Article

Effect of Cesium and Phosphate Addition to Mo/V/W Mixed Oxide Catalysts for the Gas Phase Oxidation of Methacrolein to Methacrylic Acid

by
Maximilian Sennerich
1,
Peter G. Weidler
2,
Stefan Heißler
2 and
Bettina Kraushaar-Czarnetzki
1,*
1
Institute of Chemical Process Engineering CVT, Karlsruhe Institute of Technology, Campus South, 76131 Karlsruhe, Germany
2
Institute of Functional Interfaces, Karlsruhe Institute of Technology, Campus North, 76344 Eggenstein-Leopoldshafen, Germany
*
Author to whom correspondence should be addressed.
Catalysts 2021, 11(2), 231; https://doi.org/10.3390/catal11020231
Submission received: 15 December 2020 / Revised: 4 February 2021 / Accepted: 5 February 2021 / Published: 9 February 2021

Abstract

:
The present study investigates modified Mo/V/W mixed oxides as a possible alternative for state of the art heteropoly acid catalysts (HPA) in the partial oxidation of methacrolein (MAC) to methacrylic acid (MAA). Even though HPAs show an excellent activity and MAA selectivity, their long-term stability is unsatisfying, rendering the catalyst inoperable after runtimes of roughly 6 months. Mo/V/W mixed oxides consisting of M1 and a hexagonal (Mo,V,W)Ox-phase (h-phase) in varying proportions were modified by impregnation with aqueous solutions containing cesium and phosphate ions. All samples were characterized with respect to specific surface area, crystallinity, elemental and phase composition. The catalytic performance in the oxidation of MAC to MAA was investigated using a continuously operated reaction unit with tubular fixed bed reactor. Impregnation with cesium and phosphate ions and subsequent heating triggers the transformation of the mixed oxide into a Keggin-type HPA, whereby the h-phase is more reactive than M1. The transformation into HPA is accompanied by a change in the catalytic properties, i.e., the selectivity to MAA is considerably improved. Compared to HPA synthesized directly, however, the HPA samples obtained by transformation of mixed oxides exhibit no advantages, be it with respect to activity, MAA selectivity or stability.

Graphical Abstract

1. Introduction

The catalytic conversion of methacrolein (MAC) to methacrylic acid (MAA) is of great importance for the chemical industry. MAA and its esters are used for the fabrication of acrylic polymers for a variety of applications such as transparent plastics, glue, thickener and lacquer [1,2]. A major fraction of MAA is synthesized via selective oxidation of methacrolein (MAC) [3]. Heteropoly acid (HPA) catalysts are still state of the art in the partial oxidation of MAC to MAA with a selectivity to MAA (SMAA,MAC) greater than 80% at a methacrolein conversion (XMAC) higher than 60%. However, their long-term stability of less than one year is unsatisfactory. Hence, researchers are trying to find an alternative catalyst that combines long-term stability with good catalytic activity and selectivity. Mo/V/W mixed oxides are excellent catalysts for the partial oxidation of acrolein (ACR), providing great lifetime and very high selectivity towards acrylic acid (AA). Unfortunately Mo/V/W catalysts perform significantly worse in the partial oxidation of MAC to MAA (SMAA,MAC ≈ 35%, X ≈ 40%) [4].
Several research groups discovered the addition of Cs and P to Mo/V/W mixed oxides as a method to significantly increase their MAA selectivity in the partial oxidation of methacrolein [5,6,7,8]. Wagner et al. characterized mixed oxides of the so-called Mo5O14-type with added Cs and P. XRD measurements show the presence of a hexagonal (Mo,V,W)Ox-phase (h-phase) and a M1-phase accompanied by a Keggin type heteropoly acid. [5] Böhnke et al. and Schunk et al. also suggested the formation of a heteropoly acid layer on the mixed oxide when adding Cs and P to Mo/V/W oxides related to M1 [7,8,9]. In a closer investigation, Schunk et al. achieved promising results with SMAA,MAC of about 70% at a conversion of 64%, after adding Cs and P to M1 mixed oxides under Cs/P and (Mo + V + W)/P variation [8]. Despite all progress made in improving the MAA selectivity of Mo/V/W oxides it is still significantly lower than for industrial HPAs [10,11]. Since the published data concerning the addition of Cs and P is limited, there are still unresolved questions of great interest. The phase transformation of mixed oxide into HPA or rather the extent of this transformation remains unfathomed. Moreover, the cause of improvements in MAA selectivity as well as the maximum achievable selectivity are still open to debate. Furthermore, the thermal stability of Mixed oxides modified with Cs and P has not been examined in comparison to HPA catalysts under industrially relevant reaction conditions so far, which is a crucial factor for a HPA replacement catalyst.
Three catalysts containing M1-phase and h-phase in different proportions were prepared and added with Cs and P under systematic variation of the Cs/P and (Mo + V + W)/P rations. The variation of the mixed oxides’ Cs and P content covers a range from zero up to values found in a pure Keggin-type HPA. The degree and controllability of phase transformation into HPA, cause of improvements in MAA selectivity and the thermal stability of the catalysts in comparison to a pure HPA are investigated to give a rounded view regarding this topic.

2. Results and Discussion

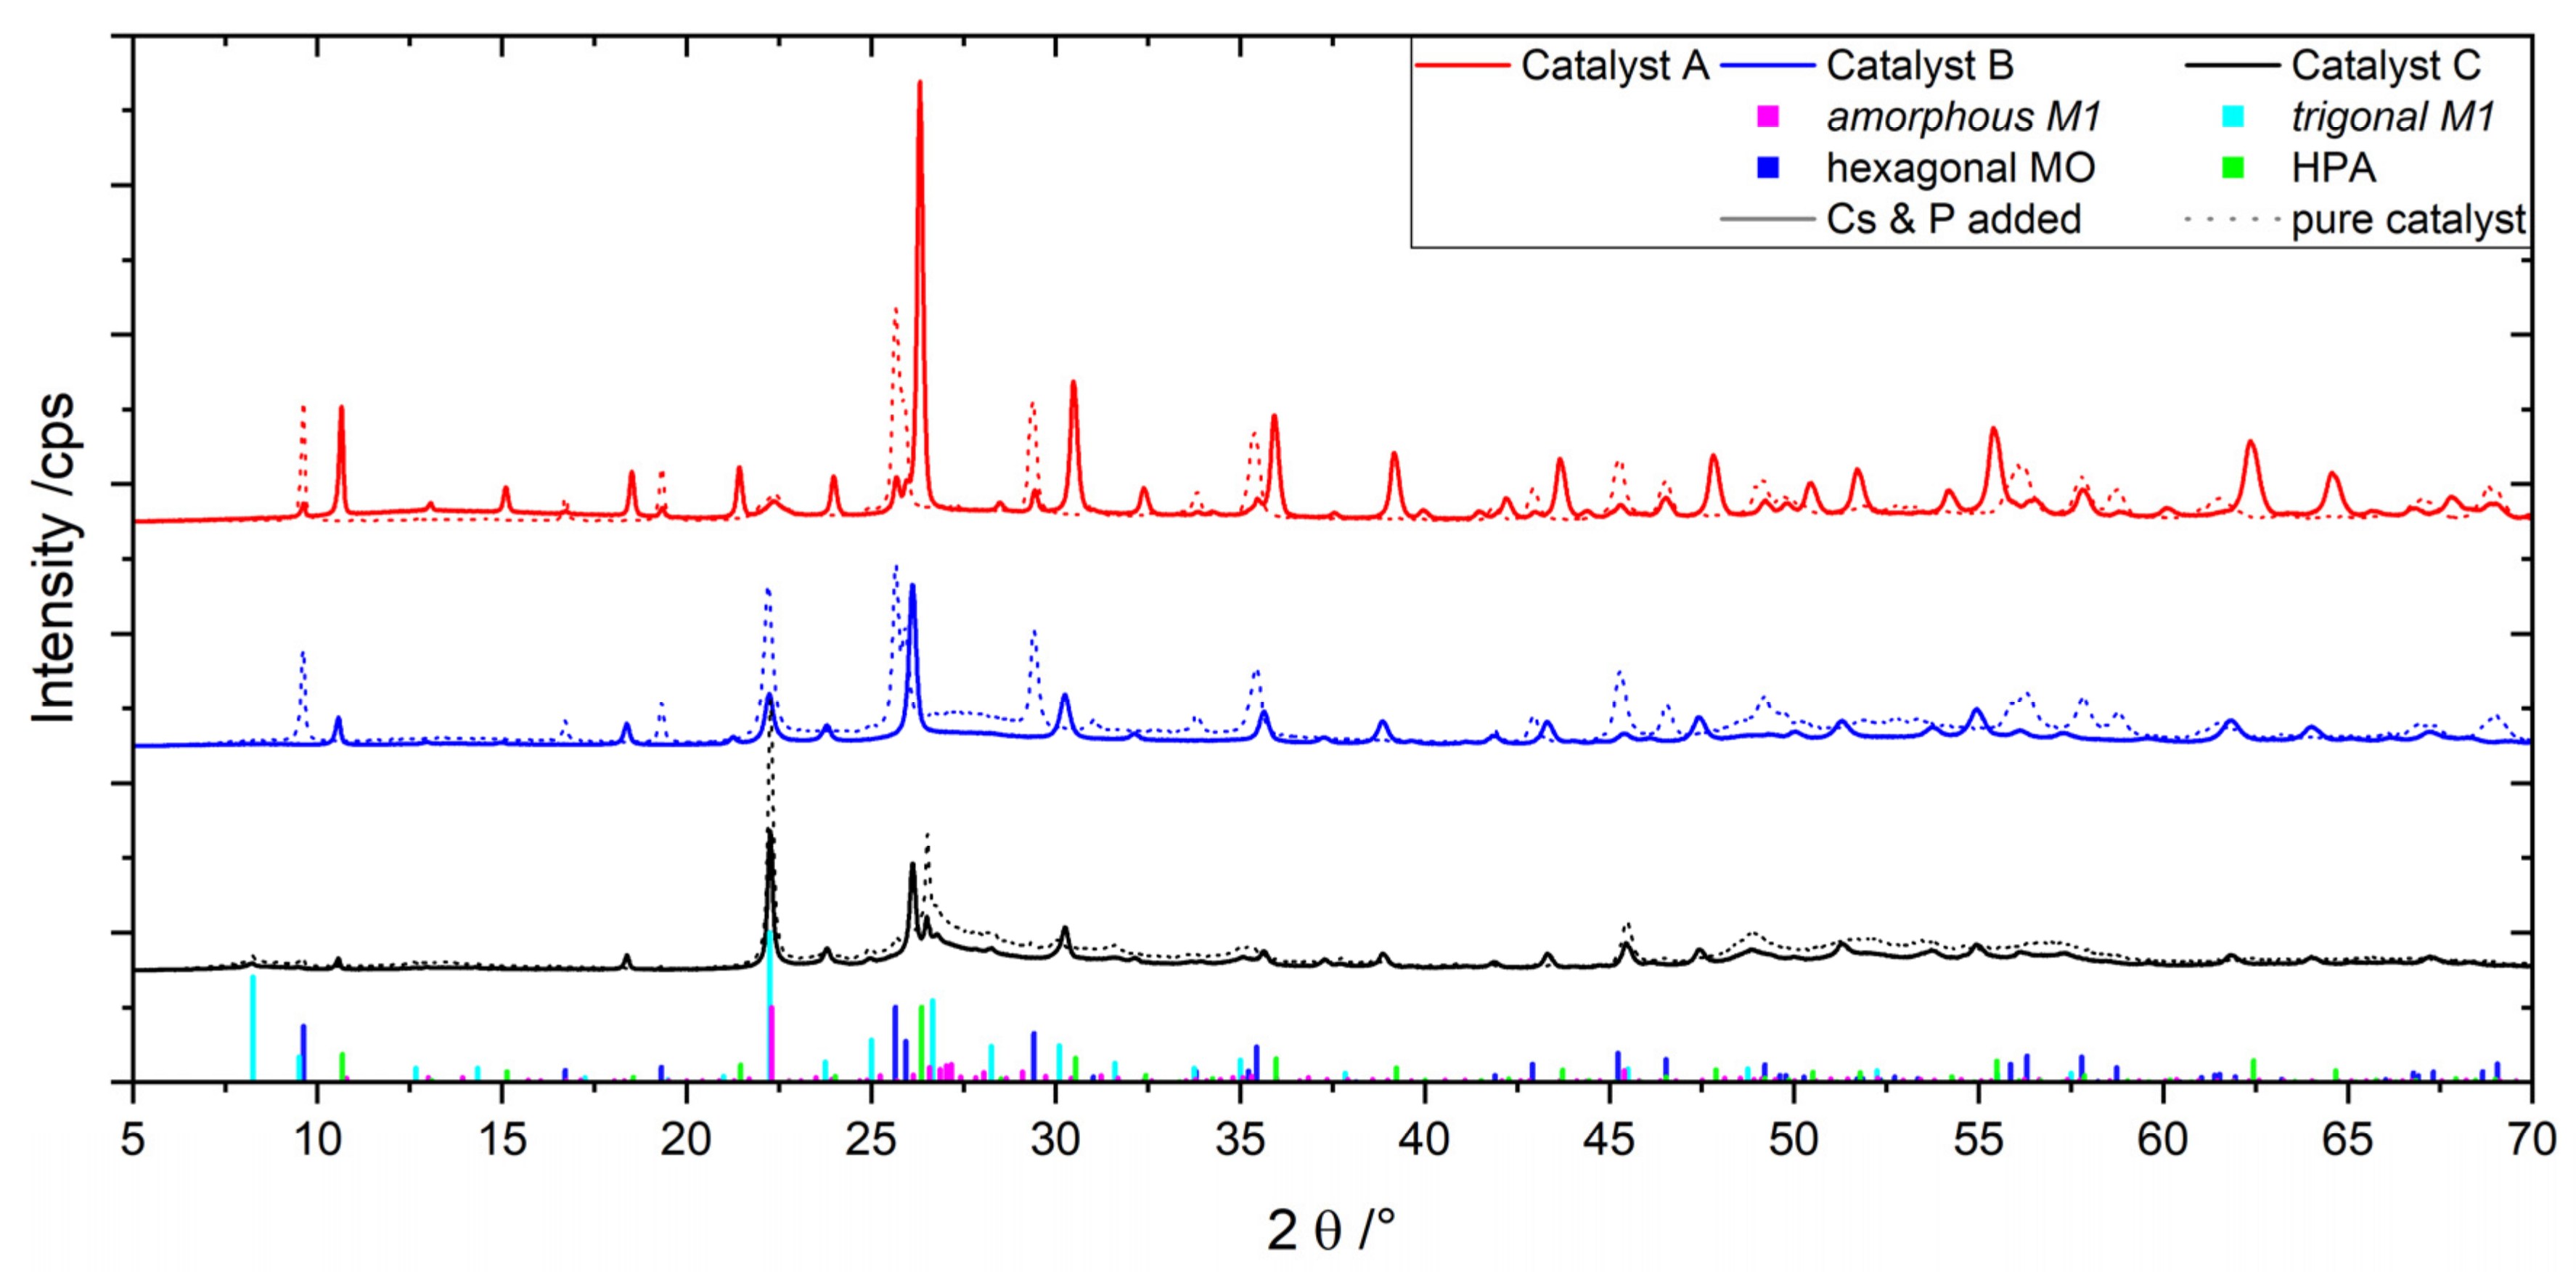
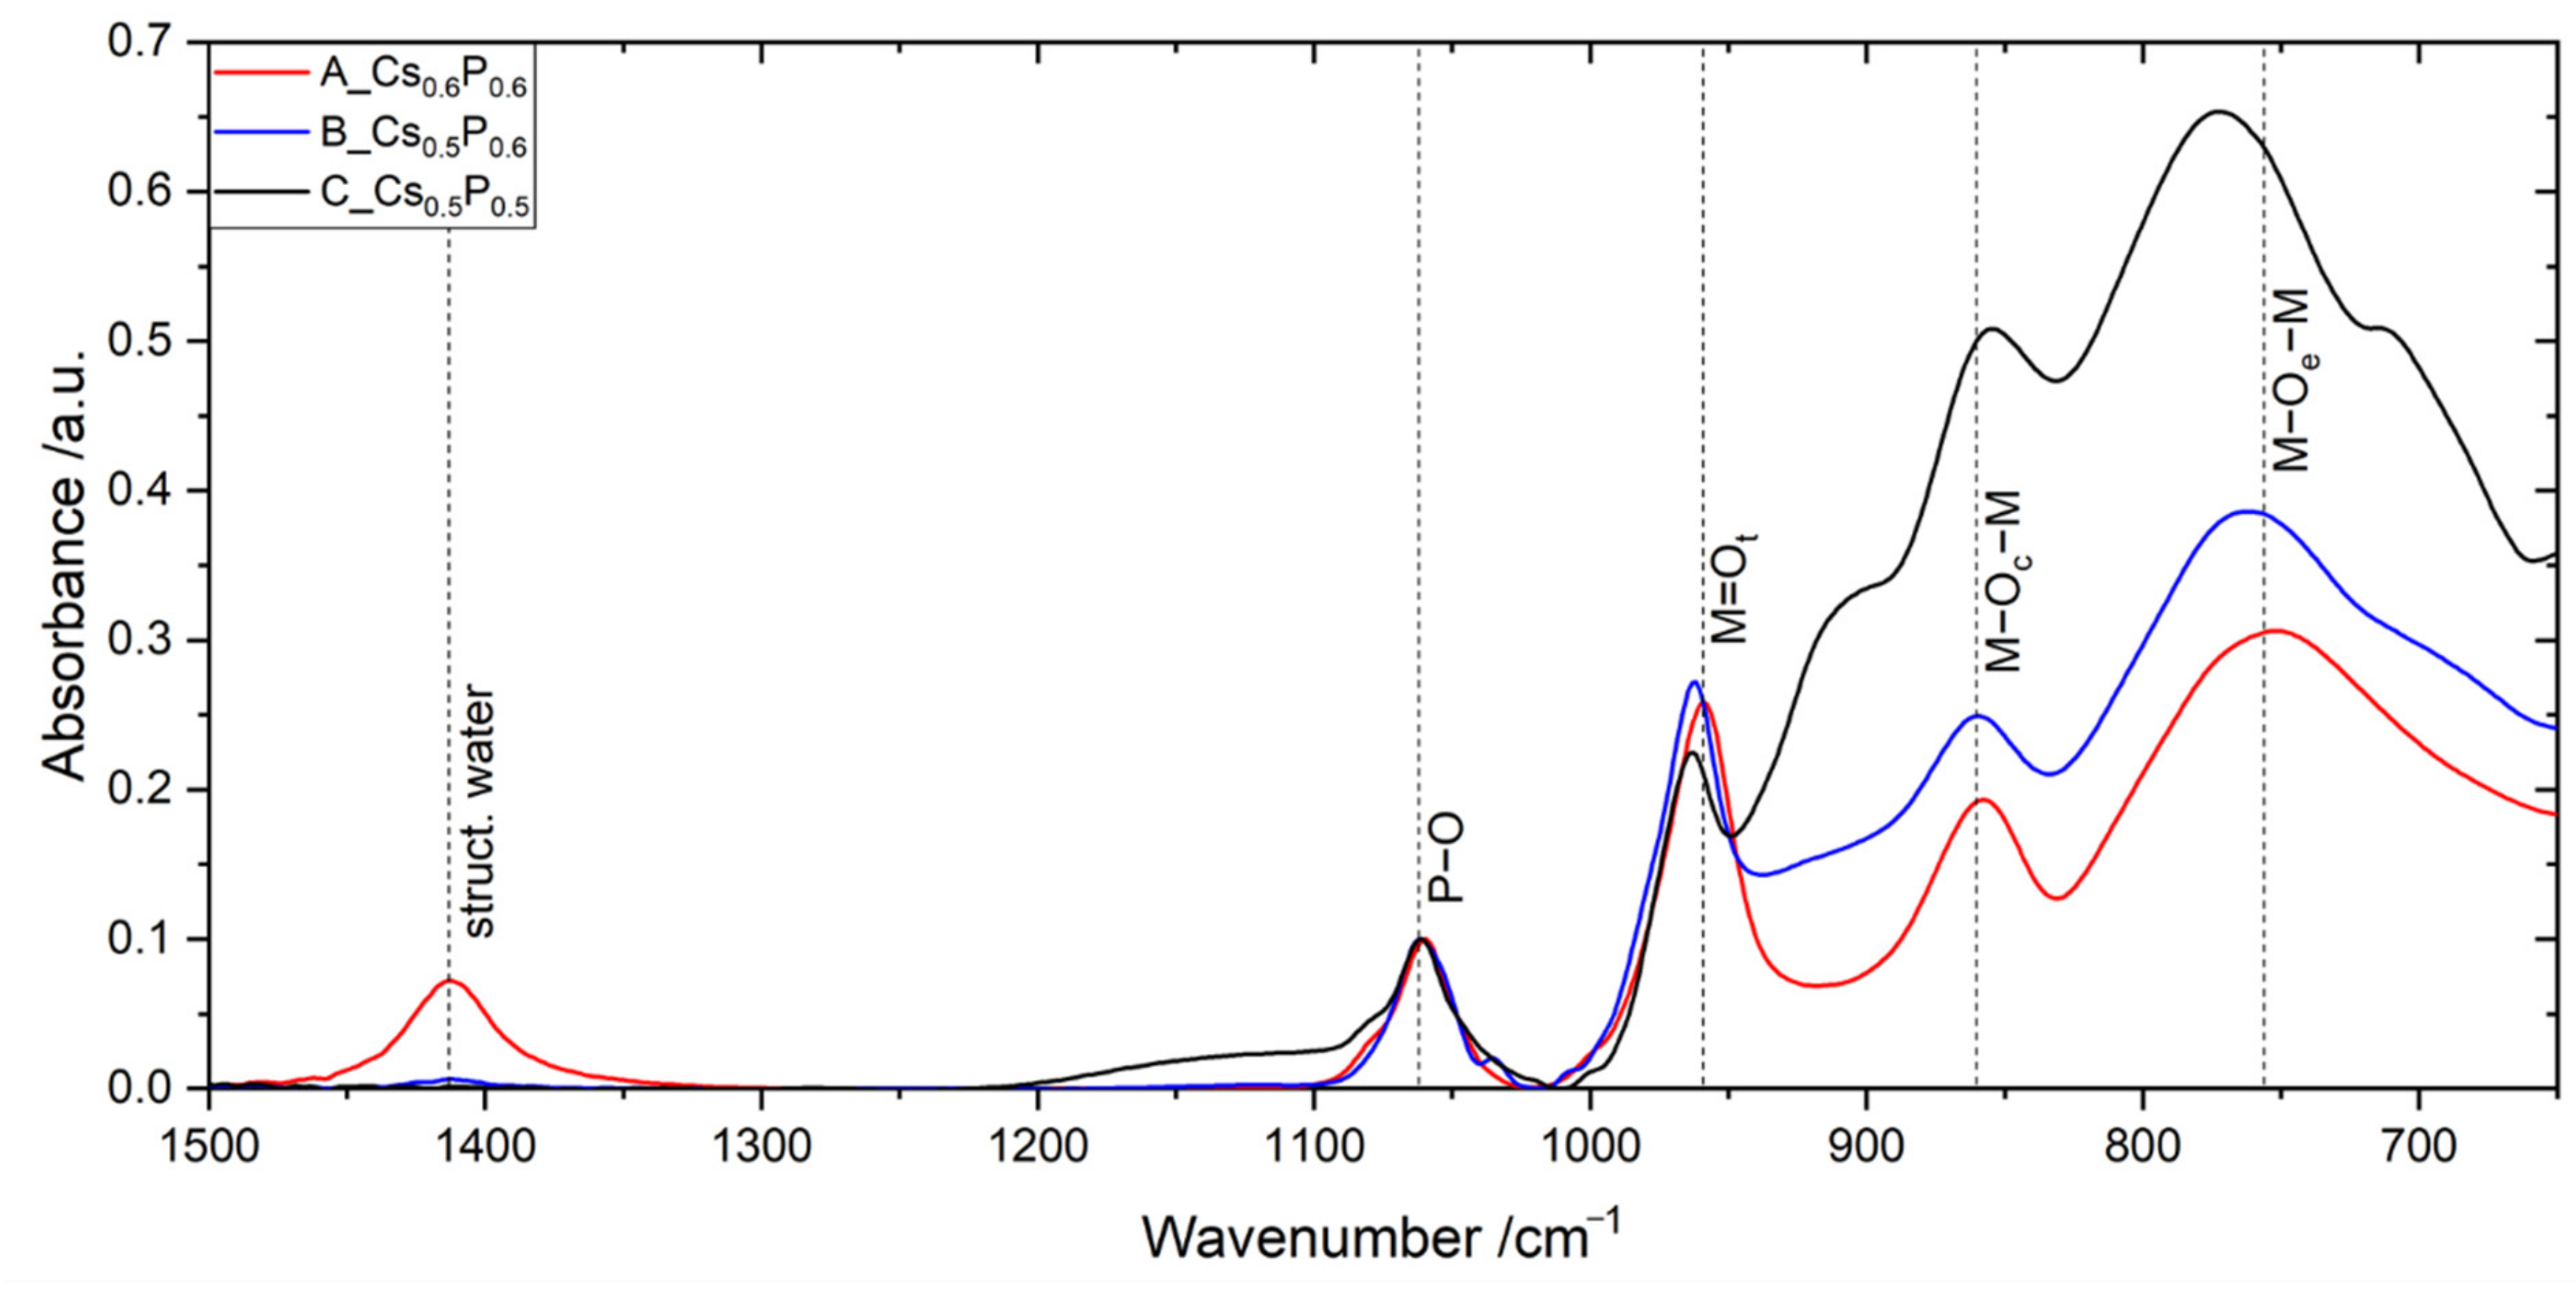
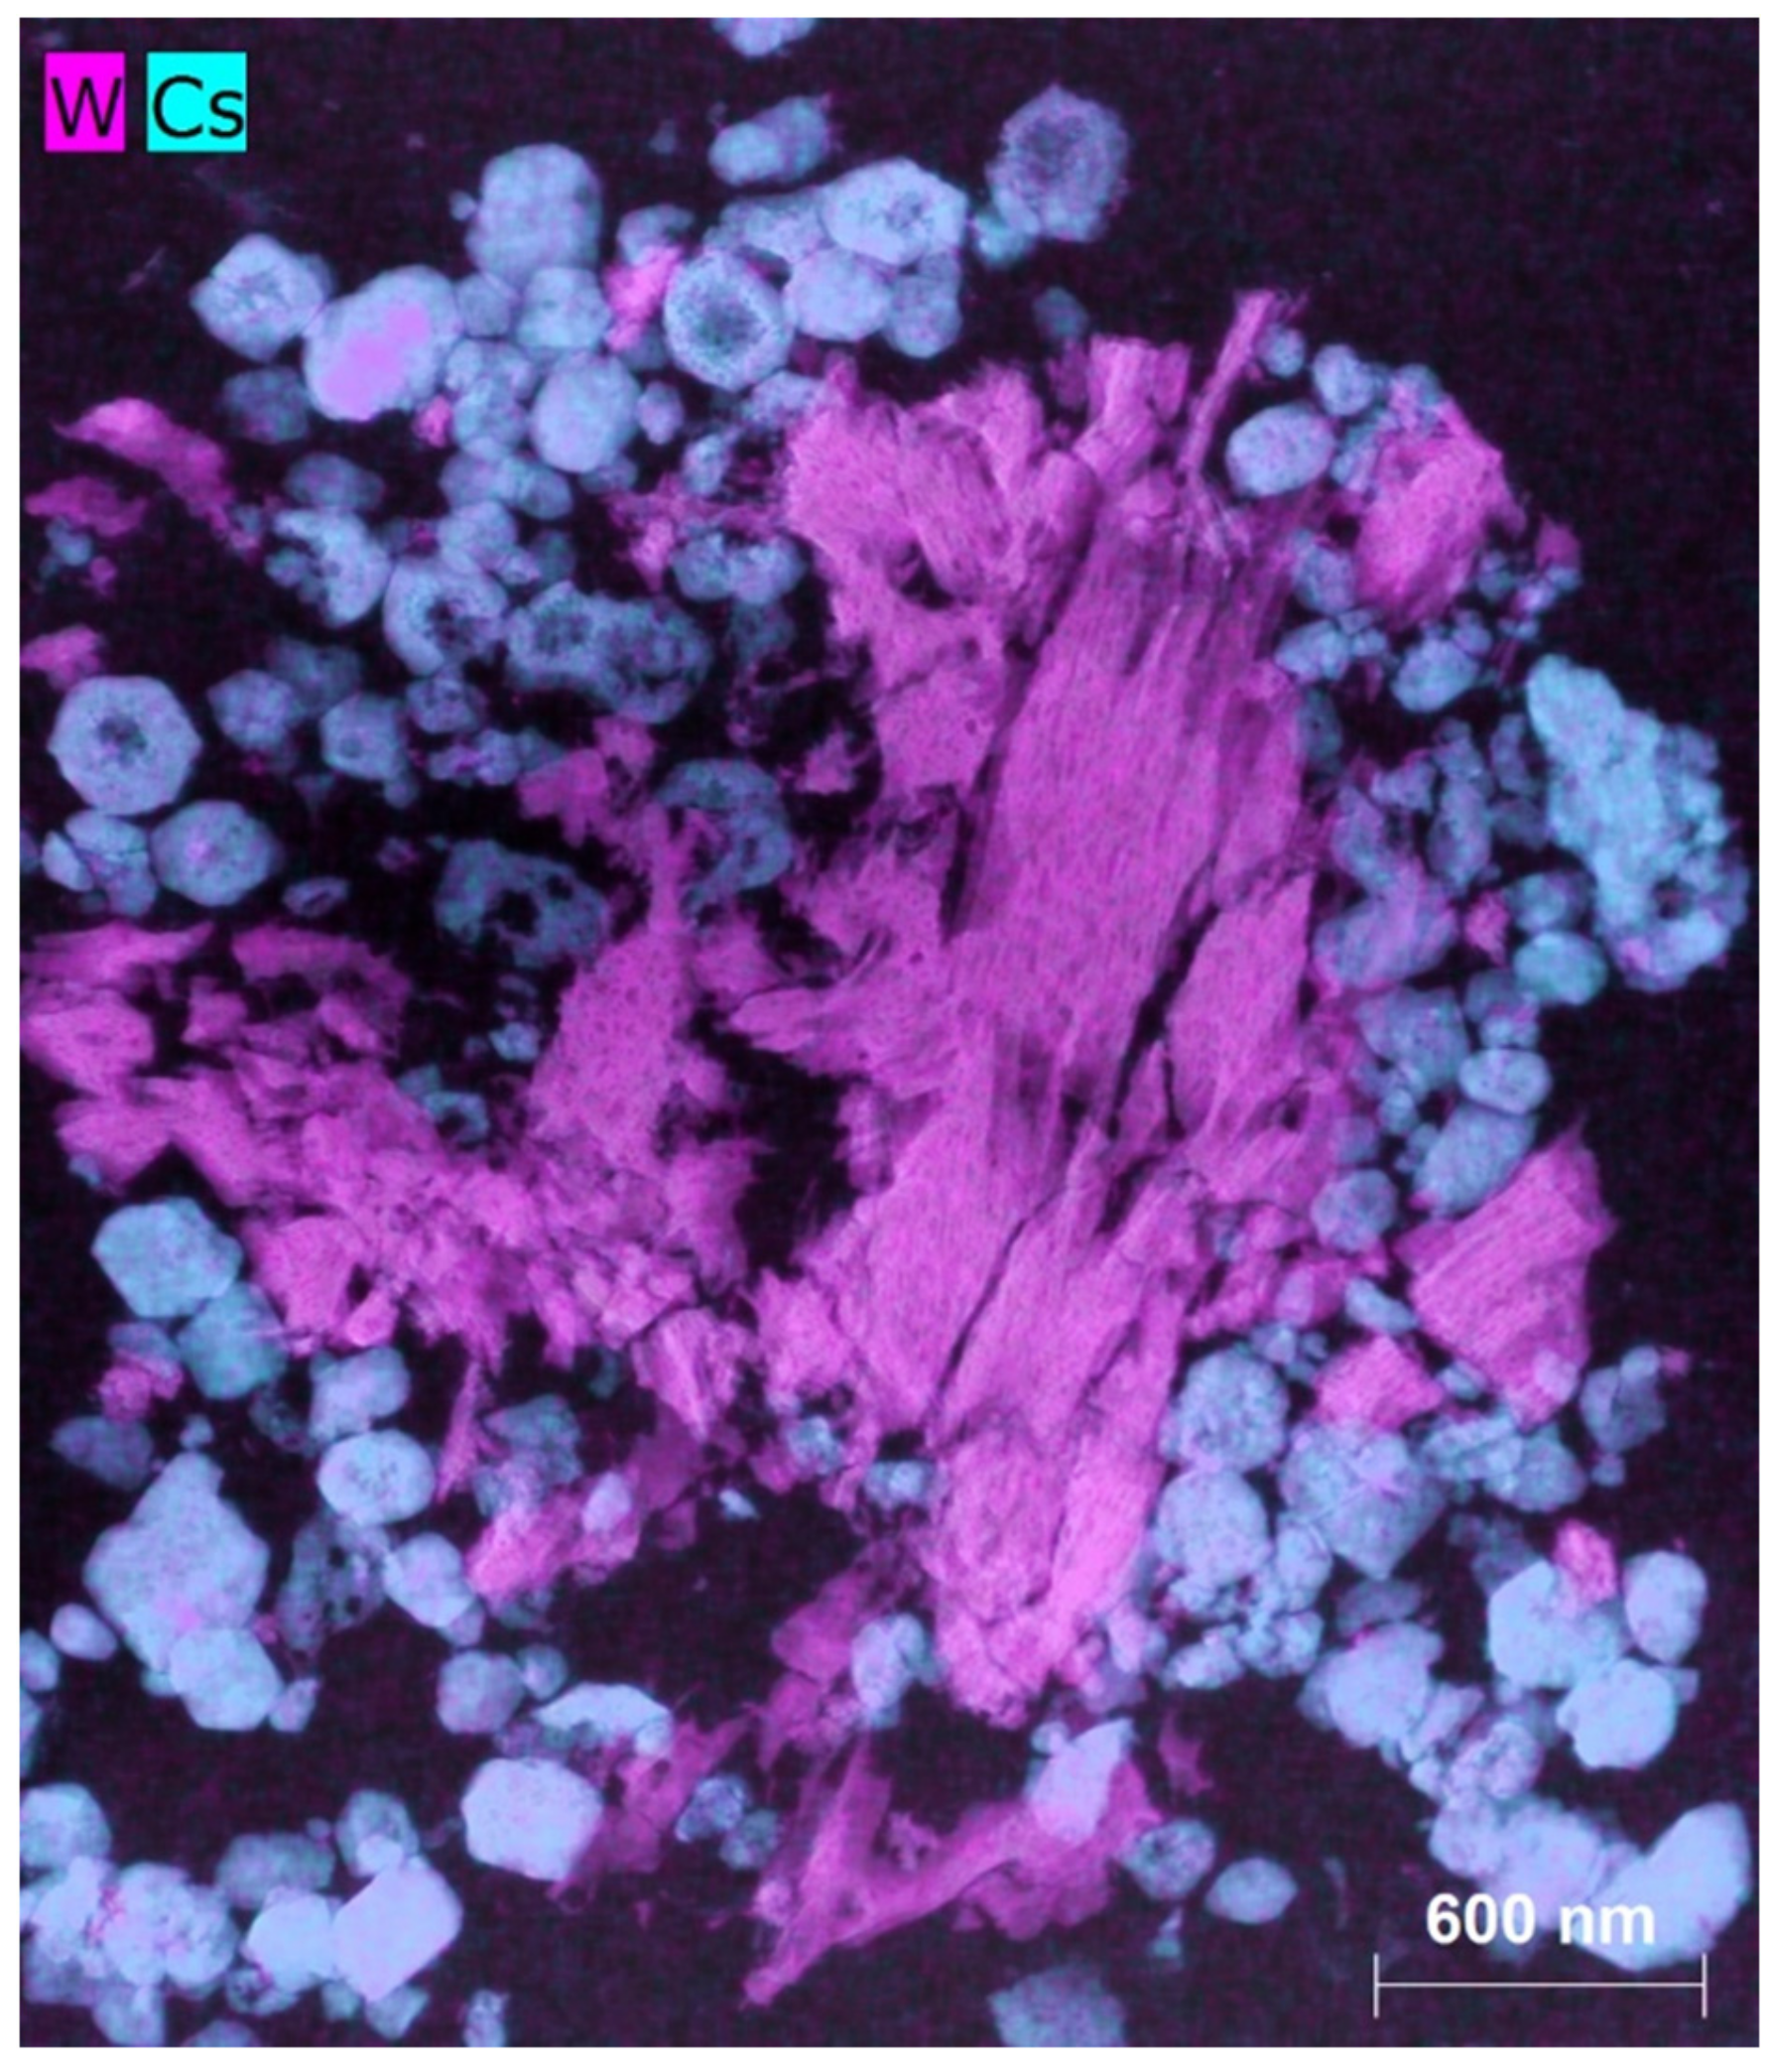
2.1. Catalysts A, B and C Containing Cs/P ≈ 1

This section presents results obtained with catalysts containing a fixed ratio Cs/P of approximately 1. The atomic ratio of (Mo + V + W)/P and (Mo + V + W)/Cs measured about 18 for every catalyst (see Table 1), which is a high Cs and P share compared to literature [7,8]. This amount resembles about 2/3rds the Cs and P content of a pure Keggin-type HPA, which should enable a possible formation of HPA.
Figure 1 shows the XRD patterns of catalysts A, B and C prior to and after the addition of Cs and P. The XRD reveals the transformation of the mixed oxide into a Keggin heteropoly acid phase. From the peak area of the main HPA reflection at 2θ ≈ 26.3°, the amount of HPA formed can be determined. The results of this evaluation are summarized in Table 1 and show that the h-phase (catalyst A) is nearly completely converted into HPA at the conditions applied here, whereas the transformation of M1 (present in catalysts B and C) into HPA is incomplete. Seemingly, the h-phase mixed oxide is more reactive than M1. A comparison of XRD pattern before and after catalytic testing for at least 120 h TOS indicated no phase changes.
The (Mo + V + W)/P ratio of a Keggin HPA measures 12/1 [12]. With the transition metal content measured via chemical analysis (Table 1), the actual amount of P needed to form the estimated amount of crystalline HPA can be calculated. While in case of catalyst A approximately 98 wt.% of the provided P transformed into HPA, catalyst B converted about 67 wt.% and catalyst C about 42 wt.% of the added P respectively. As a result, in case of catalyst B and C unused P and possibly Cs must remain in the catalyst. According to XRD, remaining Cs and P did not form any other crystal phases. As can be seen in Table 1, the surface area of the catalysts reduces with the addition of Cs and P. This observation is reasonable, because HPA catalysts usually feature a low specific surface area < 10 m2/g [10,13].
IR measurements were conducted to draw further conclusions regarding the chemical composition and water content of the formed HPA phase. The three catalyst samples with added Cs and P show characteristic Keggin-HPA IR bands. These characteristic bands represent specific bond stretching (ν)-vibrations within the Keggin-HPA-cluster: a (ν)-P-O-vibration with an internal oxygen atom at 1062 cm−1, a (ν)-M=Ot-vibration with a terminal oxygen atom at 962 cm−1, a (ν)-M-Oc-M-vibration with a corner-sharing oxygen atom at 862 cm−1 and a (ν)-M-Oe-M-vibration with an edge-sharing oxygen atom at 770 cm−1 [14,15]. Figure 2 shows the IR spectra of the modified catalysts with Cs/P ≈ 1 and (Mo + V + W)/P ≈ 18. The spectra are normalized to the characteristic Keggin-P-O-vibration at 1062 cm−1, which represents the amount of HPA formed. In relation to the wide absorption area below 950 cm−1, which can be assigned to a variety of mixed oxide metal oxygen vibrations of different energy states [16], the Keggin bands are more pronounced for catalyst A, with decreasing intensity over catalyst B to catalyst C. These results make sense, since catalyst A formed the highest amount of HPA phase. The bands at 1413 cm−1 can be assigned to the (ν)-vibration of constitutional water, which is ionically bound to the Keggin anion and occupies the same lattice sites as Cs+ [16,17,18]. Hence, if the HPA contains a lesser amount of constitutional water, it must be stronger Cs+ salified to retain the Keggin structure. Catalyst A by far features the highest amount of constitutional water while catalyst C does not show any increase of absorbance for 1413 cm−1 at all. As all catalysts were added with equal amounts of Cs and P, this leads to the conclusion that the h-phase (catalyst A) forms a far less Cs+-salified HPA than the M1-phase (catalyst C), while M1 is only capable of forming a highly Cs+-salified HPA phase.
To understand the catalyst morphology and chemical composition of the formed HPA phase, TEM-EXD measurements were conducted on A_Cs0.6P0.6 (Figure 3). The h-phase was chosen since it shows the most significant phase changes. Because the sample was prepared with a focused ion beam by extracting a thin lamella out of the catalyst bulk, TEM images a cross section of the catalyst. For visualization purposes, the HPA is indicated by cesium (cyan); the mixed oxide by tungsten (magenta). The two phases form two well separated domains with the HPA-phase showing spherical shaped particles. The chemical composition of the HPA phase could be determined as H3.15Cs1.25PMo9.4V1.4W1.2 via TEM-EDX. As reported by literature, this is not optimal for a HPA in the partial oxidation of MAC to MAA [19]. Obviously, the catalyst preparation lacks control over the HPA phase composition, as the chemical composition of the investigated catalyst is Mo8V2W1Cs0.6P0.6, which significantly differs from the element ratios of the HPA phase. Mo and W were enriched in the HPA phase while the V content decreased. Hence, the HPA phase favorably forms from Mo and W. Furthermore, it binds all available Cs, since according to TEM-EDX Cs could only be found in the HPA phase—not within mixed oxide domains of the samples.
Figure 4 compares the catalytic performance of catalysts A, B and C prior to and after adding Cs and P in the ratios (Mo + V + W)/P and (Mo + V + W)/Cs of approximately 18. In their pure state, catalysts A, B and C show a comparable MAA selectivity with catalyst B featuring the lowest value. Catalyst B has an about 10% lower selectivity towards methacrylic acid. After addition of Cs and P, the MAA selectivities of catalyst A and catalyst B increase by nearly 20% and reach over 70% in case of catalyst A modified with Cs and P, which can be linked to the formation of the more selective heteropoly acid from less selective h-phase and/or M1-phase. The M1-phase catalyst C loses about 5% SMAA,MAC after adding Cs and P even though it forms HPA as well. Performance testing with a C_Cs0.3P0.3 catalyst showed a minor improvement of MAA selectivity in relation to the pure state (Supplementary Materials). According to XRD and ATR-IR the h-phase is very capable of forming HPA. This is the reason for the superior selectivity of catalyst A modified with Cs and P, since it forms the highest HPA amount of the three catalysts. Moreover, catalyst A forms a lesser Cs+-salified HPA phase which is more selective than highly Cs+-salified HPAs [17]. Interestingly, all catalysts show a similar selectivity towards acetic acid with the Cs & P added catalysts being 2–3% lower than the pure mixed oxides. Adding Cs and P decreases the catalyst activity of catalyst A and catalyst C. In case of catalyst A it is nearly halved. The activity of catalyst B increased for higher modified residence times even though the surface area declined after adding Cs and P (Table 1). This is likely caused by its lower selectivity towards COx and respectively a lower oxygen consumption, fueling the reaction with oxygen and increasing the conversion at higher residence times. Even though catalyst A modified with Cs and P contains about 95 wt.% HPA, it still falls far behind the reported MAA selectivity (≈85%) of industrial HPA catalysts at respective conversions [11]. This can be explained by significant amounts of tungsten in the formed HPA phase, which lowers the selectivity towards MAA [17,19].

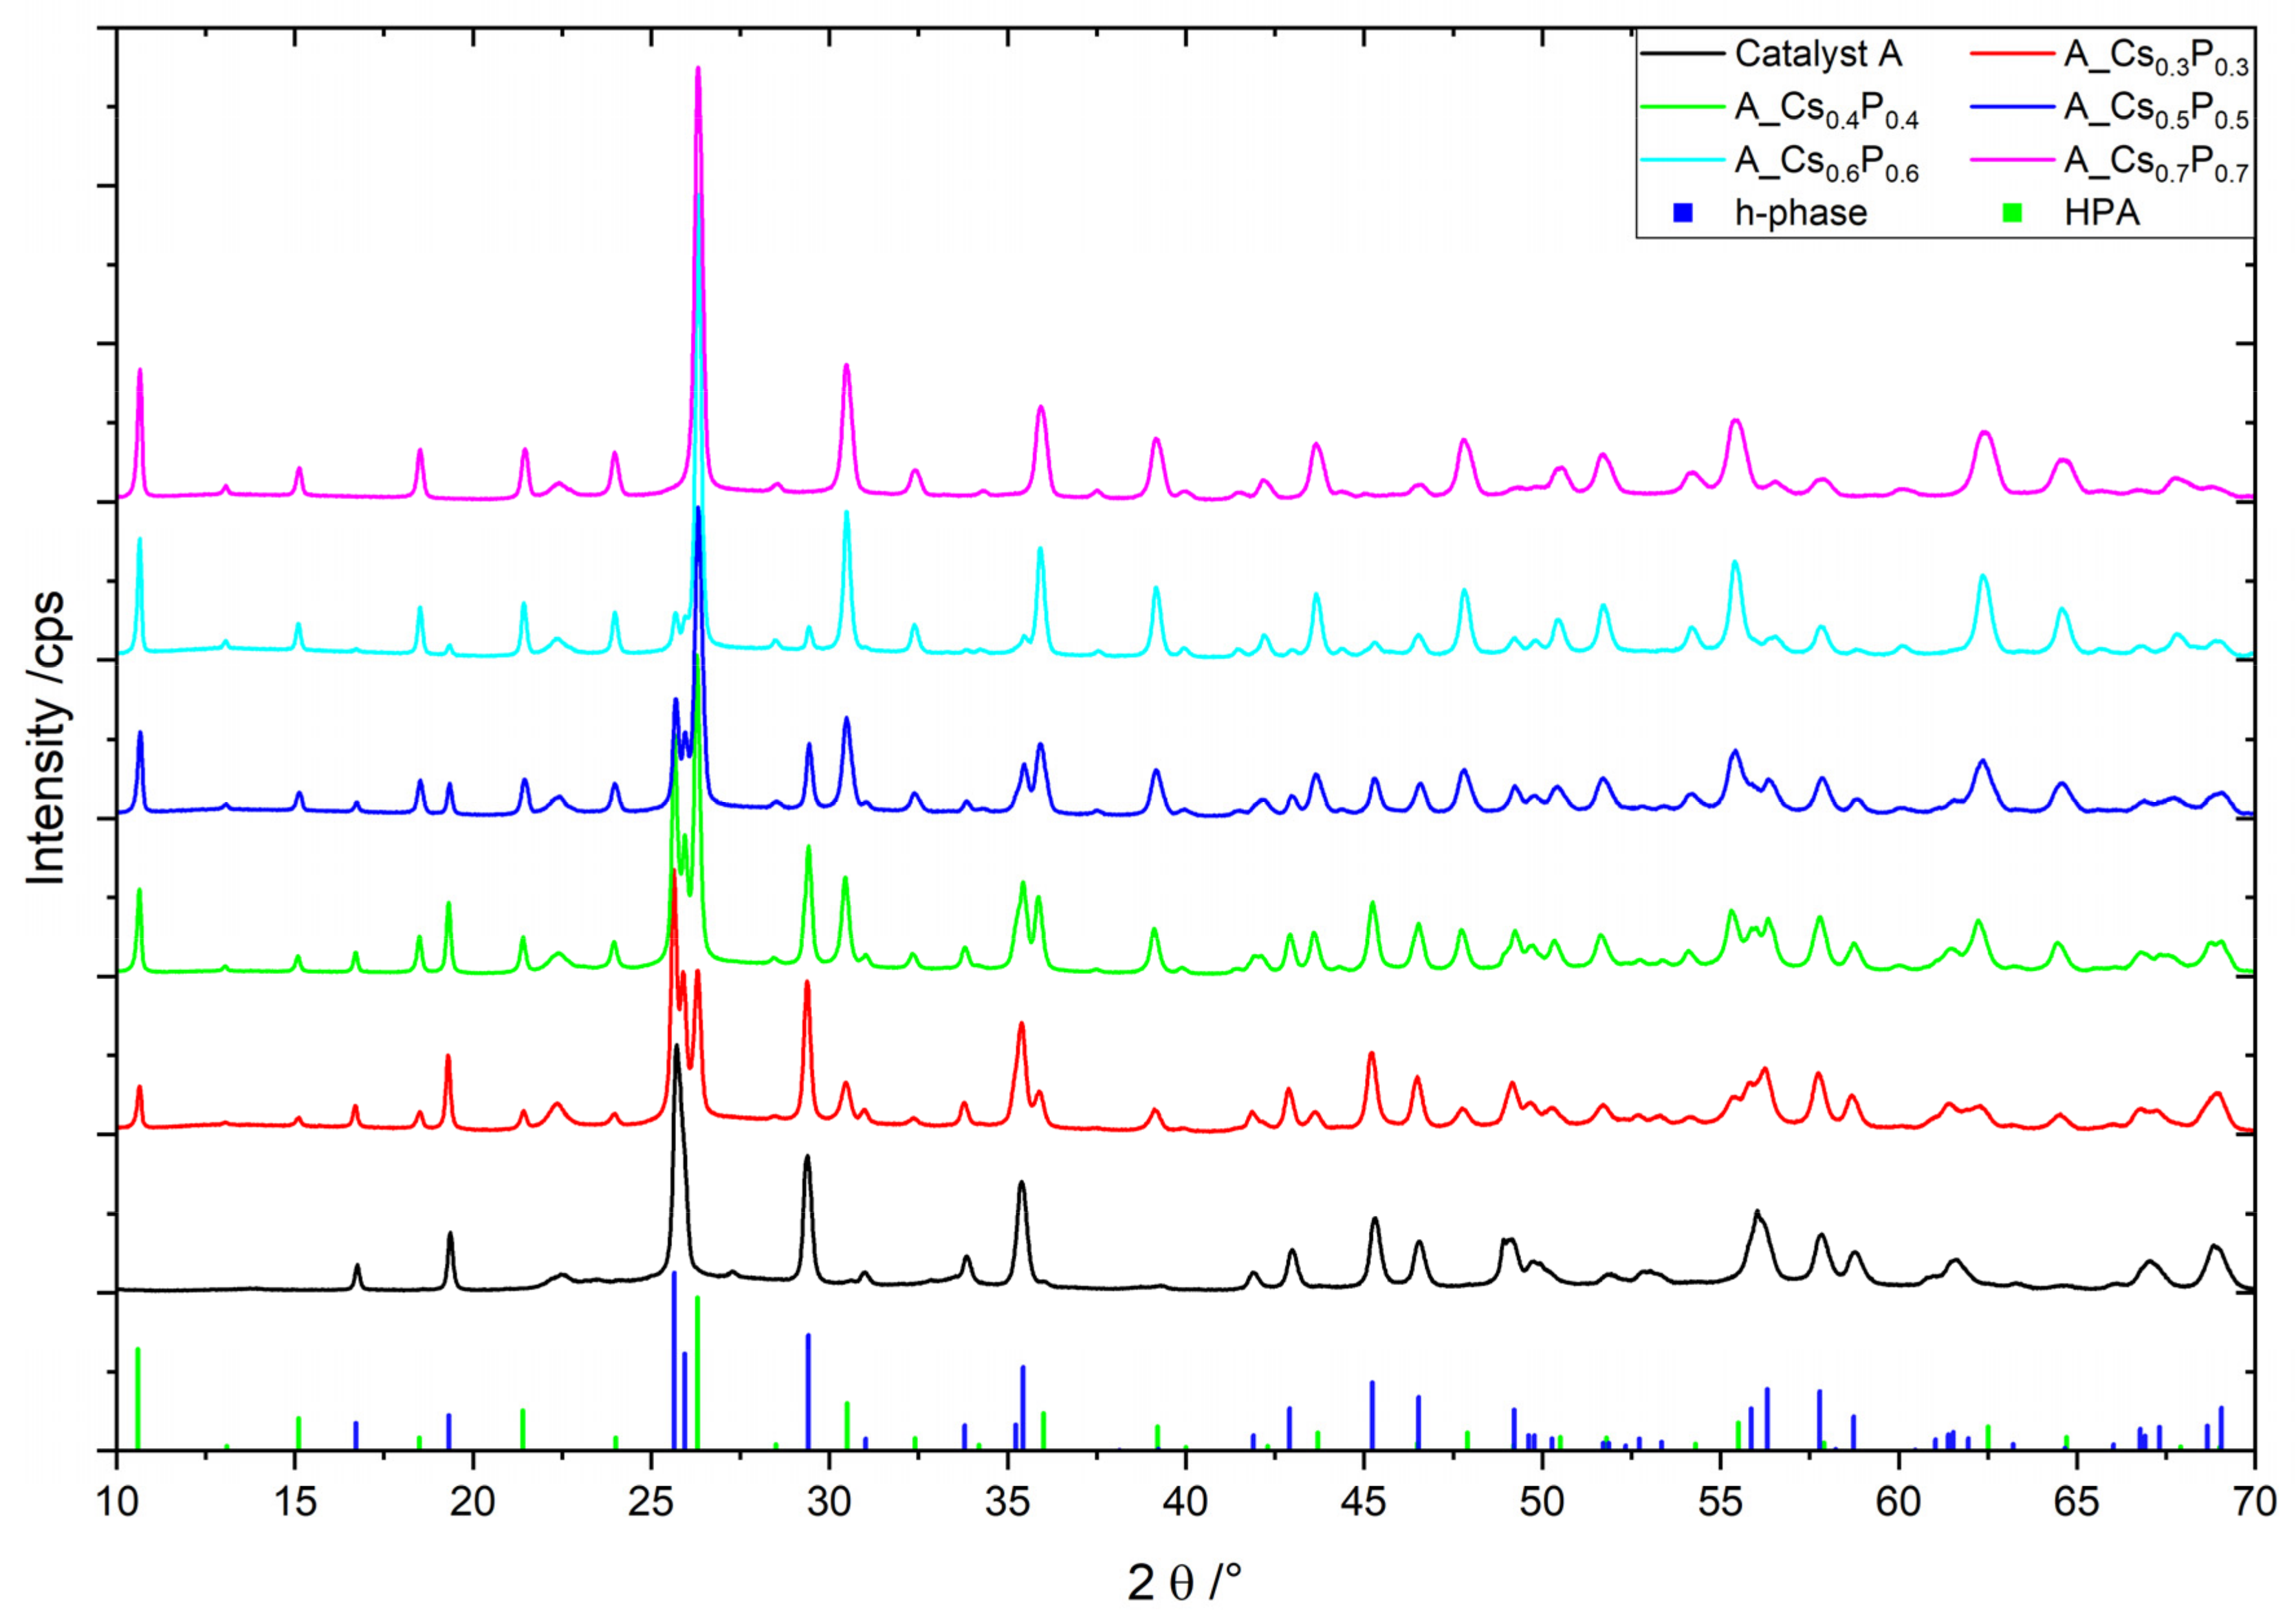
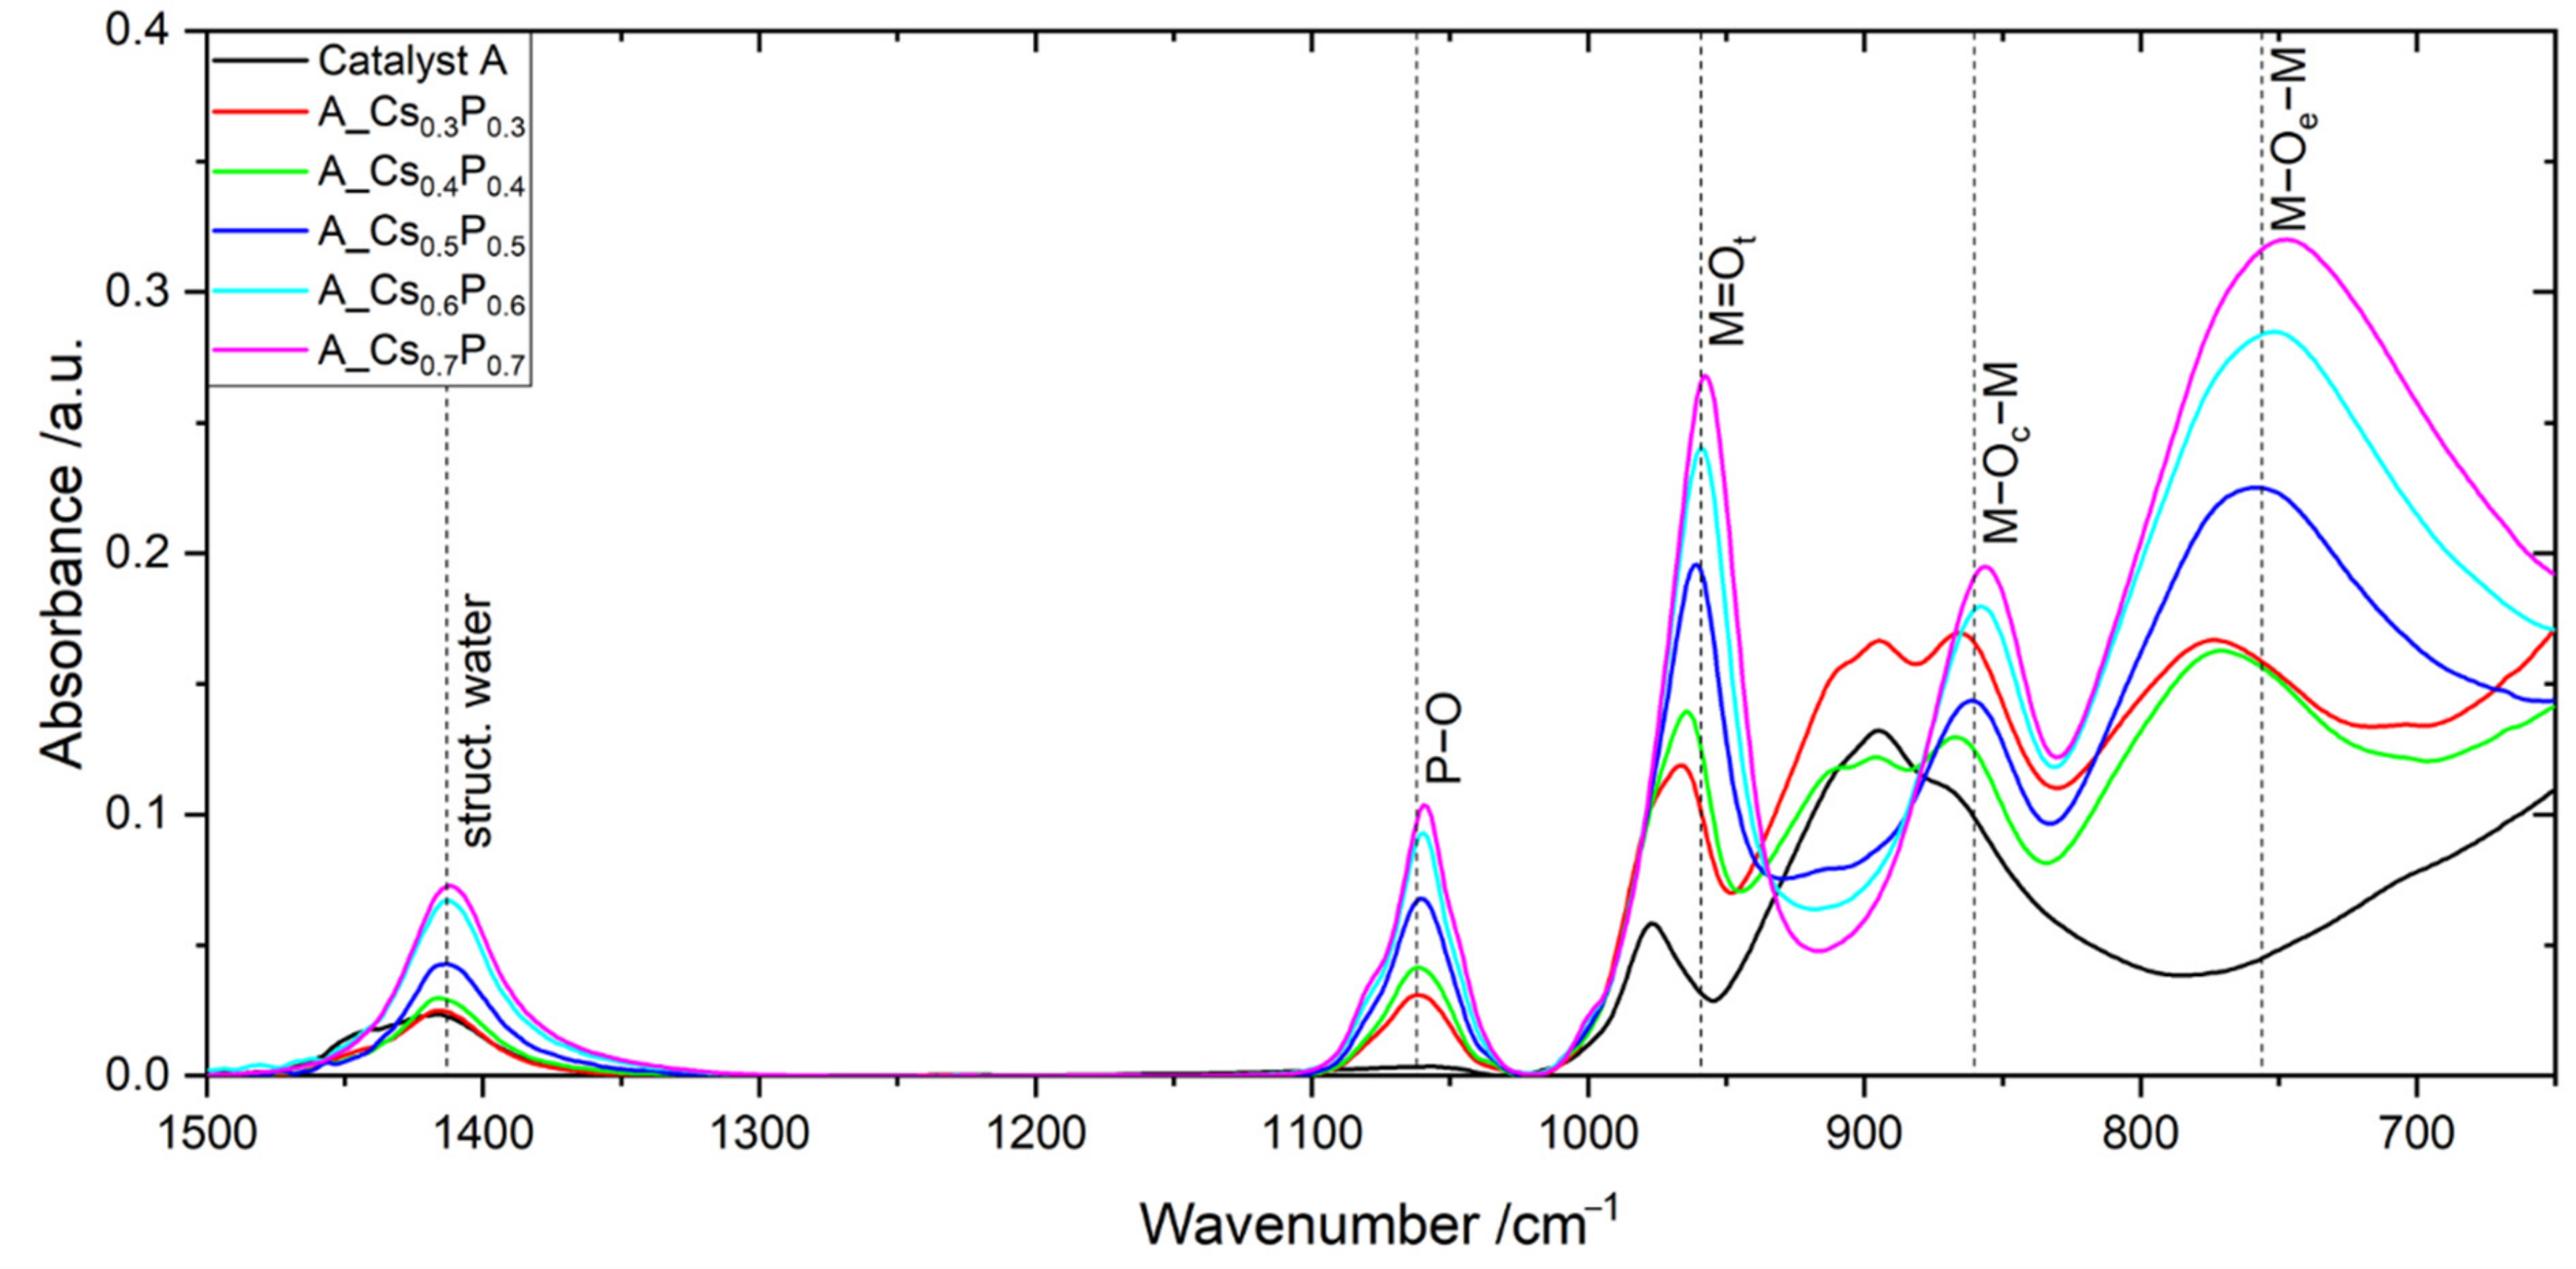
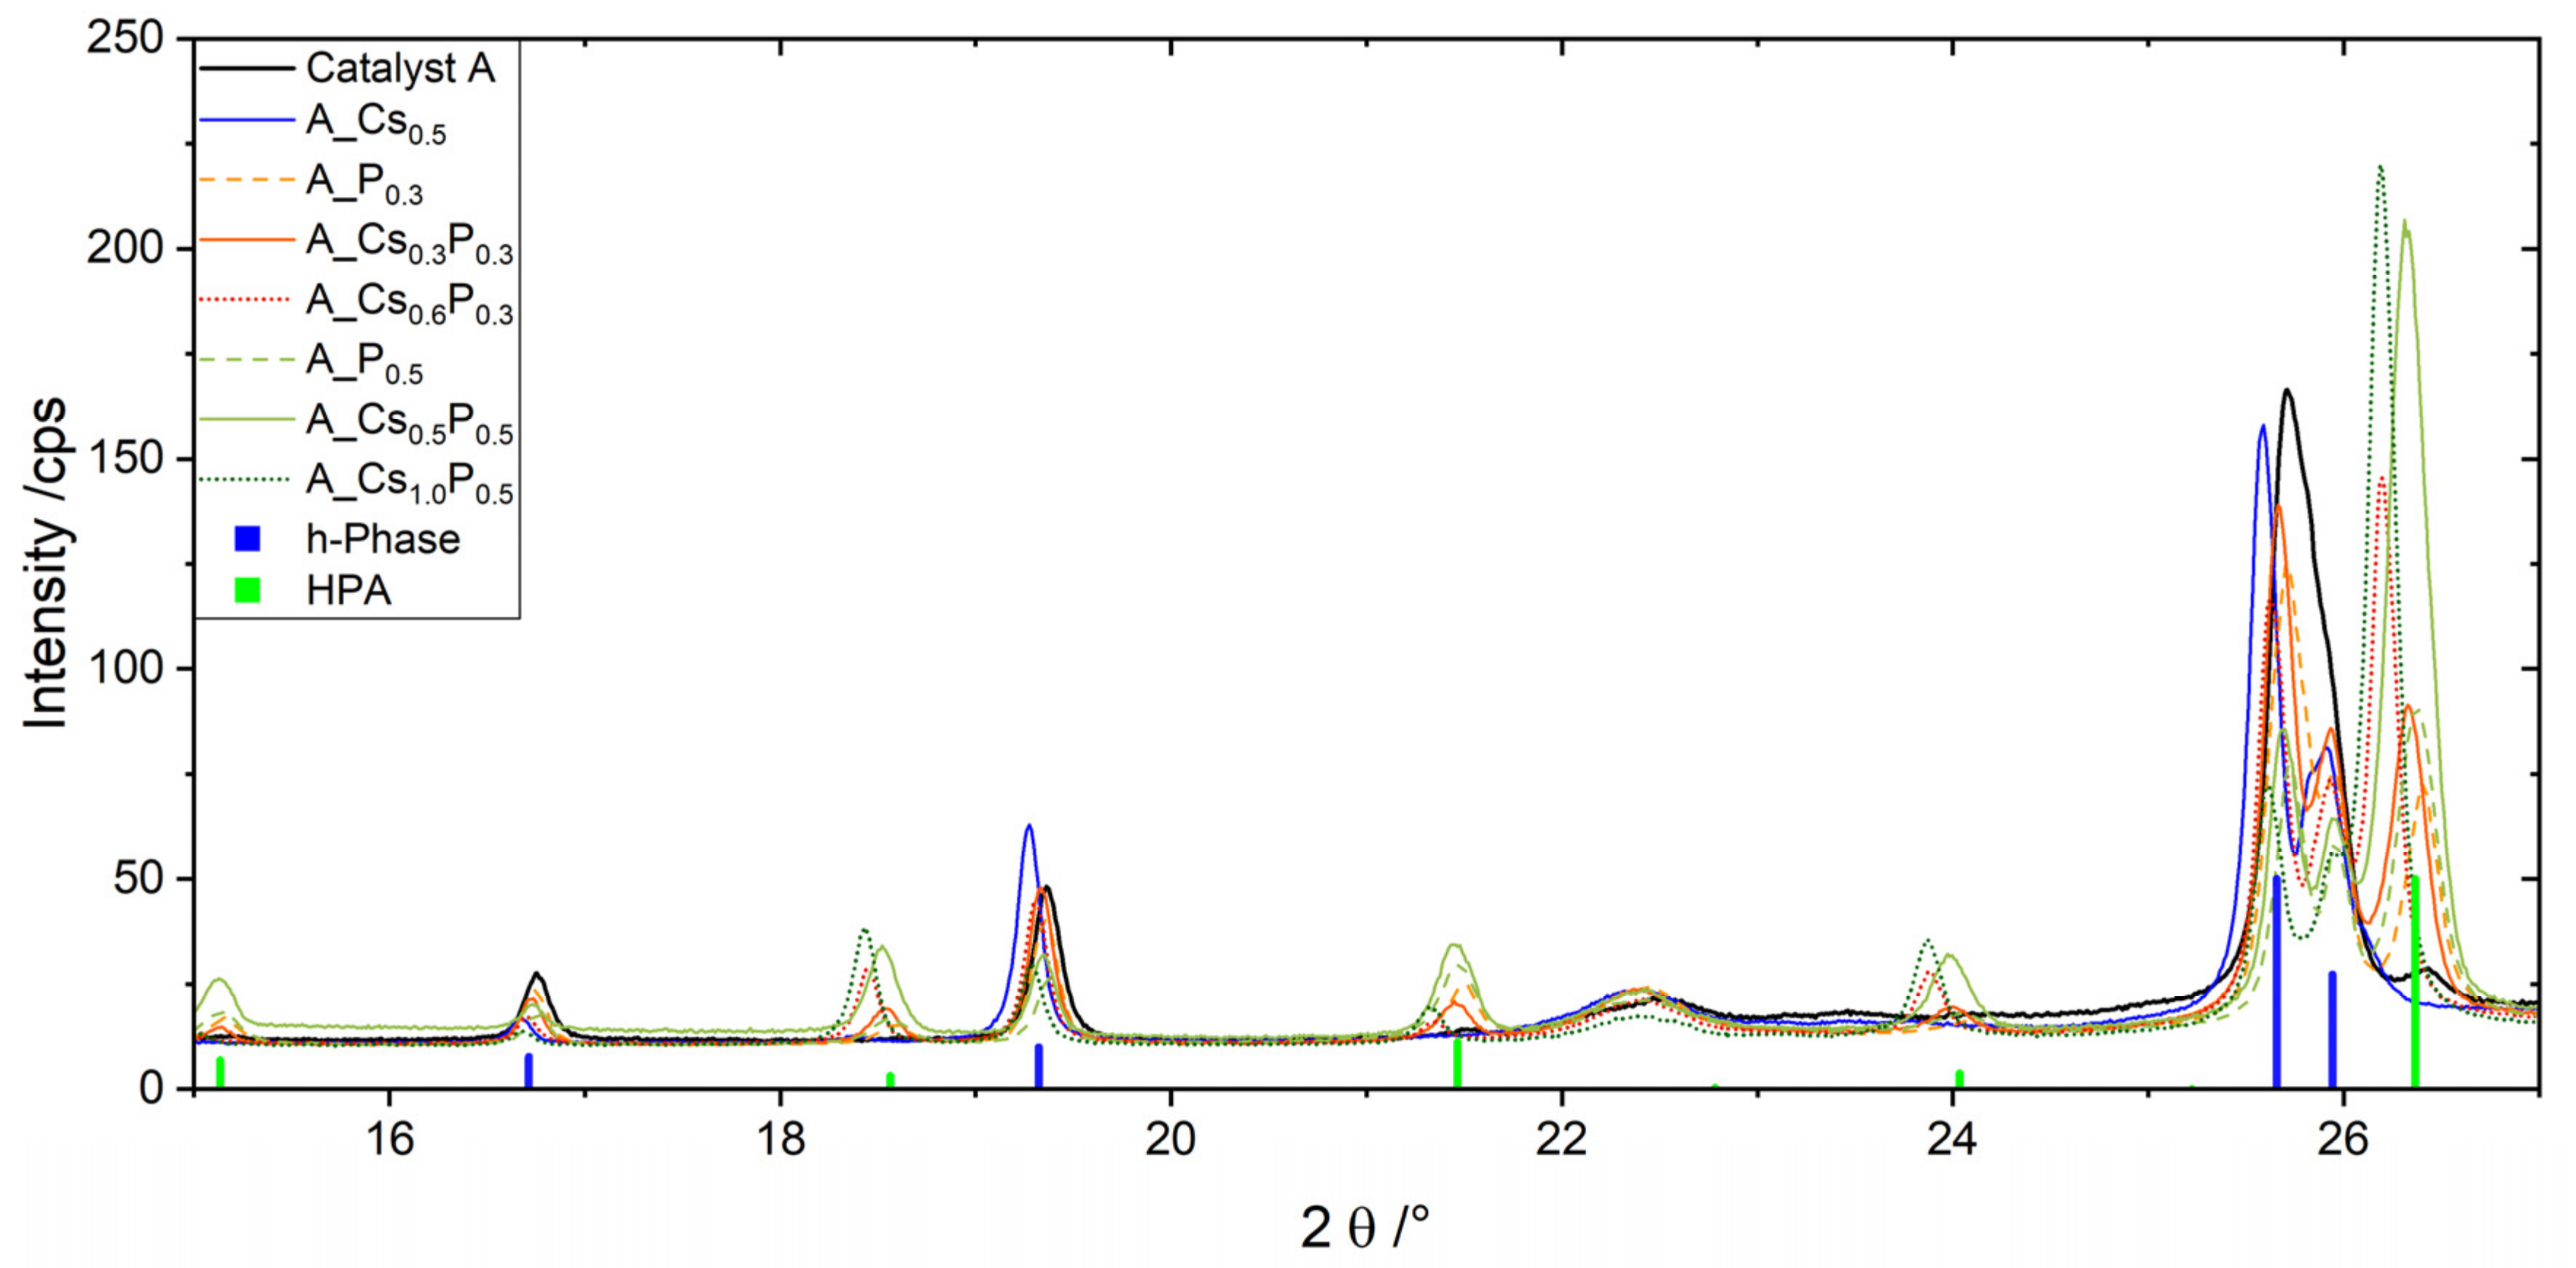
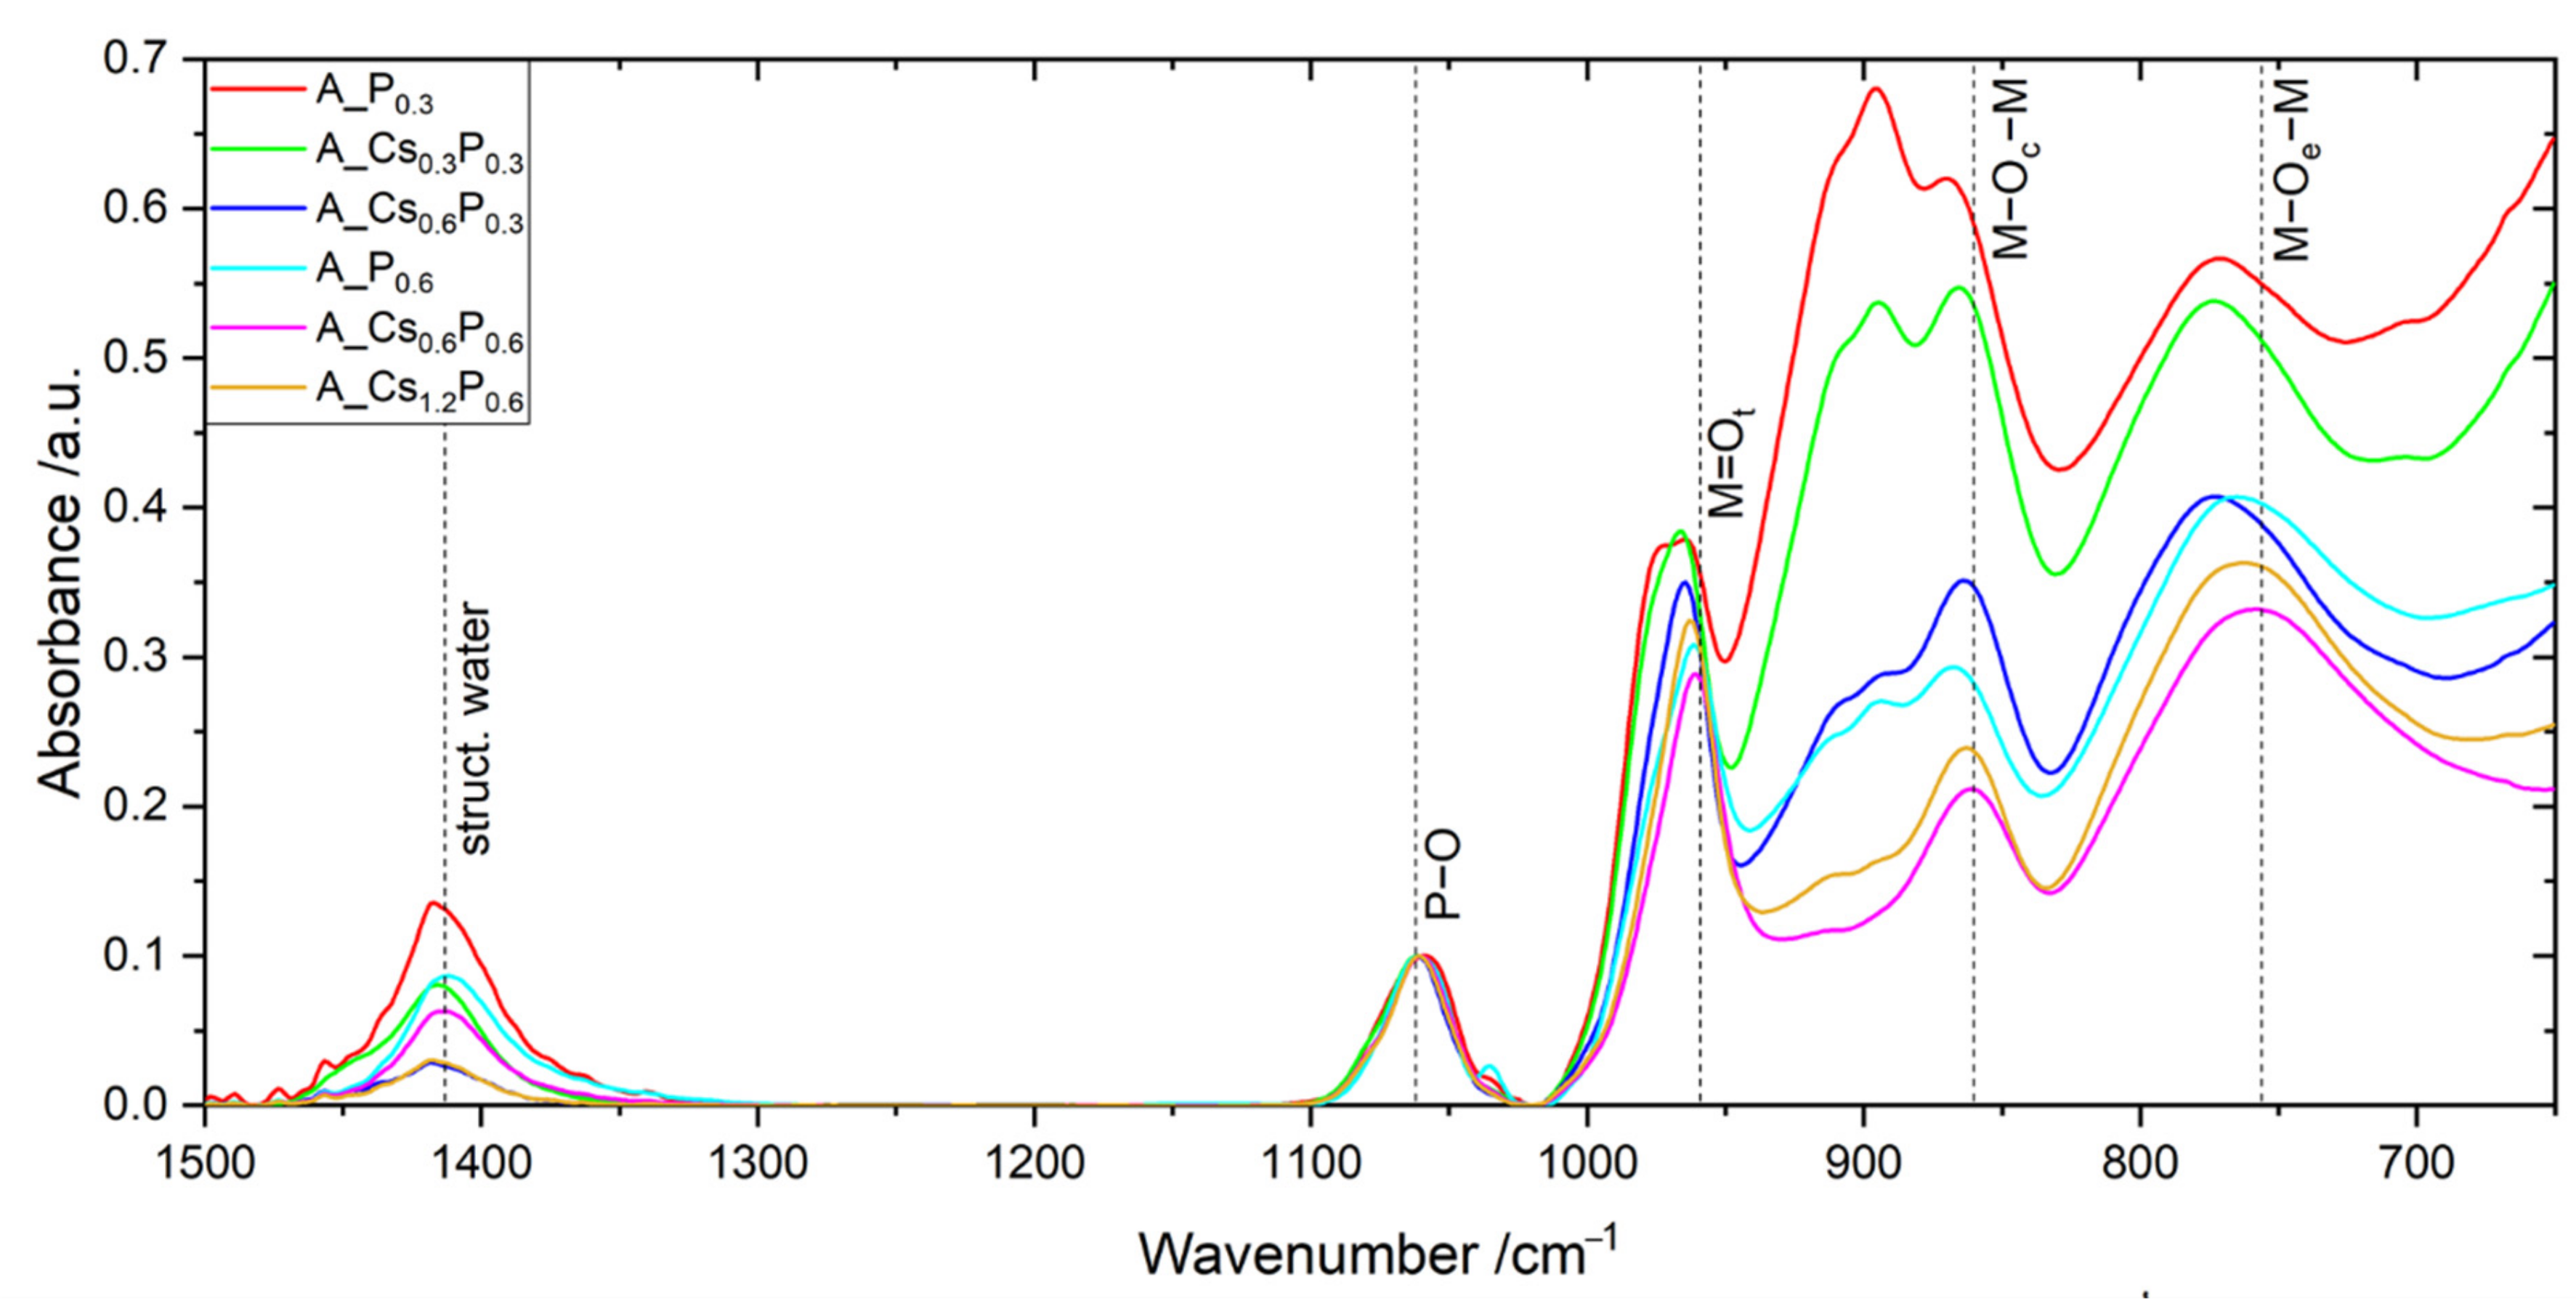
2.2. Catalyst A with Varied Cs/P and (Mo + V + W)/P Ratios

It should be investigated whether the formation of HPA is the only reason for the increased selectivity of the catalysts or if adding only Cs also has an effect. Furthermore, the influence of Cs on the formed HPA phase is of interest. Different ratios of Cs/P and (Mo + V + W)/P were added to the catalysts. Since catalyst A with added Cs and P features the highest MAA selectivity and exhibits the best capability of forming a heteropoly acid, results for catalysts B and C will not be shown. Catalysts B and C showed similar effects as catalyst A for all following experiments. The corresponding results can be found in the Supplementary Materials.
Figure 5 shows XRD patterns of catalyst A prior to and after adding Cs and P with different (Mo + V + W)/P ratios at Cs/P ≈ 1. A greater extent of HPA phase formation with higher amounts of Cs and P added can be observed. As the Cs and P content of the samples rises, the HPA peaks in the XRD pattern increase, while the h-phase peaks decrease. This process continues until the hexagonal phase is completely converted into HPA (pink line). Table 2 shows the estimated crystallinity and phase composition of the catalysts modified with Cs and P. For each tenth of added Cs and P, the HPA proportion increases for about 15 wt.%. The (Mo + V + W)/P ratio does not influence the lattice parameters of the HPA. For all catalysts, the HPA unit cell measures about 1.173 nm. Apparently, the specific surface area of the catalysts is not affected by the amount of HPA formed. All catalysts feature a similar specific surface area after the introduction of Cs and P, which is lower than the surface area of the unmodified catalyst A.
In addition to XRD, IR measurements of the same catalysts are shown in Figure 6. With increasing amount of Cs and P added, a higher amount of HPA can be detected in form of stronger pronounced characteristic Keggin vibration bands. This becomes particularly obvious when relating the Keggin bands to the mixed oxides Mo-O-band at 900 cm−1, which gradually decreases with higher Cs and P content. The ratio of structural water band to P-O-band is about equal for every sample, which indicates a similar Cs+-salification of the catalysts’ HPA phases. Interestingly, the wave number of the characteristic Keggin bands shifts to smaller values for lower (Mo + V + W)/P ratios. The band positions are shown in the Supplementary Materials. This effect has already been reported in studies varying the transition metal composition of HPAs. It is well known, that the IR wavenumbers of tungsten HPAs are higher compared to molybdenum HPAs. [14,15] Possibly tungsten preferably gets included into the HPA phase upon mixed oxide transformation, leading to a higher tungsten content in the HPA phase at lower amounts of Cs and P addition.
Figure 7 shows the activity and MAA selectivity of catalyst A prior to and after adding Cs and P with different (Mo + V + W)/P ratios at Cs/P ≈ 1. As can be expected, the MAA selectivity is subsequently increased with higher Cs and P content and a higher HPA share, respectively. As already pointed out in Section 2.1, the catalyst activity of catalyst A modified with Cs and P is lower than for the pure catalyst A. Apparently, the catalyst activity is not affected by the (Mo + V + W)/P ratio, since all the catalysts modified with Cs and P feature roughly the same specific surface area of 7.5–9.5 m2/g (Table 2). The variations of the surface area are likely caused by the preparation method. Since all catalysts were hand grinded, they did not have an identical particle size distribution. This affected the resulting specific surface area after adding Cs & P, as additional testing showed.
To further investigate the HPA formation as well as the effect of Cs alone, the Cs/P ratio was varied. Figure 8 displays the XRD pattern of the Cs/P variation. As can be expected, adding only Cs does not form a HPA phase, since P acts as the central atom of the HPA structure. With increasing Cs/P ratios, the characteristic HPA peaks shift towards smaller θ values, which implies the widening of the HPA unit cell. This indicates the implementation of Cs primarily into the HPA phase, as already expected via TEM-EDX (Figure 3). Table 3 summarizes the HPA unit cell parameters as well as the phase composition of the catalysts modified with Cs and P. At equal Cs/P ratios the unit cell has roughly the same size. Moreover, the amount of HPA formed increases with the Cs/P ratio. Hence, a higher Cs/P ratio is beneficial for the formation of HPA phase. Furthermore, it can be concluded that a higher Cs/P ratio increases the specific surface area of the catalysts, which is a known effect for pure heteropoly acids [10,20]. The mixed oxide unit cell size is not majorly affected by the addition of both Cs and P. Only when adding Cs alone, Cs seems to be included in the hexagonal phase, as the peak positions of the h-phase shift to smaller θ values (blue line).
IR spectra of catalyst A prior to and after adding Cs and P with different (Mo + V + W)/P and Cs/P ratios are shown in Figure 9. Here, the IR spectra are normalized to the characteristic P-O band at 1062 cm−1. The ratio of the constitutional water vibration band (1413 cm−1) to P-O vibration band decreases with increasing Cs/P ratio, proving a greater salification of the HPA phase with higher Cs/P ratios.
Catalytic performance figures of catalyst A samples modified with Cs and P under Cs/P variation can be found in the Supplementary Materials. The highest MAA selectivities could be reached with a Cs/P ratio of between 0 and 1. Even though a higher Cs/P ratio increases the amount of HPA phase transformed, it is not beneficial for the MAA selectivity. At Cs/P ≈ 2 the catalysts feature the lowest selectivity towards MAA. A higher Cs+-salification lowers the MAA selectivity of HPAs [13]. The higher the Cs/P ratio, the higher the catalyst activity, which can be linked to a rise in catalyst surface area (Table 3.). This is likely to be caused by the formation of HPA phase with increasing amount and degree of Cs+-salification, as the surface area of HPAs gets boosted when higher Cs+-salified [10,20].
If only Cs is added to the h-phase, the MAA selectivity slightly decreases. The catalyst activity is not effected by Cs addition. Corresponding data can be found in the Supplementary Materials as well. Hence, it can be concluded that Cs does not affect the catalyst in a positive way.

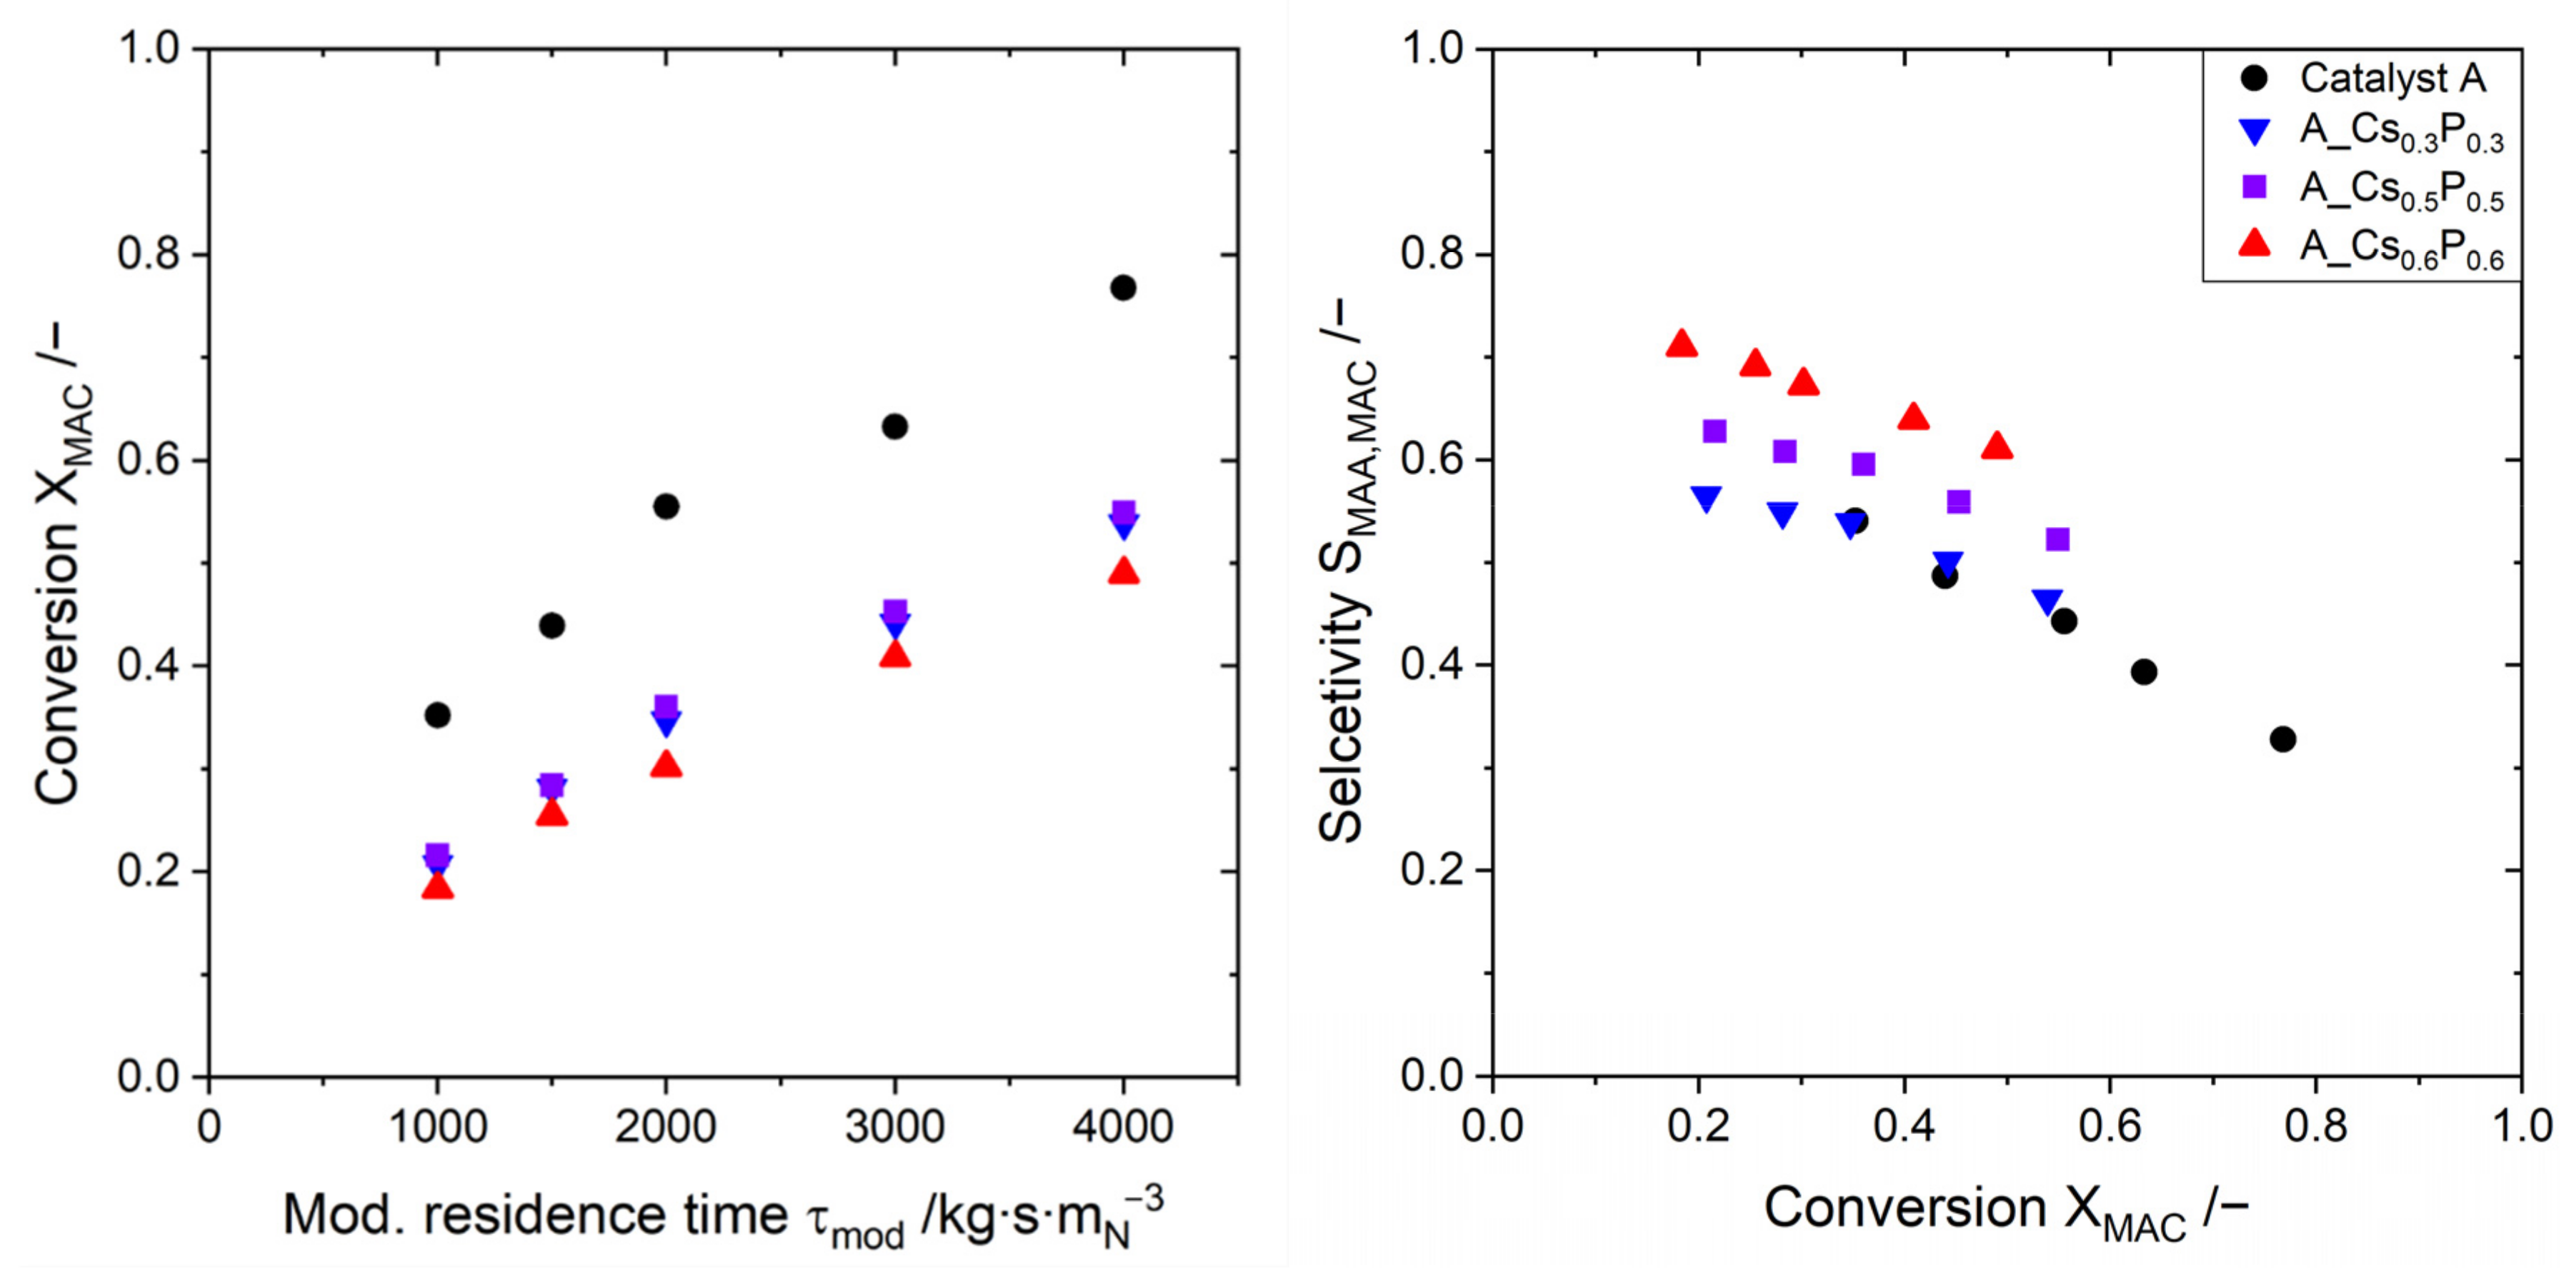
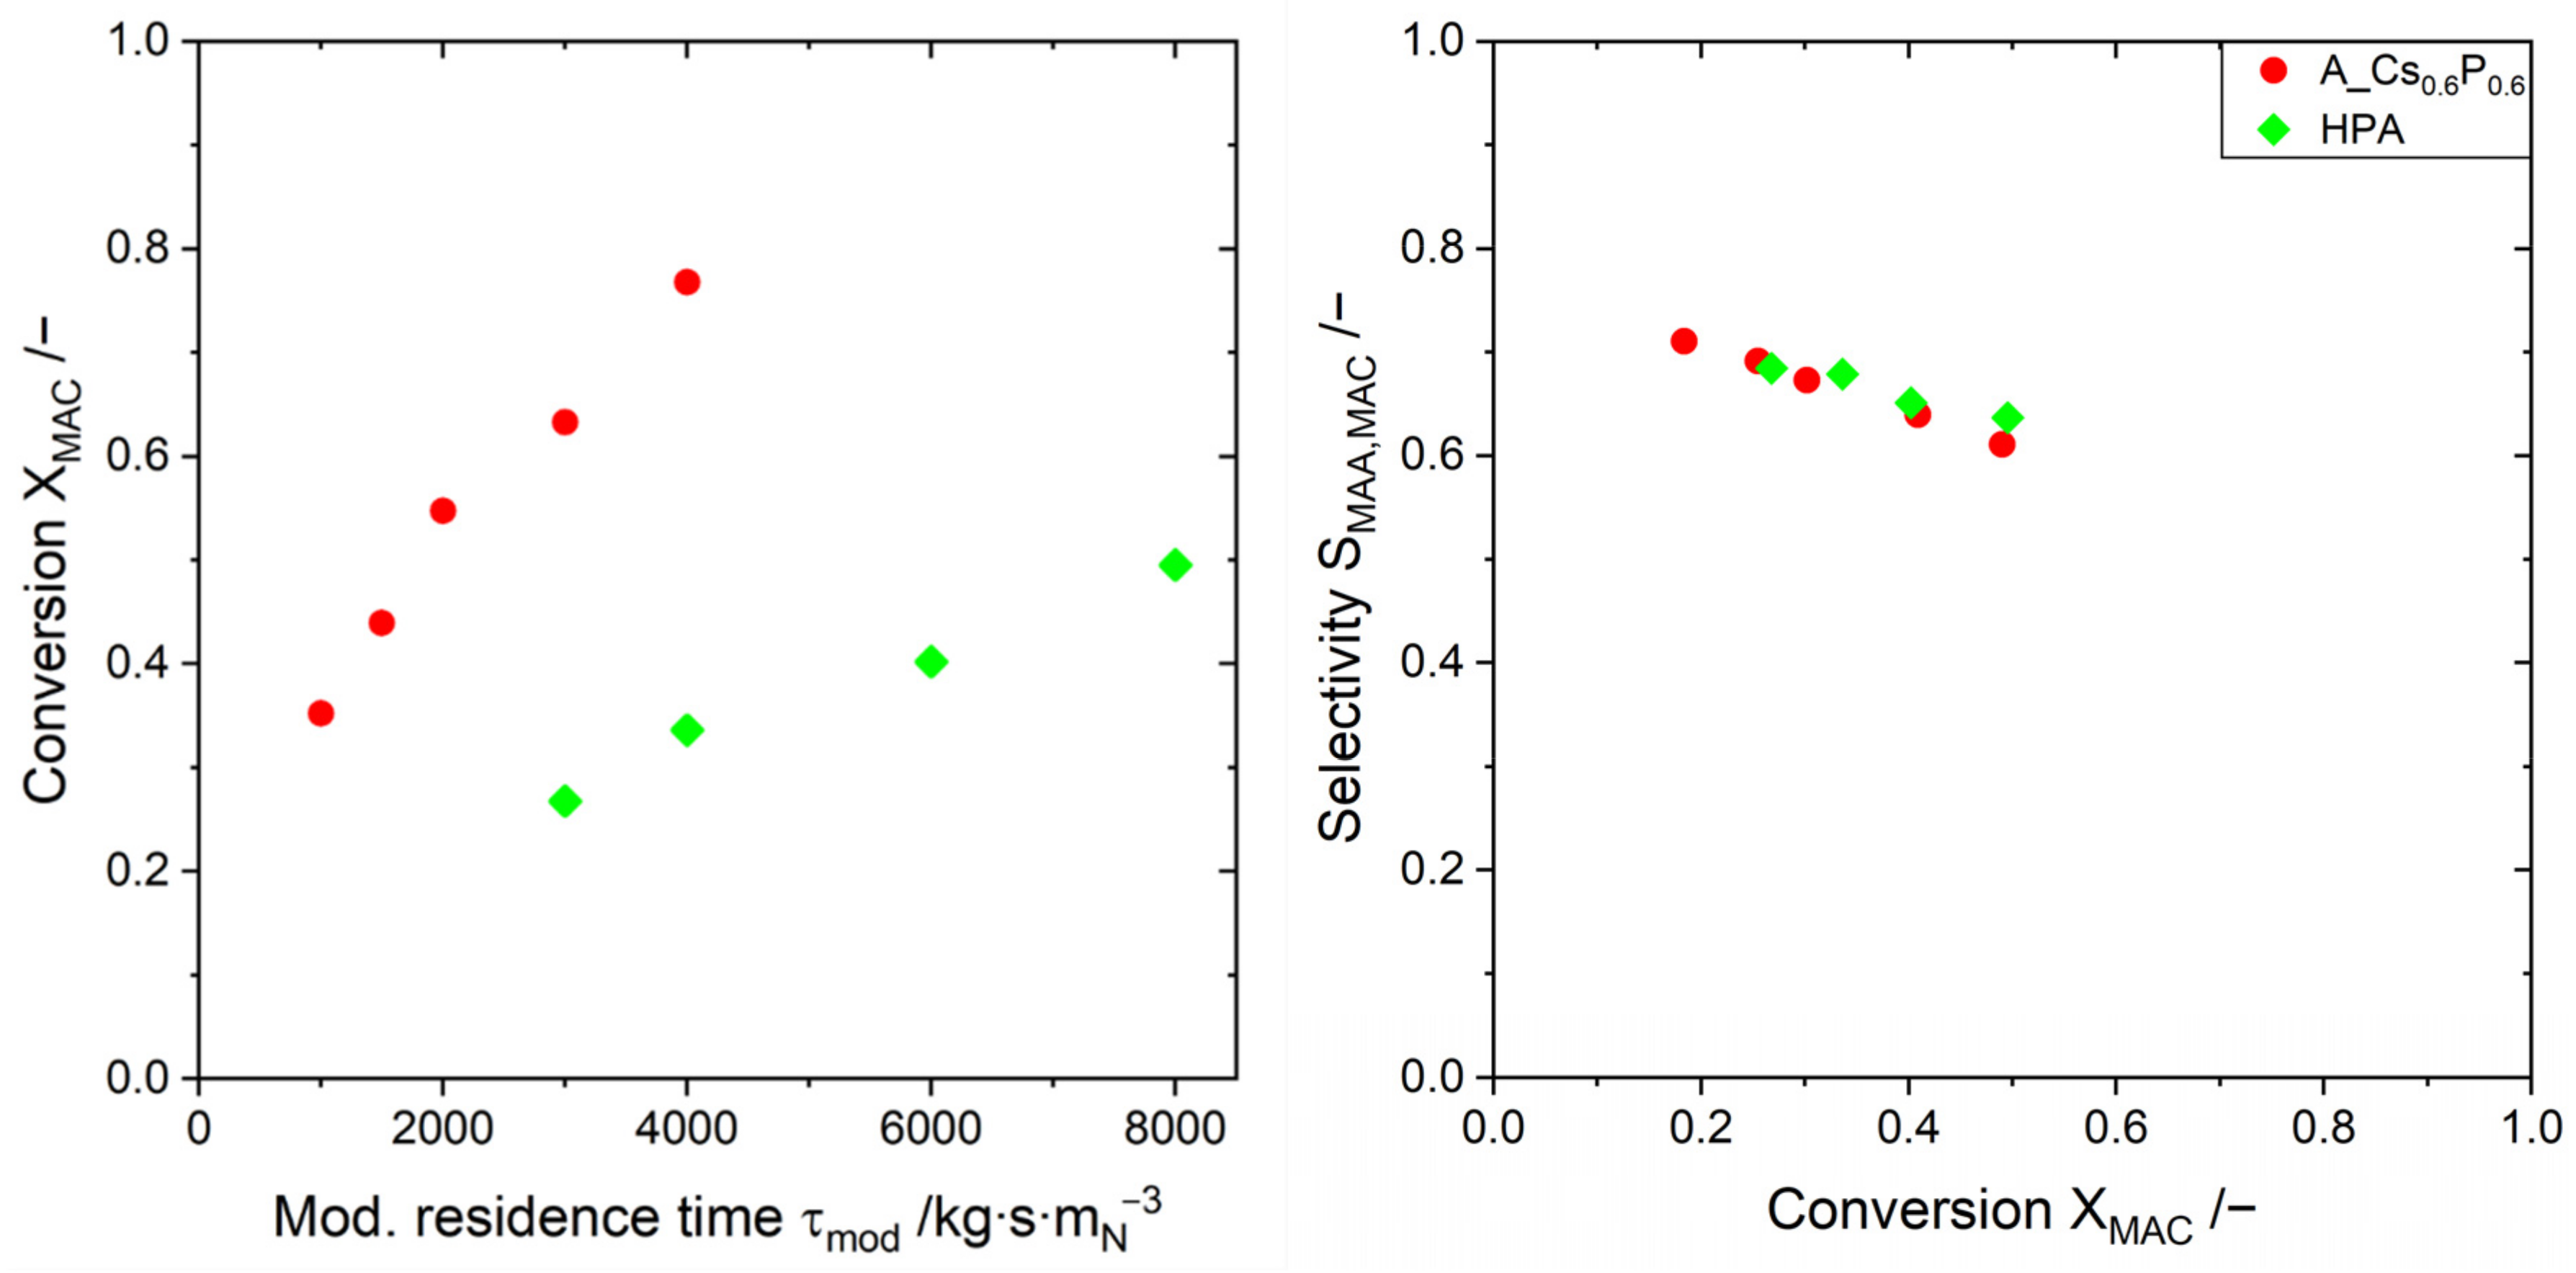
2.3. Evaluating the Catalyst Performance

We compared our best-performing mixed oxide modified with Cs and P (A_Cs0.6P0.6) to a directly synthesized HPA phase. This HPA was synthesized to match the elemental composition of the HPA phase transformed from the mixed oxide according to TEM-EDX analysis (Figure 3). A comparison of the catalysts’ performance is shown in Figure 10. The catalyst activity of A_Cs0.6P0.6 is much higher than for the HPA catalyst. This can be explained by the low surface area of the directly synthesized HPA (3.9 m2/g) compared to the mixed oxide modified with Cs and P (8.8 m2/g). When comparing the surface specific activity of both catalysts, they measure about the same. The MAA selectivity of the two catalysts is nearly identical. Since A_Cs0.6P0.6 is composed of 95 wt.% HPA and its’ MAA selectivity is equal to the directly synthesized HPA, the purpose of adding Cs and P to Mo/V/W mixed oxide questionable. The only benefit compared to a direct HPA synthesis could be a higher thermal stability, which is evaluated in the following section.

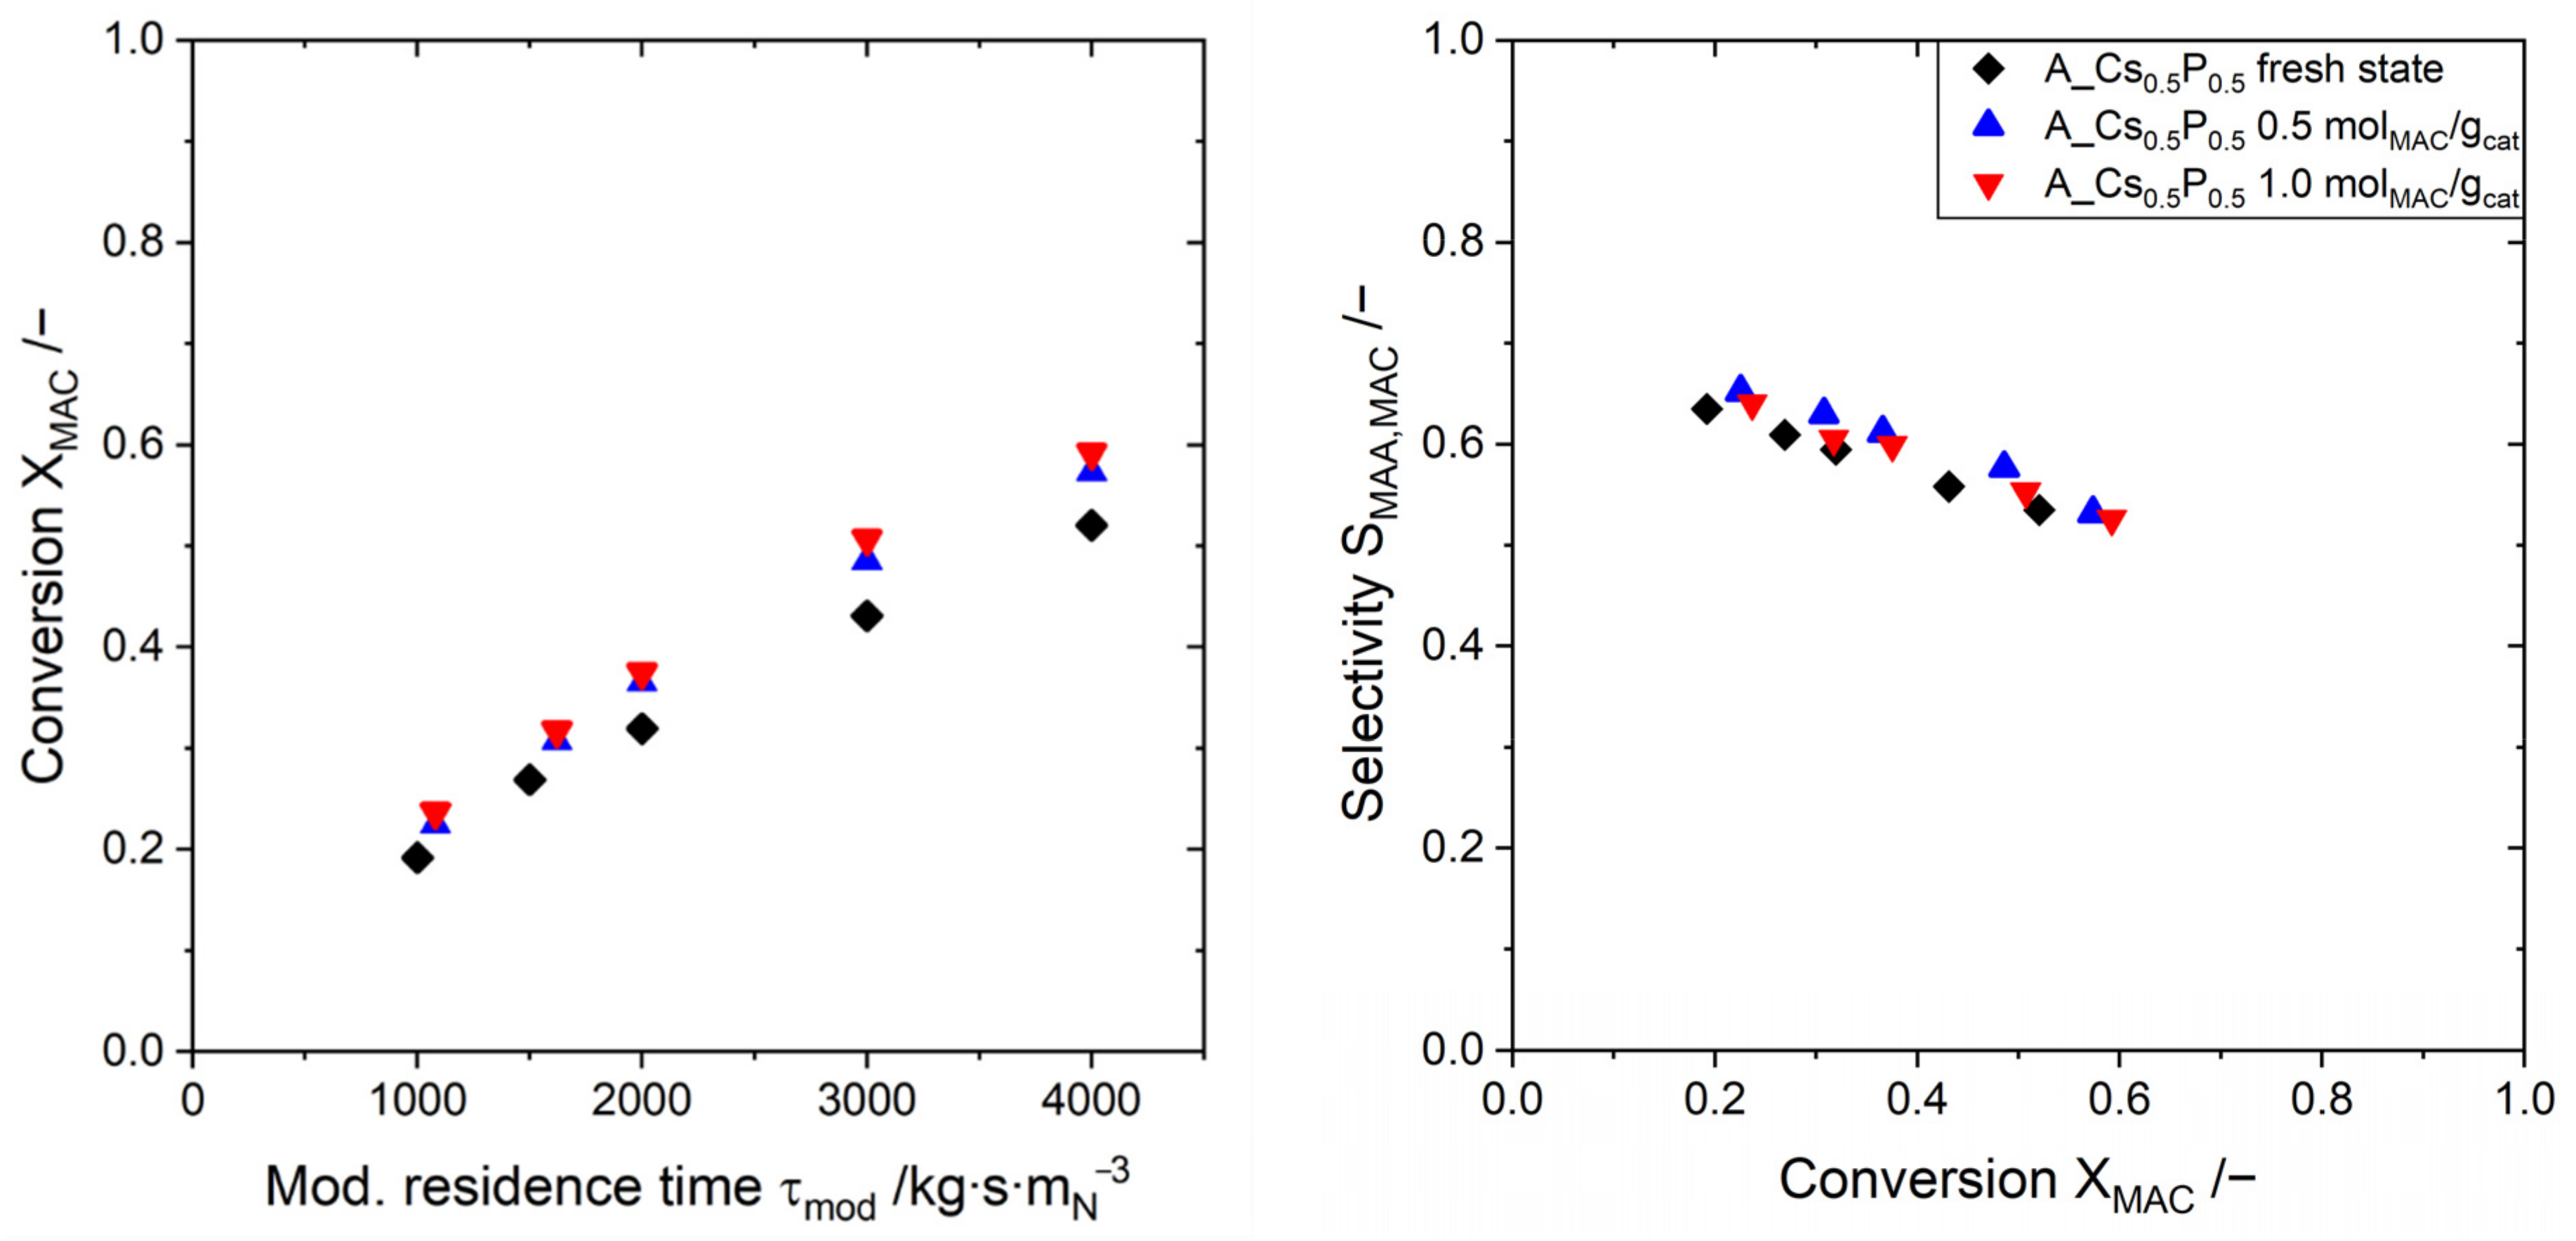
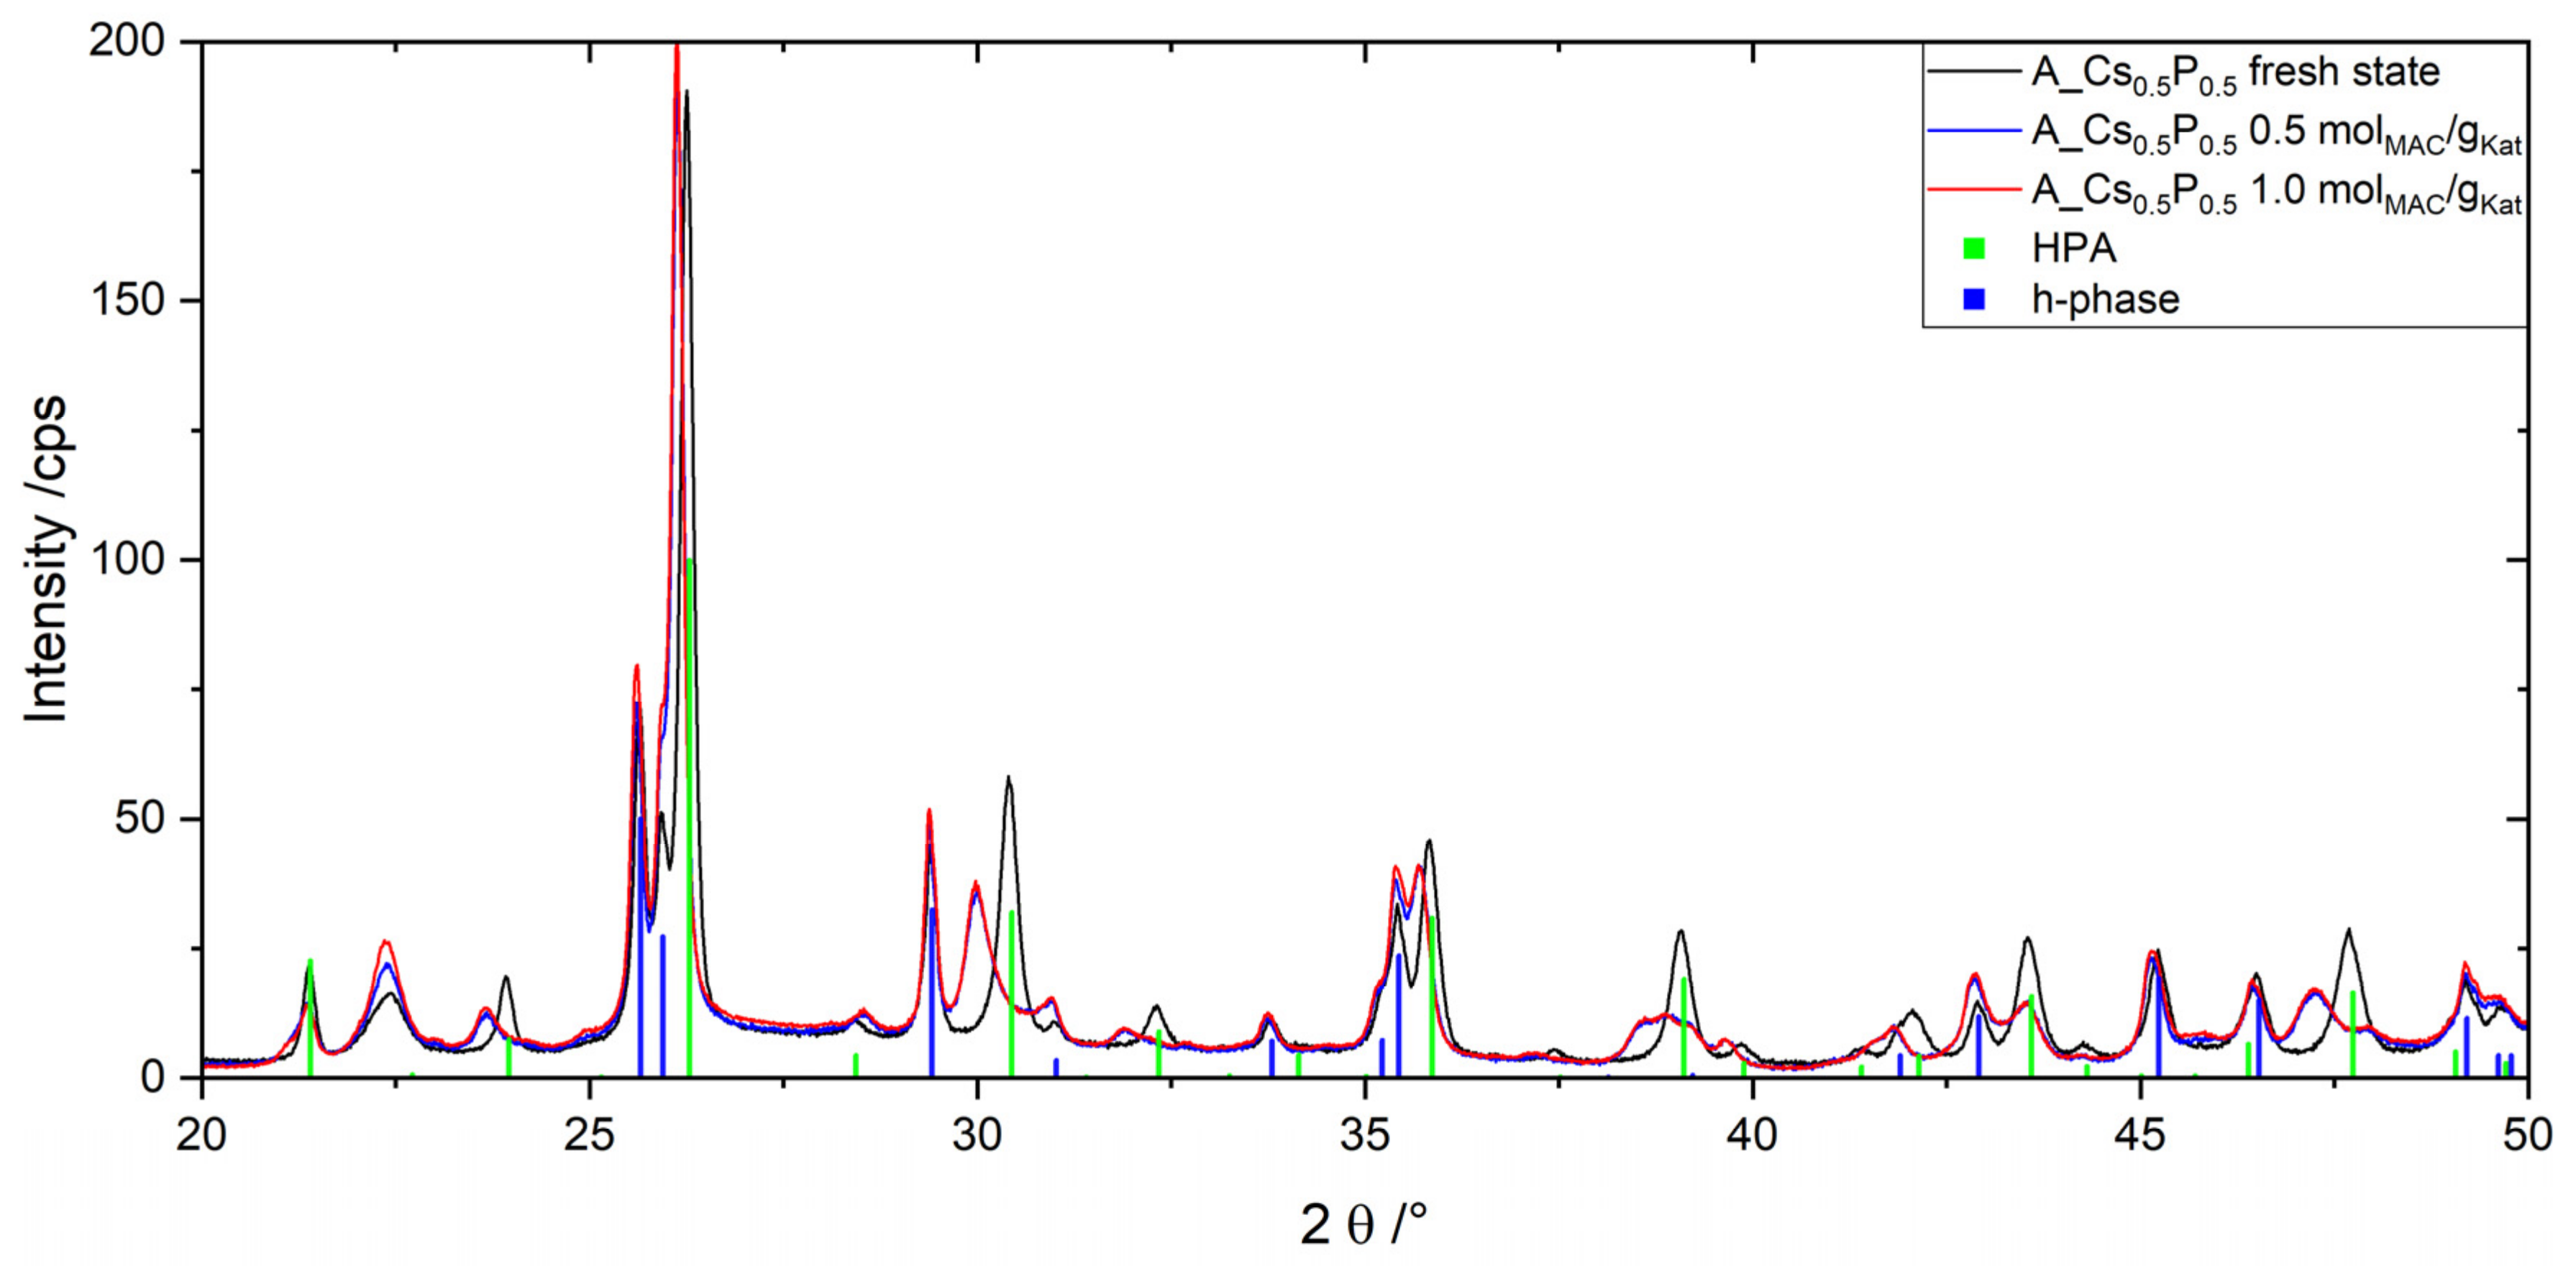
2.4. Catalyst Stability

To investigate the thermal stability of mixed oxides with added Cs and P, a directly synthesized HPA was compared to an A_Cs0.5P0.5-catalyst. A_Cs0.5P0.5 contains about 75 wt.% HPA with 25 wt.% mixed oxide remaining. After reaching steady state performance, both catalysts were exposed to an elevated reactor temperature of 340 °C to increase their thermal decomposition rate. The cumulated amount of converted MAC was regarded as an indicator for catalyst age. In total, both catalysts converted about 1 mol MAC per g of catalyst. During our stability testing both HPA phases exhibited characteristic ageing symptoms to a similar extent, which will be discussed as follows. On this account, only data of A_Cs0.5P0.5 will be shown, while the HPA catalyst can be found in the Supplementary Materials.
Figure 11 shows the catalytic performance of A_Cs0.5P0.5 at 300 °C for the fresh state, 0.5 molMAC/gcat converted and 1.0 molMAC/gcat converted. Similar to the observations of Marosi et al. [13] the MAA selectivity initially rises by 3–5%, but decreases by 2–3% upon a MAC conversion of 1.0 molMAC/gcat, indicating a catalyst deactivation. The same effect can be observed for the directly synthesized HPA phase (Supplementary Materials). With increased catalyst age, the catalyst activity of A_Cs0.5P0.5 rises to about 120% of its initial value, which can be linked to an increase in catalyst surface area (Table 4).
Figure 12 displays XRD pattern of the A_Cs0.5P0.5 catalyst at the three aging stages. While the h-phase appears completely unaffected, the HPA shows a significant shift towards smaller angles. The unit cell widens from initially 1.175 nm to 1.189 nm, as shown in Table 4. Moreover, many characteristic HPA reflexes widen, which corresponds to a reduction in HPA particle size that can be caused by its disintegration. This observation again correlates with works of Marosi et al., where the authors also recognized a widening of the unit cell with advanced catalyst age. For 0.6 molMAC/gcat they observed an expansion of the unit cell from 1.171 nm to 1.188 nm [13]. In contradiction to [13] the formation of orthorhombic MoO3 cannot be identified. Very similar results to A_Cs0.5P0.5 can be observed for the directly synthesized HPA catalyst (Supplementary Materials).
IR spectra of A_Cs0.5P0.5 and the directly synthesized HPA show a mayor decline of the constitutional water band at 1410 cm−1 with increased catalyst age. This segregation of structural water is a well-known sign of HPA decomposition [21,22,23], which further underlines the HPA fragmentation. Corresponding figures can be found in the Supplementary Materials.

3. Experimental

3.1. Catalyst Preparation
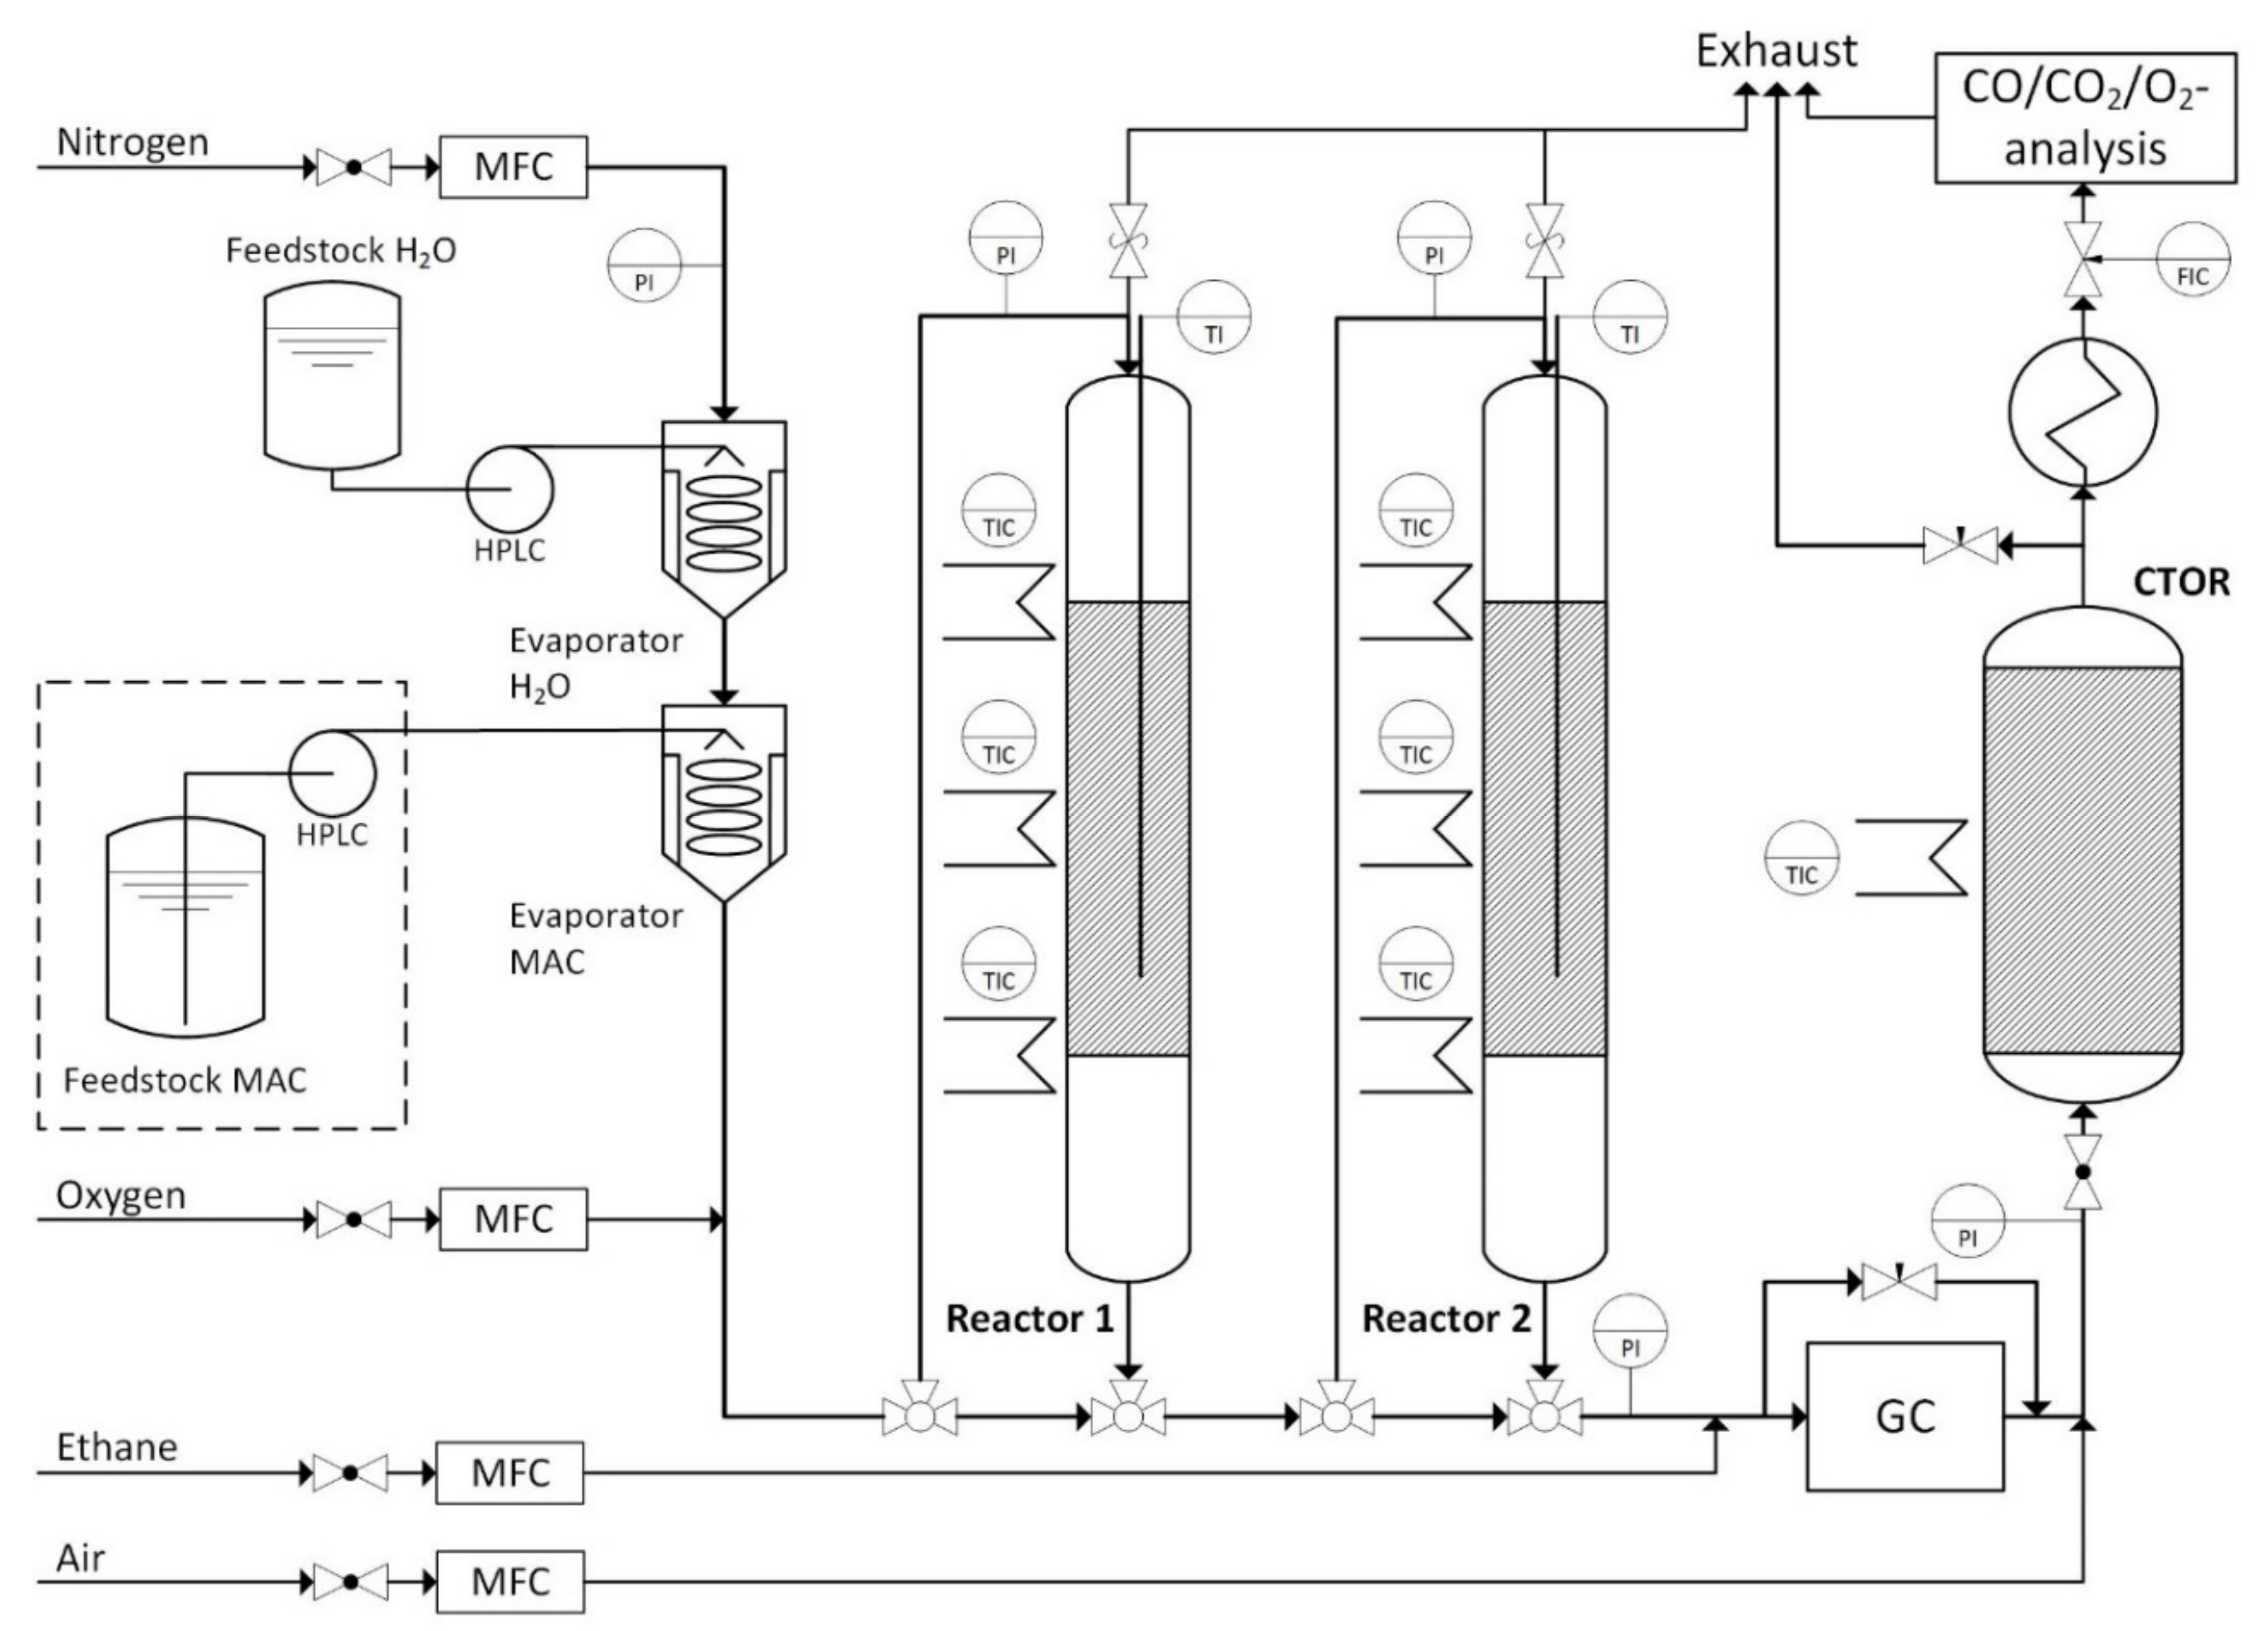
This study uses three mixed oxide catalysts (A, B and C) as starting materials for modification with Cs and P. Because the syntheses of catalysts A, B and C have already been described in detail elsewhere [24], they will only be addressed shortly. The syntheses aimed at starting materials with a similar elemental composition of approximately (Mo8V2W1)Ox, but containing different portions of the so-called h-phase and of M1. Catalyst A predominantly consisted of h-phase, catalyst B contained h-phase and M1 in equal amounts, and catalyst C was almost pure M1. As reference, a pure Keggin-type HPA catalyst was also synthesized.
Catalyst A: The hexagonal (Mo,V,W)Ox catalyst was acquired via crystallization. An aqueous solution containing 29.76 g ammonium heptamolybdate (Alfa Aesar, Haverhill MA, USA, 99%), 4.93 g ammonium metavanadate (Merck, Darmstadt, Germany, 99%) and 5.32 g ammonium metatungstate (Honeywell, Charlotte, NC, USA, 99%) in 1000 mL demineralized was evaporated, crystallizing a solid precursor. The precursor was calcinated under nitrogen at up to 400 °C.
Catalyst B: The M1 phase and hexagonal phase catalyst was obtained by means spray drying following the procedure of example 1) in [25]. 29.76 g ammonium heptamolybdate (Alfa Aesar, 99%), 4.93 g ammonium metavanadate (Merck, 99%) and 2.66 g ammonium metatungstate (Honeywell, 99%) were dissolved in 1000 mL demineralized water and spray dried. The spray dried powder was kneaded with added water and calcined like catalyst A.
Catalyst C: The M1 phase was prepared with hydrothermal synthesis in an autoclave according to example 2) in [26]. 11.61 g ammonium heptamolybdate (Alfa Aesar, 99%) and 1.01 g ammonium metatungstate (Honeywell, 99%) were dissolved in 120 mL demineralized water (solution A). Another solution containing 3.97 g vanadium sulfate oxide hydrate (Alfa Aesar, 99.9%) in 120 mL demineralized water was prepared (solution B). The two solutions were added together and thermally treated in an autoclave at 175 °C for 24 h. The calcination was also accomplished in nitrogen atmosphere at temperatures up to 400 °C.
Addition of Cs and P: The solids were hand grinded and suspended in an aqueous solution containing cesium acetate (Alfa Aesar, 99%) and/or phosphoric acid (VRW Chemicals, 99%) with a ratio of 10 mL solution per 1 g of catalyst. The Cs and P concentrations in the solution were adjusted to obtain the desired molar ratio of promotor/catalyst. The liquid was completely evaporated; the solid residue was calcined in nitrogen atmosphere as previously described for catalyst A.
HPA: The HPA catalyst was obtained via crystallization. 40.07 g ammonium heptamolybdate (Alfa Aesar, 99%), 3.95 g ammonium metavanadate (Merck, 99%) and 7.31 g ammonium metatungstate (Honeywell, 99%) were dissolved in 60 mL demineralized water at 50 °C. The solution was stirred under reflux for 90 min at 50 °C until 2.78 g 85% phosphoric acid (VWR Chemicals, Radnor, PA, USA, 99%) and 5.88 g cesium nitrate (Alfa Aesar 99.8%) were added. The pH value of the solution was adjusted to pH 1 via nitric acid (VWR Chemicals, 99%), causing yellow flakes to crystallize. The suspension was stirred under reflux for 150 min at 50 °C until the liquid was completely evaporated at 85 °C. The calcination of the solid HPA precursor was achieved like catalyst A.
Prior to transfer into a reactor, the catalyst powders were finely ground, subsequently pressed into cylindrical pellets and crushed again. The fraction of particles with diameters ranging from 0.71 mm to 1.25 mm was used for catalytic performance tests. The occurrence of external and internal mass transfer limitations at and in these particles could be excluded (calculations are provided in the Supplementary Materials).

3.2. Reaction Unit

The catalytic experiments were conducted in a lab scale experimental unit with two tubular fixed-bed reactors in series (Figure 13). To ensure ideal plug-flow and to improve heat transfer with the intention to maintain isothermal reactor conditions, coarse silicon carbide particles of 1 mm diameter were placed up- and downstream to the catalyst bed, and fine SiC particles of 0.2 mm diameter were applied in a 1:1 mass ratio mixture with catalyst particles in the reaction zone. Isothermal conditions (ΔTmax = 2 K) were ensured with a coaxially displaceable thermocouple (Ni/Cr-Ni). A detailed description of the experimental unit and procedure can be found in [24].
Table 5 summarizes the parameter settings for the catalytic performance tests. The modified residence time is defined as the quotient of the total mass of active component and the volumetric inlet flow (Equation (1)) at standard conditions; values were varied such that a conversion range of from 30% to 80% was covered.
τ mod = m cat V ˙ p N , T N
Prior to catalytic testing, each catalyst was held at for about 72 h TOS under reaction conditions at 300 °C until a steady state was reached. The MAC conversion (Equation (2)) and the carbon-related reactor selectivities of the products (Equation (3)) were calculated with ṅi being molar flows and zi the number of carbon atoms of component i.
X MAC = n ˙ MAC , 0 n ˙ MAC n ˙ MAC , 0
S   R i = n ˙ i , 0 n ˙ i · z i n ˙ MAC , 0 n ˙ MAC · z i

3.3. Catalyst Characterization

X-ray diffraction measurements were conducted via a Bruker D8 Advance diffractometer equipped with a LynxEye XE detector to determine phase composition and crystallinity. CuKα radiation was applied over a scanning range from 5–95° with a step with of 0.015° and a total counting time of 384 s per step. For evaluation purposes DIFFRAC.SUITE EVA from Bruker was used. The lattice parameters were fitted with the software TOPAS V6 from Bruker [27]. Equation (4) was used to calculate the catalyst crystallinity, where F represents the respective integrated XRD peak area. Corundum was used as an internal standard to normalize the XRD patterns and account for so-called height errors.
crystallinity =   F total F amorphous F total
To support the data gained via XRD and detect constitutional water, attenuated total reflection infrared spectroscopy was conducted with a TENSOR 27 FTIR spectrometer (Bruker Optik). Base line correction was accomplished via OPUS software from Bruker.
The specific surface areas of the catalysts were determined using nitrogen physisorption (BET method) in a Micromeritics PhysiSporption ASAP 2020. The surface areas were calculated at relative pressures between 0.06–0.3. Before the measurements, the probes were heated to 300 °C for nine hours.
In order to elucidate the catalyst morphology, high-angle annular dark field scanning transmission electron microscopy (HAADF-STEM) imaging was performed in combination with energy-dispersive X-ray spectroscopy (EDX) utilizing a FEI OSIRIS ChemiSTEM microscope operated at 200 kV. For TEM sample preparation, the catalyst powder was mixed with Gatan G1 glue and hardened. Afterwards TEM lamella were cut using the focused ion-beam (FIB) method.
To obtain the elemental composition of the catalysts, the probes were melted with lithium borate (Spectromelt® A1000) and casted as fused tablets. For each element to detect, at least four fused tablets with different standardized concentrations were cast, which acted as a calibration standard. The chemical composition of the catalysts was determined by measuring the probe tablets against the calibration tablets via wavelength dispersive X-ray fluorescence spectroscopy (WD-XRF, Pioneer S4, Bruker AXS, Billerica, MA, USA).

4. Conclusions

The effects of adding Cs and P to Mo/V/W mixed oxides on catalytic performance as well as phase composition were studied. Three mixed oxides containing the well known M1-phase and a hexagonal (Mo,V,W)Ox-phase (h-phase) in the following mass ratios: A: 5/95, B: 45/45 and C: 95/5 were prepared. These catalysts A, B and C were added with phosphoric acid and/or cesium acetate with different (Mo + V + W)/P and Cs/P ratios and were characterized in the selective oxidation of MAC to MAA.
X-ray diffraction and infrared spectroscopy analysis revealed the transformation of the mixed oxides into a HPA phase after adding Cs and P. The extent of the phase transformation was depending on the mixed oxide starting material and increased for higher (Mo + V + W)/P and Cs/P ratios. In some cases it could reach almost 100%. Higher Cs/P ratios resulted in a higher extent of HPA formation and a higher Cs+-salified HPA phase. In general, the transformation of mixed oxide into HPA is accompanied by a boost of MAA selectivity while high Cs/P ratios had a detrimental effect on the MAA selectivity. Of the two crystal phases, the h-phase proved to be much more capable of transforming into a selective HPA catalyst than M1. Adding Cs and P to M1 yielded a highly Cs-salified HPA, which is considerably less MAA selective than a HPA with partial acid site occupation by Cs+. While the preconditions for HPA formation have been identified, effects of preparation conditions like temperature and atmosphere as well as the mechanism itself are not understood yet.
The highest MAA selectivity was achieved when almost fully transforming h-phase into HPA phase. At this state, the MAA selectivity was indistinguishable from a directly synthesized HPA with the same elemental composition. When comparing the thermal stability of a directly synthesized HPA with a mixed oxide modified with Cs and P, both catalysts showed well-known signs of HPA deactivation to such a similar extent that no catalyst could be ascribed a superior stability. Consequently, the addition of Cs an P to Mo/V/W mixed oxides should be seen as a different approach for obtaining a common Keggin-type HPA phase rather than an alternative catalyst system.

Supplementary Materials

The following are available online at https://www.mdpi.com/2073-4344/11/2/231/s1, Figure S1: XRD pattern of the directly synthesized HPA and characteristic Keggin-HPA XRD reflexes, Figure S2: Catalytic performance of catalyst A with added Cs and P. Variation of the Cs/P ratio at constant (Mo+V+W)/P ratio at 300 °C and 21% v/v water. MAC conversion over modified residence time and MAA selectivity over conversion, Figure S3: Catalytic performance of catalyst A and A_Cs0.5 at 300 °C and 21% v/v water. MAC conversion over modified residence time and MAA selectivity over conversion, Figure S4: Catalytic performance of catalyst B at 300 °C and 21 % v/v water prior to and after adding Cs and P. Variation of the (Mo+V+W)/P ratio with constant Cs/P ratio of 1. MAC conversion over modified residence time and MAA selectivity over conversion, Figure S5: Catalytic performance of catalyst B at 300 °C and 21 % v/v water prior to and after adding Cs and P. Variation of the Cs/P ratio at constant (Mo+V+W)/P ratios. MAC conversion over modified residence time and MAA selectivity over conversion, Figure S6: XRD pattern of catalyst B prior to and after adding Cs and P with different (Mo+V+W)/P ratios at a constant Cs/P ratio of 1. Characteristic XRD reflexes of h-phase (blue bars), HPA and amorphous M1-phase, Figure S7: XRD pattern of catalyst B prior to and after adding Cs and P in different Cs/P and (Mo+V+W)/P ratios. Characteristic XRD reflexes of h-phase and HPA, Figure S8: IR spectra of catalyst B prior to and after adding Cs and P with different (Mo+V+W)/P ratios at a constant Cs/P ratio of 1, Figure S9: IR spectra of catalyst B prior to and after adding Cs and P with different (Mo+V+W)/P and Cs/P ratios, Figure S10: Catalytic performance of catalyst C at 300 °C and 21% v/v water prior to and after adding Cs and P. Variation of the (Mo+V+W)/P ratio with constant Cs/P ratio of 1. MAC conversion over modified residence time and MAA selectivity over conversion, Figure S11: XRD pattern of catalyst C prior to and after adding Cs and P with different (Mo+V+W)/P ratios at a constant Cs/P ratio of 1. Variation of the (Mo+V+W)/P ratio with constant Cs/P ratio of 1. Characteristic XRD reflexes of h-phase and HPA, Figure S12: XRD pattern of catalyst C prior to and after adding Cs and P in different Cs/P and (Mo+V+W)/P ratios. Characteristic XRD reflexes of h-phase HPA and amorphous M1-phase, Figure S13: IR spectra of catalyst C prior to and after adding Cs and P with different (Mo+V+W)/P ratios at a constant Cs/P ratio of 1, Figure S14: IR spectra of a A_Cs0.5P0.5 for three cumulated amounts of converted MAC at an elevated temperature of 340 °C. Absorbance over wavenumber, Figure S15: Catalytic performance of the directly synthesized HPA at 300 °C and 21% v/v water. MAC conversion over modified residence time and MAA selectivity over conversion. Data shown for three cumulated amounts of converted MAC at an elevated temperature of 340 °C, Figure S16: XRD pattern of the directly synthesized HPA catalyst for three cumulated amounts of converted MAC at an elevated temperature of 340 °C. Characteristic XRD reflexes of HPA, Figure S17: IR spectra of the directly synthesized HPA catalyst for three cumulated amounts of converted MAC at an elevated temperature of 340 °C. Absorbance over wavenumber, Figure S18: Estimation of the catalyst crystallinity with Bruker DIFFRAC.EVA software, Table S1: Used parameters for the calculation of the external MAC concentration gradient between gas phase and catalyst surface, Table S2: Used parameters for the calculation of mass transfer limitation in the inter-crystalline voids, Table S3: Characteristic Keggin-HPA cluster IR vibration bands of catalyst A with added Cs and P at constant Cs/P ratio of 1 and varied (Mo+V+W)/P ratio, Table S1: Unit cell parameters and specific surface area of the directly synthesized HPA for three cumulated amounts of converted MAC at an elevated temperature of 340 °C.

Author Contributions

Conceptualization, M.S. and B.K.-C.; Methodology, M.S. and B.K.-C.; Software, M.S. and P.G.W.; Validation, M.S., B.K.-C., P.G.W. and S.H.; Formal Analysis, M.S., P.G.W., S.H.; Investigation, M.S.; Resources, B.K.-C.; Data Curation, M.S.; Writing—Original Draft Preparation, M.S.; Writing—Review & Editing, M.S. and B.K.-C.; Visualization, M.S.; Supervision, B.K.-C.; Project Administration, B.K.-C.; Funding Acquisition, B.K.-C. All authors have read and agreed to the published version of the manuscript.

Funding

This research was funded by KIT-Publication Fund of the Karlsruhe Institute of Technology.

Conflicts of Interest

The authors declare no conflict of interest.

Nomenclature

Abbreviations
FIDflame ionization detector
HAcacetic acid
HPAheteropoly acid
MAAmethacrylic acid
MACmethacrolein
MOmixed oxide
TCDthermal conductivity detector
wtweight
Symbols
ABETspecific surface area (m2∙g−1)
CMAC,sMAC concentration on the catalyst surface (mol∙m−3)
CMAC,gMAC concentration in the gas phase (mol∙m−3)
dHPAUnit cell parameter of HPA phase (nm)
Fiintegrated area in XRD diffractogram (−)
kF,isurface specific reaction rate coefficient (m∙s−1)
km,Imass specific reaction rate coefficient (m3∙kg−1∙s−1)
n ˙ i molar flow of component i (mol∙s−1)
n ˙ i , 0 molar flow of component i at the inlet (mol∙s−1)
ppressure (bar)
RSicarbon-based reactor selectivity to component i (−)
Ttemperature (°C)
TOStime on stream (h)
V ˙ total volumetric inlet flow (m3∙s−1)
WzWeisz number for inner mass transfer limitation (−)
Xiconversion of component i (−)
zicarbon number of component i (−)
τmodmodified residence time at standard conditions (kg∙s∙m−3)
Subscripts
0inlet condition
ccorner sharing
catcatalyst
eedge sharing
icomponent i
maxmaximum
NNorm conditions (0 °C, 1.01325 bar)
tterminal
Superscripts
Rreactor

References

  1. Védrine, J.C. Metal Oxides in Heterogeneous Oxidation Catalysis: State of the Art and Challenges for a More Sustainable World. ChemSusChem 2019, 12, 577–588. [Google Scholar] [CrossRef]
  2. Darabi Mahboub, M.J.; Dubois, J.-L.; Cavani, F.; Rostamizadeh, M.; Patience, G.S. Catalysis for the synthesis of methacrylic acid and methyl methacrylate. Chem. Soc. Rev. 2018, 47, 7703–7738. [Google Scholar] [CrossRef]
  3. Nagai, K.; Ui, T. Trends and Future of Monomer–MMA Technologies. Sumitomo Chem. 2004, 2, 4–13. [Google Scholar]
  4. Drochner, A.; Ohlig, D.; Knoche, S.; Gora, N.; Heid, M.; Menning, N.; Petzold, T.; Vogel, H. Mechanistic Studies on the Transition Metal Oxide Catalysed Partial Oxidation of (Meth)Acrolein to the Corresponding Carboxylic Acids. Top. Catal. 2016, 59, 1518–1532. [Google Scholar] [CrossRef]
  5. Wagner, J.B.; Su, D.S.; Schunk, S.A.; Hibst, H.; Petzoldt, J.; Schlögl, R. Structural characterization of high-performance catalysts for partial oxidation—the high-resolution and analytical electron microscopy approach. J. Catal. 2004, 224, 28–35. [Google Scholar] [CrossRef] [Green Version]
  6. Böhnke, H.; Gaube, J.; Petzoldt, J. Selective Oxidation of Methacrolein towards Methacrylic Acid on Mixed Oxide (Mo, V, W) Catalysts. Part 1. Studies on Kinetics. Ind. Eng. Chem. Res. 2006, 45, 8794–8800. [Google Scholar] [CrossRef]
  7. Böhnke, H.; Gaube, J.; Petzoldt, J. Selective Oxidation of Methacrolein towards Methacrylic Acid on Mixed Oxide (Mo, V, W) Catalysts. Part 2. Variation of Catalyst Composition and Comparison with Acrolein Oxidation. Ind. Eng. Chem. Res. 2006, 45, 8801–8806. [Google Scholar] [CrossRef]
  8. Schunk, S.; Sundermann, A.; Hibst, H. Structure oriented library design in gas phase oxidation catalysis. Catal. Today 2008, 137, 36–43. [Google Scholar] [CrossRef]
  9. Grasselli, R.K.; Volpe, A.F. Catalytic Consequences of a Revised Distribution of Key Elements at the Active Centers of the M1 Phase of the MoVNbTeOx System. Top. Catal. 2014, 57, 1124–1137. [Google Scholar] [CrossRef]
  10. Deusser, L.M.; Petzoldt, J.C.; Gaube, J.W.; Hibst, H. Kinetic Model for Methacrolein Oxidation. Influence of Cesium and Vanadium on Heteropolyacid Catalysts CsxH3-x+y[PMo12-yVyO40]. Ind. Eng. Chem. Res. 1998, 37, 3230–3236. [Google Scholar] [CrossRef]
  11. Illies, S.; Kraushaar-Czarnetzki, B. Processing Study on the Stability of Heteropoly Acid Catalyst in the Oxidation of Methacrolein to Methacrylic Acid. Ind. Eng. Chem. Res. 2016, 55, 8509–8518. [Google Scholar] [CrossRef]
  12. Keggin, J.F. Structure of the Crystals of 12-Phosphotungstic Acid. Nature 1933, 132, 351. [Google Scholar] [CrossRef]
  13. Marosi, L. Catalytic performance of Csx(NH4)yHzPMo12O40 and related heteropolyacids in the methacrolein to methacrylic acid conversion: In situ structural study of the formation and stability of the catalytically active species. J. Catal. 2003, 213, 235–240. [Google Scholar] [CrossRef]
  14. Chamack, M.; Mahjoub, A.R.; Aghayan, H. Cesium salts of tungsten-substituted molybdophosphoric acid immobilized onto platelet mesoporous silica: Efficient catalysts for oxidative desulfurization of dibenzothiophene. Chem. Eng. J. 2014, 255, 686–694. [Google Scholar] [CrossRef]
  15. Xue, J.; Yin, H.; Li, H.; Zhang, D.; Jiang, T.; Yu, L.; Shen, Y. Oxidation of cyclopentene catalyzed by tungsten-substituted molybdophosphoric acids. Korean J. Chem. Eng. 2009, 26, 654–659. [Google Scholar] [CrossRef]
  16. Krauß, K. Entwicklung und Einsatz einer DRIFTS-Meßzelle zur In-Situ-Spektroskopie Heterogen Katalysierter Gasphasenoxidationen; Technische Universität Darmstadt: Darmstadt, Germany, 2000. [Google Scholar]
  17. Dürr, N. Partialoxidation von Methacrolein zu Methacrylsäure an Heteropolysäurekatalysatoren; Technische Universität Darmstadt: Darmstadt, Germany, 2014. [Google Scholar]
  18. Mestl, G.; Verbruggen, N.F.D.; Bosch, E.; Knözinger, H. Mechanically Activated MoO3. 5. Redox Behavior. Langmuir 1996, 12, 2961–2968. [Google Scholar] [CrossRef]
  19. Akimoto, M. 12-Heteropolymolybdates as catalysts for vapor-phase oxidative dehydrogenation of isobutyric acid 3. Molybdotungstophosphoric and molybdovanadophosphoric acids. J. Catal. 1984, 89, 196–208. [Google Scholar] [CrossRef]
  20. Essayem, N.; Coudurier, G.; Fournier, M.; Védrine, J.C. Acidic and catalytic properties of CsxH3−xPW12O40 heteropolyacid compounds. Catal. Lett. 1995, 34, 223–235. [Google Scholar] [CrossRef]
  21. Xian-e, C.; Daichun, D.; Jianping, N.; Youming, J.; Jing, Z.; Yixiang, Q. Enthalpies of formation and DSC and TG results of heteropoly acids containing tungsten and molybdenum. Thermochim. Acta 1997, 292, 45–50. [Google Scholar] [CrossRef]
  22. Kozhevnikov, I.V. Heterogeneous acid catalysis by heteropoly acids: Approaches to catalyst deactivation. J. Mol. Catal. A Chem. 2009, 305, 104–111. [Google Scholar] [CrossRef]
  23. Micek-Ilnicka, A. The role of water in the catalysis on solid heteropolyacids. J. Mol. Catal. A Chem. 2009, 308, 1–14. [Google Scholar] [CrossRef]
  24. Sennerich, M.; Weidler, P.; Kraushaar-Czarnetzki, B. Hexagonal Mo/V/W mixed oxide as a catalyst for the partial oxidation of methacrolein to methacrylic acid. Catal. Commun. 2020, 141, 106016. [Google Scholar] [CrossRef]
  25. Hibst, H.; Tenten, A.; Marosi, L. Multimetalloxide. German Patent DE19542755A1, 22 May 1997. [Google Scholar]
  26. Rosowski, F.; Müller-Engel, K.J.; Klaus, J.; Blickhan, N.; Dürr, N.; Jekewitz, T.; Menning, N.; Petzold, T.; Schmidt, S. Verfahren der heterogen katalysierten Gasphasenpartialoxidation von (Meth)acrolein zu (Meth)acrylsäure. German Patent DE102012207811A1, 12 July 2012. [Google Scholar]
  27. Bruker AXS. TOPAS V6: General Profile and Structure Analysis Software for Powder Diffraction Data—User’s Manual; Bruker: Billerica, MA, USA, 2017. [Google Scholar]
Figure 1. XRD pattern of the three catalysts prior to (dots) and after (solid line) adding Cs & P in a (Mo + V + W)/Cs and (Mo + V + W)/P ratio of 18. Characteristic XRD reflexes of amorphous M1-phase (magenta bars), trigonal M1-phase (cyan bars), h-phase (blue bars) and HPA (green bars).
Catalysts 11 00231 g001
Figure 2. IR spectra of catalyst A_Cs0.6P0.6, B_Cs0.5P0.6 and C_Cs0.5P0.5 normalized to the characteristic (ν)-P-O-vibration at 1062 cm−1.
Catalysts 11 00231 g002
Figure 3. TEM-EDX micrograph recording of A_Cs0.6P0.6. Cyan color: HPA phase, magenta color: h-phase.
Catalysts 11 00231 g003
Figure 4. Catalytic performance of catalysts A, B and C at 300 °C and 21% v/v water prior to (empty circle) and after adding Cs and P (filled circle) with (Mo + V + W)/P and (Mo + V + W)/Cs ≈ 18. MAC Conversion over the modified residence time (top left), MAA selectivity over MAC conversion (top right), COx selectivity over MAC conversion (bottom left) and acetic acid selectivity over MAC conversion (bottom right).
Catalysts 11 00231 g004
Figure 5. XRD pattern of catalyst A prior to and after adding Cs and P with different (Mo + V + W)/P ratios at a constant Cs/P ratio of 1. Characteristic XRD reflexes of h-phase (blue bars) and HPA (green bars).
Catalysts 11 00231 g005
Figure 6. IR spectra of catalyst A prior to and after adding Cs and P with different (Mo + V + W)/P ratios at a constant Cs/P ratio of 1.
Catalysts 11 00231 g006
Figure 7. Catalytic performance of catalyst A prior to and after adding Cs and P. Variation of the (Mo + V + W)/P ratio with constant Cs/P ratio of 1 at 300 °C and 21% v/v water. MAC conversion over modified residence time (left) and MAA selectivity over conversion (right).
Catalysts 11 00231 g007
Figure 8. XRD pattern of catalyst A prior to and after adding Cs and P in different Cs/P and (Mo + V + W)/P ratios. Characteristic XRD reflexes of h-phase (blue bars) and HPA (green bars).
Catalysts 11 00231 g008
Figure 9. IR spectra of catalyst A prior to and after adding Cs and P with different Cs/P and (Mo + V + W)/P ratios. The IR spectra are normalized to the characteristic P-O band at 1062 cm−1.
Catalysts 11 00231 g009
Figure 10. Comparison of the catalytic performance of A_Cs0.6P0.6 with the directly synthesized HPA at 300 °C and 21% v/v water. MAC conversion over modified residence time (left) and MAA selectivity over MAC conversion (right).
Catalysts 11 00231 g010
Figure 11. Catalytic performance of A_Cs0.5P0.5 at 300 °C and 21% v/v water. MAC conversion over modified residence time (left) and MAA selectivity over conversion (right). Data shown for three cumulated amounts of converted MAC at an elevated temperature of 340 °C.
Catalysts 11 00231 g011
Figure 12. XRD pattern of A_Cs0.5P0.5 for three cumulated amounts of converted MAC at an elevated temperature of 340 °C. Characteristic XRD reflexes of h-phase (blue bars) and HPA (green bars).
Catalysts 11 00231 g012
Figure 13. Simplified flow scheme of the lab scale plant.
Catalysts 11 00231 g013
Table 1. Chemical composition, specific surface area, crystallinity and estimated phase composition of the catalysts A, B and C prior to and after adding Cs and P in a (Mo + V + W)/Cs and (Mo + V + W)/P ratio of 18.
CatalystChemical CompositionABET (m2/g)Cryst. (wt.%)h-Phase
(wt.%) *
M1
(wt.%) *
HPA
(wt.%) *
AMo8.0V2.0W1.013.9≈79>95<50
BMo8.0V2.0W0.520.6≈68≈55≈450
CMo8.0V2.3W0.825.8≈58<5>950
A_Cs0.6P0.6Mo8.0V2.0W0.9Cs0.6P0.68.8≈71<5≈0>95
B_Cs0.5P0.6Mo8.0V2.5W0.5Cs0.5P0.615.3≈650≈25≈75
C_Cs0.5P0.5Mo8.0V2.4W0.8Cs0.5P0.524.9≈620≈60≈40
The elemental ratios are normalized to Mo8. * numbers refer to the crystalline portion of the catalyst.
Table 2. Chemical composition, estimated crystallinity, estimated phase composition and BET surface area of catalyst A prior to and after adding Cs and P with different (Mo + V + W)/P ratios at a constant Cs/P ratio of 1.
CatalystChemical CompositionCryst.
(wt.%)
h-phase
(wt.%) *
HPA
(wt.%) *
ABET
(m2/g)
AMo8.0V2.0W1.0≈78100011.6
A_Cs0.3P0.3Mo8.0V2.0W0.9Cs0.3P0.2≈7255459.4
A_Cs0.4P0.4Mo8.0V2.0W1.0Cs0.4P0.4≈7540607.4
A_Cs0.5P0.5Mo8.0V2.0W1.0Cs0.5P0.5≈7225759.0
A_Cs0.6P0.6Mo8.0V2.0W0.9Cs0.6P0.6≈715958.8
A_Cs0.7P0.7Mo8.0V2.0W0.9Cs0.7P0.7≈7501009.5
* numbers refer to the crystalline portion of the catalyst.
Table 3. Chemical composition, estimated crystallinity, estimated phase composition, HPA unit cell size and BET-Surface areas of catalyst A with added Cs and P in varied Cs/P and (Mo + V + W)/P ratios.
CatalystChemical CompositionCryst.
(wt.%)
h-Phase
(wt.%) *
HPA
(wt.%) *
dHPA
(nm)
ABET (m2/g)
A_P0.3Mo8.0V2.0W1.0P0.3≈7760401.1686.7
A_Cs0.3P0.3Mo8.0V2.0W0.9Cs0.3P0.2≈7265451.1739.4
A_Cs0.6P0.3Mo8.0V2.0W0.9Cs0.7P0.3≈7340601.17911.4
A_P0.5Mo8.0V2.0W1.0P0.5≈7340601.1705.2
A_Cs0.5P0.5Mo8.0V2.0W1.0Cs0.5P0.5≈7225751.1749.0
A_Cs1.0P0.5Mo8.0V2.0W1.0Cs0.9P0.5≈7920801.17810.8
* numbers refer to the crystalline portion of the catalyst.
Table 4. Unit cell parameters and specific surface area of A_Cs0.5P0.5 for three cumulated amounts of converted MAC at an elevated temperature of 340 °C.
Catalyst Ageing StatedHPA (nm)ABET (m2∙g−1)
A_Cs0.5P0.5Fresh state1.1758.21
A_Cs0.5P0.50.5 molMAC/gKat1.1869.52
A_Cs0.5P0.51.0 molMAC/gKat1.18910.76
Table 5. Experimental conditions in the partial oxidation of methacrolein to methacrylic acid.
ParameterValue
isothermal reactor temperature (°C)300/340 *
methacrolein (MAC) content in the feed (% v/v)3.4
molar feed ratio MAC:O21:2
water vapor content (% v/v)21
total pressure (bar(a))1.5
total volumetric inlet flow (mLN/min)150–1200
modified residence time (kg·s/m3)500–8000
* Long term stability measurements.
Publisher’s Note: MDPI stays neutral with regard to jurisdictional claims in published maps and institutional affiliations.

