Article

Preparation and High-Throughput Testing of TiO2-Supported Co Catalysts for Fischer‒Tropsch Synthesis

1
hte GmbH, the high throughput experimentation company, Kurpfalzring 104, 69123 Heidelberg, Germany
2
Venator Germany GmbH, Dr.-Rudolf-Sachtleben-Straße 4, 47198 Duisburg, Germany
*
Author to whom correspondence should be addressed.
Catalysts 2021, 11(3), 352; https://doi.org/10.3390/catal11030352
Submission received: 29 January 2021 / Revised: 25 February 2021 / Accepted: 2 March 2021 / Published: 9 March 2021
(This article belongs to the Special Issue Recent Development in Fischer-Tropsch Synthesis Catalysts)

Abstract

:
A series of Co/TiO2 catalysts was tested in a parameters field study for Fischer‒Tropsch synthesis (FTS). All catalysts were prepared by the conventional impregnation technique to obtain an industrially relevant Co content of 10 wt % or 20 wt %, respectively. In summary, 10 different TiO2 of pure anatase phase, pure rutile phase, as well as mixed rutile and anatase phase were used as supports. Performance tests were conducted with a 32-fold high-throughput setup for accelerated catalyst benchmarking; thus, 48 experiments were completed within five weeks in a relevant operation parameters field (170 °C to 233.5 °C, H2/CO ratio 1 to 2.5, and 20 bar(g)). The most promising catalyst showed a CH4 selectivity of 5.3% at a relevant CO conversion of 60% and a C5+ productivity of 2.1 gC5+/(gCo h) at 207.5 °C. These TiO2-based materials were clearly differentiated with respect to the application as supports in Co-catalyzed FTS catalysis. The most prospective candidates are available for further FTS optimization at a commercial scale.

1. Introduction

The mitigation of climate change and reduction of CO2 emissions are urgent topics on the political agenda. In 2019, the European Union passed its vision of a sustainable economy by presenting “The European Green Deal” [1]. The main goal is to achieve climate neutrality by 2050. Prior to this, other nations had joined together and signed the Paris Agreement aiming to tackle the threat of climate change by keeping global temperature rise this century below 2 °C above pre-industrial levels [2]. Therefore, significant changes in the chemical industries are ongoing [3,4,5]. Some companies are already expecting the end of oil-driven growth and are changing their strategy [6,7]. The raw material bases of coal, oil, or gas are expected to shift to more sustainable ones such as renewable feedstocks as well as the utilization of CO2.
Melero et al. 2012 described the challenges and early state-of-the-art of the bio-refinery in comparison to the petroleum refinery [8]. Although the topic is intensively studied, process development and catalyst optimization are still at an early stage [9]. In particular, the availability of bio-based feeds and optimized catalysts that are suited for diverse feeds is still not sufficient [10].
Another promising approach might be the conversion of synthesis gas generated via carbon-neutral routes with established processes. Sustainable generation of synthesis gas, i.e., a mixture of CO, CO2, H2, and steam, may be possible via various routes, e.g., gasification of biomass or municipal waste [11,12], or the conversion of CO2 via reverse water–gas shift reaction with renewable H2 [13].
Fischer–Tropsch synthesis (FTS) is an established process [14,15]. Typically, synthesis gas is generated from natural gas, and the subsequent FTS can be carried out in a low or high temperature range [16]. Brief information about both processes is summarized in Table 1.
FTS is strongly exothermic [15]. The reaction can be described via the simplified reaction equation Equation (1).
n   CO + 2 n   H 2   CH 2 n + n   H 2 O         R H 0 250   ° C = 158.5   kJ / mol
Nevertheless, the product spectrum is more complex and the main products are straight-chain paraffins, olefins, and alcohols. Branched hydrocarbons and other oxygenates can also be formed, but in lower amounts. The oxygen is rejected as water or, for shift-active catalysts, also as CO2.
Catalysts for FTS typically comprise Ni, Fe, Co, and Ru as the active component [16,17,18,19,20]. It is known that Ni generally leads to a very high CH4 formation, which is undesirable, and that Ru shows good activity and selectivity but is expensive, which prohibits commercial use. Instead, Fe and Co are typically used for large-scale application. Carrier materials should be porous materials with a large specific surface area, enabling high dispersion of the active components. The interaction between active component and carrier should minimize sintering, which would lead to a loss in activity. Typical carrier materials are SiO2, Al2O3, and TiO2 [21,22,23,24].
However, to mitigate CO2 emissions, it may be necessary to develop new processes and catalysts that are able to operate under conditions different from established processes. Furthermore, new processes may be tailored for a certain product spectrum. Due to the timeframe set by politics, a fast and cost-efficient way to perform catalyst research is necessary. High-throughput experimentation is one way to facilitate this task. This work demonstrates the application of high-throughput testing in the FTS of a supported Co catalyst on different TiO2 supports.

2. Results and Discussion

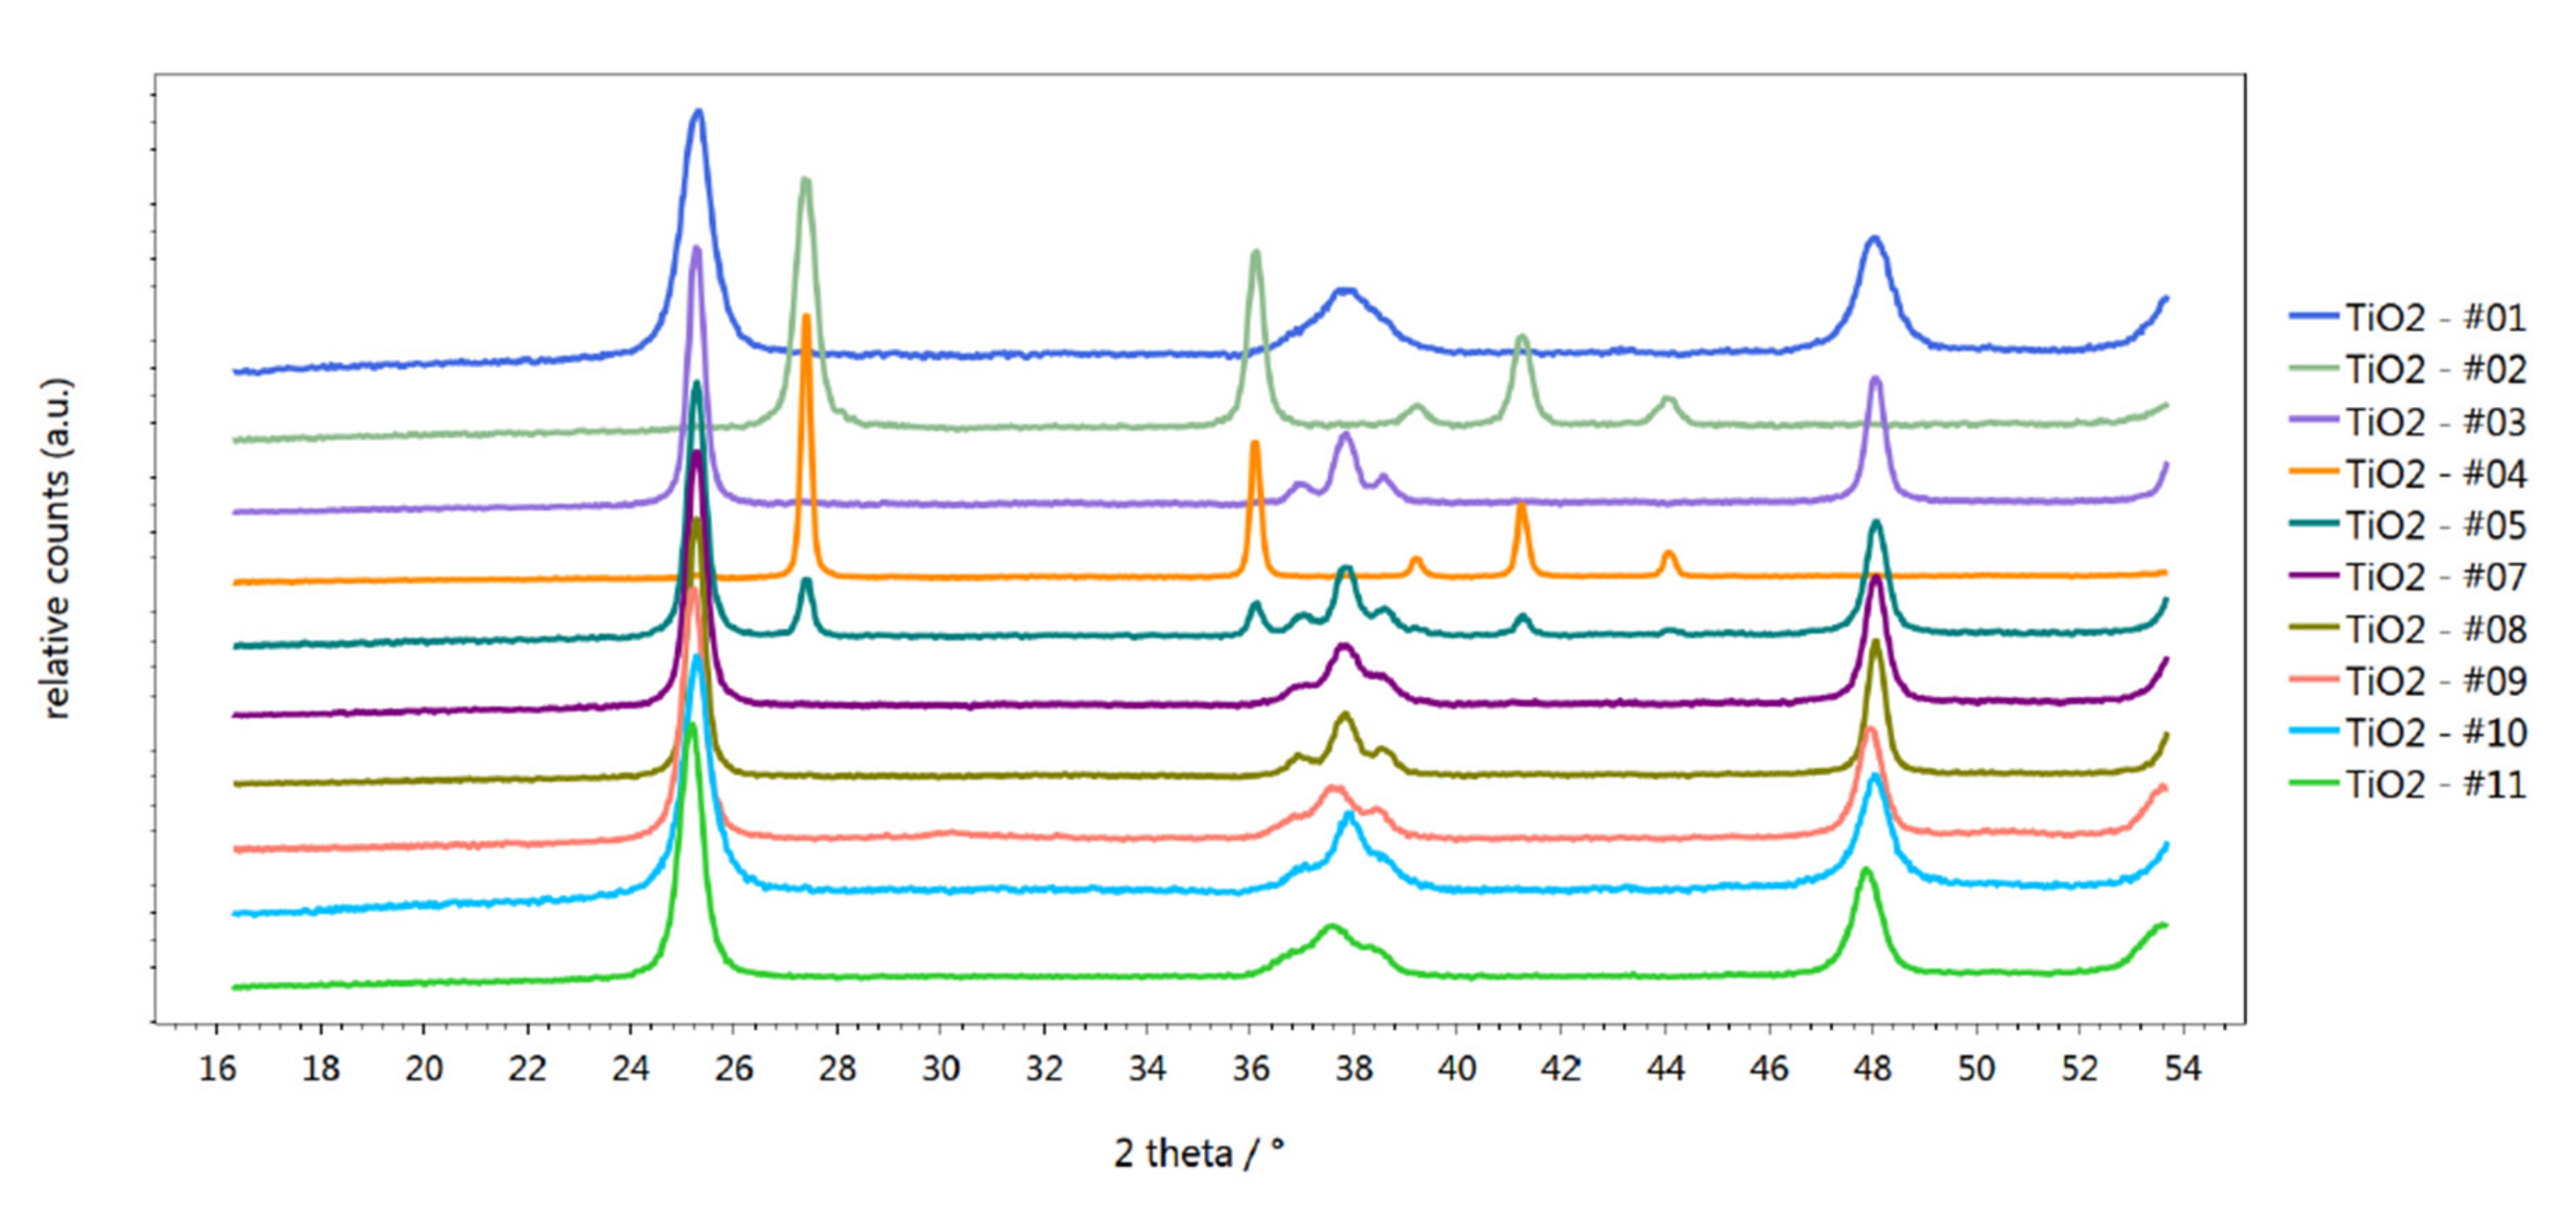
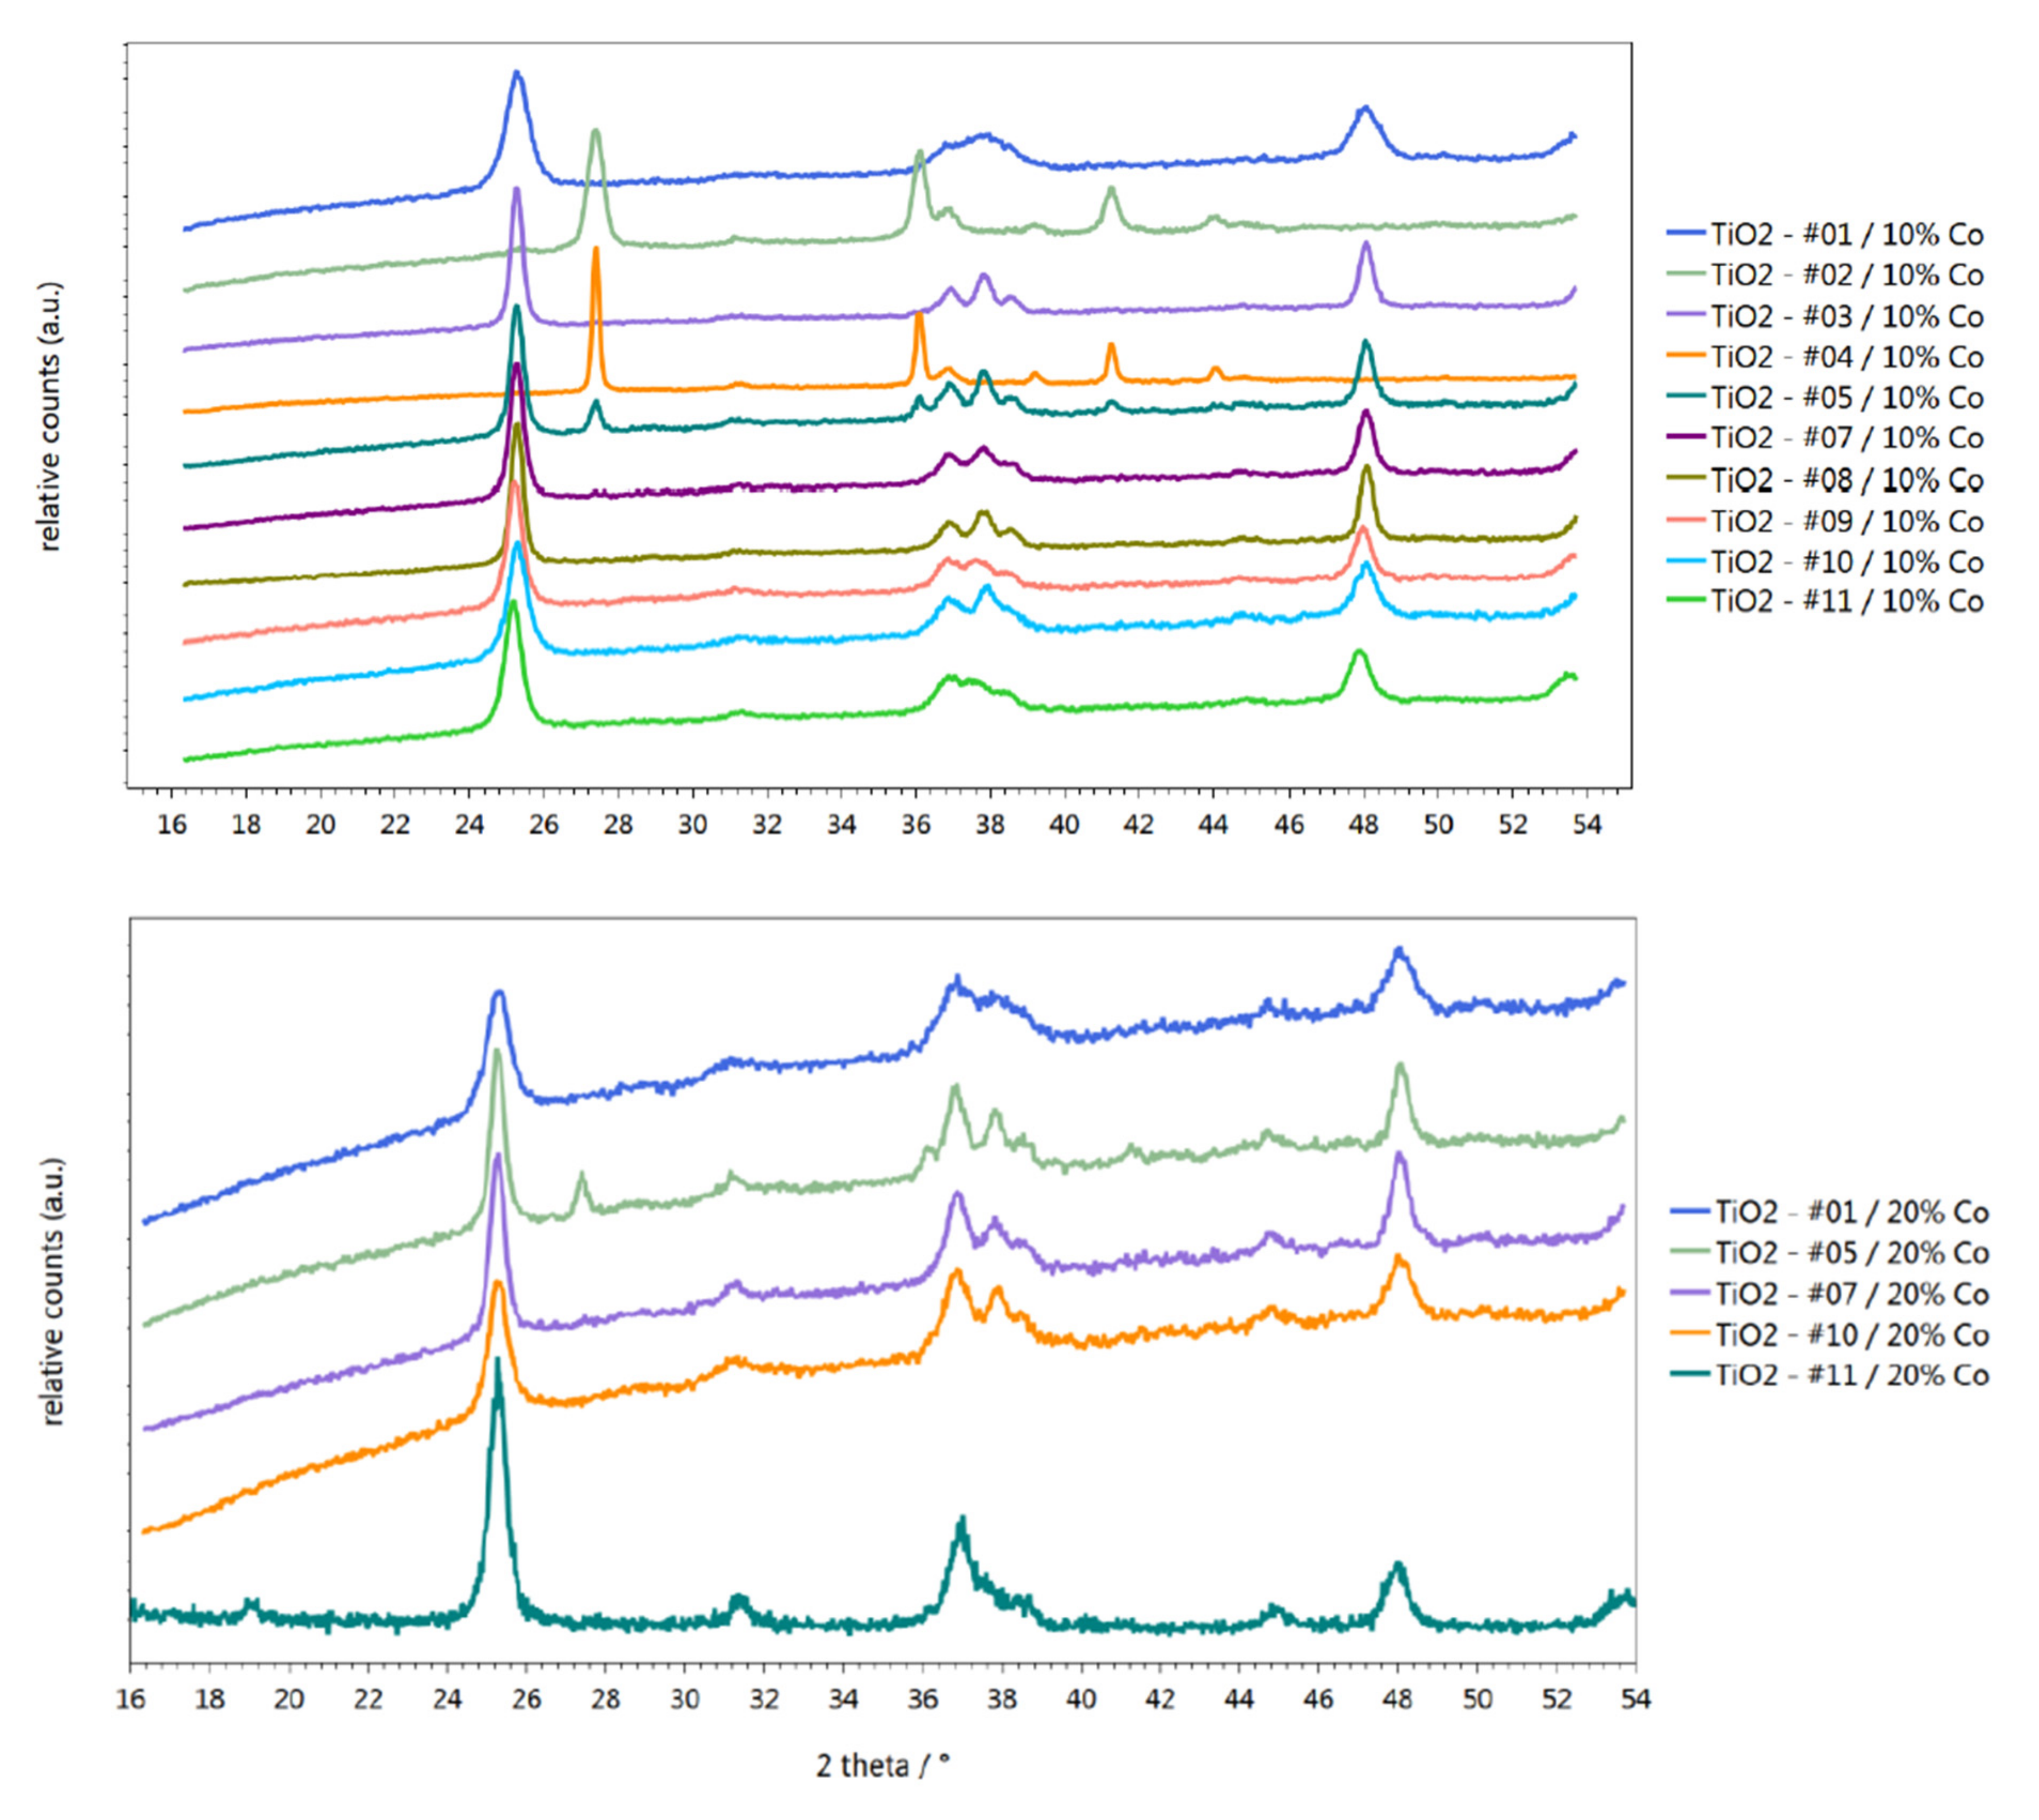
2.1. Characterization of Materials

The support materials were prepared by a commercial process. They were first calcined at 350 °C prior to analysis by X-ray diffraction. Analysis of the phase composition via XRD shows that most materials exclusively consist of anatase phase TiO2 with slightly varying crystallite sizes and typical reflections at 2θ = 25°, 38°, 48°, 55°, and 62.5°, corresponding to 101, 004, 200, 211, and 204 planes, respectively (Figure 1) [25,26,27]. TiO2 #2 and #4 consist of pure rutile phase with typical reflections at 2θ = 27°, 36°, and 55°, corresponding to 110, 101, and 211 planes [25,26,27]. In contrast, TiO2 #5 shows reflexes of both anatase and rutile phases. None of the powder XRD patterns indicate the presence of crystalline impurities.
For all 11 carriers, the specific surface areas were measured, both before and after impregnation with Co. The pure rutile carrier is essentially non-porous (<10 m2/g). The mixed rutile/anatase phase had a much larger surface area of nearly 50 m2/g, but all pure anatase-based materials had even larger surface areas of up to 158 m2/g.
After impregnation, the surface areas of the materials were generally found to be lower than those of the pure carriers, which can be explained by the blocking of micropores. This effect is especially pronounced for the materials with higher Co loading. Moreover, the surface area loss is greater for high surface areas. An exception is the essentially non-porous carrier #4. For this material, an increase in surface area was observed after impregnation and calcination. This is most likely the result of changes in the textural properties, e.g., surface enhancement induced by nanoparticles. XRD and N2 physisorption results are summarized in Table 2.
All of the 10 wt % samples and some of the anatase-based materials covering the range of surface areas were analyzed by XRD (Figure 2). The main reflex for Co3O4 can be found at approximately 2θ = 37°; however, the reflex is relatively broad, as the absence of sharp Co3O4 reflexes for all samples indicates that Co3O4 is finely dispersed within the sample.
Reduction studies with temperature programmed reduction (TPR) showed the typical reduction profile for cobalt oxide clusters. The transformation of Co3O4 to CoO typically starts around 250 °C and is followed by the reduction of CoO to Co. The required temperature for the second reduction step depends on the support. The onset temperature can be found at approximately 350 °C. The final temperature for full conversion to metallic Co exceeds 600 °C for some materials (Figure 3). The results are in good agreement with the literature [21]. The reduction profiles of the carriers #1 and #10 are notably shifted to higher temperatures compared to the material #5 (Figure 3). This can be explained with higher dispersions of the Co in the high surface area supports TiO2—#01 and TiO2—#10 compared to the lower surface area TiO2—#05 and resulting stronger metal support interaction. It is well known that the type of support has a pronounced influence on the reduction temperature and percentage reduction of cobalt clusters [28]. For the activation of the prepared catalysts, a maximum temperature of 350 °C was applied. Since all carriers had already been calcined at this temperature, phase transformation or changes in the material during catalyst activation are unlikely.

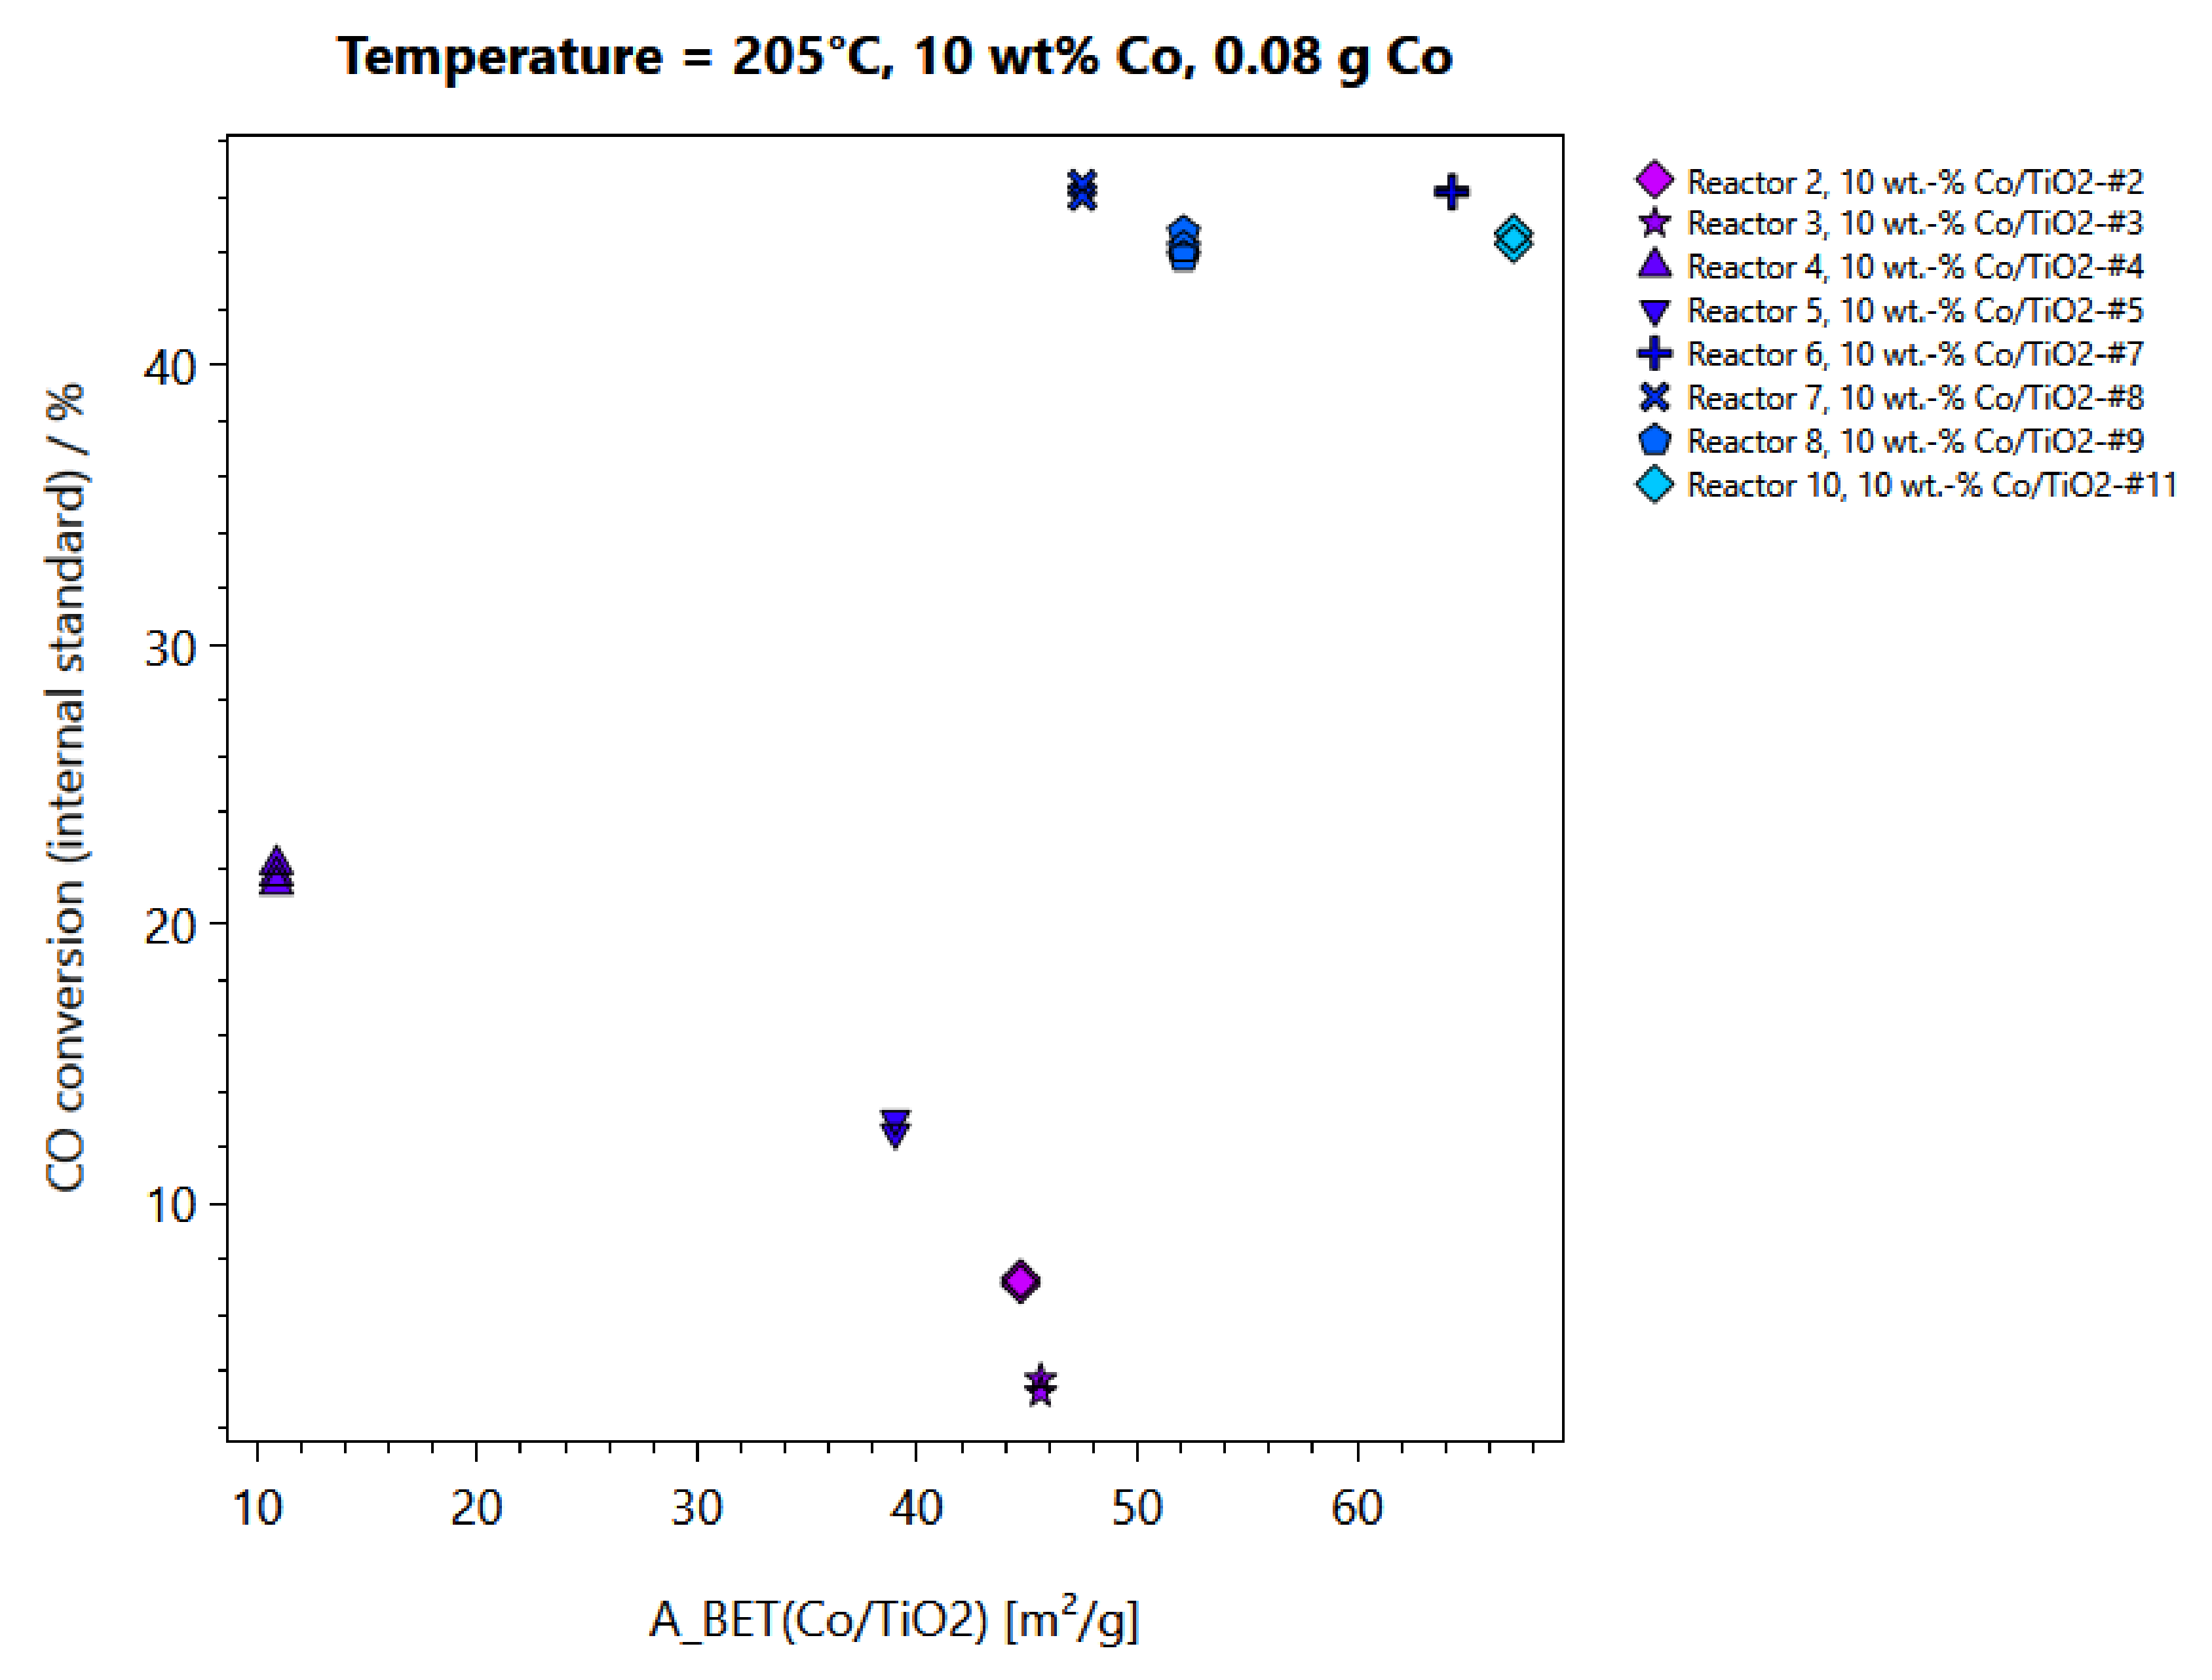
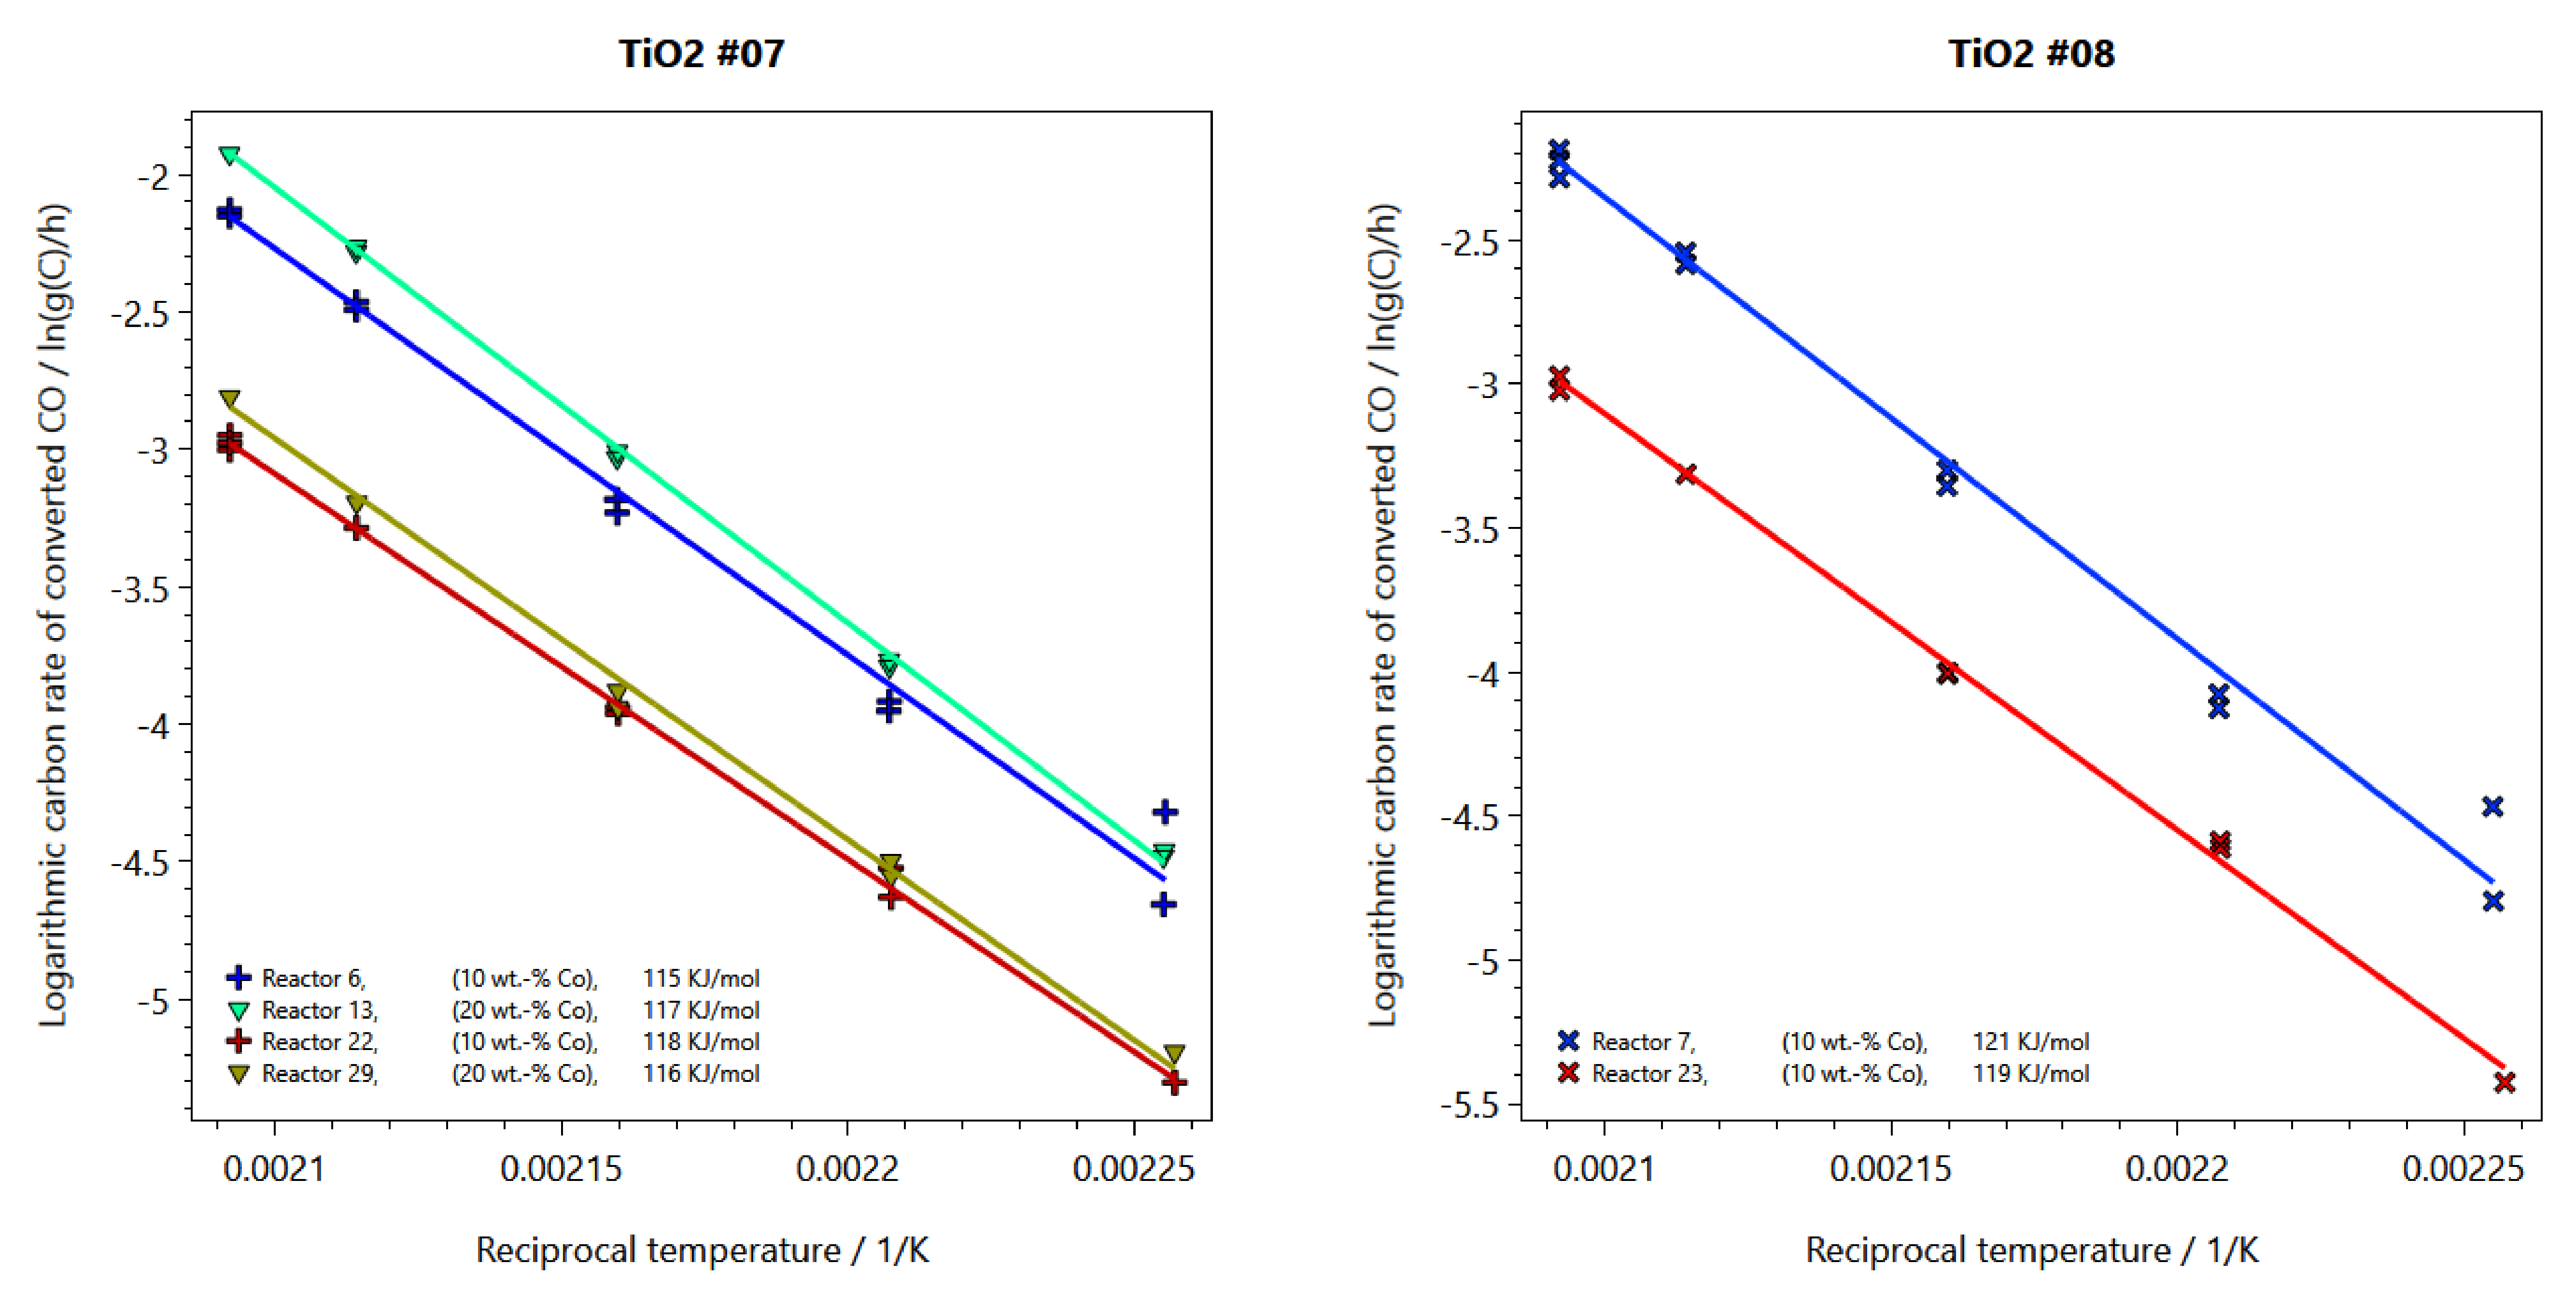
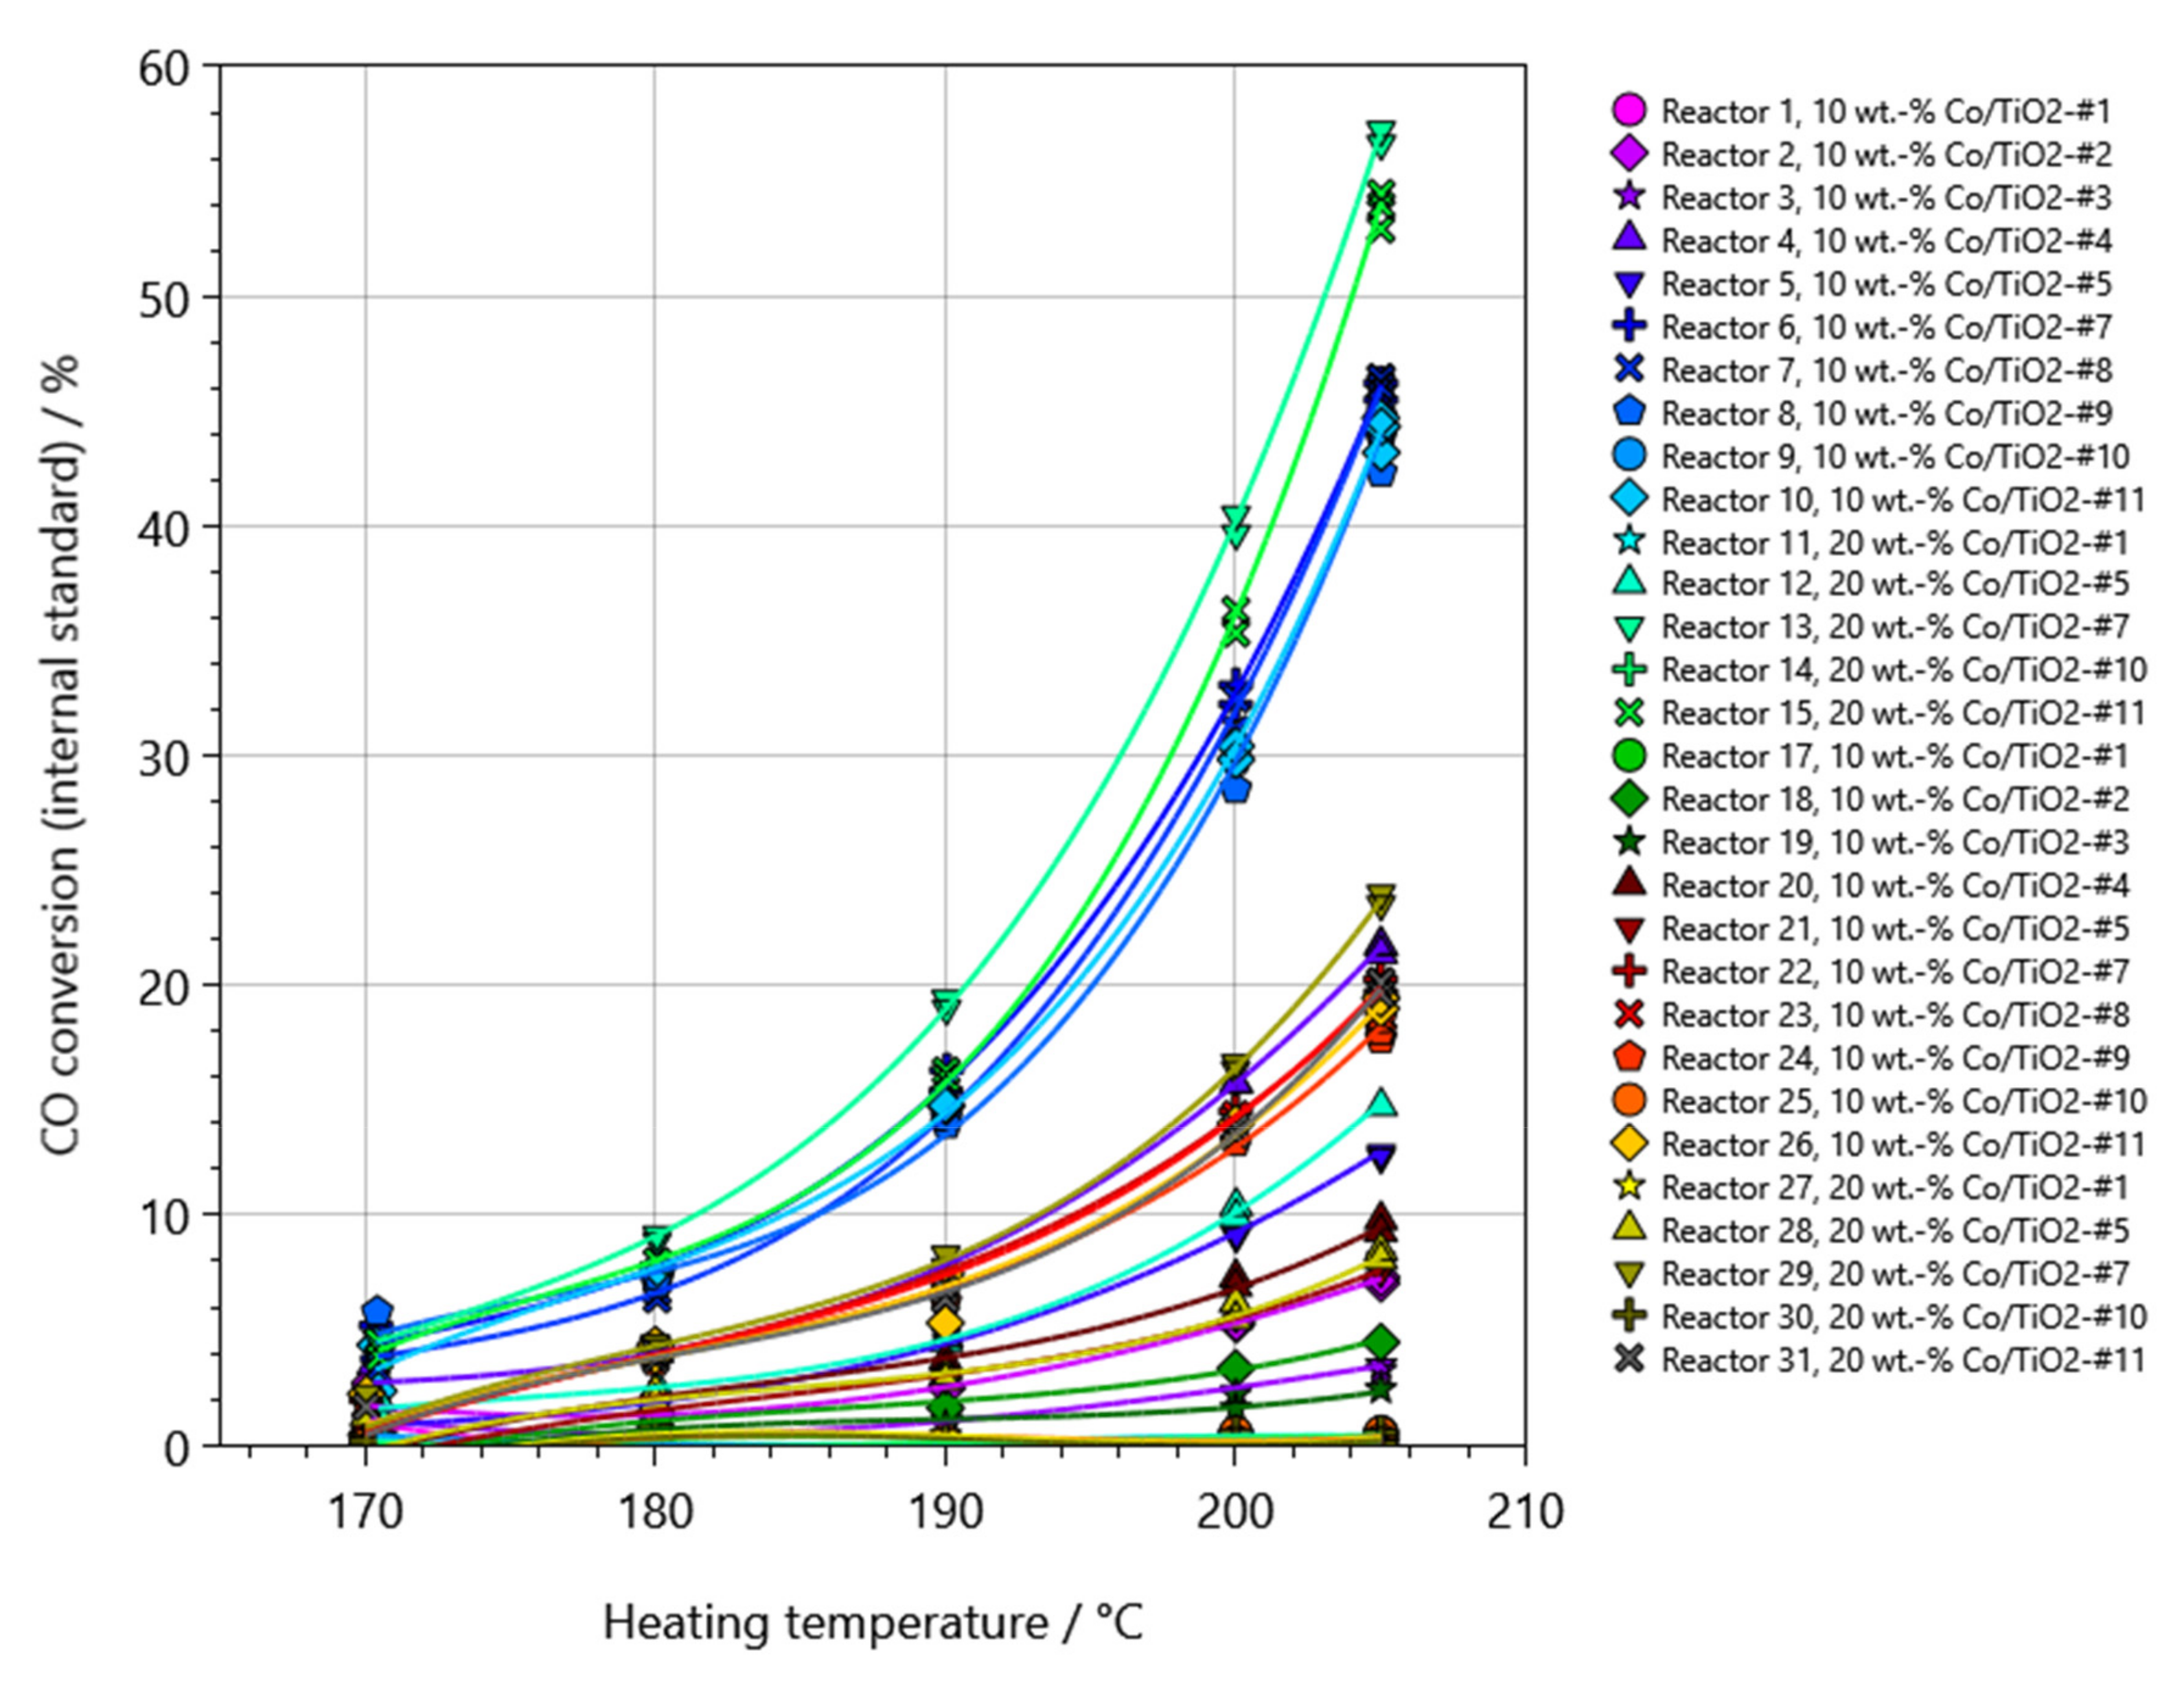
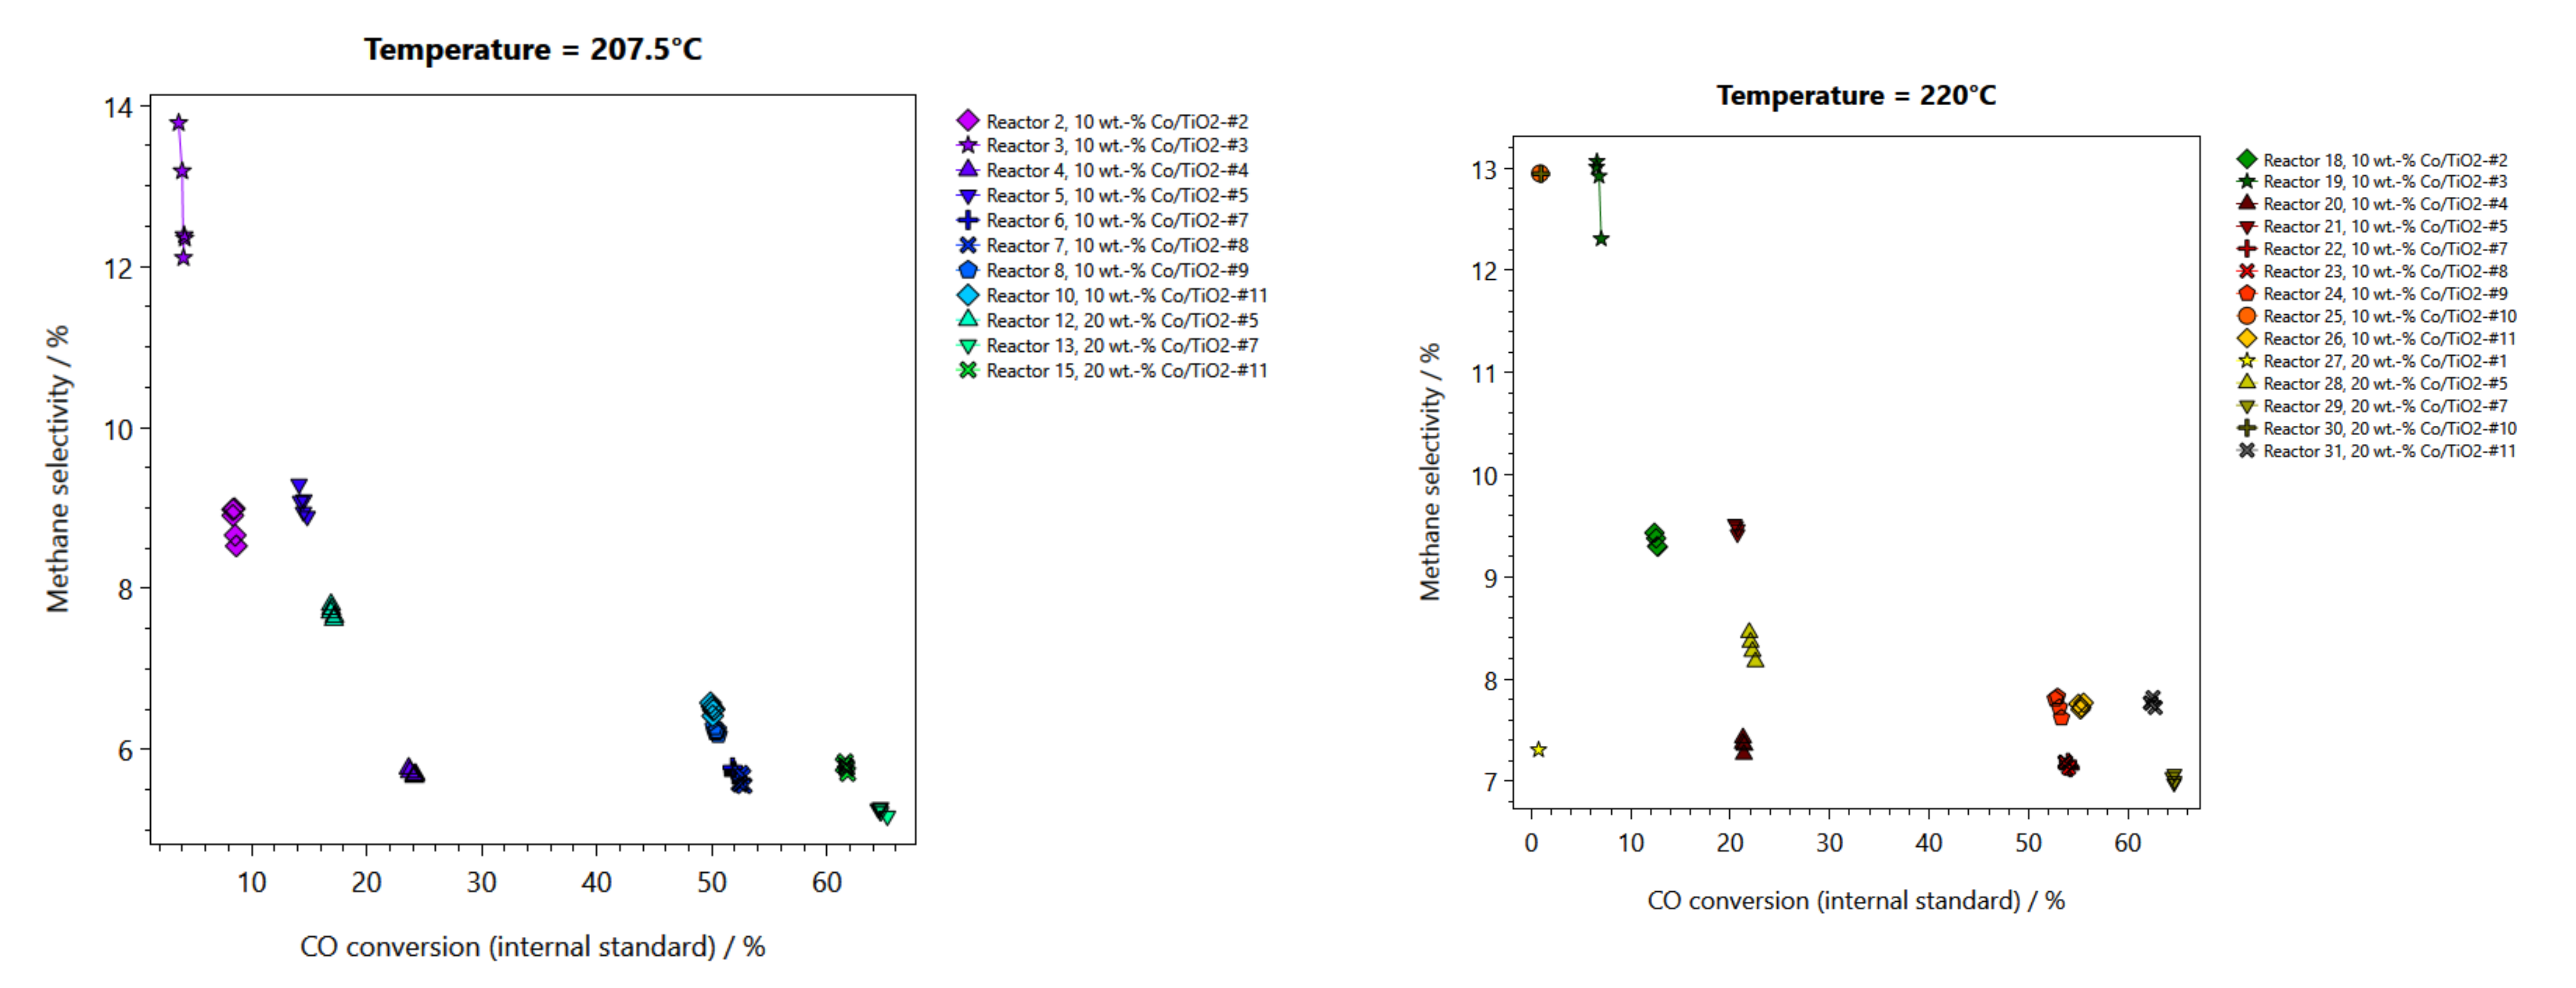
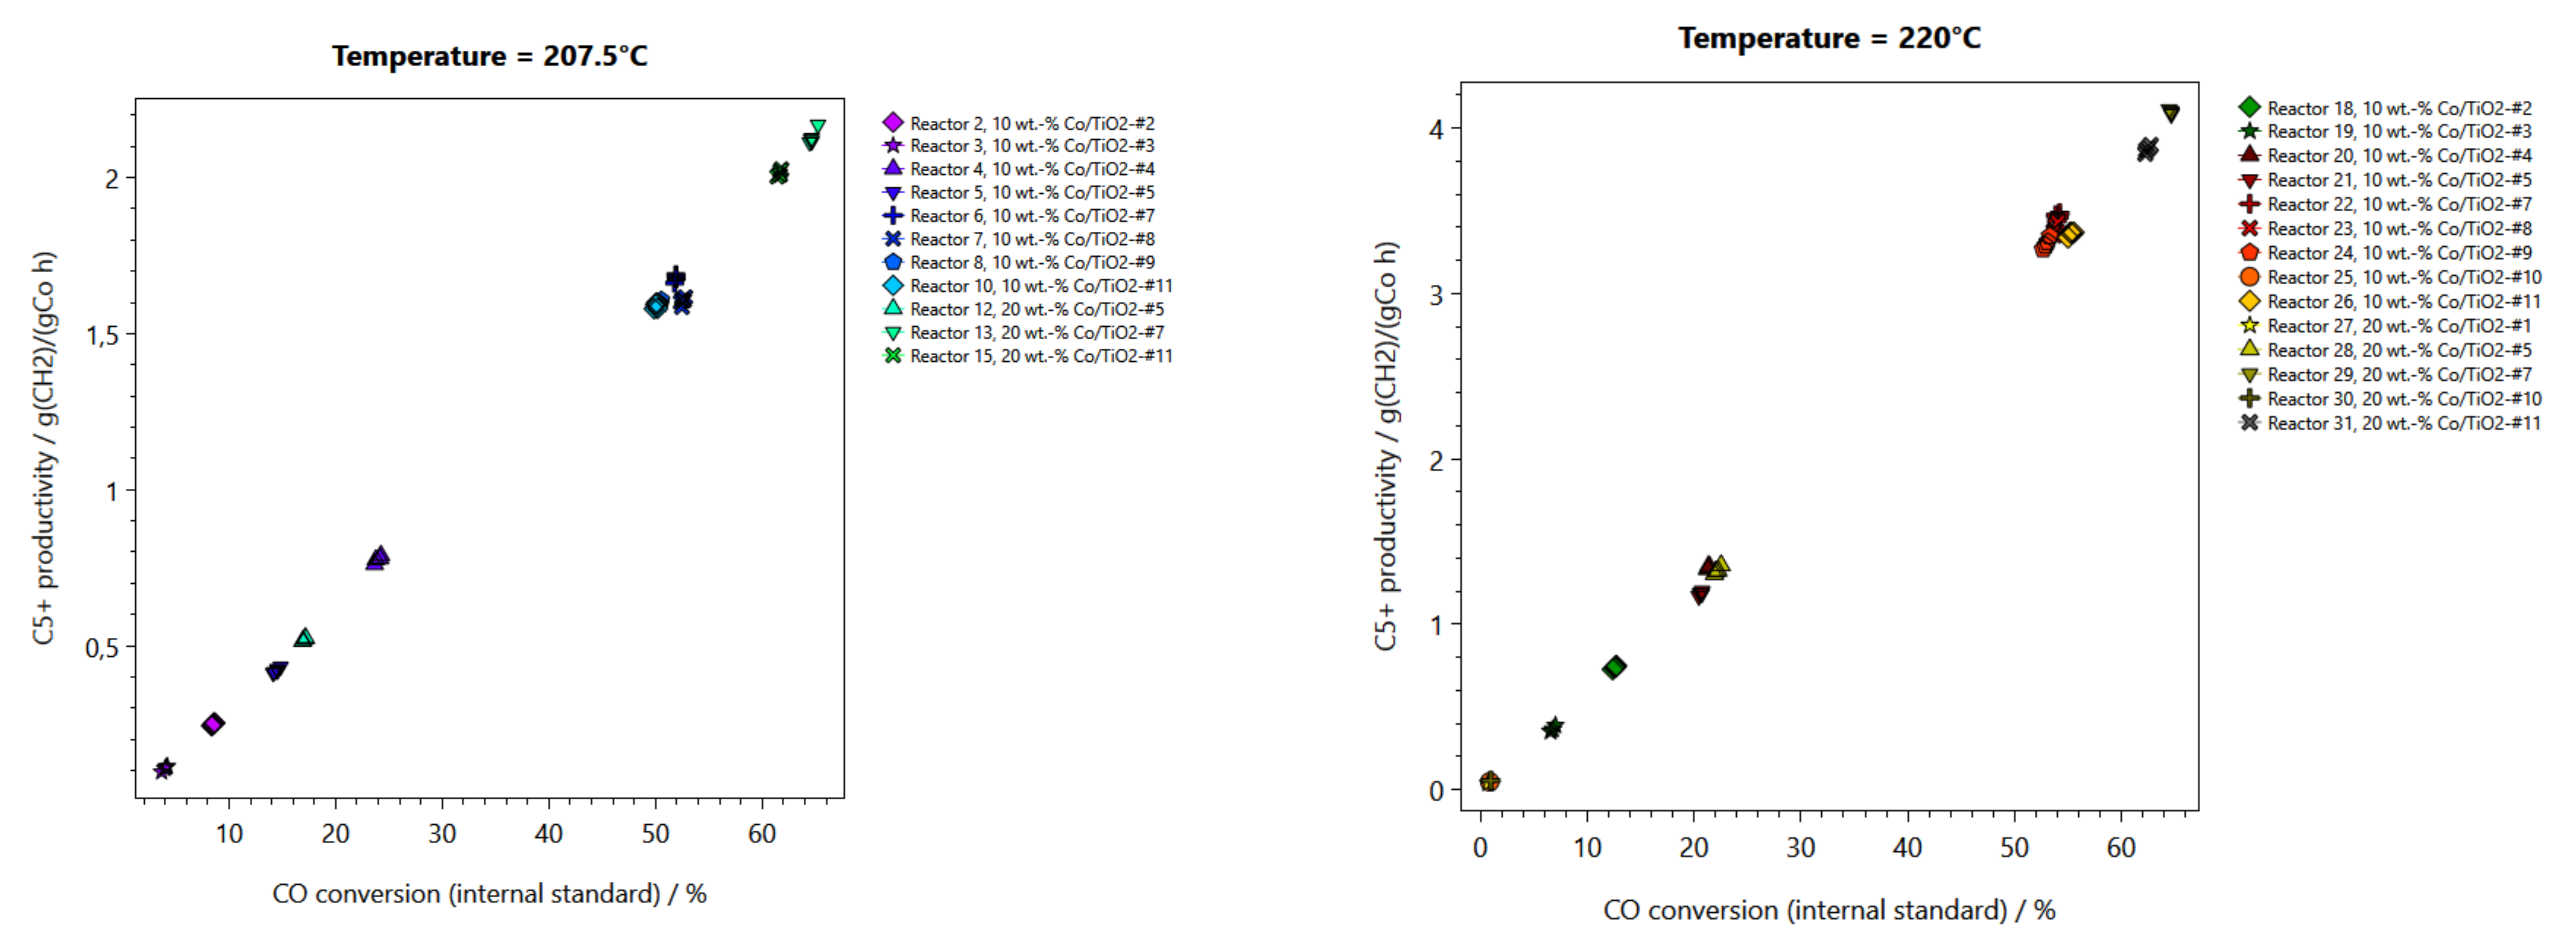
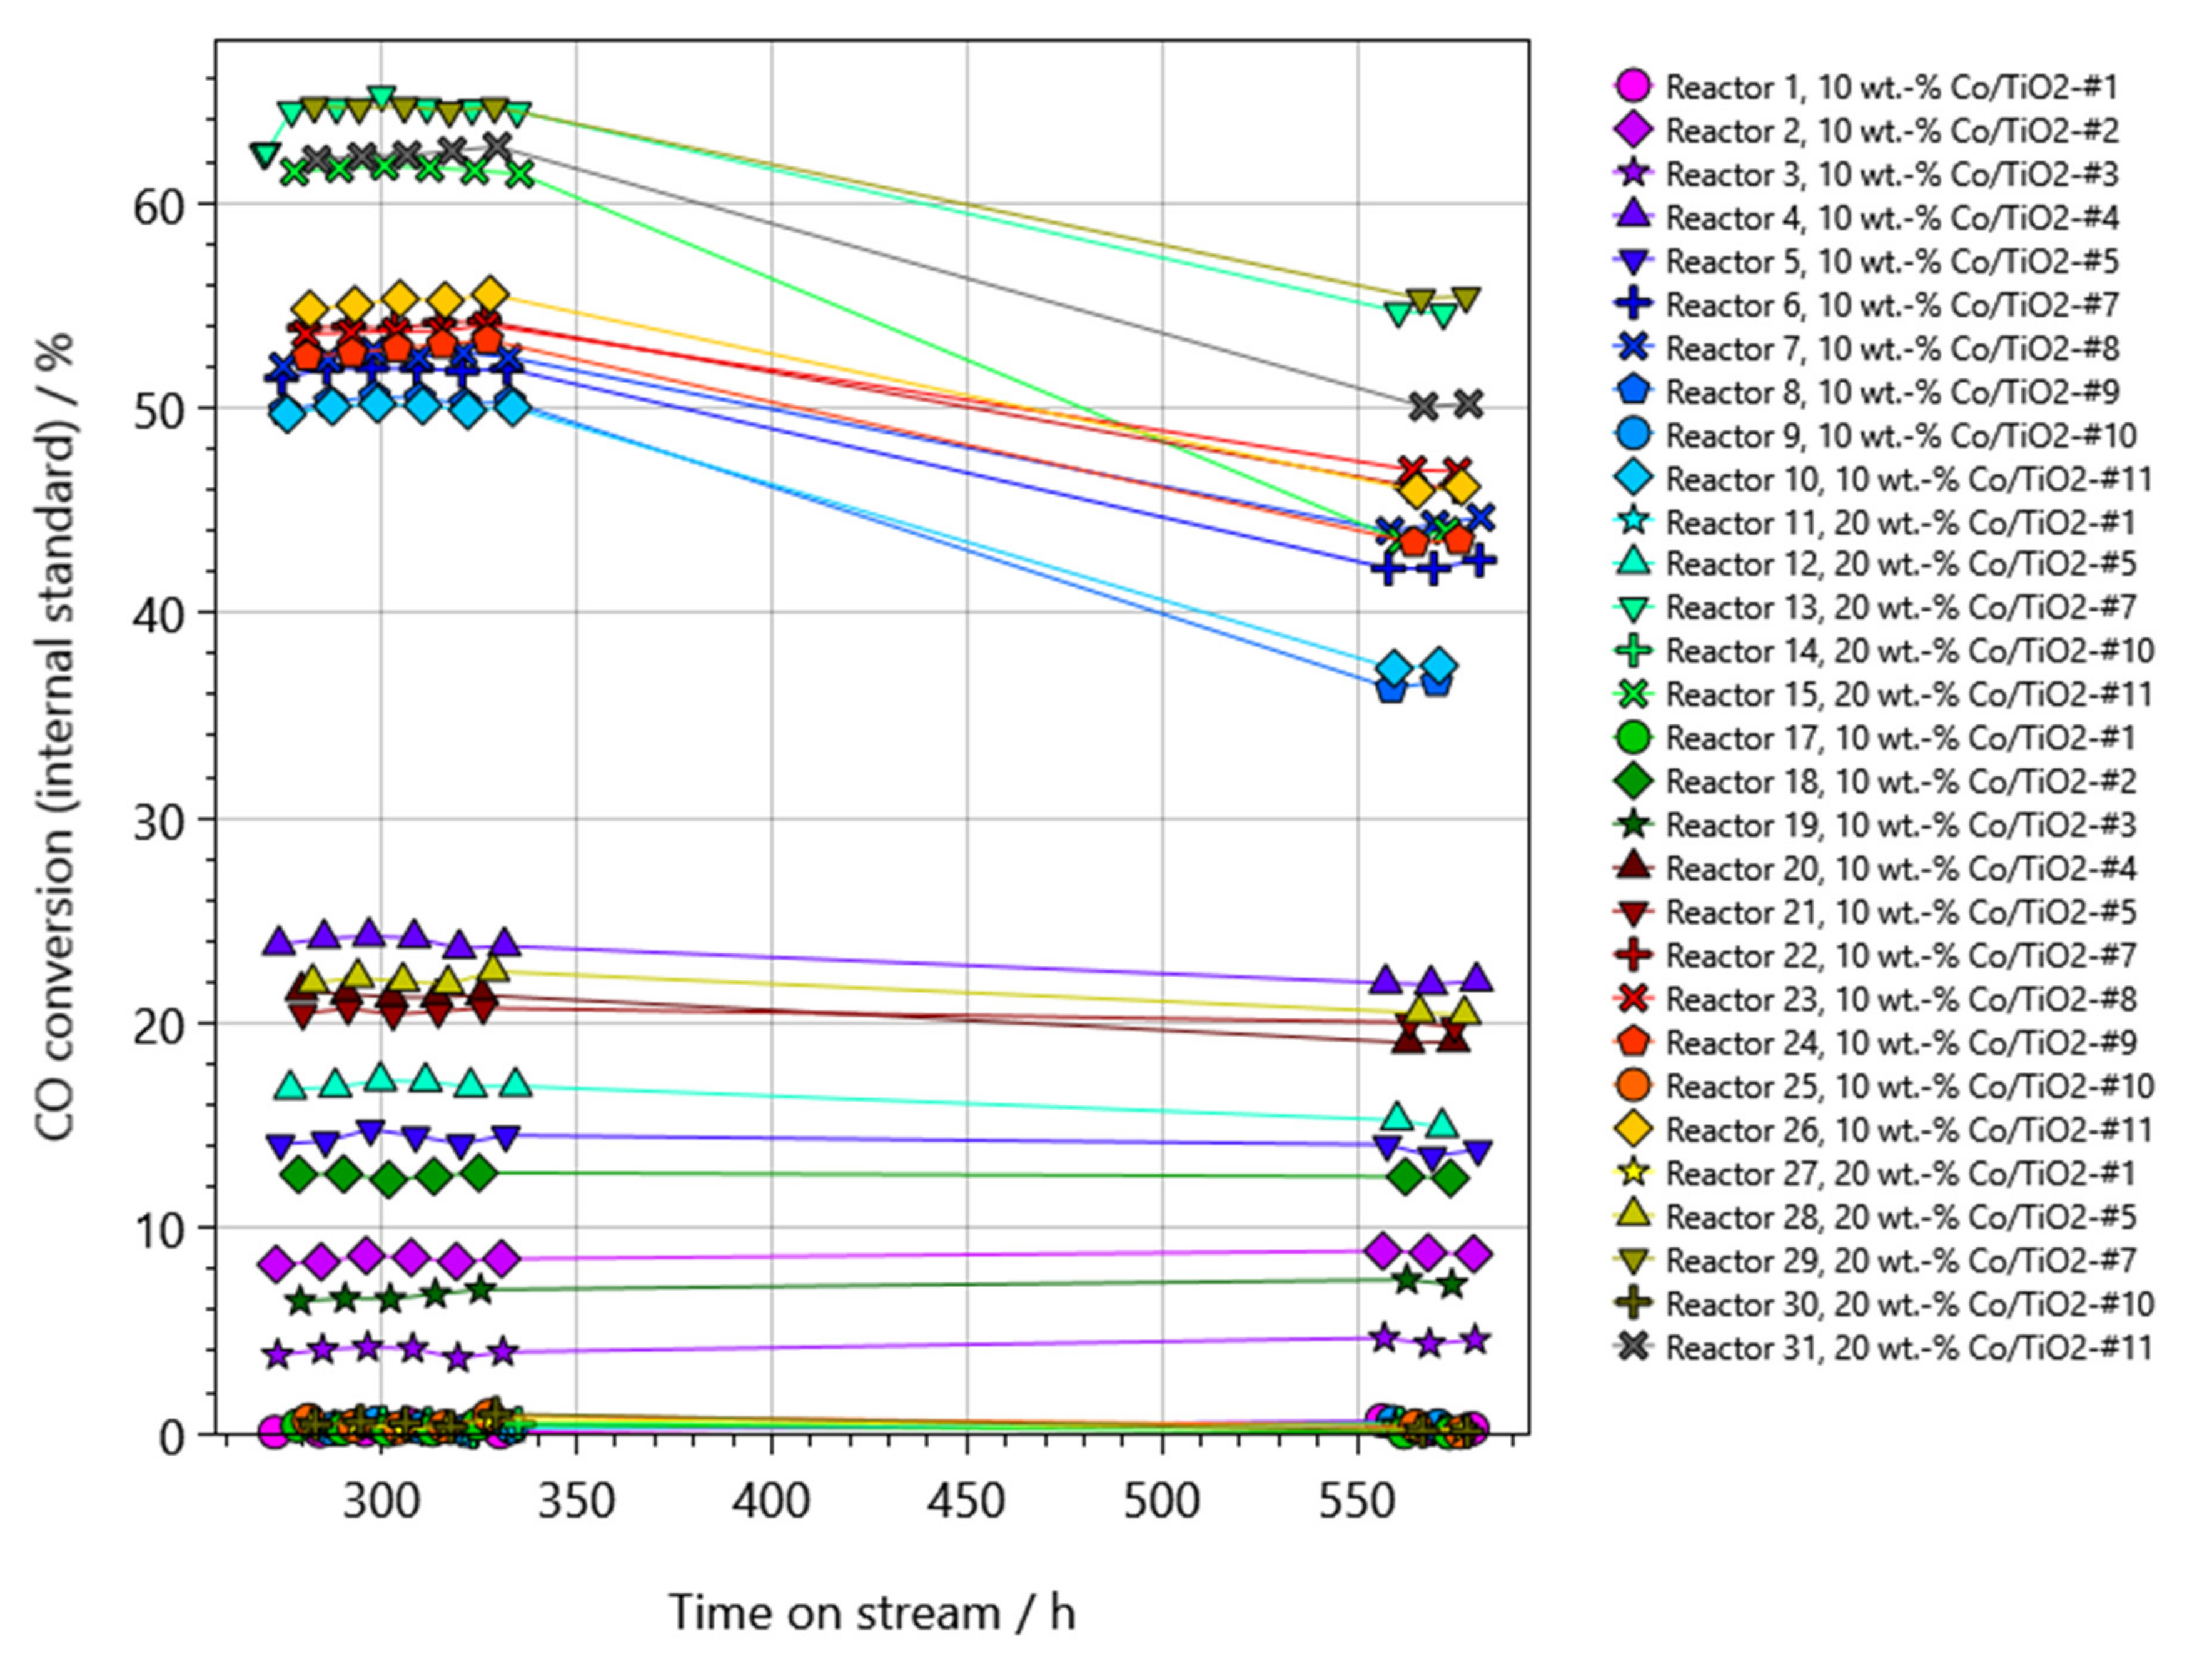
2.2. Performance Testing in FTS

After calcination of the materials, a defined fraction was loaded into the tubular reactors. Materials were reduced in situ by a mixture of 5 vol % H2 in Ar. Synthesis gas was added at low temperature (150 °C) to avoid strong initial exothermal reactions, which would lead to sintering of the reduced Co particles. After a short stabilization time, the temperature was gradually increased, and reaction parameters were varied. An overview of all conditions is shown in Figure 4.
At a temperature of 170 °C, the catalysts started to show a noticeable CO conversion. Catalysts based on support #01 and #10 showed negligible conversion. Based on the TPR result, this is attributed to incomplete reduction to elemental Co at 350 °C. Virtually no run-in behavior could be observed after a condition change, and the catalysts quickly reached a steady activity level.
Figure 5 shows the CO conversion data measured during experiment 5, i.e., at 200 °C and a space velocity (SV) of 20,000 as a function of the specific surface area of the impregnated catalysts. Only materials with 10 wt % Co loading and a total amount of Co of 80 mg are considered. It can be seen that the most active materials with a CO conversion of >40% all have a surface area of >45 m2/g. However, the material based on carrier #3 with a similar surface area is much less active (<5% CO conversion), and the material with the lowest surface area based on carrier #4 shows a moderate activity level. Shimura at al. have prepared a series of Co-based FT catalysts on TiO2 supports that are modified with various metal ions [29]. Among the five unmodified materials, they found a maximum activity for a rutile-based carrier with a surface area of 33 m2/g. However, the material had the highest surface area of Co. The surface area is clearly only one of several parameters that define the catalytic activity. A further analysis of the materials prepared in this study could help to better understand the property–activity relationships.
Figure 6 shows the Arrhenius plots of the catalysts with support #07, #08, #09, and #11. An activation energy of approximately 120 kJ/mol can be derived. Similar values have been obtained for other catalysts [30,31].
The conversion of CO correlates with catalyst mass, space time velocity (GHSV), and temperature. For a better performance comparison, a modification of the gas hourly space-time velocity is defined per gram of metallic Co (GHSV=mL/(gCo h)). Dependence on temperature is shown in Figure 7. Correlation of active mass with conversion is non-linear, and higher weights of the catalysts lead to higher conversion per weight unit, which can be explained by heat transport limitations of higher catalyst mass, i.e., local hot spots.
In terms of commercial relevance, CH4 selectivity and C5+ productivity are performance descriptors of interest. For a fair comparison between individual catalysts, they should be operated in a similar CO conversion range. This could be achieved by operating the catalyst with a Co loading of 80 mg at 207.5 °C, and those catalysts with a lower Co loading of 40 mg and thus a two times higher space velocity at a higher temperature of 220 °C. The conditions were chosen to achieve an industrially relevant CO conversion of approximately 60%. An overview of CH4 selectivity and C5+ productivity as a function of CO conversion is given in Figure 8.
Among the products in FTS, CH4 is the least useful due to the high H2 consumption in its production and the fact that it is the common starting material for the production of the synthesis gas. Thus, a low selectivity to CH4 is a very desirable property of an FTS catalyst. In general, CH4 selectivities up to 5% are regarded as “low”. In the benchmarking tests, the lowest selectivity for CH4 was 5.3% (20 wt % Co/TiO2 support #7) and went up to only 6.6% for catalysts with support #04, #07, #08, #09, and #11 at 207.5 °C and 20 wt % Co. The other materials at identical temperature showed a significantly higher selectivity for CH4 of up to 13.8%. At a higher temperature, the selectivity of CH4 increased in most cases, and the lowest CH4 selectivity observed was 7.1%. In general, the lowest CH4 selectivities can be found at high conversion, indicating that the differences in the properties of the carrier and the preparation variables influence the chain growth and the CH4 formation in different ways. High C5+ productivities were found. The best performance was reached with high Co loading of 20 wt % on support #7. At 207.5 °C, liquid productivities of 2.1 gC5+/(gCo h) were found. By increasing the temperature to 220 °C and doubling the GHSV, the productivities increased to 4.1 gC5+/(gCo h). Based on the catalyst volume, productivity of approximately 1,2 gC5+/(mLCat h) can be calculated. These values are in quite good accordance with literature values, e.g., Tonkovich et al. 2011 [32]. They performed a long-term stability test in a microchannel reactor with highly active Co-based catalysts. By varying GHSV to 80,000 mL/(gCo h) at 233.5 °C, the C5+ productivities can be maximized to 8.3 gC5+/(gCo h). However, the selectivity for CH4 is also increased to 9.5%.
Chain growth probability was determined by offline analysis of equilibrated wax samples for the described benchmarking conditions and selected positions. The fit was done between C30 and C40 hydrocarbons and yielded 0.86 < α < 0.91, which is expected for a Co-based catalyst.
In heterogeneously catalyzed reactions, the lifetime of the catalyst is a very important factor. Long lifetimes reduce the number of catalyst exchanges, which in turn leads to lower cost for a given catalyst and also reduces unproductive idle time during catalyst exchange. For FTS catalysts, lifetimes of years are desirable, which is partly due to the fact that Co is a relatively expensive metal. Tests to establish the long-term stability of FTS catalysts are normally performed by experiments under constant conditions lasting weeks and months. Due to the very limited testing time, the stability was probed by repeating a start-of-run condition at medium severity at the end of the run (CO conversion of best catalyst between 50% and 60%, 205 °C, 20 bar(g), H2/CO ratio 2, 20,000 mL/(gCo h), 10 vol % Ar in feed). Within the initial experiments, no deactivation could be observed. Accelerated deactivation can be simulated at higher severity, i.e., higher conversion of CO and greater productivity. Therefore, higher reaction temperatures (221 °C and 233.5 °C, 20 bar(g), H2/CO ratio 2, 40,000 mL/(gCo h)) leading to CO conversion of up to 80% were tested. Under this chosen condition, significant deactivation was observed with a relative decrease of up to 25%, as shown in Figure 9.
The high CO conversion leads to a high partial pressure of water, which, in combination with the high temperatures, leads to several deactivation processes such as hydrothermal sintering of Co particles, oxidation of active Co0 to CoO, as well as the formation of Co-support compounds, which were recently found via in situ characterization published by Wolf et al. [33].
It is known in the literature that H2-lean conditions can be correlated with catalyst deactivation by carbon formation on the catalyst [34]. Different carbon species are coke, Boudouard carbon, FTS intermediates or products, bulk carbide formation, polymeric carbon, and graphite [35,36]. It was speculated that the observed loss in activity might have been caused by an accumulation of long-chain hydrocarbons inside the pores or by coke deposition. In this case, treatment of the catalysts with pure H2 can remove the deposits and restore the catalyst activity. Thus, the catalysts were treated with 90 vol % H2 and 10 vol % Ar at a space velocity of 20,000 mL/(gCo h) and a pressure of 20 bar(g). The temperature was 250 °C for reactor positions 1 to 16 and 350 °C for reactor positions 17 to 32 with a heating ramp of 1 K/min. Activity increased after H2 treatment and was higher than expected. Indeed, after regeneration, most catalysts showed greater activity than observed at the start-of-run. Apparently, catalyst activation at the beginning did not fully reduce the cobalt oxides and the additional H2 treatment has most likely generated additional Co0 particles from previously unreduced Co oxide precursors.
In summary, this study demonstrates how high-throughput experimentation can be utilized to screen material libraries and identify promising catalytic lead materials. Activity, selectivity, and stability are investigated under industrially relevant conditions on a short time scale. Catalyst synthesis of 15 materials and 10 different TiO2 supports was carried out for four weeks, and benchmarking, regeneration tests, and stability tests were finished and evaluated within five weeks. Based on commercially available supports, catalyst libraries can be synthesized and tested for various applications in a short time frame.
However, this study shows only the first cycle in the development of new catalytic materials and the power of high-throughput testing can be unlocked through successive development cycles. An acceleration of catalyst and process development will be one key to overcoming the challenge of decarbonizing our society.

3. Experimental Section

3.1. Catalyst Preparation

All TiO2 materials were received from Venator Germany GmbH. The materials were selected due to their different phase composition as well as specific surface area. All materials were calcined at 350 °C for six hours (heating ramp 1 K/min) in a constant flow of dried air using a conventional muffle oven. Each oxide support was compacted to tablets (13 mm diameter) using a hydraulic press and subsequently crushed and sieved in order to obtain a sufficient amount of particle size fraction in the range 125 to 160 µm.
For the modification of TiO2 with Co (10 wt % Co), 5 g of TiO2 was placed in a 50 mL flask to which was added a solution of Co(NO3)2 (Cobalt(II) nitrate hexahydrate; Acros Organics) in 30 mL of acetone. The mixture was vigorously shaken for one hour at high frequency using a lab shaker (CAT S20; 500 rpm; room temperature) in order to achieve complete wetting of the TiO2 support and homogeneous distribution of the Co precursor. Subsequently, the sample was placed in a rotary evaporator and slowly heated up to a temperature of 55 °C. After approximately 30 minutes, the pressure was lowered to 550 mbar via a membrane pump. The sample was kept rotating for at least two hours until a dry, pinkish powder was obtained. Then, the dried and impregnated samples were placed in a muffle oven with a constant flow of air, heated up with 1 K/min to 350 °C, and kept at this temperature for six hours before the sample was allowed to cool down to room temperature.
Based on the highest specific surface area after impregnation, supports were chosen for a higher cobalt loading. For the modification of TiO2 with Co (20 wt % Co), the same experimental procedure was used as for preparation of TiO2 with Co (10 wt % Co). However, the procedure was optimized to avoid the decomposition of high amounts of nitrate precursors (e.g., in case of one-step impregnation of 20 wt % Co), which is generally considered to lead to larger agglomerates of metals or metal oxides. Thus, a significantly milder procedure was chosen for modification with Co. In particular, TiO2 with Co (20 wt % Co) samples were prepared according to the following sequence:
  • Impregnation of TiO2 with Co(NO3)2 (targeting 10 wt % Co)
  • Drying and calcination as described above
  • Impregnation of TiO2 with Co(NO3)2 (targeting 15 wt % Co including the previous impregnation step)
  • Drying and calcination as described above
  • Impregnation of TiO2 with Co(NO3)2 (targeting 20 wt % Co including the previous two impregnation steps)
  • Drying and calcination as described above
Finally, calcined samples were sieved to remove all potential fines from the particle size fraction 125 to 160 µm.

3.2. Catalyst Characterization

BET measurements were carried out in a volumetric N2 physisorption setup (Autosorb-6-B, Quantachrome) at the temperature of liquid N2. The sample was degassed in a dynamic vacuum at 150 °C for two hours prior to physisorption. Full adsorption–desorption isotherms were recorded. The specific surface area according to the BET method was calculated from the linear range of the adsorption isotherm (p/p0 = 0.05 to 0.28). The catalyst was characterized before and after catalytic testing.
XRD measurements were performed in Bragg–Brentano reflection geometry on a theta/theta diffractometer (D8 Advance, Bruker AXS) equipped with a secondary graphite monochromator (Cu Kα1+2 radiation) and scintillation detector. Sample powder was filled into the recess of a cup-shaped sample holder, the surface of the powder bed being flush with the edge of the sample holder. Data analysis was performed using the software package Topas (v 2.1, Bruker AXS) [37].
Temperature-programmed reduction experiments were conducted inside a commercial device from Micromeritics. An oxidic form of selected catalytic material was loaded into the TPR setup. A flow of 5 vol % H2 in Ar was passed over the sample with a heating ramp rate of 5 K/min.

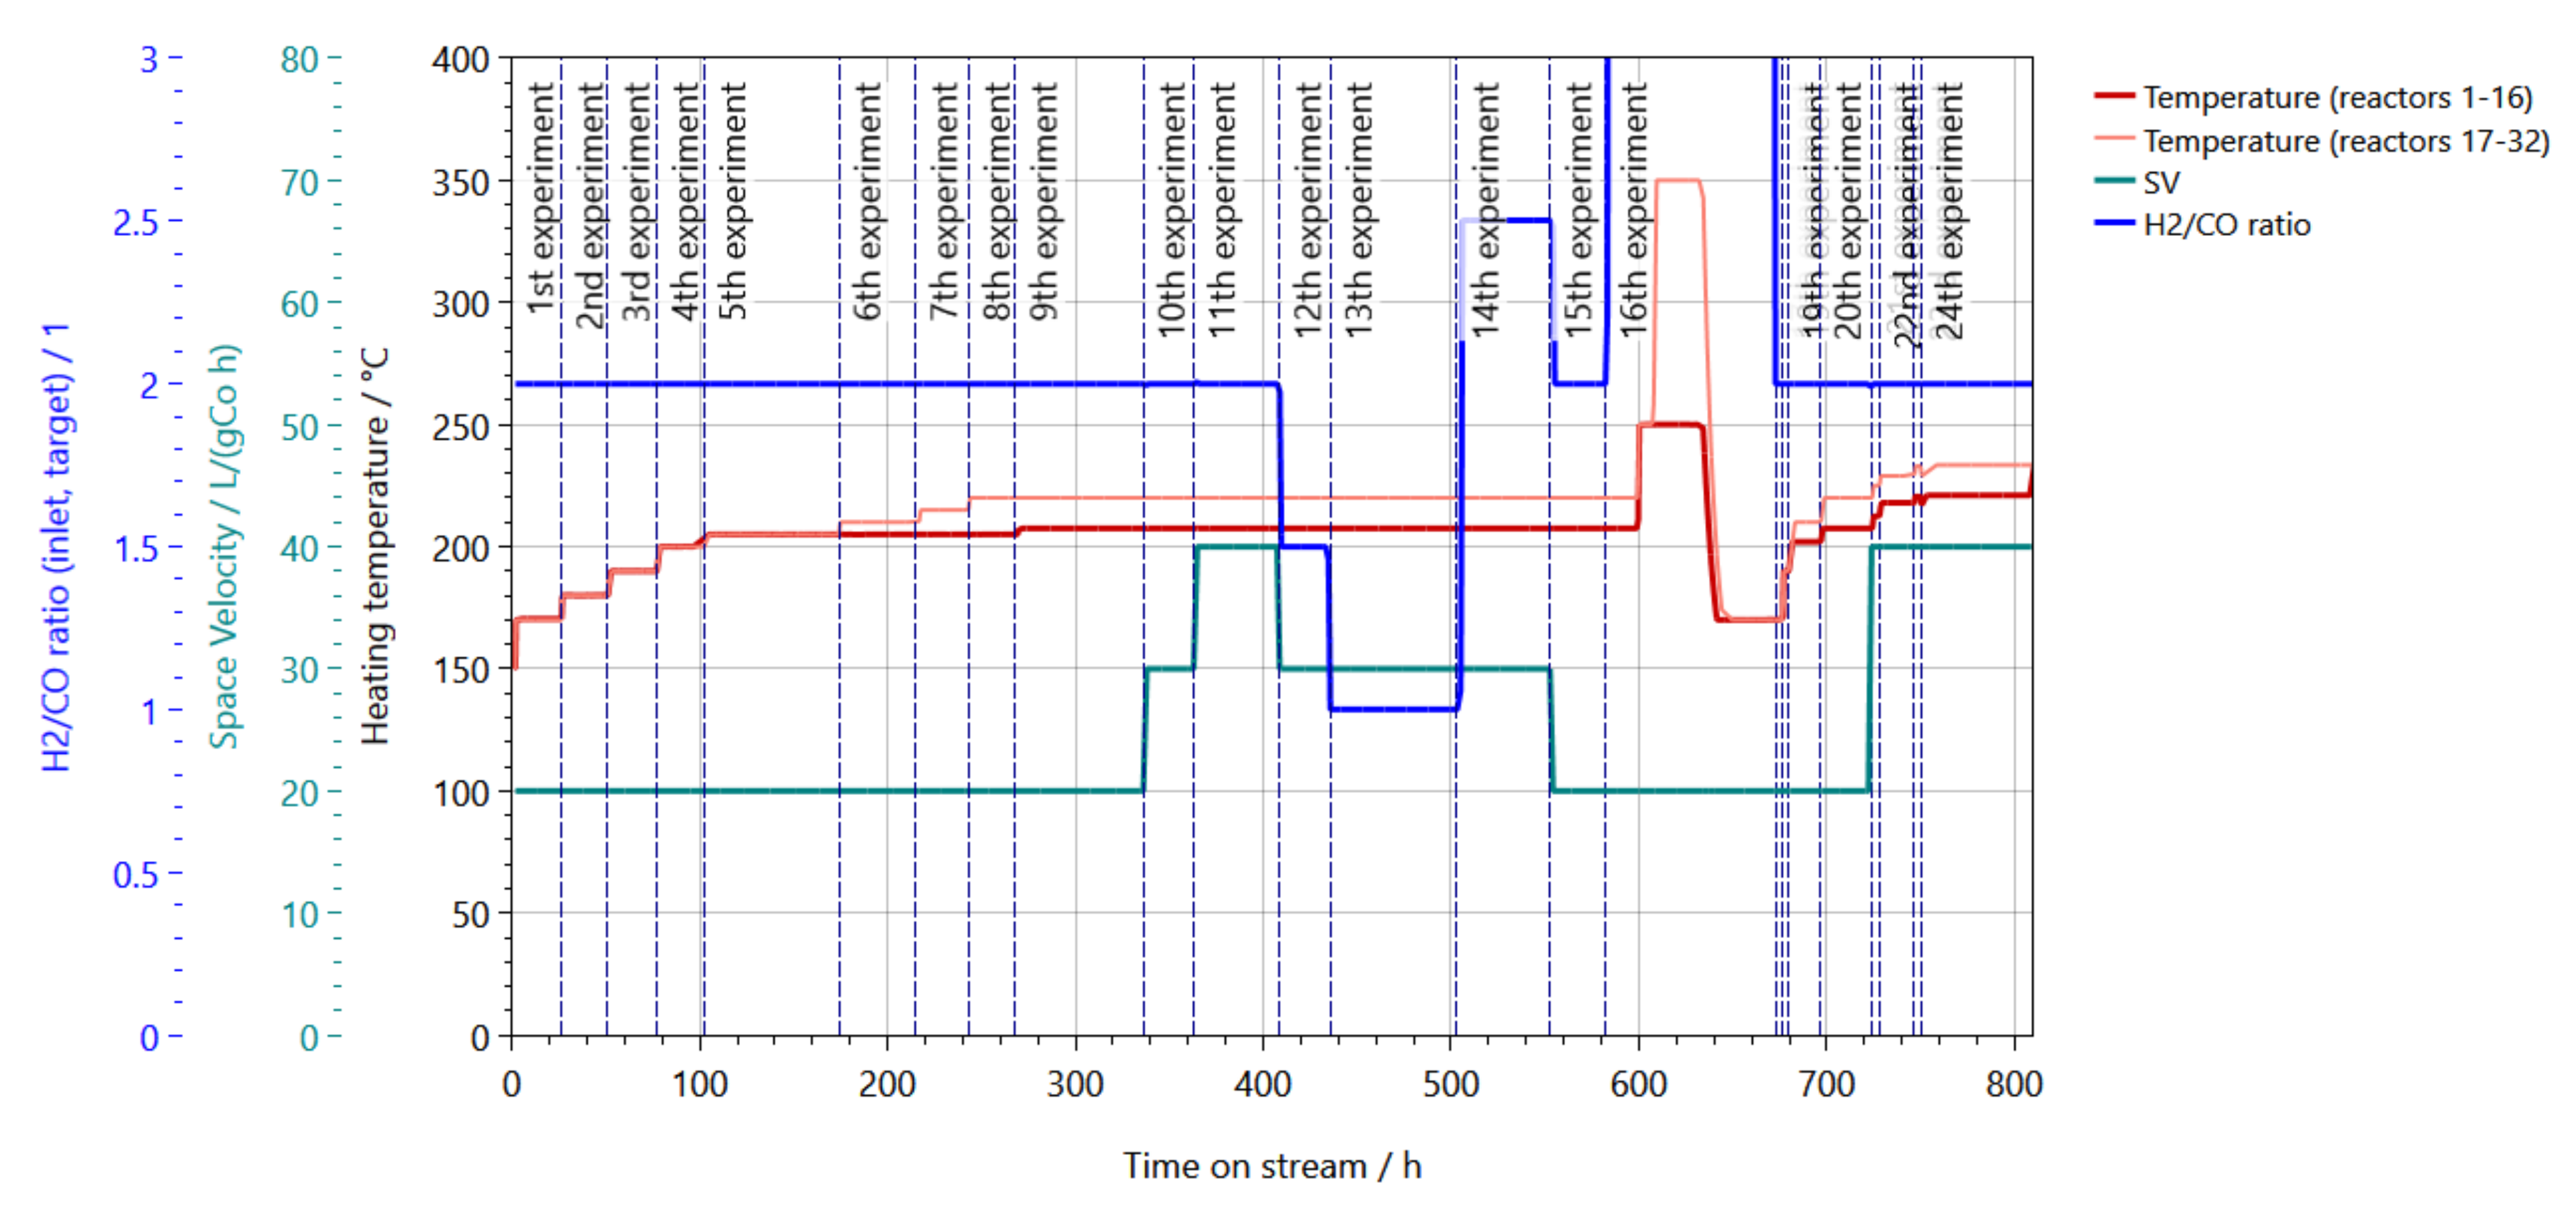
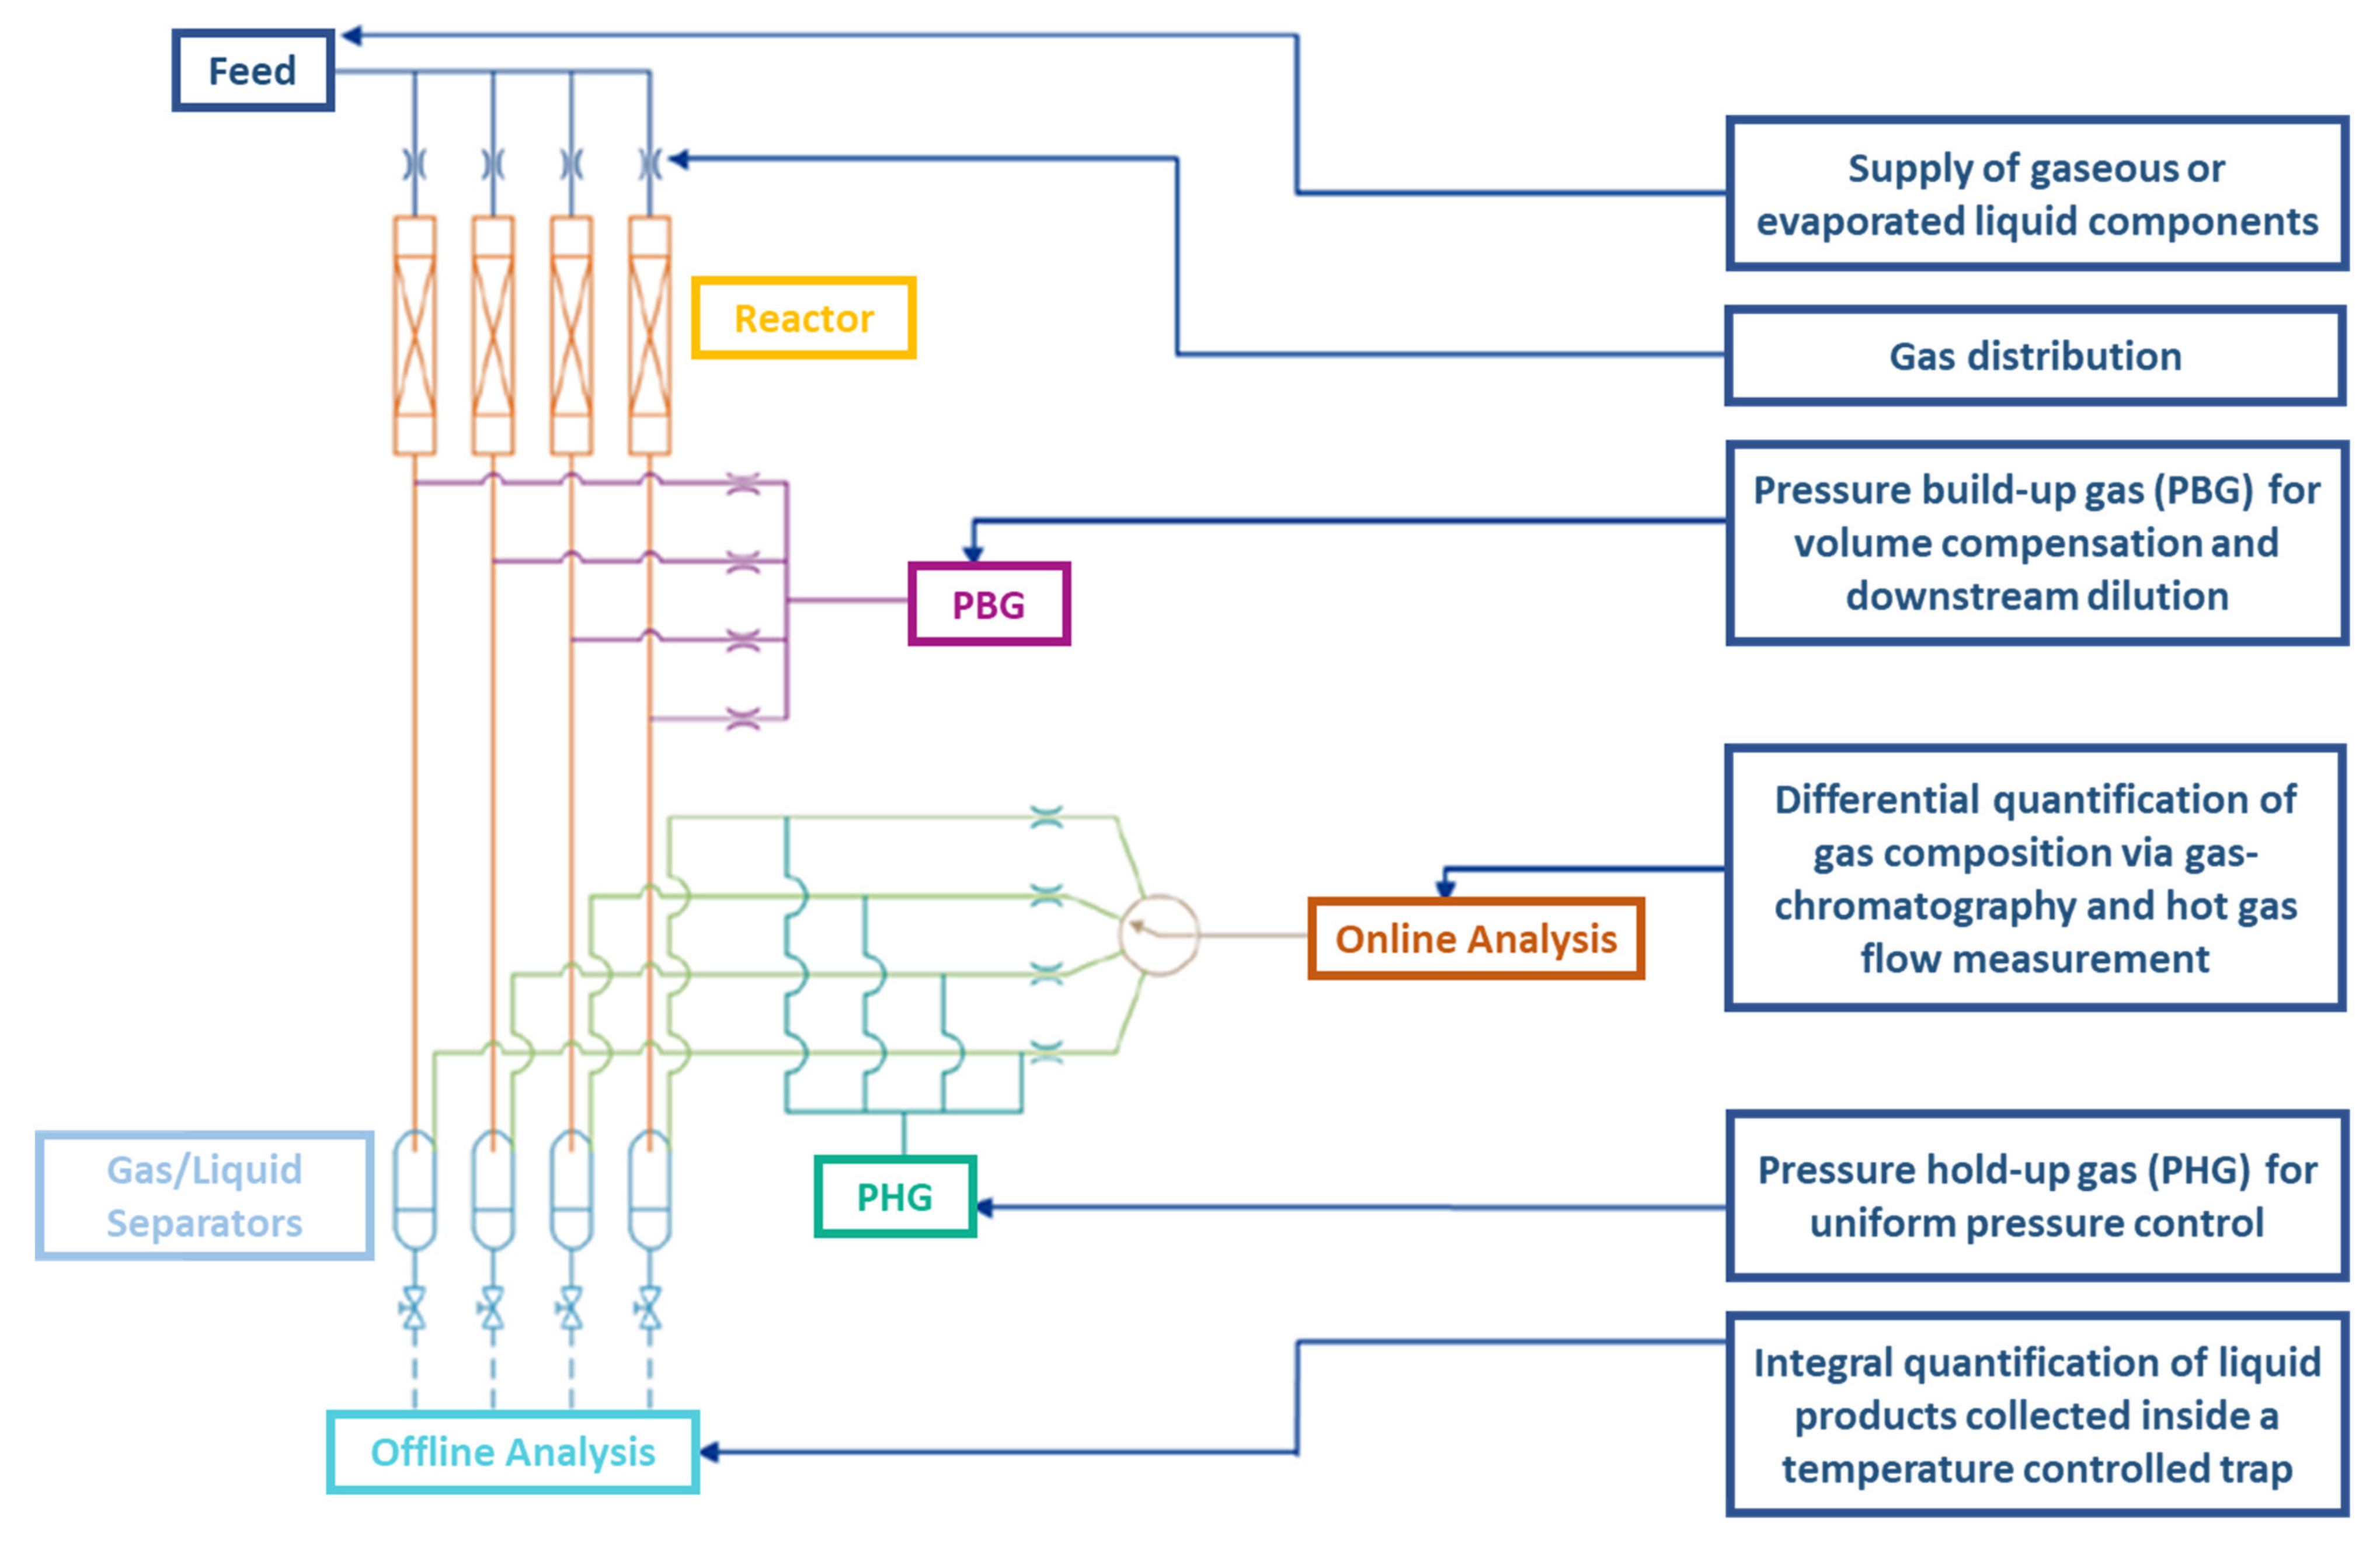
3.3. High-Throughput Testing of Catalysts

The catalysts were loaded in the reactors on a wet basis, i.e., without previous drying. Corundum in 125 to 160 µm was used as the upper and post bed up front and below the catalyst bed. The same particle size was used in order to avoid mixing particles of different sizes. The catalyst beds were not diluted with inert material. The results described in this study were obtained from a single set of reactors. The details of the reactor filling are provided in Table 3.
Catalytic tests were performed in a fully automated, commercial 32-fold parallel testing setup designed and built by hte GmbH. The gas-dosing unit provides mixed feeds comprising H2 (0 vol % to 70 vol %), CO (0 vol % to 50 vol %), and Ar (as an internal standard, 10 vol %). The typical range of gas hourly space velocities (GHSV) is 10,000–80,000 mL/(gCo h). Catalyst volumes of up to 1 mL were placed inside stainless steel reactors with inner diameters of 6 mm. Before catalytic testing, isothermal zones were determined with stainless steel thermowells (1/8” outer diameter) in the center of all reactors. An isothermal zone was defined with a temperature deviation of ±1 K. In total, 32 reactors can be tested in parallel. The reactor unit comprises two separate slice reactor blocks, each designed for 16 reactors. The two reactor blocks can be individually temperature controlled up to 450 °C. The process control for equal feed distribution and constant reaction pressure is based on the technology described in the patent [38]. A simplified process scheme of the setup is shown in Figure 8 to reduce complexity; the degree of parallelization is reduced to 4 reactors in parallel (Figure 10).
Using the parallel testing setup, the variation of space-time velocities was realized by loading the channels with different amounts of catalyst. The larger catalyst amounts were loaded in reactor heating block 1, while the smaller amounts (half the amount compared to reactor heating block 1) were loaded in reactor heating block 2.
The catalysts were dried under pure Ar (GHSV = 60,000 mL/(gCo h) at 110 °C and 1 atm for two hours to purge the catalyst bed of air and residual moisture. The activation was performed with 25 vol % H2 in Ar (GHSV = 60,000mL/(gCo h) at 350 °C (1 K/min heating ramp) and 1 atm for 24 h. The chosen procedure is comparable to activation protocols from the literature [39].
Cooling to 150 °C after finishing catalyst activation was done in 100 vol % Ar without a defined temperature ramp. Afterward, the system was pressurized to 20 bar(g) with synthesis gas (H2/CO ratio 2, Ar content 10 vol %). A full parameter field variation of temperature, GHSV, and H2/CO ratio was applied to all 30 catalysts. An overview of all reaction conditions can be found in Table 4. A detailed overview is shown in the Appendix A1.
Matching industrially relevant feed conditions, the sequence of catalytic testing comprises a temperature variation (170 to 233.5 °C), H2/CO ratio adaption (1 to 2.5), and a GHSV variation (20,000 mL/(gCo h) to 40,000 mL/(gCo h)). The total gas pressure was kept constant at 20 bar(g) throughout the entire run. Each reactor was measured at least three times to check the time scale of equilibration required for stable catalytic performance. To monitor catalyst aging effects on activity and product selectivity, a reference point was measured (207.5 °C and 220 °C, H2/CO ratio 2, 20,000 mL/(gCo h)) after 24 days on stream.
The product gases are analyzed by two gas chromatographs (GC 7890 A, Agilent). Each GC is mounted with three detectors. In total, three flame ionization detectors (FID) and three thermal conductivity detectors (TCD) were utilized for a full gas-phase analysis up to C20. The first FID is connected to an isomer resolving column for analysis of all isomers from C1 to C5. The second FID is connected to a boiling point column, where C5 to C20 compounds are analyzed. The third FID is mounted with a Jetanizer for COx analytics. The first TCD is connected to a molecular sieve column and optimized for H2 and N2 analytics. The second TCD is used for Ar analysis as well as for COx. The last TCD can be used for water analysis. The effluent gas of the blank reactor, which has the same composition as the inlet gas, is also analyzed to verify the correct operation of the feed dosage and the analysis. Prior to the GC analysis, all effluent gas streams are diluted with hot inert gas to provide a defined cut of the gas phase products. Liquid products are separated inside a hot trap at 130 °C. Transfer lines between reactors and gas chromatographs are heated (200 °C). Before the GC, the hot gas flow (HGF) is measured with a flow indicator. Typically, gas-phase compositions up to C20 can be differentially analyzed in the gas phase via online GC and hot gas flow indicator, where longer hydrocarbons are integrally analyzed with offline methods. Therefore, the amount of wax is collected, and liquid samples are extracted via manual valves on the hot trap; then, they are quantified via mass balance. To avoid instationary composition, the wax formed initially at each condition is discarded and equilibrated wax composition is collected. The composition of the wax sample is analyzed via offline GC. The mass of the wax samples and its composition measured by offline gas chromatography is combined with the online gas chromatograms and process parameters measured during the sample collection. From the merged results, a full Schultz Flory distribution covering gas and liquid phase can be derived.
The conversion (X) of CO (Equation (2)) and the selectivities (S) of the respective products (Equation (3)) are calculated from the concentrations measured with reference to the internal standard Ar. The productivities of each product are calculated from the carbon concentrations referred to as CH2 per loaded mass of metallic Co (Equation (4)).
X ( CO )   =   1 A CO A CO , 0   ×   A Ar , 0 A Ar
with A = area derived from GC chromatogram
S i   =   cc i   × H G F i cc CO , 0   ×   H G F 0   x   X ( CO )
with i = reaction products, cc = carbon concentration with (cc) = gCarbon/L, with HGF = hot gas flow with (HGF) = L/h.
P i   =   cc i   ×   HGF   /   m Co
with m = mass.

Author Contributions

Conceptualization, A.H. and C.K.; methodology, C.K.; validation, D.K., L.R. and C.K.; formal analysis, P.K.; investigation, M.S.; resources, T.E.M. and T.B.T.; data curation, C.S.; writing—original draft preparation, C.S.; writing—review and editing, C.S.; visualization, P.K.; supervision, A.H.; project administration, C.K.; funding acquisition, T.E.M. and T.B.T.. All authors have read and agreed to the published version of the manuscript.

Funding

This research received no external funding.

Data Availability Statement

3rd Party Data: Restrictions apply to the availability of these data. Data was obtained from the GmbH and are available from Carsten Knobloch with the permission of Venator Germany GmbH.

Conflicts of Interest

The authors declare no conflict of interest.

Appendix A

Table A1. Detailed overview of experimental conditions.
DayExperiment NumberTemperature (Reactor 1 to 16)/°CTemperature (Reactor 17 to 32)/°CPressure/bar(g)GHSV (Reactor 1 to 16)/mL/(gCo h)GHSV (Reactor 17 to 32)/mL/(gCo h)H2/CO Ratio
111701702020,00040,0002.0
221801802020,00040,0002.0
331901902020,00040,0002.0
442002002020,00040,0002.0
552052052020,00040,0002.0
862052102020,00040,0002.0
1072052152020,00040,0002.0
1182052202020,00040,0002.0
129207.52202020,00040,0002.0
1510207.52202020,00040,0002.0
1611207.52202040,00080,0002.0
1812207.52202030,00060,0001.5
1913207.52202030,00060,0001.0
2214207.52202030,00060,0002.5
2415207.52202020,00040,0002.0
25162503502020,00040,000n.a.
29171701702020,00040,0002.0
29181901902020,00040,0002.0
29192022102020,00040,0002.0
3020207.52202020,00040,0002.0
3121212.52252040,00080,0002.0
32222182292040,00080,0002.0
3223220.52332040,00080,0002.0
3224221233.52040,000/80,0002.0

References

  1. Comm/dg/unit. A European Green Deal. Available online: https://ec.europa.eu/info/strategy/priorities-2019-2024/european-green-deal_en (accessed on 7 December 2020).
  2. The Paris Agreement|UNFCCC. Available online: https://unfccc.int/process-and-meetings/the-paris-agreement/the-paris-agreement (accessed on 7 December 2020).
  3. Kätelhön, A.; Meys, R.; Deutz, S.; Suh, S.; Bardow, A. Climate change mitigation potential of carbon capture and utilization in the chemical industry. Proc. Natl. Acad. Sci. USA 2019, 11187–11194. [Google Scholar] [CrossRef] [Green Version]
  4. Vogel, G.H. Change in Raw Material Base in the Chemical Industry. Chem. Eng. Technol. 2008, 31, 730–735. [Google Scholar] [CrossRef]
  5. Pagliaro, M. An Industry in Transition: The Chemical Industry and the Megatrends Driving Its Forthcoming Transformation. Angew. Chem. Int. Ed. 2019, 11154–11159. [Google Scholar] [CrossRef]
  6. bp Global. Oil|Energy Economics|Home. Available online: https://www.bp.com/en/global/corporate/energy-economics/energy-outlook/demand-by-fuel/oil.html (accessed on 7 December 2020).
  7. Shell’s Ambition to Be a Net-Zero Emissions Energy Business. Available online: https://www.shell.com/energy-and-innovation/the-energy-future/shells-ambition-to-be-a-net-zero-emissions-energy-business.html (accessed on 10 January 2020).
  8. Melero, J.A.; Iglesias, J.; Garcia, A. Biomass as renewable feedstock in standard refinery units. Feasibility, opportunities and challenges. Energy Environ. Sci. 2012, 5, 7393. [Google Scholar] [CrossRef]
  9. Fernando, S.; Adhikari, S.; Chandrapal, C.; Murali, N. Biorefineries: Current Status, Challenges, and Future Direction. Energy Fuels 2006, 20, 1727–1737. [Google Scholar] [CrossRef]
  10. Rauch, R.; Kiennemann, A.; Sauciuc, A. Fischer-Tropsch Synthesis to Biofuels (BtL Process). In The Role of Catalysis for the Sustainable Production of Bio-Fuels and Bio-Chemicals; Elsevier: Amsterdam, The Netherlands, 2013; pp. 397–443. [Google Scholar] [CrossRef]
  11. Luo, S.; Zhou, Y.; Yi, C. Syngas production by catalytic steam gasification of municipal solid waste in fixed-bed reactor. Energy 2012, 44, 391–395. [Google Scholar] [CrossRef]
  12. Arena, U. Process and technological aspects of municipal solid waste gasification. A review. Waste Manag. 2012, 32, 625–639. [Google Scholar] [CrossRef]
  13. Daza, Y.A.; Kuhn, J.N. CO2 conversion by reverse water gas shift catalysis: Comparison of catalysts, mechanisms and their consequences for CO2 conversion to liquid fuels. RSC Adv. 2016, 6, 49675–49691. [Google Scholar] [CrossRef]
  14. Rostrup-Nielsen, J.R. Syngas in perspective. Catal. Today 2002, 71, 243–247. [Google Scholar] [CrossRef]
  15. Saeidi, S.; Talebi Amiri, M.; Saidina Amin, N.A.; Rahimpour, M.R. Progress in Reactors for High-Temperature Fischer–Tropsch Process: Determination Place of Intensifier Reactor Perspective. Int. J. Chem. React. Eng. 2014, 12, 639–664. [Google Scholar] [CrossRef] [Green Version]
  16. Mahmoudi, H.; Mahmoudi, M.; Doustdar, O.; Jahangiri, H.; Tsolakis, A.; Gu, S.; LechWyszynski, M. A review of Fischer Tropsch synthesis process, mechanism, surface chemistry and catalyst formulation. Biofuels Eng. 2017, 2, 11–31. [Google Scholar] [CrossRef]
  17. Ponec, V. Some Aspects of the Mechanism of Methanation and Fischer-Tropsch Synthesis. Catal. Rev. 1978, 18, 151–171. [Google Scholar] [CrossRef]
  18. Jager, B.; Espinoza, R. Advances in low temperature Fischer-Tropsch synthesis. Catal. Today 1995, 23, 17–28. [Google Scholar] [CrossRef]
  19. Yang, J.; Ma, W.; Chen, D.; Holmen, A.; Davis, B.H. Fischer–Tropsch synthesis: A review of the effect of CO conversion on methane selectivity. Appl. Catal. A Gen. 2014, 470, 250–260. [Google Scholar] [CrossRef]
  20. Van der Laan, G.P.; Beenackers, A.A.C.M. Kinetics and Selectivity of the Fischer–Tropsch Synthesis: A Literature Review. Catal. Rev. 1999, 41, 255–318. [Google Scholar] [CrossRef]
  21. Viswanathan, B.; Gopalakrishnan, R. Effect of support and promoter in Fischer-Tropsch cobalt catalysts. J. Catal. 1986, 99, 342–348. [Google Scholar] [CrossRef]
  22. Borg, Ø.; Eri, S.; Blekkan, E.A.; Storsæter, S.; Wigum, H.; Rytter, E.; Holmen, A. Fischer–Tropsch synthesis over γ-alumina-supported cobalt catalysts: Effect of support variables. J. Catal. 2007, 248, 89–100. [Google Scholar] [CrossRef]
  23. Bessel, S. Support effects in cobalt-based Fischer-Tropsch catalysis. Appl. Catal. A Gen. 1993, 96, 253–268. [Google Scholar] [CrossRef]
  24. Jacobs, G.; Das, T.K.; Zhang, Y.; Li, J.; Racoillet, G.; Davis, B.H. Fischer–Tropsch synthesis: Support, loading, and promoter effects on the reducibility of cobalt catalysts. Appl. Catal. A Gen. 2002, 233, 263–281. [Google Scholar] [CrossRef]
  25. Sakurai, K.; Mizusawa, M. X-ray diffraction imaging of anatase and rutile. Anal. Chem. 2010, 82, 3519–3522. [Google Scholar] [CrossRef] [PubMed]
  26. Peng, B.; Meng, X.; Tang, F.; Ren, X.; Chen, D.; Ren, J. General Synthesis and Optical Properties of Monodisperse Multifunctional Metal-Ion-Doped TiO 2 Hollow Particles. J. Phys. Chem. C 2009, 113, 20240–20245. [Google Scholar] [CrossRef]
  27. Yan, Z.; Wu, H.; Han, A.; Yu, X.; Du, P. Noble metal-free cobalt oxide (CoO) nanoparticles loaded on titanium dioxide/cadmium sulfide composite for enhanced photocatalytic hydrogen production from water. Int. J. Hydrogen Energy 2014, 39, 13353–13360. [Google Scholar] [CrossRef]
  28. Reuel, R. Effects of support and dispersion on the CO hydrogenation activity/selectivity properties of cobalt. J. Catal. 1984, 85, 78–88. [Google Scholar] [CrossRef]
  29. Shimura, K.; Miyazawa, T.; Hanaoka, T.; Hirata, S. Fischer–Tropsch synthesis over TiO2 supported cobalt catalyst: Effect of TiO2 crystal phase and metal ion loading. Appl. Catal. A Gen. 2013, 460–461, 8–14. [Google Scholar] [CrossRef]
  30. Post, M.F.M.; Van’t Hoog, A.C.; Minderhoud, J.K.; Sie, S.T. Diffusion limitations in fischer-tropsch catalysts. AICHE J. 1989, 35, 1107–1114. [Google Scholar] [CrossRef]
  31. Lyu, S.; Wang, L.; Zhang, J.; Liu, C.; Sun, J.; Peng, B.; Wang, Y.; Rappé, K.G.; Zhang, Y.; Li, J.; et al. Role of Active Phase in Fischer–Tropsch Synthesis: Experimental Evidence of CO Activation over Single-Phase Cobalt Catalysts. ACS Catal. 2018, 8, 7787–7798. [Google Scholar] [CrossRef]
  32. Jarosch, K.T.; Tonkovich, A.L.Y.; Perry, S.T.; Kuhlmann, D.; Wang, Y. Microchannel Reactors for Intensifying Gas-to-Liquid Technology. In Microreactor Technology and Process Intensification; ACS Symposium Series; ACS: Washington, DC, USA, 2005; pp. 258–272. [Google Scholar] [CrossRef]
  33. Wolf, M.; Fischer, N.; Claeys, M. Water-induced deactivation of cobalt-based Fischer–Tropsch catalysts. Nat. Catal. 2020, 3, 962–965. [Google Scholar] [CrossRef]
  34. Tsakoumis, N.E.; Rønning, M.; Borg, Ø.; Rytter, E.; Holmen, A. Deactivation of cobalt based Fischer–Tropsch catalysts: A review. Catal. Today 2010, 154, 162–182. [Google Scholar] [CrossRef]
  35. Bartholomew, C.H. Carbon Deposition in Steam Reforming and Methanation. Catal. Rev. 1982, 24, 67–112. [Google Scholar] [CrossRef]
  36. Moodley, D.J. On the deactivation of cobalt-based Fischer-Tropsch synthesis catalysts. Am. Chem. Soc. Div. Petrochem. Chem. 2008, 53, 122–125. [Google Scholar]
  37. Snyder, R.L.; Fiala, J.; Bunge, H.-J. Defect and Microstructure Analysis by Diffraction; Oxford Science Publications: Oxford, UK; Oxford University Press: Oxford, UK, 1999; Volume 10. [Google Scholar]
  38. Brenner, A.; Friess, M.; Haas, A.; Köchel, O.; Strehlau, W.; Zech, T. Device and Method for Pressure and Flow Control in Parallel Reactors. Patent PCT/EP2004/014509, 23 12 2003. [Google Scholar]
  39. Eschemann, T.O.; Oenema, J.; de Jong, K.P. Effects of noble metal promotion for Co/TiO2 Fischer-Tropsch catalysts. Catal. Today 2016, 261, 60–66. [Google Scholar] [CrossRef]
Figure 1. XRD pattern of investigated TiO2 support materials.
Catalysts 11 00352 g001
Figure 2. XRD analysis of Co supported on TiO2 with 10 wt % (top) and 20 wt % (bottom) Co loading.
Catalysts 11 00352 g002
Figure 3. TPR experiment with two-step reduction of cobalt oxide (left). TPR experiments of cobalt oxide reduction on different support materials (right).
Catalysts 11 00352 g003
Figure 4. Overview of all applied reaction conditions.
Catalysts 11 00352 g004
Figure 5. Correlation of specific surface area and conversion of CO.
Catalysts 11 00352 g005
Figure 6. Arrhenius plots.
Catalysts 11 00352 g006aCatalysts 11 00352 g006b
Figure 7. Conversion of CO as a function of reactor temperature.
Catalysts 11 00352 g007
Figure 8. CH4 selectivity and C5+ productivity of all catalysts for two experimental conditions.
Catalysts 11 00352 g008aCatalysts 11 00352 g008b
Figure 9. Catalyst deactivation after high severity experiments.
Catalysts 11 00352 g009
Figure 10. Simplified process scheme of a parallel test unit.
Catalysts 11 00352 g010
Table 1. Overview Fischer‒Tropsch synthesis (FTS) applications in industry.
ProcessLow-Temperature FTSHigh-Temperature FTS
Reaction temperature220 to 240 °C300 to 350 °C
CatalystCo-basedFe-based
ProductParaffins, long chains/waxesOlefins, short chains, gasoline, chemicals
Reactor TypeFixed bed, slurry bubble columnFluidized bed reactors
Table 2. Overview of supported Co catalysts on different TiO2 supports.
Sample DescriptionSpecific Surface Area of Support m2/gCo Loading/wt %Specific Surface Area of Impregnated Support/m2/gPhase Composition of TiO2
10 wt % Co/TiO2—#01158.910100.6Anatase
10 wt % Co/TiO2—#0256.71044.7Rutile
10 wt % Co/TiO2—#0357.41045.6Anatase
10 wt % Co/TiO2—#045.41010.9Rutile
10 wt % Co/TiO2—#0548.81039.0Anatase/Rutile
10 wt % Co/TiO2—#0775.61064.3Anatase
10 wt % Co/TiO2—#0853.11047.5Anatase
10 wt % Co/TiO2—#0955.01052.1Anatase
10 wt % Co/TiO2—#10111.41062.5Anatase
10 wt % Co/TiO2—#1176.81067.1Anatase
20 wt % Co/TiO2—#01158.92059.2Anatase
20 wt % Co/TiO2—#0548.82029.2Anatase/Rutile
20 wt % Co/TiO2—#0775.62052.6Anatase
20 wt % Co/TiO2—#10111.42034.5Anatase
20 wt % Co/TiO2—#1176.82052.5Anatase
Table 3. Reactor loading design for parallel testing.
Heating BlockReactor PositionSample DescriptionCo Loading / wt %Support NumberWet-Based Mass/gCo Mass/mg
A110 wt % Co/TiO2—#011010.80780
210 wt % Co/TiO2—#021020.80780
310 wt % Co/TiO2—#031030.80980
410 wt % Co/TiO2—#041040.80880
510 wt % Co/TiO2—#051050.80780
610 wt % Co/TiO2—#071070.80880
710 wt % Co/TiO2—#081080.80980
810 wt % Co/TiO2—#091090.80980
910 wt % Co/TiO2—#1010100.80880
1010 wt % Co/TiO2—#1110110.80780
1120 wt % Co/TiO2—#012010.40480
1220 wt % Co/TiO2—#052050.40480
1320 wt % Co/TiO2—#072070.40580
1420 wt % Co/TiO2—#1020100.40380
1520 wt % Co/TiO2—#1110110.40580
16Inert----
B1710 wt % Co/TiO2—#011010.40540
1810 wt % Co/TiO2—#021020.40440
1910 wt % Co/TiO2—#031030.40440
2010 wt % Co/TiO2—#041040.40540
2110 wt % Co/TiO2—#051050.40540
2210 wt % Co/TiO2—#071070.40440
2310 wt % Co/TiO2—#081080.40340
2410 wt % Co/TiO2—#091090.40340
2510 wt % Co/TiO2—#1010100.40340
2610 wt % Co/TiO2—#1110110.40540
2720 wt % Co/TiO2—#012010.20340
2820 wt % Co/TiO2—#052050.20140
2920 wt % Co/TiO2—#072070.20140
3020 wt % Co/TiO2—#1020100.20340
3120 wt % Co/TiO2—#1120110.20140
32Inert----
Table 4. Overview of experimental conditions.
GHSV/mL/(gCo h)20,000 to 80,000
H2/CO ratio1 to 2.5
Internal standard Ar/vol %10
Temperature/°C150 to 233.5
p/bar(g)20
Publisher’s Note: MDPI stays neutral with regard to jurisdictional claims in published maps and institutional affiliations.

