Article

Thermochemical Energy Storage Performance Analysis of (Fe,Co,Mn)Ox Mixed Metal Oxides

1
School of Energy Science and Engineering, Harbin Institute of Technology, Harbin 150001, China
2
MIIT Key Laboratory of Critical Materials Technology for New Energy Conversion and Storage, School of Chemistry and Chemical Engineering, Harbin Institute of Technology, Harbin 150001, China
*
Authors to whom correspondence should be addressed.
Catalysts 2021, 11(3), 362; https://doi.org/10.3390/catal11030362
Submission received: 22 January 2021 / Revised: 4 March 2021 / Accepted: 8 March 2021 / Published: 10 March 2021

Abstract

:
Metal oxide materials are known for their ability to store thermochemical energy through reversible redox reactions. Metal oxides provide a new category of materials with exceptional performance in terms of thermochemical energy storage, reaction stability and oxygen-exchange and uptake capabilities. However, these characteristics are predicated on the right combination of the metal oxide candidates. In this study, metal oxide materials consisting of pure oxides, like cobalt(II) oxide, manganese(II) oxide, and iron(II, III) oxide (Fe3O4), and mixed oxides, such as (100 wt.% CoO, 100 wt.% Fe3O4, 100 wt.% CoO, 25 wt.% MnO + 75 wt.% CoO, 75 wt.% MnO + 25 wt.% CoO) and 50 wt.% MnO + 50.wt.% CoO), which was subjected to a two-cycle redox reaction, was proposed. The various mixtures of metal oxide catalysts proposed were investigated through the thermogravimetric analysis (TGA), differential scanning calorimetry (DSC), energy dispersive X-ray (EDS), and scanning electron microscopy (SEM) analyses. The effect of argon (Ar) and oxygen (O2) at different gas flow rates (20, 30, and 50 mL/min) and temperature at thermal charging step and thermal discharging step (30–1400 °C) during the redox reaction were investigated. It was revealed that on the overall, 50 wt.% MnO + 50 wt.% CoO oxide had the most stable thermal stability and oxygen exchange to uptake ratio (0.83 and 0.99 at first and second redox reaction cycles, respectively). In addition, 30 mL/min Ar–20 mL/min O2 gas flow rate further increased the proposed (Fe,Co,Mn)Ox mixed oxide catalyst’s cyclic stability and oxygen uptake ratio. SEM revealed that the proposed (Fe,Co,Mn)Ox material had a smooth surface and consisted of polygonal-shaped structures. Thus, the proposed metallic oxide material can effectively be utilized for high-density thermochemical energy storage purposes. This study is of relevance to the power engineering industry and academia.

1. Introduction

“Clean energy” is a major area of focus in this century. A related aspect is efficient energy storage development and utilization, which are necessitated by an increase in global energy demand and the deleterious effects of the use of fossil fuels to the environment. There is an array of renewable energy sources such as wind, tidal wave, biogas, hydro, and solar, which aim at providing electricity, with hydroelectric energy taking the lead. On the other hand, solar energy integration with thermal energy storage is a very important technology, particularly when the cost of electric supply and demand increases. Thus, thermal energy storage provides a means of continuous and stable energy supply. There are different solar energy concentrators developed to receive solar energy directly from the sun, or as radiation received by the heliostats, which is then reflected back to the solar receiver. In the latter case, the collected energy is taken to the energy storage reactor by means of heat transfer fluid (HTF). Energy storage can be achieved in different ways, such as sensible, latent, and phase change materials. Sensible energy storage depends on the internal energy of a material, which in turn depends on the material’s heat capacity. Latent heat energy storage is possible when the material undergoes a phase change such as freezing or melting [1,2], whereas phase change materials (PCM) are possible due to absorption or release of energy by the material. Thermal energy storage (TES) that is integrated with concentrated solar power (CSP) [3,4,5,6], can be used when variable energy or electricity demand is high. Thermochemical energy storage (TCES) is an attractive and alternative means of solar storage at higher temperatures (400–1200 °C). The high-temperature process associated with thermodynamic cycles facilitate the conversion of solar energy to electricity. TCES is advantageous in offering high energy density and a possibility of energy storage at room temperature using solid stable biomolecules. Pertaining to TCES application, there are oxides that were proven to show promising results for their energy storage capacity, such as metallic oxides [5,7,8,9], hydroxides, particularly calcium hydro oxides [10,11,12,13,14,15,16], and carbonate-made materials including calcium [17,18,19] and strontium carbonate [20,21]. However, these carbonates require structural stabilization to hinder sintering at high reaction temperature. Co3O4/CoO and Mn2O3/Mn3O4 are well known to be the most promising redox systems, while CuO/Cu2O also show good properties for TCES application [22,23,24,25,26,27,28]. Cobalt metallic oxides provide fast reaction activity, complete reversibility, and high energy density with cyclic stability and transition temperature in CSP application (892 °C). Studies have implemented cobalt metallic oxides with CSP integrated reactor as an energy storage unit. Sing et al. [29] developed a numerical model that simulated the asserting heat and mass transfer performance of a cobalt-based material as a thermochemical storage system.
The aim of thermal energy storage application technology in solar thermal power system is to store solar energy as sensible, latent, and in PCM form or chemical forms, which can later be used for different energy demands particularly during low to non-sunshine hours. The dispatch ability [30] of TES and the nature of construction caused its demand to be increased. This study focused on the selection and characterization of materials with different proportion of metallic oxides that would be suitable for the development of thermochemical energy storage devices. The energy density capacity, cyclic stability, oxygen absorption, and release capacity of these were studied in the temperature range from 30 to 1400 °C and constant temperature supply was taken as the CSP power input. In the experimental analysis the endothermic and exothermic reaction with reversibility and cyclic stability were assessed. From Equations (1) and (2), heat was supplied to the compound to store solar energy in the form of chemical energy. When this system integrated with the CSP system, continuous energy production was possible in cloudy or dark skies [16,17,18,19,20,21,22,23,24,25,26,27,28,29,30,31,32]. The following Equations (1) and (2) can express the redox reactions mechanisms during charging–discharging processes. In the specific case of single metal oxides, air can be used as heat transfer fluid (Equations (1) and (2)), which allows operating with an open-loop system. The MO used in Equations (1) and (2) represents any metallic oxides.
M O ( o x ) + H e a t M O ( r e d ) + α O 2 ( g )
M O ( r e d ) + α O 2 ( g ) M O ( o x ) + H e a t
The use of metallic oxides as TES materials and air as heat transfer fluid can be advantageous in an open-loop system of solar energy harassing technology. The development of thermochemical solar energy storage mechanism, which depends on pressurized air-based solar tower receivers has attracted the attention of researchers. CoO and Mn3O4 are the most used oxide materials for thermochemical energy storage. Existing studies show that Co3O4 undergoes fast kinetic reaction, complete reaction, cyclic stability and has a gravimetric energy density of 576 kJ/kg [33] and a theoretical enthalpy of 844 kJ/kg [34,35,36,37]. However, the toxic nature cobalt oxides hamper their use. Studies have revealed that Mn2O3 occurs between 920–1000 °C with notable slow re-oxidation between 850–500 °C and it has an energy storage density range 110–160 kJ/kg [38,39,40] and a theoretical enthalpy of 202 kJ/kg [39].
Generally, optimization of material reactivity particularly metallic oxides can be enhanced by adopting strategies with proper synthesis control techniques for tailored morphology or stabilization of inert materials to reduce sintering effect. Improvement of reaction kinetics, reaction turning, and flexibility of a material can be obtained by the addition dopants, particularly in the case of the oxides of manganese, which are known to slow down reaction cycles. Doping effects of transition metals are also an option to slow redox reaction [33,35].
The purpose of the present study is to investigate and identify the appropriate proportion of cobalt(II) oxide, manganese(II) oxide, and Fe3O4 that synthesizes a material with good cyclic stability, optimal redox reaction, and good oxygen absorption capacity, which are characteristics suitable for thermal energy storage purpose (TES). In this study, the best optimized metallic mixed oxides were tested and compared for their capability of energy density, the identification the optimized gas flow rates, the heat rates, cyclic stability and phase changing temperature were properly analyzed. These aforementioned parameters would assist in investigating how appropriate addition of transition metallic oxides improves the slow and the fast reaction to optimized [36] and sintering [41], loss-in-capacity over cycles [39] to decrease the reduction temperature lower so that at lower supply of energy can be effective for thermochemical energy storage capacity. Singh et al. [29] revealed that addition of iron on pure cobalt oxides or addition of cobalt oxides on iron slowed down chemical reaction kinetics of the mixed oxides and consequently lowered its enthalpy when compared to pure oxides. Pakoura et al. [40] that cobalt oxide with 10–20 wt.% of iron good thermo-mechanical stability over the temperature of redox cycles. Carrillow et al. [41] revealed that the iron does not prevent the sintering encountered by Mn2O3 but helps to increase the heat storage density of the material. Thus, the addition of iron helps to stabilize and enhance the oxidation rate of manganese oxide over repeating performance of redox cycles. According to their study, the fastest and most stable oxidation reaction was obtained by Mn2O3 doped 20 mol% Fe. In another study, the author’s also considered Fe-Cu Co-doping in manganese oxide and that the incorporation of Cu decreased reduction temperature. However, the doping of iron to copper found to increase the r-oxidation temperature.
Recently models have been developed to provide thermodynamic descriptions of (Fe,Co,Mn)Ox [42,43,44,45] systems. Guene Lougou et al. [46,47,48,49,50] and Shuai [51,52] conducted studies on energy storage thermochemical reactor together with the synthesis of thermochemical energy storage material and Yabiabl et al. [53,54] studied about the impacts of thermochemical reactor designs for thermal energy storage and conversion of thermal efficiency. The researchers were able to produce a material that could resist the high-temperature thermal reduction super magnetic nanoparticles coated with aluminum (NiFe2O4@Alumina), (NiFe2O4@ZrO2), as well as support transits into new active phases including hercynite class materials (FeNiAlO4 and FeAlO4), Fe-oxide phases (Fe2O3, Fe3O4, and FeO) and NiO, (Ni,Fe), and AlNi phases.
This present work is also aimed at oxygen storage and exchange capacity during mass loss and during redox reaction in the newly prepared (Fe,Co,Mn)Ox material. The uptake and release capability of oxygen in each redox reaction cycle has been studied and the phase, reaction enthalpy, phase change, or the transition temperature for each metallic oxides have been compared. In developing the newly synthesized material, six metallic oxides were subjected to thermogravimetric analysis (TGA), scanning electron microscopy (SEM), differential scanning calorimetry (DSC), and energy dispersive X-ray (EDS) analysis. In addition, different atmospheric argon gas flow rates (20, 30, and 50 mL/min), oxygen flow rates (20, 30, and 50 mL/min), and charging temperatures (30–1400 °C) were studied and their effects on the newly developed thermochemical energy storage material were elucidated.

2. Result and Discussion

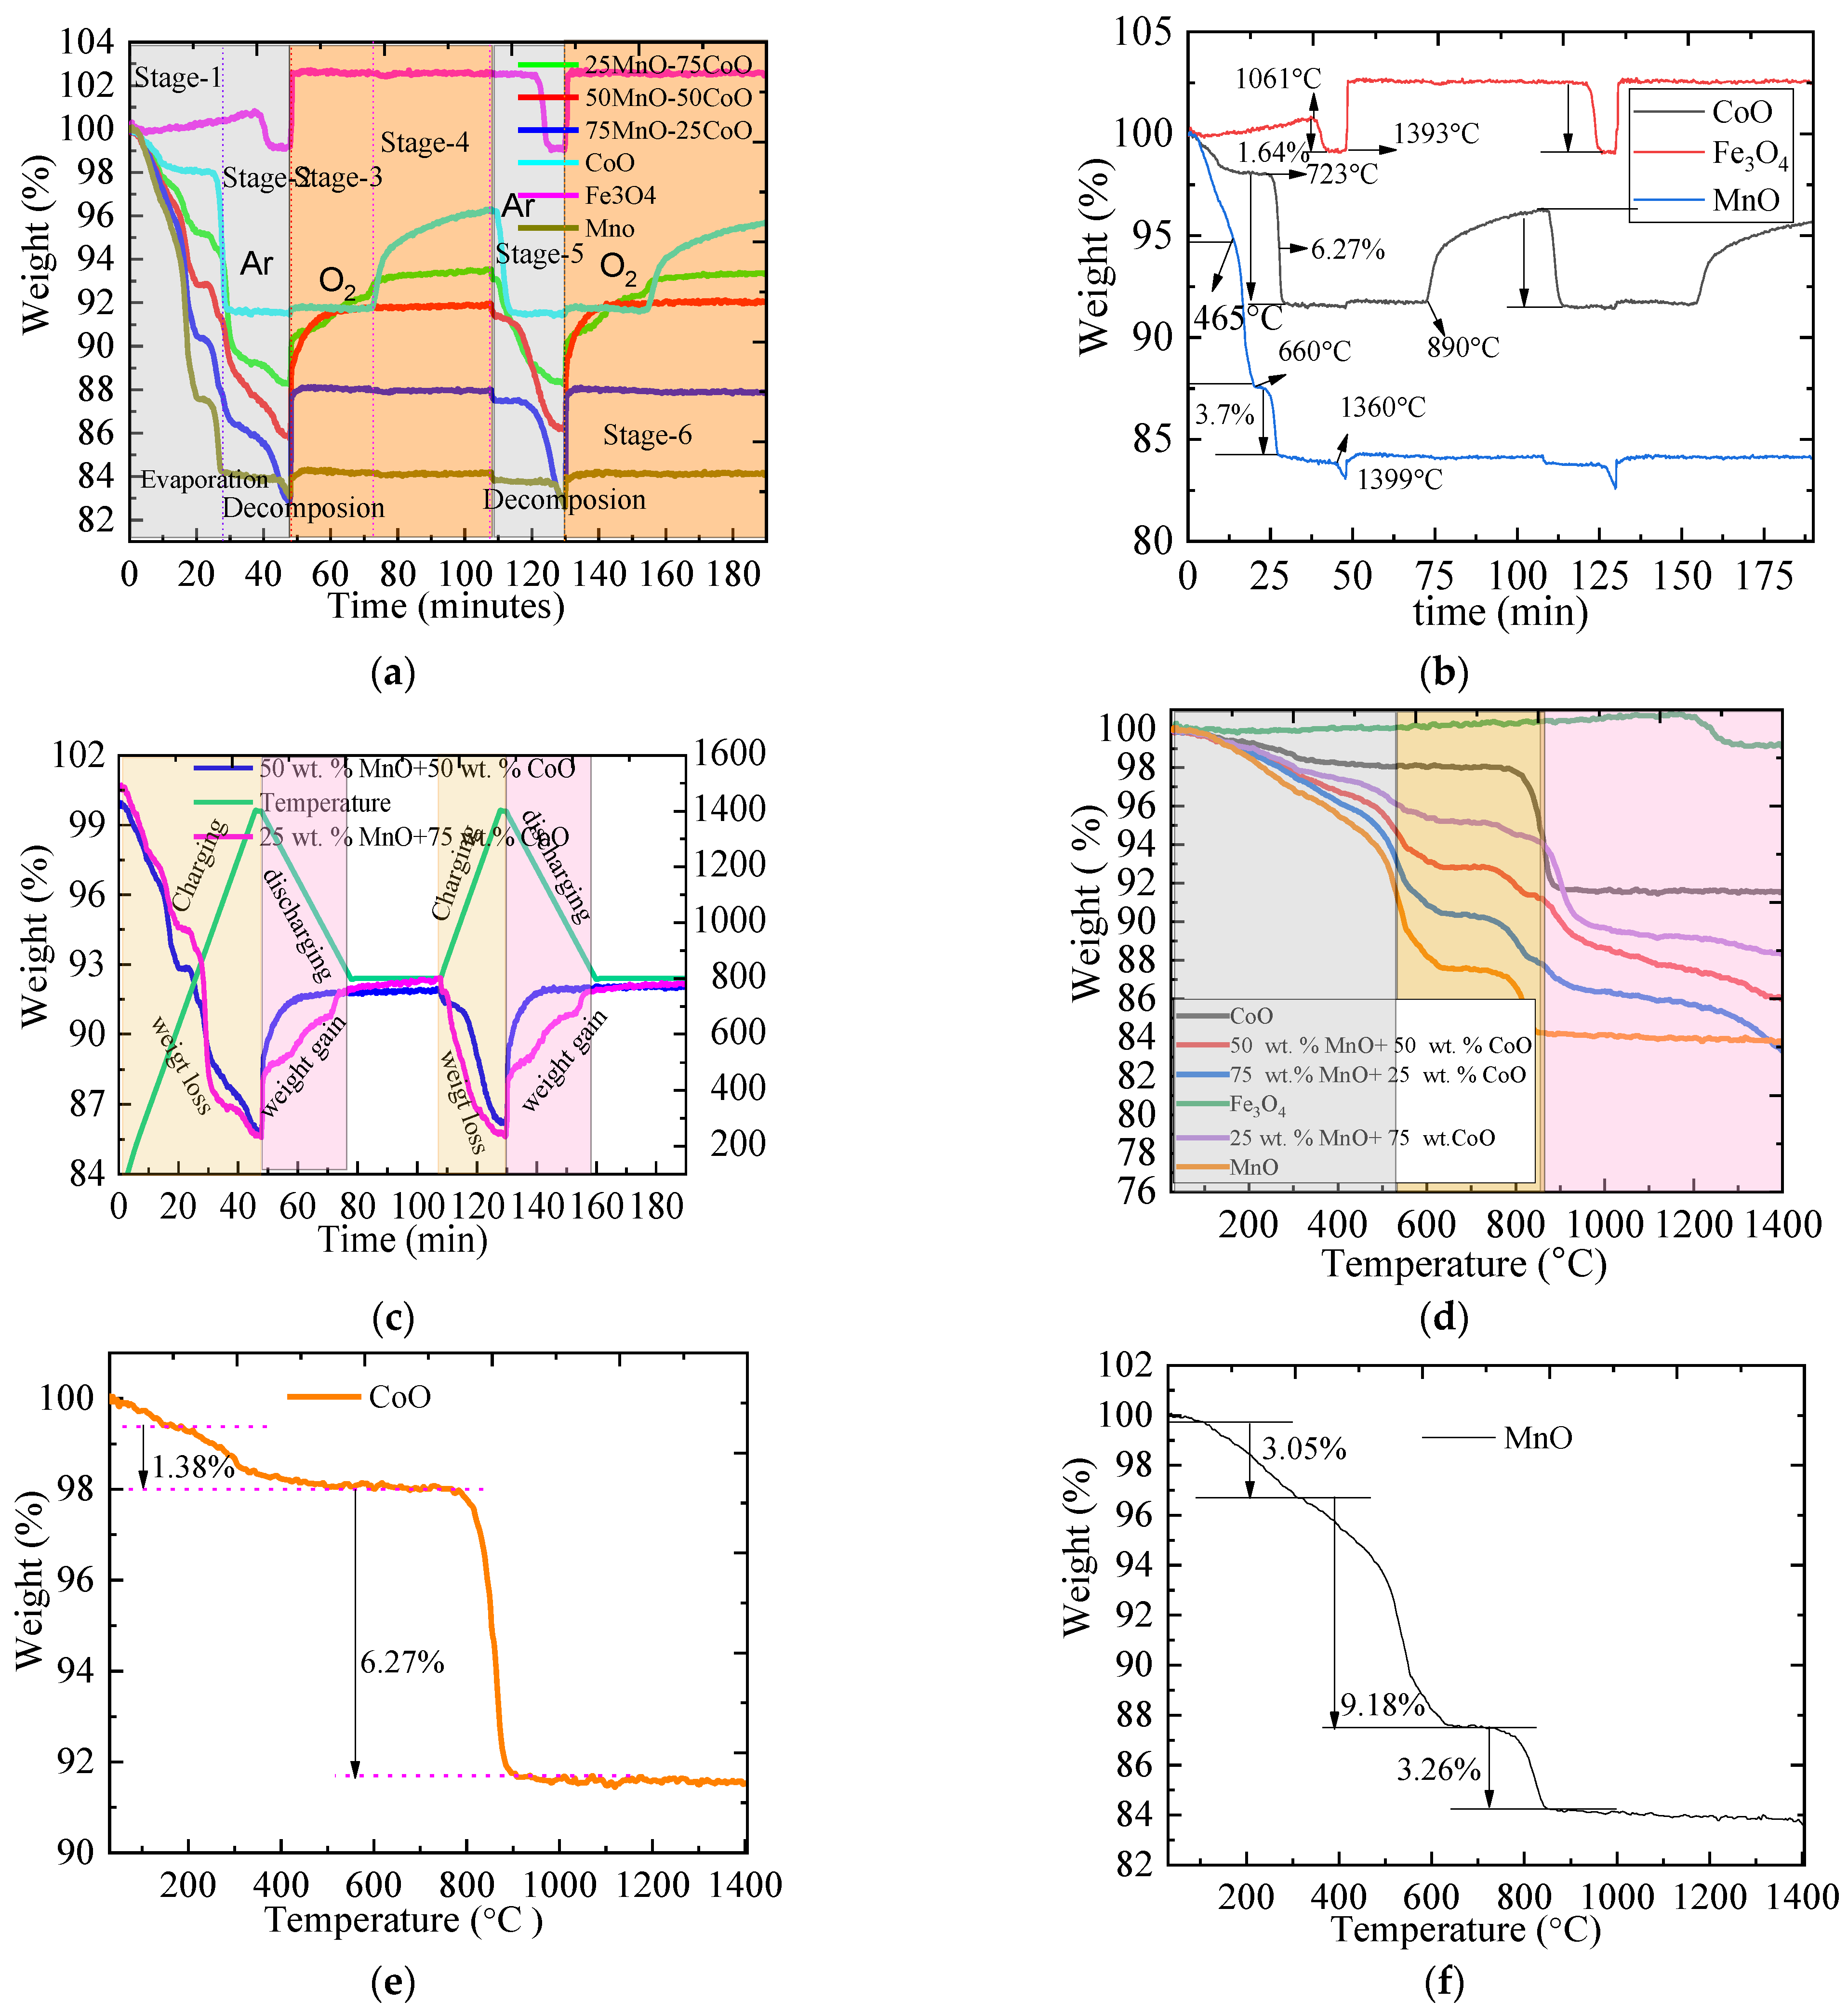
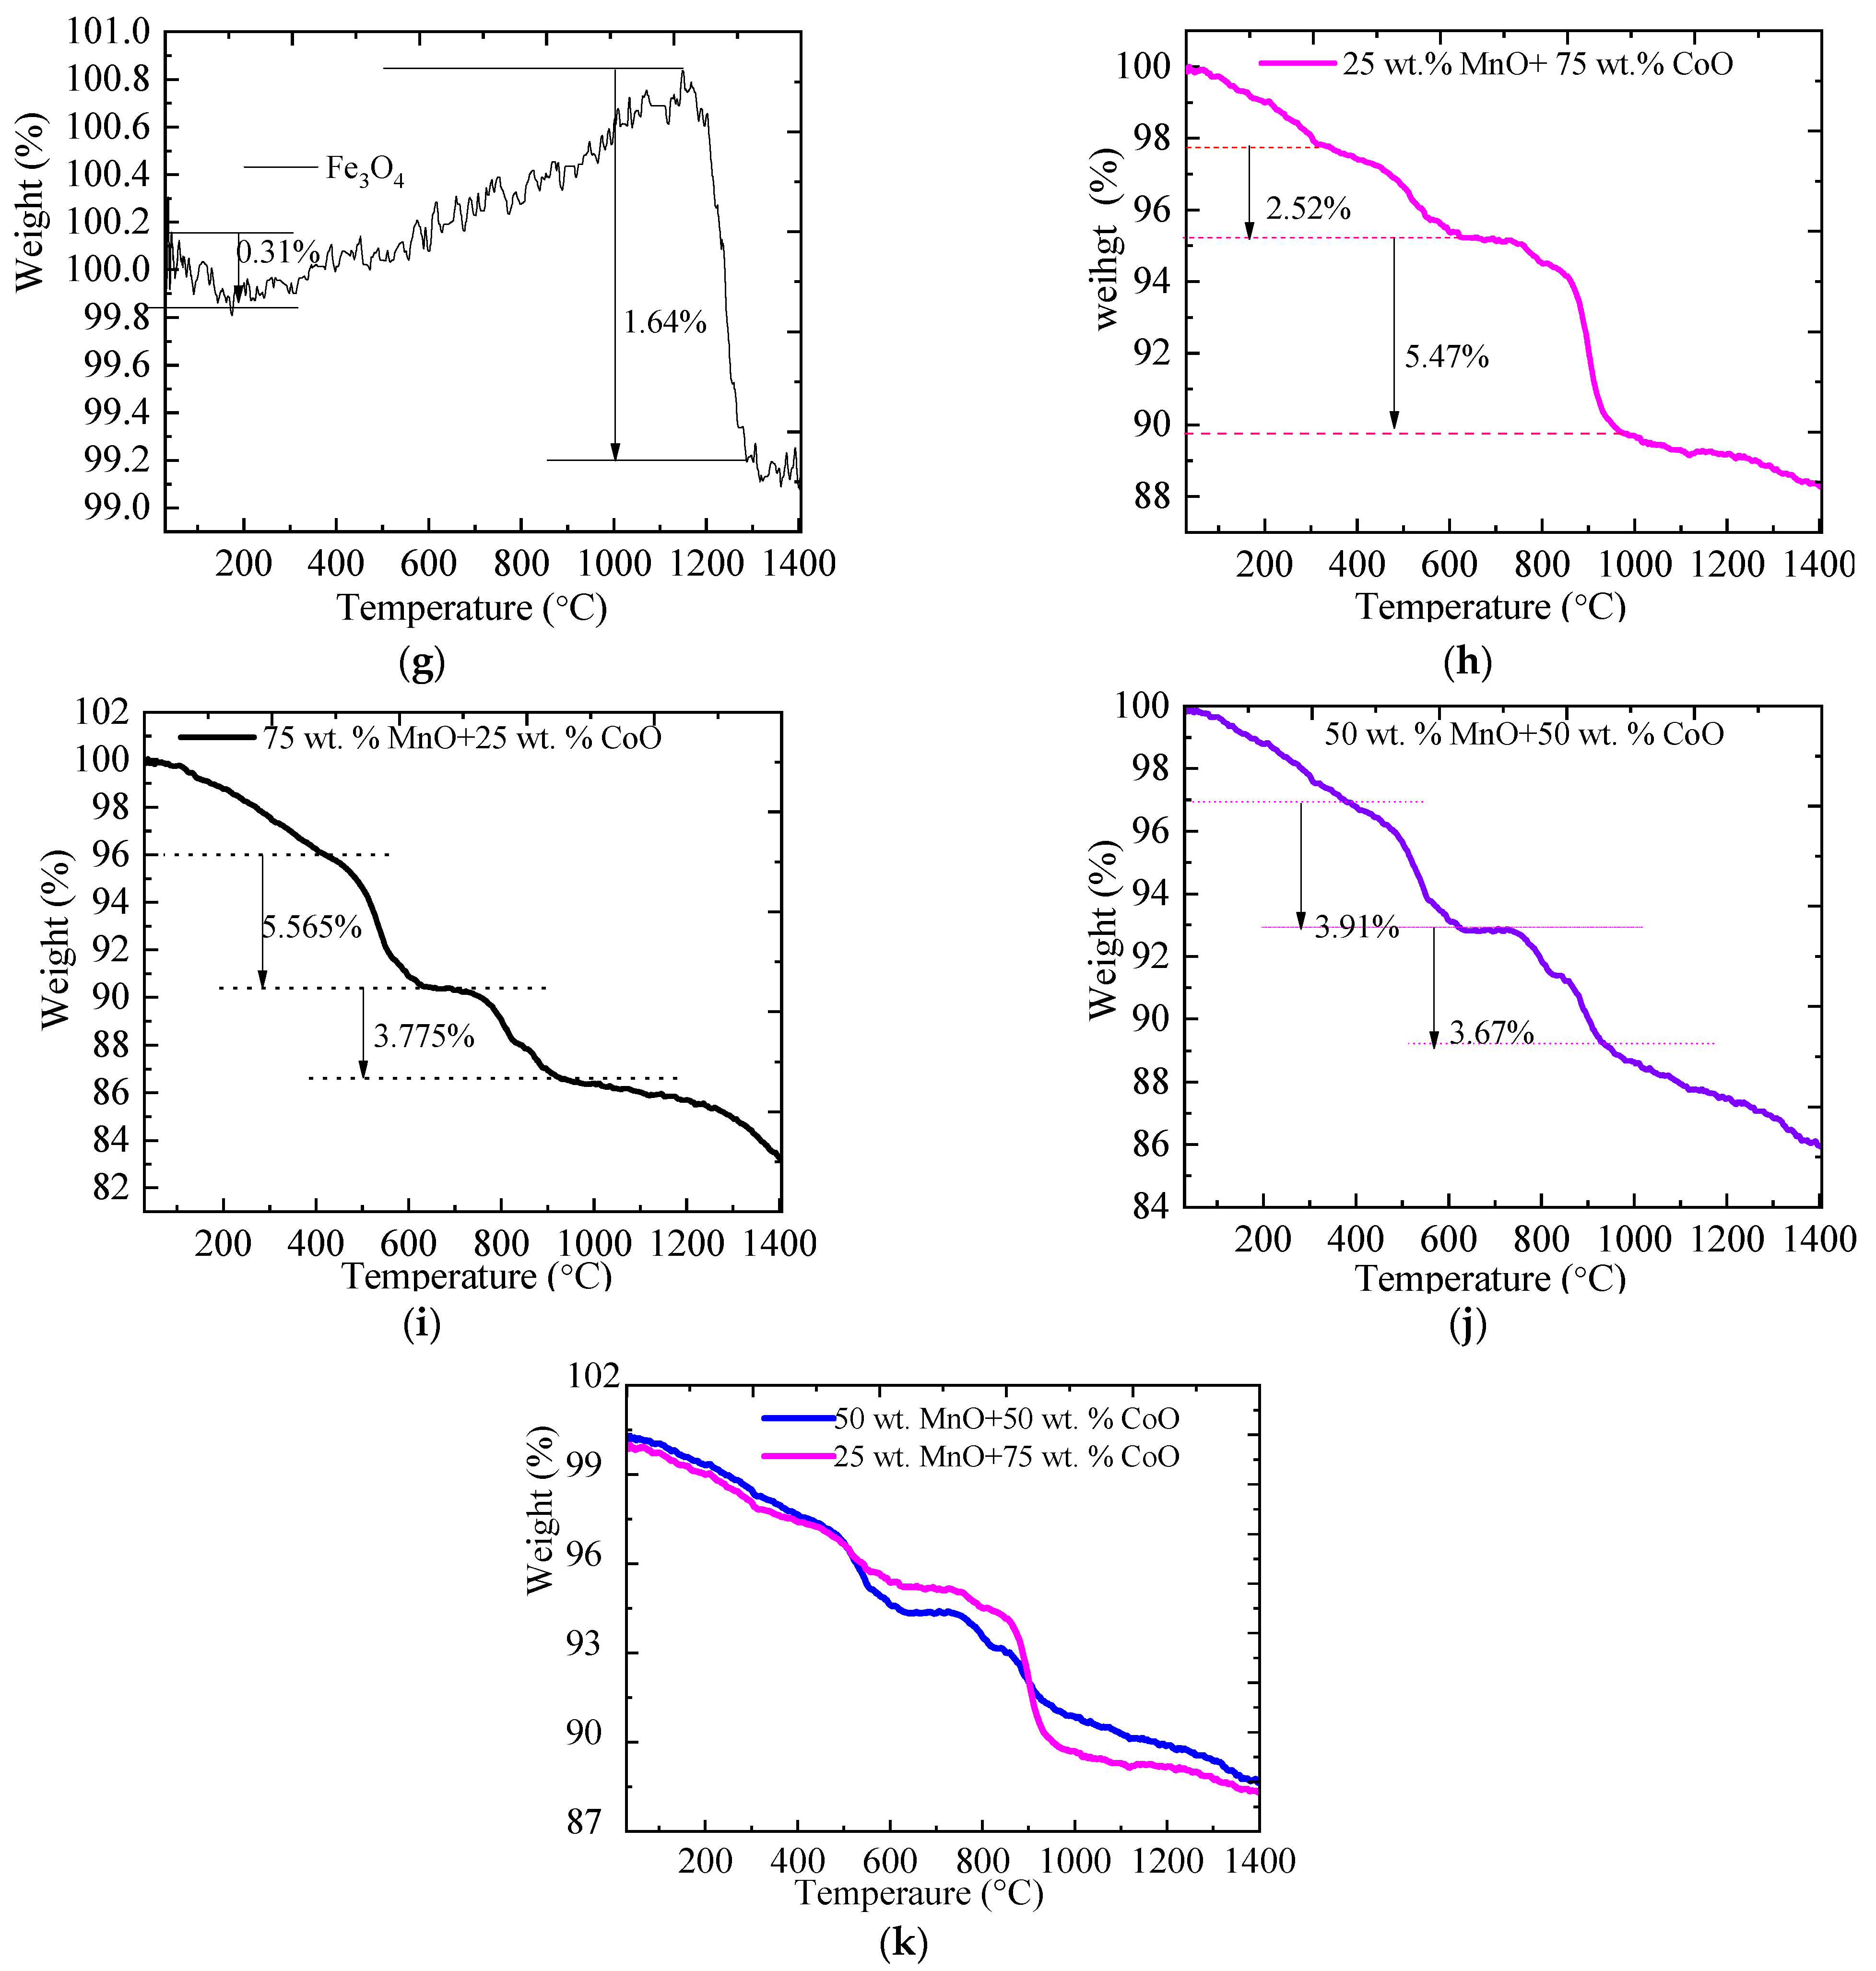
2.1. The TGA of Metallic Oxides during Redox Reactions

From Figure 1a, all the TGA tested results are explained by weight loss % with time of charging and discharging temperature. Figure 1 shows the two cycles that all six materials were heated from room temperature (30 → 1400 °C → 800 → 1400 →800 °C) and different results were observed during the test process. The results were identified using broken lines and stages. In the first stage, as the applied temperature increased for about 30 min, all materials lost weight except Fe3O4. In this stage, the loss was mainly due to the dehydration of water. When the temperature reached 1400 °C in the second stage from 30 to 45 min, except Fe3O4 which gained weight, other materials lost weight due to decomposition. In the third stage from 45 to 75 min, all materials reacted with the oxygen molecules and gained weight. The process of weight gain continued even when the temperature decreased from 1400 to 800 °C during the process of chemical reactions. The weight gained for 100 wt.% CoO and 25 wt.% MnO + 75 wt.% CoO were higher than other materials. In the fourth stage, from 75 to 105 min, while the temperature remained at 800 °C, the weight of 100 wt.% CoO and 25 wt.% MnO + 75 wt.% CoO increased while weights of other materials were constant. In the fifth stage, from 105 to 110 min, the materials were re-heated from 800 to 1400 °C and all materials lost weight and the process was endothermic. In the sixth stage, at 110 to 130 min, the materials were again cooled to 800 °C and the result indicated that all reactions gained weight. However, the weight gained by 100 wt.% Fe3O4, 100 wt.% CoO and 25 wt.% MnO + 75 wt.% CoO were greater than other materials, which underwent similar chemical reaction under the same conditions. As it can be seen in Figure 1b for individual oxides, the reduction onset temperature for Fe-O was higher than CoO and MoO (1061 °C > 465–1360 °C > 200–723 °C). However, the decomposition percentage for weight loss of CoO was far greater than MnO and Fe-O (6.27% >3.7% > 0.31%). The re-oxidation onset temperature for MnO was a little bit greater than Fe-O but higher than CoO, which was (1399 °C > 1393 > 913), respectively. From Figure 1b, it is possible to conclude that CoO needs a high temperature for reduction followed by Fe3O4 as compared to MnO. From Figure 1c the 50 wt.% MnO + 50 wt.% CoO underwent for the two step redox reaction and Figure 1c shows the TGA results for the mixed metallic oxides of 50 wt.% MnO + 50 wt.% CoO and 25 wt.% MnO + 75 wt.% CoO. After for 23 min, 25 wt.% MnO + 75 wt.% CoO recorded a higher weight loss than 50 wt.% MnO + 50 wt.% CoO. From 23 to 40 min of, the weight loss of 50wt.% MnO + 50 wt.% CoO was slightly higher than that of 25 wt.% MnO + 75 wt.% CoO. From 40 to 180 min for both processes as it was observed in Figure 1c, 50 wt.% MnO + 50 wt.% CoO was more stable than 25 wt.% MnO + 75 wt.% CoO. Thus, from the abovementioned results and findings, 50 wt.% MnO + 50 wt.% CoO was found the most stable compared to other metallic oxides. Figure 1c also depicted the temperature at thermal charging step and thermal discharging step during the process. Figure 1d shows the TGA for all computed metallic oxides. From that Figure 1d, Fe3O4 was the least decomposed; CoO underwent a single stage of decomposition, whereas others underwent multi-decomposition stages during the charging process in the first cycle redox reaction. From Figure 1e, CoO underwent an almost single visible stage of reduction and a single stage of dehydration, whereas Figure 1d indicated that MnO underwent multi-stage decomposition. Figure 1e shows the iron reduction reaction events during cycle 1. During the process of Fe3O4 reduction, the dehydration led to 0.31% weight loss, which was smaller than those of MnO and CoO. In the charging of Fe3O4 to 1400 °C, the weight kept increasing until about 1200 °C. Figure 1h depicted the 25 wt.% MnO + 75 wt.% CoO underwent for first step of redox reaction and depicted the 2.52% of the initial weight probably lost due to evaporation and 5.47% of the weight was due to decomposition. Figure 1h depicted multi-stage decomposition. Figure 1i depicted the TGA with temperature and the percentage loss for 75 wt.% MnO + 25 wt.% CoO were 5.565 in the first stage and 3.775 in the second stage. Figure 1i showed the first stage of decomposition was higher than the second stage. This was due to the content of MnO being higher than CoO, and CoO is more vulnerable for decomposition than MnO. Figure 1j depicted the redox for 50 wt.% MnO + 50 wt.% CoO. As it has been seen from Figure 1j the percentage loss were 3.91 and 3.67 in the first- and second-stage decomposition, respectively. Figure 1k shows the TGA for 25 wt.% MnO + 75 wt.% CoO and 50 wt.% MnO + 50 wt.% CoO. From Figure 1k, it was noted that charging temperature (applied temperature) from 30 to 1400 °C with 30 °C/min heating rate led to a significant reduction of 30 mL/min Ar and/min O2, 25 wt.% MnO + 75 wt.% CoO, and all developed significant plateauing in reduction values of 50 wt.% MnO + 50 wt.% CoO around 1000 °C.

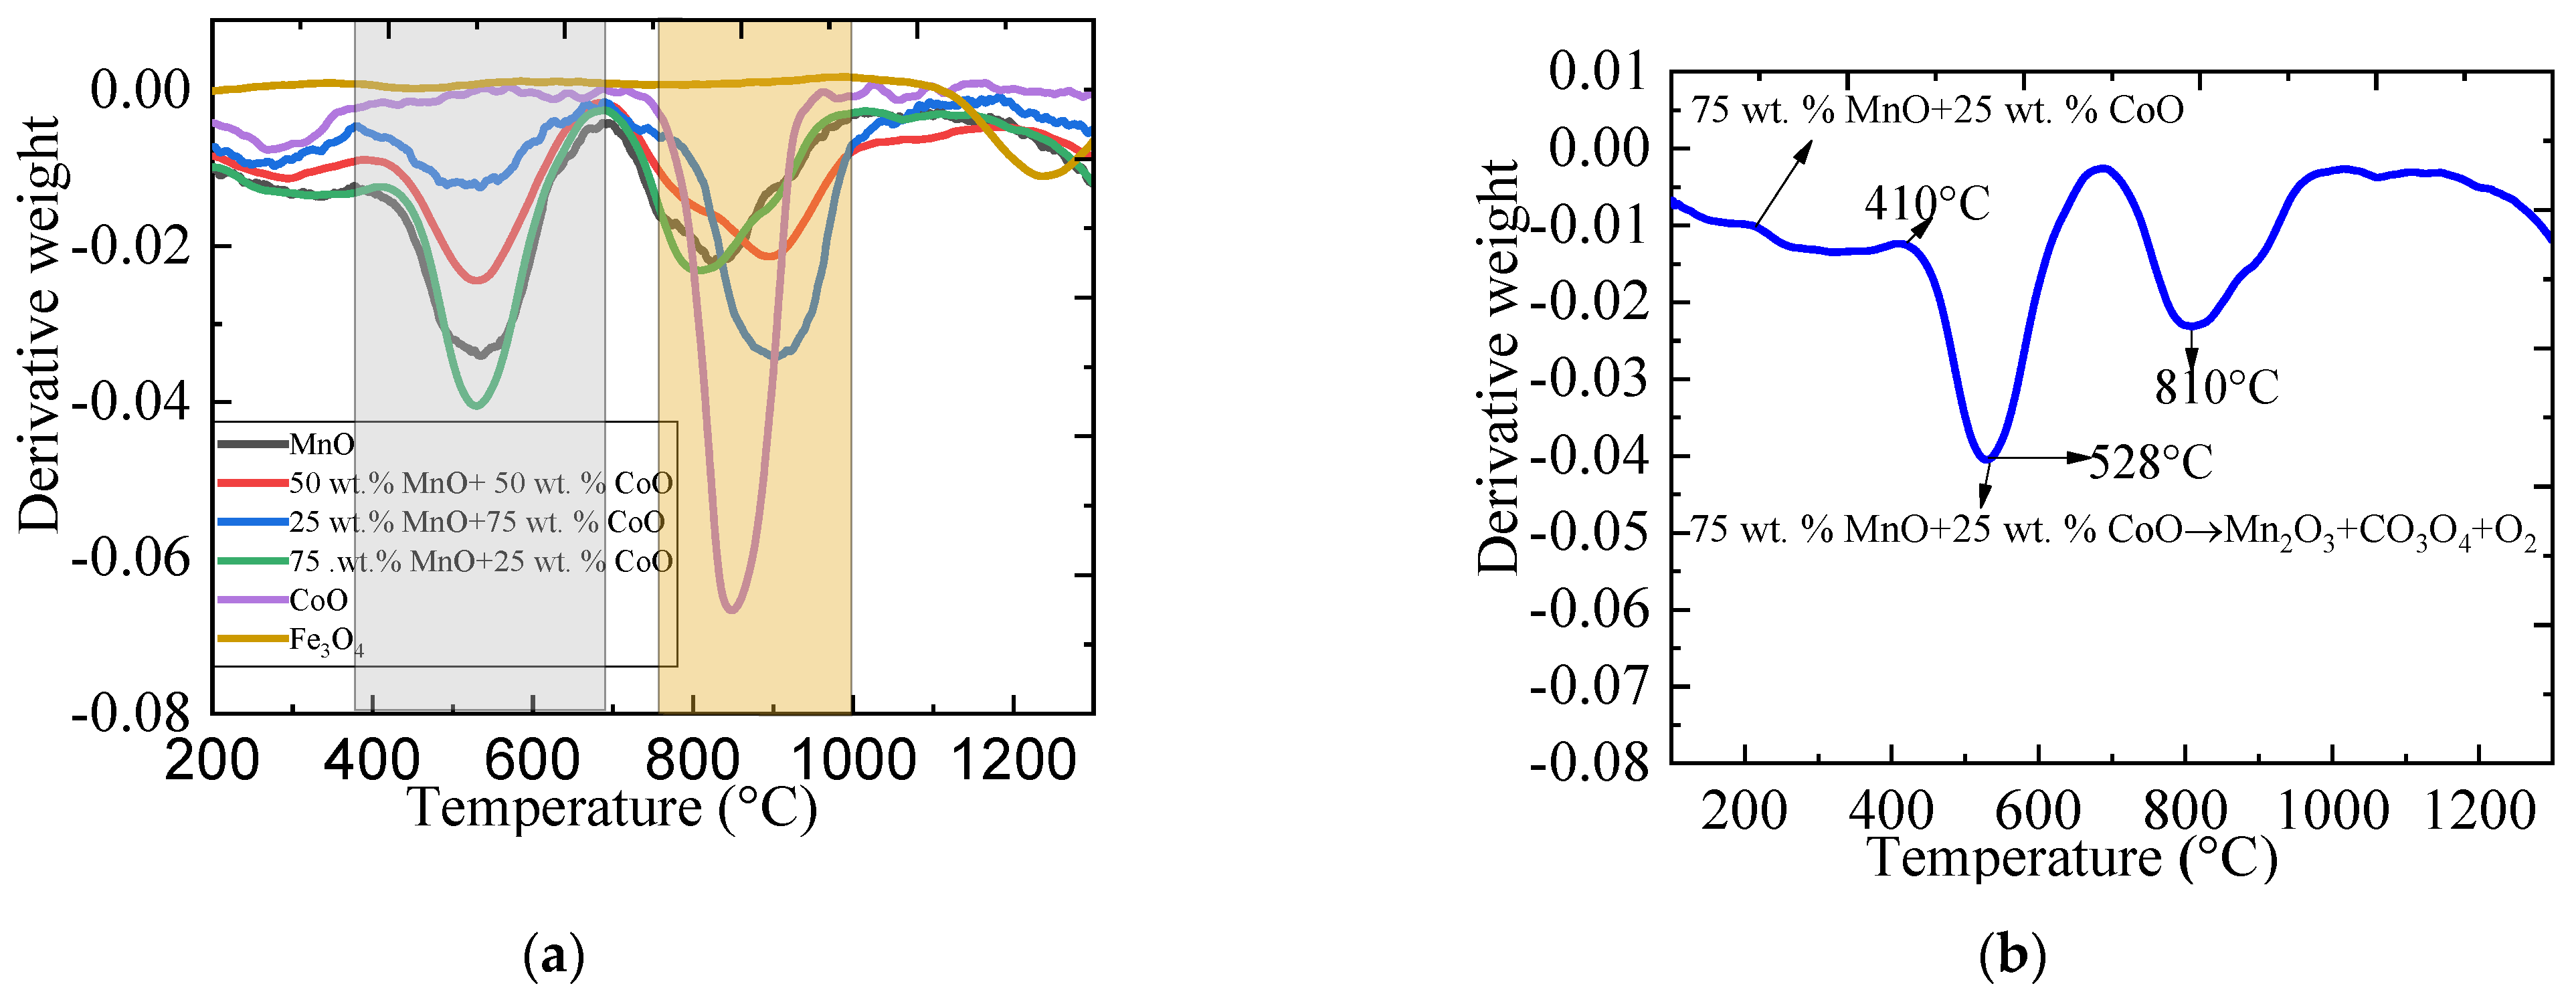
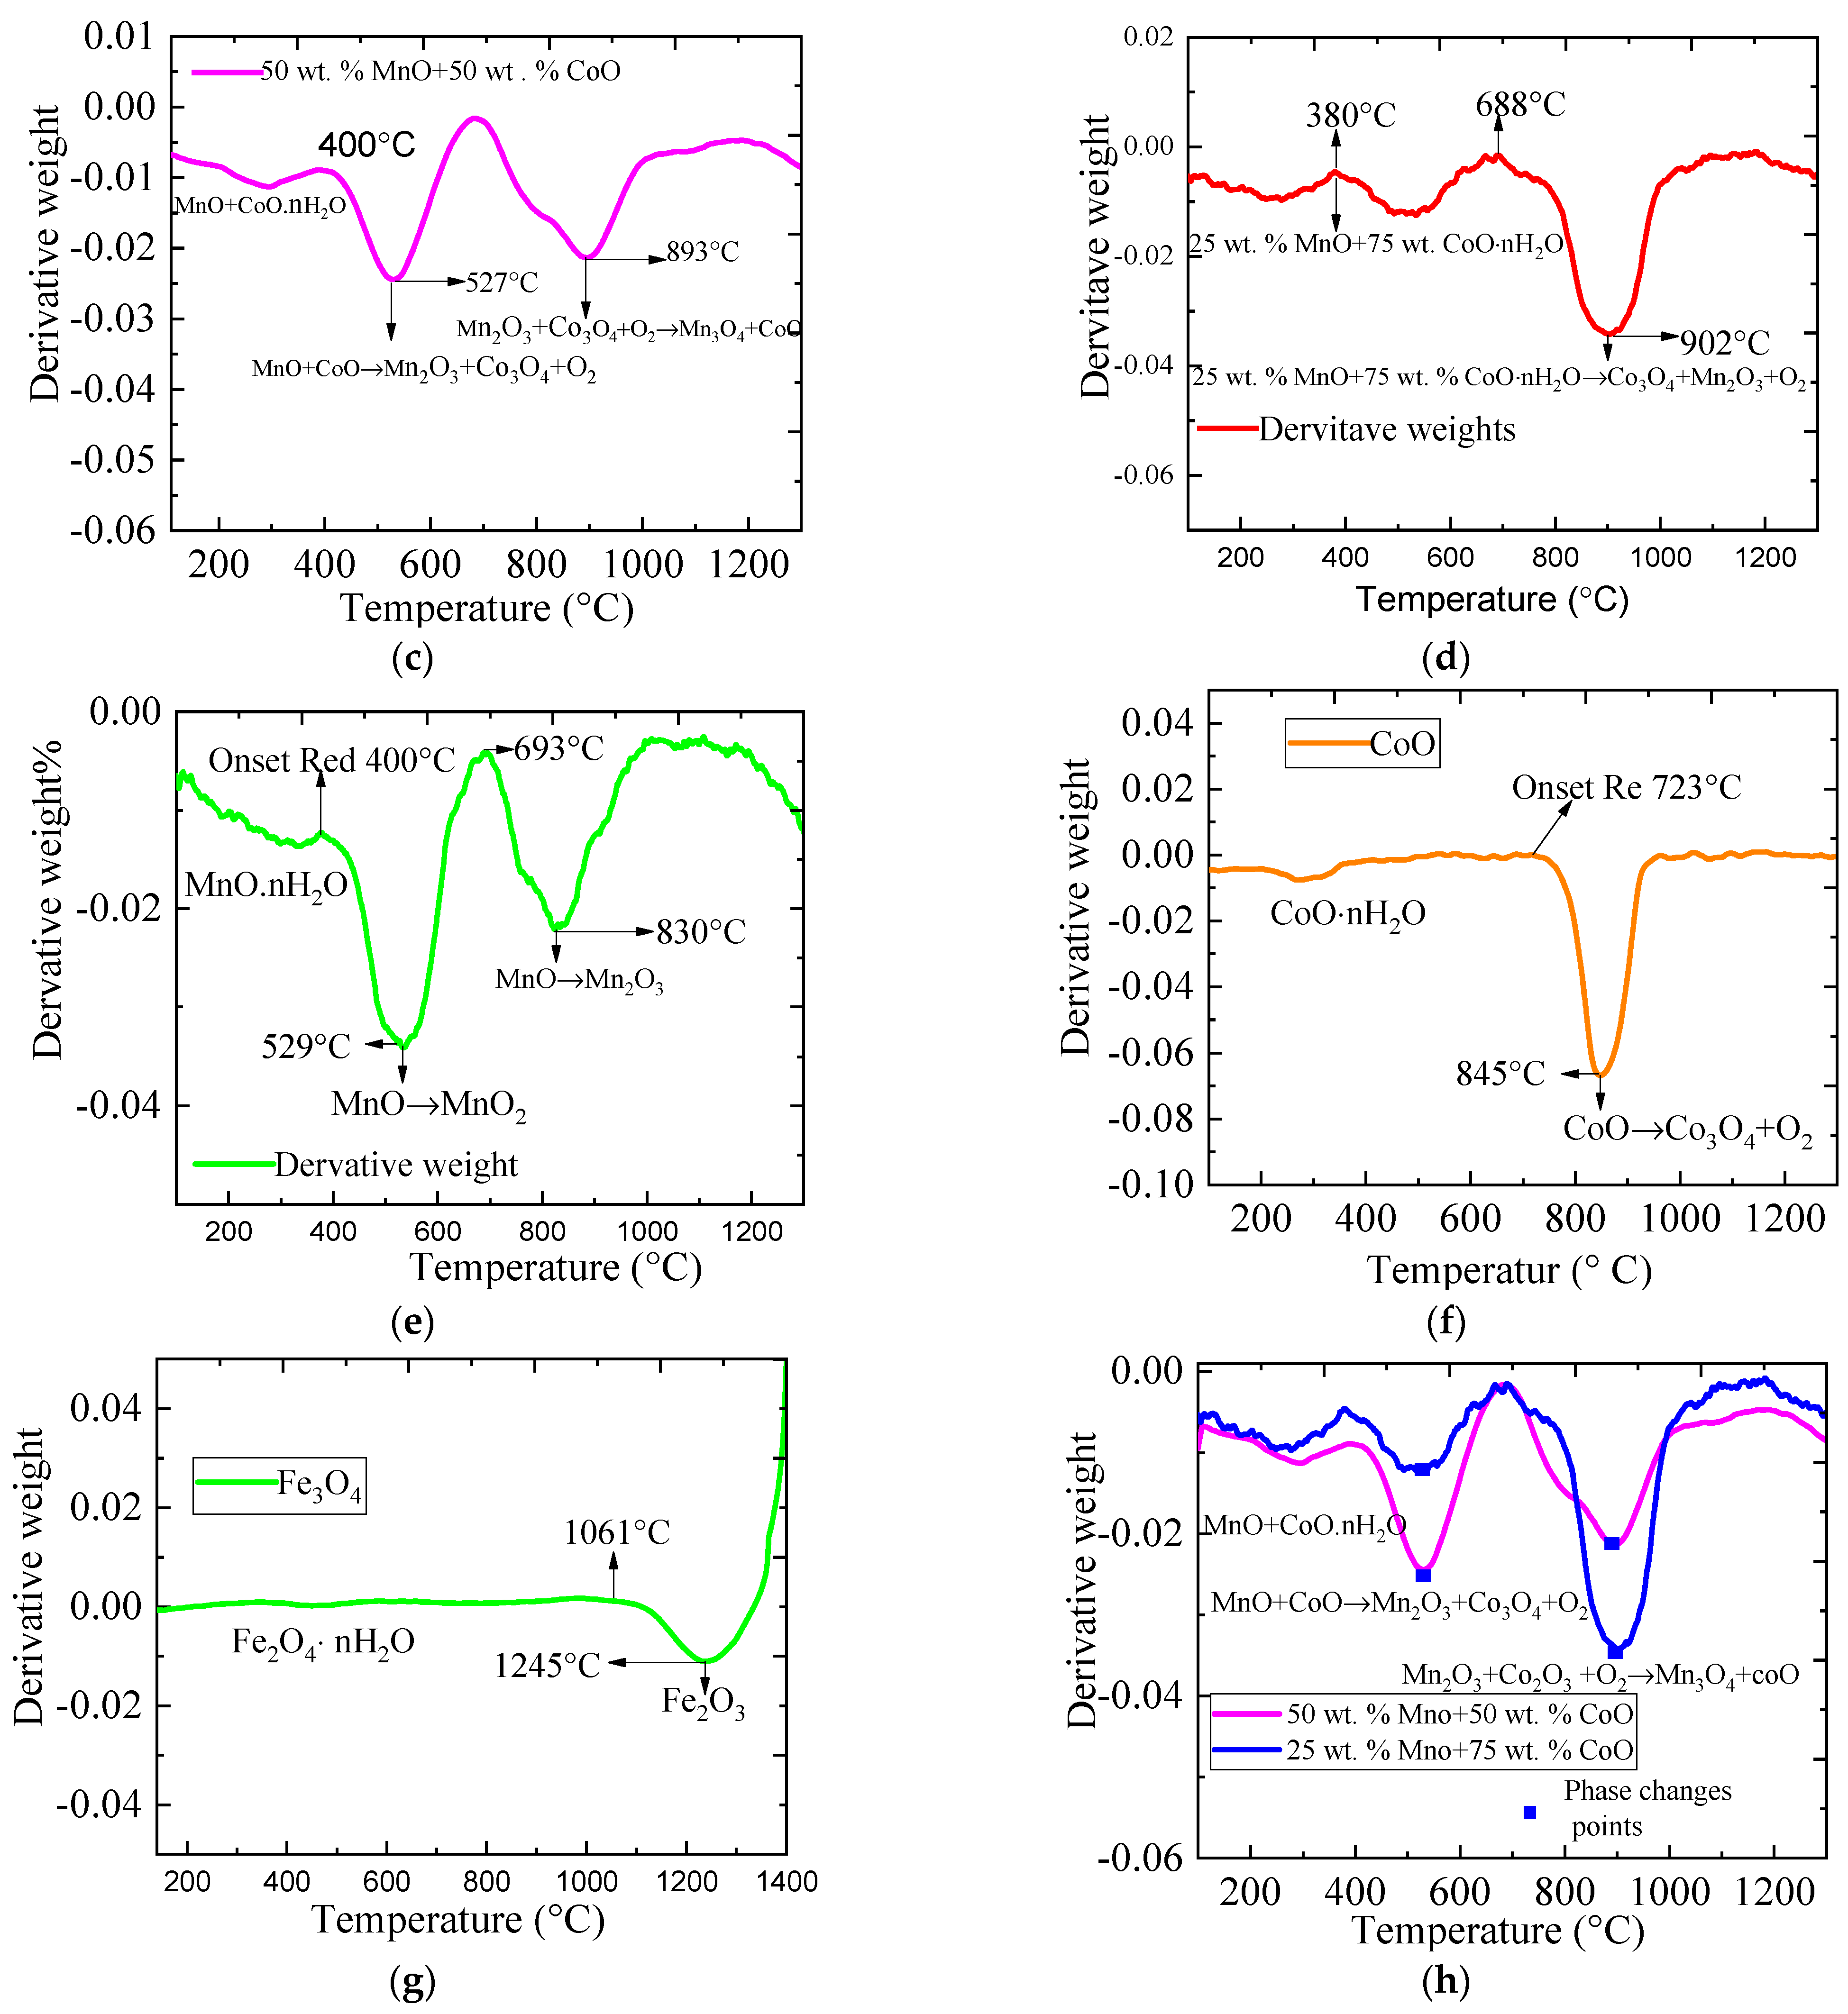
2.2. The Phase Change Conditions Using Weight Derivative Graphs (WDG) on Metallic Oxides during the Redox Reaction

Figure 2a shows the derivative weight for all metallic oxides with charging temperature in the first cycle redox reaction. From that figure, it was noted that unlike iron oxide, which had a phase change temperature occurring at >1200 °C, for other metallic oxides, which were considered in this study, phase change temperature gaps were observed at 400–600 °C and 750–1000 °C. Figure 2b shows the weight derivative of 75 wt.% MnO + 25 wt.% CoO with room to 1400 °C in the first cycle, which revealed that phase changes occurred at 528 °C and 801 °C, respectively. However, it was difficult to show the changing phase reaction products in the TGA analysis because it needs further investigation, like XRD tests for checking whether the phase changing temperatures, which were observed in TGA, belong to reactants products, and what types of products are observed. From Figure 2c, the phase change of 50 wt.% MnO + 50 wt.% CoO was observed at 527 °C and 893 °C, but the reduction of the compound started at 400 °C and Figure 2c clearly shows the stability of the redox reaction in both the second and first steps of the process. From Figure 2d, the derivative weight graph with temperature depicted that the phase change of 25 wt.% MnO + 75 wt.% CoO occurred at 902 °C and reduction of the oxide started at 688 °C. The phase change indicating the critical curve for 25 wt.% MnO + 75 wt.% CoO was sharper than that of 50 wt.% MnO + 50 wt.% CoO, specifically at the second turning curve, which indicated that higher weight losses occurred at this stage. From Figure 2e, the first stage of the derivative weight loss curve of MnO depicted that the weight loss was due to evaporation of water, the second events were observed at 529 °C and 830 °C, respectively, which were the phase change temperatures of MnO. From Figure 2f, the first stage of the reduction step of CoO curve revealed that dehydration occurred. The onset temperature for the reduction was observed at 723 °C and the phase change occurred at 845 °C. From Figure 2g, in the first stages from 200 to 450 °C, Fe3O4 lost its weight by 0.31%, which was also seen in Figure 1g, and decomposition of the iron oxide started around 1061 °C and changed its phase around 1245 °C. From Figure 2b–d, the derivative mixed oxides analysis revealed that the reduction of 50 wt.% MnO + 50 wt.% CoO, 75 wt.% MnO + 25 wt.% CoO and 25 wt.% MnO + 75 wt.% CoO took place at 400 °C, 410 °C, and 688 °C, respectively. From Figure 1b, under Section 3.1, it was seen that the reduction temperatures for MnO and CoO occurred at the same heating and gases flow rates (400 °C and 723 °C, respectively), which were similar to those of mixed oxides of 50 wt.% MnO + 50 wt.% CoO. However, the reduction onset temperature for 50 wt.% MnO + 50 wt.% CoO was less than the parent oxides (MnO and CoO), which was about 420 °C as observed in Figure 2c. However, other mixed oxides revealed higher onset reduction temperatures particularly oxides with more proportion weight of CoO. Figure 2h shows the derivative weight for 50 wt.% MnO + 50 wt.% CoO and 25 wt.% MnO + 75 wt.% CoO. As it has been described in Section 3.1 Figure 1k, Figure 2h also indicates that the 50 wt.% MnO + 50 wt.% CoO was more stable during the reduction-oxidation reactions.

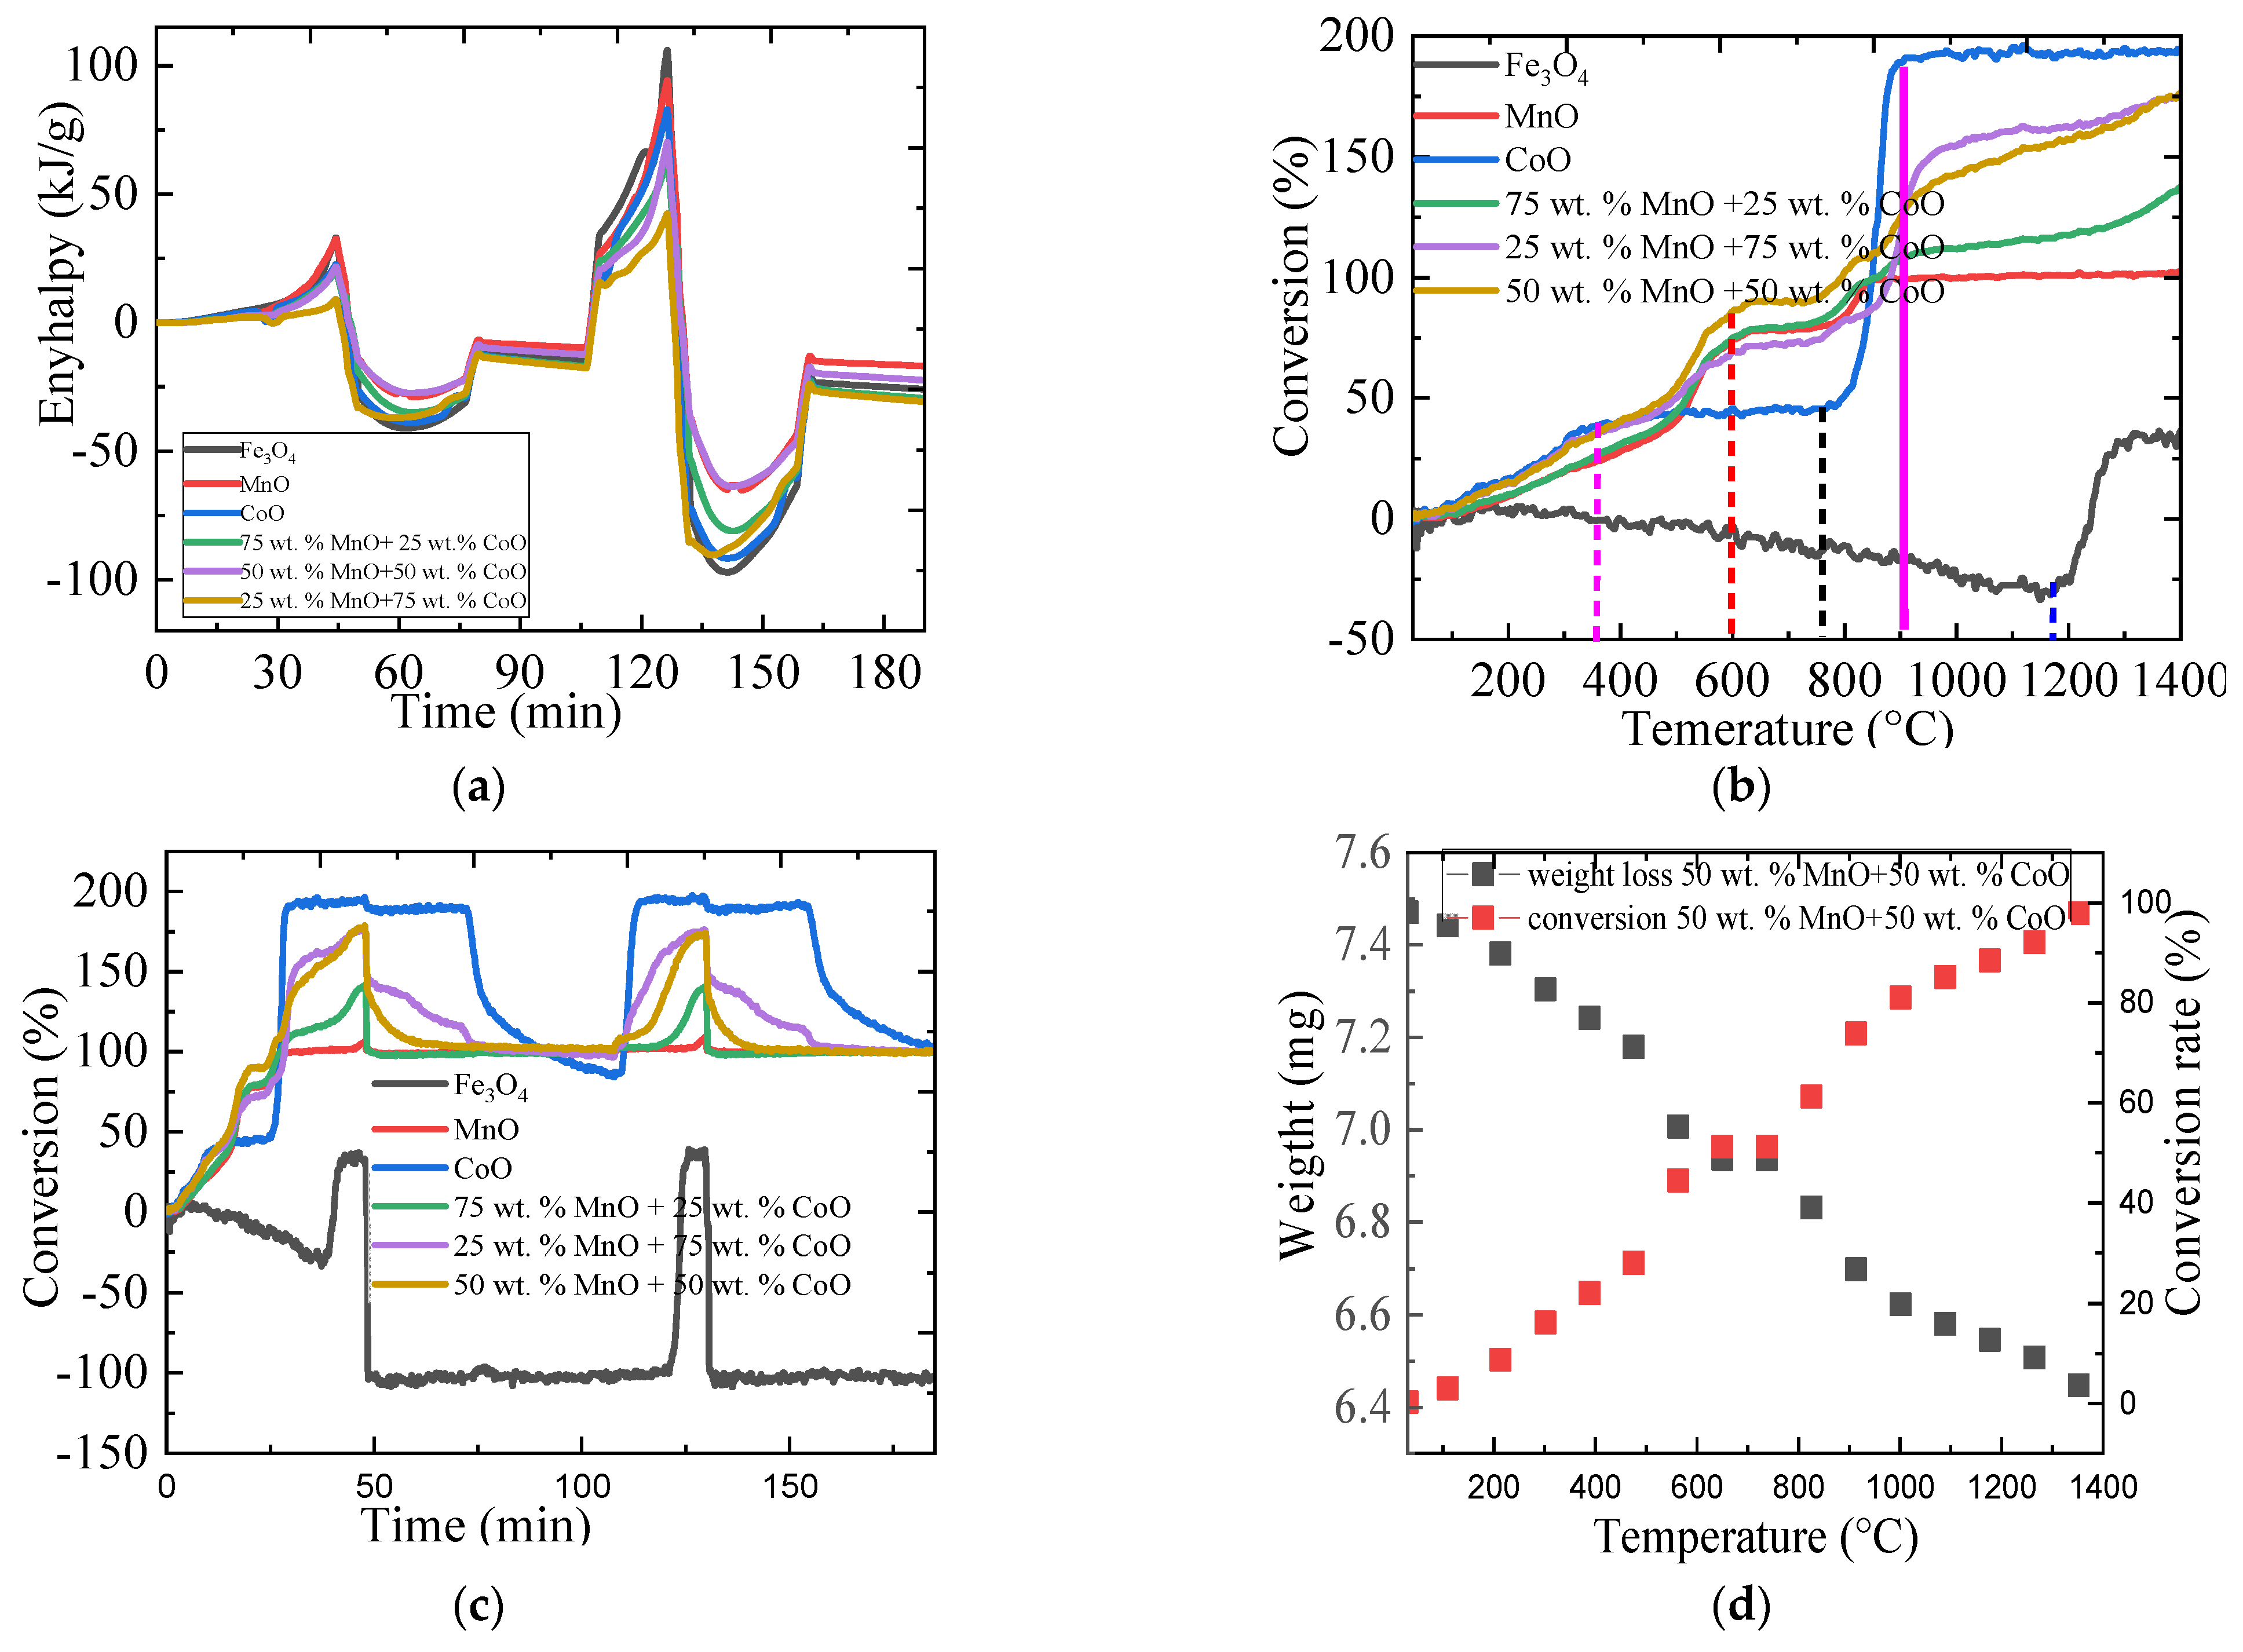
2.3. The Thermal Performance and the Oxygen Uptake of Metallic Oxides

2.3.1. The Thermal Performance of Metallic Oxides

Figure 3a shows the enthalpy accumulated for two-step cyclic redox reaction of all the metallic oxides. During the charging and discharging process Fe3O4, MnO, and 50 wt.% MnO + 50 wt.% CoO had large enthalpies, particularly during discharging, 50 wt.% MnO + 50 wt.% CoO had a higher enthalpy than other pure and mixed metallic oxides. Figure 3b–d shows the conversion rate efficiency of the metallic oxides. Figure 3b shows the conversion rate of the metallic oxides during the heating from room to temperature 1400 °C in the first cycle, of redox reaction. Figure 3c shows conversion rates of all the metallic oxides during the entire cycle redox reaction with time and Figure 3d shows the conversion rate and the TGA of 50 wt.% MnO + 50 wt.% CoO in the first cycle of the redox reaction. Thus, from Figure 3b–d, 50 wt.% MnO + 50 wt.% CoO had stable conversion effect in the redox reaction while CoO had unstable conversion rate in both cycles of the redox reaction. Table 1 shows the onset temperature for reduction, conversion, enthalpy, and phase change temperature of all the metallic oxides during the charging stage in the first cycle. From that table, 50 wt.% MnO + 50 wt.% CoO had the highest conversion and iron oxide had the highest phase change temperature. Table 2 shows the specific energy contents for all the metallic oxides at 952 °C in both the first and second reaction steps. From Table 2, at 952 °C in the first cycle redox reaction, MnO, CoO, 50 wt.% MnO + 50 wt.% CoO, and Fe3O4 had reduction to oxidation percentage ratio of 24.2%, 17.7%, 16.7%, and 16%, respectively, whereas 50 wt.% MnO + 50 wt.% CoO, MnO and Fe3O4 had reduction to oxidation of specific energy density ratio 41.5%, 55.2%, 48.2%, respectively during the second redox cycle. From Table 2, it was observed that the second cycle redox reaction had more energy exchange than the first had and 25 wt.% MnO + 75 wt.% CoO had the least specific energy density ratio at 952 °C (6.7 kJ/g and 23.1 kJ/g) in the first and second cycle, respectively. Figure 3e shows the endothermic and exothermic phases of 50 wt.% MnO + 50 wt.% CoO during redox reaction in the first cycle.
However, the standard enthalpy values for iron(II, III) oxide, Mn(II) oxide and Co(II) are −1118.4, −248.9 and −237.9 kJ respectively.

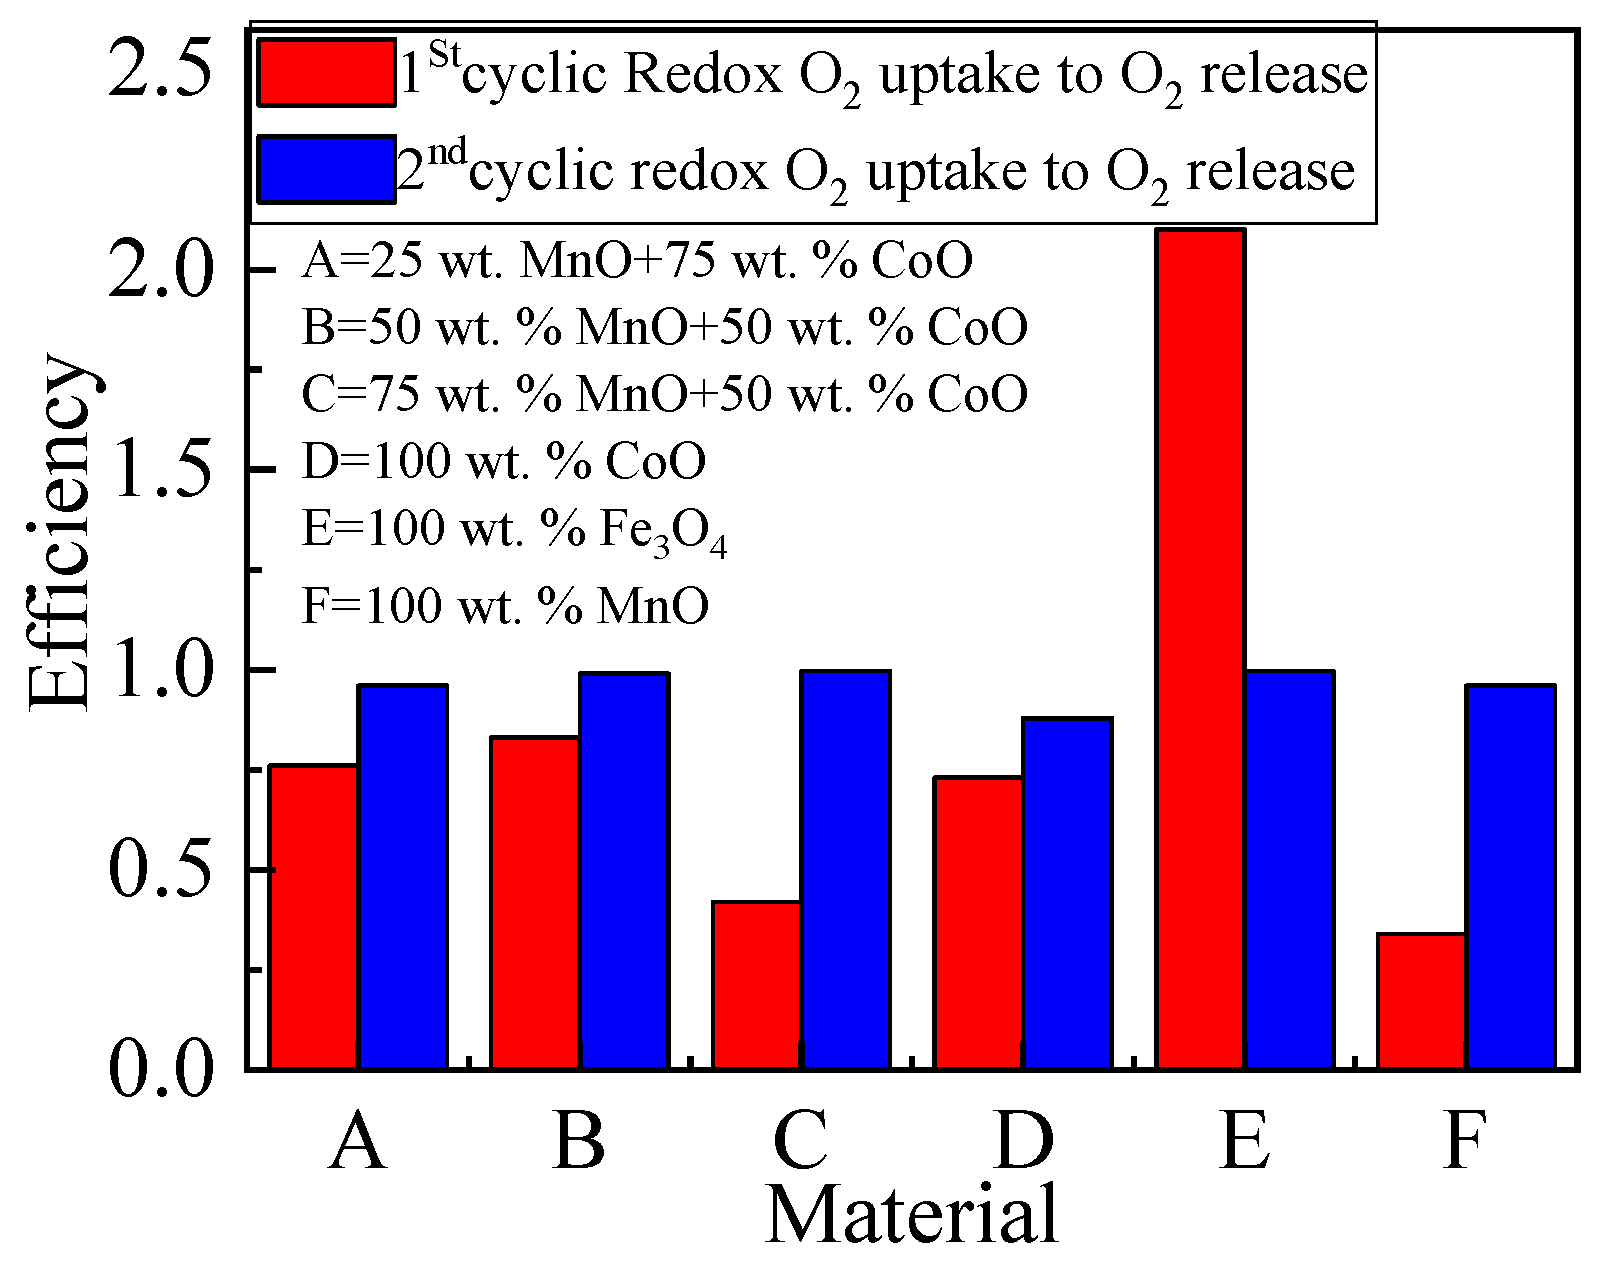
2.3.2. The Oxygen Storage Capacity of Metallic Oxides

Figure 4 shows the efficiency for oxygen uptake and release ratio during redox reactions. The uptake and release of oxygen by all the metallic oxides during the two-cycle re-dox reaction derived from TGA are shown in Table 3. Fe3O4, 50 wt.% MnO + 50 wt.% CoO, and 25 wt.% MnO + 75 wt.% CoO had oxygen uptake values of 2.1, 0.830, and 0.760, respectively in the first cycle and 0.997, 0.996, and 0.960, respectively in the second cycle. Increase in oxygen uptake implies increase in energy storage. Thus, this finding indicates that the aforementioned materials had good energy storage efficiency. For the mixed oxides, 50 wt.% MnO + 50 wt.% CoO was found to have good thermochemical energy storage capacity as its oxygen uptake to release ratio values in both cycles were 0.830 and 0.996. For the pure oxides, iron oxides had the highest oxygen uptake in both cycles (2.1 and 0.997). This result related to the findings in Section 3.1 and Section 3.2, which revealed that the mass of iron oxide increased during the charging stage. Figure 3 shows the efficiency of oxygen uptake capacity of the pure metallic and mixed oxides. According to that figure and Table 2, iron oxide had the highest oxygen uptake in the first cycle. As revealed, oxygen uptake capacity ratio of 0.86, and 0.96 in the first and second cycles, respectively. Thus, 50 wt.% MnO + 50 wt.% CoO was selected for the next stage, which involved both stability and energy capacity analysis, and Fe3O4 had the oxygen uptake to oxygen release capacity ratio (2.1, 0.997) cycle 1 and cycle 2 during redox, respectively.

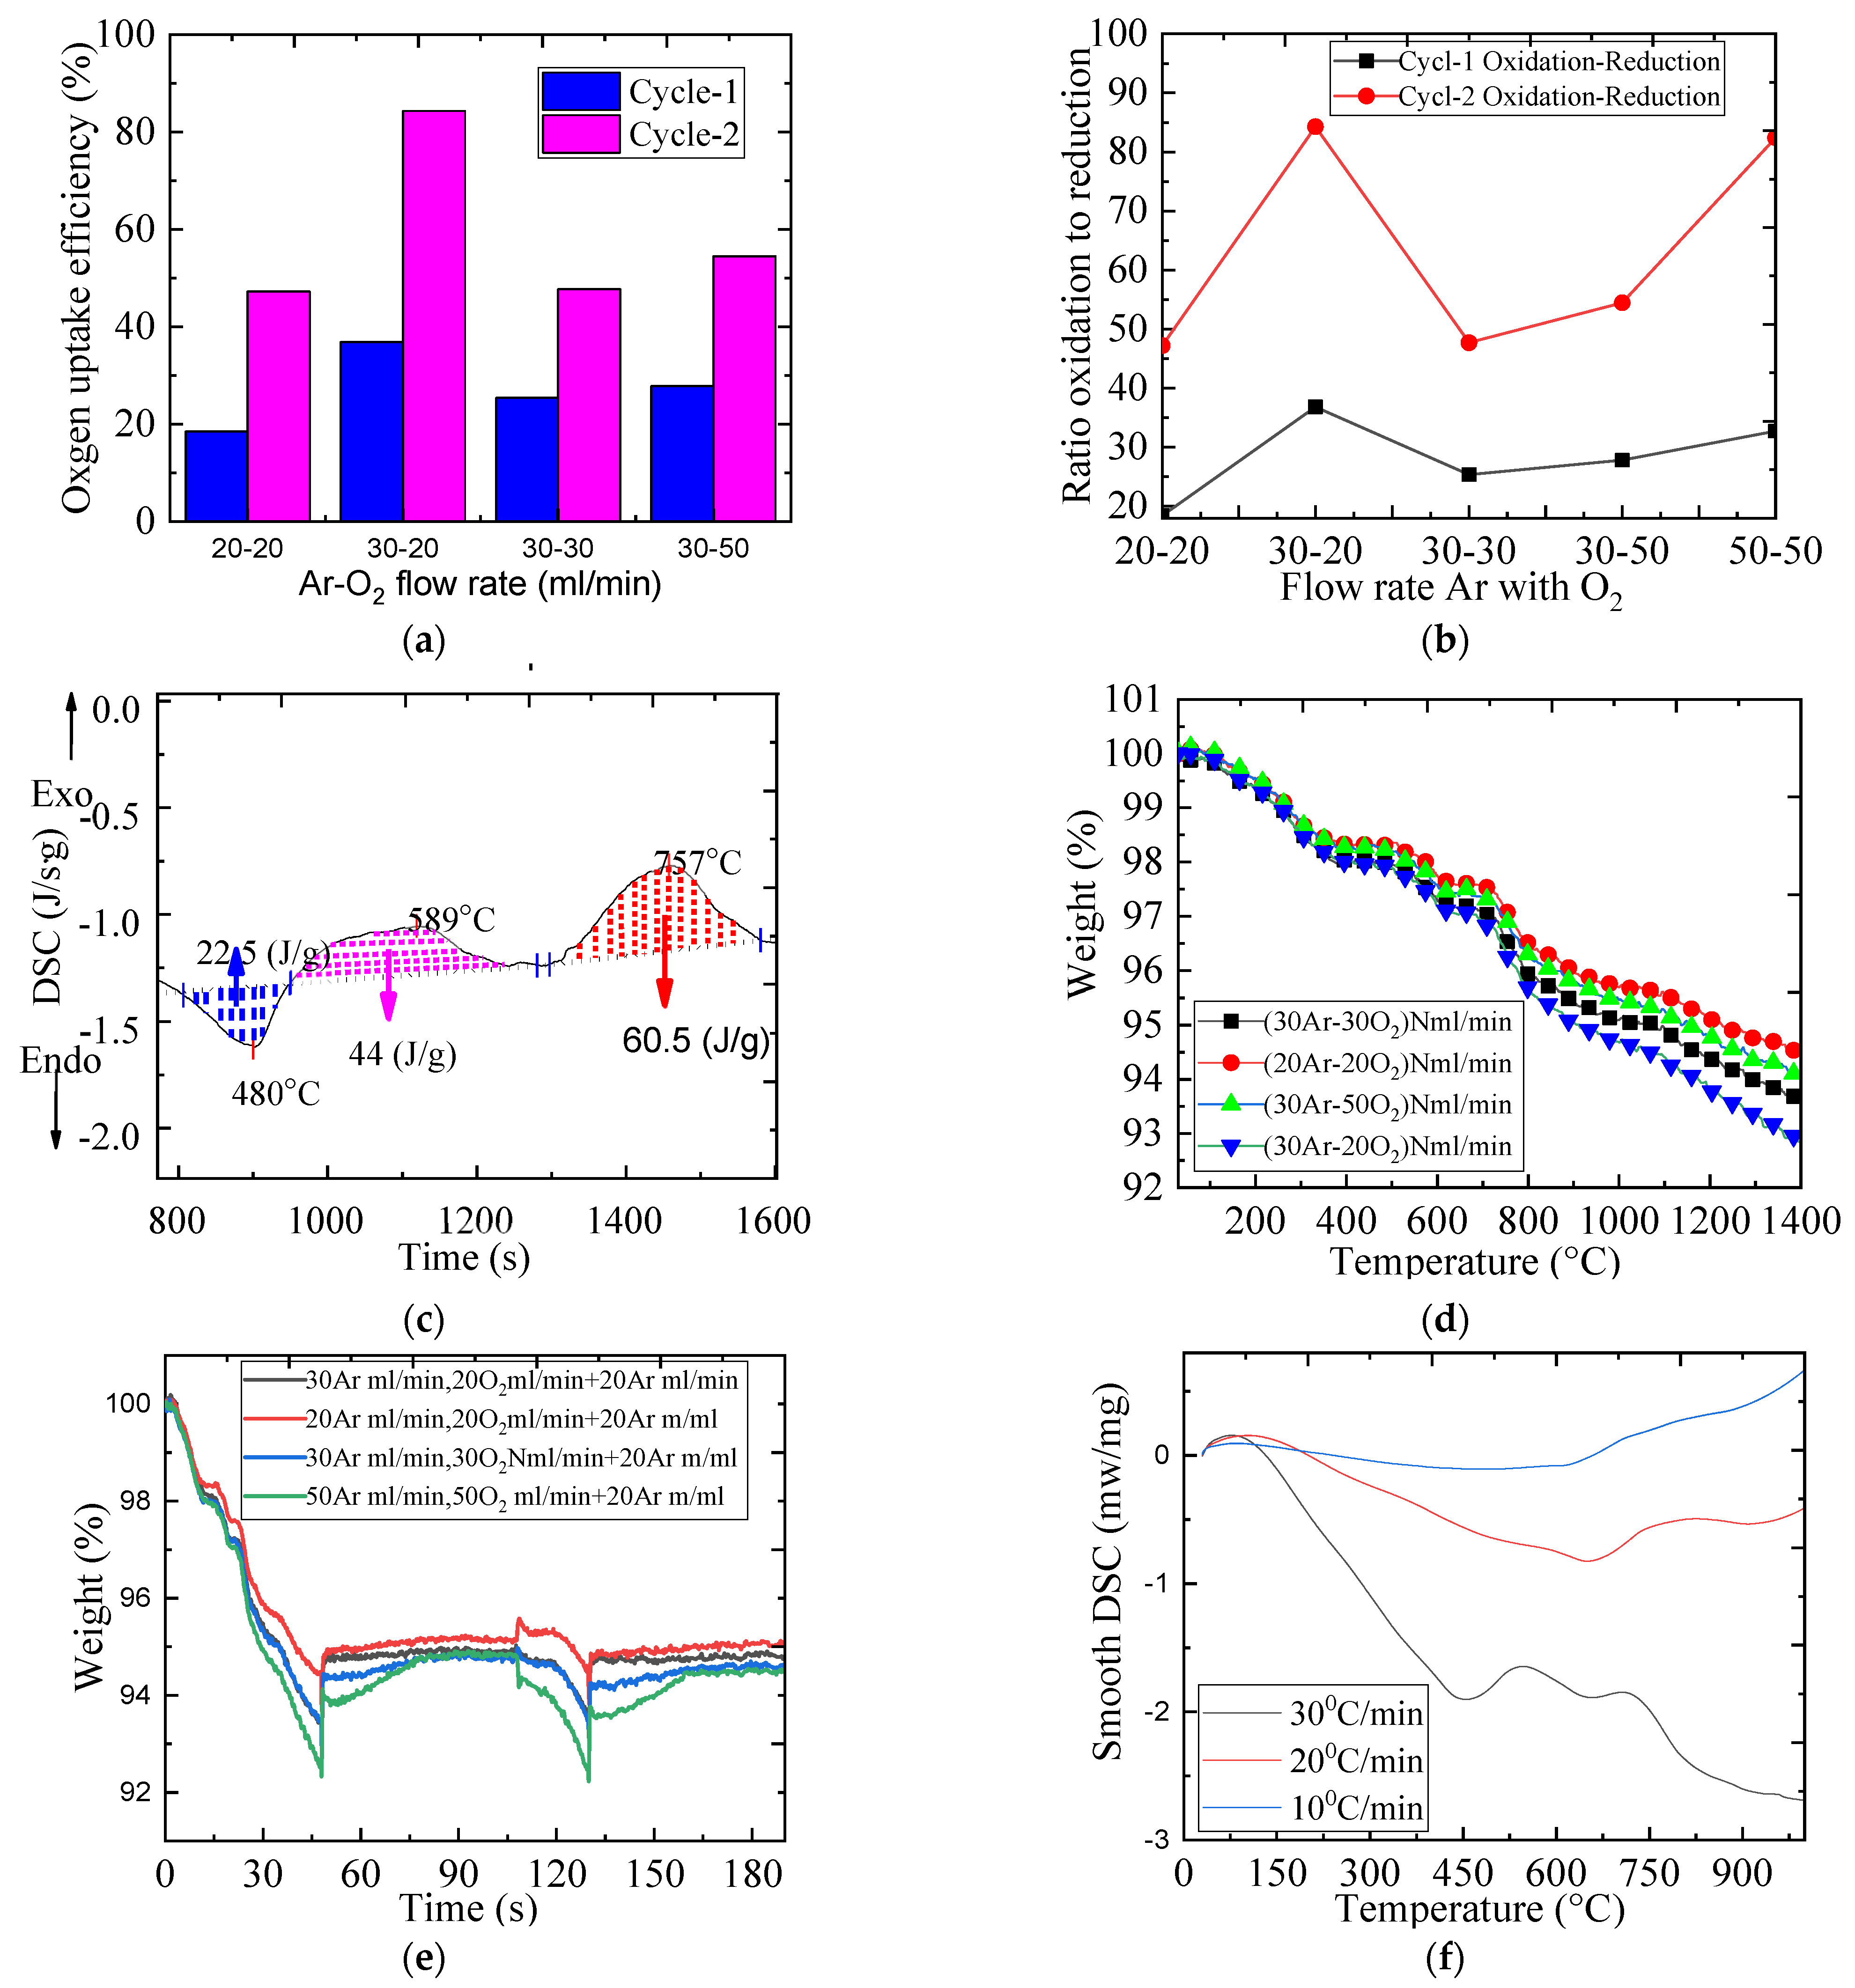
2.4. The Impact of Gas Flow Rate on the Redox Reaction

From Table 4 the (Fe,Co,Mn)Ox material was tested for different Ar and O2 flow rates during the heating–cooling processes of the redox reaction. Consequently, 30 mL Ar-20 mL O2/min gas flow rate was appropriate for stable and high oxygen uptake. Figure 5a shows the impacts of applied the different combined argon and oxygen gases flow rate on (Fe,Co,Mn)Ox. From that Figure 5a, it was observed that the cyclic reduction reaction elicited by 30 mL Ar-20 mL O2/min gas flow rate had great contributions to oxygen uptake. Figure 5b shows the influence of Ar and O2 flow rates on redox reaction kinetics. From that figure, it was revealed that keeping Ar gas flow rate constant and altering the oxygen flow resulted in constant O2 uptake in cycle 1 and slightly constant uptake in cycle 2. Figure 5c shows the DSC analysis of (Fe,Co,Mn)Ox redox with time and the endothermic-exothermic thermal process along with phase change of temperature at 30 mL Ar/min-20 mL O2/min gas flow rate. Figure 5d shows the weight loss during redox reaction for different values Ar and O2 flow rates during the charging step. From Figure 5d, the 30 mL Ar-20 mL O2/min combined gas flow rates on (Fe,Co,Mn)Ox increased weight loss when compared with other combined gas flow rates. Figure 5e shows the weight loss for four types of combined Ar- O2 flow rates for both cycles. Figure 5f shows the heat flow curve with the charging temperature. From Figure 5e,f, it was revealed that 30 mL Ar-20 mL O2/min gas flow rate depicted stable redox reaction for the (Fe,Co,Mn)Ox material.

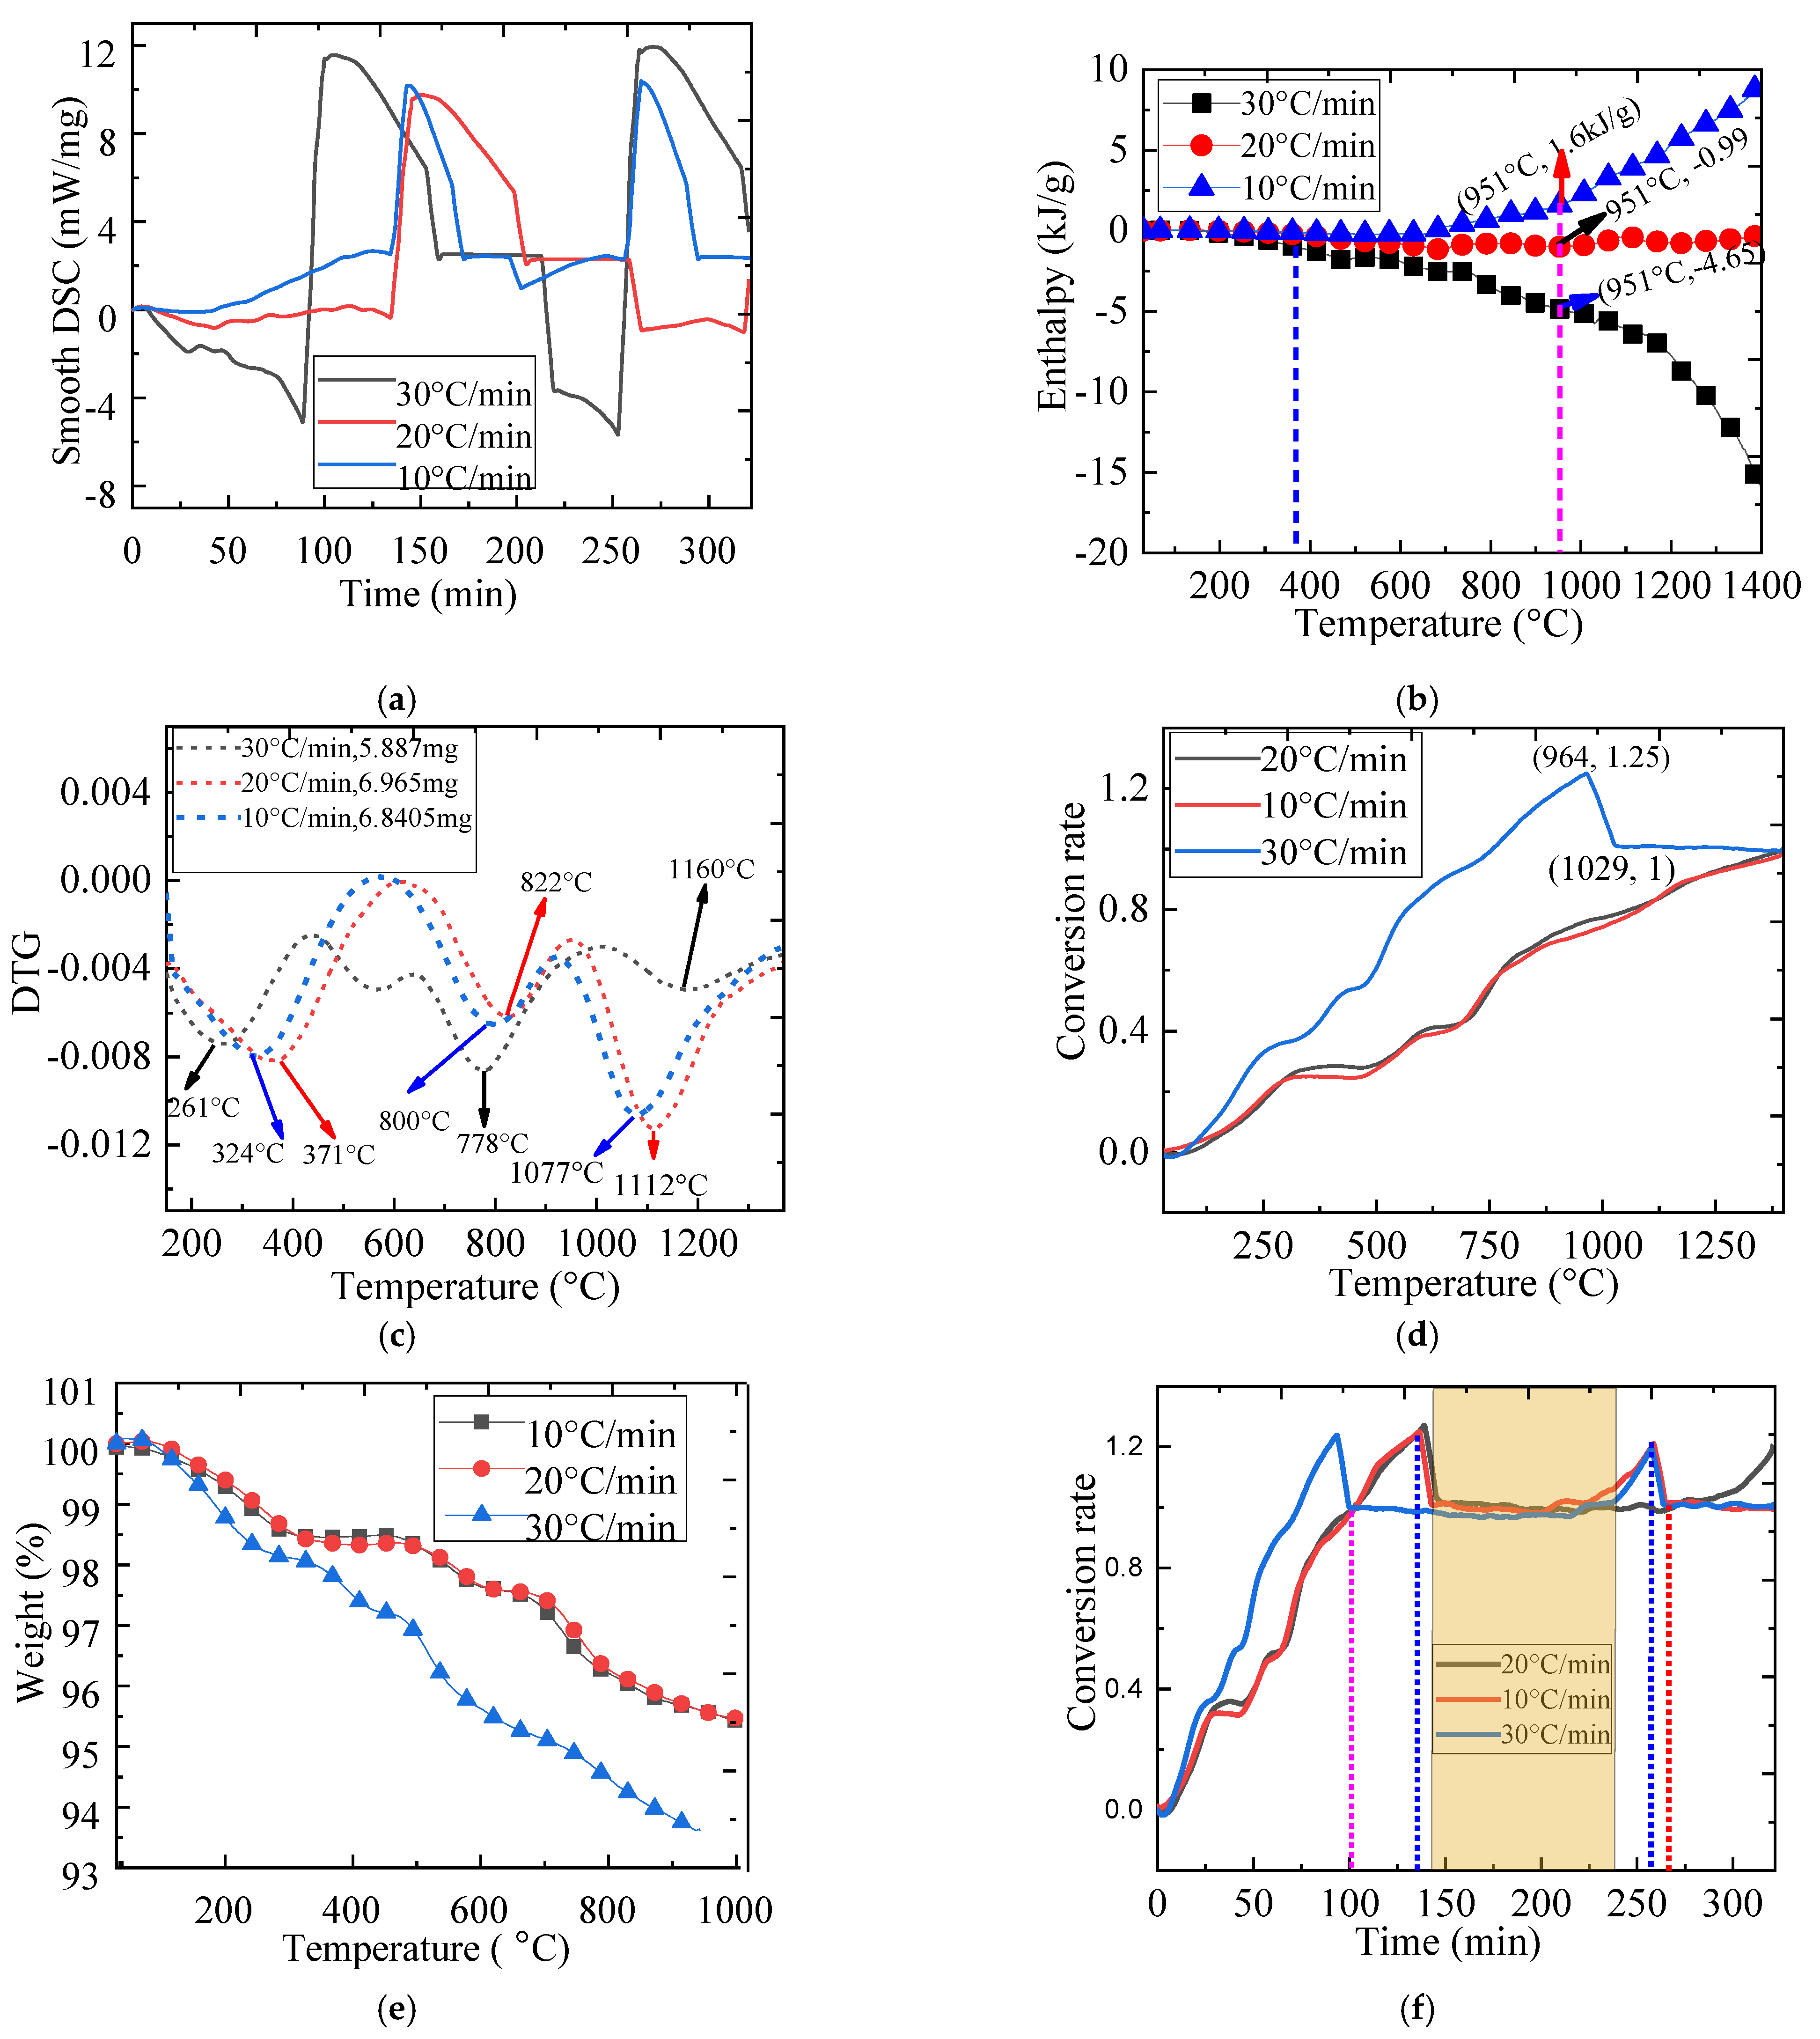
2.5. The Effect of Heating Rate on Redox Reaction

Heating rate is one of the determinant factors that affect the redox reaction of metallic oxides. Figure 6a shows the smooth DSC analysis of the effect of different heating rates on the (Fe,Co,Mn)Ox material as a function of time. As observed from Figure 6a, during the charging process, heating rate at 30 °C/min that was applied during redox shifts to negative than other heating rates at the time of 87 min and the flow heat increase sharply at 100 min. The redox reaction rate at 10 °C/min dominated that of 20 °C/min for about 143 min. However, from 143 to 243 min reaction time, the redox reaction at 20 °C/min dominated that of 10 °C/min heating rate. From 243 to 300 min reaction time, redox reaction at 20 °C/min heating rate was lower than that of 10 °C/min heating rate. Since 30 °C/min heating rate has impacted the TGA machine, there had been additional 20mL/min argon flow during charging at 1400 °C and discharging at 800 °C. However, the addition of Ar gas affected the decomposition rate of the (Fe,Co,Mn)Ox material, as it shifted the enthalpy to the negative region as shown in Figure 6b. From Figure 6b, comparing the heat flow rates (10, 20, 30 °C/min) at 951 °C, the (Fe,Co,Mn)Ox material had 1.6 kJ/g, −0.99kJ/g, and −4.65 kJ/g, respectively. From 400 to 1400 °C during charging, the 20 °C/min heating rate affected the metallic oxides smoothly and without altering enthalpy, whereas 10 °C/min heating rate diverged to the highly positive enthalpy region and 30 °C/min rating diverged to the highly negative enthalpy region. Figure 5c shows the derivative weight during the charging process from 30 to 1400 °C. From that Figure 5c, the phase change indicator temperature is shown on the critical curves for the different values of heating rates. For 30 °C/min heating rate case, the phase change values temperature for the redox were 261, 778, and 1160 °C; at 20 °C/min heating rate the values were 371, 822, and 1112 °C, and at 10 °C/min heating rate for the values were 324, 800, and 1077 °C. Thus, the phase change temperature values for the metallic oxides subjected to 20 °C/min heating rate were generally higher than those at 10 °C/min heating rate. In the early stage of the redox reaction, the onset temperature corresponded to heating rate in the order 30 < 10 < 20 °C/min. Figure 5e shows the weight loss with corresponding charging temperature-axis and it revealed that decomposition reaction at 30 °C/min heating rate was higher than those of 10 °C/min and 20 °C/min heating rates. Figure 6d shows the weight loss with corresponding charging temperature-axis and it revealed that decomposition reaction at 30 °C/min heating rate was higher than those of 10 °C/min and 20 °C/min heating rates. Figure 6e shows the conversion rate for the (Fe,Co,Mn)Ox material at different heating rates. It revealed that increase in temperature at 30 °C/min heating rate attained a conversion rate of 1.25 at 964 °C, which sharply decreased to 1 at 1029 °C. Figure 6f shows the conversion rate the whole redox reaction process. It revealed that conversion rate increased sharply for about 91 min of the redox process started, and sharply decreased when it reached at 100 min then became constant until to 236 min, increased at 258 min and decreased at 266 min and then became constant afterwards. It was also be deducted from that figure that the conversion rates during 10 °C/min and 20 °C/min heating rates overlapped except between 206 to 208 min. The conversation rate during 10 °C/min heating rate was higher than that during 20 °C/min heating rate. In addition, from 287 to 320 min, the conversion rate during 20 °C/min heating rate was higher than that during 10 °C/min heating rate.

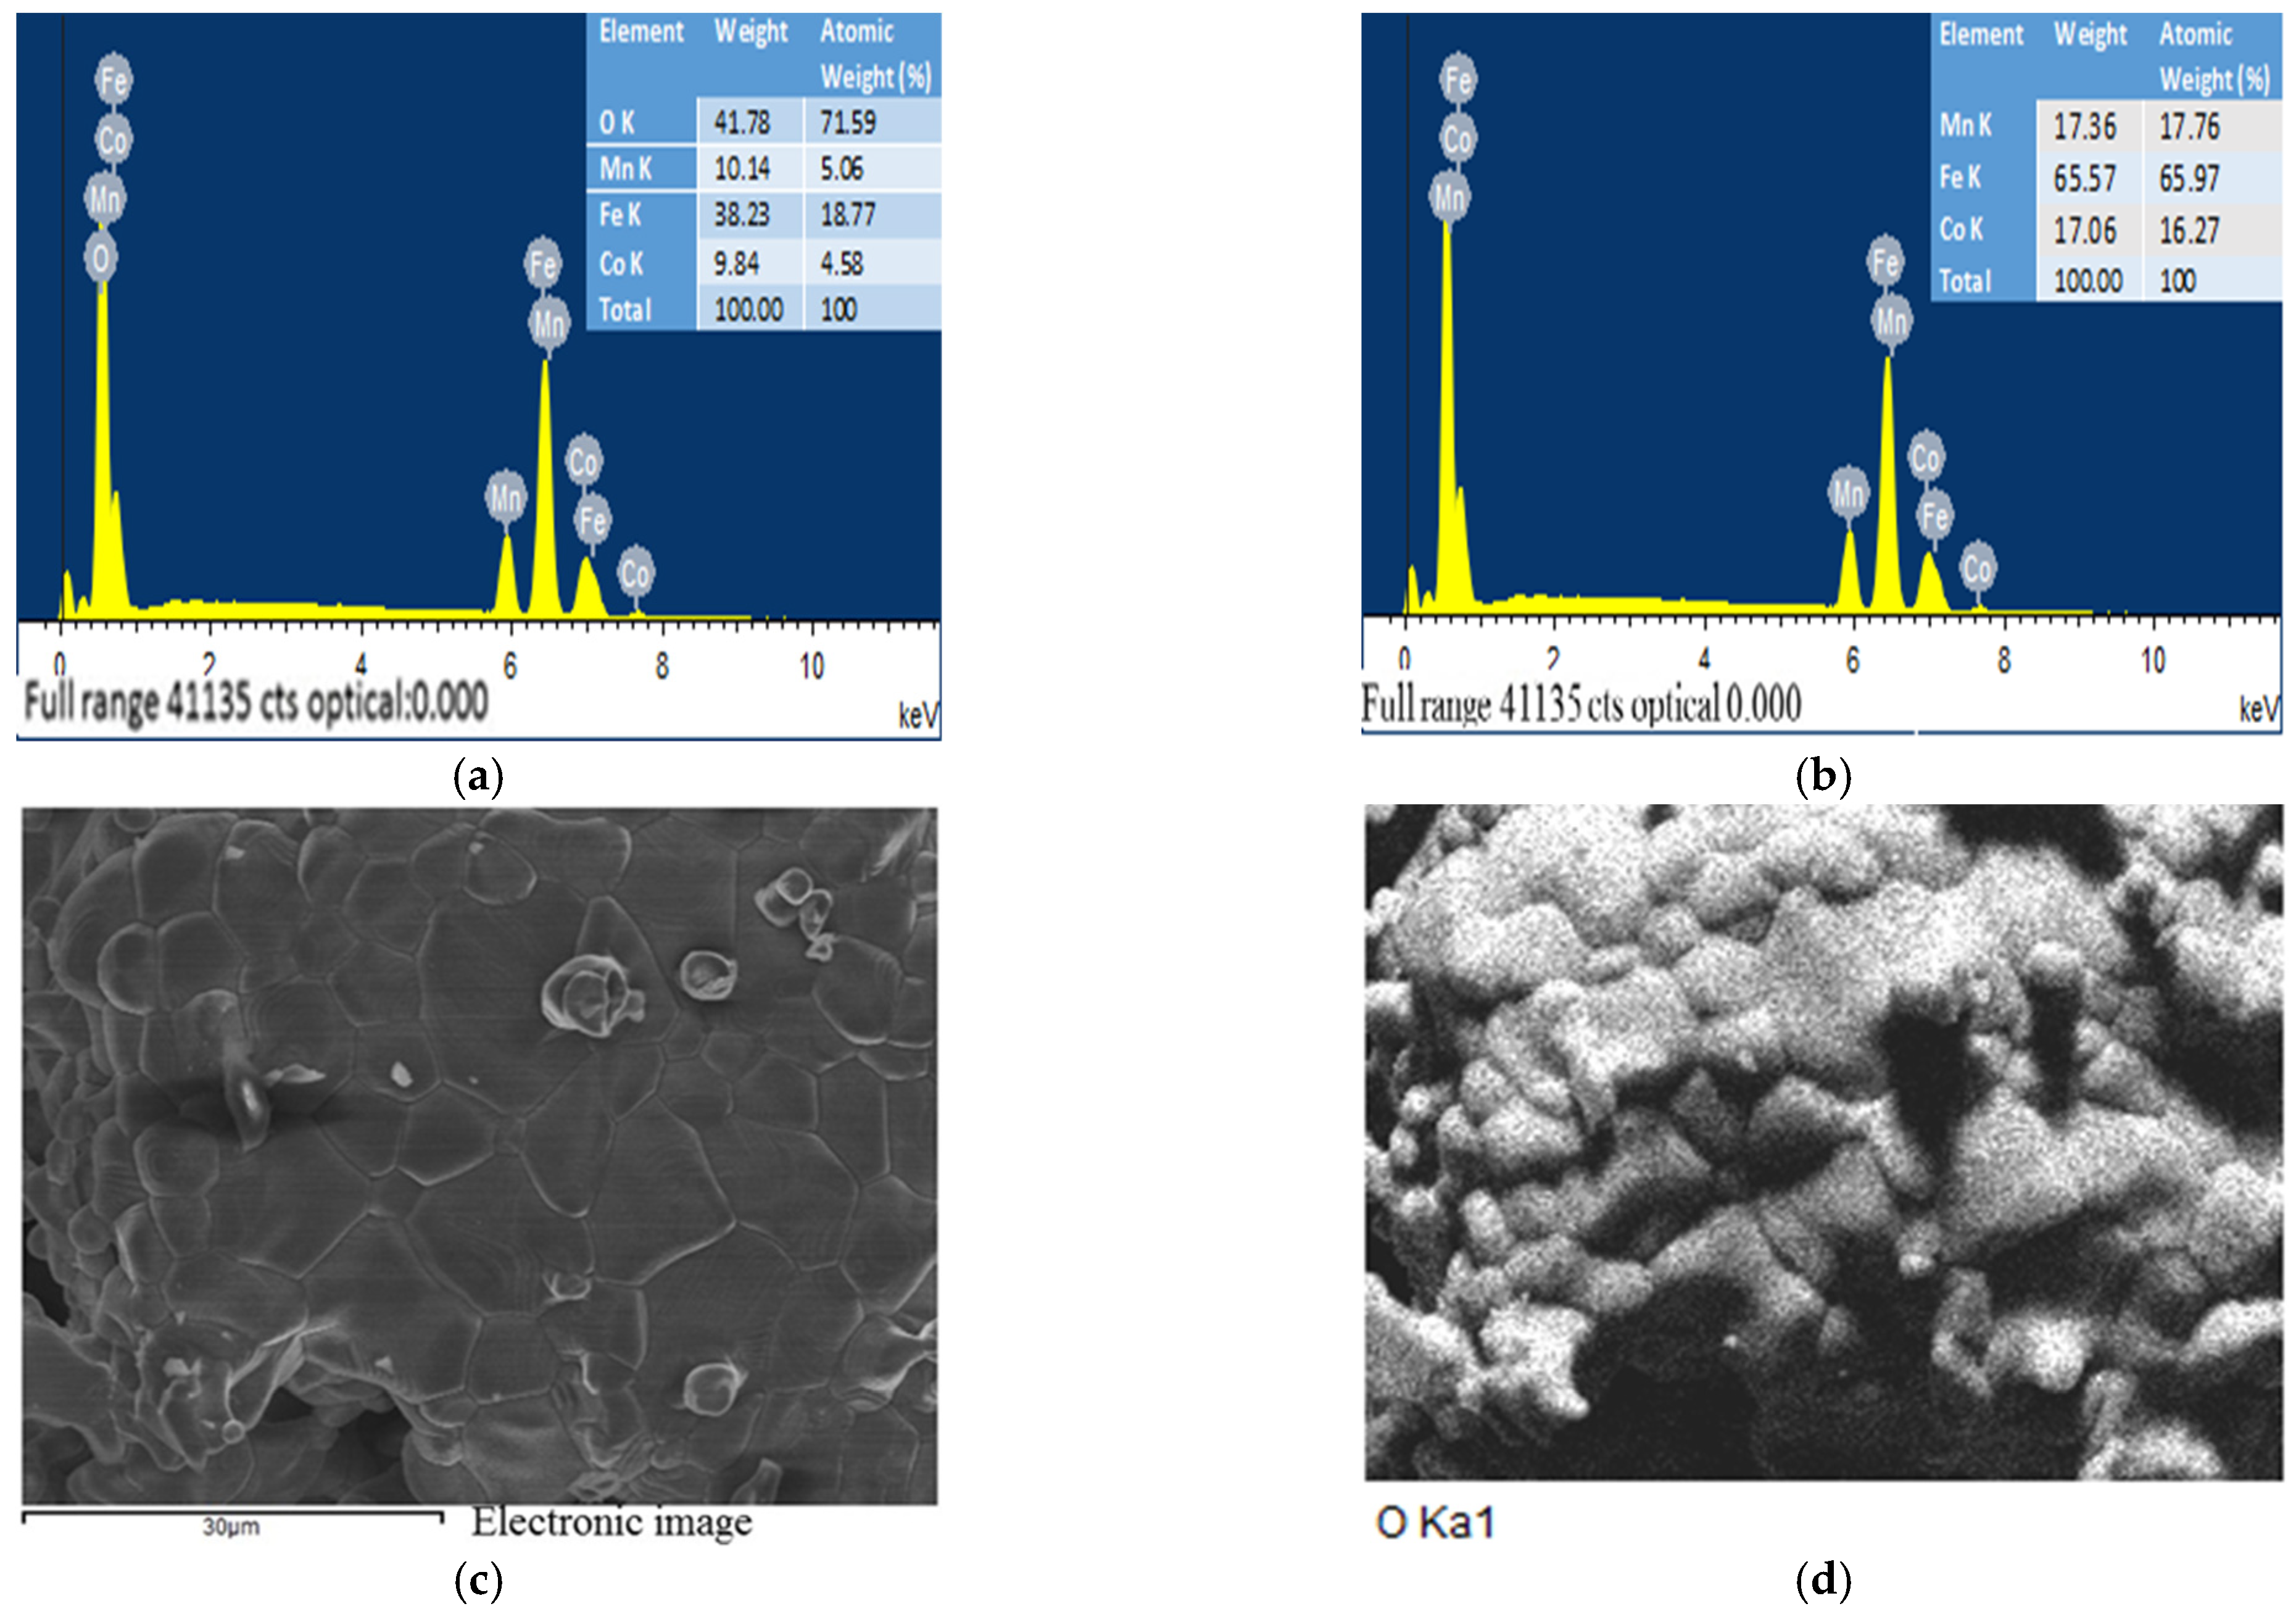
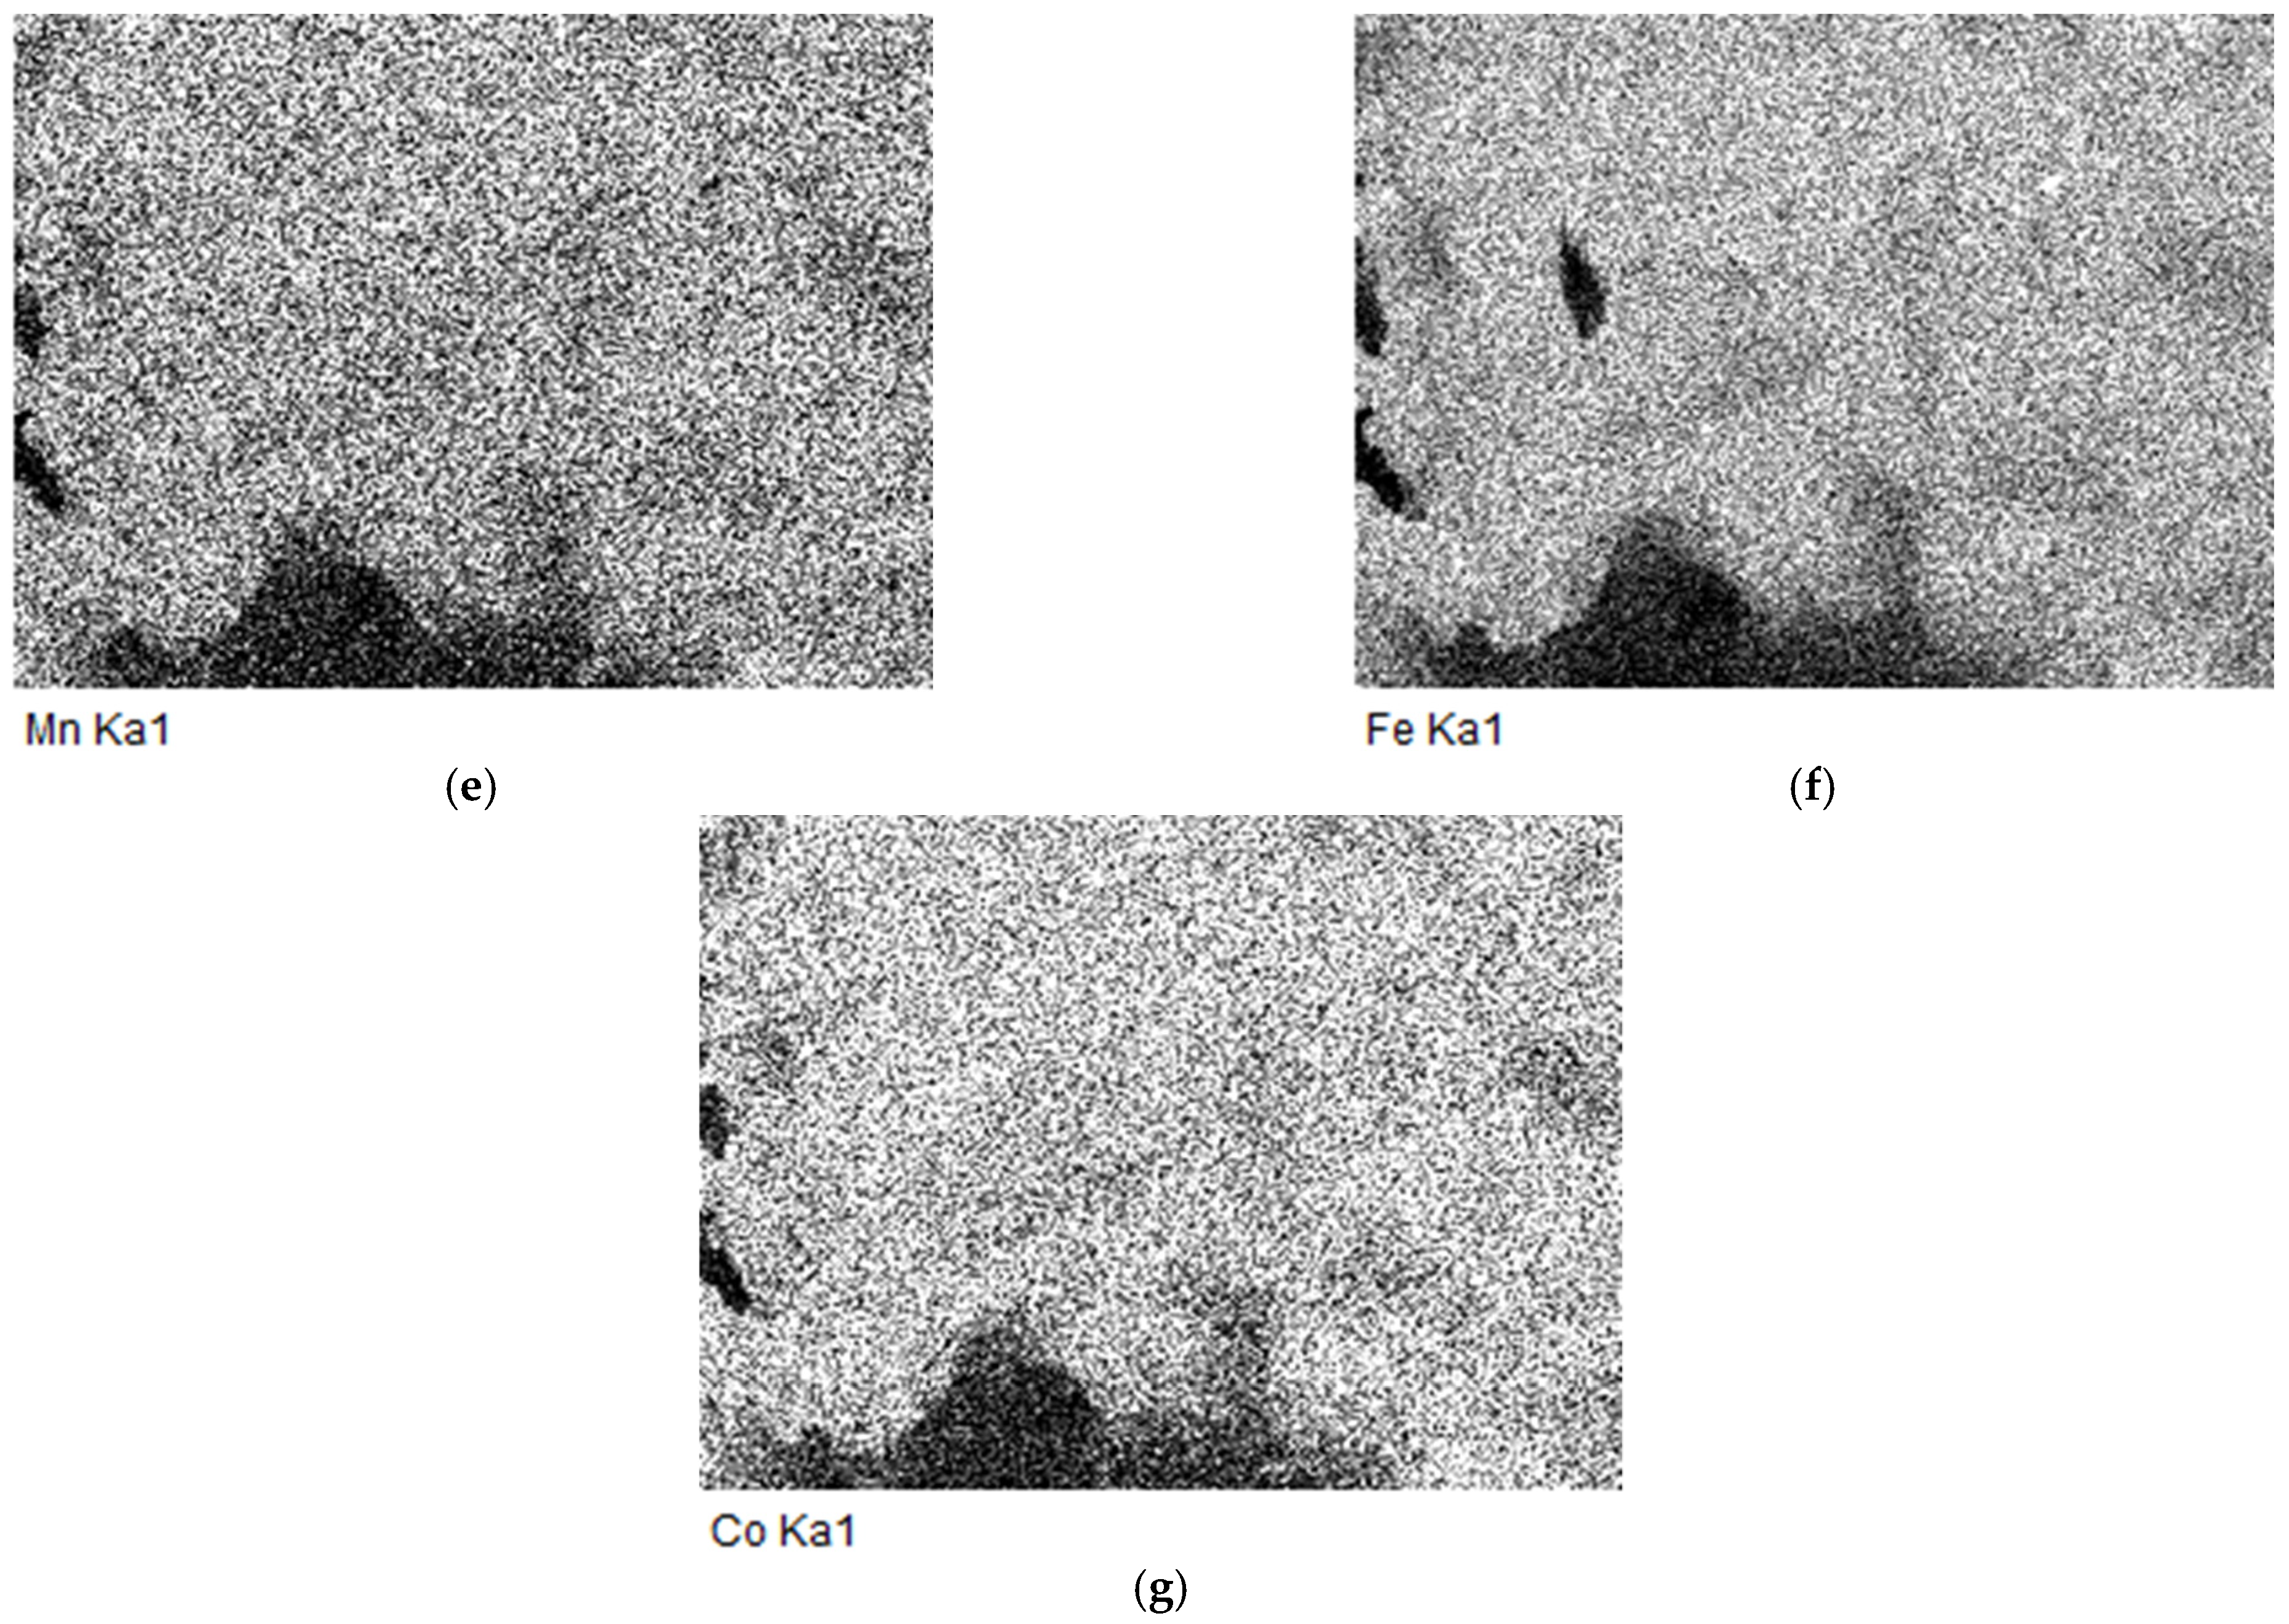
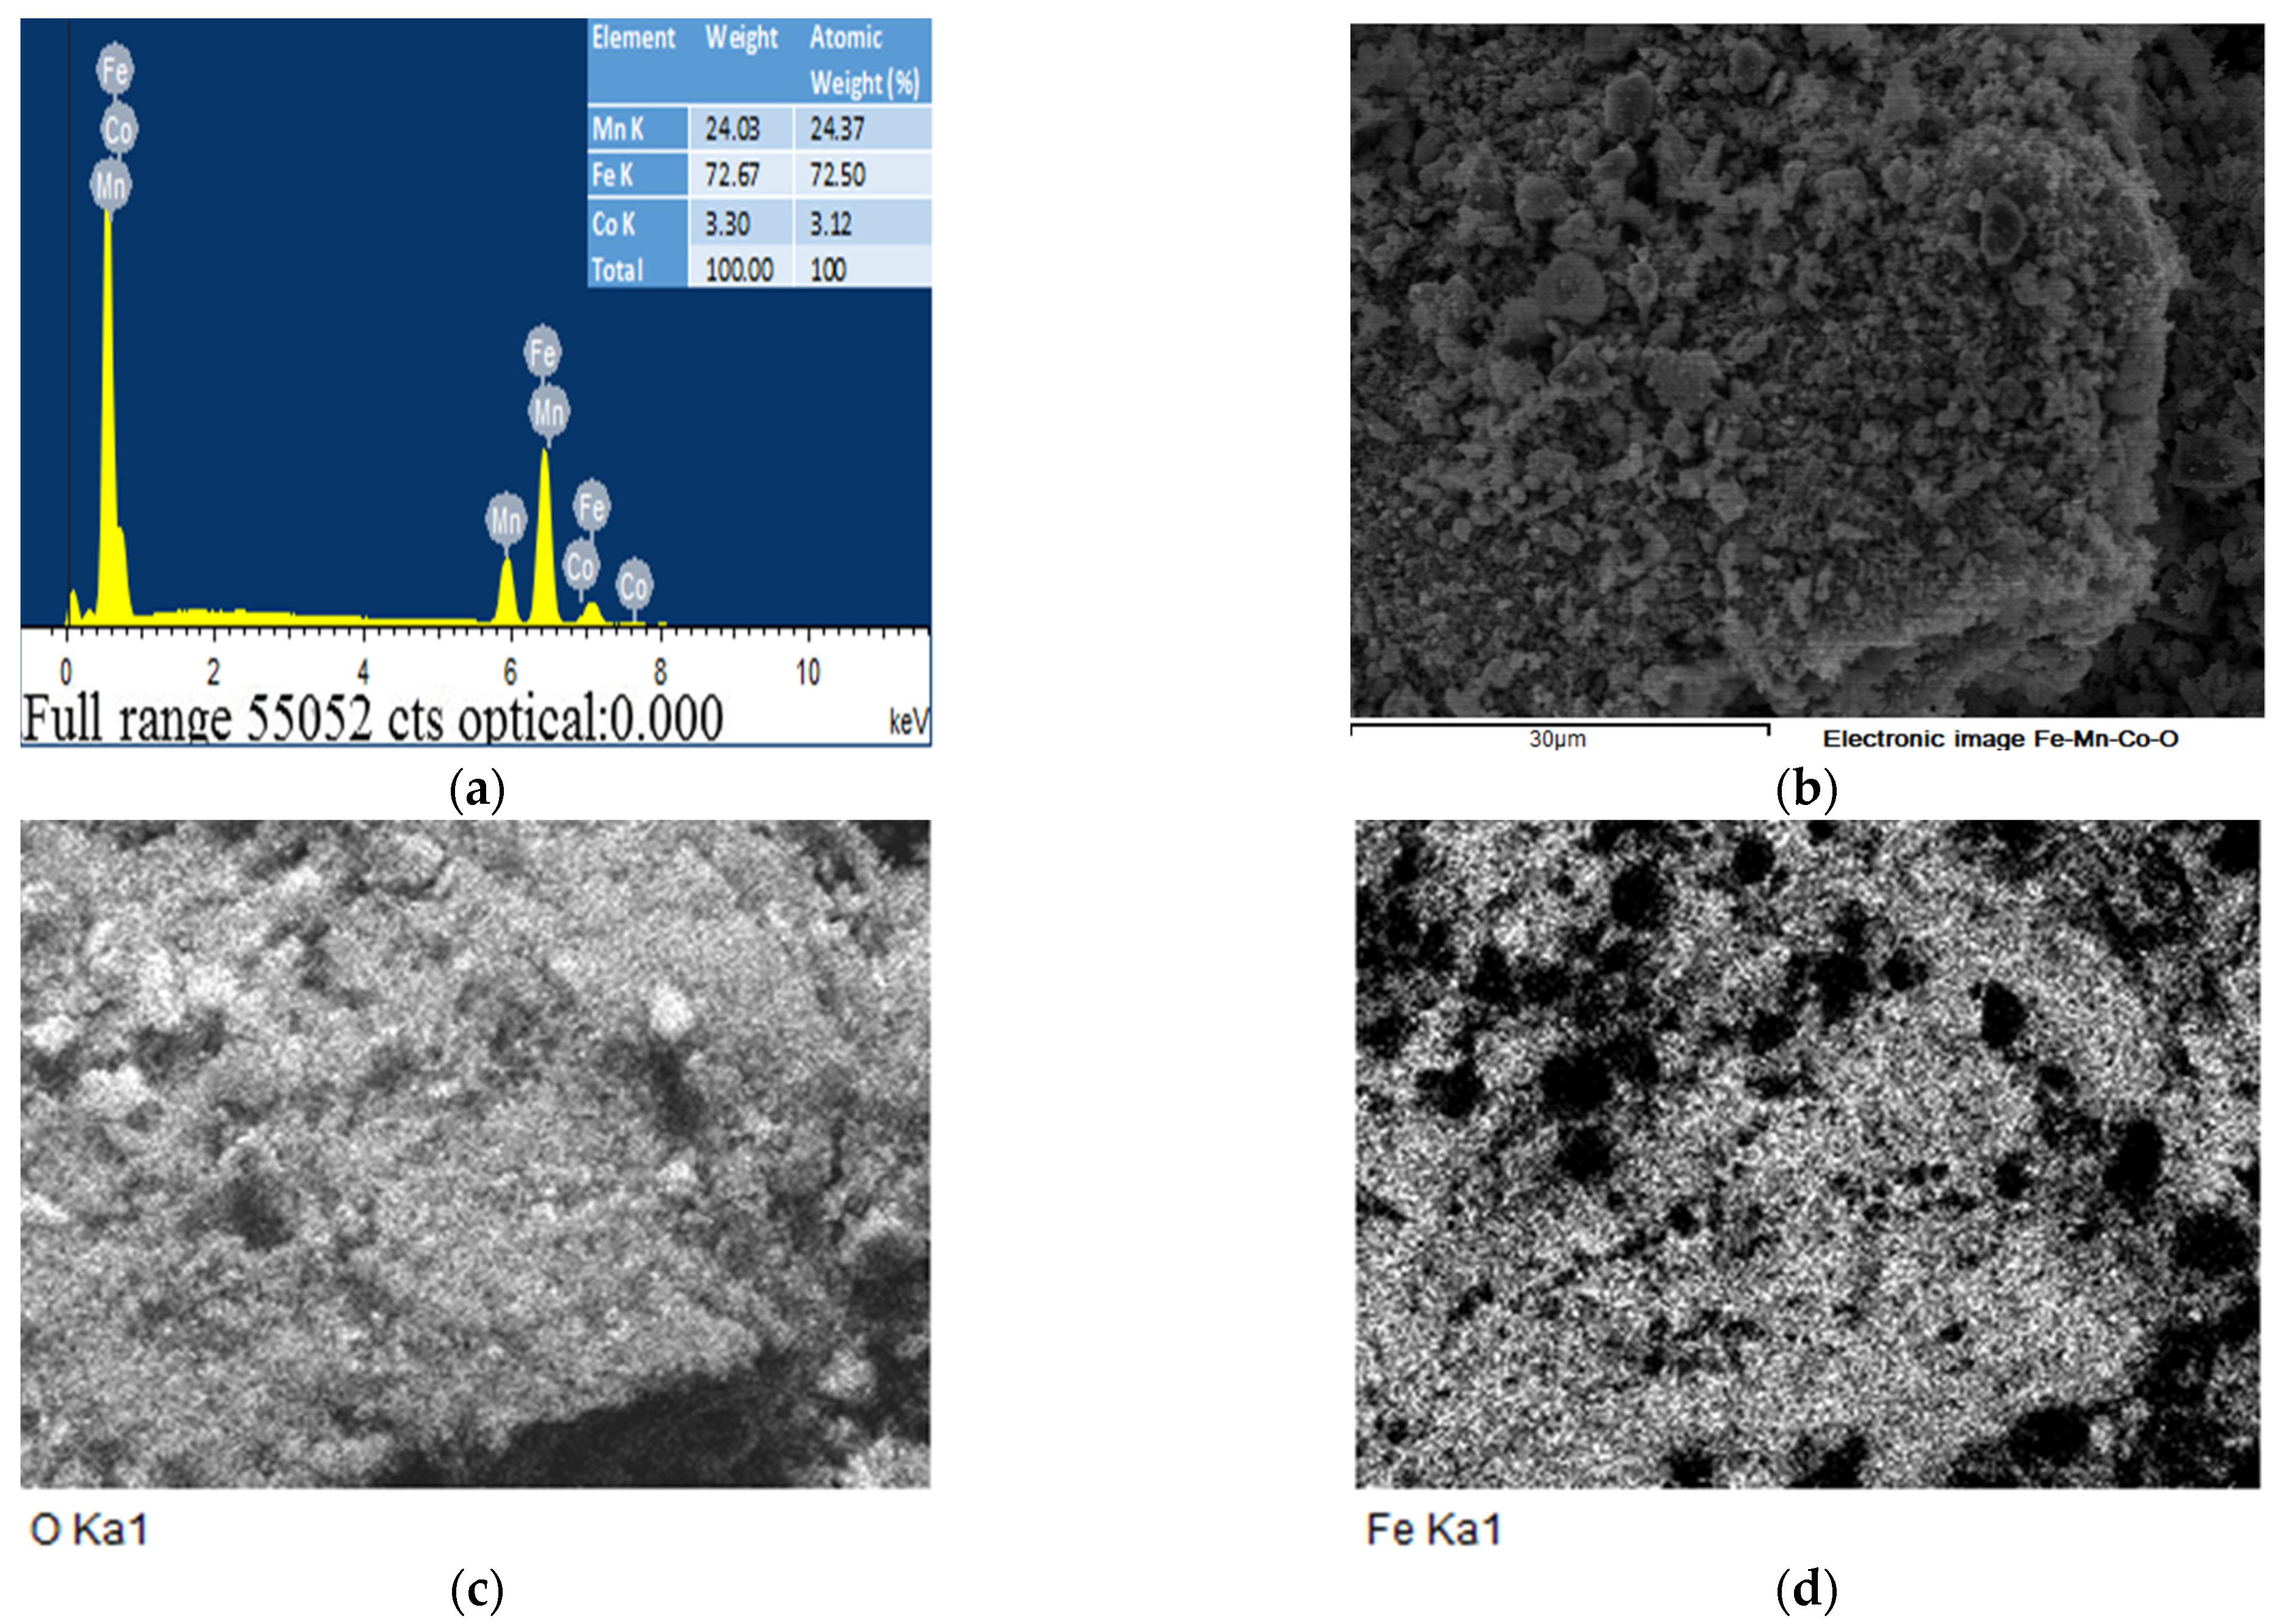
2.6. The EDS and SEM analysis of the (Fe,Co,Mn)Ox Material

EDS of the (Fe,Co,Mn)Ox Material

Figure 7a shows the EDS spectrum of the reduced elements of O, Mn, Fe, and Co with weight percentages of 41.78%, 10.14%, 38.23%, and 9.84% and element compositions of 71.59%, 5.06%, 18.77%, and 4.58%, respectively. Excluding impurities and oxygen, Figure 7b shows the reduced EDS spectrum of Mn, Fe, and Co with weight percentages 17.36%, 65.57%, and 17.06% element compositions of 17.76%, 65.97%, and 16.27%, respectively. Figure 7c shows the EDS mapping images of the reduced (Fe,Co,Mn)Ox oxide and Figure 7d–g show the EDS mapping pictures of O, Mn, Fe, and Co. From the EDS mapping images, there were black spots seen on the surface of the material, which was created due to the interaction of the applied field and missing the electrons atoms of that element. During the redox reaction with applied temperature at thermal charging step of 30 °C to 1400 °C, the added weight was 100 wt.% Fe3O4 on 50 wt.% MnO + 50 wt.% CoO. However, from the EDS weight analysis spectrum distribution, the untreated weight percentage of Fe-O (38.28%) was higher than the sum of the weight percentage of Co-O and Mn-O (10.14% + 9.84%) and the treated weight percentage of Fe (65.57%) and Mn-Co (17.36% + 17.06%). From the TGA analysis in Section 3.1 and Section 3.2, it was deduced that the reduction of CoO and MnO was faster than Fe3O4. Furthermore, Fe-O was not well reduced except for the 0.31% weight loss due to dehydration until it reached 1200 °C. Nevertheless, at 1200 °C, Fe-O was reduced by 1.31% from its initial weight as compared to a maximum reduction of MnO (9.18%) and CoO (6.27%). This might be due to the availability of 65% of Fe-O during redox and that half of its weight was Mn-Co, which was because the redox reaction decreased the weight of Mn-Co more than that of the Fe-O. However, the EDS spectrum and mapping results both revealed the uniform distribution of composed elements in the reduced reaction. Figure 8 shows the EDS spectrum and mapping analysis of the fresh (Fe,Co,Mn)Ox material. It was revealed that the percentage of weight distribution spectrum of Fe, Mn, and Co were 24.04, 3.3, and 72.67, and weight percentage of atomic weight composition were 24.37%, 72.5%, and 3.12%, respectively. Figure 8b shows the electronic image of the fresh (Fe,Co,Mn)Ox mixture before the reduction process. Figure 8c–f show the EDS mapping images of the fresh Fe, O, Mn, and Co. Unlike the reduced EDS spectrum weight analysis in Figure 7a, the EDS spectrum observation in Figure 8a particularly for Co, had less percentage weight distribution and it had an uneven weight distribution when observed over the EDS mapping image in Figure 8c. From Figure 8c, Fe had more evenly distributed weights and Mn was less evenly distributed. However, Co had uneven, less weight, and scattered form of weight distribution and white-colored spots scattered on the surface of the EDS maps indicate the presence of Co and Mn, while the black points spots indicate the existence of oxygen.

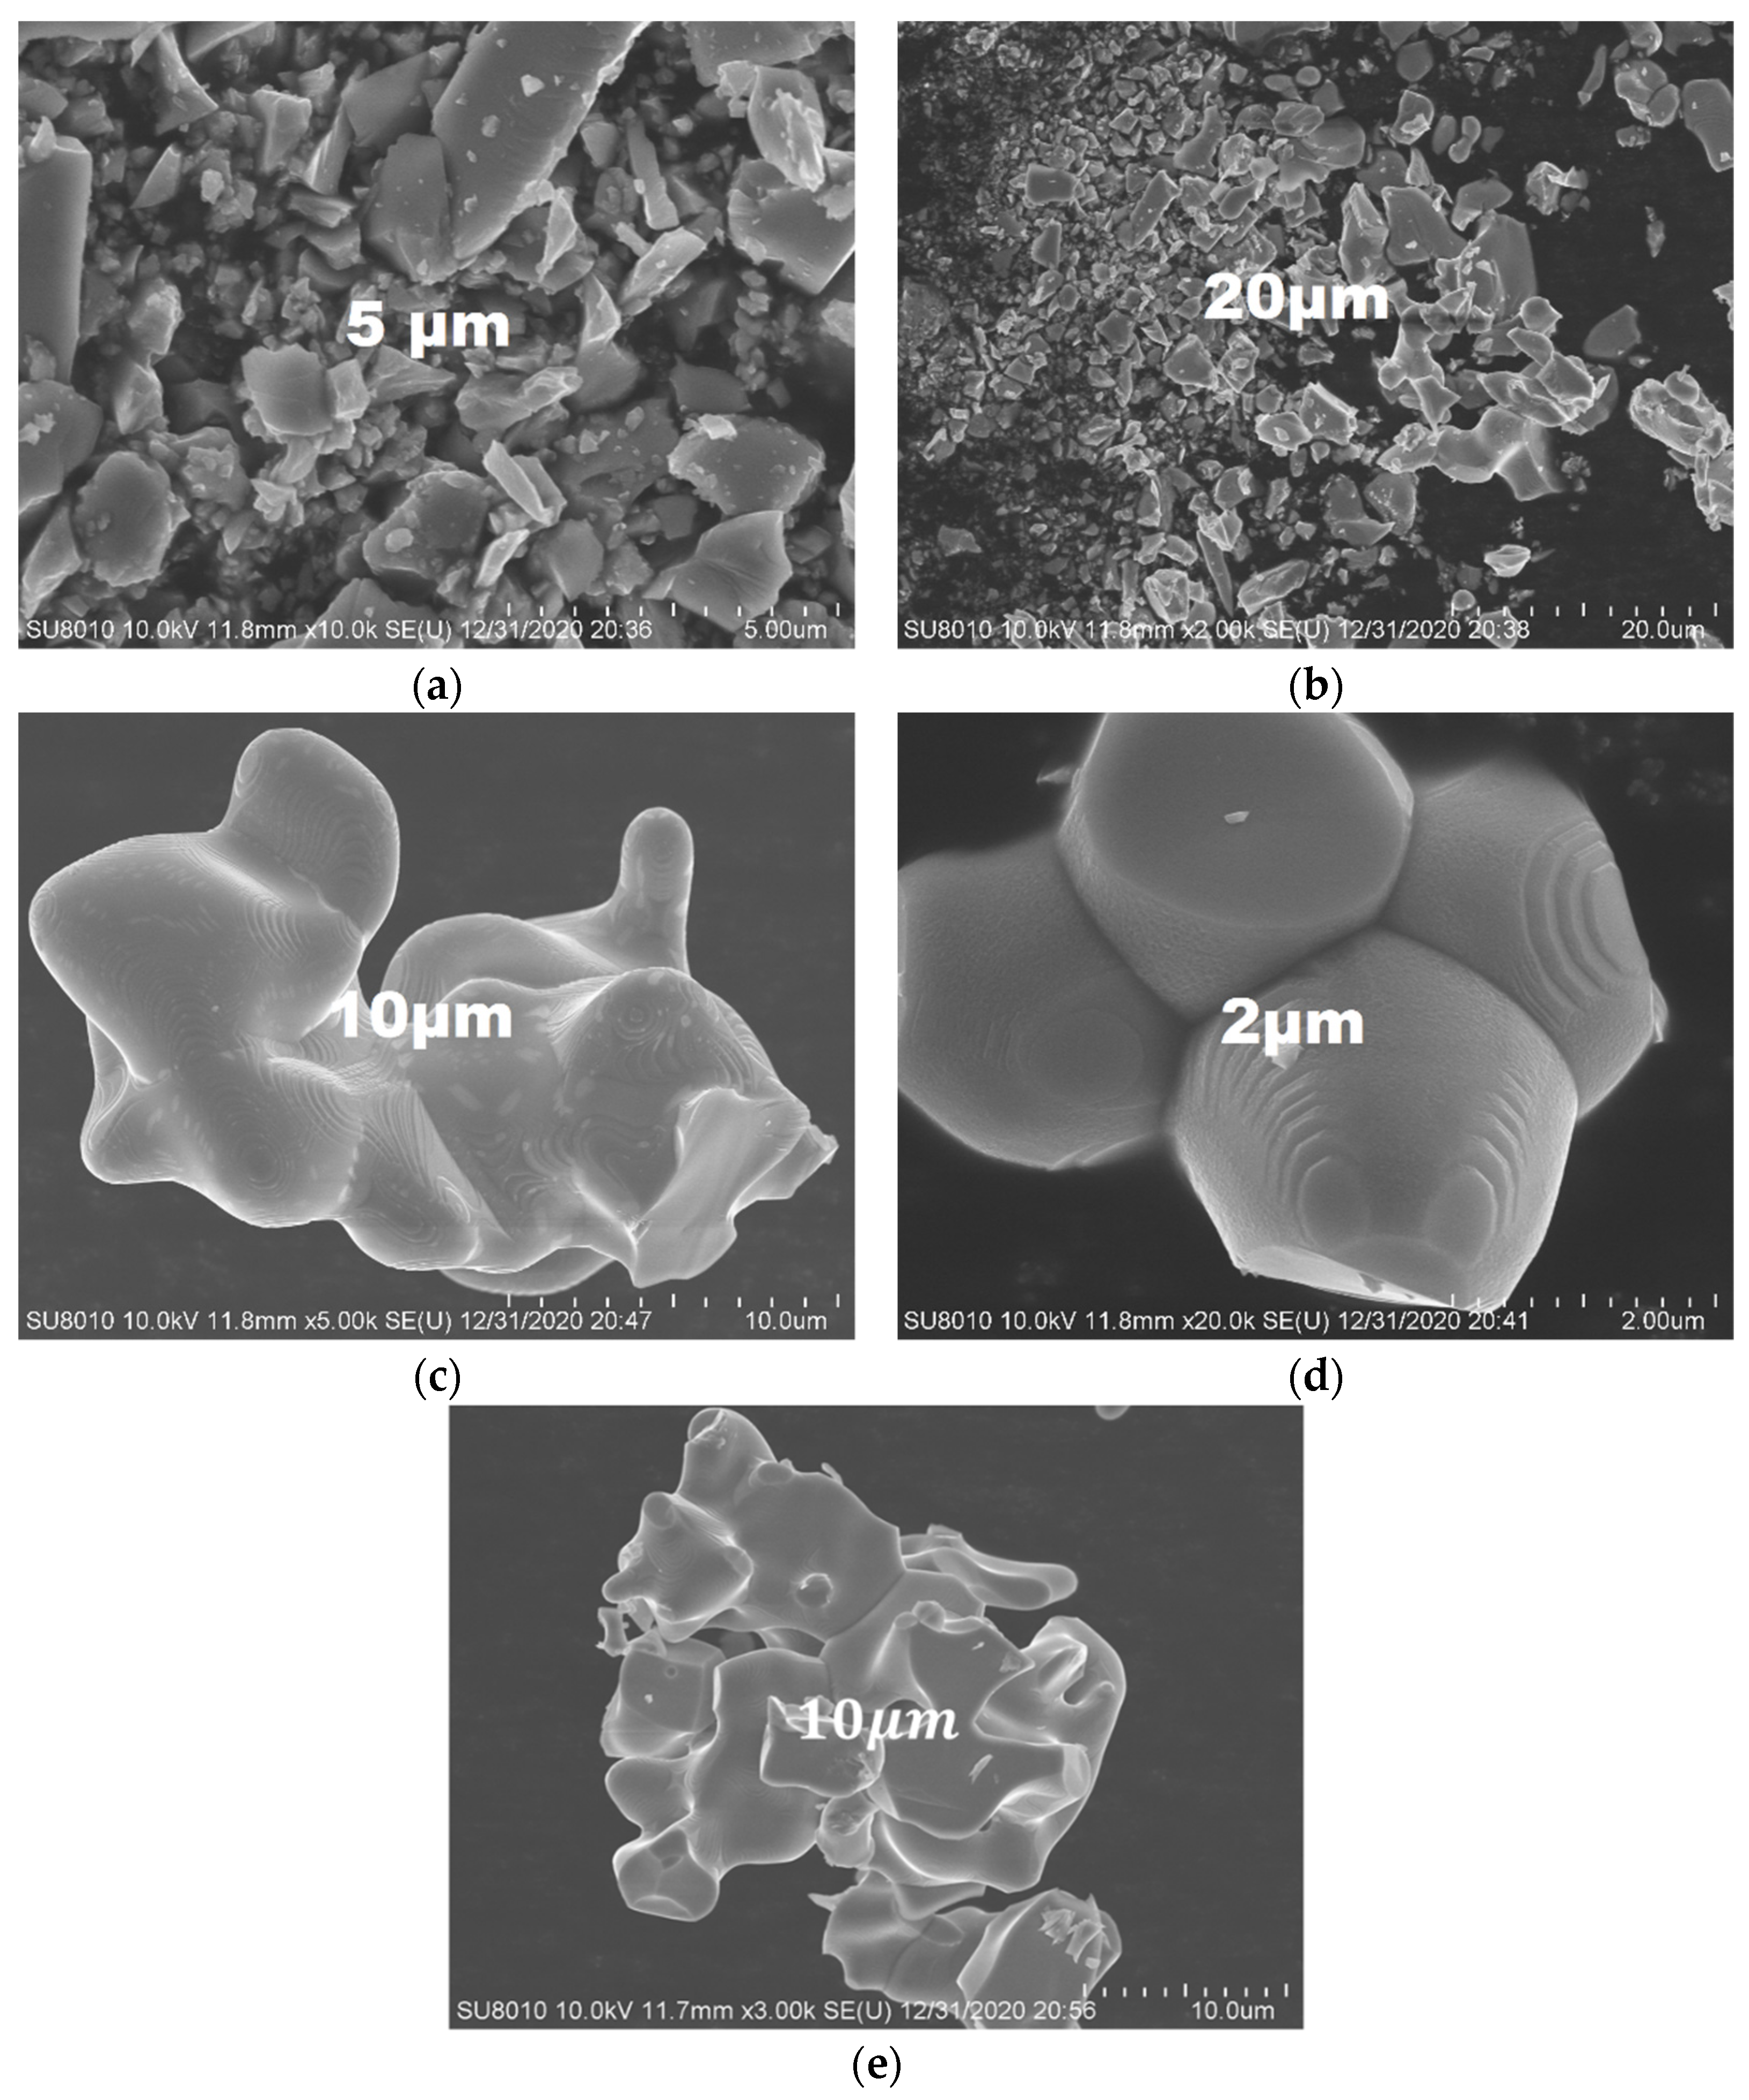
2.7. The SEM Analysis

The SEM images of the (Fe,Co,Mn)Ox are shown in Figure 9 and Figure 10. Figure 9 shows the morphology of (Fe,Co,Mn)Ox material after the two-cycle reaction process. The (Fe,Co,Mn)Ox catalyst was air-dried and then characterized. The (Fe,Co,Mn)Ox material was composed of highly agglomerated polygonal-shaped structures, which had highly rough surfaces (cracked and weathered sections). Figure 9a–d deprive rough surface features, which comprised small and large crystal-like structures that coincided with the EDS spectrum results, suggesting that the small structures belong to cobalt and manganese fragments while the large structures were iron fragments. Figure 10a–d shows the morphology of (Fe,Co,Mn)Ox material after the two-cycle redox reaction for different applied voltage and dimensions. Figure 10a–d also revealed large structures with smoother surfaces and less agglomerated structures. Figure 10c shows hexagonal shape whereas Figure 10d shows a porous structure, which is important for energy storage application.

3. Material and Methods

3.1. Material Synthesis and Characterization

Pure oxides namely CoO, MnO, Fe3O4, and mixed oxides with proportion of 25 wt.% CoO + 75 wt.% MnO, 50 wt.% CoO + 50 wt.% MnO, and 75 wt.% CoO + 25 wt.% MnO were synthesized. The proportion was taken by weight. First, 30 mg each of the six metallic oxides was prepared, it is, 30 mg of CoO, 30 mg of MnO, 30 mg of Fe3O4, 7.5 mg of CoO + 22.5 mg of MnO (31.7), 15 mg of CoO + 15 mg of MnO and 22.5 mg of CoO + 7.5 mg of MnO. 42.3 mol% of MnO, 40 mol% of CoO, 12.8 mol% of Fe3O4, 10.6 mol% of MnO + 30 mol% of CoO, 10 mol% of CoO + 31.7 mol% of MnO and 20 mol% of CoO + 21 mol% of MnO. The purity of metallic oxide was 99.99%. The powders were heated at a range of 30 to 1400 °C for about 180 min.

3.2. Experimental Procedure for Thermochemical Redox Cycling

The experimental result data were collected and analyzed using transition temperature during reduction-oxidation process and the, oxygen uptake capacity, oxygen release and reaction enthalpies were obtained by using TGA and DSC analysis. The different metallic oxide samples were exposed to the test of TGA and DSC, EDS and SEM analysis.
The redox reaction cycles were performed in O2/Ar atmosphere (30 mL/min Ar and 20 mL/min O2), between 30 to 1400 °C for each metallic oxide. In the reduction-oxidation steps, the heating rate was 30 °C/min and the cooling step was 20 °C/min for the re-oxidation. The charging and discharging processes for all materials were performed in two series cycles. The metallic oxides were heated from 30 to 1400 °C at a heating rate of 30 °C/min (charging), cooled from 1400 to 800 °C at 20 °C/min heating rate (discharging) then heated to 1400 °C (charging) and held at that temperature for 2 min followed by cooling to 800 °C and held at that temperature for 30 min and then heated from 800 to 1400 °C at 30 °C/min (charging) and held at that temperature for 2 min and then cooled to 800 °C at 20 °C/min (discharging). These processes were conducted for achieving stability as well as to analyze the oxygen uptake and release of oxygen, weight loss, and phase changing temperature in the redox reactions.

3.3. Thermodynamic Calculations

The metallic oxides experimental data were analyzed using OriginPro software (2018a, Northampton, MA, USA). For the calculations, using the OriginPro software and extracted data from the TGA and DSC excel, the oxygen uptake, oxygen release, the weight loss, the onset reduction temperatures, the conversion rate, the phase change temperatures, the gas flow rates, and the heat rate, which were applied during redox reactions, were analyzed and calculated. During the experiment, the additional argon gas for protection were considered. The gaseous components, O2, and Ar were considered, with ideal mixing properties. The total pressure was always 1 atm. The phase change diagrams and phase changing temperatures were plotted and calculated. The calculations provide the theoretical mass loss (i.e., oxygen storage capacity) and rate of conversion of metallic oxides in the trial of the tests, which were calculated as follows. From
η = ( Δ w ( % ) 32 ) × 10 , 000 μ m o l / g
χ = ( m o m ( T ) m o m )
χ c o n = ( w i n ( m o l s ) w O 2 ( m o l s ) w i n ( m o l s ) + w O 2 ( m o l s ) )
From the non-parametric kinetics (NPK), which originally was developed by Serrra et al. [56,57,58] where, η is the O2 storage or release capacity, Δ ( w % ) is the weight loss, χ is the conversion rate, m o is initial weight, m ( T ) is the weight at temperature (T), m the residue weight at the end of reaction, χ c o n is conversion efficiency, w i n is the weight of metallic oxides set for redox, w O 2 is the weight of metallic oxides changes to oxygen.

4. Conclusions

This study utilized different proportions of MnO, CoO, and Fe3O4 to produce a metallic oxide material with high thermal storage performance using a two-cycle redox reaction. Proper moisture of MnO and CoO can stabilize the weak reaction rate of Mn and fast reaction of CoO as well as enhance cyclic stability and oxygen uptake ratio. The combination of 50 wt.% MnO + 50 wt.% CoO produced a material with high cyclic stability, high oxygen uptake ratio, and high energy conversion performance. The mixing of 100 wt.% Fe3O4 with 50 wt.% MnO + 50 wt.% CoO resulted in decreased oxygen uptake ratio, increased stability performance, increased the reaction temperature and decreased the gap in temperature for reduction-oxidation steps for the material thereby reducing the sensible energy loss during the heating and cooling steps of the material production process. The phase change and decomposition of iron oxide occurred at the very high temperatures. Increasing the oxygen exchange capacity on iron oxides during redox reaction had a clear adverse effect on the thermal performance of MnO and CoO, and thereby leading to decrease in thermal enthalpy in the process. Thus, the development of new models covering large multi-component systems could further be used in selecting other transition metals to enhance the properties of mixed metal oxides for thermochemical energy storage application technology.

Author Contributions

Formal analysis, B.J.; Software, J.Z. and J.A.; Supervision, Q.H. and B.G.L.; Writing—original draft, Y.G.D.; Writing—review & editing, E.B.T. All authors have read and agreed to the published version of the manuscript.

Funding

This work was funded by the National Natural Science Foundation of China (No. 51976044; 51950410590), China Postdoctoral Science Foundation Fund (2019M651284), and Fundamental Research Funds for the Central Universities (HIT.NSRIF.2020054)

Conflicts of Interest

The authors declare no conflict of interest and the funders had no role in the design of the study; in the collection, analyses, or interpretation of data; in the writing of the manuscript, or in the decision to publish the results.

References

  1. Medrano, M.; Gil, A.; Martorell, I.; Potau, X.; Cabeza, L.F. State of the art on high-temperature thermal energy storage for power generation. Part 2-Case studies. Renew. Sustain. Energy Rev. 2010, 14, 56–72. [Google Scholar] [CrossRef]
  2. Zalba, B.; Marín, J.M.; Cabeza, L.F.; Mehling, H. Review on thermal energy storage with phase change: Materials, heat transfer analysis and applications. Appl. Therm. Eng. 2003, 23, 251–283. [Google Scholar] [CrossRef]
  3. Pardo, P.; Deydier, A.; Anxionnaz-Minvielle, Z.; Rougé, S.; Cabassud, M.; Cognet, P. A review on high temperature thermochemical heat energy storage. Renew. Sustain. Energy Rev. 2014, 32, 591–610. [Google Scholar] [CrossRef] [Green Version]
  4. Yan, T.; Wang, R.Z.; Li, T.X.; Wang, L.W.; Fred, I.T. A review of promising candidate reactions for chemical heat storage. Renew. Sustain. Energy Rev. 2015, 43, 13–31. [Google Scholar] [CrossRef]
  5. Farulla, G.A.; Cellura, M.; Guarino, F.; Ferraro, M. A review of the Thermochemical Emergy Storage Systems for Power Grid Support. Appl. Sci. Rev. 2020, 10, 3142. [Google Scholar] [CrossRef]
  6. Pelay, U.; Luo, L.; Fan, Y.; Stitou, D.; Rood, M. Thermal energy storage systems for concentrated solar power plants. Renew. Sustain. Energy Rev. 2017, 79, 82–100. [Google Scholar] [CrossRef]
  7. Ströhle, S.; Haselbacher, A.; Jovanovic, Z.R.; Steinfeld, A. The effect of the gas-solid contacting pattern in a high-temperature thermochemical energy storage on the performance of a concentrated solar power plant. Energy Environ. Sci. 2016, 9, 1375–1389. [Google Scholar] [CrossRef]
  8. Bayon, A.; Bader, R.; Jafarian, M.; Fedunik-Hofman, L.; Sun, Y.; Hinkley, J.; Miller, S.; Lipiński, W. Techno-economic assessment of solid-gas thermochemical energy storage systems for solar thermal power applications. Energy 2018, 149, 473–484. [Google Scholar] [CrossRef]
  9. André, L.; Abanades, S.; Flamant, G. Screening of thermochemical systems based on solid-gas reversible reactions for high temperature solar thermal energy storage. Renew. Sustain. Energy Rev. 2016, 64, 703–715. [Google Scholar] [CrossRef]
  10. Fujii, I.; Tsuchiya, K.; Higano, M.; Yamada, J. Studies of an energy storage system by use of the reversible chemical reaction: CaO + H2OCa(OH)2. Sol. Energy 1985, 34, 367–377. [Google Scholar] [CrossRef]
  11. Pardo, P.; Anxionnaz-Minvielle, Z.; Rougé, S.; Cognet, P.; Cabassud, M. Ca(OH)2/CaO reversible reaction in a fluidized bed reactor for thermochemical heat storage. Sol. Energy 2014, 107, 605–616. [Google Scholar] [CrossRef] [Green Version]
  12. Linder, M.; Roßkopf, C.; Schmidt, M.; Wörner, A. Thermochemical energy storage in kW-scale based on CaO/Ca(OH)2. Energy Procedia 2013, 49, 888–897. [Google Scholar] [CrossRef] [Green Version]
  13. Dai, L.; Long, X.F.; Lou, B.; Wu, J. Thermal cycling stability of thermochemical energy storage system Ca(OH)2/CaO. Appl. Therm. Eng. 2018, 133, 261–268. [Google Scholar] [CrossRef]
  14. Criado, Y.A.; Huille, A.; Rougé, S.; Abanades, J.C. Experimental investigation and model validation of a CaO/Ca(OH)2 fluidized bed reactor for thermochemical energy storage applications. Chem. Eng. J. 2017, 313, 1194–1205. [Google Scholar] [CrossRef] [Green Version]
  15. Yan, J.; Zhao, C.Y. First-principle study of CaO/Ca(OH)2 thermochemical energy storage system by Li or Mg cation doping. Chem. Eng. Sci. 2014, 117, 293–300. [Google Scholar] [CrossRef]
  16. Criado, Y.A.; Alonso, M.; Abanades, J.C. Enhancement of a CaO/Ca(OH)2 based material for thermochemical energy storage. Sol. Energy 2016, 135, 800–809. [Google Scholar] [CrossRef] [Green Version]
  17. Ortiz, C.; Romano, M.C.; Valverde, J.M.; Binotti, M.; Chacartegui, R. Process integration of Calcium-Looping thermochemical energy storage system in concentrating solar power plants. Energy 2018, 155, 535–551. [Google Scholar] [CrossRef]
  18. Chen, X.; Jin, X.; Liu, Z.; Ling, X.; Wang, Y. Experimental investigation on the CaO/CaCO3 thermochemical energy storage with SiO2 doping. Energy 2018, 155, 128–138. [Google Scholar] [CrossRef]
  19. Benitez-Guerrero, M.; Valverde, J.M.; Sanchez-Jimenez, P.E.; Perejon, A.; Perez-Maqueda, L.A. Multicycle activity of natural CaCO3 minerals for thermochemical energy storage in Concentrated Solar Power plants. Sol. Energy 2017, 153, 188–199. [Google Scholar] [CrossRef]
  20. André, L.; Abanades, S. Evaluation and performances comparison of calcium, strontium and barium carbonates during calcination/carbonation reactions for solar thermochemical energy storage. J. Energy Storage 2017, 13, 193–205. [Google Scholar] [CrossRef]
  21. Wu, S.; Zhou, C.; Doroodchi, E.; Nellore, R.; Moghtaderi, B. A review on high-temperature thermochemical energy storage based on metal oxides redox cycle. Energy Convers. Manag. 2018, 168, 421–453. [Google Scholar] [CrossRef]
  22. Bulfin, B.; Vieten, J.; Agrafiotis, C.; Roeb, M.; Sattler, C. Applications and limitations of two step metal oxide thermochemical redox cycles: A review. J. Mater. Chem. A 2017, 5, 18951–18966. [Google Scholar] [CrossRef]
  23. Alonso, E.; Pérez-Rábago, C.; Licurgo, J.; Fuentealba, E.; Estrada, C.A. First experimental studies of solar redox reactions of copper oxides for thermochemical energy storage. Sol. Energy 2015, 115, 297–305. [Google Scholar] [CrossRef]
  24. Haseli, P.; Jafarian, M.; Nathan, G.J. High temperature solar thermochemical process for production of stored energy and oxygen based on CuO/Cu2O redox reactions. Sol. Energy 2017, 153, 1–10. [Google Scholar] [CrossRef]
  25. Hänchen, M.; Stiel, A.; Jovanovic, Z.R.; Steinfeld, A. Thermally driven copper oxide redox cycle for the separation of oxygen from gases. Ind. Eng. Chem. Res. 2012, 51, 7013–7021. [Google Scholar] [CrossRef]
  26. Clayton, C.K.; Whitty, K.J. Measurement and modeling of decomposition kinetics for copper oxide-based chemical looping with oxygen uncoupling. Appl. Energy 2014, 116, 416–423. [Google Scholar] [CrossRef]
  27. Alonso, E.; Pérez-Rábago, C.; Licurgo, J.; Gallo, A.; Fuentealba, E.; Estrada, C.A. Experimental aspects of CuO reduction in solar-driven reactors: Comparative performance of a rotary kiln and a packed bed. Renew. Energy 2017, 105, 665–673. [Google Scholar] [CrossRef]
  28. Schrader, A.J.; Muroyama, A.P.; Loutzenhiser, P.G. Solar electricity via an Air Brayton cycle with an integrated two-step thermochemical cycle for heat storage based on Co3O4/CoO redox reactions: Thermodynamic analysis. Sol. Energy 2015, 118, 485–495. [Google Scholar] [CrossRef] [Green Version]
  29. Singh, A.; Tescari, S.; Lantin, G.; Agrafiotis, C.; Roeb, M.; Sattler, C. Solar thermochemical heat storage via the Co3O4/CoO looping cycle: Storage reactor modelling and experimental validation. Sol. Energy 2017, 144, 453–465. [Google Scholar] [CrossRef]
  30. Abedin, A.H.; Rosen, M.A. A critical review of thermochemical energy storage systems. Open Renew. Energy 2011, 4, 42–46. [Google Scholar] [CrossRef] [Green Version]
  31. Yuan, Y.; Ruan, Z.-H.; Huang, X.; Jiang, Y.-Q.; Tan, H.-P. Energy-absorption-based explanation of the TiO2/C photocatalytic activity enhancement mechanism. J. Catal. 2017, 348, 246–255. [Google Scholar] [CrossRef]
  32. Fuqiang, W.; Ziming, C.; Jianyu, T.; Yuan, Y.; Yong, S.; Linhua, L. Progress in concentrated solar power technology with parabolic trough collector system: A comprehensive review. Renew. Sustain. Energy. Rev. 2017, 79, 1314–1328. [Google Scholar] [CrossRef]
  33. Block, T.; Knoblauch, N.; Shmücker, M. The cobalt-oxide/iron-oxide binary system for use as high temperature thermochemical energy storage material. Thermochim. Acta 2014, 577, 25–32. [Google Scholar] [CrossRef]
  34. Agrafiotis, C.; Roeb, M.; Schücker, M.; Sattler, C. Exploitation of thermochemical cycles based on solid oxide redox systems for thermochemical storage of solar heat. Part 2: Redox oxide-coated porous ceramic structures as integrated thermochemical reactors/heat exchangers. Sol. Energy 2015, 114, 440–458. [Google Scholar] [CrossRef]
  35. Agrafiotis, C.; Tescari, S.; Roeb, M.; Schücker, M.; Sattler, C. Exploitation of thermochemical cycles based on solid oxide redox systems for thermochemical storage of solarheat.Part 3: Cobaltoxide monolithic porous structures as integrated thermochemical reactors/heat exchanger. Sol. Energy 2015, 114, 459–475. [Google Scholar] [CrossRef]
  36. Neises, M.; Tescari, S.; DeOliveira, L.; Roeb, M.; Sattler, C.; Wong, B. Solar-heated rotary kilnfor thermochemical energy storage. Sol. Energy 2012, 86, 3040–3048. [Google Scholar] [CrossRef]
  37. Tescari, S.; Agrafiotis, C.; Breuer, S.; DeOliveira, L.; Nieses-vonPuttkamer, M.; Roeb, M.; Sattler, C. Thermochemical solar energy storage varied oxides: Materials and reactor/heat exchanger concepts. Energy Procedia 2014, 49, 1034–1043. [Google Scholar] [CrossRef] [Green Version]
  38. Karagiannakis, G.; Pagkoura, C.; Zygogianni, A.; Lorentzou, S.; Konstandopoulos, A.G. Monolithic ceramic redox materials for thermochemical heat storage applications in CSP plants. Energy Procedia 2014, 49, 820–829. [Google Scholar] [CrossRef] [Green Version]
  39. Carrillo, A.J.; Serrano, D.P.; Pizarro, P.; Coronado, J.M. Improving the thermo- chemical energy storage performance of the Mn2O3/Mn3O4 redox couple by the incorporation of iron. ChemSusChem 2015, 8, 1947–1954. [Google Scholar] [CrossRef]
  40. Pagkoura, C.; Karagiannakis, G.; Zygogianni, A.; Lorentzou, S.; Kostoglou, M.; Konstandopoulos, A.G.; Rattenburry, M.; Woodhead, W.J. Cobalt oxide based structured bodies as redox thermochemical heat storage medium for future CSP plants. Sol. Energy 2014, 108, 146–163. [Google Scholar] [CrossRef]
  41. Carrillo, A.J.; Serrano, D.P.; Pizarro, P.; Coronado, J.M. Thermochemical heat storage based on the Mn2O3/Mn3O4 redox couple: Influence of the initial particle on the morphological evolution and cyclability. J. Mater. Chem. A 2014, 2, 19435–19443. [Google Scholar] [CrossRef]
  42. Jung, I.H.; Decterov, S.A.; Pelton, A.D.; Kim, H.M.; Kang, Y.B. Thermodynamic evaluation and modeling of the Fe-Co-O system. Acta Mater. 2004, 52, 507–519. [Google Scholar] [CrossRef]
  43. Zhang, W.-W.; Chen, M. Thermodynamic modeling of the Co–Fe–O system. Calphad 2013, 41, 76–88. [Google Scholar] [CrossRef]
  44. Kang, Y.B.; Jung, I.H. Thermodynamic modeling of oxide phases in the Fe-Mn-O system. J. Phys. Chem. Solids 2016, 98, 237–246. [Google Scholar] [CrossRef]
  45. Kjellqvist, L.; Selleby, M. Thermodynamic assessment of the Fe-Mn-O system. J. Phase Equilibria Diffus. 2010, 31, 113–134. [Google Scholar] [CrossRef]
  46. Guene Lougou, B.; Shuai, Y.; Guohua, Z.; Chaffa, G.; Ahouannou, C.; Tan, H. Analysis of H2 and CO production via solar thermochemical reacting system of NiFe2O4 redox cycles combined with CH4 partial oxidation. Int. J. Hydrog. Energy 2018, 43, 5996–6010. [Google Scholar] [CrossRef]
  47. Lougou, B.G.; Shuai, Y.; Chaffa, G.; Ahouannou, C.; Pan, R.; Zhang, H.; Tan, H. Analysis of two-step solar thermochemical looping reforming of Fe3O4 redox cycles for synthesis gas production. Energy Technol. 2018, 7, 1800588. [Google Scholar] [CrossRef]
  48. Lougou, B.G.; Shuai, Y.; Pan, R.; Chaffa, G.; Tan, H. Heat transfer and fluid flow analysis of porous medium solar thermochemical reactor with quartz glass cover. Int. J. Heat. Mass. Transf. 2018, 127, 61–74. [Google Scholar] [CrossRef]
  49. Lougou, B.G.; Shuai, Y.; Pan, R.; Chaffa, G.; Ahouannou, C.; Zhang, H.; Tan, H. Radiative heat transfer and thermal characteristics of Fe-based oxides coated SiC and Alumina RPC structures as integrated solar thermochemical reactor. Sci. China Technol. Sci. 2018, 61, 1788–1801. [Google Scholar] [CrossRef]
  50. Guene Lougou, B.; Han, D.; Zhang, H.; Jiang, B.; Anees, J.; Ahouannou, C.; Zhao, J.; Shuai, Y. Numerical and experimental analysis of reactor optimum design and solar thermal-chemical energy conversion for multidisciplinary applications. Energy Convers. Manag. 2020, 213, 112870. [Google Scholar] [CrossRef]
  51. Shuai, Y.; Zhang, H.; Guene Lougou, B.; Jiang, B.; Mustafa, A.; Wang, C.-H.; Wang, F.; Zhao, J. Solar-driven thermochemical redox cycles of ZrO2 supported NiFe2O4 for CO2 reduction into chemical energy. Energy 2021, 223, 120073. [Google Scholar] [CrossRef]
  52. Shuai, Y.; Guene Lougou, B.; Zhang, H.; Zhao, J.; Ahouannou, C.; Tan, H. Heat transfer analysis of solar-driven high-temperature thermochemical reactor using NiFe-Aluminate RPCs. Int. J. Hydrog. Energy 2021, 46, 10104–10118. [Google Scholar] [CrossRef]
  53. Getahun Dessie, Y.; Guene Lougou, B.; Qi, H.; Tan, H. Reactor Design and Thermal Performance Analysis for Solar Thermal Energy Storage Application. Energies 2020, 13, 3186. [Google Scholar] [CrossRef]
  54. Getahun Dessie, Y.; Guene Lougou, B.; Qi, H.; Tan, H.; Zhang, J.; Gao, B.; Islam, M.A. Thermal Performance Analysis of a Solar Reactor Designed for Syngas Production. Energies 2020, 13, 3405. [Google Scholar] [CrossRef]
  55. Guene Lougou, B.; Shuai, Y.; Zhang, H. Thermochemical CO2 reduction over NiFe2O4@alumina filled reactor heated by high-flux solar simulator. Energy 2020, 197, 117267. [Google Scholar] [CrossRef]
  56. Serra, R.; Nomen, R.; Sempere, J. The non-parametric kinetics a new method for the kinetic study of thermoanalytical data. J. Thermal. Anal. Calorim. 1998, 52, 933–943. [Google Scholar] [CrossRef]
  57. Serra, R.; Sempere, J.; Nomen, R. A new method for the kinetic study of thermoanalytical data: The nonparametric kinetics method. Thermochim. Acta 1998, 316, 37–45. [Google Scholar] [CrossRef]
  58. Sempere, J.; Nomen, R.; Serra, R.; Soravilla, J. The NPK method—An innovative approach for kinetic analysis of data from thermal analysis and calorimetry. Thermochim. Acta 2002, 388, 407–414. [Google Scholar] [CrossRef]
Figure 1. The TGA on mixed and pure metallic oxides at 30 mL Ar/min and 20 mL O2/min gas flow rates and 30 °C/min heating rate with applying temperature from room to 1400 °C and cooling to 800 °C for two step redox reaction: (a) TGA for two- step cyclic redox reaction for all oxides with time; (b) TGA for pure oxides with time; (c) TGA for mixed oxides that shows redox with time; (d) TGA for all oxides in the test with temperature in the first step of redox; (e) TGA for CoO with temperature in the first step of redox; (f) TGA for MnO with temperature in the first step of redox; (g) TGA for Fe3O4 with temperature in the first step of redox; (h) TGA for 25 wt.% MnO + 75 wt.% CoO with temperature in the first step of redox; (i) TGA for 75 wt.% MnO + 25 wt.% CoO with temperature in the first step of redox; (j) TGA for 50 wt.% MnO + 50 wt.% CoO with temperature in the first step of redox; (k) TGA for 50 wt.% MnO + 50 wt.% CoO and 25 wt.% MnO + 75 wt.% CoO with tempertaure.
Catalysts 11 00362 g001aCatalysts 11 00362 g001b
Figure 2. Weight derivative graphs (WDG) for mixed and pure metallic oxides at 30 mL Ar/min and 20 mL O2/min gas flow rates subjected to heating from 30 to 1400 °C (at 30 °C/min heating rate) step 1 redox: (a) WDG for all oxides under the test; (b) WDG for mixed oxides of 75 wt.% MnO + 25 wt.% CoO with temperature; (c) WDG for mixed oxides of 50 wt.% MnO + 50 wt.% CoO with temperature; (d) WDG for mixed oxides of 25 wt.% MnO + 75 wt.% CoO with temperature; (e) t WDG for MnO with temperature; (f) WDG for CoO with temperature; (g) WDG for Fe3O4CoO with temperature; (h) WDG t for mixed oxides of 25 wt.% MnO + 75 wt.% CoO and 50 wt.% MnO + 50 wt.% CoO with temperature in the first step of redox.
Catalysts 11 00362 g002aCatalysts 11 00362 g002b
Figure 3. The thermal performance of mixed and pure oxide during the experiment at 30 mL Ar/min and 20 mL O2/min gas flow rates subjected to heating from 30 to 1400 °C at 30 °C/min heating rate and cooling to 800 °C for two-cyclic redox reactions: (a) The oxygen uptake ratio in both cyclic redox reactions; (b) the enthalpy for mixed all oxides under test; (c) the conversion performance of all oxides under state (d) conversion performance for all oxides under the test with time; (e) specific heat capacity for 50 wt.% MnO + 50 wt.% CoO with temperature.
Catalysts 11 00362 g003aCatalysts 11 00362 g003b
Figure 4. The oxygen uptake ratio in both cyclic redox reactions at 30 mL Ar/min and 20 mL O2/min gas flow rates subjected to heating from 30 to 1400 °C at 30 °C/min heating rate and cooling to 800 °C for two-cyclic redox reactions.
Catalysts 11 00362 g004
Figure 5. The impacts of different Ar and O2 combined flow rates on the redox reaction for the (Fe,Co,Mn)Ox: (a) O2 uptake efficiency with Ar-O2 flow rates; (b) impact of gas flow rates on redox reaction; (c) DSC analysis with phase change temperature picks and enthalpies; (d) the impact of gas flow rates on weight loss during heating in the first cycle, and (e) the weight loss with time for both cyclic redox reactions including the impacts additional 20 mL/min Ar protective gas; (f) smooth DSC analysis in terms of heat flow curve against the variation in charging temperature.
Catalysts 11 00362 g005
Figure 6. The impact of heat flow rate during redox reactions: (a) Changes in smooth DSC with time; (b) changes in enthalpy with charging temperature in cycle 1; (c) phase change indicator graph during cycle 1; (d) changes in conversion rate with charging temperature in cycle 1; (e) changes in TGA with charging temperature in cycle 1 and (f) changes in conversion rate during the whole charging–discharging time for both redox cycles.
Catalysts 11 00362 g006
Figure 7. EDS analysis of reduced (Fe,Co,Mn)Ox: (a) EDS spectrum; (b) the treated and reduced spectrum, (c) electronic image of the (Fe,Co,Mn)Ox material; (c) EDS mapping picture of Fe, Mn, Co, and O; (d) EDS mapping of O; (e) EDS mapping of Mn; (f) EDS mapping of Fe; (g) EDS mapping of Co.
Catalysts 11 00362 g007aCatalysts 11 00362 g007b
Figure 8. EDS analysis the fresh (Fe,Co,Mn)Ox material: (a) EDS spectrum; (b) electronic image of the (Fe,Co,Mn)Ox material; (c) EDS mapping of O; (d) EDS mapping of Fe; (e) EDS mapping of Mn; (f) EDS mapping of Co.
Catalysts 11 00362 g008aCatalysts 11 00362 g008b
Figure 9. SEM micrographs of the (Fe,Co,Mn)Ox material. (a) Image acquired using a 10 kv accelerating voltage at 20,000× length of 2 μm; (b) image acquired using a 10 kv accelerating voltage at 10,000× length of 5 μm; (c) image acquired using a 10 kv accelerating voltage at 1000× length of 50 μm and (d) image acquired a 10 kv accelerating voltage at 5000× length of 10 μm.
Catalysts 11 00362 g009
Figure 10. SEM micrographs of the treated (Fe,Co,Mn)Ox material: (a) Image acquired using a 10 kv accelerating voltage at 10,000× length of 5μm; (b) image acquired using a 10 kv accelerating voltage at 2000× length of 20 μm; (c) image acquired using a 10 kv accelerating voltage at 5000× length of 10 μm; (d) image acquired using a 10 kv accelerating voltage at 20,000× length of 2 μm, and (e) image acquired using a 10 kv accelerating voltage at 3000× length of 10 μm.
Catalysts 11 00362 g010
Table 1. Physical properties during charging from 25 to 1400 °C with rounding to three digit [55].
MaterialOnset Temperature Reduction (°C)ConversionEnthalpy (J/g)Phase Changing Temperature (°C)
CrystallizationMelting
50 wt.% MnO + 50 wt.% CoO40692.3402830530–895
25 wt.% MnO + 75 wt.% CoO39587.500No observation403518–905
75 wt.% MnO + 25 wt.% CoO42587.600138529–808
CoO72086.00No observation284.70850
MnO40083.800No observation33525–834
Fe3O4106390.400No observation281245
Table 2. Specific energy content in kJ/g of reduction (charging) and oxidation (discharging) steps of the six materials.
MaterialEnergy Content in kJ/g at 952 °C O2/O2
Ratio of Energy Uptake to Energy Release at 952 °C in %
Cycle 1Cycle 2
ReductionOxidationReductionOxidationCycle 1 Cycle 2
50 wt.% MnO + 50 wt.% CoO4.426.30023.80057.30016.70041.500
25 wt.% MnO + 75 wt.% CoO2.23316.400716.70023.100
75 wt.% MnO + 25 wt.% CoO4.232.40025.5007312.96034.900
CoO6.436.70023.90080.9017.40029.500
MnO627.300325824.20055.200
Fe3O46.44039.500821648.200
Table 3. The oxygen uptake and release ratio metallic oxides during redox reaction.
MaterialsO2 Released (μmol/g)O2 Uptake (μmol/g)O2 Uptake/O2 Released Ratio
1st Cycle2nd Cycle1st Cycle2nd Cycle1st Cycle2nd Cycle
25 wt.% Mno + 75 wt.% CoO21251625162515630.7600.960
50 wt.% Mno + 50 wt.% CoO22501843187518190.8300.990
75 wt.% Mno + 50 wt.% CoO39721569165015610.4200.996
100 wt.% CoO20321413147512380.7300.880
100 wt.% Fe3O45161066109710632.1000.997
100 wt.% Mno13723914693750.3400.960
Table 4. Gas flow rate and O2 storage capacity.
MaterialsO2 RELEASED (μmol/g)O2 Uptake (μmol/g)O2 Uptake/O2 Released Ratio
Argon and O2 Flow1st Cycle2nd Cycle1st Cycle2nd Cycle1st Cycle2nd Cycle
20–20101733818815918.44047.200
30–20109738840432736.81084.270
30–30115939329318725.35047.690
30–50112946331424327.81054.465
Publisher’s Note: MDPI stays neutral with regard to jurisdictional claims in published maps and institutional affiliations.

