2.1. Characterization Results
Table 1 shows the expected and actual compositions of the synthesized catalysts, as well as their surface area.
The ICP-OES results indicate that the composition of the catalysts obtained by coprecipitation of the precursors is in good agreement with the targeted values. The BET area of CZA_30 is ca. 3 times higher than that of CZA_60, which is not surprising due to the higher content of Al2O3 in the former catalyst. Copper dispersion in CZA_60 is lower than that of the CZA_30 but, due to the higher Cu loading, its Cu surface area is higher.
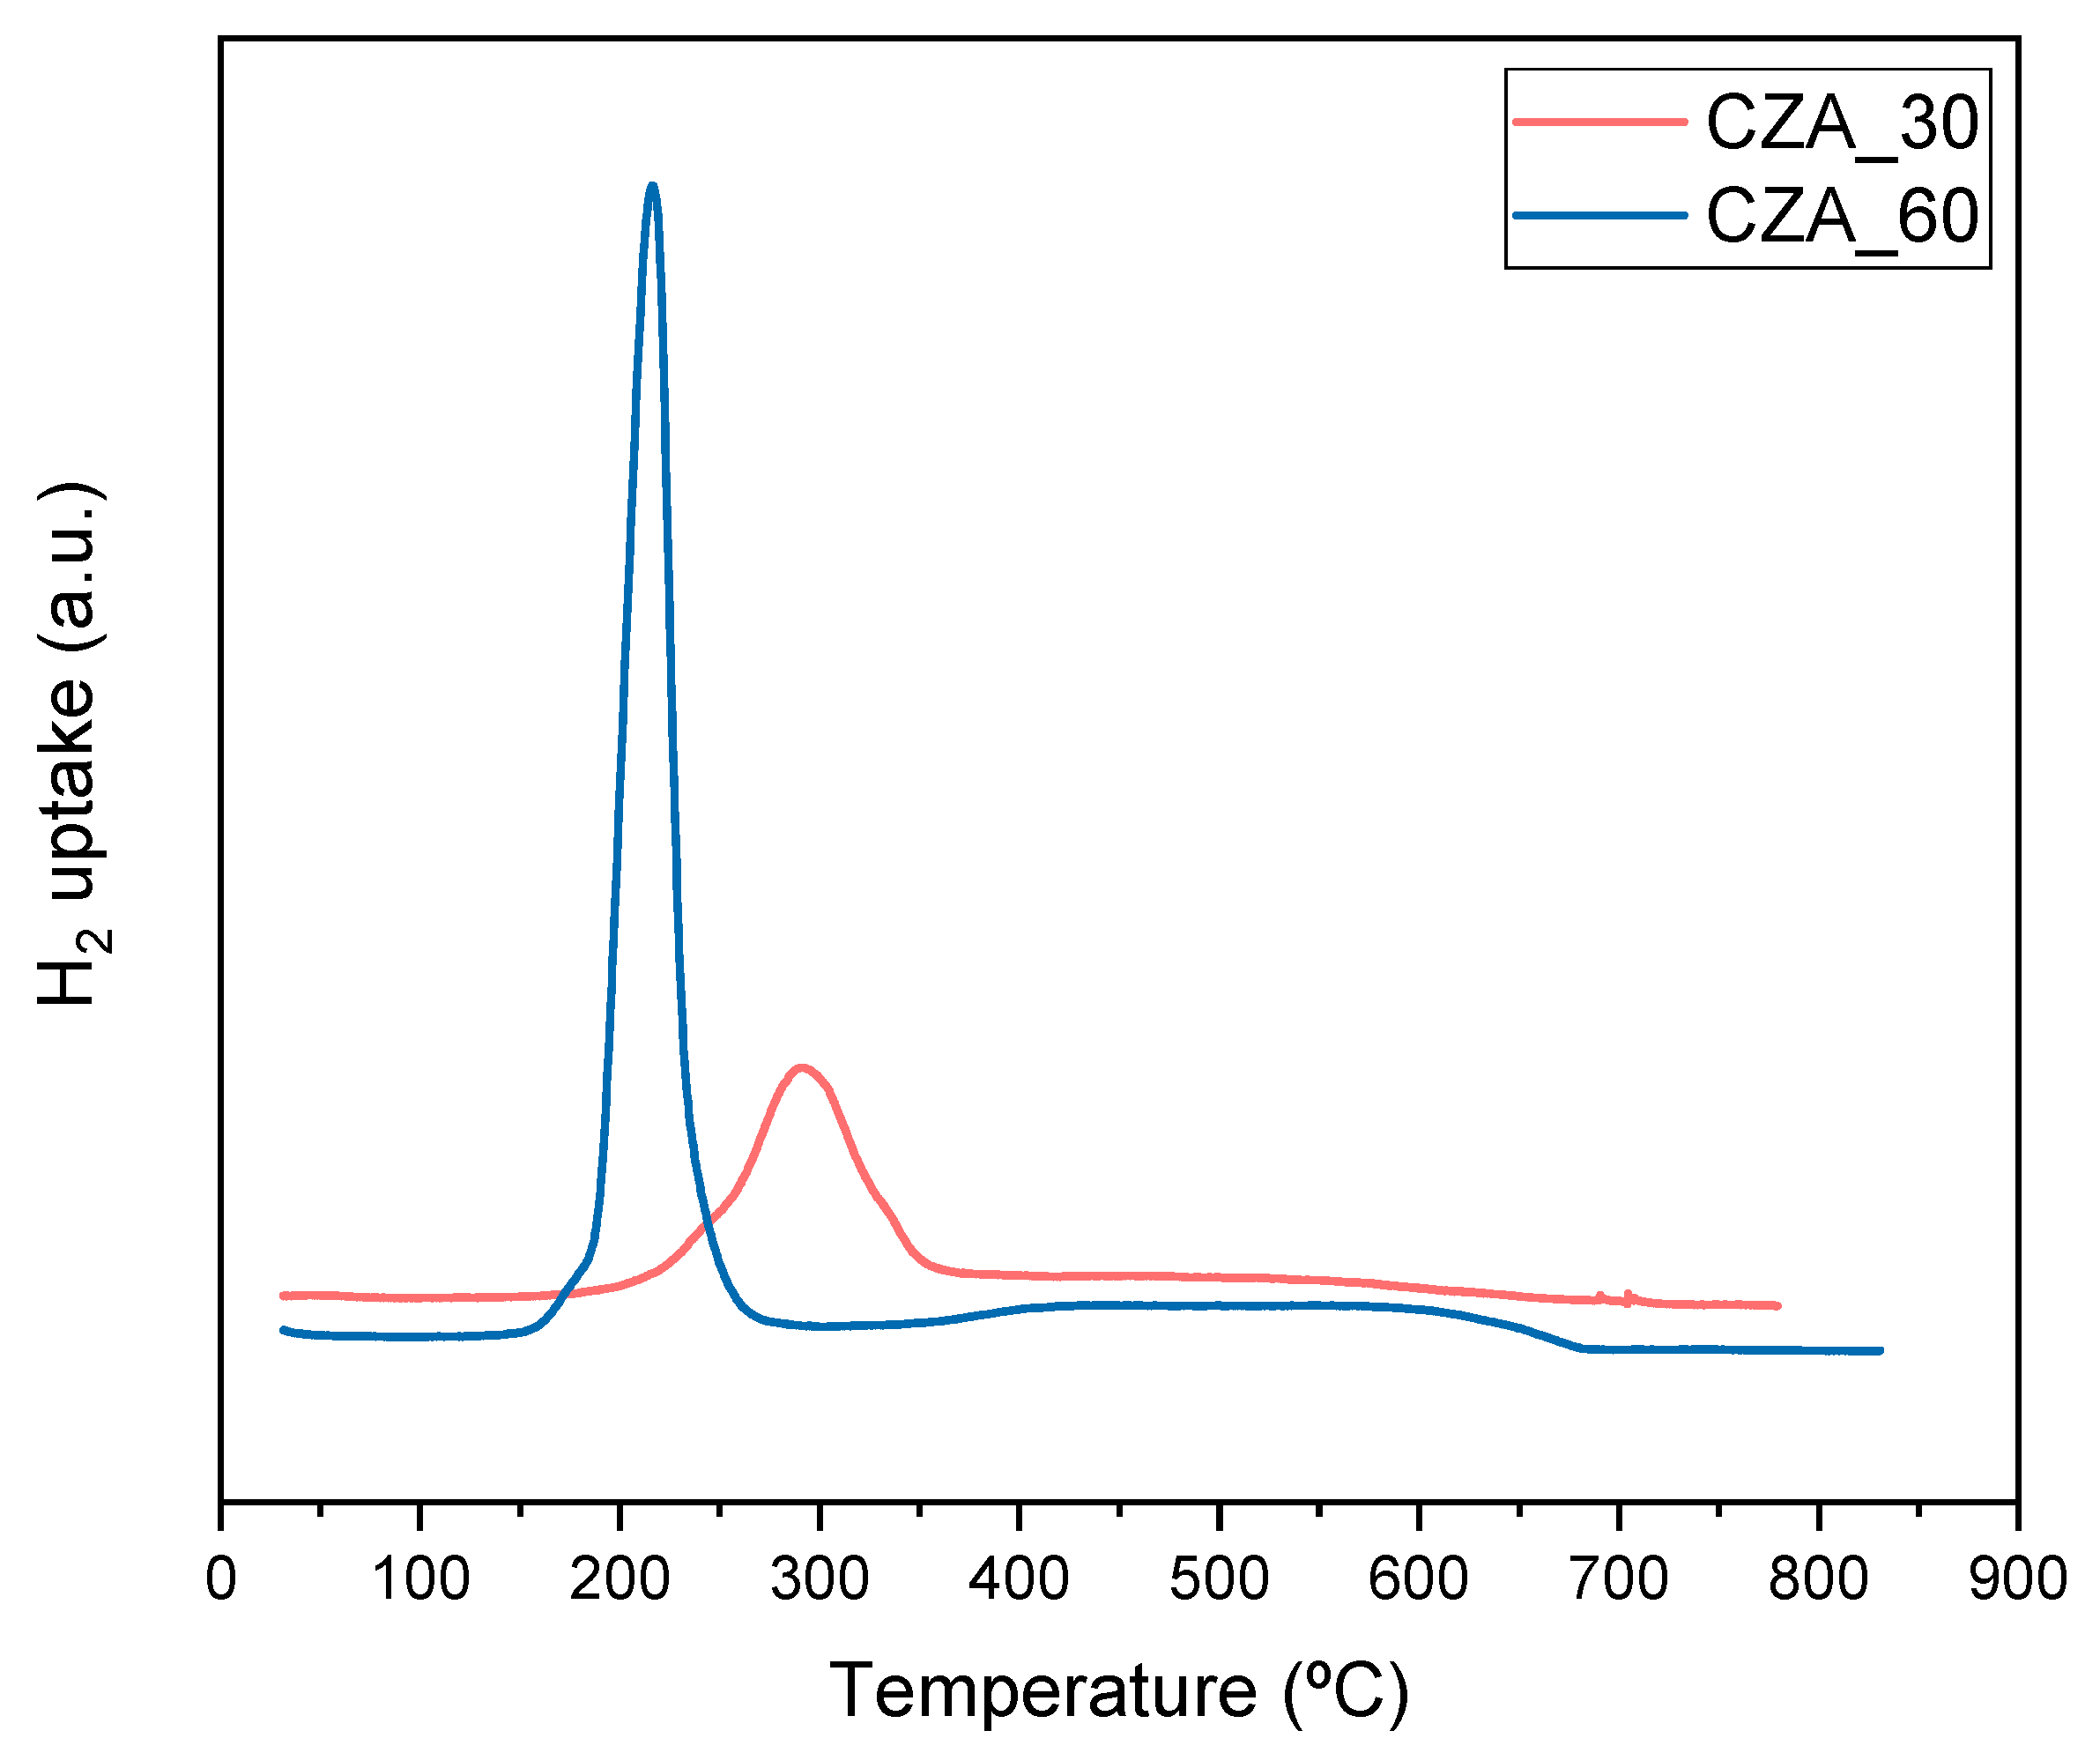
The temperature programmed reduction (TPR) profiles of the catalysts are shown in
Figure 1. The reduction profile of CZA_60 displays a broad peak between 150 and 275 °C, shifting to higher temperatures (between 200 and 350 °C) in CZA_30. This peak characterizes the reduction processes of the CuO particles. The shifting of the reduction peaks to higher temperatures has been ascribed to a lower reducibility of copper by strong interaction with Al
2O
3, forming a Cu-Al spinel at higher alumina content [
29].
The surface composition of the reduced catalysts (30 min at 250 °C under 20% H
2 in N
2, ramp 2 °C/min) was analyzed by X-ray photoelectron spectra (XPS). The spectra of both catalysts display peaks of Cu, Zn, Al and O. The binding energy of the Cu 2p
3/2 core-level at 932.5 eV is consistent with the presence of metallic Cu, although the presence of a weak shake-up satellite at 944 eV indicates that at least part of the copper was oxidized to CuO during the transfer to the XPS pre-chamber. The relative atomic surface composition of the catalyst, calculated from the integration of the Cu 2
p3/2, Zn 2
p3/2 and Al 2
p core-levels (using a Shirley background) of the reduced samples obtained by XPS are summarized in
Table 2.
The Cu/ZnO ratios obtained from the XPS analysis for both samples are close to 1, which is half of what is expected from ICP-OES analysis. This could indicate sintering of copper during the reduction process. On the other hand, the content of alumina on the surface is much higher than expected (see
Table 1), showing an important segregation of dispersed Al
2O
3 (see X-ray diffraction (XRD) results below). This segregation is relatively higher in the CA_60 catalyst, with a lower content of alumina.
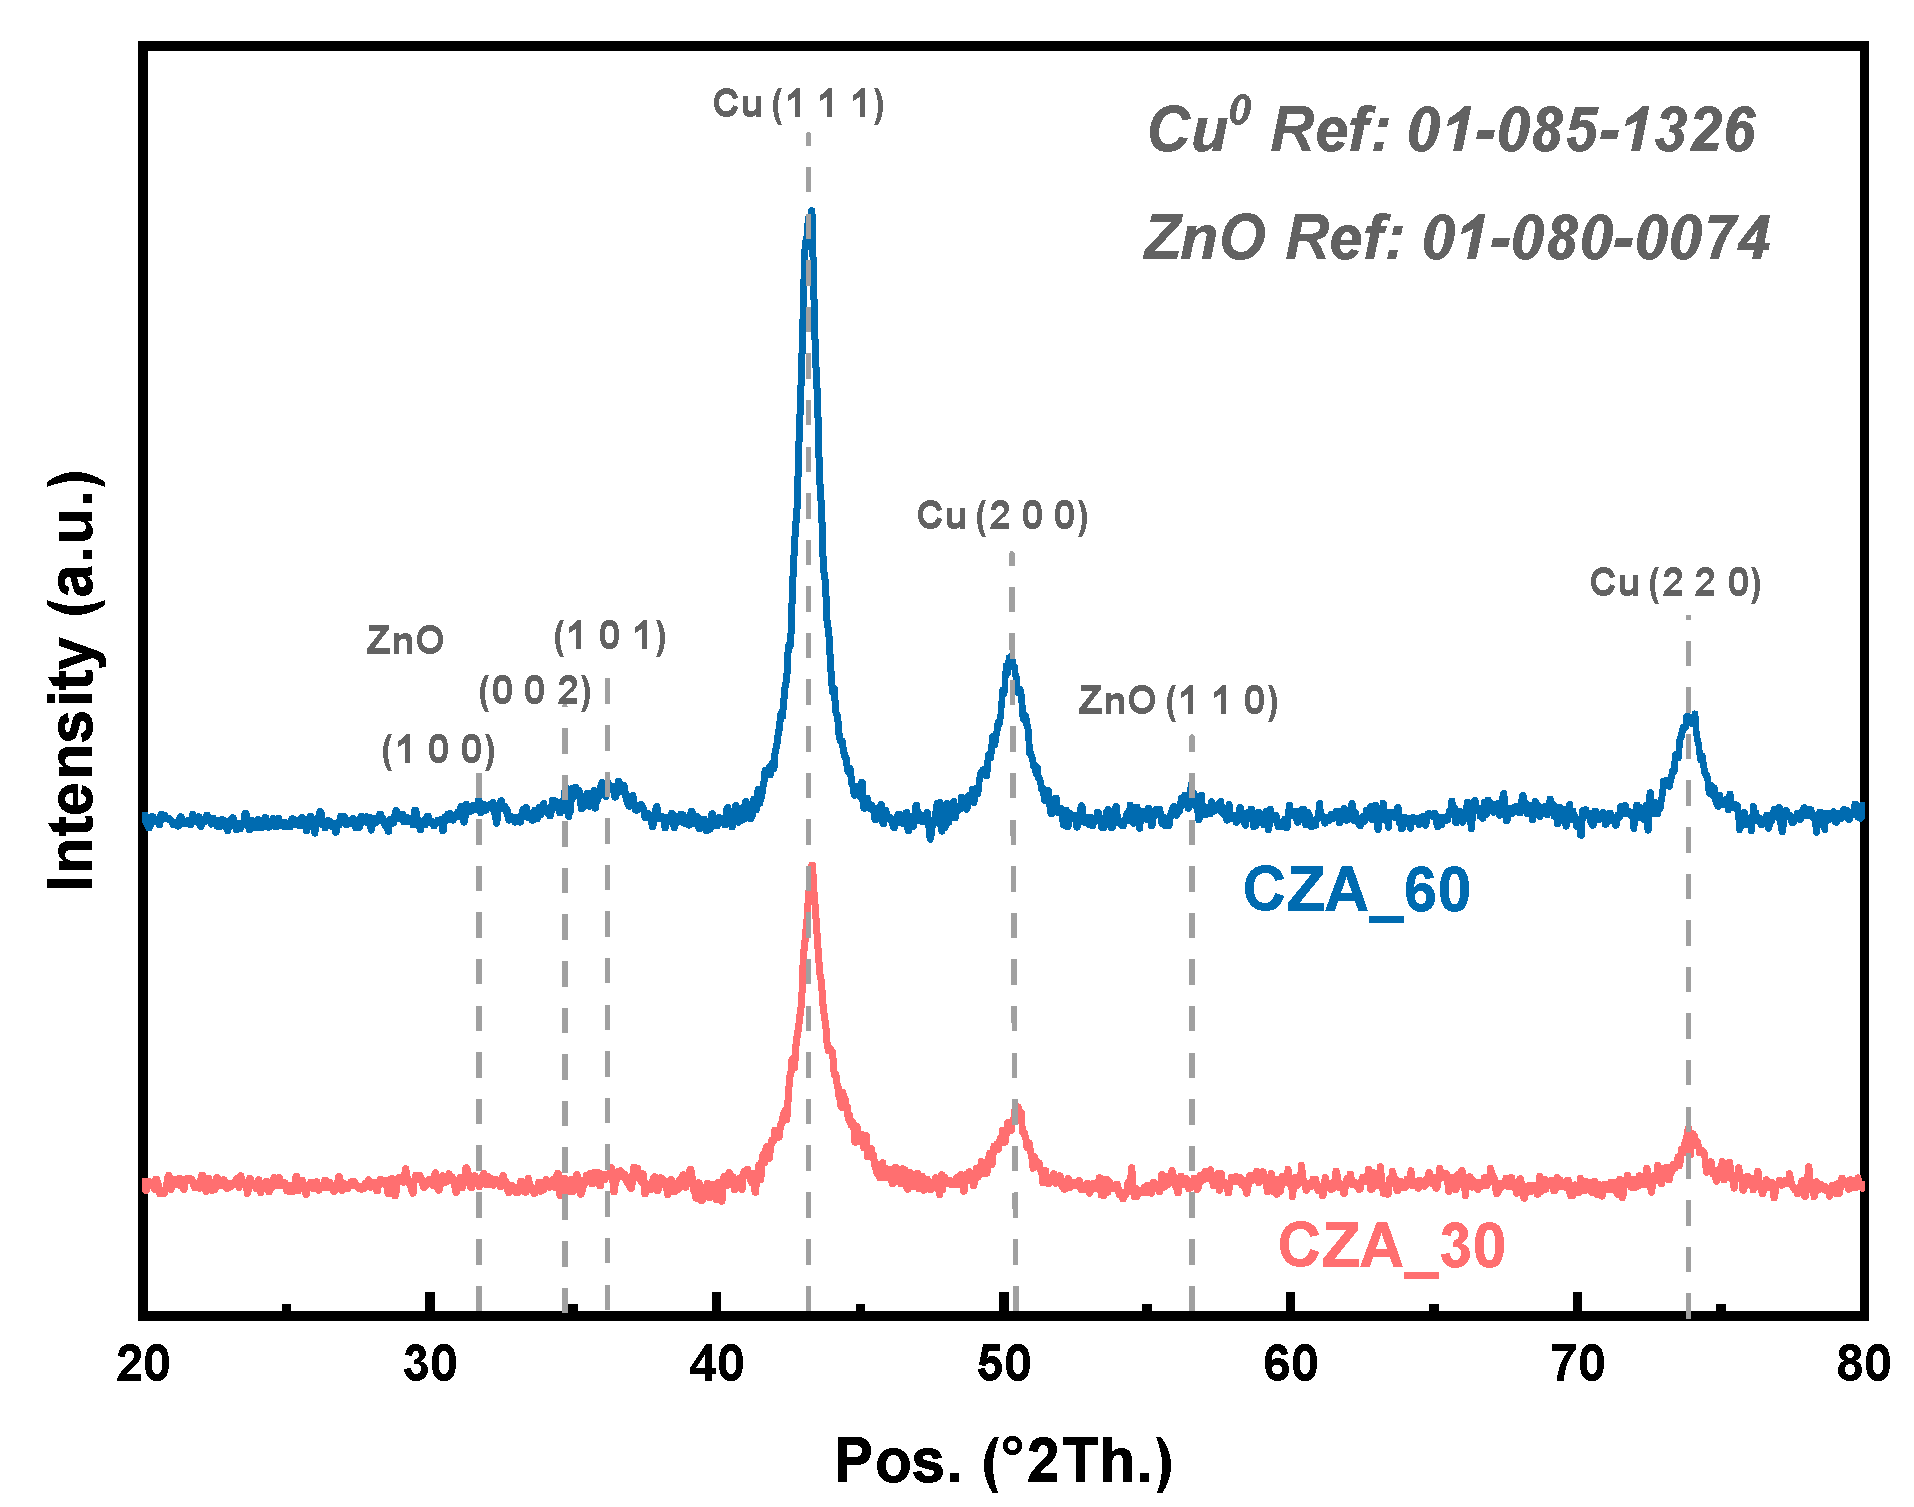
Figure 2 shows the XRD patterns of the reduced catalysts, CZA_60 and CZA_30. The diffractograms display the set of diffractions that can be ascribed to the cubic-phase Cu
0 (Ref. Pattern 01-085-1326, space group Fm3m). Please note that the catalysts are treated in situ under H
2 atmosphere at 250 °C, which is the reduction temperature of the catalysts in the reactor. The diffractogram for CZA_60 also displays a set of diffraction lines that can be ascribed to the hexagonal-phase ZnO (Ref. Pattern 01-080-0074, space group P63mc). The diffractograms lack of diffraction lines that can be ascribed to Al
2O
3, which suggests the formation of an amorphous Al
2O
3 phase. The Cu
0 crystalline size was determined by the Scherrer equation using the Cu (1 1 1) reflection. Values of 10.3 and 9.5 nm were obtained for the CZA_60 and CZA_30 catalysts, respectively. These values are consistent with the dispersion values obtained from the N
2O chemisorption experiments, as reported in
Table 1.
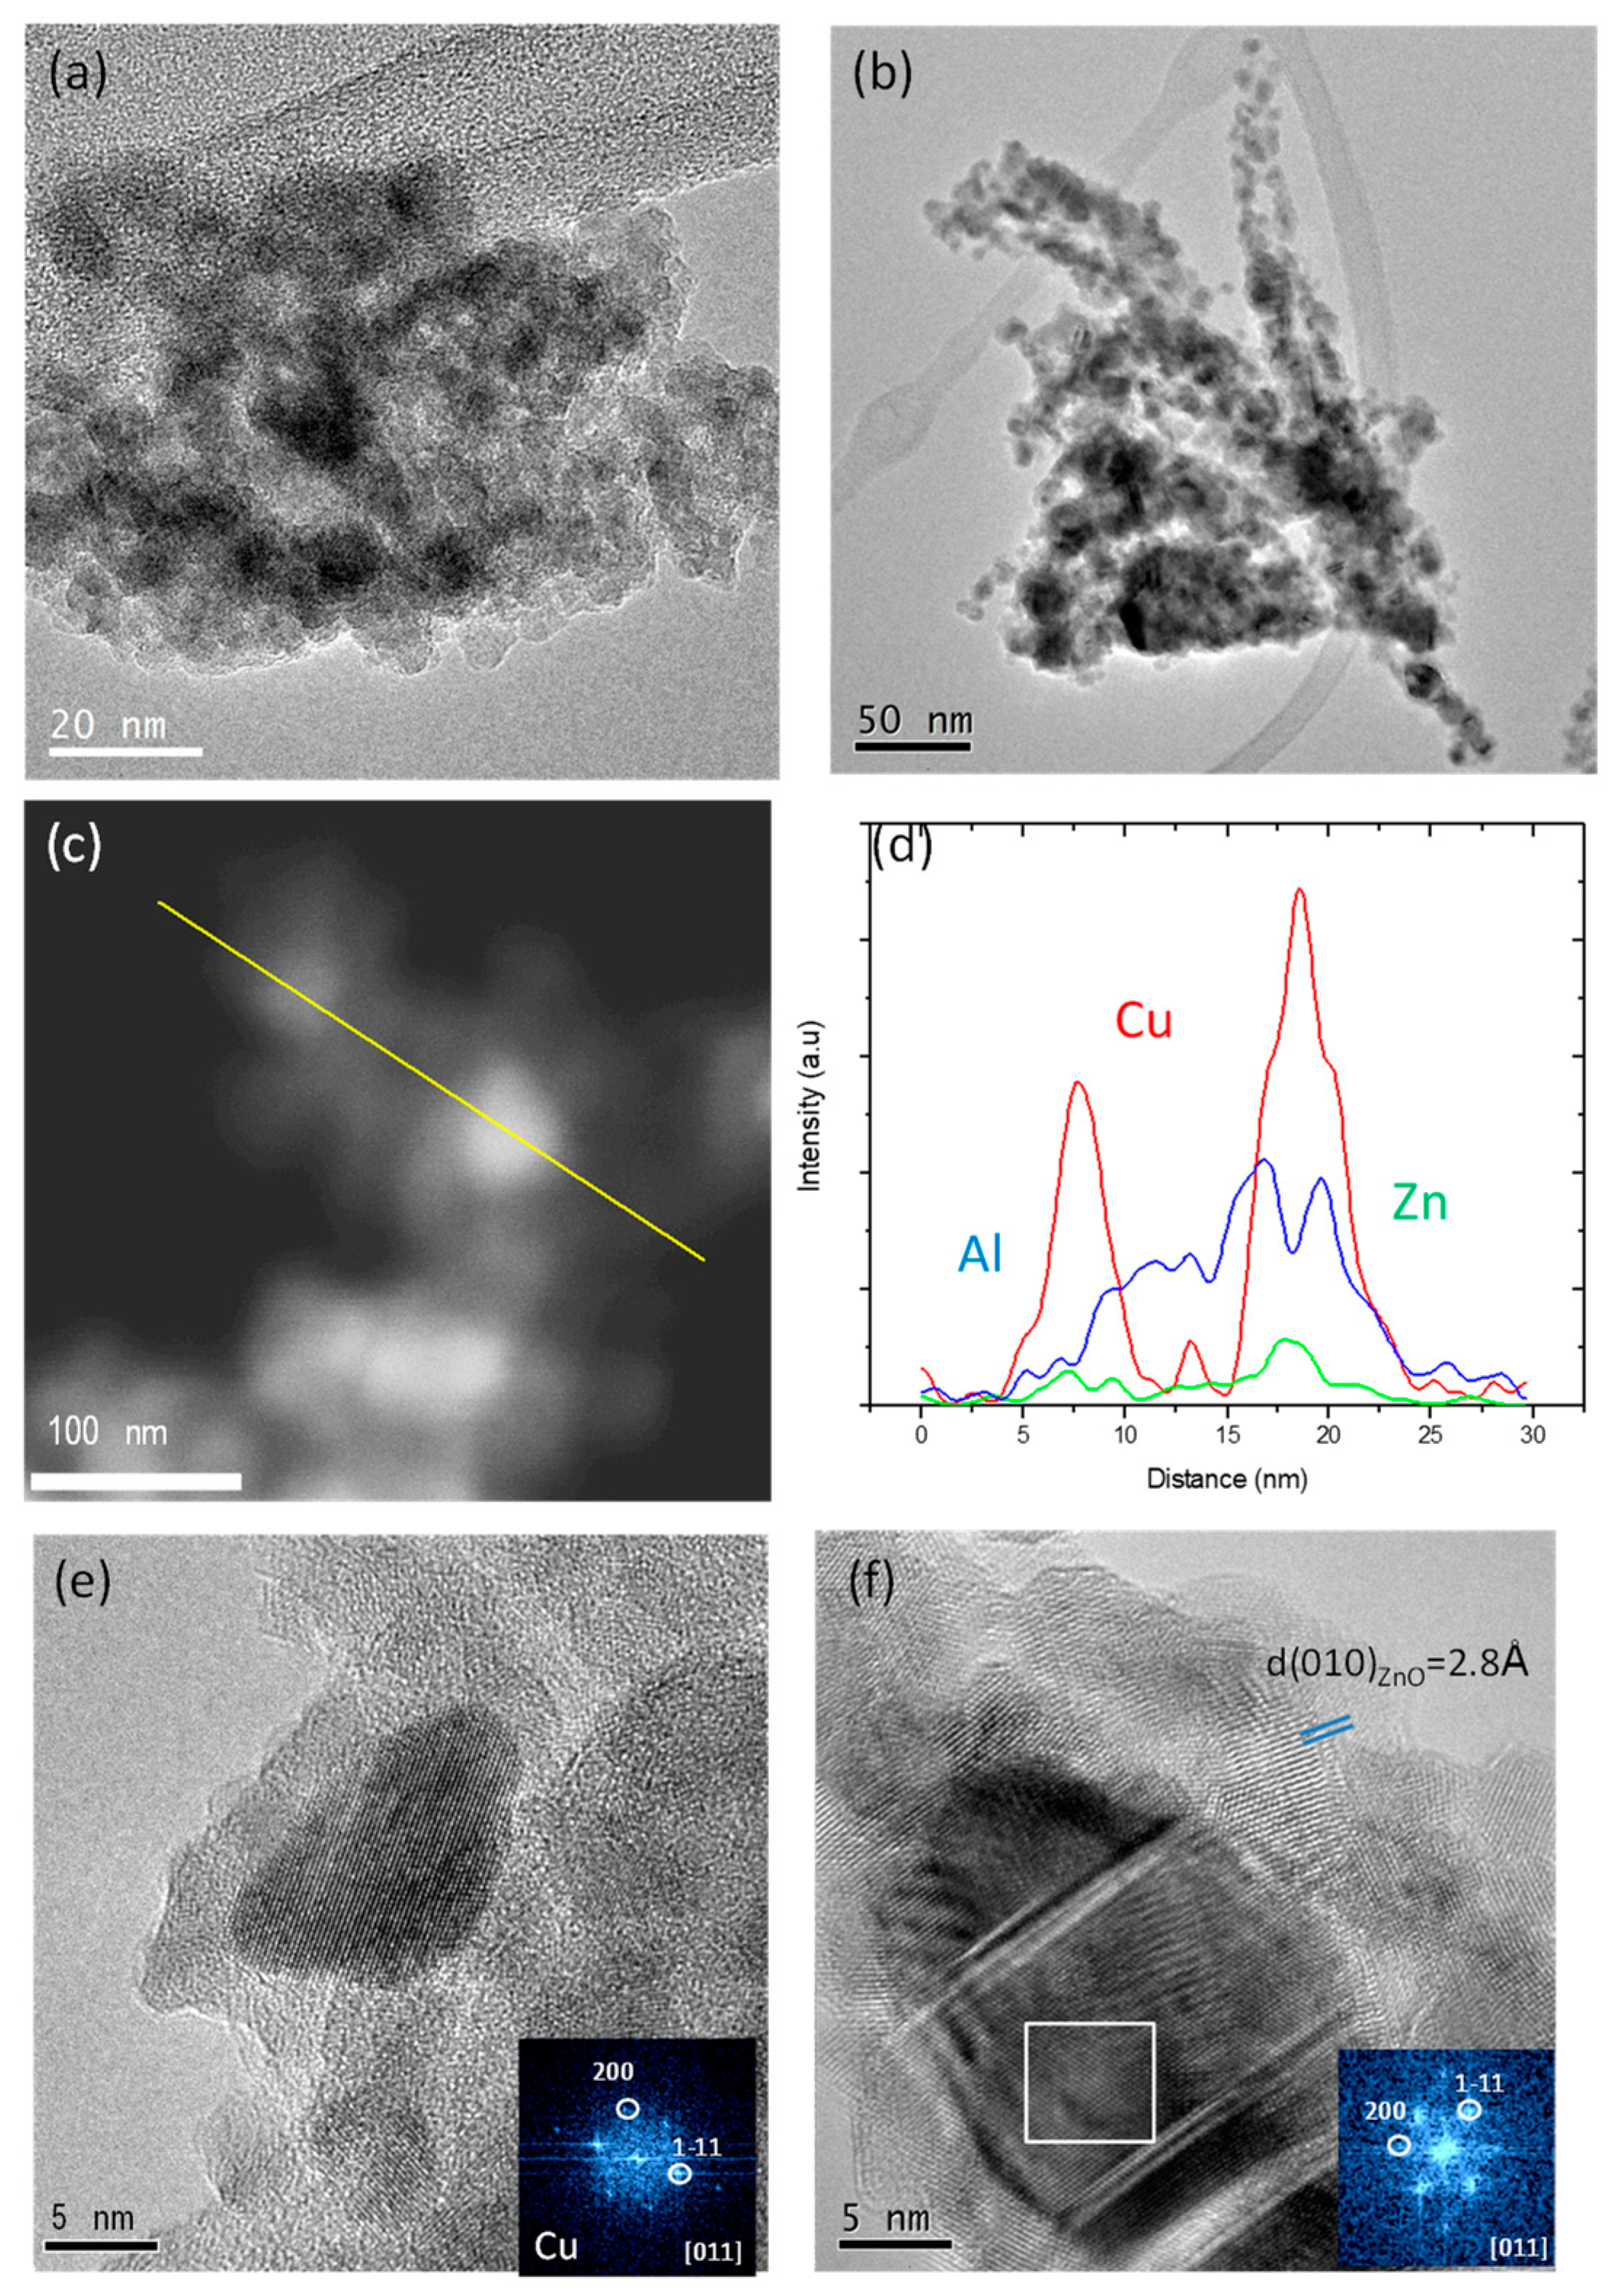
Figure 3a,b show representative conventional Transmission Electron Microscopy (TEM) micrographs of samples CZA_30 and CZA_60, respectively. As observed, both samples are composed of agglomerates of smaller particles. The agglomerates in CZA_30 are more compact, while in the CZA_60 they have needle shape. More detailed analyses through STEM-HAADF (Scanning Transmission Electron Microscopy–High Angle Annular Dark Field) and EDX (Energy Dispersive X-ray Spectroscopy) line profile are shown in
Figure 3c,d. As observed, the Cu particles appear embedded (or surrounded) by the ZnO and Al
2O
3 phases. This is evident in the HRTEM (High Resolution–TEM) images of
Figure 3e,f. In both cases, a Cu particle oriented down the [010] zone axis and surrounded by ZnO and Al
2O
3 is displayed. In the case of CZA_30 (
Figure 3e), the particle displays a smaller particle size and the ZnO and Al
2O
3 phases present also smaller sizes and more disorder than in the case of CZA_60 (
Figure 3f), where Cu particles clearly show the presence of crystalline defects such as stacking faults. In the latter, ZnO can be clearly identified by the 2.8 A interplanar distance attributable to the (010) plane of the P63mc space group.
Figure 4a,b show the elemental distribution of Cu, Zn, and Al from EDX maps, pointing out a heterogeneous dispersion of the three phases in both samples.
2.2. Performance of CZA_30 for the WGS
The aim of this work is to study the effect of modifying the CO
2/CO ratio in the syngas feed used for the synthesis of methanol from syngas via in situ r-WGS reaction. Therefore, we first tested performance of CZA_30. We observed that under the conditions studied in this work, CZA_30 only displayed activity for the r-WGS reaction. CO
2 and CO (H
2O and H
2 are not detected in our analytical setup) are the only products detected at the outlet of the reactor. The outlet CO
2/CO ratios at different conditions studied in this work are shown in
Table 3. The CO
2/CO thermodynamic equilibrium ratios are also shown for comparison.
Although the different methanol synthesis processes proposed in this work were tested at a total GHSV of 7500 mLsyngas/h/mLcatalytic bed (henceforth, h−1) to compare reactors with a similar size operating with similar feed flows, the r-WGS reaction was tested at 15,000 h−1. This decision is based on the assumption that the real GHSV of the syngas along the CZA_30 in the combined beds would be about 15,000 h−1. By testing the r-WGS catalyst at this GHSV, we obtained a better estimation of the composition of the gas that enters the methanol catalyst in the combined beds after being pre-treated.
The results in
Table 3 indicate that the CZA_30 catalyst effectively provides a decrease of the CO
2/CO ratio, which at 270 °C reaches a value close to that of the equilibrium at 25 and 50 bar, respectively. The decrease in this ratio is less evident at 240 °C, from 1.9 to 1.8, showing that the temperature has a major effect on the catalytic activity of CZA_30. Also, the CO
2 conversion at the equilibrium decreases with the decreasing temperature, as reflected by the higher CO
2/CO conversion at the equilibrium at 240 °C. These results anticipate the importance of the process conditions, especially the temperature, when trying to increase the methanol production using the r-WGS pre-treatment.
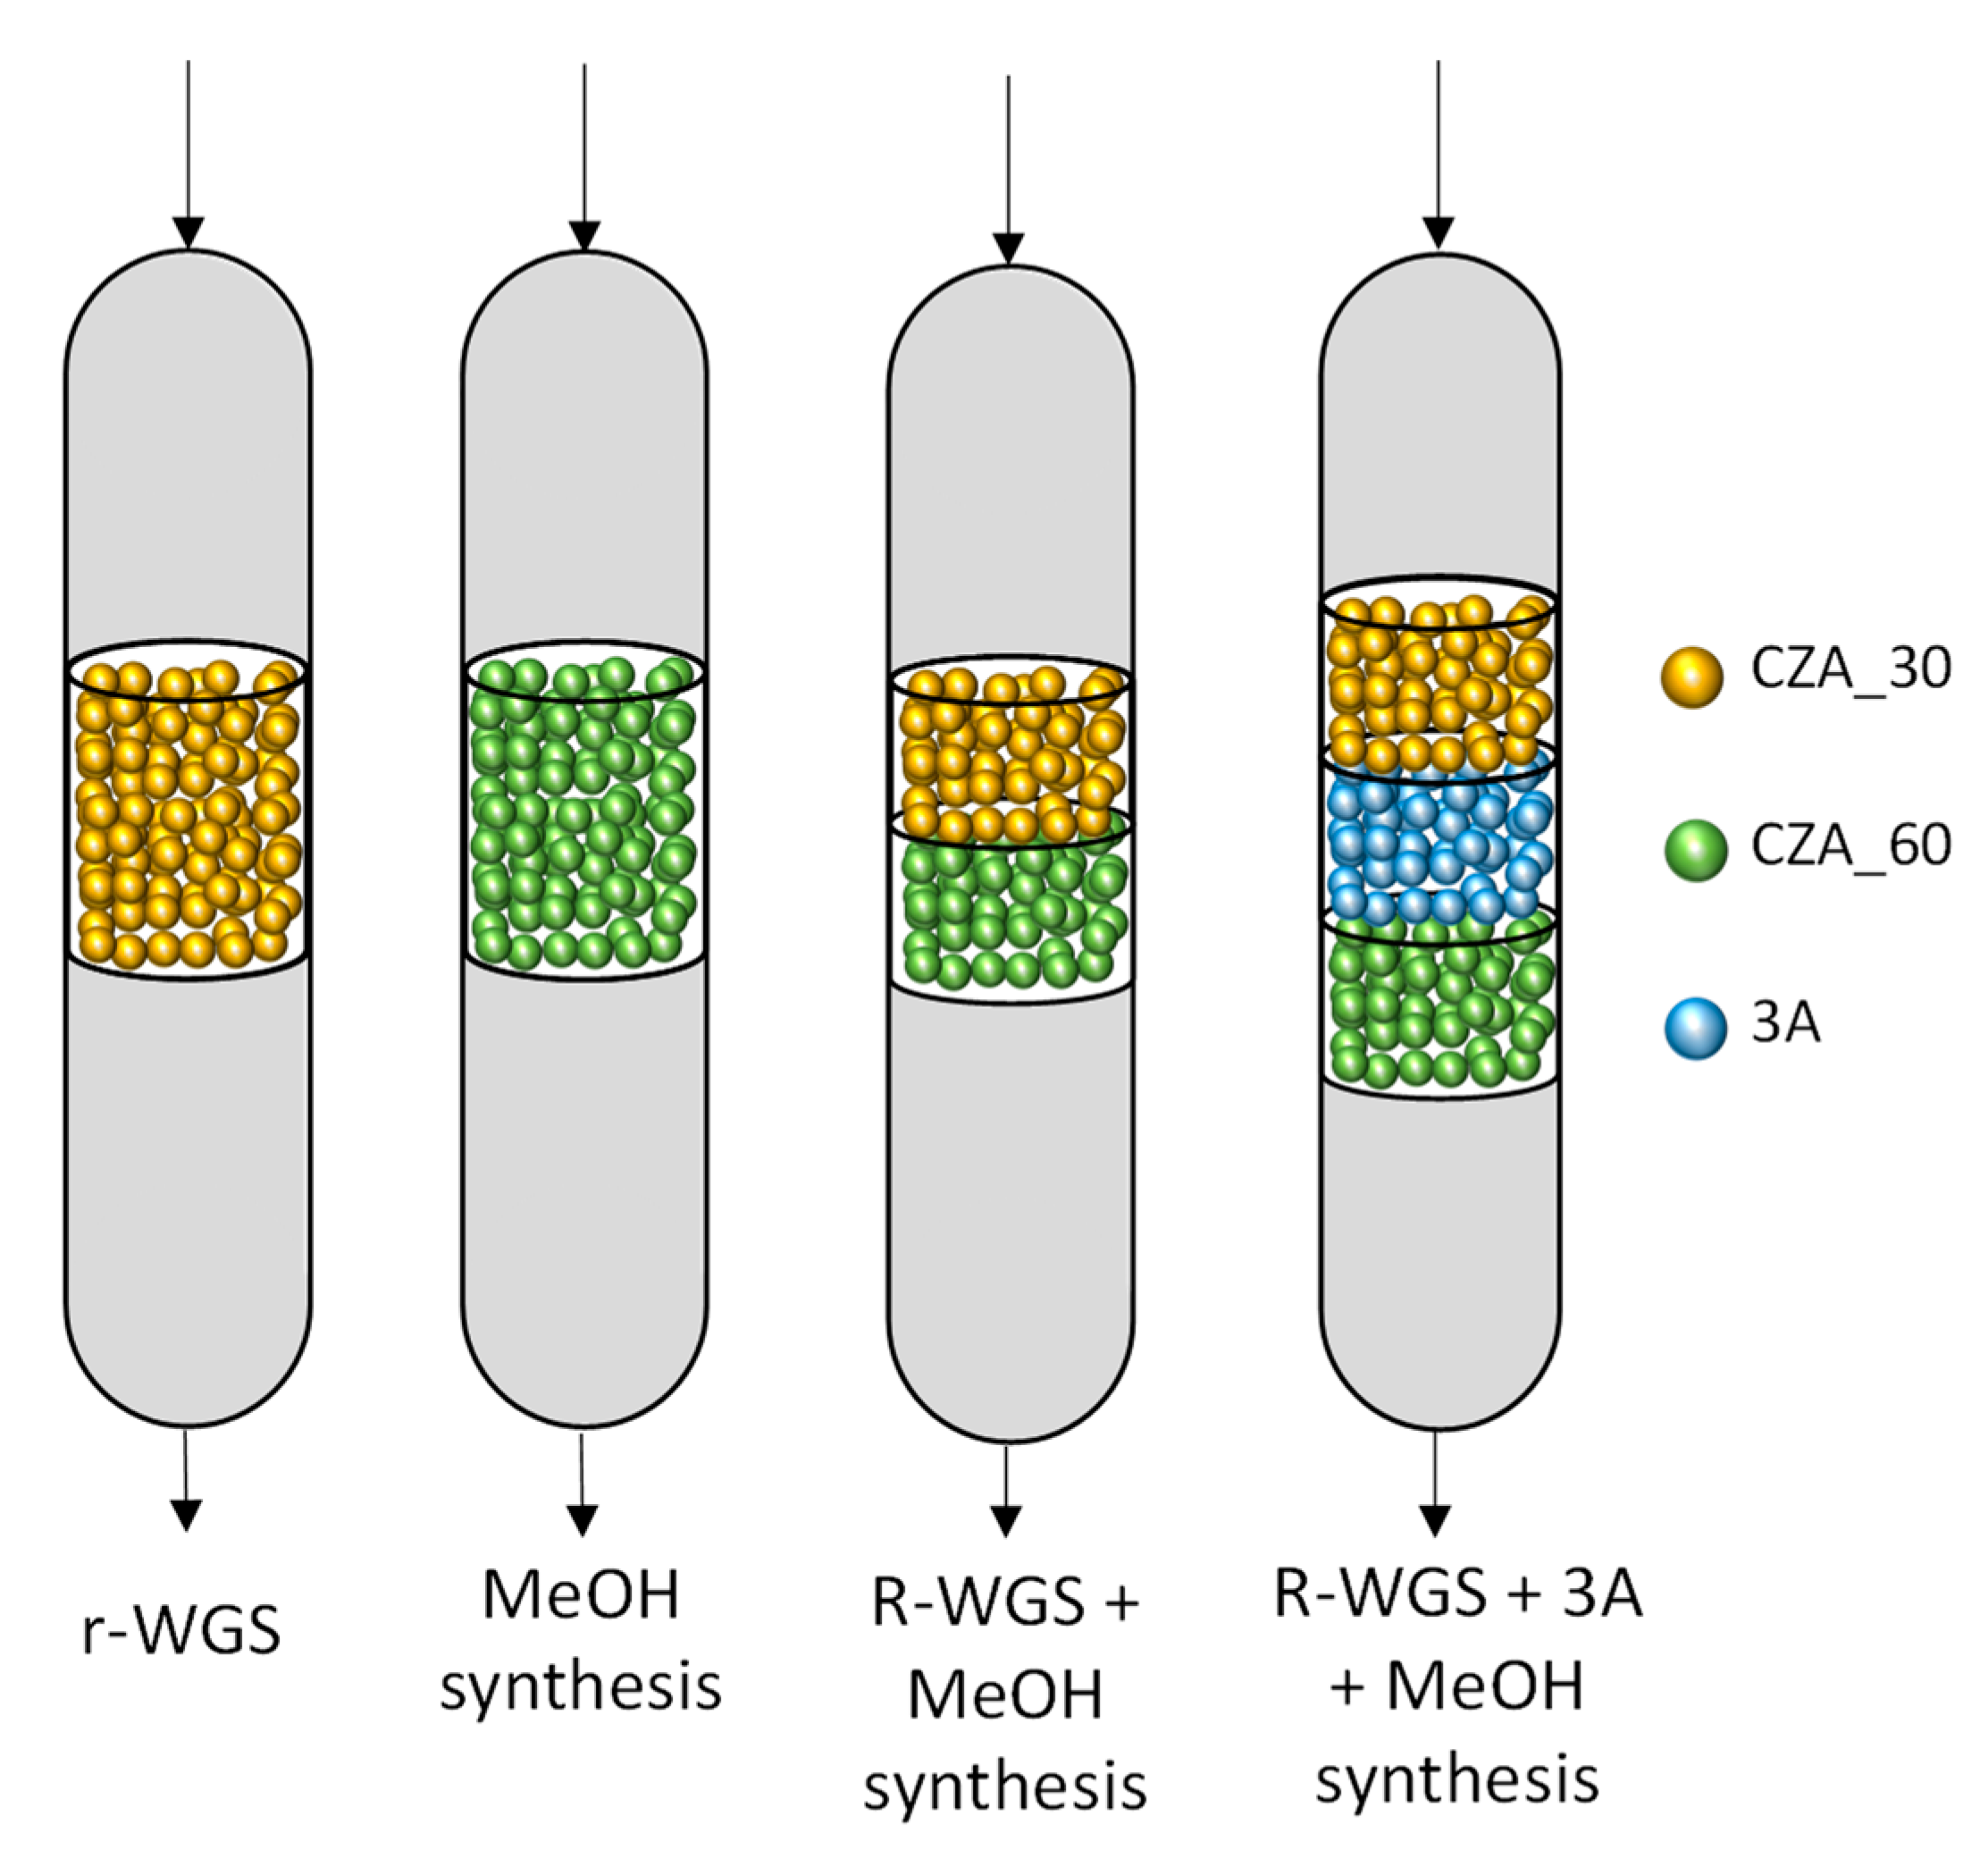
2.3. Synthesis of Methanol in a Single Catalytic Bed
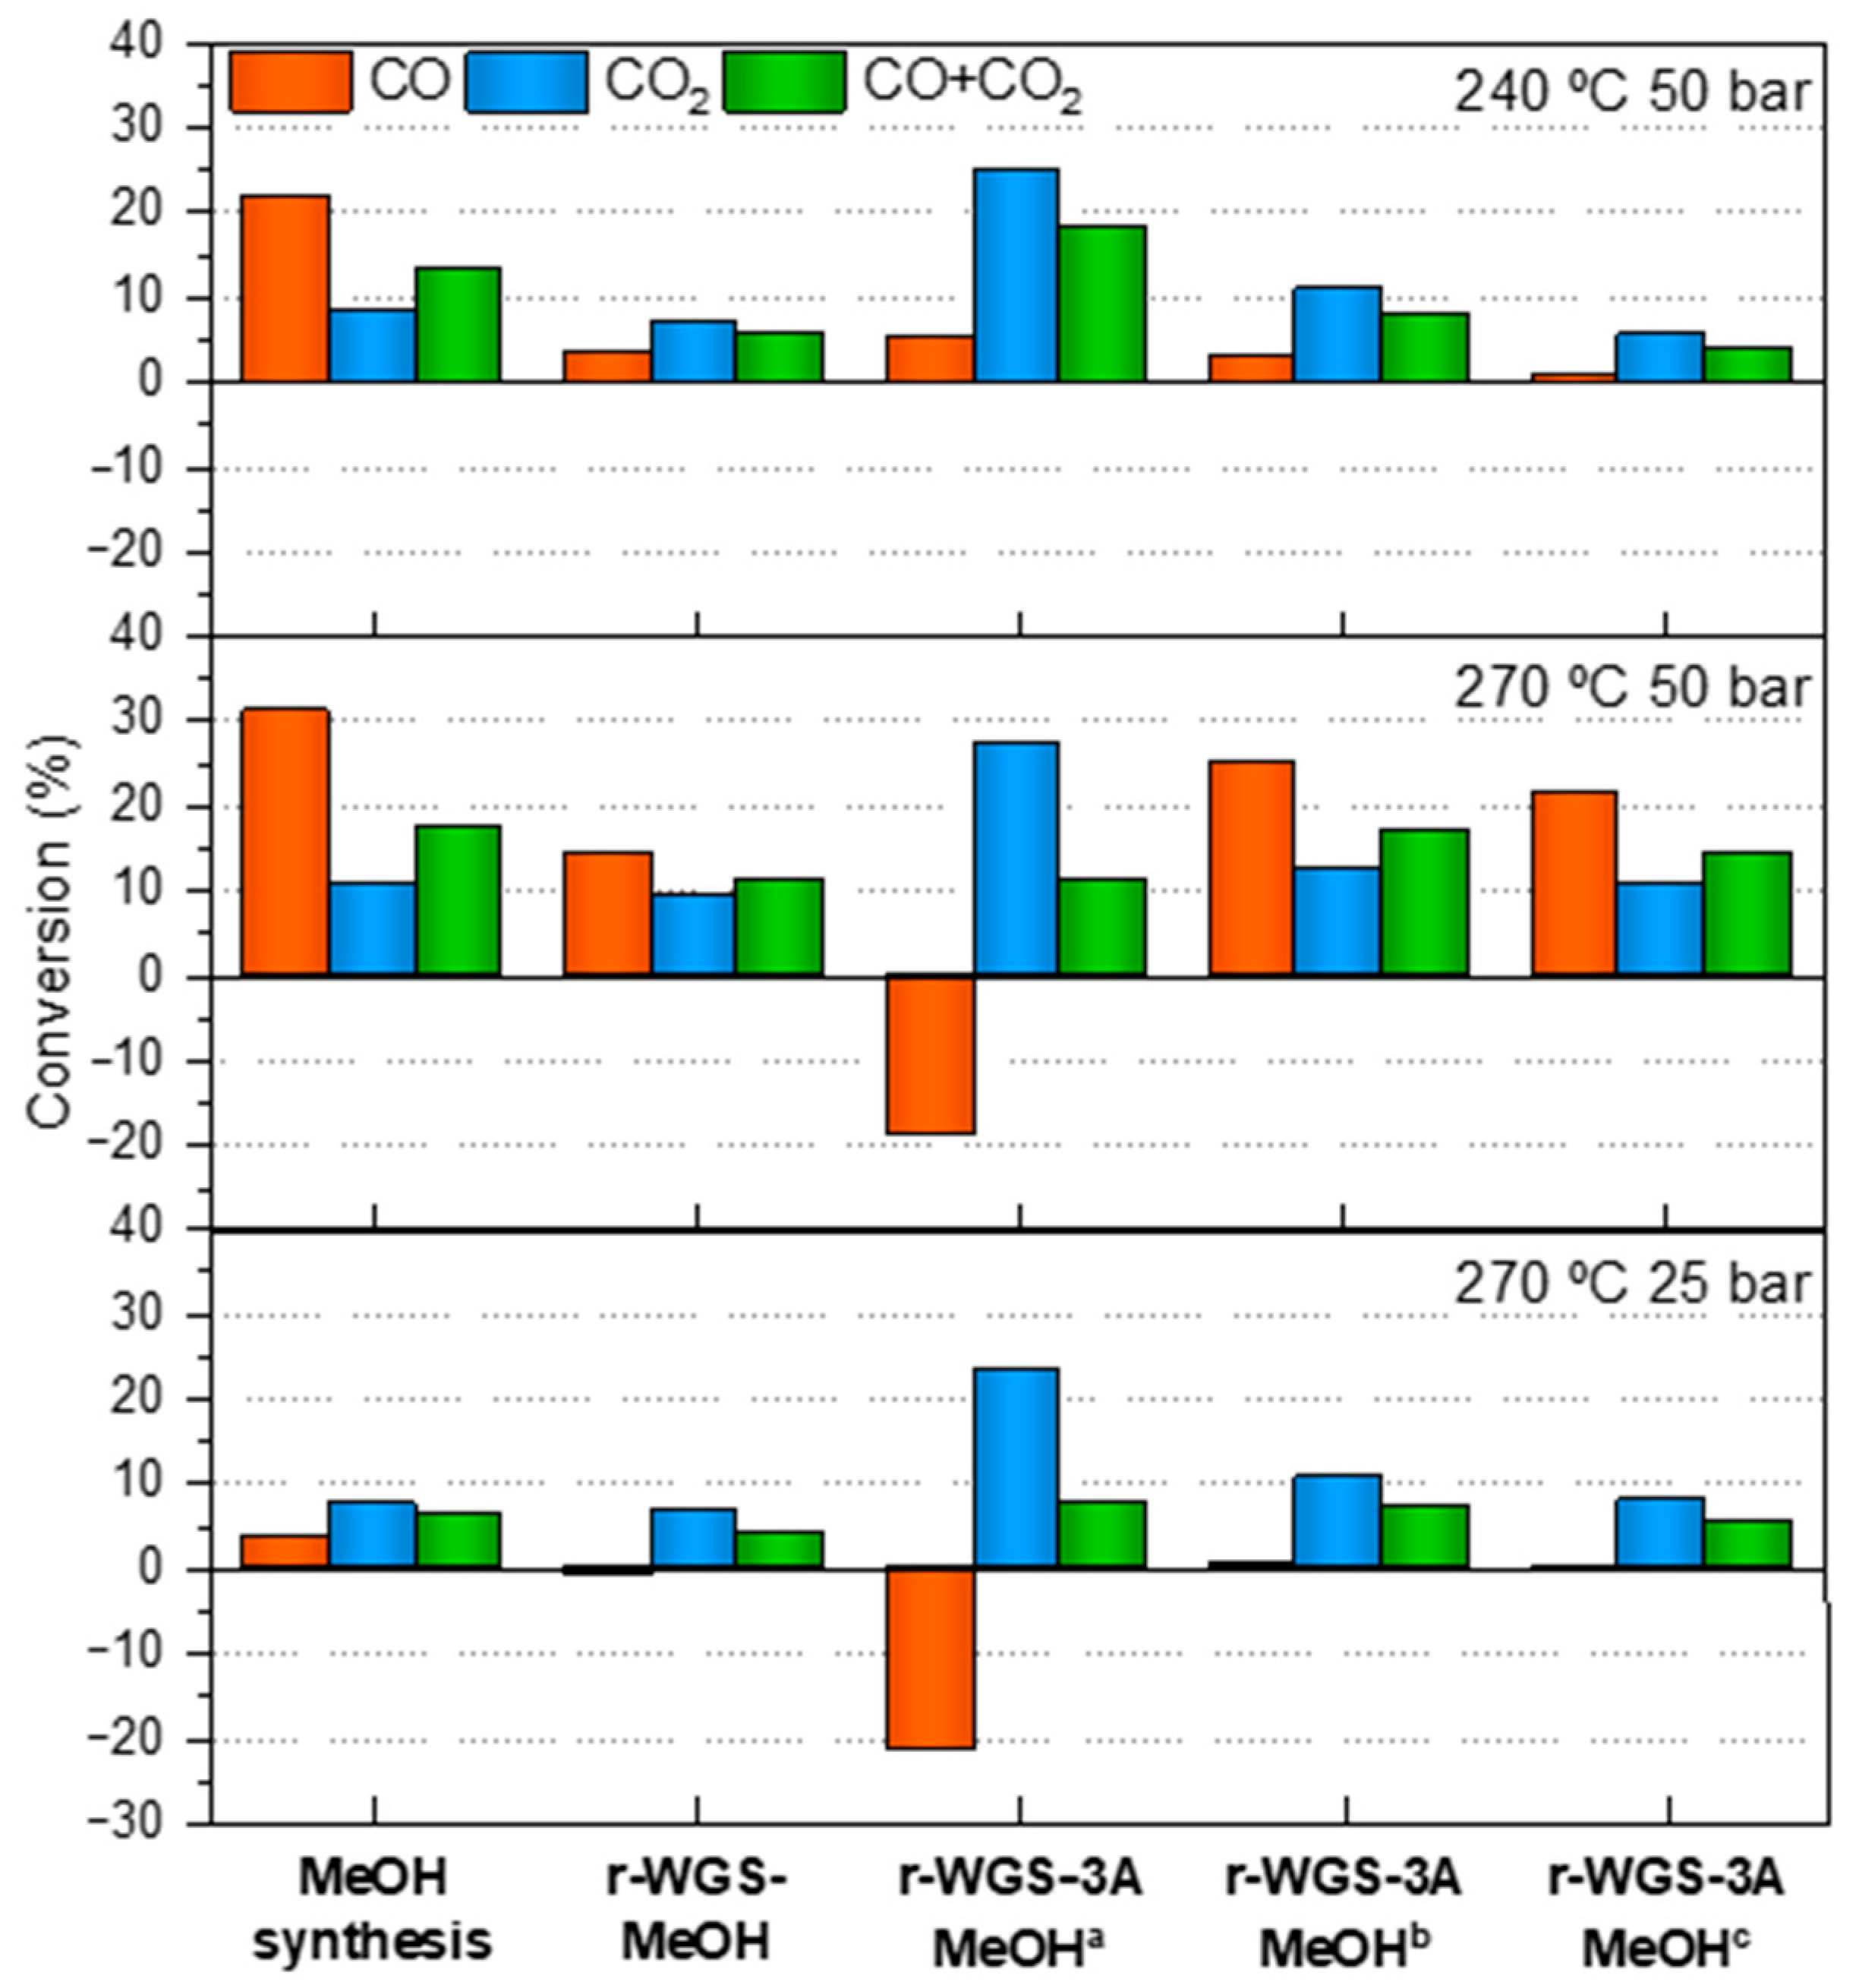
Figure 5 compares the three methanol production processes considered in this work (MeOH, r-WGS-MeOH and r-WGS-3A-MeOH productions), in terms of CO, CO
2 and total carbon conversion at different reaction conditions of pressure and temperature, including the stages 1, 2 and 3 of the r-WGS-3A-MeOH synthesis process (Stage 1—First collected data set of the experiment (TOS near to 0). Stage 2—Value at TOS near to 2, within the dynamic state. Stage 3—Value after the stationary state was reached (saturation of the sorbent)). The methanol synthesis experiments demonstrated that CZA_60 catalyst is active for this reaction, yielding higher CO and CO
2 conversions at increasing pressures and temperatures. The increase in CO and CO
2 conversions at 50 bar and 270 °C with respect to those at 25 bar and the same temperature can be explained, at least partly, from the thermodynamics of the system. The equilibrium conversions for CO and CO
2 increase from 6.6 and 10.4%, respectively, to 39.4 and 13.9% by increasing reaction pressure from 25 to 50 bar. Conversely, the drop in the conversion values from 270 °C to 240 °C at 50 bar is an effect of the catalytic activity, which decreases at lower temperatures. The equilibrium conversion values at 240 °C and 50 bar are 73.3% for CO and 14.8% for CO
2, meaning that the methanol production is thermodynamically more favored at 240 °C than at 270 °C at 50 bar. Thus, the worse results at 240 °C respond not to a thermodynamic but to a catalytic limitation.
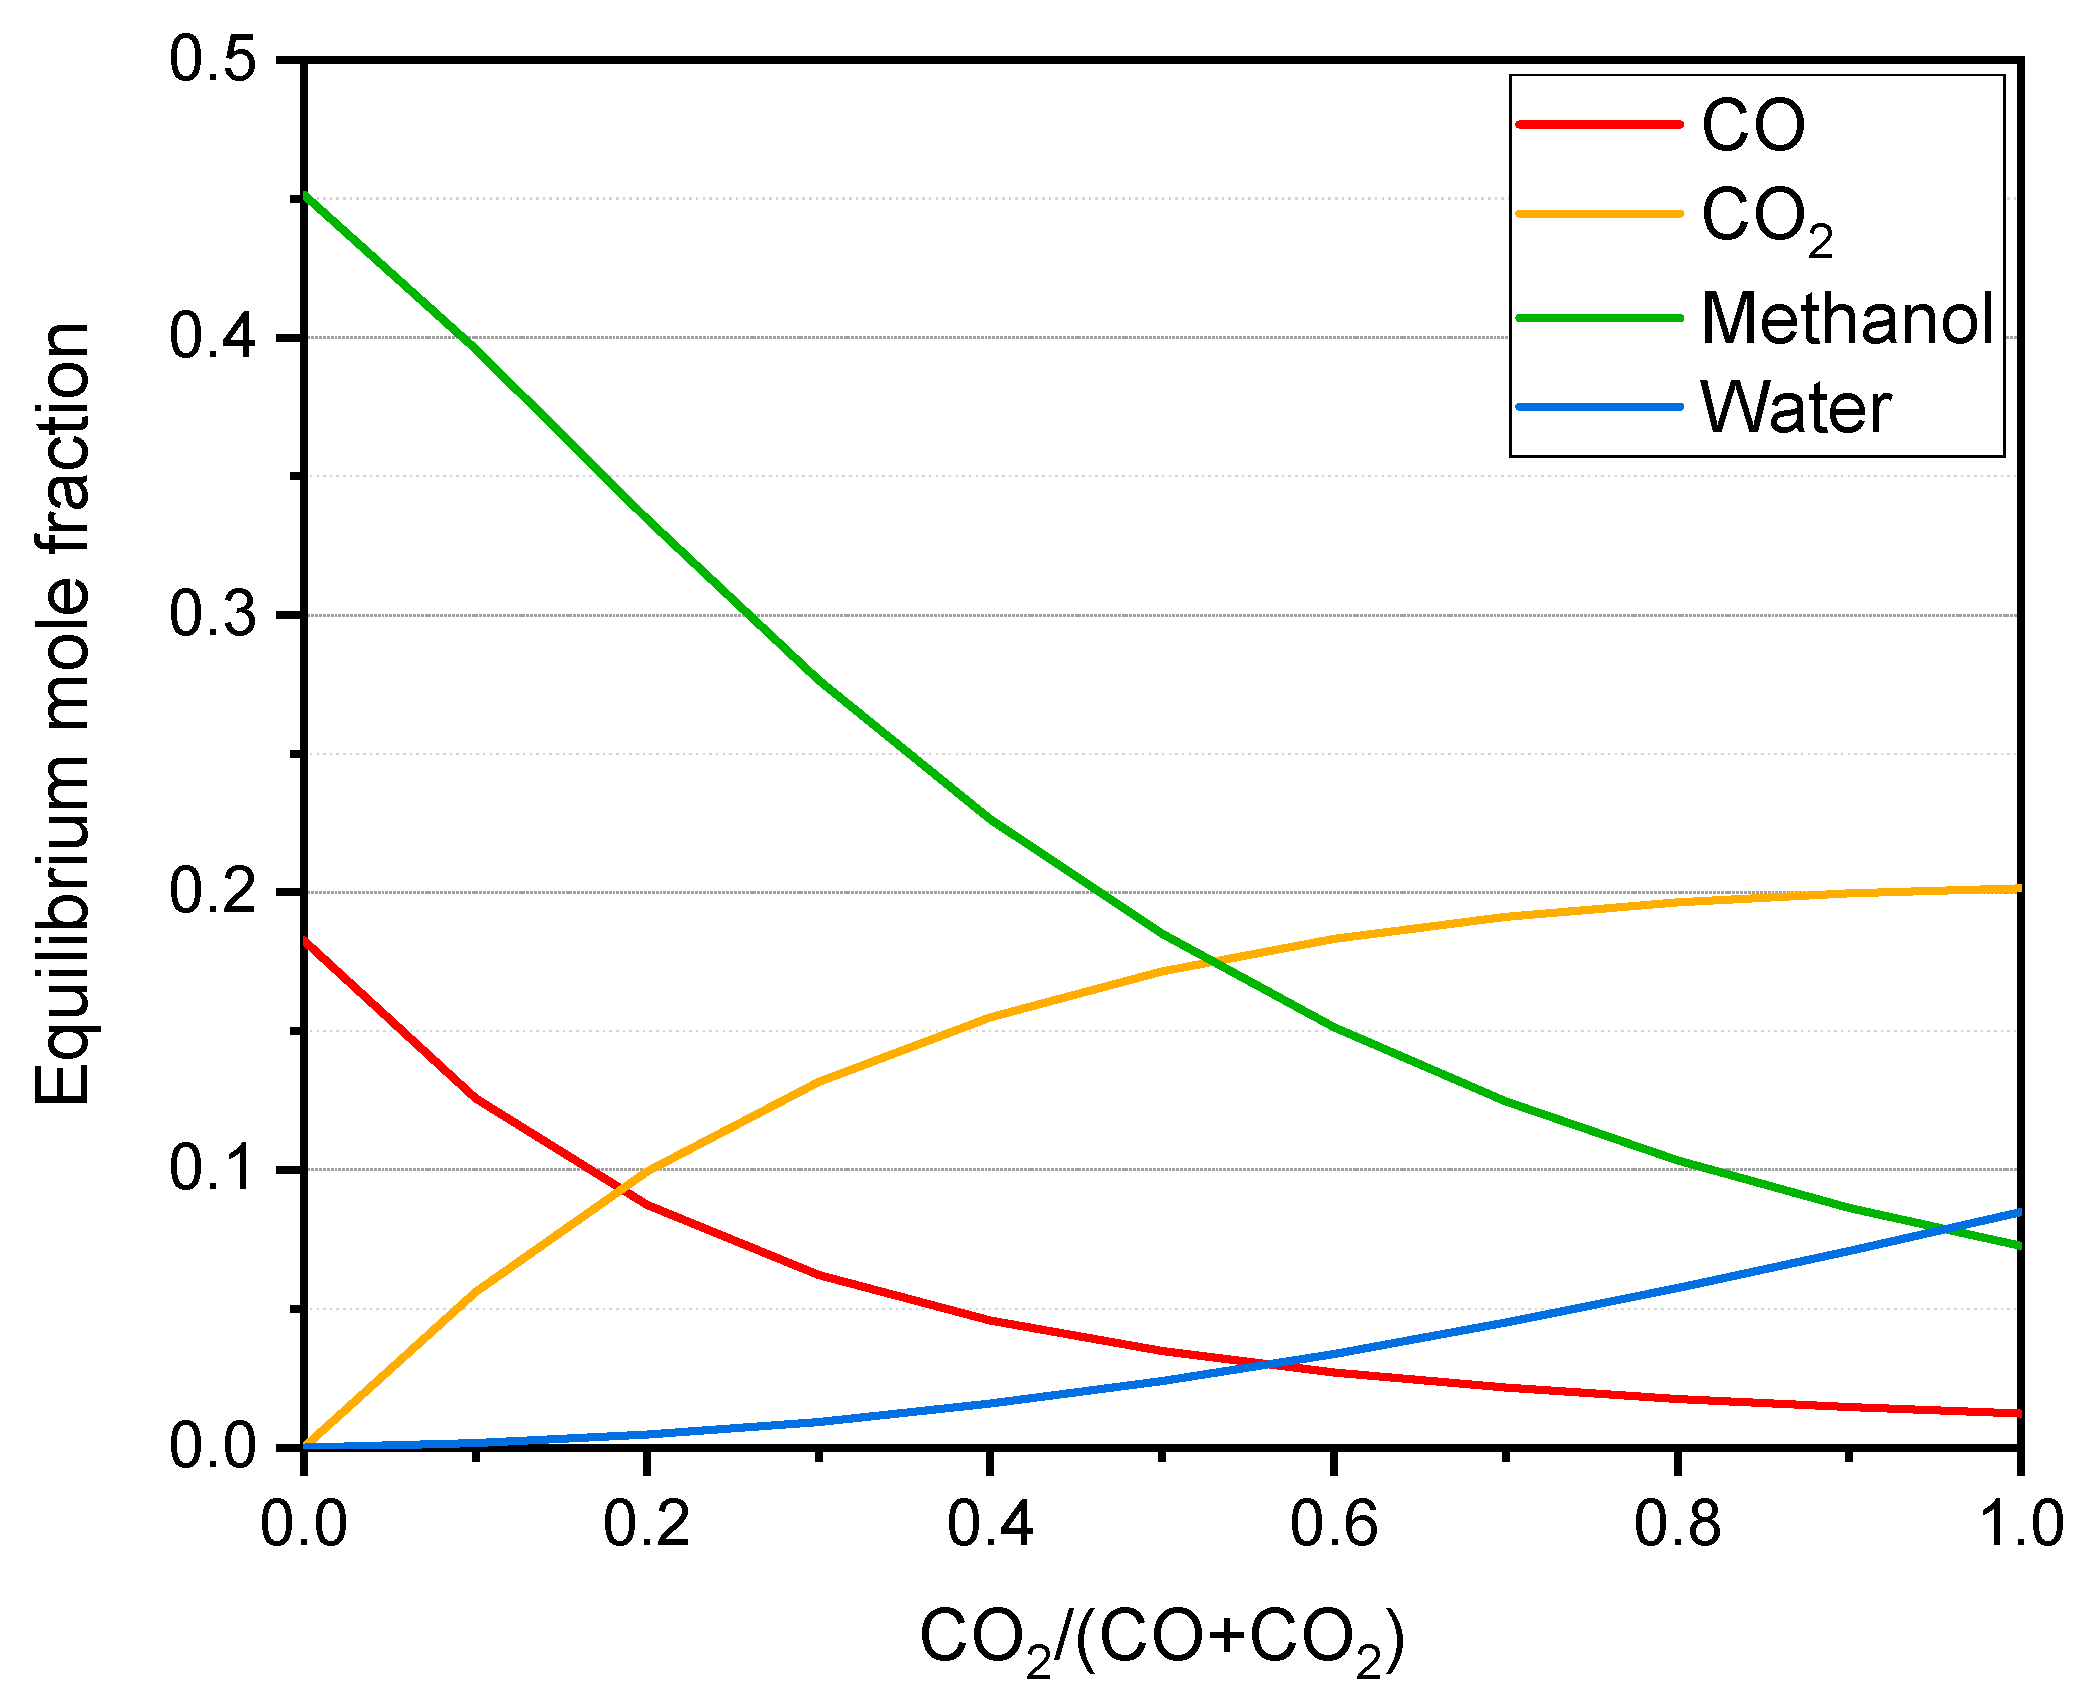
As mentioned before, the CO
2 content also has an impact in the thermodynamics of the system.
Figure 6 illustrates the change in the equilibrium composition of the methanol synthesis for different inlet compositions under typical industrial conditions.
As observed, the methanol concentration in the equilibrium drops drastically with the content in CO2 in the syngas, and this trend is the same for all the conditions considered in this work. Theoretically, a higher methanol production could be expected when converting CO2 into CO prior to the methanol synthesis. In the following section, we discuss the experimental results of the proposed strategy.
2.4. Synthesis of Methanol in the Double Catalytic Beds
The effect of the in situ conditioning of the syngas via the r-WGS reaction was studied with a catalytic bed containing two catalysts, CZA_30 and CZA_60, which display r-WGS and methanol synthesis activity, respectively. The results are shown in
Figure 5. Noticeably, the total carbon conversion, the CO conversion, and the methanol production obtained in the double-bed configuration are smaller than the ones obtained in the single-bed reactor using CZA_60. By contrast, similar CO
2 conversions are obtained in both experiments. None of these conversions is limited by the thermodynamics; note that the equilibrium conversion for the MeOH synthesis and the r-WGS-MeOH experiments are the same, and the experimental conversions for the latter are lower than for the former. These results should be taken cautiously, since the amount of CZA_60 used in the double-bed configuration is half of that used in the single-bed process. Please note that CZA_30 is not active for the production of methanol. In practice, this results in two times higher GHSV in the double-bed experiment than in the single-bed one, since the mass of methanol activity catalyst in the double-bed performance is the half than that in the single-bed one, which is actually consistent with the observed decreasing of methanol production. In addition, although the r-WGS has no effect in the M module of the syngas, it actually produces water, which is known to have negative impact in the performance of CZA catalysts for methanol production [
22,
23,
30].
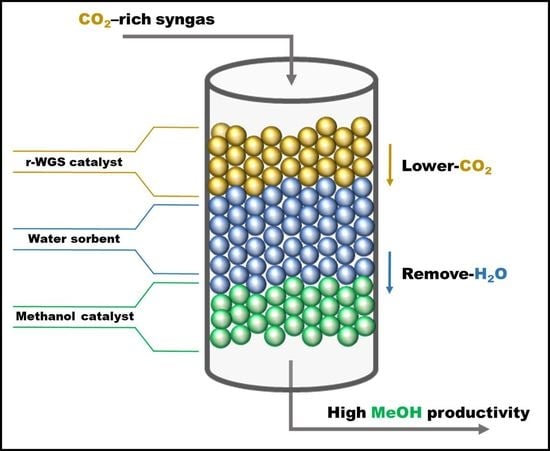
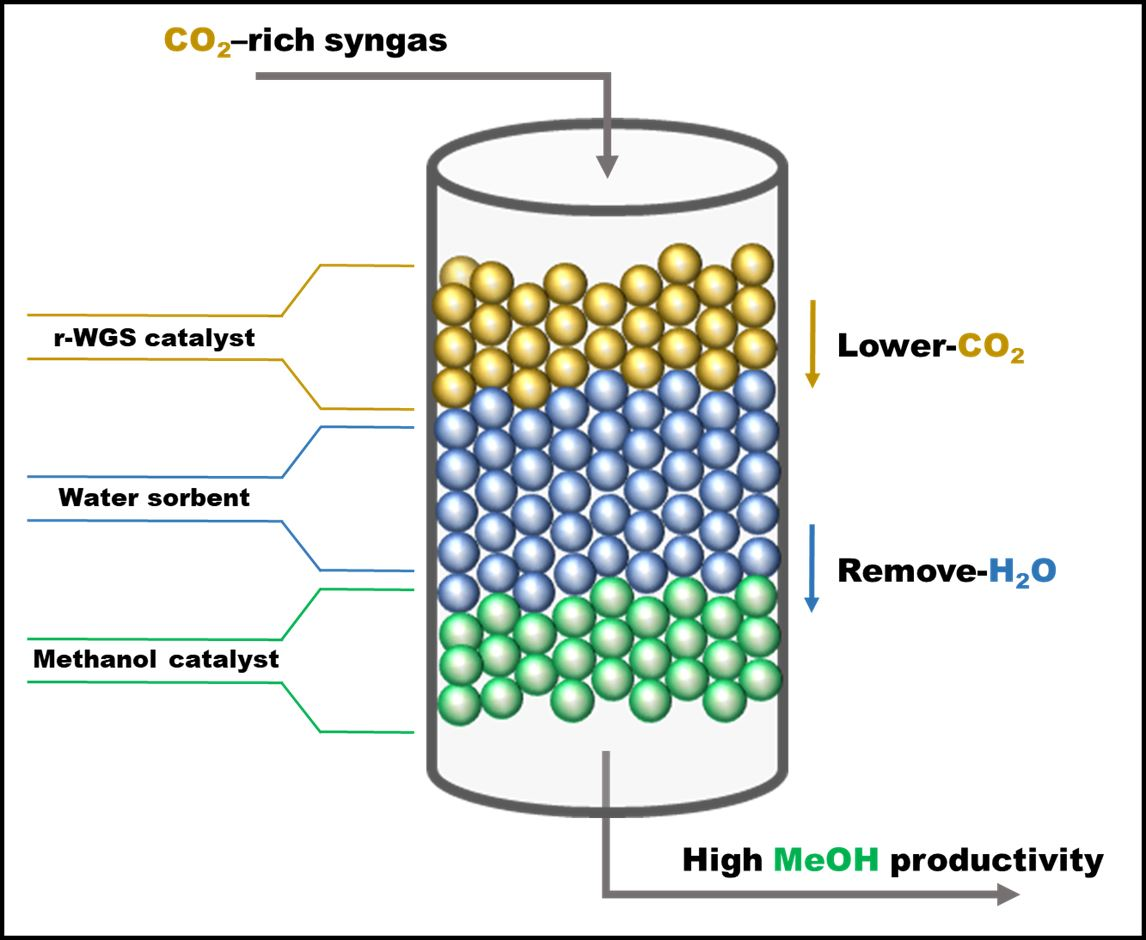
To avoid the negative impact of H
2O production during the r-WGS step in the performance of CZA_60 for the production of methanol the experiments were also conducted by placing a water sorbent (zeolite 3A) between the CZA_30 and CZA_60 catalysts under the same reaction conditions (240 and 270 °C, 25 and 50 bar).
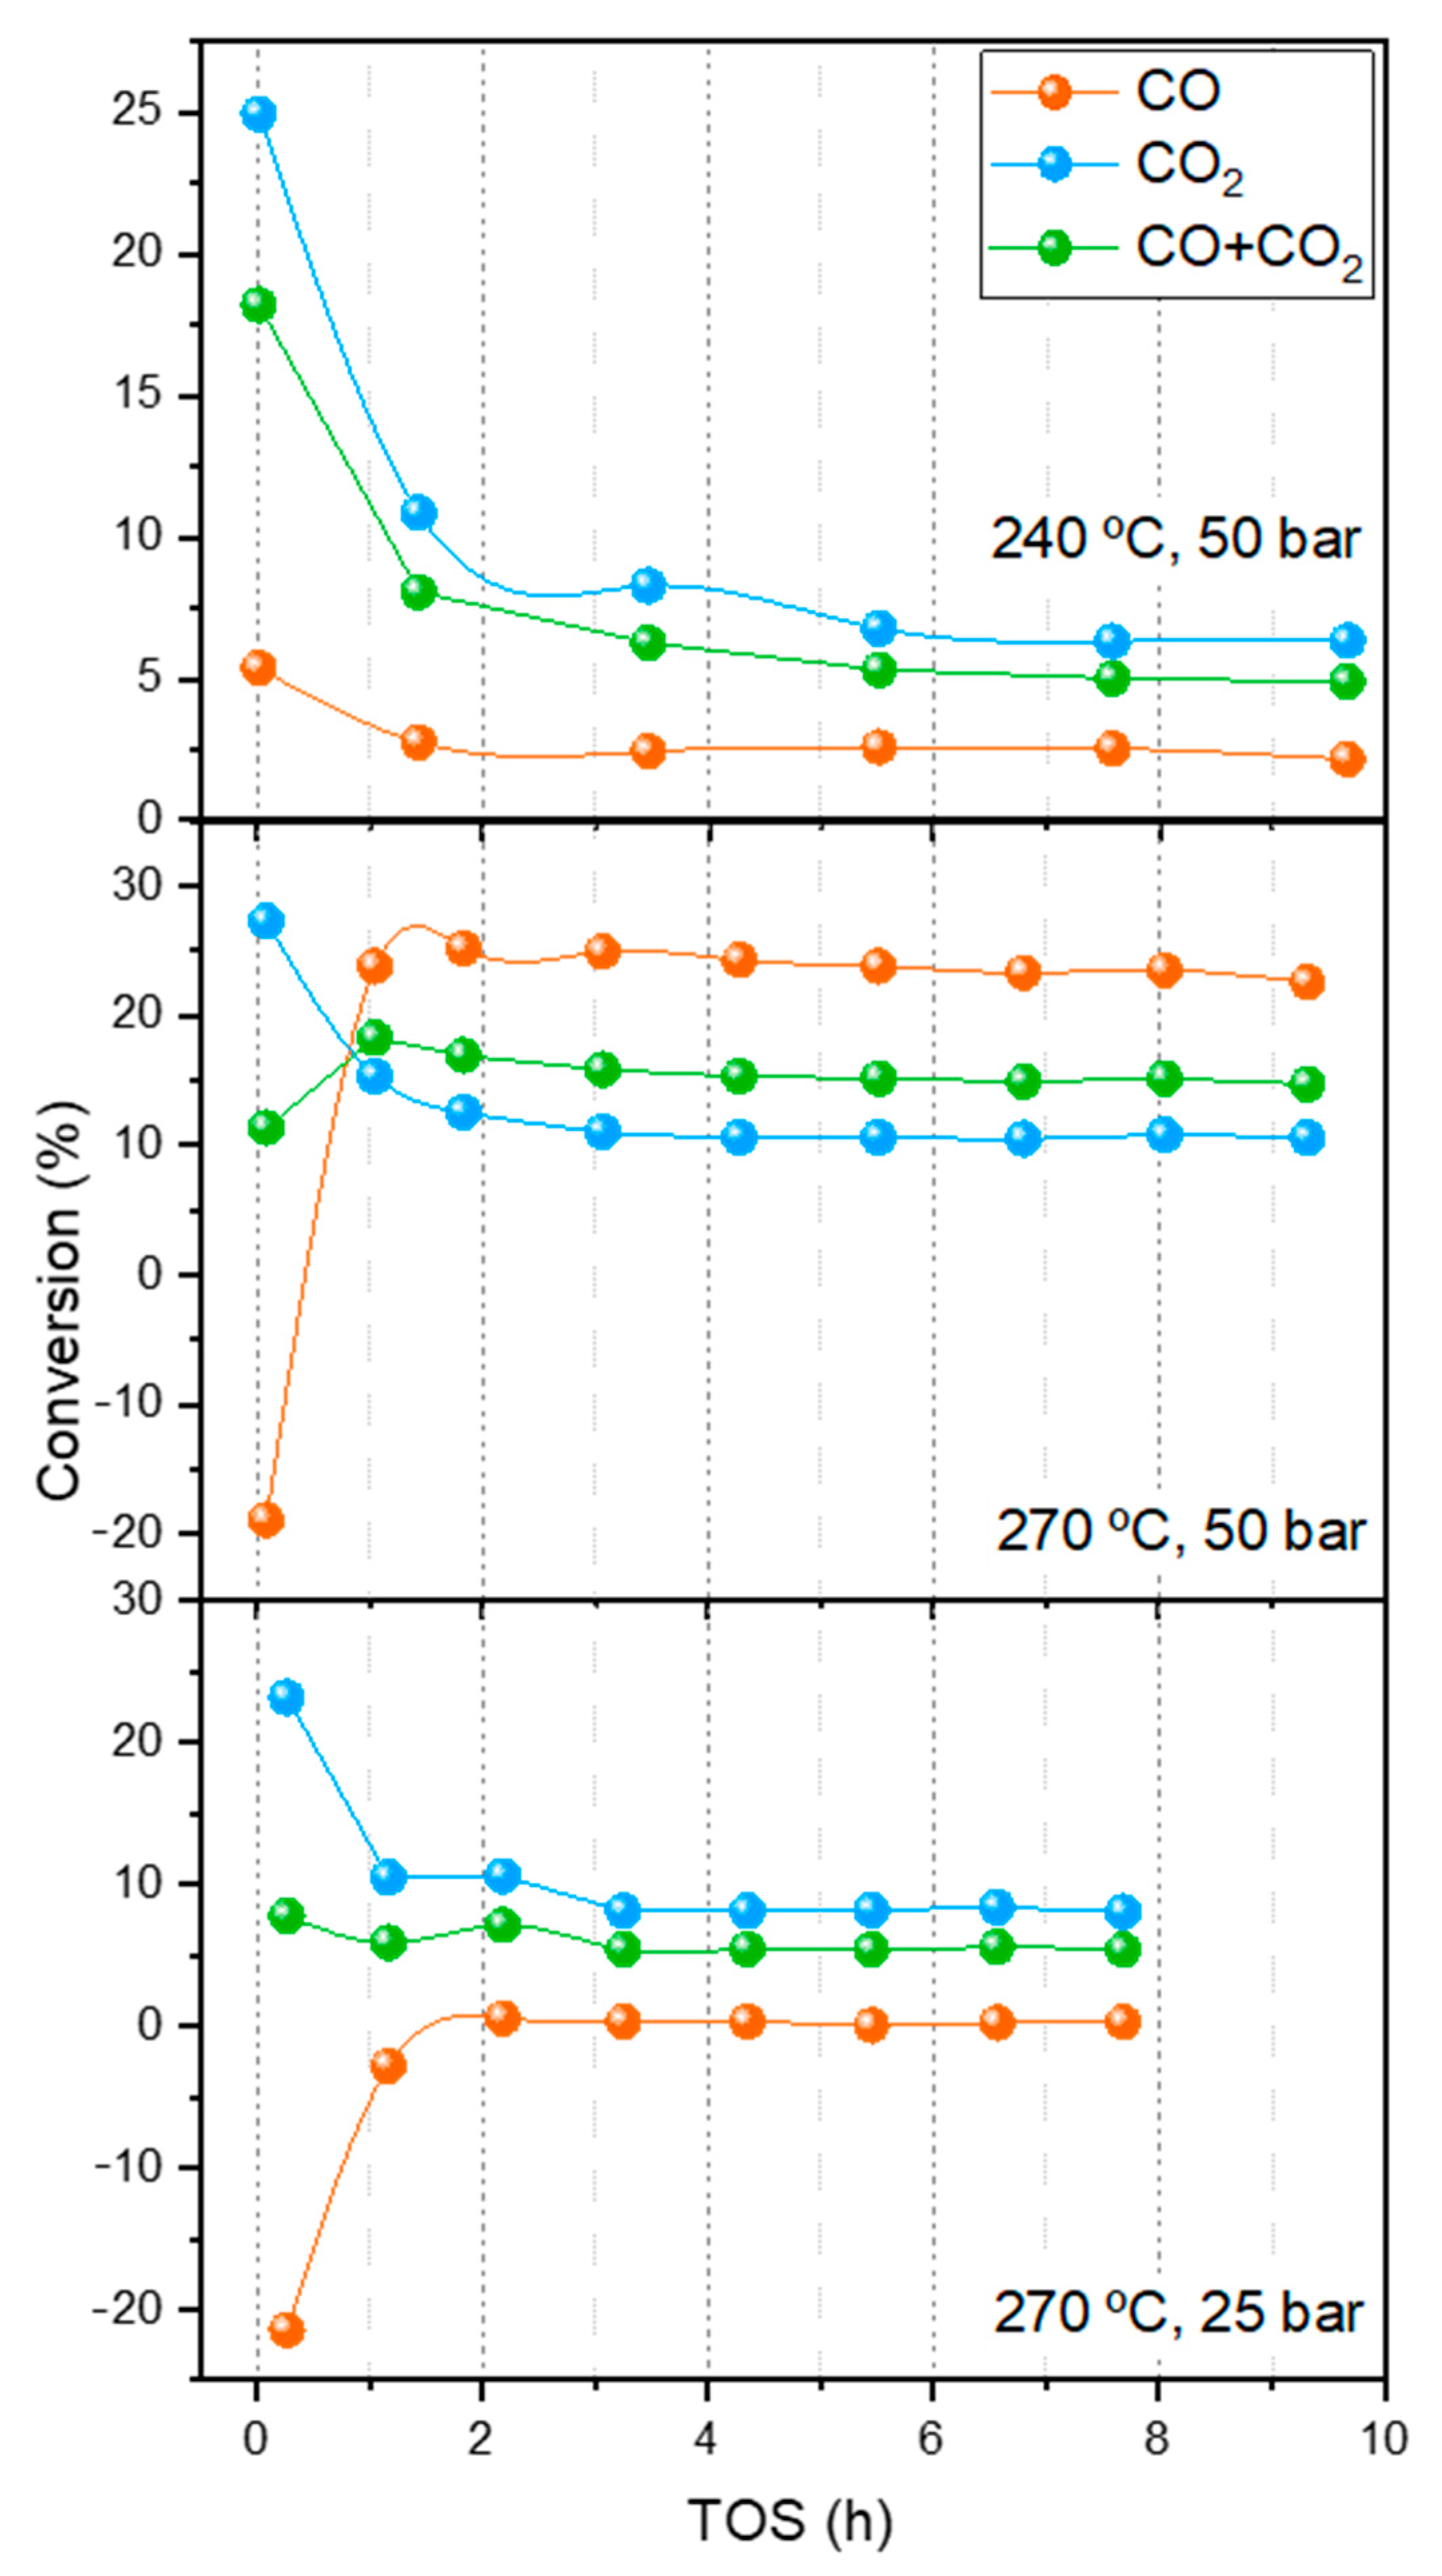
Figure 6 shows the evolution of CO, CO
2 and CO+CO
2 conversions with the time-on-stream (TOS) for the experiments of combined r-WGS-methanol catalytic bed with 3A. These results are discussed by considering three regimens: (i) low TOS, lower than 2 h, when the sorption capacity of the zeolite is maximum, (ii) TOS around 2–4 h, when the zeolite has lost part of its capacity, but still absorbs H
2O, and (iii) TOS higher than 4 h, when the zeolite is fully saturated and the stationary state has been reached (this regime is akin to the experiments conducted with the double catalytic bed without H
2O removal shown above). Please note that, based on recent isotherm measurements [
30], a capacity of 0.1 mmol/g may be expected under these conditions leading to a breakthrough time of around 4 h.
As observed in
Figure 5 and
Figure 7, the CO
2 conversion obtained at low times on stream (TOS < 4 h) of ca. 25% is significantly higher than that obtained in either of the single-bed configurations or in the double-bed configuration without the sorbent under the same reaction conditions. The CO conversion follows the opposite trend and a high amount of CO is produced at TOS < 2 h in the reactions conducted at 270 °C. CO conversion increases with TOS, especially at 270 °C. This phenomenon can be associated with an increase in the water partial pressure in the inlet of the CZA_60, thus hampering the r-WGS over this catalyst by means of Le Châtelier’s principle. The more saturated the zeolite, the higher the water content at the inlet of the methanol production stage.
In contrast, at 240 °C, CO conversions are always positive, but decrease with TOS. The striking difference between the initial (TOS < 2h) CO conversions with temperature (positive at 240 °C but negative at 270 °C) can be attributed to the fact that the r-WGS is less thermodynamically favored at lower temperatures. The lower CO2 conversion into CO and the consequent lower production of water favors the net disappearance of CO and the total conversion of carbon, which leads to a higher methanol production.
The production of methanol over the different configurations was assessed from the total carbon (CO + CO
2) conversion since, besides CO an CO
2, methanol is the only reaction product observed. Higher methanol productions were obtained with the double-bed configuration containing 3A, especially at lower TOS. Thus, total carbon conversion in the presence of the water sorbent at 240 ° and 50 bar increases by a 37% when compared with that obtained in the single-bed configuration (C conversion from 13.3% to 18.2%), and by 214% when compared with that obtained in the double-bed configuration without the water sorbent (C conversion from 5.8% to 18.2%). Similar trends were observed under the other reaction conditions studied in this work, see
Figure 5. It should be noted that the effect of the water sorbent is only observed at TOS < 4 h, since at higher TOS the zeolite becomes saturated.
Given that the total amount of catalyst in the catalytic bed was kept constant in all experiments, and that CZA_60 is the only catalyst with activity for the methanol production, the methanol production has not occurred at the same GHSV in all configurations studied in this work. Thus, the values of conversion might be deceptive for the identification of the best configuration to maximize the use of the catalysts. For this reason, we studied the methanol productivity of each catalytic bed in more detail.
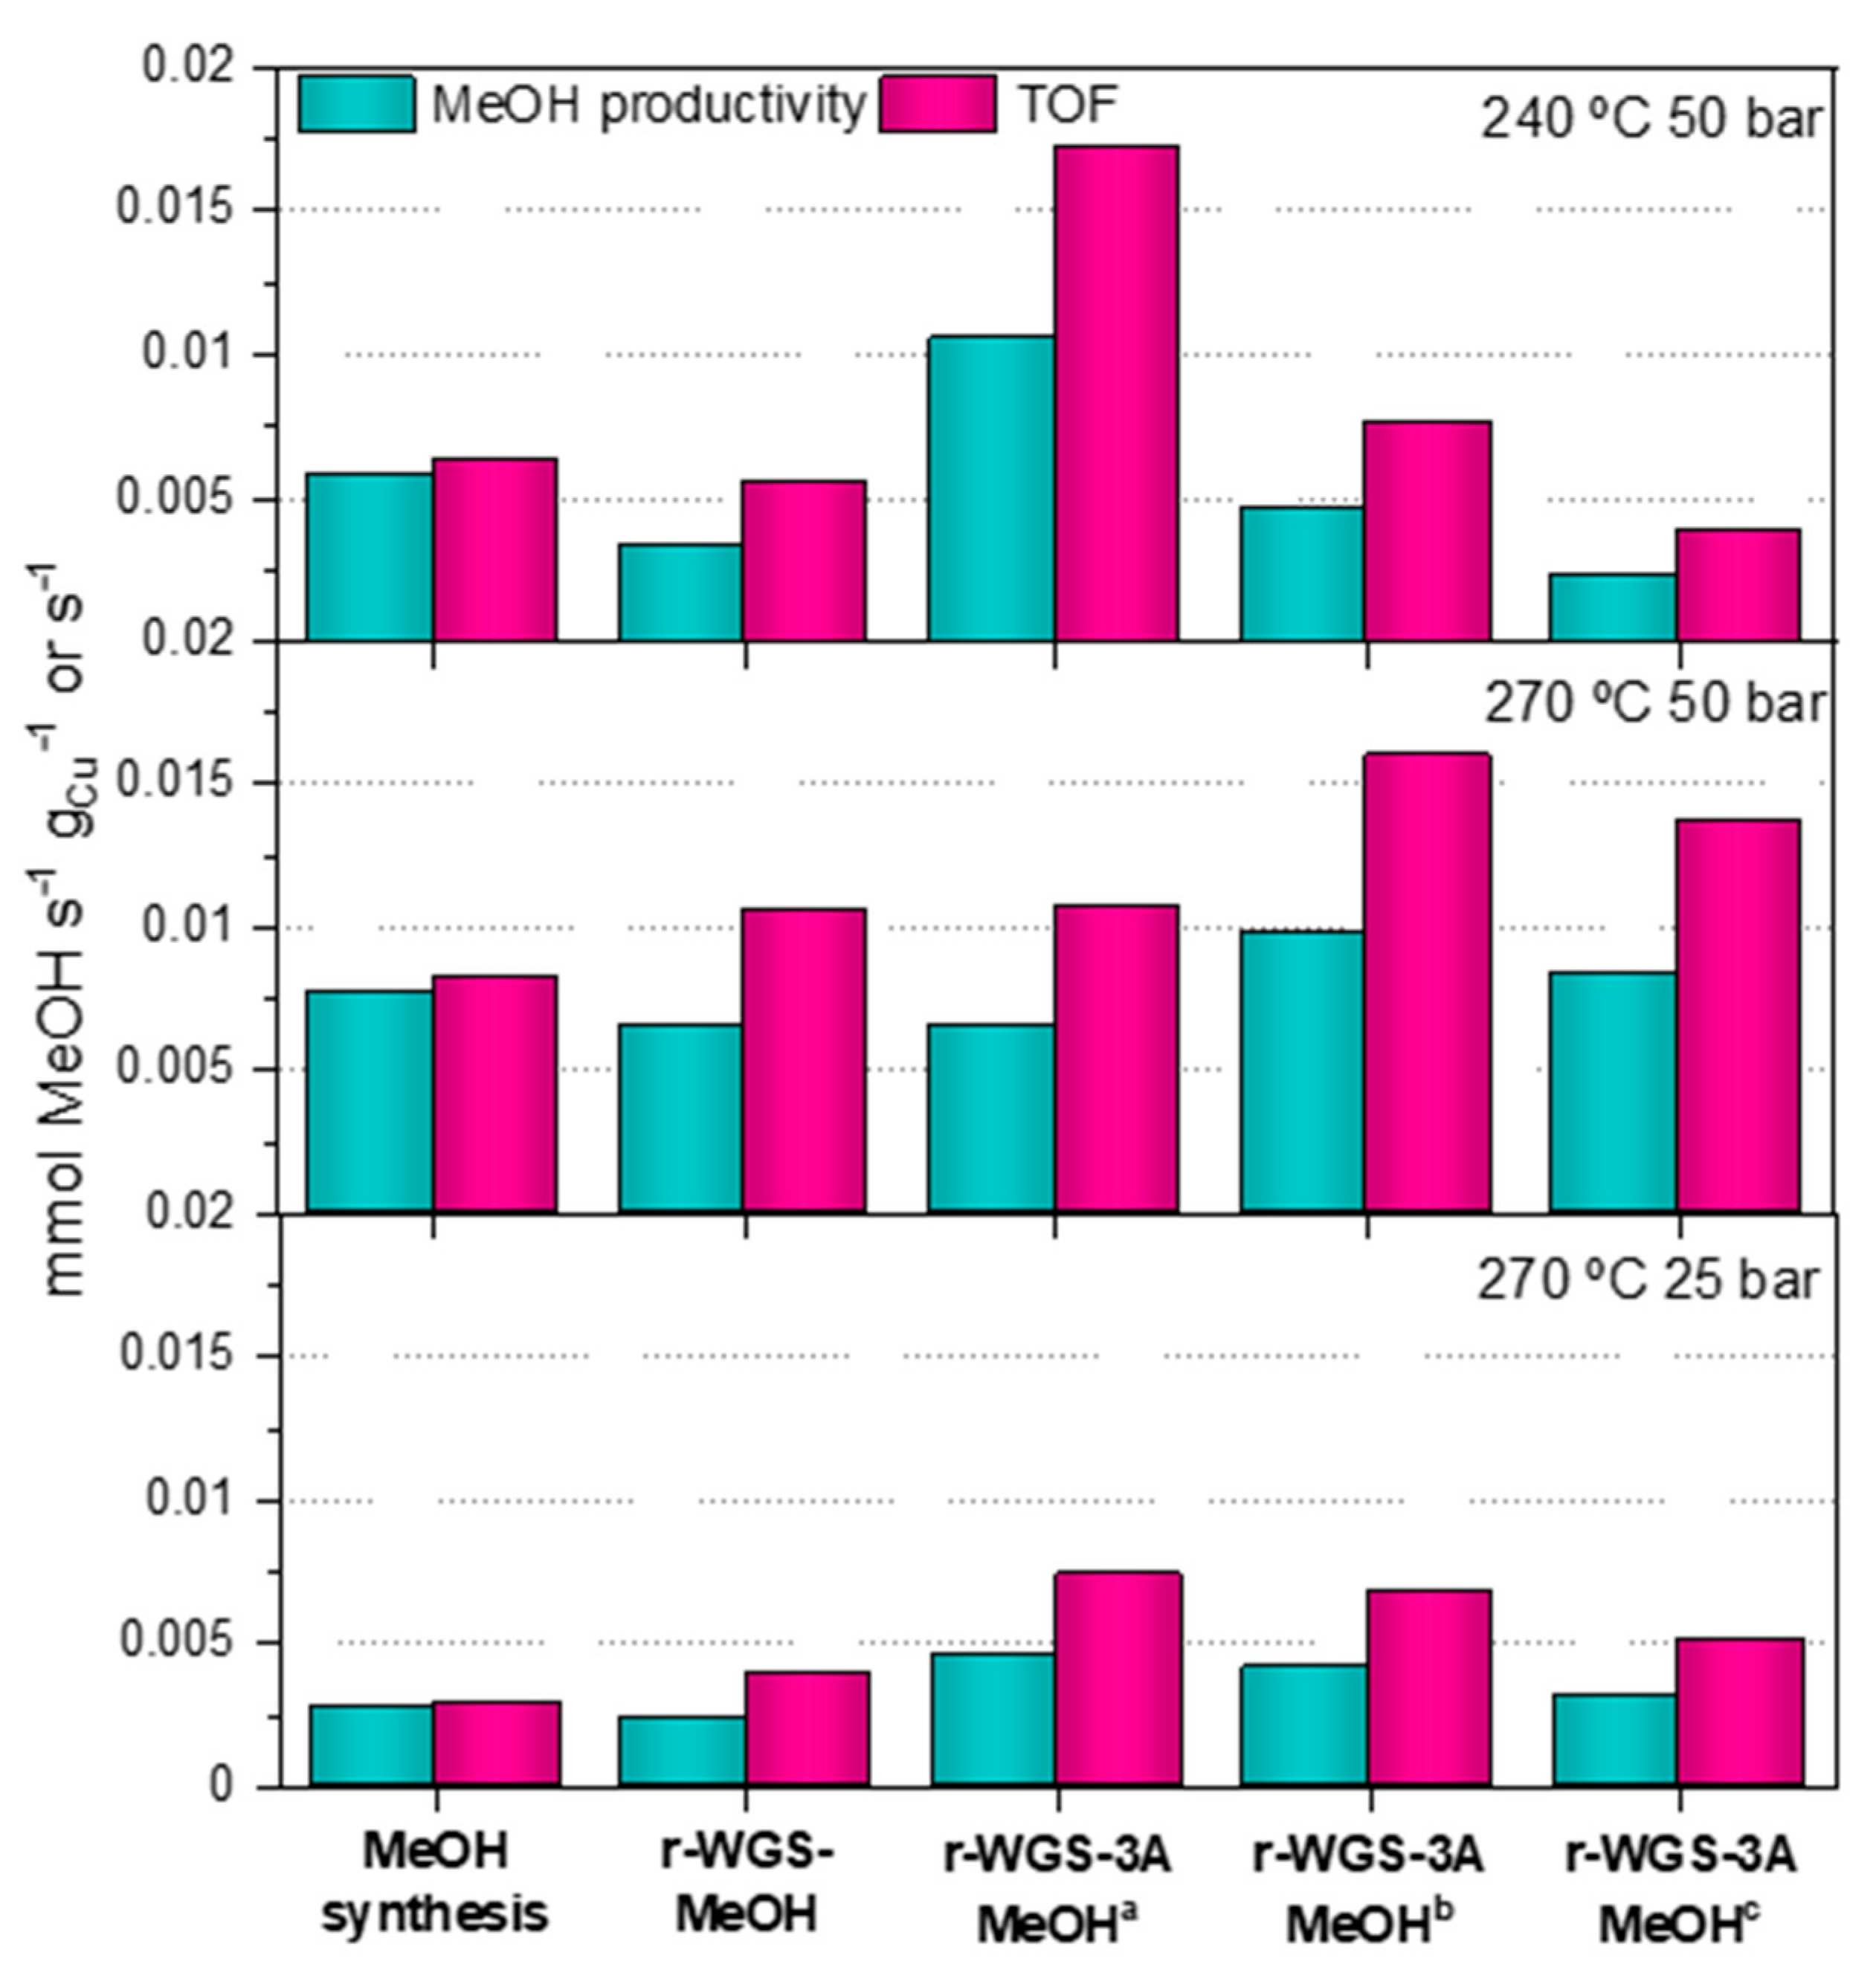
Figure 8 shows a comparison of the methanol produced over each catalytic bed normalized to the total amount of copper in the catalytic bed (mmol of methanol/gr
Cu·s), and the TOF for the CZA_60 in each catalytic bed. In this way, the productivities obtained can be regarded as a measure of how copper would be used better in a catalytic bed: just as CZA_60 or as a combination of CZA_30 and CZA_60.
As shown in
Figure 8, methanol productivity in the single-bed configuration (CZA_60) is higher than in the double-bed configuration (CZA_30 + CZA_60) at every condition studied in this work. Although the presence of CZA_30 in the catalytic bed allows optimizing the CO
2/CO ratio in the syngas, this effect does not result in higher methanol productivity over CZA_60. This effect can be ascribed to the negative impact of the higher partial pressure of water in the double-bed configuration due to the r-WGS reaction, that would negatively impact the performance of CZA_60 for the production of methanol. In situ water removal from the double-bed configuration actually results in higher methanol productivities at every reaction condition. Please note that this effect is only observed during low TOS (<4 h), when the sorbent ability of the zeolite is operative. For instance, the methanol productivity at 240 °C and 50 bar over the 3A-containing bed is ca. 80% higher than that of single-bed process. This behavior, which is also observed at other reaction conditions (see
Figure 8, indicates that copper in the catalytic beds may be better exploited when divided between a catalyst of r-WGS and a catalyst of methanol, provided the water produced in the shift reaction is removed between stages.
It is striking that once the enhancement of the productivity is attained it lasts longer at 270 °C than at 240 °C. Thus, at 240 °C methanol productivity drops below that recorded in the single-bed configuration at some point between 0 and 2 h. This effect is observed at 270 °C only after 7–9 h on stream. This observation can be explained by the different environments during the r-WGS-3A-MeOH experiments at 240 °C and 270 °C, in particular regarding the ratio of oxidizing (H
2O, CO
2) to reducing (H
2, CO) species. Please note that at 270 °C the fraction of CO
2 is lower than at 240 °C (due to the enhancement of the r-WGS) and in both cases the water is removed from the reaction environment due to the 3A zeolite. Therefore, the oxidation of surface copper is more severe at 240 °C than at 270 °C, resulting in a lower faction of metallic copper sites during the reaction at 240 °C. When the syngas fed to the CZA_60 presents a lower CO
2/CO ratio, this decrease of the metallic copper sites could be slower, and the methanol catalyst remains active for longer. Several observations found in related literature support this explanation. For instance, changes in the surface copper in CZA catalysts depending on the composition of the gas that passes through it (CO, CO
2 or syngas) were reported previously by Wilmer and Hinrichsen [
31]. Chinchen et al. determined that the oxygen coverage of copper catalysts during the synthesis of methanol from syngas depended directly on the CO
2/CO ratio of the syngas. In this work, the apparent copper areas measured after reaction were notable lower than those measured before reaction [
32]. Later, Martin et al. also observed a slower methanol production over CZA when pre-treated with CO
2/H
2 than when pre-treated with CO/H
2 [
8].
Figure 8 also shows that the TOF (molecules
CH3OH/s/site
Cu,cza_60) values obtained in the experiments using a double-bed configuration are higher than the ones obtained in the single-bed experiments at all the experimental conditions studied in this work. Thus, the TOF recorded in the water-sorbent double-bed experiment at 240 °C and 50 bar is 2.7 times higher than with the single-bed containing only CZA_60 under the same reaction conditions. A similar trend is observed in the experiments at 270 °C. The increasing TOF values obtained with the double-bed experiments supports the idea that in situ decreasing of the CO
2/CO ratio of the syngas has a positive impact in the intrinsic activity of the methanol catalyst, even if water is not removed from the system (note that TOF increasing was observed in the double-bed experiments, with and without the water sorbent). Nevertheless, the combination of both strategies results in the highest methanol catalyst activities.
TOF values of around 1.6·10
−2 s
−1 at 50 bar and 240–250 °C and CO
2/CO ratios of 0.3–1.3 can be found in the literature [
32,
33]. This TOF value is ca. 2.5 times higher than the TOFs reported in our work in the single-bed experiments. The main reason of this difference is the initial composition of the syngas, which in our case displays a significantly higher CO
2/CO ratio of 1.9. As explained above, this high value is detrimental for the production of methanol. Higher CO
2/CO ratios increase the oxygen coverage of the copper surface, decreasing the fraction of available metallic copper sites. Nonetheless, in the experiments with r-WGS pre-treatment and water removal, the obtained TOF value is very similar to that reported in bibliography at least at low TOS, reaching a value of 1.7 s
−1 at 240 °C with the fresh zeolite.
In parallel with the methanol productivity, the evolution of the TOF with time-on-stream at the different reaction conditions can be explained by the results obtained for the r-WGS in
Table 3. As the CO
2 conversion in the pre-treatment is higher, the enhancing effect of the pre-treatment is visible for a longer time. Thus, at 270 °C, at which the CO
2/CO decrease is more pronounced, the CZA_30-CZA_60 beds, irrespective of whether they included 3A or not, always provided a TOF higher than that provided by the bed containing only CZA_60. On the other hand, the experiments at 240 °C only showed an enhancement in the TOF when combining the r-WGS pre-treatment and the water sorption, and this enhancement only lasted for a TOS between 1.4 and 3.5 h. Again, the more oxidizing nature of the syngas with a higher CO
2/CO ratio seems to be accountable for the trend observed in the results.


 ,
, 
 CH3OH ∆H0 = −90.6 kJ/mol


