Abstract
In the context of climate change mitigation, CO2 methanation is an important option for the production of synthetic carbon-neutral fuels and for atmospheric CO2 recycling. While being highly exothermic, this reaction is kinetically unfavorable, requiring a catalyst to be efficiently activated. Recently Rh nanoparticles gained attention as effective photocatalyst, but the rate-determining step of this reaction on Rh surface has not been characterized yet. In this work, Density Functional Theory and Nudged Elastic Band calculations were performed to study the Rh-catalyzed rate-determining step of the CO2 methanation, which concerns the hydrogen assisted cleavage of the CO* molecule and subsequent formation of CH* and O* (* marks adsorbed species), passing through the CHO* key intermediate. The configurations of the various adsorbates on the Rh (100) surface were investigated and the reaction mechanism was studied exploiting different exchange-correlation functionals (PBE, RPBE) and the PBE+U technique. The methanation rate-determining step consists of two subprocesses which subsequently generate and dissociate the CHO* species. The energetics and the dynamics of such processes are extensively studied and described. Interestingly, PBE and PBE+U calculated activation barriers are in good agreement with the available experimental data, while RPBE largely overestimate the CHO* dissociation barrier.
1. Introduction
The last Intergovernmental Panel on Climate Change (IPCC) summary report addressed the prominent impact that human industrial activities are having on global climate conditions [1]. The enormous quantity of greenhouse gases that have been released into the atmosphere since the mid of the 20th century are causing a sharp increase in the global average temperature, with dramatic consequences on many ecosystems [1,2]. Reducing carbon emissions and mitigating the impact of climate change is thus a challenging and fundamental task. In particular, actions leading to the replacement of fossil fuels with other environmentally sustainable sources and to the decrease of CO2 atmospheric concentration are especially needed. The effective production of synthetic carbon-neutral fuels from greenhouse gases could help addressing both these issues, making it possible at the same time to recycle atmospheric pollutants while providing a new source of fuels. In this context, CO2 methanation represents a possible route toward the production of carbon-neutral fuels [3,4]. This process is represented by the following reaction:
CO2 + 4H2 → CH4 + 2H2O ΔH0 = −165 kJ/mol (298 °K)
The reaction enthalpy ΔH0 value, reported in Equation (1), shows that this reaction is highly exothermic. However, the elementary steps connected to the eight-electron reduction present high kinetic barriers that make this process unfeasible without an effective catalyst [5,6]. Indeed in the last decade many efforts were spent in order to search for catalysts with high selectivity and stability, and low working temperatures [3,4,5,6]. In this context, a promising family of devices is represented by metal-based catalysts, in which an active metallic layer is deposited over a supporting material [5,7,8].
This configuration has made it possible to produce many catalysts based on transition metals (e.g., Ru, Rh, Pd, Cu, Ni, Co), resulting in them being very stable and selective, but requiring a large amount of energy to activate the methanation reaction (working temperature usually ranging between 250 and 500 °C) [3,4,6,8]. Recently, large improvements in the catalytic features of metallic devices have been achieved by exploiting the surface plasmon resonance in small metal nanoparticles [9,10,11,12]. In these works it was shown that upon activation of their plasmonic resonance, Rh-based catalysts showed almost 100% selectivity toward methane formation and extremely high production rates [10,11,12]. Such high catalytic performance was ascribed to the decreasing of the activation energy of the reaction rate-determining step (rds), which, on Rh surfaces is the hydrogen assisted dissociation of CO*, through the key intermediate CHO* in CH* and O* (* marks species adsorbed on the Rh surface) [10,13,14]. However, to the best of our knowledge, while the thermal process has been theoretically studied in the context of CO2 hydrogenation on Ni, Cu, Co and Ru surfaces [13,15], in the case of Rh it has not been addressed yet.
Despite the exact reaction path for the Rh-catalyzed methanation still being debated and not fully understood [7], and that there is evidence indicating that the reaction could proceed through different pathways towards the generation of gaseous methane [6], there is a general agreement on some key steps that the reaction has to go through in order to produce methane. More precisely, in recent years, several studies have demonstrated that the first step for the Rh-catalyzed CO2 reduction is the dissociative chemisorption of CO2, leading to the formation of the CO* and O* species through a finite number of steps (* symbol indicates that the species is adsorbed on the catalyst surface) [6,7]. This process seems to be related to the rhodium surface itself, rather than to other factors (e.g., the supporting material), since it was observed on Rh crystals [16], foils [17,18], and on several supported systems [19,20,21,22] and was demonstrated to take place more easily on the Rh (100) surface rather than the Rh (111) one [23]. Furthermore, it seems that this step is made easier when H2 is dissociatively adsorbed on the surface too [24,25]. Once formed, CO* can either desorb (leading to the formation of gaseous CO through the reverse water gas shift mechanism [26]) or interact with H* to generate intermediate complexes. The nature of these molecular species has not been uniquely identified, since there are many processes that can take place locally on the surface, leading to the generation of molecules like CHO*, H2CO* or COH* [6,22]. Additionally, backward reactions with adsorbed free oxygen can occur leading to species such as HCOO−*, COOH−* or HCOOH* [20,27]. However, there is evidence to suggest that CHO* formation and dissociation are key processes in this reaction, and it has been suggested that the CHO* dissociation into CH* and O* through a C-O bond cleavage represents the rds of the whole methanation process [13,28,29,30,31].
In this work, we study and characterize the rds of CO2 methanation reaction on the Rh (100) surface employing DFT and Climbing-Image Nudged Elastic Band (CI-NEB) calculations [32]. Different exchange-correlation (XC) functionals and methods (Perdew-Burke-Ernzerhof (PBE) [33], Revised Perdew-Burke-Ernzerhof (RPBE) [34] and PBE+U [35]) have been used to treat the electronic interactions, and their performances are compared. The equilibrium geometry and energetics of the clean Rh slab, adsorbed reactants, and products have been carefully investigated in the low coverage regime. From our calculations, the CHO* formation is a single-step process in which the reactive CO* and H* species diffuse and rotate on the rhodium surface, allowing the formation and relaxation of the CHO*. Instead, the CHO* dissociation seems to proceed in two main steps. In the first one, involving the largest barrier, the C–O bond is stretched and breaks, leading to the two separated CH* and O* species. In the second step, O* diffuses on the surface reaching its equilibrium configuration, overcoming another lower energy barrier and relaxing the stress accumulated in the distortion of Rh outermost surface layer. While all methodologies and functionals agree on the general dynamics of the process, when using the RPBE functional CH* and O* stabilities are lowered by c.a. 0.35 eV with respect to PBE-based methods, and the CHO* dissociation energy barrier is greatly overestimated compared to experimental data. We relate the divergence among the methods to the different treatment of the interface region in the RPBE functional [34], which yields lower adsorption energies, a tendency that is stronger for the products than for the reactant. The paper is organized as follows: first the computational details of the work are provided, then the results of the geometry optimizations and the NEB simulations are presented and discussed, finally conclusions are drawn.
2. Results and Discussion
2.1. Clean Rh (100) Slab Characterization
To determine the geometrical structure of the catalyst and to compare the performance of the different xc functionals, the physical and geometrical features of the clean Rh (100) surface were studied. In particular, the slabs were characterized on the basis of their surface energies , work function , and surface lattice relaxation parameter . These quantities were computed on the basis of the definition reported in Appendix A as Equations (A1)–(A3). The calculated data, together with theoretical and experimental results available in the literature, are collected in Table 1. Among all the available computational data, only those obtained with computational setups similar to the ones adopted in this work are reported here. As shown in Table 1, our PBE results are in good agreement with previous calculations. Differences on the absolute values of the analyzed parameters are very small and can be ascribed to the different codes used by the authors [36,37]. The difference of about 0.17 eV/atom with respect to the surface energy computed in ref. [36] can be related to the different method adopted in the surface energy calculation. Indeed, in ref. [36], the surface energy was obtained through the linear regression on the total energy of the slabs as a function of the number of layers of the slabs themselves.

Table 1.
Surface relaxations and , work function and surface energies for the Rh (100) slab, relaxed with PBE and RPBE functionals, together with available theoretical and experimental literature data.
Moreover, as can be seen from Table 1, PBE results agree well with experimental data apart from the relaxation of the outermost layer, which is overestimated by all the calculations, except for the RPBE one. It is worth noting that the 0.19 eV difference with the experimental work function is well within the range of the accuracy of DFT-PBE for this quantity [41]. Regarding RPBE results, all values are comparable with the other theoretical estimations, with the exception of , which interestingly is closer to the experimental data. This could suggest a better performance of RPBE in determining the physical properties of the Rh (100) slab. However, as mentioned in the computational details, RPBE predicts a larger (and less accurate) Rh bulk unit cell parameter. This is reflected in the larger denominator in Equation (A3) and the smaller relative surface layer relaxation. Globally, our analysis suggests that the two XC functionals give comparable results in determining the clean slab physical properties. The major difference resides in the accuracy of determining the bulk Rh–Rh bond length which is more accurate using PBE rather than RPBE.
2.2. Description of the Adsorbates
As mentioned in Section 1, the key molecular species involved in the rds of CO2 reduction are CO*, H*, CHO*, CH* and O*. We thus studied the equilibrium configuration of these species and the energetics of the various systems. Three possible adsorption sites, Bridge, Top and Hollow were considered. A visual representation of these sites on the Rh (100) surface is shown in Figure 1. For each adsorbate, the most stable configuration was identified, and the adsorption energies were calculated using the following expression:
where is the total energy of the system composed on the slab and the adsorbed specie, is the energy of the slab itself, and is the energy of the free species. It is important to underline that given the 3 × 3 supercell dimension adopted for these calculations, our results refer to low (Θ = 1/9 ML) adsorbate coverage of the surface. The adsorption energies of the investigated molecular species are collected in Table 2, while the most stable geometrical configurations of the different species, calculated at the PBE level, are shown in Figure 2.
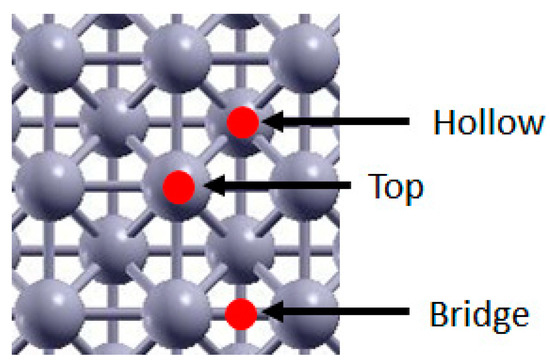
Figure 1.
Rh (100) adsorption sites. Red spots indicate the site, Rh atoms are pictured in grey.
Table 2.
Adsorption energies of the investigated species on the three possible adsorption sites (Bridge, Top and Hollow) of Rh (100) slab, calculated with the PBE, PBE+U and RPBE methods. Values within round parenthesis refers to the adsorption energies of the biatomic species, i.e., H2 and O2.
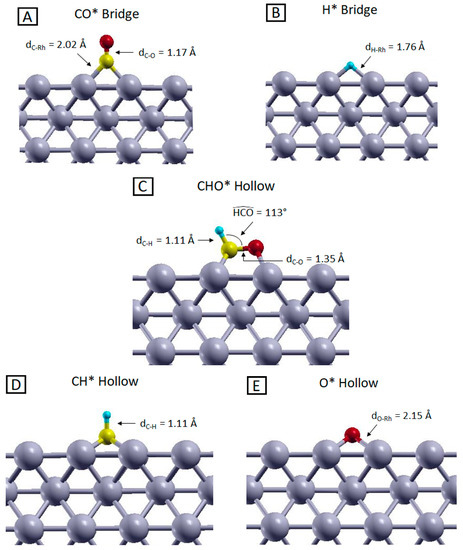
Figure 2.
Side views of the most stable configurations of (A) CO, (B) H, (C) CHO, (D) CH and (E) O adsorbed on the Rh (100) surface, optimized at the PBE level. Yellow, red, light blue and grey represent C, O, H and Rh atoms, respectively.
A first fundamental step of the methanation reaction is the generation of CO*. This adsorbed species has to satisfy two main requirements in order to represent a reliable intermediate for the reaction mechanisms namely thermodynamic stability and geometrical accessibility. The first requirement ensures that the molecular intermediate is more stable when adsorbed on the catalyst surface compared to the gas phase form, ensuring the stability of such species which would otherwise desorb, preventing further reaction steps. On the other hand, the geometrical accessibility is mandatory to allow interactions with co-adsorbed hydrogen atoms and thus to proceed towards the reaction products. As visible from the data collected in Table 2 and the picture in Figure 2 panel A, both these criteria are satisfied. Regardless of the calculation level, the adsorbed configurations are always more stable than the isolated systems, indicating that the adsorption of CO is an exothermic (and thus favorable) process. Moreover, within the relaxed geometry, the CO molecule is adsorbed perpendicularly to the surface, with the carbon interacting with the rhodium atoms and the oxygen pointing in the opposite direction. This suggests that the C atom can easily interact with hydrogen, because no steric hindrance is present along the directions parallel to the surface plane. From our analysis, the most stable configuration is obtained when CO is adsorbed on a Bridge site. The adsorption energies are close to the ones of the Top adsorbed geometries (maximum energy difference of about 70 meV), and this justifies the co-existence of these two configurations observed experimentally [42,43,44]. Despite the qualitative agreement between theory and experiments concerning the adsorption geometries, experimental values for CO adsorption energy range between 1.35 ÷ 1.45 eV [43,44,45,46,47], while our DFT PBE calculations predict a much larger adsorption energy (ca. 2 eV), in agreement with previous theoretical results [48,49,50,51]. Indeed, despite PBE properly predicts properties like Rh bonds length and electronic structures [52], it was shown that it overestimates the interaction among the Rh d-type orbitals and the 2π* level of CO, leading to an overestimation of the CO adsorption energy on rhodium surfaces [53,54]. To overcome this problem, on one hand, we employed the PBE+U method, which allowed us to properly shift the CO 2π* level in order to obtain more accurate results [55,56]; on the other hand, we used the RPBE functional, which was specifically designed for yielding more accurate adsorption energies compared to PBE functional [34] and has been demonstrated to give more reliable results in modeling the CO-metal interactions [52]. As shown in Table 2, the two methods yield a much better agreement with the experimental adsorption energy values. Interestingly, these results are not associated with significant geometrical changes; indeed, the computed C–O bond length for the Bridge adsorption sites are 1.17 Å and 1.18 Å for the PBE-based and RPBE calculations respectively, while the distance between C and Rh atoms resulted in be 2.02 Å and 2.07 Å for the PBE-based and RPBE calculations, respectively. All these data are coherent with previous calculations [49,51,52].
The other reactant that must adsorb on the Rh surface is hydrogen. Previous investigations have shown that H2 spontaneously dissociates and diffuses on the catalyst surface as soon as it is chemisorbed [57,59]. The adsorption energies reported in Table 2 indicate that the most stable adsorption sites for H* are Bridge and Hollow (the most stable geometry is shown in Figure 2 panel (B). These configurations are practically isoenergetic, as already reported in previous studies [60,61]. The energy of the Top configurations cannot be obtained since the chemisorbed H naturally falls into a Hollow site during the relaxation. The H-Rh distance is about 1.76 Å and 2.00 Å in Bridge and Hollow sites, respectively, for PBE and 1.79 Å and 2.02 Å for RPBE calculations. PBE and PBE+U results are identical as no Hubbard-U corrections to H atoms were applied.
Given the atomic nature of the adsorbed species, the values reported in Table 2, computed with respect to the total energy of the isolated hydrogen atom, cannot be directly compared with experimental data which refer to the H2 dissociative chemisorption. To be able to compare directly with such experimental data and check the reliability of our results, we repeated the calculations for a slab with an H atom adsorbed on each side, this time computing the adsorption energy with respect to the total energy of the isolated H2 molecule; the results are listed in parenthesis in Table 2. Additionally in this case, the favorite chemisorption sites are Bridge and Hollow with an adsorption energy calculated with PBE functional of about 0.52 eV, in line with what has previously been observed [57,60]. Using the RPBE functional gives an adsorption energy of about 0.65 eV, slightly larger than the PBE case, and in worse agreement with the experimental values.
The stability of the adsorbed CHO* complex, involved in the rds, compared to its gas-phase counterpart, is confirmed by the adsorption energies reported in Table 2. The most stable geometry, reported in Figure 2 panel C, was obtained starting from both Bridge and Hollow configurations, using all three computational methods. As shown in Figure 2 panel C, the C–O bond is basically parallel to the surface, with a C–O distance, C–H bond length and an HCO angle of about 1.35 Å, 1.11 Å and 113°, respectively, with these being the same for PBE, PBE+U and RPBE calculations. Such adsorbate geometry can be viewed as a Hollow configuration since the atoms’ coordinations are comparable to those of a fourfold Hollow site, as visible from Figure S2 in the Supplementary Materials. This configuration represents a reliable starting point to study the C–O bond cleavage, which can qualitatively occur without requiring a large amount of energy, because the proximity of the Rh surface atoms can partially stabilize the highly energetical intermediates that are generated during the bond dissociation. Since this molecular fragment is not stable in the gas phase (it would exist only as a radical species), no comparison with experimental data could be carried out. However, calculations performed on similar systems revealed the same geometrical configuration and an adsorption energy on the Rh (100) surface of about 3.62 eV, which is compatible with our results [30]. As shown in Table 2, the PBE-based and RPBE CHO* adsorption energies are very different, the latter being 0.75 eV less stable than the former. This effect is related to the way the molecule–slab interface regions are treated by the functionals [34,62] and is even more pronounced for the CH* and O* systems, which are the products of the CHO* dissociation. As presented in Table 2, CH* adsorption energy changes of about 1.18 eV changing the functional from PBE to RPBE. This indicates that the choice of the functional can affect the calculated stability of the adsorbed species, and this is reflected in the results of the NEB calculations that we will discuss in the next section. Despite these differences, all calculations provide as equilibrium structure for the CH* species the Hollow adsorbed configuration, with the C-H bond directed perpendicularly to the Rh surface, as visible form Figure 2 panel D. All other adsorption sites give unstable structures that naturally relax into the Hollow configuration during the geometry optimization. The prominent stability of this configuration compared to the other adsorption geometries can be related to the undercoordination of the C atom in the CH species, which needs to be saturated by the highest number of surface metal atoms, occurring in Hollow sites (4-fold coordination). Due to the intrinsic instability of the CH species, in the gas phase, it is not possible to compare the adsorption energies with experimental data. Moreover, most of the available computational results on the CH* specie refer to different Rh surfaces [63,64,65] or to systems where CH* is co-adsorbed with hydrogen atoms [61]. Despite these differences, these studies in any case indicate the Hollow configuration to be the most stable one and report geometrical parameters comparable with the computed C–H bond length of 1.10 Å and 1.11 Å for the PBE-based and RPBE calculations respectively, and C–Rh distance of 2.09 Å and 2.11 Å for the PBE-based and RPBE calculations respectively.
Additionally, in the case of O*, adsorption energies are strongly dependent on the choice of the XC functional. Here RPBE underbinds the O* species with respect to PBE of about 0.95 eV for the Hollow adsorption site and of 1.05 eV for the Bridge configuration. As happened in the previous cases, these adsorption energy differences seem to be uncorrelated with the adsorption sites stability trend and almost identical geometrical configurations were obtained in all the three calculations. The most stable adsorbed configuration for O* is on the Hollow site, as reported in previous theoretical studies [66,67,68]. The Bridge-to-Hollow energy difference ranges between 0.12 and 0.22 eV, depending on the calculation level. As reported in Figure 2 panel E, the O–Rh distance is 2.15 Å for the PBE-based calculations, while it increases to 2.20 Å for the RPBE calculation. This bond length difference is compatible with the lower affinity between oxygen and the rhodium surface using the RPBE functional compared to the PBE-based schemes. To be able to compare with the experimental data, as in the H* case, we repeated the calculations referring to O2 dissociative chemisorption. As visible from the data in parenthesis in Table 2, the favorite chemisorption site is still the Hollow spot with an adsorption energy calculated with PBE functional of about 4.53 eV, which overestimates the available experimental data for dissociative chemisorption of about 0.53 eV [58,69]. On the other hand, changing the functional from PBE to RPBE decreases the adsorption energy to 3.04 eV, and strongly underestimates the O2 dissociative chemisorption energy (by 0.96 eV) with respect to the experiment.
Besides considerations on single molecule adsorption, we searched for the most stable co-adsorbate configurations for both the CO*/H* and CH*/O* pairs, which represent the initial and final stage of all our processes, respectively. Our analysis revealed that the less energetic conformation in the case of the CO*/H* pair can be obtained when these species are co-adsorbed in adjacent Bridge sites, as shown in the Supporting Movie (SM) and in Figure S2 attached as Supplementary Material. Regarding the CH*/O* pair, we found that the most stable configuration is the one where the two products species are located on the opposite corner of the square identified by four Hollow sites, as shown in the Supplementary Materials. This arrangement represents the target state of our reaction energy profile analysis.
2.3. Study of the Methanation Rate-Determining Step
As already mentioned, the rate-determining step of the Rh catalyzed CO2 methanation reaction was identified in the CO* + H* → CH* + O* step through the formation of CHO* species [5,6,10,13,14]. Previous DFT simulations concerning the study of Ru (0001) catalyzed CO2 reduction, showed that the CHO* formation and its dissociation have comparable energy barriers [13,29]. A kinetic study performed on top of such calculations points to the CHO* dissociation as the rds of the whole reduction process [13]. To the best of our knowledge, no theoretical studies are currently available concerning the CO2 reduction over rhodium surfaces; what is known from the study of CH3OH dehydrogenation on Rh (111) is that the CHO* formation has an energy barrier similar to that found on the Ru (0001) surface [13,29,70]. Therefore, we calculated the energy landscape of the whole process generating the CH*/O* co-adsorbed pair from CO* and H* through CHO*, at the PBE, PBE+U and RPBE levels. We will discuss in the next paragraph the effect of the different functionals, while we focus here on the reaction mechanism itself, studied at the PBE+U level. The calculated energy profile is shown in Figure 3.
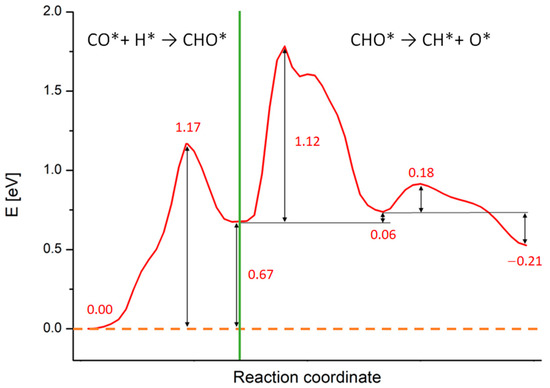
Figure 3.
Reaction energy profiles for the whole CO* + H* → CH* + O* reaction on Rh (100) surface calculated at the PBE+U level. The numbers report the values of energy barriers and reaction energies in eV. The green line separates the two subprocesses in which we split the calculations: the CHO* generation starting from CO* and H and the CHO* dissociation in CH* and O*.
As noticeable, all processes are endothermic and require a certain amount of energy to occur. The green line in Figure 3 separates the two subprocesses in which we split the calculations: the CHO* generation starting from CO* and H*, occurring in a single-step, and the CHO* dissociation, occurring in two sub-steps. During the CHO* formation, the species moves and rotate on the Rh (100) surface in order to generate CHO* and the Rh outermost layer gets slightly distorted. This step requires ca. 1.17 eV to take place, while the reaction energy is around 0.67 eV, as written in Figure 3. Such results compare well with simulations performed on Rh (111) and Ru (0001) surfaces (although different XC-functionals were used) [29,70]. A movie representing this first reaction step is available as SM, while the meaningful snapshots of the process are reported in Figure S2 in the Supplementary Material section. Differently from the simple landscape of this first process, the CHO* dissociation exhibits a more complex energy profile. We focus now on this process whose PB energy profile and related geometries are shown in Figure 4. The initial configuration of the dissociation is shown in Figure 2 panel C (side view) and in the inset A of Figure 4 (top view), while the final configuration is shown in inset C of Figure 4. The values of the energy profiles at the most relevant points of the reaction are explicitly indicated in Figure 4.
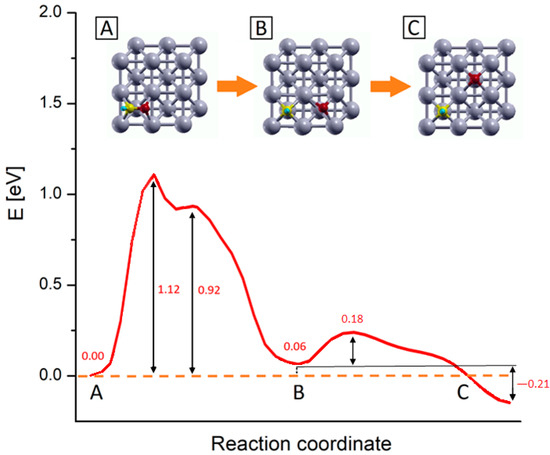
Figure 4.
PBE+U computed reaction energy profiles for the CHO* → CH* + O* step on Rh (100) surface. The numbers report the values of energy barriers and reaction energies in eV. Inset pics represent the main step of the process: (A) CHO* most stable configuration, (B) configuration of dissociated species, and (C) equilibrium configuration of the dissociated species upon oxygen diffusion. Yellow, red, light blue and grey represent C, O, H and Rh atoms respectively.
Following the energy profiles, the whole reaction can be roughly divided into two sub-processes: the first one comprises the C-O bond dissociation and O* migration reaching a first local energy minimum corresponding to the configuration B in Figure 4; in the following step, the O* further migrates to reach the products most stable configuration (inset C). In the first subprocess, starting from the CHO* equilibrium configuration (inset A in Figure 4), there is an initial energy growth, corresponding to the elongation of the C–O bond and consequent adjustment of the outermost Rh layer, which actively takes part in this first dissociation step. After this initial growth, the profiles reach their absolute maximums, which correspond to a state where the CH* and O* species are separated but the system is highly unstable, as the two fragments are located into the same 2 × 2 Rh cell, in mixed Bridge-Hollow sites. This configuration constitutes the transition state for the CHO* bond dissociation, as confirmed by the vibrational analysis which reveals the presence of an imaginary frequency associated with a normal mode pointing along the reaction coordinate. After this sharp maximum, the profiles exhibit a shoulder, corresponding to a configuration in which both species are in Bridge adsorption sites. This is a metastable configuration where the adsorbates are located in a relatively stable point but are not in their minimum energy configuration. In the following steps O* starts to migrate towards the Hollow site of the adjacent Rh 2 × 2 cell, while the CH* makes structural adjustments and falls into its energy minimum structure, a Hollow adsorption site, as previously discussed. Within this subprocess, the outermost Rh layer plays a primary role in supporting all structural changes. This can be noticed for example by looking at the inset B of Figure 4, where despite the whole system being in an energy minimum configuration, the Rh atoms of the outermost layer are still distorted, due to the long-range interactions acting among the two adsorbed species. In the second subprocess of the reaction, O* diffuses towards the Hollow site corresponding to its position in the target state (inset C of Figure 4), passing through a Bridge configuration. Once the final Hollow spot is reached, the interactions among the adsorbed species are minimized, the surface atoms can relax all the tension accumulated along these processes and the system reaches its global minimum. These two subprocesses can be viewed in the movie SM attached as Supplementary Material, while in Figure S2 the snapshots of the molecular configurations in the main points of interest are collected.
As shown in Figure 4, the process that requires more energy is the first dissociation of the C-O bond, with an activation energy barrier of about 1.12 eV to occur. These activation energy barriers are compatible with those of theoretical studies carried out on similar systems: in particular, Zhang et al. [29] estimated that CHO* dissociation can take place on Ru (100) with an activation barrier of about 1.48 eV, while Avanesian et al. [13] showed that on Rh (211), this step can occur with a free energy barrier of about 1.43 eV. At the same time, the computed barriers overestimate experimental values for the whole CO2 methanation reaction that range from 0.7 to 1.0 eV depending on the support [16,19,71,72,73]. The energy barrier overestimation with respect to experiments can be linked to contributions arising from the presence of co-adsorbed species. Indeed, the calculated energy profiles refer to the dissociation of an isolate CHO* species without accounting for the presence of other co-absorbed species. However, it was proved that after the first dissociative adsorption of CO2, the dissociated oxygen atoms remain absorbed on the surface and their presence reduces the activation barrier of the whole methanation reaction [19,66,73]. This explains at the same time why the methanation activation energy is lower for CO2 than that of CO of about 0.15 ÷ 0.35 eV, depending on the experimental conditions [16,19,21,73], and the overestimation of the reaction barrier presented in this work.
Considering the high similarities in the physico-chemical features between the systems, our calculations suggests that the Rh (100) catalyzed process occur as in the case of Ru (0001), being the energy landscapes profiles and the activation barriers comparable for CHO* formation and dissociation [13,29]. Taking into account the role of kinetics, it was found that on the Ru (0001), the slowest process is the CHO* dissociation, even if this step is less energetically demanding compared to the CHO* generation [13]. In analogy with these results, the CHO* cleavage could be the rds of the whole CO2 reduction also in this case, although further investigation on the kinetics of this reaction exploiting, e.g., variational transition state theory [74], are needed to fully validate this hypothesis.
Finally, all the results presented here refer to systems in zero-absolute temperature conditions and do not include any entropic contribution. Indeed, previous studies concerning this reaction on similar systems showed entropic corrections to the free energy on the order of 0.1 eV at room temperature [13,28,29], smaller than the difference related to the use of various computational setups, as shown in the next section.
2.4. Comparison among Different Computational Techniques
To highlight the different performances given by the various computational techniques, we report in Figure 5 the calculated NEB profile for the whole process, where for a better comparison, the three profiles are aligned by setting the energy of the initial configuration to zero.
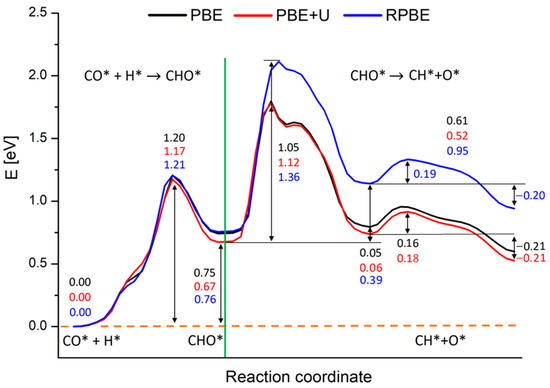
Figure 5.
Reaction energy profiles for the whole CO* + H* → CH* + O* reaction on Rh (100) surface, involving CHO*. Black, red and blue lines represent the profiles calculated at the PBE, PBE+U and RPBE levels respectively. The numbers report the values of energy barriers and reaction energies in eV. The green line separates the two subprocesses in which we split the calculations: the CHO* generation starting from CO* and H and the CHO* dissociation in CH* and O*.
PBE, PBE+U and RPBE yield approximately the same results concerning the generation of CHO*. The activation energy is estimated in ca. 1.20 eV, while the reaction energy is around 0.75 eV for PBE and RPBE calculations, and 0.67 eV for the PBE+U one, as reported in Figure 5. At odds with these results, RPBE description of the CHO* dissociation step deviates strongly from the PBE and PBE+U ones. As is clearly visible from Figure 6, starting from a certain point along the reaction coordinate prior to the first maximum, the RPBE energy diagram is shifted to higher energies when compared to the PBE and PBE+U cases. This upshift slightly varies with the reaction coordinate until the minimum corresponding to configuration B is reached, while it is almost constant, ranging between 0.36 eV and 0.39 eV, during the second part of the process.
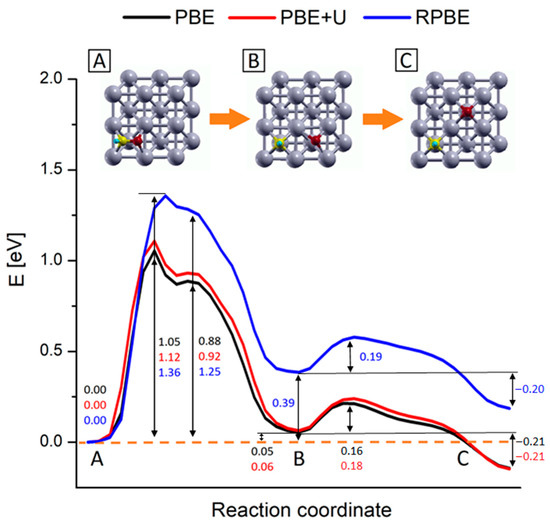
Figure 6.
Reaction energy profiles for the CHO* → CH* + O* reaction on Rh (100) surface. Black, red and blue lines represent the profiles calculated at the PBE, PBE+U and RPBE levels respectively. The numbers report the values of energy barriers and reaction energies in eV. Inset pics represent the geometries of the main steps of the process: (A) CHO* most stable configuration, (B) configuration of dissociated species and (C) equilibrium configuration of the dissociated species upon oxygen diffusion. Yellow, red, light blue and grey represent C, O, H and Rh atoms respectively.
To understand the nature of such energy difference, we decomposed the energetics of the system on the basis of energy data coming from simpler systems. As shown in Figure 7, we were able to decompose the system energetics in three main contributions: the adsorption energies of single CHO*, CH*, O* species, the energy of the free CHO, CH and O (and thus the CH–O bond strength), and the CH*–O*co-adsorption energy. The latter can be recovered on the basis of the dissociated CH*/O* system (the last image of NEB calculation) and the isolated ones. More details on these calculations can be found in the Supplementary Material.
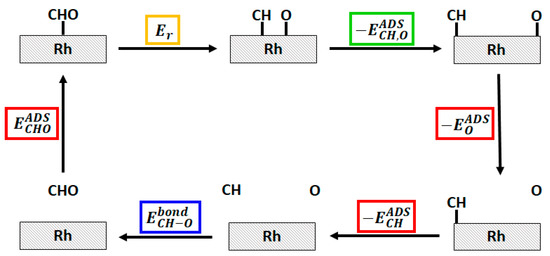
Figure 7.
Hess cycle of the decomposition of the CHO* → CH* + O* reaction energy (highlighted in yellow). The three main contribution, namely the adsorption energies () of CHO*, CH* and O*, the CH–O bond strength in the free CHO species (), and the CH*–O*co-adsorption energy () are highlighted in red, blue and green respectively.
The analysis shows that, in line with the data reported in Table 2, the main difference between PBE and RPBE functionals can be ascribed to the way the free species and the adsorbed species energetics are modeled, while a minor contribution is given by the estimation of the co-adsorption energy. As shown in Table 2, RPBE has a tendency toward lower binding energies with respect to PBE schemes, and this tendency is particularly strong for CH* and O* where the PBE to RPBE adsorption energy differences are about twice the CHO* PBE to RPBE adsorption energy difference. These considerations can motivate the shift observed in the NEB profiles and indeed it can be noticed that the profiles in Figure 4 begin to diverge once the C–O bond is split, i.e., when the substrate-adsorbate interaction increases.
3. Materials and Methods
All simulations were carried out at the DFT level using a plane-waves basis set, as implemented in Quantum Espresso version 6.5. [75] The Perdew-Burke-Ernzerhof (PBE) [33] and the Revised Perdew-Burke-Ernzerhof (RPBE) [34] exchange-correlation (XC) functionals were employed to describe the electron-electron interactions. PBE+U calculations were also performed on systems containing C and O atoms, using as corrective parameter U = 0.65 eV both for C and O species. By using this U value, in line with the one adopted in similar previous calculations [55,56], the computed CO adsorption energies on Rh (100) surface match the experimental data. As the main process in this reaction concerned the generation and cleavage of covalent bonds, we did not include any dispersion corrections. The energy cut-off for the plane waves expansion was set to 1080 eV and 820 eV for PBE and RPBE calculations respectively. Core-electrons were modeled with the XC-compatible Optimized Norm-Conserving Vanderbilt (ONCV) pseudopotentials. Bulk calculations for the Rh crystals were performed on a face centered cubic (fcc) cell, using an 18 × 18 × 18 k-point mesh, yielding an equilibrium lattice constant of 3.833 Å and 3.922 Å for the PBE and RPBE calculations respectively, in close agreement (especially in the case of PBE) with the experimental value [76] extrapolated at 0 °K of 3.797 Å. The PBE and RPBE calculated bulk cell parameters were used to build the 8-layers Rh (100) slabs which represent the catalyst surface. Building the supercells, a 20 Å vacuum layer was added along the direction orthogonal to the surface in order to avoid any interaction between consecutive replicas. Keeping the two inner layers fixed at their ideal bulk positions, all the remaining atomic positions were relaxed until the residual forces were lower than 10−4 eV/Å, with a convergence threshold on the ground state total energy of 10−9 eV. All relaxation runs were carried out using the Broyden–Fletcher–Goldfarb–Shanno (BFGS) quasi-Newton algorithm [77].
Geometry optimizations involving adsorbed species were performed on single molecules adsorbed on a 3 × 3 eight-layer-thick supercell. This supercell dimension was chosen in order to avoid spurious interactions among molecules belonging to nearby unit cells within the same surface. The calculations on these systems were performed using a 6 × 6 × 1 k-point mesh, the same Brillouin zone sampling of the converged bulk calculations ensuring adsorption energies accurate up to ±0.01 eV. Dipole corrections were applied along the direction orthogonal to the slab surface to prevent artifacts related to the presence of an artificial net electric field in the case of asymmetric slabs [78]. Calculations on the adsorbed species in gas phase were carried out by fully relaxing the respective geometries within fcc cells with a 40 Å lattice parameter. The study of the methanation rds was conducted using the Climbing Image Nudged Elastic Band technique (CI-NEB) [32]. Transition state geometries and energy barriers for the process were obtained by imposing a convergence threshold on the forces of 0.05 eV/A. The CI-NEB simulations was split into two separate calculations, namely the formation of the intermediate CHO* and its dissociation. The former calculation was conducted using 20 images, while the latter exploited a total of 40 images. Transition states were identified as the maxima in the NEB energy profile in analogy with previous study concerning CO2 reduction over various metal surfaces [13,29]. Furthermore, to confirm the nature of the transition state associated with the rate-determining step, we performed vibrational frequency and normal mode calculations on the geometry corresponding to the maximum of the rds NEB profile, by computing the Hessian matrix on the solely atoms of the adsorbate, while the atoms of the slab were kept fixed [75]. The starting point of the CHO* generation simulation was the most stable co-adsorbed CO*/H* configuration, while the final image was the relaxed CHO* complex adsorbed on the Rh (100) surface. CHO* dissociation calculations started from this last image and ended in the configuration in which the complex was dissociated, and the CH* and O* relative positions minimized the total energy of the system.
4. Conclusions
In conclusion, we studied the rate-determining step of the rhodium catalyzed CO2 reduction, which is the hydrogen-assisted CO* dissociation through formation and subsequent dissociation of the CHO* intermediate [4,5,13,15]. In the present work, this reaction step was studied by means of DFT and CI-NEB techniques on the Rh (100) surface. Within this framework, the PBE, RBPE XC functionals and PBE+U methods were employed. Overall, all the methods predicted the same energetics for the CHO* generation from CO* and H*, which was found to be a single step process. On the contrary, the CHO* dissociation was found to be happening in two separate steps: first the elongation and breaking of the C–O bond, and second the migration of the O* species to its equilibrium site, with the concomitant relaxation of surface tension. Although finding the same process and geometries, RPBE results differ from PBE based ones when taking a closer look at the energies which are involved in the CHO* → CH* + O* step: the products being less stable by ~0.35 eV and the C–O bond break energy barrier strongly overestimated for RPBE. The origin of this difference resides in the way RPBE was designed in order to correct the adsorption energetics of LDA and PBE functionals [34,62]. The tendency of RPBE to underbind with respect to PBE is especially enhanced in the case of the product species. For example, our results show that RPBE strongly underbinds the O* species with respect to experimental data, largely overcorrecting PBE overbinding. The larger underbinding in the O* and CH* species compared to CHO* explains both the deviation of the RPBE profile with respect to the PBE based one in the moment the C–O bond breaks and the product species are formed, and the subsequent almost rigid shift of the profile. A similar picture to that found on Ru (0001) concerning the energetics of the two subprocesses was found, suggesting the CHO* cleavage as the rate-determining step of the whole Rh-catalyzed methanation reaction.
Supplementary Materials
The following are available online at https://www.mdpi.com/article/10.3390/catal11050538/s1, Video SM: CI-NEB calculated mechanism for the CHO* generation and dissociation; Text: details on the calculations of the interaction energy among co-adsorbed species, snapshots of the meaningful involved in the PBE+U calculated NEB trajectory.
Author Contributions
Conceptualization, M.V., M.M. and S.C.; investigation, M.V. and M.M.; writing—original draft preparation, M.V. and M.M.; writing—review and editing, M.V., M.M. and S.C.; supervision, M.M. and S.C.; project administration, S.C.; funding acquisition, S.C. All authors have read and agreed to the published version of the manuscript.
Funding
M.M. and S.C. acknowledge funding from the ERC under the grant ERC-CoG-681285 TAME Plasmons. M.V. and S.C. also acknowledge funding from MIUR under the grant R164LZWZ4A MIUR-FARE Plasmo-Chem.
Data Availability Statement
All relevant data are contained in the present manuscript. Other inherent data are available on request from the corresponding author.
Acknowledgments
The authors acknowledge CINECA (Bologna, Italy), the Leibniz Supercomputing Centre (Munich, Germany) and the CRESCO/ENEAGRID High Performance Computing (Rome, Italy) infrastructure and its staff for computational resources and technical support.
Conflicts of Interest
The authors declare no conflict of interest.
Appendix A
The precise structure and the physical features of the rhodium surface strongly depends on the computational technique adopted in the calculations. To compare the performance of the different xc functionals, we define three main quantities that characterize the catalyst properties, namely the surface energies , work function , and surface lattice relaxation parameter . These quantities are defined as follow:
- is the energy required to build a surface starting from an infinite bulk crystal:where is the total energy of the -layer slab and is the energy per atom of the infinite bulk. In this case, = 8. The ½ factor accounts for the presence of two symmetric surfaces for each slab.
- represents the energy required for extracting an electron from the system:where is the electrostatic potential calculated at the center of vacuum region and is the Fermi energy of the slab.
- : quantifies how much the superficial layers of the slab move with respect to their ideal position in the bulk crystal structure:where is the distance between layers i and j, and is the distance between the layers of the bulk.
These quantities were calculated for the Rh (100) slabs treated with different computational approaches and the results, together with some meaningful literature data, are reported in Section 2.1.
References
- Intergovernmental Panel on Climate Change. IPCC’s Fifth Assessment Report; IPCC: Geneva, Switzerland, 2014.
- Vijayavenkataraman, S.; Iniyan, S.; Goic, R. A review of climate change, mitigation and adaptation. Renew. Sustain. Energy Rev. 2012, 16, 878–897. [Google Scholar] [CrossRef]
- Mebrahtu, C.; Krebs, F.; Abate, S.; Perathoner, S.; Centi, G.; Palkovits, R. CO2 Methanation: Principles and Challenges. In Studies in Surface Science and Catalysis; Elsevier B.V.: Amsterdam, The Netherlands, 2019; Volume 178, pp. 85–103. ISBN 9780444641274. [Google Scholar]
- Rönsch, S.; Schneider, J.; Matthischke, S.; Schlüter, M.; Götz, M.; Lefebvre, J.; Prabhakaran, P.; Bajohr, S. Review on methanation—From fundamentals to current projects. Fuel 2016, 166, 276–296. [Google Scholar] [CrossRef]
- Miao, B.; Ma, S.S.K.; Wang, X.; Su, H.; Chan, S.H. Catalysis mechanisms of CO2 and CO methanation. Catal. Sci. Technol. 2016, 6, 4048–4058. [Google Scholar] [CrossRef]
- Su, X.; Xu, J.; Liang, B.; Duan, H.; Hou, B.; Huang, Y. Catalytic carbon dioxide hydrogenation to methane: A review of recent studies. J. Energy Chem. 2016, 25, 553–565. [Google Scholar] [CrossRef]
- Erdőhelyi, A. Hydrogenation of carbon dioxide on supported rh catalysts. Catalysts 2020, 10, 155. [Google Scholar] [CrossRef]
- Kattel, S.; Liu, P.; Chen, J.G. Tuning Selectivity of CO2 Hydrogenation Reactions at the Metal/Oxide Interface. J. Am. Chem. Soc. 2017, 139, 9739–9754. [Google Scholar] [CrossRef] [PubMed]
- Zhang, Y.; He, S.; Guo, W.; Hu, Y.; Huang, J.; Mulcahy, J.R.; Wei, W.D. Surface-Plasmon-Driven Hot Electron Photochemistry. Chem. Rev. 2018, 118, 2927–2954. [Google Scholar] [CrossRef] [PubMed]
- Zhang, X.; Li, X.; Zhang, D.; Su, N.Q.; Yang, W.; Everitt, H.O.; Liu, J. Product selectivity in plasmonic photocatalysis for carbon dioxide hydrogenation. Nat. Commun. 2017, 8, 1–9. [Google Scholar] [CrossRef]
- Li, X.; Everitt, H.O.; Liu, J. Confirming nonthermal plasmonic effects enhance CO2 methanation on Rh/TiO2 catalysts. Nano Res. 2019, 12, 1906–1911. [Google Scholar] [CrossRef]
- Kim, C.; Hyeon, S.; Lee, J.; Kim, W.D.; Lee, D.C.; Kim, J.; Lee, H. Energy-efficient CO2 hydrogenation with fast response using photoexcitation of CO2 adsorbed on metal catalysts. Nat. Commun. 2018, 9, 1–8. [Google Scholar] [CrossRef] [PubMed]
- Avanesian, T.; Gusmão, G.S.; Christopher, P. Mechanism of CO2 reduction by H2 on Ru(0001) and general selectivity descriptors for late-transition metal catalysts. J. Catal. 2016, 343, 86–96. [Google Scholar] [CrossRef]
- Dai, X.; Sun, Y. Reduction of carbon dioxide on photoexcited nanoparticles of VIII group metals. Nanoscale 2019, 11, 16723–16732. [Google Scholar] [CrossRef]
- Wang, J.; Kawazoe, Y.; Sun, Q.; Chan, S.; Su, H. The selectivity and activity of catalyst for CO hydrogenation to methanol and hydrocarbon: A comparative study on Cu, Co and Ni surfaces. Surf. Sci. 2016, 645, 30–40. [Google Scholar] [CrossRef]
- Sexton, B.A.; Somorjai, G.A. The hydrogenation of CO and CO2 over polycrystalline rhodium: Correlation of surface composition, kinetics and product distributions. J. Catal. 1977, 46, 167–189. [Google Scholar] [CrossRef]
- Castner, D.G.; Sexton, B.A.; Somorjai, G.A. Leed and Thermal Desorption Studies of Small Molecules (H2, O2, CO, CO2, NO, C2H4, C2H2 and C) Chemisorbed on the Rhodium (111) and (100) Surfaces. Surf. Sci. 1978, 71, 519–540. [Google Scholar] [CrossRef]
- van Tol, M.F.H.; Gielbert, A.; Nieuwenhuys, B.E. The adsorption and dissociation of CO2 on Rh. Appl. Surf. Sci. 1993, 67, 166–178. [Google Scholar] [CrossRef]
- Fisher, I.A.; Bell, A.T. A comparative study of CO and CO2 hydrogenation over Rh/SiO2. J. Catal. 1996, 162, 54–65. [Google Scholar] [CrossRef]
- Novák, É.; Fodor, K.; Szailer, T.; Oszkó, A.; Erdöhelyi, A. CO2 hydrogenation on Rh/TiO2 previously reduced at different temperatures. Top. Catal. 2002, 20, 107–117. [Google Scholar] [CrossRef]
- Jacquemin, M.; Beuls, A.; Ruiz, P. Catalytic production of methane from CO2 and H2 at low temperature: Insight on the reaction mechanism. Catal. Today 2010, 157, 462–466. [Google Scholar] [CrossRef]
- Karelovic, A.; Ruiz, P. Mechanistic study of low temperature CO2 methanation over Rh/TiO 2 catalysts. J. Catal. 2013, 301, 141–153. [Google Scholar] [CrossRef]
- Liu, X.; Sun, L.; Deng, W.Q. Theoretical Investigation of CO2 Adsorption and Dissociation on Low Index Surfaces of Transition Metals. J. Phys. Chem. C 2018, 122, 8306–8314. [Google Scholar] [CrossRef]
- Solymosi, F.; Pásztor, M. Analysis of the IR-spectral behavior of adsorbed CO formed in H2 + CO2 surface interaction over supported rhodium. J. Catal. 1987, 104, 312–322. [Google Scholar] [CrossRef]
- Henderson, M.A.; Worley, S.D. An Infrared Study of the Dissociation of Carbon Dioxide over Support Rhodium Catalyst. Surf. Sci. 1985, 149, L1–L6. [Google Scholar] [CrossRef]
- Claver, C. Rhodium Catalysis; Springer International Publishing: Cham, Switzerland, 2018; ISBN 9783319666631. [Google Scholar]
- Dietz, L.; Piccinin, S.; Maestri, M. Mechanistic insights into CO2 activation via reverse water—Gas shift on metal surfaces. J. Phys. Chem. C 2015, 119, 4959–4966. [Google Scholar] [CrossRef]
- Alfonso, D.R. Further theoretical evidence for hydrogen-assisted CO dissociation on Ru(0001). J. Phys. Chem. C 2013, 117, 20562–20571. [Google Scholar] [CrossRef]
- Zhang, S.T.; Yan, H.; Wei, M.; Evans, D.G.; Duan, X. Hydrogenation mechanism of carbon dioxide and carbon monoxide on Ru(0001) surface: A density functional theory study. RSC Adv. 2014, 4, 30241–30249. [Google Scholar] [CrossRef]
- Zhang, M.; Wu, X.; Yu, Y. A comparative DFT study on the dehydrogenation of methanol on Rh(100) and Rh(110). Appl. Surf. Sci. 2018, 436, 268–276. [Google Scholar] [CrossRef]
- Zhu, Y.A.; Chen, D.; Zhou, X.G.; Yuan, W.K. DFT studies of dry reforming of methane on Ni catalyst. Catal. Today 2009, 148, 260–267. [Google Scholar] [CrossRef]
- Henkelman, G.; Uberuaga, B.P.; Jónsson, H. Climbing image nudged elastic band method for finding saddle points and minimum energy paths. J. Chem. Phys. 2000, 113, 9901–9904. [Google Scholar] [CrossRef]
- Perdew, J.P.; Burke, K.; Ernzerhof, M. Generalized gradient approximation made simple. Phys. Rev. Lett. 1996, 77, 3865–3868. [Google Scholar] [CrossRef] [PubMed]
- Hammer, B.; Hansen, L.B.; Nørskov, J.K. Improved adsorption energetics within density-functional theory using revised Perdew-Burke-Ernzerhof functionals. Phys. Rev. B Condens. Matter Mater. Phys. 1999, 59, 7413–7421. [Google Scholar] [CrossRef]
- Tolba, S.A.; Gameel, K.M.; Ali, B.A.; Almossalami, H.A.; Allam, N.K. Density Functional Calculations—Recent Progresses of Theory and Application. Intech Open: London, UK, 2018; pp. 3–30. [Google Scholar] [CrossRef]
- Patra, A.; Bates, J.E.; Sun, J.; Perdew, J.P. Properties of real metallic surfaces: Effects of density functional semilocality and van der Waals nonlocality. Proc. Natl. Acad. Sci. USA 2017, 114, E9188–E9196. [Google Scholar] [CrossRef]
- Xie, J.; Scheffler, M. Structure and dynamics of Rh surfaces. Phys. Rev. B 1998, 57, 4768–4775. [Google Scholar] [CrossRef]
- Begley, A.M.; Kim, S.K.; Jona, F.; Marcus, P.M. Surface relaxation of Rh{001}. Phys. Rev. B 1993, 48, 12326–12329. [Google Scholar] [CrossRef]
- Derry, G.N.; Kern, M.E.; Worth, E.H. Recommended values of clean metal surface work functions. J. Vac. Sci. Technol. A 2015, 33, 060801. [Google Scholar] [CrossRef]
- Tyson, W.R. Surface energies of solid metals. Can. Metall. Q. 1975, 14, 307–314. [Google Scholar] [CrossRef]
- De Waele, S.; Lejaeghere, K.; Sluydts, M.; Cottenier, S. Error estimates for density-functional theory predictions of surface energy and work function. Phys. Rev. B 2016, 94, 235418. [Google Scholar] [CrossRef]
- Kose, R.; Brown, W.A.; King, D.A. Role of Lateral Interactions in Adsorption Kinetics: CO/Rh{100}. J. Phys. Chem. B 1999, 103, 8722–8725. [Google Scholar] [CrossRef]
- Jansen, M.M.M.; Gracia, J.; Nieuwenhuys, B.E.; Niemantsverdriet, J.W. Interactions between co-adsorbed CO and H on a Rh(100) single crystal surface. Phys. Chem. Chem. Phys. 2009, 11, 10009–10016. [Google Scholar] [CrossRef]
- De Jong, A.M.; Niemantsverdriet, J.W. The adsorption of CO on Rh(100): Reflection absorption infrared spectroscopy, low energy electron diffraction, and thermal desorption spectroscopy. J. Chem. Phys. 1994, 101, 10126–10133. [Google Scholar] [CrossRef]
- Kim, J.; Peebles, H.C.; White, J.M. Electron spectroscopic study of the interaction of coadsorbed CO and D2 on Rh(100) at low temperature. Surf. Sci. 1982, 114, 363–380. [Google Scholar] [CrossRef]
- Van Bavel, A.P.; Hopstaken, M.J.P.; Curulla, D.; Niemanstsverdriet, J.W.; Lukkien, J.J.; Hilbers, P.A.J. Quantification of lateral repulsion between coadsorbed CO and N on Rh(100) using temperature-programmed desorption, low-energy electron diffraction, and Monte Carlo simulations. J. Chem. Phys. 2003, 119, 524–532. [Google Scholar] [CrossRef]
- Baraldi, A.; Gregoratti, L.; Comelli, G.; Dhanak, V.R.; Kiskinova, M.; Rosei, R. CO adsorption and CO oxidation on Rh(100). Appl. Surf. Sci. 1996, 99, 1–8. [Google Scholar] [CrossRef]
- Hung, T.C.; Liao, T.W.; Liao, Z.H.; Hsu, P.W.; Cai, P.Y.; Lu, W.H.; Wang, J.H.; Luo, M.F. Dependence on size of supported Rh nanoclusters for CO adsorption. RSC Adv. 2016, 6, 3830–3839. [Google Scholar] [CrossRef]
- Nieskens, D.L.S.; Jansen, M.M.M.; Van Bavel, A.P.; Curulla-Ferré, D.; Niemantsverdriet, J.W. The influence of carbon on the adsorption of CO on a Rh(100) single crystal. Phys. Chem. Chem. Phys. 2006, 8, 624–632. [Google Scholar] [CrossRef]
- Nieskens, D.L.S.; Curulla-Ferré, D.; Niemantsverdriet, J.W. Atom-molecule interactions on transition metal surfaces: A DFT study of CO and several atoms on Rh(100), Pd(100) and Ir(100). ChemPhysChem 2006, 7, 1075–1080. [Google Scholar] [CrossRef]
- Liu, D.J. CO oxidation on Rh(100): Multisite atomistic lattice-gas modeling. J. Phys. Chem. C 2007, 111, 14698–14706. [Google Scholar] [CrossRef]
- Gajdoš, M.; Eichler, A.; Hafner, J. CO adsorption on close-packed transition and noble metal surfaces: Trends from ab initio calculations. J. Phys. Condens. Matter 2004, 16, 1141–1164. [Google Scholar] [CrossRef]
- Mason, S.E.; Grinberg, I.; Rappe, A.M. First-principles extrapolation method for accurate CO adsorption energies on metal surfaces. Phys. Rev. B 2004, 69, 161401. [Google Scholar] [CrossRef]
- Tan, L.; Huang, L.; Liu, Y.; Wang, Q. Detailed mechanism of the NO + CO reaction on Rh(100) and Rh(111): A first-principles study. Appl. Surf. Sci. 2018, 444, 276–286. [Google Scholar] [CrossRef]
- Kresse, G.; Gil, A.; Sautet, P. Significance of single-electron energies for the description of CO on Pt(111). Phys. Rev. B 2003, 68, 3–6. [Google Scholar] [CrossRef]
- Köhler, L.; Kresse, G. Density functional study of CO on Rh(111). Phys. Rev. B 2004, 70, 165405. [Google Scholar] [CrossRef]
- Efstathiou, A.M.; Bennett, C.O. Enthalpy and entropy of H2 Adsorption on Rh/Al2O3 measured by temperature-programmed desorption. J. Catal. 1990, 124, 116–126. [Google Scholar] [CrossRef]
- Kose, R.; Brown, W.A.; King, D.A. Calorimetric heats of dissociative adsorption for O2 on Rh{100}. Surf. Sci. 1998, 402–404, 856–860. [Google Scholar] [CrossRef]
- Panayotov, D.; Mihaylov, M.; Nihtianova, D.; Spassov, T.; Hadjiivanov, K. Spectral evidence for hydrogen-induced reversible segregation of CO adsorbed on titania-supported rhodium. Phys. Chem. Chem. Phys. 2014, 16, 13136–13144. [Google Scholar] [CrossRef]
- Zhang, R.; Liu, F.; Zhao, X.; Wang, B.; Ling, L. First-Principles Study about the Effect of Coverage on H2 Adsorption and Dissociation over a Rh(100) Surface. J. Phys. Chem. C 2015, 119, 10355–10364. [Google Scholar] [CrossRef]
- Wang, B.; Song, L.; Zhang, R. The dehydrogenation of CH4 on Rh(111), Rh(110) and Rh(100) surfaces: A density functional theory study. Appl. Surf. Sci. 2012, 258, 3714–3722. [Google Scholar] [CrossRef]
- Wellendorff, J.; Silbaugh, T.L.; Garcia-Pintos, D.; Nørskov, J.K.; Bligaard, T.; Studt, F.; Campbell, C.T. A benchmark database for adsorption bond energies to transition metal surfaces and comparison to selected DFT functionals. Surf. Sci. 2015, 640, 36–44. [Google Scholar] [CrossRef]
- Lin, Y.Z.; Sun, J.; Lin, J.D.; Chen, H.B.; Liao, D.W.; Yi, J.; Liao, D.W.; Chen, H.B.; Liao, D.W. Energetics of chemisorption and conversion of methane on transition metal surfaces. J. Mol. Struct. THEOCHEM 2002, 587, 63–71. [Google Scholar] [CrossRef]
- Van Grootel, P.W.; Van Santen, R.A.; Hensen, E.J.M. Methane dissociation on high and low indices Rh surfaces. J. Phys. Chem. C 2011, 115, 13027–13034. [Google Scholar] [CrossRef]
- Van Grootel, P.W.; Hensen, E.J.M.; Van Santen, R.A. The CO formation reaction pathway in steam methane reforming by rhodium. Langmuir 2010, 26, 16339–16348. [Google Scholar] [CrossRef]
- Wang, Y.Q.; Lv, C.Q.; Wang, G.C. Chemisorbed oxygen atom on the activation of C-H bond in methane: A Rh model study. RSC Adv. 2015, 5, 66221–66230. [Google Scholar] [CrossRef]
- Diao, Z.Y.; Hao, C.; Wang, Z.X.; Dong, C.C.; Pang, X.H. Adsorption, vibration, and diffusion of O atoms on Rh low-index and (711) stepped defective surfaces. J. Phys. Chem. B 2005, 109, 12467–12473. [Google Scholar] [CrossRef]
- Xing, B.; Pang, X.Y.; Wang, G.C. C-H bond activation of methane on clean and oxygen pre-covered metals: A systematic theoretical study. J. Catal. 2011, 282, 74–82. [Google Scholar] [CrossRef]
- Brown, W.A.; Kose, R.; King, D.A. Femtomole adsorption calorimetry on single-crystal surfaces. Chem. Rev. 1998, 98, 797–831. [Google Scholar] [CrossRef]
- Jiang, R.; Guo, W.; Li, M.; Zhu, H.; Zhao, L.; Lu, X.; Shan, H. Methanol dehydrogenation on Rh(111): A density functional and microkinetic modeling study. J. Mol. Catal. A Chem. 2011, 344, 99–110. [Google Scholar] [CrossRef]
- Solymosi, F.; Erdöhelyi, A. Methanation of CO2 on supported rhodium catalysts. Stud. Surf. Sci. Catal. 1981, 7, 1448–1449. [Google Scholar] [CrossRef]
- Zhang, Z.; Kladi, A.; Verykios, X.E. Effects of carrier doping on kinetic parameters of CO2 hydrogenation on supported rhodium catalysts. J. Catal. 1994, 148, 737–747. [Google Scholar] [CrossRef]
- Beuls, A.; Swalus, C.; Jacquemin, M.; Heyen, G.; Karelovic, A.; Ruiz, P. Methanation of CO2: Further insight into the mechanism over Rh/γ-Al2 O3 catalyst. Appl. Catal. B Environ. 2012, 113, 2–10. [Google Scholar] [CrossRef]
- Bao, J.L.; Truhlar, D.G. Variational transition state theory: Theoretical framework and recent developments. Chem. Soc. Rev. 2017, 46, 7548–7596. [Google Scholar] [CrossRef]
- Giannozzi, P.; Baroni, S.; Bonini, N.; Calandra, M.; Car, R.; Cavazzoni, C.; Ceresoli, D.; Chiarotti, G.L.; Cococcioni, M.; Dabo, I.; et al. QUANTUM ESPRESSO: A modular and open-source software project for quantum simulations of materials. J. Phys. Condens. Matter 2009, 21, 395502. [Google Scholar] [CrossRef] [PubMed]
- Arblaster, J.W. Crystallographic properties of rhodium. Platin. Met. Rev. 1997, 41, 184–189. [Google Scholar]
- Head, J.D.; Zerner, M.C. A Broyden—Fletcher—Goldfarb—Shanno optimization procedure for molecular geometries. Chem. Phys. Lett. 1985, 122, 264–270. [Google Scholar] [CrossRef]
- Bengtsson, L. Dipole correction for surface supercell calculations. Phys. Rev. B 1999, 59, 12301–12304. [Google Scholar] [CrossRef]


Publisher’s Note: MDPI stays neutral with regard to jurisdictional claims in published maps and institutional affiliations. |
© 2021 by the authors. Licensee MDPI, Basel, Switzerland. This article is an open access article distributed under the terms and conditions of the Creative Commons Attribution (CC BY) license (https://creativecommons.org/licenses/by/4.0/).