Article

CO2 Self-Poisoning and Its Mitigation in CuO Catalyzed CO Oxidation: Determining and Speeding up the Rate-Determining Step

1
Energy and Catalysis Laboratory, Department of Mechanical and Automation Engineering, The Chinese University of Hong Kong, Shatin, NT, Hong Kong, China
2
Hubei Key Laboratory of Biomass Fibers and Eco-Dyeing & Finishing, School of Chemistry and Chemical Engineering, Wuhan Textile University, No.1, Yangguang Avenue, Wuhan 430200, China
*
Author to whom correspondence should be addressed.
Catalysts 2021, 11(6), 654; https://doi.org/10.3390/catal11060654
Submission received: 30 April 2021 / Revised: 18 May 2021 / Accepted: 20 May 2021 / Published: 22 May 2021
(This article belongs to the Special Issue Oxidation Catalysis under Unconventional Methods)

Abstract

:
Cu-based catalysts are promising for CO oxidation applications with catalyst deactivation being a major barrier. We start with a CuO/Al2O3 catalyst and find that while the CO conversion decreases, CO2 accumulates and the average Cu chemical state stays the same. It suggests CO2 self-poisoning, i.e., CO2 desorption is the rate-determining step. Subsequently, experiments are performed to prove this hypothesis by showing (1) CO2 adsorption inhibits O2 adsorption, (2) complete desorption of CO2 regenerate the catalyst, (3) pre-adsorbed CO2 quenches catalyst activity which recovers during the reaction and (4) the apparent activation energy is consistent with CO2 desorption. It is further evidenced by using a stronger CO2 adsorbing support CeO2 to speed up CO2 desorption from the CuO sites resulting in a superior CuO/CeO2 catalyst. It provides an example for experimentally deciding and speeding up the rate-determining step in a catalytic reaction.

1. Introduction

Catalytic CO oxidation is an important reaction in automotive exhaust catalysis [1,2,3,4,5]. The current commercial catalysts are mainly noble metal (Pt, Pd and Rh) containing catalysts. However, due to the high prices and the limited resources of noble metals, noble metal-free catalysts are much more desired. Among all base metal oxides, cobalt and copper-based oxides are potential candidates [6,7,8,9,10]. A major drawback of Cu based catalysts is high susceptibility to deactivation by water and sulfur, which hinders their applications [11,12]. Specifically, there is no consensus on what the active sites and deactivation mechanism are for Cu based catalysts.
Many studies suggest that reduced species such as Cu0 or Cu+ species are active species while Cu2+ species have poor activity. It is believed that the Cu oxidation state changes among Cu, Cu2O and CuO depending on the pretreatment or reaction condition [11,13,14,15,16]. Several characterization techniques, including XRD, XPS and TEM, have been used to characterize fresh and spent Cu catalysts under ex situ conditions. However, there is always concern of proper preservation of chemical state and catalyst structure when the spent catalysts are exposed to air in these experiments [17]. To overcome these problems, in situ characterization has also been carried out. However, due to the constraint imposed by in situ techniques, new issues arise with the most significant one probably being that the chemical environments are quite different from the real reaction conditions, for example, much lower reactant partial pressures in in situ XPS, [18]. different gas flow patterns in in situ XRD [19,20] etc.
The extensive efforts in determining catalyst structure or active sites are well reflective of the current development in mechanistic and kinetics studies of heterogeneous catalysis, i.e., a surface reaction involving the active site is presumably the rate determining step. A catalysis mechanism consists of many elementary steps and the quasi-equilibrium approximation has it that the slowest elementary step determines the overall reaction rate (thus called “the rate determining step”) while all other steps are sufficiently fast that they can be considered as being in quasi-equilibrium when deriving kinetics in heterogeneous catalysis [21]. Product desorption are often assumed to be fast, such as in Langmuir–Hinshelwood–Hougen–Watson (LHHW) kinetics [22]. There are few reports suggesting that the product desorption can be the rate determining step such as in the NH3 decomposition and hydrogen desorption reactions, which were inferred from the N2 desorption rate measurements for the former and DFT calculation of activation energy for the latter [23,24].
In CO oxidation, CO2 is the reaction product. There are limited research efforts on CO2 inhibiting effect on the reaction evidenced by feeding additional CO2 gas in the system [3,25,26], which, however, may well result from a change in thermodynamic equilibrium of the reaction. The effect was believed to be due to the accumulation of surface carbonate species evidenced by IR characterization. However, it is not clear which sites these carbonates accumulate on and it is often argued that the observed species may be a spectator species. When a reaction product strongly adsorbs on the catalytic active sites, it inhibits further adsorption of reactants and slows down the catalytic reaction; this phenomenon is called self-poisoning in catalysis. In these cases, product desorption is the rate determining step. There are a few reports in the literature on CO2 self-poisoning of Au based catalysts in the literature [27,28,29,30]. To the best of our knowledge, there has been no report regarding CO2 self-poisoning of Cu based catalysts.
In this work, we develop a method to in situ measure the Cu chemical state and the adsorption characteristics of the reactants (CO and O2) and the product (CO2). The average Cu chemical state is measured by a difference method. After ruling out chemical change in the catalyst itself and CO poisoning and separating temperature effects, CO2 self-poisoning is identified as the main reason for the catalyst deactivation and CO2 desorption is the rate-determining step on the CuO/Al2O3 catalyst, which is further proved by a set of experiments.

2. Results and Discussion

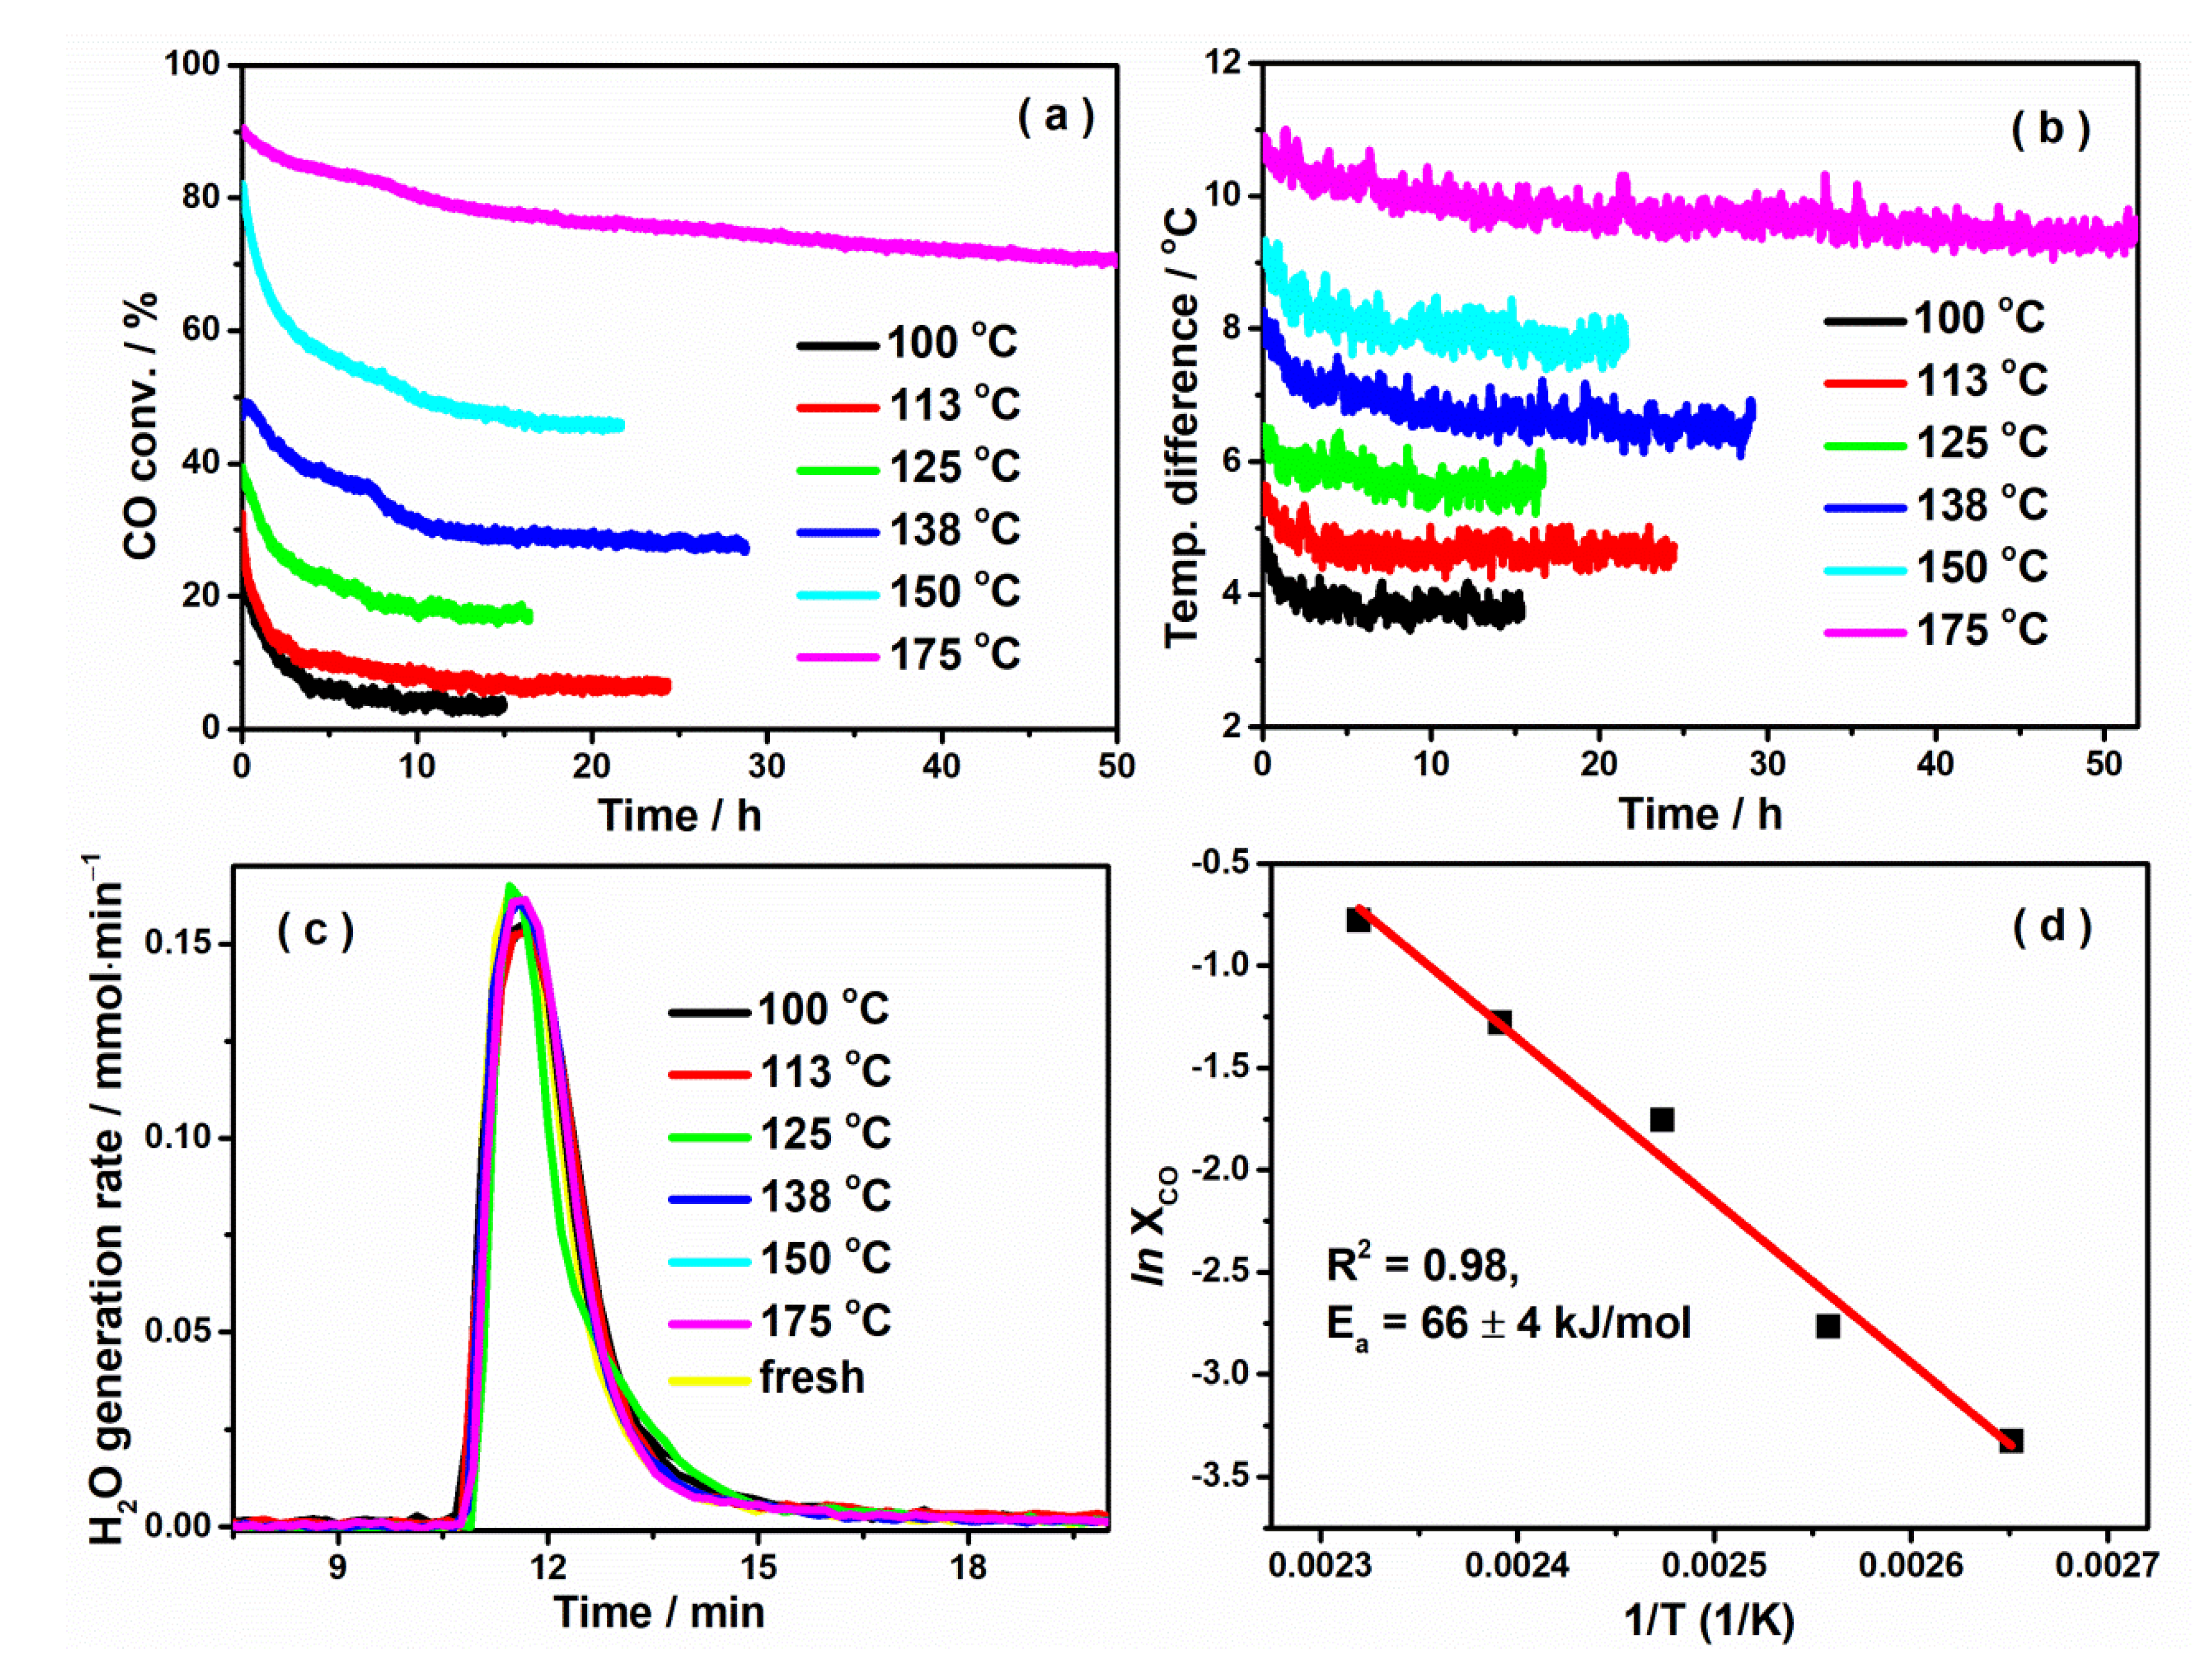
2.1. Catalyst Deactivation Occurs on a CuO/Al2O3 Catalyst in CO Oxidation

To reveal intrinsic catalytic activity, CO conversion was tested at different furnace temperatures until steady state was reached according to our recently published work [31]. The temperatures were selected in such a way that there was a good spacing in the initial conversion covering low (~20%) to ~100%. In all catalytic performance tests, CO conversion decreases over time as shown in Figure 1a. At each set furnace temperature, it takes over 10 h to reach steady state. Meanwhile, the catalyst front temperatures were also recorded and they were constantly above the set furnace temperatures due to the exothermicity of the reaction. The trends of CO conversion and the temperature difference are very similar (see Figure 1a,b), which raises a question as to whether the observed decreasing of CO conversion is merely a temperature effect or indeed due to catalyst deactivation, which may involve factors such as physical or chemical change of the catalyst itself, adsorption of CO and O2, or desorption of CO2.
In order to assess the effect of catalyst structure on the catalytic surface reaction, we reliably measured the average Cu chemical state using a difference method (see Figure 1c and experimental Section 3.5). We applied the procedure on the catalyst after every reaction we performed in this work. All tests show the same result that after reaction Cu in the catalyst remains at the same average chemical state, i.e., 94% in oxide (CuO) form. Since CuO doesn’t have multiple phases at the reaction temperatures [32], it is inferred that the physical property of the CuO catalyst does not change during the reaction. Therefore, the catalyst bulk structure remains stable and is expected to have little contribution to the observed decreasing of CO conversion. Note that the catalyst surface under reaction conditions can still be dynamic as the catalyst is continuously consumed and regenerated. A cycle such as Cu2+ -> Cu+ -> Cu2+ is very likely and when the reaction ends the catalyst returns to Cu2+ state.
In catalytic CO oxidation, temperature dependence of the apparent CO conversion is through the rate determining step. In other words, when the catalyst temperature decreases the rate determining step slows down accordingly resulting in lower CO conversion. The activation energy is estimated to be 66 ± 4 kJ/mol (see Figure 1d). With the activation energy, we determine the relative conversion changes due to these temperature differences being 2.3–6.2%, as shown in Table 1. These values are much smaller than the relative conversion losses observed in the experiments (22.2–89.4%). Thus, the change in the catalyst temperature has a minor effect on the performance.

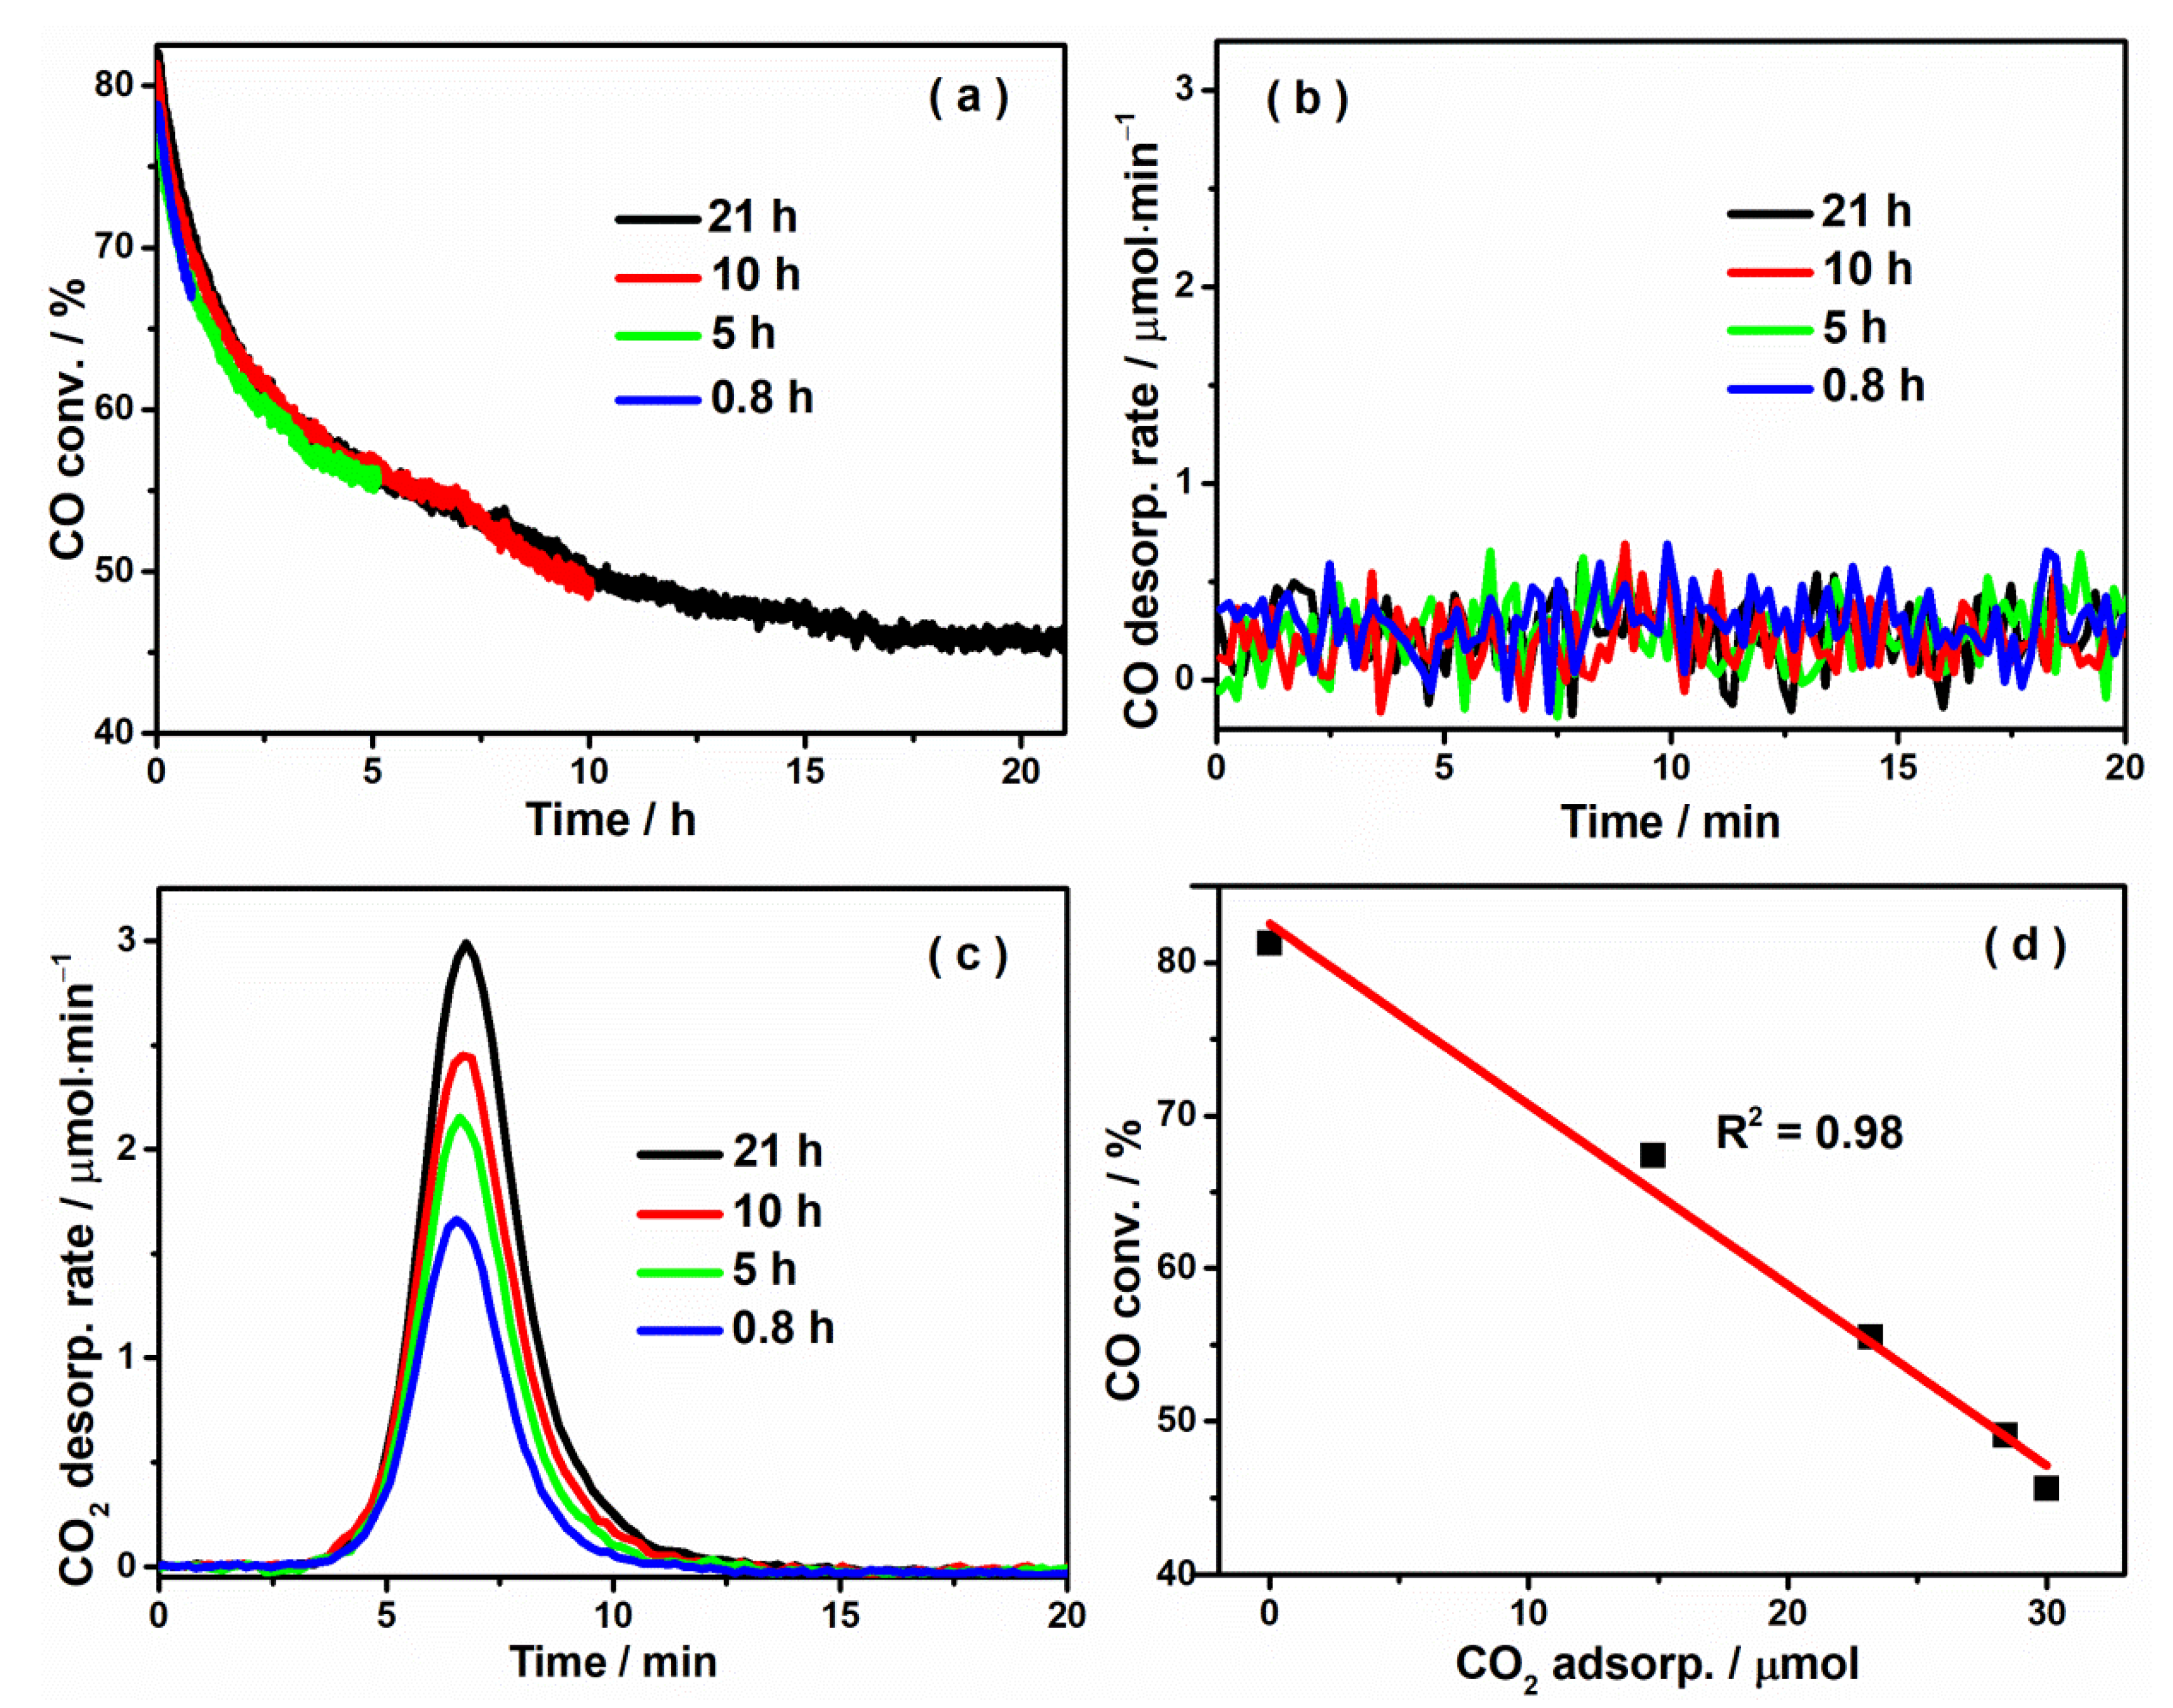
2.2. CO2 Adsorption Is a Major Cause for the Observed Catalyst Deactivation

As we have ruled out temperature and the catalyst structure as major sources of deactivation, we now turn our attention to other possible correlating factors such as the adsorption of the reactants and the desorption of the reaction product. In preparation of the catalyst for the experiments to measure Cu oxidation state, the procedure provided us an opportunity to look at the adsorbed species on the catalyst surface after each reaction. We found no CO, but substantial amount of CO2 desorbing from the catalyst as shown in Figure 2, suggesting CO2 other than CO poisoning may be the reason for the observed catalyst deactivation. Figure 2a shows the evolution of CO conversion in CO oxidation reaction at 150 °C for 21 h. The three shorter reactions for 0.8, 5 and 10 h under the same reaction conditions were performed so that we were able to measure the adsorption of CO, CO2 and O2 at different times during the reaction. These three shorter reactions overlap very well with the 21-h run with the initial CO conversion at 80 ± 2%. In the last few hours of the 21-h test, the reaction reached steady state with a 46% CO conversion. Subsequently, the adsorptions of CO2 gases were quantified (see Table 2). The relative measurement errors are estimated to be less than 1%. The correlation between the CO conversion and the CO2 adsorption is well illustrated in Figure 2d. The CO conversion appears to decrease linearly with the CO2 adsorption, which manifests our theory that CO2 adsorption is a major cause for the observed catalyst deactivation.

2.3. CO2 Adsorption Inhibits O2 Adsorption

To further corroborate the theory, additional experiments were performed to elucidate how CO2 adsorption affects the catalytic reaction network. The first experiment was to show direct evidence that pre-adsorbed CO2 adversely affects catalyst performance. The regenerated catalyst was exposed to 0.5% CO2 at the reaction temperature (150 °C) for 1 h and it was determined experimentally that 14.9 μmol CO2 was adsorbed. This CO2 pre-adsorption quantity is close to CO2 adsorption during a reaction at the same temperature for 0.8 h (14.8 μmol, see Table 2). As shown in Figure 3a, with the CO2 pre-adsorption catalyst the CO conversion starts off from 41%, much lower than the 80% conversion with the fresh catalyst. It then reaches its maximum conversion at 68% in about an hour and then gradual decrease is observed with time. Throughout the investigation, we confirmed multiple times that complete desorption of CO2 off used catalysts brought back their activity. These results support our earlier assumption that catalyst structure contributes little to the observed loss of performance. Specifically, the observed decreasing CO conversion may be mostly due to the accumulations of CO2 adsorbed species on Al2O3 surface, which can be completely desorbed at high temperatures reversibly. Interestingly, the catalyst with CO2 pre-adsorption seems to deactivate in a slower pace than without CO2 pre-adsorption. This is somehow puzzling and deserves further investigation. What is less surprising is that regardless of CO2 pre-adsorption, the steady-state CO conversion appears to be very similar.
To better understand CO2 self-poisoning in CO oxidation, the second experiment was to determine what reactant adsorption is adversely affected by CO2 adsorption. In this case, since CO does not adsorb, CO2 supposedly competes with O2 for active catalyst sites. We measured the O2 adsorption (0.25% O2 for 1 h) on the fresh CuO/Al2O3 catalyst with and without CO2 pre-adsorption (0.5% CO2 for 1 h) and the titration profiles are shown in Figure 3b. O2 adsorption is lower on the catalyst with pre-adsorbed CO2 adsorption. This result confirms that CO2 competes with O2 for adsorption sites leading to less adsorbed O2 on the CuO/Al2O3 catalyst.
Since the rate determining step limits the overall reaction rate, the apparent activation energy of the reaction should correspond to CO2 desorption. The apparent activation energy of the reaction has been estimated to be 66 kJ/mol (see Figure 1d), which is similar than the activation energy of carbonate decomposition on some CuO/CeO2 catalysts [33]. During the reaction, the number of active sites is decreasing; strictly speaking, the value of activation energy determined in Figure 1d is not conceptually accurate as no catalyst deactivation was implied. We attempted to take into account the effect of CO2 self-poisoning on the determination of activation energy (see Supplementary Materials) and the value would be slightly higher at 71 kJ/mol. The magnitude of the activation energy further supports the conclusion that CO2 desorption is the rate-determining step and CO2 self-poisoning, the catalyst deactivation mechanism.

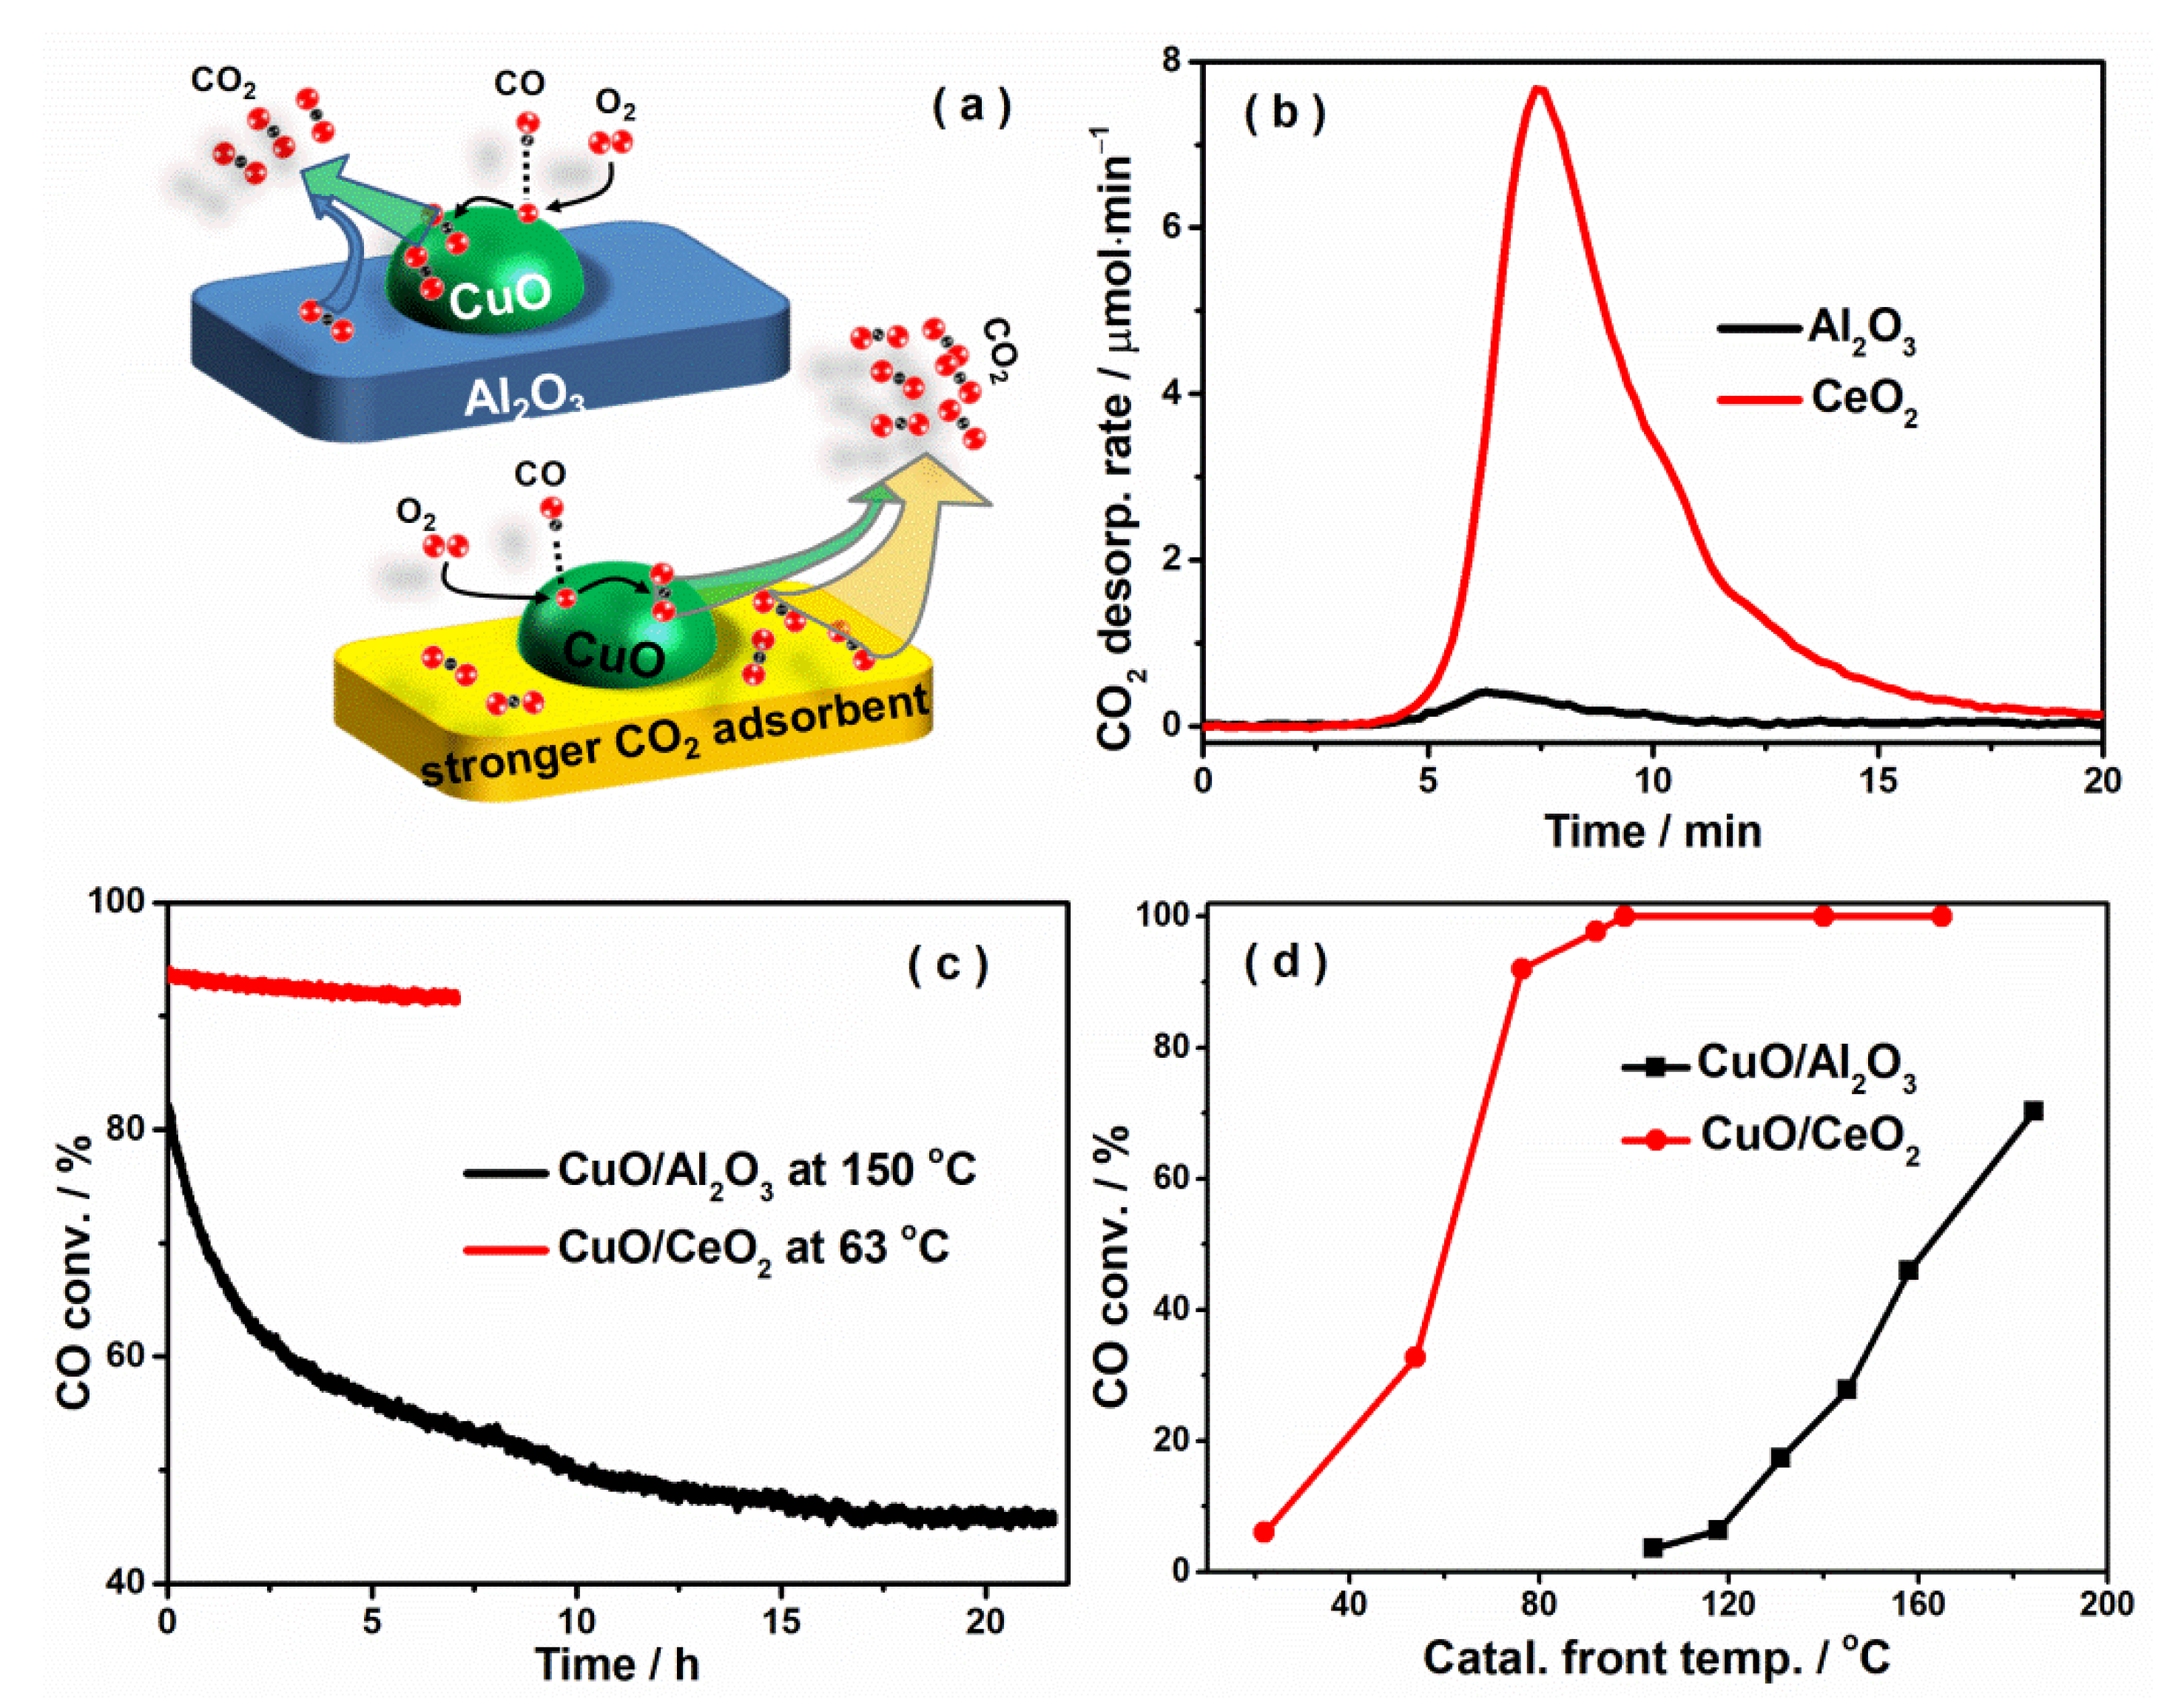
2.4. CO2 Self-Poisoning Is Mitigated by Introducing a Strong CO2 Adsorbent as the Support

Since CO2 self-poisoning has been positively identified as the main factor for the CuO/Al2O3 catalyst deactivation, it is now possible to improve CuO catalysts by rational design. Previous tests showed that CO2 adsorbed more on the CuO component than the Al2O3 support; this brings us an idea that a better CO2 adsorbing support would possibly help free CuO from CO2 poisoning by providing a dump-field for CO2 before it desorbs into the gas phase (see Figure 4a). To test the idea, we chose a new support to synthesize another supported CuO catalyst that has the same molar ratio between Cu and the support metal (Cu/Al = 8.17 atom.%) and the same CuO loading per support surface area (0.011 mmol Cu/m2) as in the CuO/Al2O3 catalyst. With a special CeO2 support, a 3.9wt% CuO/CeO2 catalyst meeting the criteria was synthesized. We tested its performance for CO oxidation using 0.61 g CuO/CeO2 catalyst so that the CuO quantity was the same as in the 0.20 g CuO/Al2O3 catalyst. The CO2 adsorption capacities of the Al2O3 and CeO2 supports are depicted in Figure 4b and the CeO2 has much higher CO2 adsorption capacity than the Al2O3 support (116.7 μmol vs. 8.4 μmol).
The activity test shows much better catalytic performance for the CuO/CeO2 catalyst than that of the CuO/Al2O3 catalyst. As shown in Figure 4c, the former has an initial CO conversion of 94% at a furnace temperature of 63 °C, while the latter has an initial CO conversion of 82% at a furnace temperature of 150 °C. Moreover, there is only a small decrease in CO conversion for the former (2%) in 7 h while within the same time the latter experiences a much more significant loss in CO conversion (28%). The results of steady-state CO conversion as a function of the catalyst front temperature over the two catalysts are compared in Figure 4d. Undoubtedly, replacing the Al2O3 support with CeO2, a stronger CO2 adsorbent, greatly improves the performance of the CuO catalysts. Importantly, the CuO/CeO2 catalyst has exceeded one current US DOE technical goal by having a T100 at 98 °C (catalyst temperature required to reach 100% CO conversion) much lower than 150 °C [34,35]. To clarify the effect of pure Al2O3 and CeO2 supports on the performance, we further tested their catalytic activities. Both pure supports showed no activity under 200 °C, which have also been found elsewhere [36,37,38]. Apparently, the activity comes from CuO. The better activity of the CuO/CeO2 catalyst is due to the higher affinity of CO2 to CeO2 but not necessarily its redox property [39]

3. Experimental Section

3.1. Catalyst Synthesis

A 10.0 wt.% Cu/γ-Al2O3 (or 12.2 wt.% CuO/γ-Al2O3, SBET = 141 m2/g) catalyst was prepared by the incipient wetness impregnation method. 2.03 g Cu(NO3)2·2.5H2O (Alfa Aesar Co. Inc., Shanghai, China, 98%) was dissolved in 4.6 mL distilled water and then mixed with 5 g γ-Al2O3 (Hongwu Nano Co. Ltd., Guangdong, China, 99.99%) powder. After achieving the complete impregnation by stirring, the sample was dried at 80 °C overnight and then calcined at 500 °C in air for 4 h. Finally, the catalyst was ground and then crushed into 40–60 mesh. A 3.2 wt.% Cu/CeO2 (or 3.9 wt.% CuO/CeO2, SBET = 46 m2/g) catalyst was prepared using the same method to keep the same molar fraction of Cu/Ce and Cu/Al for comparison.

3.2. Catalytic Performance Evaluation

The CO oxidation reaction was performed under a stoichiometric feed condition (λ = 1.0). The catalyst reaction system was described elsewhere [31,40,41]. The feed gas composition was 0.5 mol.% CO and 0.25 mol.% O2 and N2 as balance. The total flow rate was 0.5 L/min (or 22.33 mmol/min) and the gaseous hourly space velocity, 150,000 mL/gcat-h. All the activities were evaluated under steady state conditions. CO and CO2 were identified and their molar fractions quantified by an online FT-IR spectrometer (Nicolet iS50, Thermo Scientific, Madison, WI, USA). The FT-IR spectrometer was equipped with an MCT detector. A 2-m gas cell (PIKE Technologies, Inc., Madison, WI, USA) with a KBr window was placed in the beam path and maintained at 120 °C. A spectral resolution of 0.25 cm−1 was used and every 4 scans were averaged to generate one spectrum. These settings produced an absorbance spectrum every 0.187 min. To minimize system error, the CO conversion was calculated using the following equation (please see Supplementary Materials for detail):
X C O   ( % ) = F C O , i n F N 2 , i n 1 3 2 C C O , o u t C C O 2 , o u t × C C O , o u t F C O , i n × 100 %
where C C O , o u t and C C O 2 , o u t are the outlet concentrations of CO and CO2 measured by IR, respectively. F C O , i n and F N 2 , i n are the flow rates of CO and N2 in the influent.

3.3. Catalyst Activation Process

Typically, about 200 mg catalyst was used. To activate the fresh catalyst or re-generate the spent catalyst, a sequential reduction and oxidation process was carried out prior to CO oxidation reaction or other tests in this work. The gases evolved in the process were quantified by the IR spectrometer and the average relative measurement errors are within 1%. The first step was to heat up the catalyst to 400 °C in flowing N2 (500 mL/min, STP) to desorb gases adsorbed on the catalyst during catalyst preparation (in the case of a fresh catalyst) or after reaction or pre-adsorption and the thermal desorption procedure would go on until no further gas evolution was detected by IR. After the desorption, catalyst reduction was performed in 500 mL/min 1 mol.% H2/N2 gas at 400 °C for 1 h. Finally, 500 mL/min 4 mol.% O2/N2 gas was introduced to oxidize the catalyst for 2 h. To confirm the repeatability of the procedure, the reduction and oxidation were repeated 5 times on a fresh catalyst.

3.4. In-Situ Quantification of Adsorption

To investigate CO oxidation mechanism, the effects of CO, CO2 and O2 adsorption on the catalyst performance were investigated. The adsorption usually took place after the catalyst surface was properly prepared such as described above. Quantification of CO adsorption was performed by first exposing the catalyst to 0.5 mol.% CO/N2 gas at a flow rate of 500 mL/min for 1 h at desired adsorption temperature such as 150 °C. Afterwards, the flow was switched to 500 mL/min N2 to remove physically adsorbed CO molecules. TPD spectrum was then collected at a heating rate of 20 K/min and this process would go on until no CO was detected by IR. CO desorption rate was determined from its IR measured molar fraction and the flow rate of the N2 gas (see Supplementary Materials). Integration of the CO desorption rate gave the overall CO desorption amount, which was equal to the CO adsorption amount. Quantification of CO2 adsorption was performed using the same procedure except that 500 mL/min 0.5 mol.% CO2/N2 was used for a fresh catalyst or in case of a spent catalyst no pre-adsorption of CO2 would be performed.
Quantification of O2 adsorption was quite different since O2 molecules are IR inactive and cannot be detected by IR directly. Thus, the amount of adsorbed O2 was measured indirectly by H2-O2 titration, i.e., by IR measurement of H2O produced in the titration. Since the catalyst itself was also reducible by H2, the O2 adsorption was quantified by the difference in H2O production with and without O2 adsorption. After catalyst surface was properly prepared as described before, O2 adsorption was performed in 500 mL/min 0.25 mol.% O2/N2 flow on the fresh catalyst at 150 °C for 1 h. Afterwards, the gas was switched to pure N2 while maintaining the same molar flow rate to remove physically adsorbed O2 molecules. H2 was introduced into the reactor at 150 °C for 0.5 h and then the furnace temperature was raised up to 400 °C with a ramp rate of 20 K/min to titrate the adsorbed O2. The same H2 titration procedure was carried out on the fresh catalyst without O2 adsorption to establish baseline H2 consumption by the catalyst.
To further probe the influence of CO2 adsorption, CO oxidation was also carried out on the fresh catalyst with pre-adsorbed CO2. The fresh catalyst was exposed to 500 mL/min 0.5 mol.% CO2/N2 mixture at 150 °C for 1 h. CO2 desorption was quantified before and after the reaction using the same procedure described above.

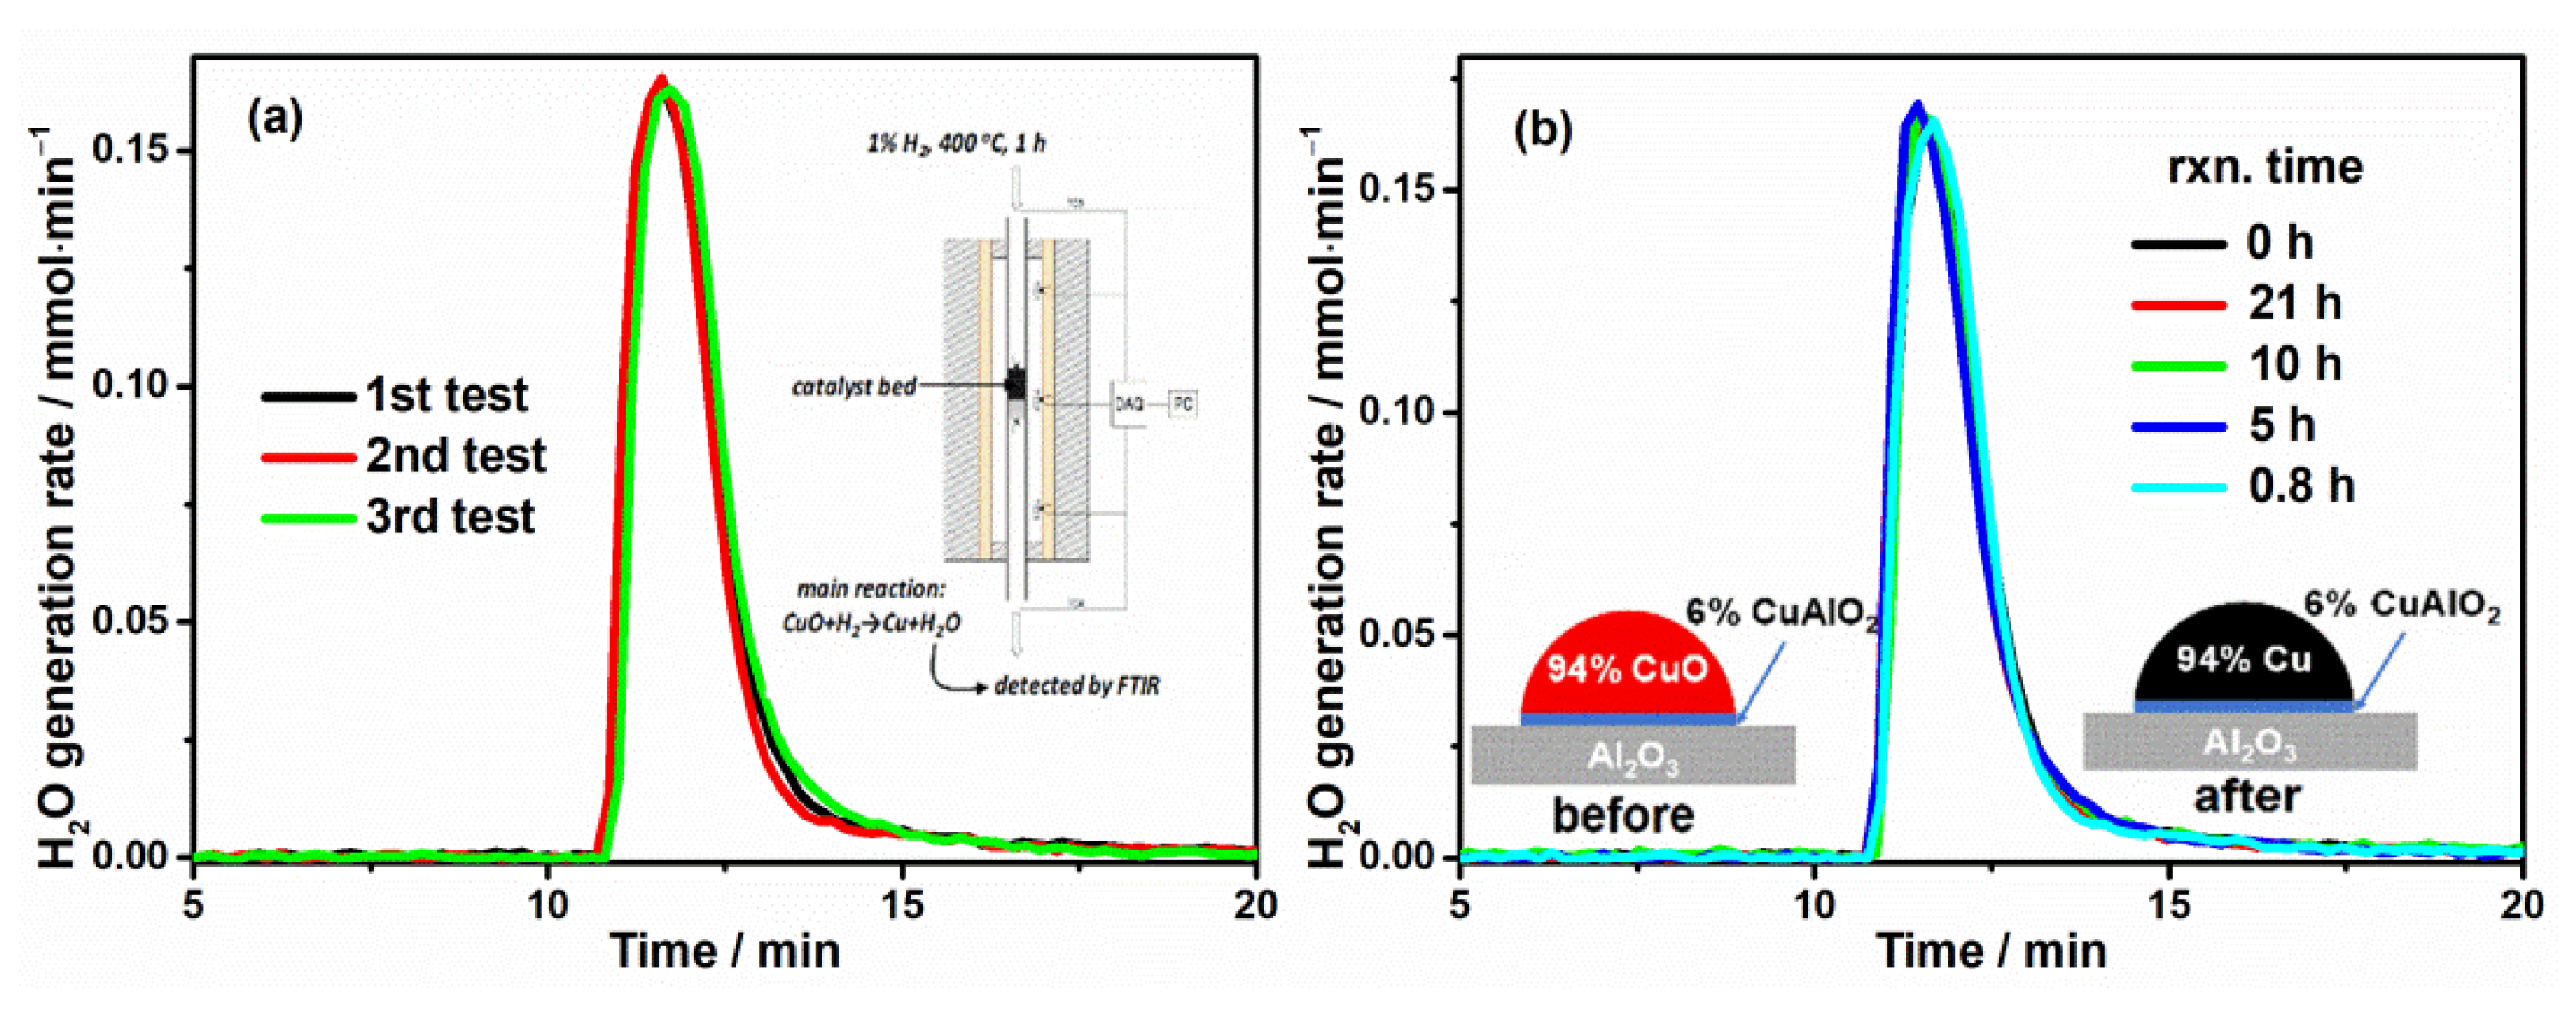
3.5. In-Situ Measurement of Average Cu Chemical State

The average Cu chemical state was measured by a difference method, which requires that the (used) catalyst be reduced to the same extent under certain reduction conditions (i.e., 1% H2, 400 °C, 1 h). As a reference, the fresh or regenerated catalyst with dominantly Cu2+ was reduced three separate times for reliability test. The results are shown in Figure 5. The reduction kinetics is fast and the major feature appears within the first 10 min as evidenced by the H2O production rate. Integration of the kinetic curves gives the quantities of the total produced H2O and according to the reduction chemistry stoichiometry this is the amount of oxygen being reduced from the initial Cu catalyst. In all three cases, the reduction quantity is 0.288 ± 0.001 mmol, which is very close to the theoretical Cu loading in the fresh catalyst (~0.307 mmol). Evidently, about 94% CuO is reduced. Considering the activation, regeneration and reduction conditions, most probably in the fresh Cu catalyst 94% Cu is in CuO form and 6% Cu in the CuAlO2 form existing as interface between the reducible CuO phase and the Al2O3 support [42]. The Cu catalyst could be completely reduced to Cu by H2 reduction at 400 °C. To determine the average Cu oxidation state, the catalyst with certain reaction history was reduced in situ by H2 at 400 oC and the reduction product, H2O, quantified by IR. From the amount of H2O production, the average Cu chemical state was determined. The H2 reduction procedure was performed as described above. The reduction would continue until no reduction product was detected by IR. H2O production rate was derived from its IR measured molar fraction and the flow rate of the N2 gas. Integration of the H2O production rate resulted in the overall H2O production amount, which determined the difference in chemical state between the measured and Cu2+.

4. Conclusions

We have successfully executed experiments to show conclusively the rate determining step in CO oxidation over the CuO/Al2O3 catalyst. With the initial show of correlation between CO2 adsorption and the catalyst performance, we experimentally proved the inferences from the CO2 self-poisoning hypothesis, including (1) CO2 adsorption inhibits O2 adsorption, (2) complete desorption of CO2 regenerate the catalyst, (3) pre-adsorbed CO2 quenches catalyst activity which recovers during the reaction and (4) the apparent activation energy is consistent with CO2 desorption. It is further evidenced by using a stronger CO2 adsorbing support CeO2 to promote CO2 desorption from the CuO sites resulting in a superior CuO/CeO2 catalyst. This work sets an example for experimentally deciding the rate-determining step in a catalytic reaction. It is also a vivid example of fundamental catalysis research leading to discovery of better catalysts.

Supplementary Materials

The following are available online at https://www.mdpi.com/article/10.3390/catal11060654/s1, Figure S1: (a) CO and CO2 physical adsorption on CO2 pre-adsorption spent catalyst; (b) CO2 desorption comparison between spent after 0.8 h reaction and fresh after adsorption of CO2 for 1 h at 150 oC; Figure S2: Arrhenius plots using uncorrected and normalized CO conversions; Table S1: Relative conversion change estimated by non-noralized Ea and normalized Ea comparison.

Author Contributions

Conceptualization, K.C. and Y.C.; methodology, K.C.; software, J.R.; validation, K.C., S.Z. and H.L.; formal analysis, K.C.; investigation, K.C., S.Z. and H.L.; resources, S.Z.; data curation, H.L.; writing—original draft preparation, H.L. and Y.C. All authors have read and agreed to the published version of the manuscript.

Funding

This work was supported by the Research Grants Council, University Grants Committee (HK) with an NSFC/RGC Joint Research Scheme Project No. N_CUHK 451/17 and a GRF project No. 14307718.

Conflicts of Interest

The authors declare no conflict of interest.

References

  1. Freund, H.J.; Meijer, G.; Scheffler, M.; Schlögl, R.; Wolf, M. CO oxidation as a prototypical reaction for heterogeneous processes. Angew. Chem. Int. Ed. 2011, 50, 10064–10094. [Google Scholar] [CrossRef] [PubMed]
  2. Van Spronsen, M.A.; Frenken, J.W.; Groot, I.M. Surface science under reaction conditions: CO oxidation on Pt and Pd model catalysts. Chem. Soc. Rev. 2017, 46, 4347–4374. [Google Scholar] [CrossRef] [PubMed] [Green Version]
  3. Nie, L.; Mei, D.; Xiong, H.; Peng, B.; Ren, Z.; Hernandez, X.I.P.; DeLaRiva, A.; Wang, M.; Engelhard, M.H.; Kovarik, L.; et al. Activation of surface lattice oxygen in single-atom Pt/CeO2 for low-temperature CO oxidation. Science 2017, 358, 1419–1423. [Google Scholar] [CrossRef] [PubMed] [Green Version]
  4. Li, L.; Wang, Y.-Z.; Wang, X.-X.; Song, K.-K.; Jian, X.-D.; Qian, P.; Bai, Y.; Su, Y.-J. Size and Stoichiometry Effect of FePt Bimetal Nanoparticle Catalyst for CO Oxidation: A DFT Study. J. Phys. Chem. C 2020, 124, 8706–8715. [Google Scholar] [CrossRef]
  5. Ning, C.; Zhang, Y.; Meng, Z.; Xiao, C.; Lu, R. Computational Screening of Single Non-Noble Transition-Metal Atoms Confined Inside Boron Nitride Nanotubes for CO Oxidation. J. Phys. Chem. C 2020, 124, 2030–2038. [Google Scholar] [CrossRef]
  6. Yang, F.; Graciani, J.; Evans, J.; Liu, P.; Hrbek, J.; Sanz, J.F.; Rodriguez, J.A. CO oxidation on inverse CeOx/Cu(111) catalysts: High catalytic activity and ceria-promoted dissociation of O2. J. Am. Chem. Soc. 2011, 133, 3444–3451. [Google Scholar] [CrossRef]
  7. Abdel-Mageed, A.M.; Rungtaweevoranit, B.; Parlinska-Wojtan, M.; Pei, X.; Yaghi, O.M.; Behm, R.J. Highly Active and Stable Single-Atom Cu Catalysts Supported by a Metal-Organic Framework. J. Am. Chem. Soc. 2019, 141, 5201–5210. [Google Scholar] [CrossRef]
  8. Xie, X.; Li, Y.; Liu, Z.Q.; Haruta, M.; Shen, W. Low-temperature oxidation of CO catalysed by Co3O4 nanorods. Nature 2009, 458, 746–749. [Google Scholar] [CrossRef]
  9. Hu, X.; Chen, J.; Li, S.; Chen, Y.; Qu, W.; Ma, Z.; Tang, X. The Promotional Effect of Copper in Catalytic Oxidation by Cu-Doped α-MnO2 Nanorods. J. Phys. Chem. C 2020, 124, 701–708. [Google Scholar] [CrossRef]
  10. Maynes, A.J.; Driscoll, D.M.; DeSario, P.A.; Pietron, J.J.; Pennington, A.M.; Rolison, D.R.; Morris, J.R. Electronic Metal-Support Interactions in the Activation of CO Oxidation over a Cu/TiO2 Aerogel Catalyst. J. Phys. Chem. C 2020, 124, 21491–21501. [Google Scholar] [CrossRef]
  11. Royer, S.; Duprez, D. Catalytic Oxidation of Carbon Monoxide over Transition Metal Oxides. ChemCatChem 2011, 3, 24–65. [Google Scholar] [CrossRef]
  12. Heck, R.M.; Farrauto, R.J.; Gulati, S.T. Catalytic Air Pollution Control: Commercial Technology, 3rd ed.; John Wiley & Sons: Hoboken, NJ, USA, 2009. [Google Scholar]
  13. Gawande, M.B.; Goswami, A.; Felpin, F.-X.; Asefa, T.; Huang, X.; Silva, R.; Zou, X.; Zboril, R.; Varma, R.S. Cu and Cu-based nanoparticles: Synthesis and applications in catalysis. Chem. Rev. 2016, 116, 3722–3811. [Google Scholar] [CrossRef] [PubMed] [Green Version]
  14. Zou, X.P.; Wang, L.N.; Li, X.N.; Liu, Q.Y.; Zhao, Y.X.; Ma, T.M.; He, S.G. Noble-Metal-Free Single-Atom Catalysts CuAl4O7–9 for CO Oxidation by O2. Angew. Chem. Int. Ed. 2018, 130, 11155–11159. [Google Scholar] [CrossRef]
  15. Sun, B.-Z.; Chen, W.-K.; Xu, Y.-J. Reaction mechanism of CO oxidation on Cu2O (111): A density functional study. J. Chem. Phys. 2010, 133, 154502. [Google Scholar] [CrossRef] [PubMed]
  16. El Kasmi, A.; Tian, Z.-Y.; Vieker, H.; Beyer, A.; Chafik, T. Innovative CVD synthesis of Cu2O catalysts for CO oxidation. Appl. Catal. B 2016, 186, 10–18. [Google Scholar] [CrossRef]
  17. Pierron, E.; Rashkin, J.; Roth, J. Copper oxide on alumina: I. XRD studies of catalyst composition during air oxidation of carbon monoxide. J. Catal. 1967, 9, 38–44. [Google Scholar] [CrossRef]
  18. Eren, B.; Heine, C.; Bluhm, H.; Somorjai, G.A.; Salmeron, M. Catalyst Chemical State during CO Oxidation Reaction on Cu(111) Studied with Ambient-Pressure X-ray Photoelectron Spectroscopy and Near Edge X-ray Adsorption Fine Structure Spectroscopy. J. Am. Chem. Soc. 2015, 137, 11186–11190. [Google Scholar] [CrossRef] [PubMed]
  19. Tsakoumis, N.E.; York, A.P.; Chen, D.; Rønning, M. Catalyst characterisation techniques and reaction cells operating at realistic conditions; towards acquisition of kinetically relevant information. Catal. Sci. Technol. 2015, 5, 4859–4883. [Google Scholar] [CrossRef]
  20. Svintsitskiy, D.A.; Kardash, T.Y.; Stonkus, O.A.; Slavinskaya, E.M.; Stadnichenko, A.I.; Koscheev, S.V.; Chupakhin, A.P.; Boronin, A.I. In situ XRD, XPS, TEM, and TPR study of highly active in CO oxidation CuO nanopowders. J. Phys. Chem. C 2013, 117, 14588–14599. [Google Scholar] [CrossRef]
  21. Chorkendorff, I.; Niemantsverdriet, J.W. Concepts of Modern Catalysis and Kinetics; John Wiley & Sons: Hoboken, NJ, USA, 2017. [Google Scholar]
  22. Constales, D.; Yablonsky, G.S.; D’hooge, D.R.; Thybaut, J.W.; Marin, G.B. Advanced Data Analysis and Modelling in Chemical Engineering; Elsevier: Amsterdam, The Netherlands, 2016. [Google Scholar]
  23. Raróg, W.; Kowalczyk, Z.; Sentek, J.; Składanowski, D.; Szmigiel, D.; Zieliñski, J. Decomposition of ammonia over potassium promoted ruthenium catalyst supported on carbon. Appl. Catal. A Gen. 2011, 208, 213–216. [Google Scholar] [CrossRef]
  24. Gulicovski, J.; Rašković-Lovre, Ž.; Kurko, S.; Vujasin, R.; Jovanović, Z.; Matović, L.; Grbović Novaković, J. Influence of vacant CeO2 nanostructured ceramics on MgH2 hydrogen desorption properties. Ceram. Int. 2012, 38, 1181–1186. [Google Scholar] [CrossRef]
  25. Guo, Y.; Li, C.; Lu, S.; Zhao, C. Low temperature CO catalytic oxidation and kinetic performances of KOH–Hopcalite in the presence of CO2. RSC Adv. 2016, 6, 7181–7188. [Google Scholar] [CrossRef]
  26. Zhang, X.-m.; Tian, P.; Tu, W.; Zhang, Z.; Xu, J.; Han, Y.-F. Tuning the dynamic interfacial structure of copper–ceria catalysts by indium oxide during CO oxidation. ACS Catal. 2018, 8, 5261–5275. [Google Scholar] [CrossRef]
  27. Wang, Y.; Widmann, D.; Lehnert, F.; Gu, D.; Schuth, F.; Behm, R.J. Avoiding Self-Poisoning: A Key Feature for the High Activity of Au/Mg(OH)2 Catalysts in Continuous Low-Temperature CO Oxidation. Angew. Chem. Int. Ed. 2017, 56, 9597–9602. [Google Scholar] [CrossRef] [PubMed]
  28. Del Río, E.; Collins, S.E.; Aguirre, A.; Chen, X.; Delgado, J.J.; Calvino, J.J.; Bernal, S. Reversible deactivation of a Au/Ce0.62Zr0.38O2 catalyst in CO oxidation: A systematic study of CO2-triggered carbonate inhibition. J. Catal. 2014, 316, 210–218. [Google Scholar] [CrossRef]
  29. Denkwitz, Y.; Schumacher, B.; Kučerová, G.; Behm, R.J. Activity, stability, and deactivation behavior of supported Au/TiO2 catalysts in the CO oxidation and preferential CO oxidation reaction at elevated temperatures. J. Catal. 2009, 267, 78–88. [Google Scholar] [CrossRef]
  30. Hao, Y.; Mihaylov, M.; Ivanova, E.; Hadjiivanov, K.; Knozinger, H.; Gates, B. CO oxidation catalyzed by gold supported on MgO: Spectroscopic identification of carbonate-like species bonded to gold during catalyst deactivation. J. Catal. 2009, 261, 137–149. [Google Scholar] [CrossRef]
  31. Ren, J.; Cheng, K.; Li, M.; Zhao, S.; Li, H.; Chen, Y. Bridging the gaps between experimental and mechanistic catalysis research: A case study with CO oxidation over a Pd/Al2O3 catalyst. ChemCatChem 2019, 11, 4427–4433. [Google Scholar] [CrossRef]
  32. Schmidt-Whitley, R.; Martinez-Clemente, M.; Revcolevschi, A. Growth and microstructural control of single crystal cuprous oxide Cu2O. J. Cryst. Growth 1974, 23, 113–120. [Google Scholar] [CrossRef]
  33. Il’Ichev, A.; Matyshak, V.; Korchak, V. Oxidation of CO with catalyst oxygen and with oxygen from the gas phase over CuO/CeO2 according to TPD and IR spectroscopic data. Kinet. Catal. 2015, 56, 115–124. [Google Scholar] [CrossRef]
  34. Zammit, M.; DiMaggio, C.L.; Kim, C.H.; Lambert, C.; Muntean, G.G.; Peden, C.H.; Parks, J.E.; Howden, K. Future Automotive Aftertreatment Solutions: The 150 °C Challenge Workshop Report; U.S. Drive Report; U.S. Drive: Southfield, MI, USA, 2013.
  35. Beale, A.M.; Gao, F.; Lezcano-Gonzalez, I.; Peden, C.H.; Szanyi, J. Recent advances in automotive catalysis for NOx emission control by small-pore microporous materials. Chem. Soc. Rev. 2015, 44, 7371–7405. [Google Scholar] [CrossRef]
  36. Wang, F.; Wang, X.; Liu, D.; Zhen, J.; Li, J.; Wang, Y.; Zhang, H. High-Performance ZnCo2O4@CeO2 Core@shell Microspheres for Catalytic CO Oxidation. ACS Appl. Mater. Interfaces 2014, 6, 22216–22223. [Google Scholar] [CrossRef] [PubMed]
  37. Sun, G.; Mu, X.; Zhang, Y.; Cui, Y.; Xia, G.; Chen, Z. Rare earth metal modified CuO/γ-Al2O3 catalysts in the CO oxidation. Catal. Commun. 2011, 12, 349–352. [Google Scholar] [CrossRef]
  38. Tang, C.; Li, J.; Yao, X.; Sun, J.; Cao, Y.; Zhang, L.; Gao, F.; Deng, Y.; Dong, L. Mesoporous NiO-CeO2 catalysts for CO oxidation: Nickel content effect and mechanism aspect. Appl. Catal. A 2015, 494, 77–86. [Google Scholar] [CrossRef]
  39. Ren, J.; Chen, Y. Pitfalls in identifying active catalyst species. Nat. Commun. 2020, 11, 4564. [Google Scholar] [CrossRef] [PubMed]
  40. Ren, J.; Lee, A.C.; Cheng, K.; Li, M.; Chen, Y. Measuring the Unmeasurable by IR Spectroscopy: Carbon Deposition Kinetics in Dry Reforming of Methane. ChemPhysChem 2018, 19, 1814–1819. [Google Scholar] [CrossRef]
  41. Ren, J.; Li, M.; Lee, A.C.; Cheng, K.; Chen, Y. IR spectroscopic measurement of hydrogen production kinetics in methane dry reforming. Int. J. Hydrog. Energy 2019, 44, 9866–9872. [Google Scholar] [CrossRef]
  42. Fernández-Garcıa, M.; Rodrıguez-Ramos, I.; Ferreira-Aparicio, P.; Guerrero-Ruiz, A. Tracking down the reduction behavior of copper-on-alumina catalysts. J. Catal. 1998, 178, 253–263. [Google Scholar] [CrossRef]
Figure 1. Evolutions of (a) CO conversion and (b) the temperature difference between the catalyst and the furnace at different set furnace temperatures; (c) H2O generation rate as a function of time on the reduction of the fresh catalyst and spent catalysts after reactions at different furnace temperatures; and (d) Arrhenius plot for CO oxidation over the CuO/Al2O3 catalyst.
Catalysts 11 00654 g001
Figure 2. (a) CO conversions for four CO oxidation reactions at 150 °C with different reaction times; (b) CO and (c) CO2 adsorptions on the spent catalysts after these reaction times; and (d) CO conversion varies with the CO2 adsorption.
Catalysts 11 00654 g002
Figure 3. (a) CO conversion as a function of time on the CuO/Al2O3 catalyst with and without CO2 pre-adsorption, the inset shows enlarged region of the first 2 h reaction; and (b) H2-O2 titration profiles of the fresh catalyst for O2 adsorption with and without CO2 pre-adsorption.
Catalysts 11 00654 g003
Figure 4. (a) Design principle of a CuO catalyst with higher resistance to CO2 self-poisoning; (b) CO2 adsorption measurements for the fresh Al2O3 and CeO2 supports after CO2 adsorption at 150 °C for 1 h; (c) CO conversion as a function of time over the CuO/Al2O3 and CuO/CeO2 catalysts at the furnace temperatures of 150 °C and 63 °C, respectively; and (d) steady-state CO conversion as a function of the catalyst front temperature for the two catalysts.
Catalysts 11 00654 g004
Figure 5. H2O generation rate as a function of time in the reduction of (a) the fresh catalyst in three separate tests with the inset showing a schematic of the experimental setup and (b) the catalyst after different reaction times with the inset showing illustrations of the catalyst structures before and after the reduction.
Catalysts 11 00654 g005
Table 1. Relative conversion changes due to temperature and experimentally determined relative conversion loss at different furnace temperatures.
Furnace Temp./°CInitial CO Conv.Steady-State CO Conv.Relative Conv. Loss *Initial Cat. Temp. (Ti)/°CSteady-State Cat. Temp. (Ts)/°CRelative Conv. Change Due to Temp. **CO2 Adsorp./μmol
10030.2%3.6%89.4%105.1104.15.6%10.5
11332.4%6.3%80.2%118.9117.85.6%15.38
12548.5%17.3%63.9%131.6131.12.3%25.1
13839.3%27.8%30.5%146.4145.15.8%39.8
15082.1%45.9%43.8%159.5158.06.2%30.0
17590.1%70.2%22.2%186.1184.55.9%66.7
* Relative conversion loss is defined as ( I n i t i a l   C O   c o n v . S t e a d y   s t a t e   C O   c o n v . ) I n i t i a l   C O   c o n v . × 100 % ; ** Relative conversion change due to temperature is calculated from Arrhenius equation: e x p { E a / [ R × ( T i + 273.15 ) ] } e x p { E a / [ R × ( T s + 273.15 ) ] } e x p { E a / [ R × ( T i + 273.15 ) ] } × 100 % .
Table 2. CO2 physical and chemical adsorption on spent and CO2 pre-adsorption catalysts.
SampleInitial Conv.Final Conv.CO2 Phys. Adsorp./μmolCO2 Chem. Adsorp./μmolTotal Adsorp./μmol
0.8 h78.8%67.4%10.44.414.8
5 h77.5%55.5%17.55.723.2
10 h81.3%49.1%21.86.628.4
21 h82.1%45.6%22.08.030.0
CO2 pre-adsorp.67.9%46.7%10.94.014.9
Publisher’s Note: MDPI stays neutral with regard to jurisdictional claims in published maps and institutional affiliations.

