Article

Synthesis and Characterization of Nickel(II) Homogeneous and Supported Complexes for the Hydrogenation of Furfural to Furfuryl Alcohol

by
Menala Kalumpha
,
Leah Charlie Matsinha
* and
Banothile C. E. Makhubela
*
Research Center for Synthesis and Catalysis, Department of Chemical Sciences, University of Johannesburg, P.O. Box 524, Auckland Park, Johannesburg 2006, South Africa
*
Authors to whom correspondence should be addressed.
Catalysts 2021, 11(6), 684; https://doi.org/10.3390/catal11060684
Submission received: 30 April 2021 / Revised: 14 May 2021 / Accepted: 14 May 2021 / Published: 28 May 2021
(This article belongs to the Special Issue Application of Catalysis and Biocatalysis in Biorefineries)

Abstract

:
Nickel(II) complexes have been synthesized and characterized using nuclear magnetic resonance (NMR), infrared spectroscopy, high resolution mass spectroscopy, and elemental analysis. The complexes were evaluated as pre-catalysts in the direct hydrogenation of furfural to furfuryl alcohol. The pre-catalysts C1 and C4 gave higher furfural conversion (97% and 96%, respectively), as a result, they were also evaluated in the transfer hydrogenation of furfural using formic acid as the hydrogen source where higher furfural conversion (93%) was obtained and selectivity (100%) toward the formation of furfuryl alcohol at 4 h. The catalyst C1 was recycled three times with and it was observed that the catalytic activity might be due to a mixture of both molecular catalysis and nanoparticles, as evidenced by the decrease in activity in mercury poisoning experiments. The hydrogenation reactions were also extended to alpha-β unsaturated substrates and were selective toward saturation of the carbonyl functionality over alkene groups.

Graphical Abstract

1. Introduction

The rapid increase in population growth has resulted in increased use of fossil resources for both chemicals and energy production. This has resulted in negative environmental impacts due to fossil fuel combustion and this, coupled with their steady depletion, has resulted in increased research efforts to find alternative renewable sources [1,2]. Therefore, using sustainable energy, transportation fuels, and chemicals is one way of mitigating this. As such, researchers have shifted attention to finding ways of valorizing plant biomass, thereby producing fuels and chemicals from renewable resources [3]. An example, furfural (FF), which is derived from plant biomass, is a good candidate platform molecule for fuels and chemical production [4].
FF is a furanic compound, derived from C5 sugars found in lignocellulosic biomass, which was discovered in 1831 by J. Dobereiner after he used sulfuric acid to treat carbohydrates [5]. Today, it is produced in bulk by companies such as Illovo, South Africa from the acid-catalyzed hydrolysis of biomass-derived hemicellulose followed by dehydration of the resultant xylose. A number of valuable products can be derived from furfural, hence it is considered as one of the top bio-based platform chemicals [6]. FF can be upgraded using different chemical processes such as hydrogenation to produce the primary product, furfuryl alcohol (FA) and other downstream products such as methyl furan (MF), tetrahydrofuran (THF), and tetrahydrofurfuryl alcohol (THFA) [7].
FA is a colorless or yellow liquid with mild odor that can be produced by the hydrogenation reaction of FF in the presence of a metal catalyst. The most commonly used catalyst in industry is copper chromite [8]. However, chromium based catalysts are known to be toxic to the environment, therefore highlighting the need for eco-friendly and efficient catalysts to promote this process.
Various metal catalysts have been used for the selective hydrogenation of FF to FA including catalysts containing precious metal active sites such as Pd [9,10,11] and Pt [7,12], however, the high cost of these poses challenges when it comes to industrial application. Non-noble metal catalysts are a promising alternative if they exhibit the same or better activity and selectivity as their precious metal counterparts [13]. Kathryn and co-workers reported the application of a Ni/SiO2 catalyst for the selective hydrogenation of FF to FA with a selectivity of 50% at a high reaction temperature of 180 °C [14]. In another example, a Ni/Al2O3 catalyst displayed poor FA selectivity, giving methylfuran (MF), tetrahydrofurfuryl alcohol (THFA), tetrahydrofuran (THF), and furan (FU) [15]. In another report, Li and co-workers reported the hydrogenation of FF to FA over Ni3Fe/SiO2, which resulted in 100% conversion of FF with 97% selectivity to FA [16].
Organometallic catalysts have seldom been explored for this reaction and to the best of our knowledge, no reports on the application of nickel complexes for the hydrogenation of furfural have been reported. Herein, we report on the synthesis and characterization of (phosphino)nickel(II) complexes and heterogenized (surface nickel complexes) as catalyst precursors for the hydrogenation of FF to FA selectively. The nickel complexes were all good catalyst precursors that showed activity toward the hydrogenation of FF to FA exclusively using both molecular hydrogen and a hydrogen carrier (formic acid).

2. Results

2.1. Synthesis and Characterization of Ligands (L1 and L2)

Ligand L1 was prepared by a modified procedure from the literature [17]. The ligand was prepared by stirring at room temperature 2-(diphenylphosphino)ethylamine with an equimolar amount of (3-Iodopropyl) trimethoxysilane in the presence of sodium hydride as a base (Scheme 1). Ligand L1 was obtained in good yield (75%) as a colorless oil. The ligand was soluble in methanol, tetrahydrofuran, dichloromethane, chloroform, partially soluble in diethyl ether, and insoluble in hexane and water.
Due to air and moisture sensitivity, the ligand could only be characterized by 31P{1H} NMR. The 31P {1H} NMR spectrum of Ligand L1 showed an intense peak at −21.95 ppm and a second peak at 30.44 ppm, corresponding to phosphorus oxide (Figure S1).
Ligand L2 was synthesized following a previously described procedure in the literature [18]. The Schiff base ligand was prepared by refluxing 2-aminophenol with an equimolar amount of salicylaldehyde (Scheme 2). Ligand L2 was obtained in good yield (87%) as an orange solid. The ligand was soluble in methanol, ethanol, dimethyl sulfoxide, partially soluble in chloroform, acetonitrile, diethyl ether, and insoluble in hexane and water.
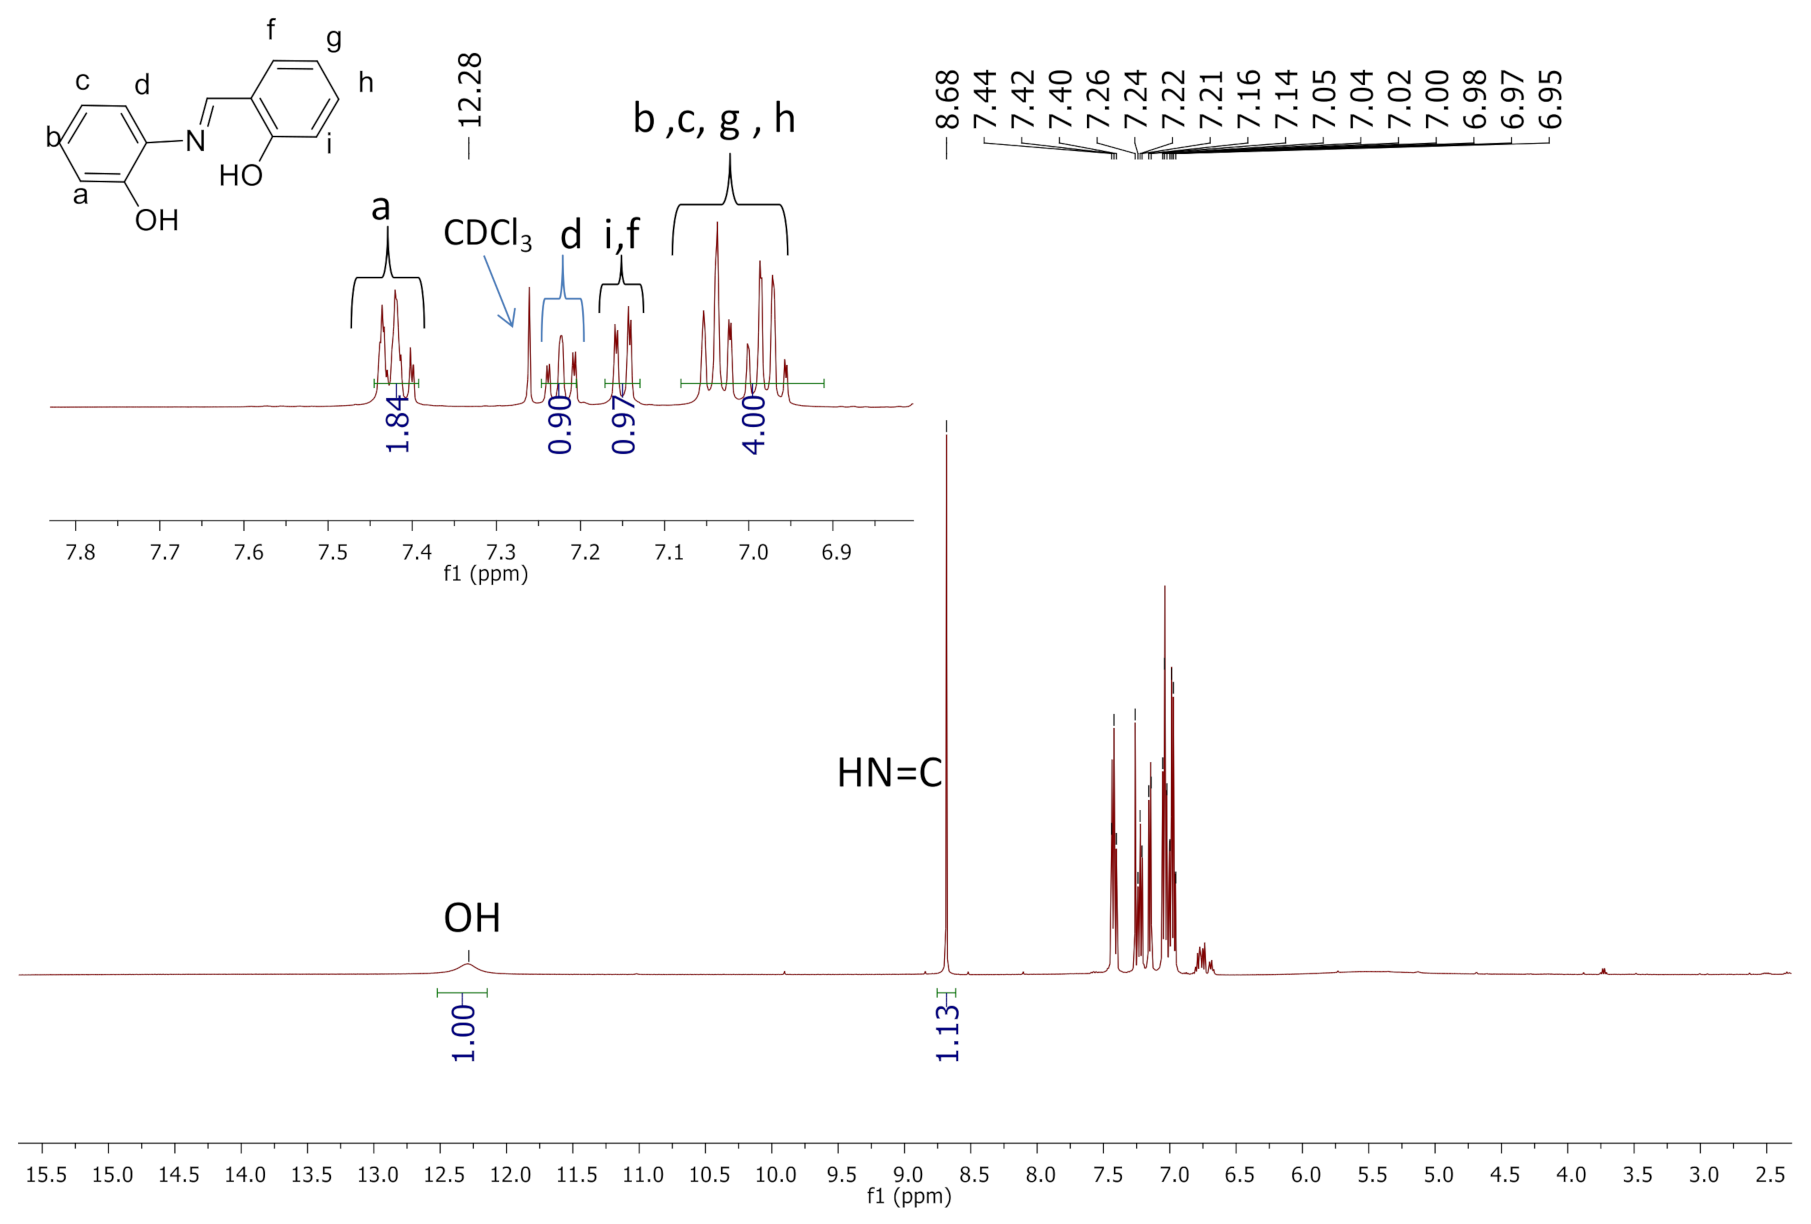
The 1H NMR spectrum (Figure 1) showed evidence of the condensation reaction clearly seen by the appearance of the imine singlet at 8.68 ppm. The hydroxyl proton of the ligand appeared downfield as a broad singlet at 12.28 ppm. All the aromatic protons appeared in the region between 6.95–7.44 ppm. The 13C{1H} NMR spectrum for ligand L2 confirmed that the number of carbon atoms present corresponded to the expected signals.
The infrared spectrum of ligand L2 showed a stretching vibration characteristic of the imine functionality at 1625 cm−1 (Figure S2). The mass spectrum of ligand L2 showed a peak at m/z = 214.0863 [M + H]]+.

2.2. Synthesis and Characterization of Complexes C1, C2, and Si-1

The complex C1 was synthesized by dissolving the Ni(II) metal precursor [NiCl2(PPh3)2] and Bis(cyclopentadienyl) nickel (II) in tetrahydrofuran [17]. The reaction mixture was refluxed at 60 °C for 6 h (Scheme 3). The complex C1 was recovered as red purple crystals with good yield (82%). Complex C1 is soluble in chloroform, ethanol, dimethyl sulfoxide, acetonitrile, and insoluble in hexane, diethyl ether, and water. The complex C2 was synthesized using a one pot procedure. The diphenyl Ni(II) metal precursor dissolved in THF was added to the solution of Bis(cyclopentadienyl)nickel(II) in THF and the reaction mixture was stirred under reflux at 65 °C for 24 h. The complex C2 was recovered as a brown oil with good yield (69%). Complex C2 is soluble in dimethyl sulfoxide, THF, partially soluble in chloroform, acetonitrile, methanol, and insoluble in hexane and diethyl ether. The complex C2 was anchored onto a silica support to afford complex Si-1 as a brown powder with good yield (71%).
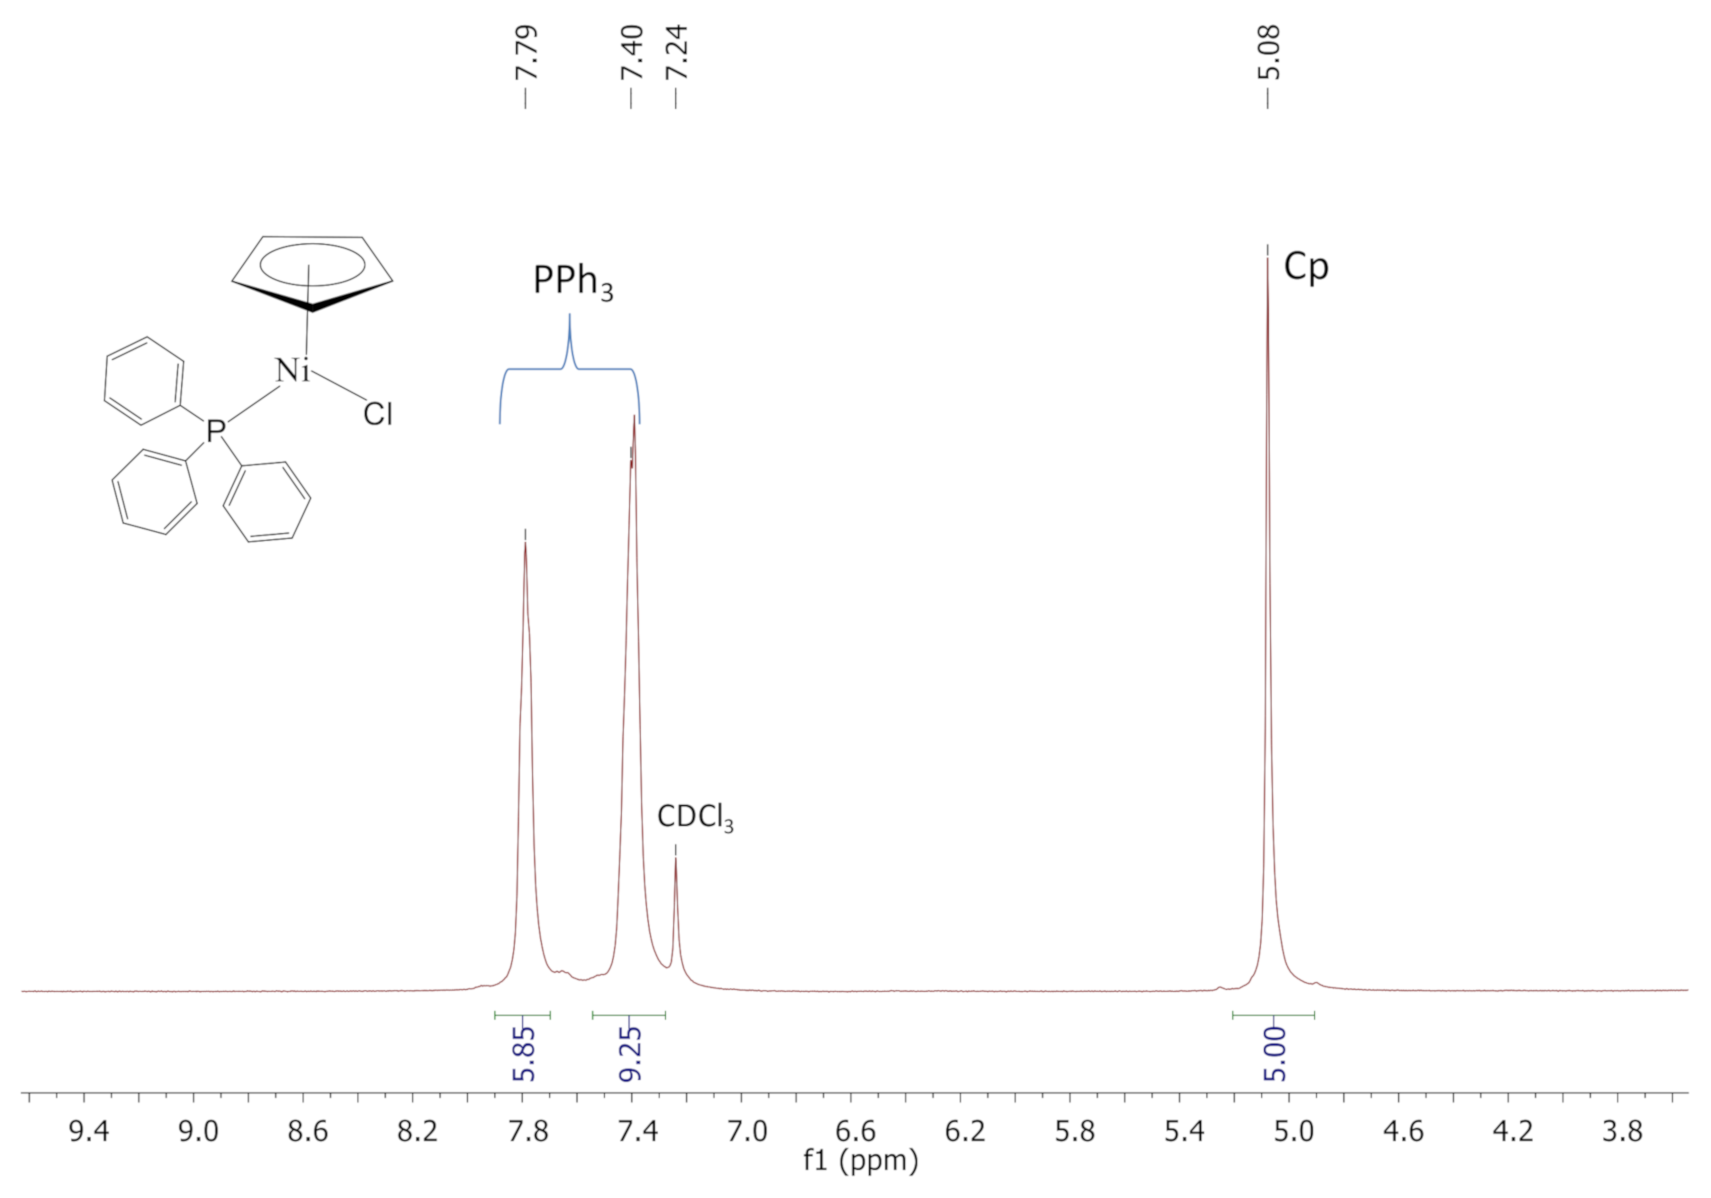
The 1H NMR spectrum of complex C1 (Figure 2) showed the characteristic cyclopentadienyl ring protons that appeared at 5.08 ppm integrating for five protons and the aromatic protons appeared in the region between 7.40–7.79 ppm, corresponding to the triphenylphosphine protons. The 31P {1H} NMR spectra of complexes C1 and C2 distinctly showed a singlet at 28.88 ppm and 34.00 ppm (Figures S3 and S4). This peak shifted from −6.28 ppm and −21.98 ppm in the ligands, respectively. This is evidence that the phosphorus atom is coordinated to the nickel center. The 29Si NMR spectrum of complex C2 showed a singlet at −43.80 ppm. The 13C{1H} NMR spectrum for complex C1 confirmed that the number of carbon atoms present corresponded to the expected signals.
The mass spectrum of complex C1 showed a peak at m/z = 385.0657 for [M-Cl + H], which corresponded to the molar mass of complex C1 (Figure S5).

2.3. Synthesis and Characterization of Complexes C4, C5, and Si-2

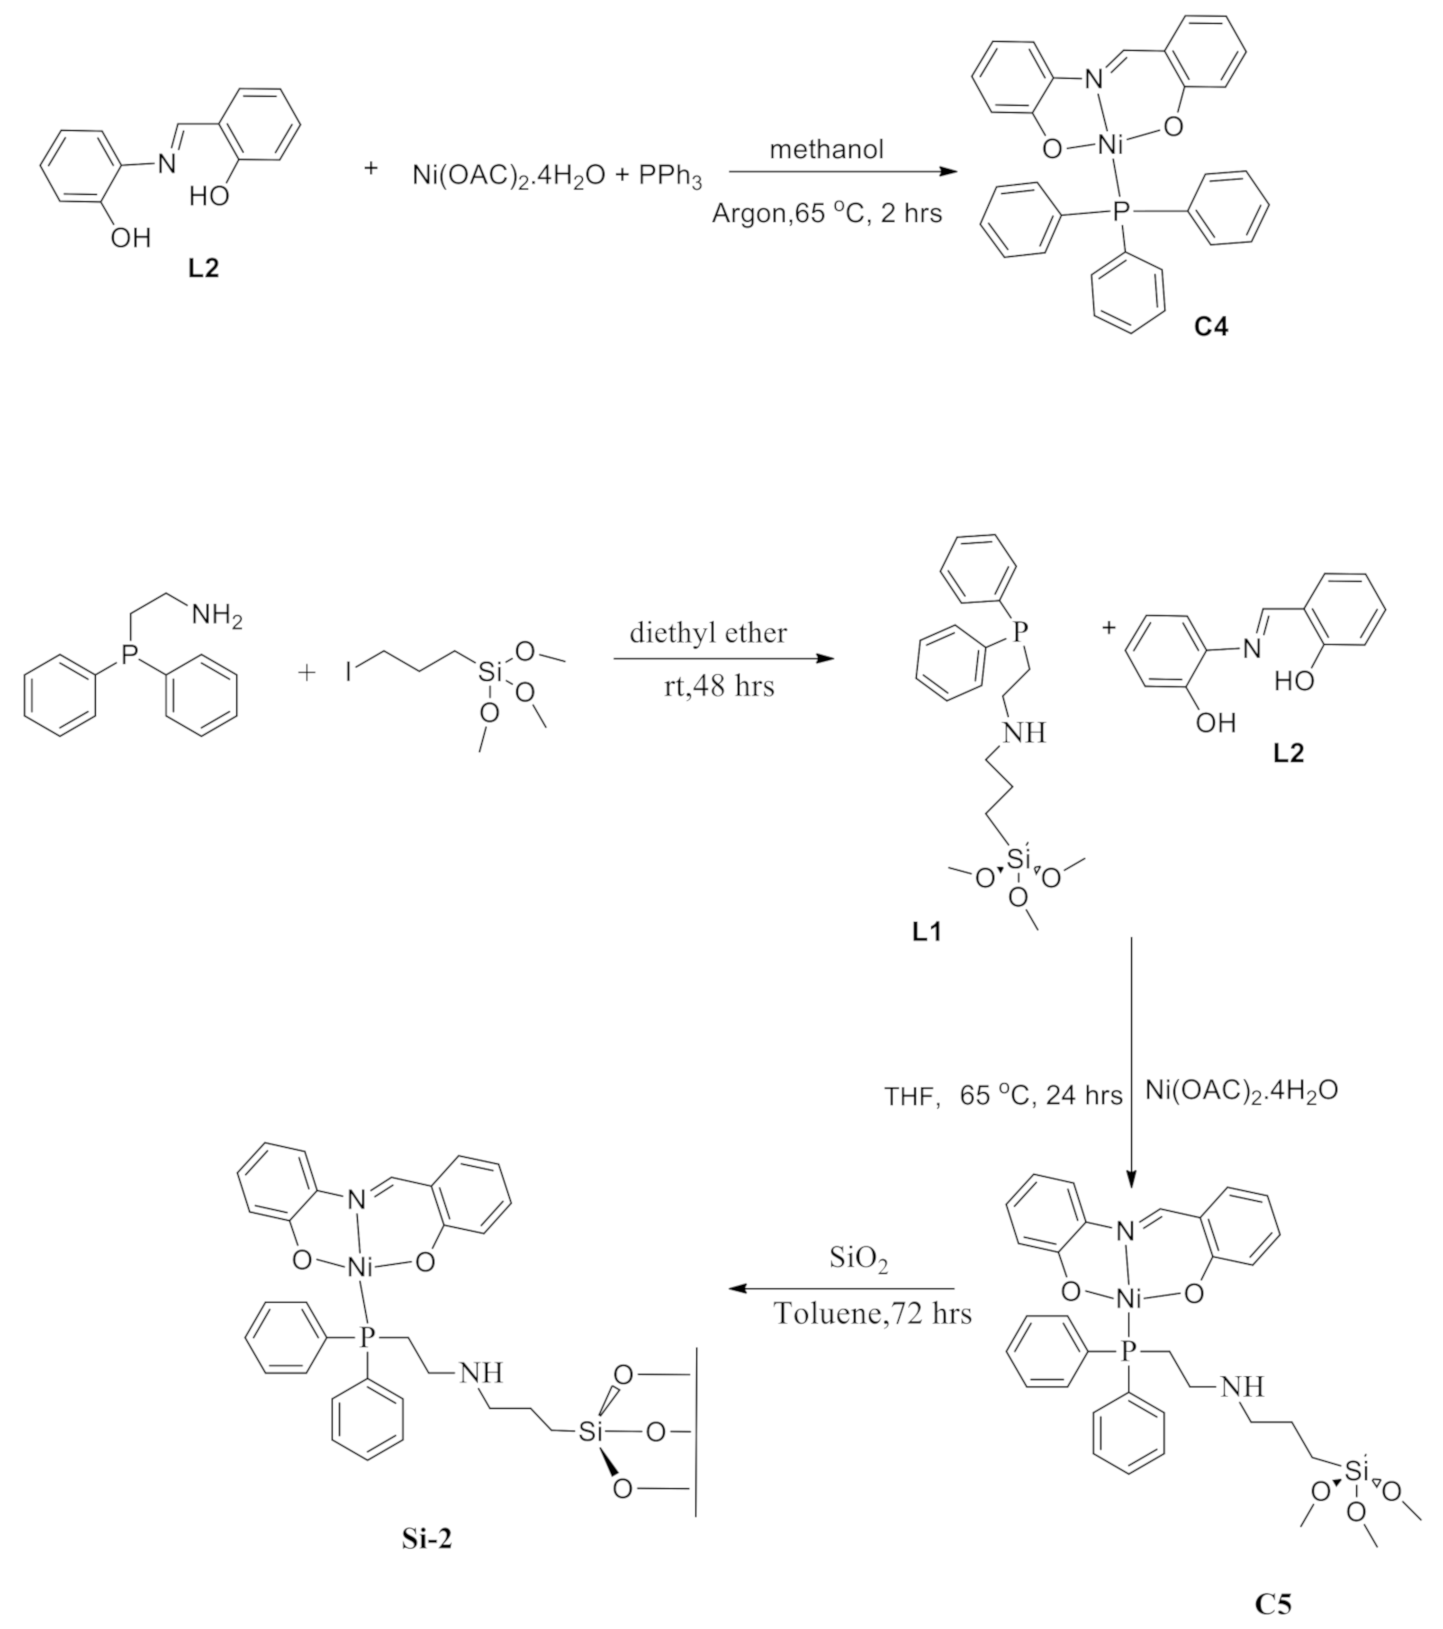
Complex C4 was synthesized by adding ligand L1 to a solution of dissolved equimolar amounts of nickel acetate tetrahydrate and triphenylphosphine in methanol [19,20]. The reaction mixture was refluxed at 65 °C for 2 h under argon (Scheme 4). The complex C4 was recovered as a brown crystalline solid with good yield (75%). The Complex C4 is soluble in chloroform, methanol, ethanol, toluene, and insoluble in hexane, diethyl ether, and water. The complex C5 was prepared using a one pot procedure, NaH was added into a flask containing 2(diphenylphosphino)ethylamine dissolved in dry THF, and stirred at room temperature for one hour. 3(Iodopropyl)trimethoxysilane was added to the solution and the reaction mixture was continually stirred for 48 h. To this was added equimolar amounts of nickel acetate tetrahydrate and ligand L1 and the mixture was refluxed at 65 °C for 24 h. The complex C5 was obtained as a brown oil with fair yield (52%). The complex C5 is soluble in chloroform, methanol, acetonitrile, dimethyl sulfoxide, and insoluble in diethyl ether, hexane, and water. The complex C5 was anchored onto a silica support to afford complex Si-2 as a yellow powder with good yield (87%).
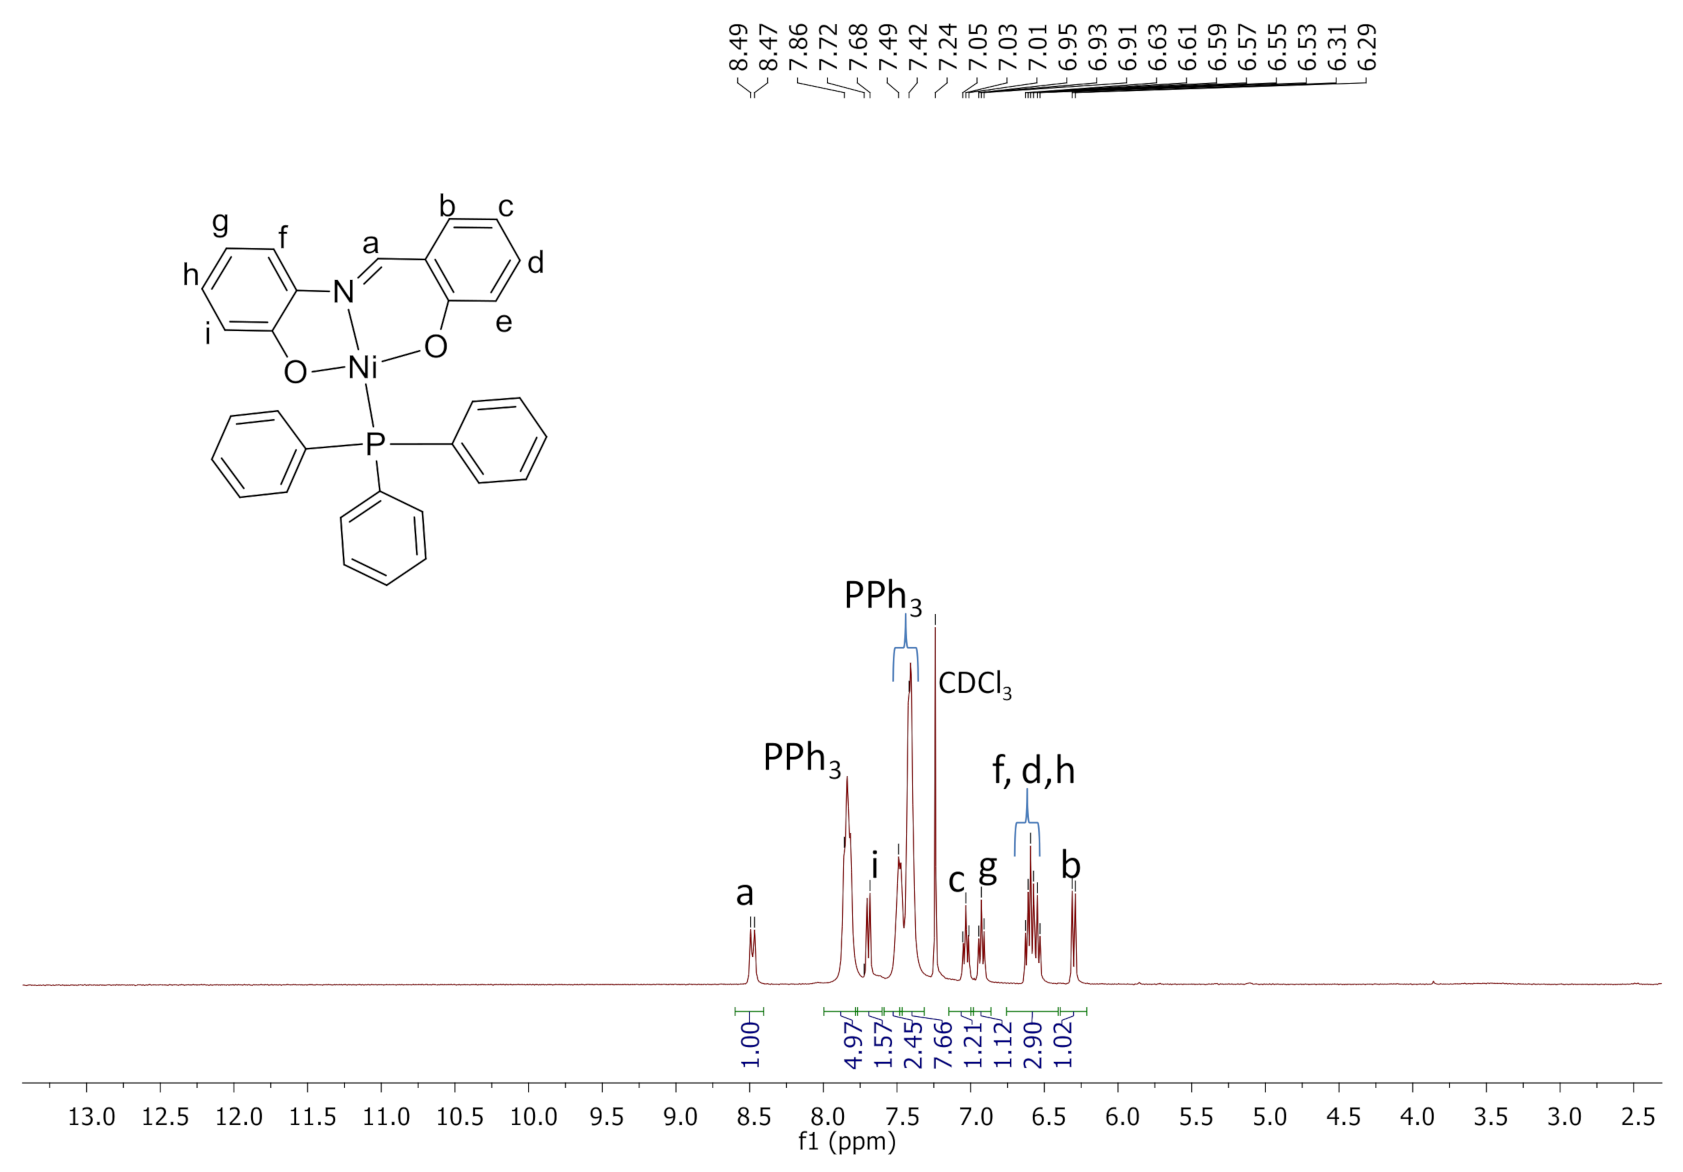
The 1H NMR spectrum of complex C4 (Figure 3) showed a signal for the imine proton (8.49 ppm) shifted up field compared to that of ligand L1 (8.68 ppm), which confirms coordination of the nickel metal.
The imine hydrogen (HC=N) appeared as a doublet at 8.40 ppm due to coupling to the phosphine and this coupling has also been reported in the literature for similar compounds [20,21]. The aromatic protons of the Schiff base ligand and triphenylphosphine appeared in the range 6.29–7.86 ppm. The disappearance of the hydroxyl proton (OH) at 12.28 ppm also confirms that the nickel metal was coordinated to both the oxygen and the imine nitrogen.
The 31P {1H} NMR spectra of complexes C4 and C5 (Figures S6 and S7) distinctly show a singlet at 14.97 ppm for complex C4 and a broad peak at 50.34 ppm for complex C5. This shows successful coordination of the phosphorus atom to the nickel center in both complexes. The 29 Si NMR spectrum of complex C5 showed a peak at −21.35 ppm, which is a great shift from −43.80 ppm of 3(iodopropyl)trimethoxysilane (Figure S8). The 13C{1H} NMR spectrum for complex C4 confirmed that the number of carbon atoms present corresponded to the expected signals.
The infrared spectra of complexes C4, C5, and Si-2 (Figures S9 and S10) were compared with the infrared spectrum of the Schiff base ligand L1. The imine functionality shifted to lower frequencies (1606 cm−1, 1573 cm−1, and 1558 cm−1) compared to the free Schiff base ligand (1625 cm−1). This confirms the coordination of the Schiff base ligand L1 to the nickel center. The HN=C shifts to lower frequencies after coordination, which might be due to the electron withdrawing effects from the coordinated metal that weakens the imine bond (synergic effect) [20].

2.4. Surface Properties

The BET surface area, pore volume, and pore size data of the silica-supported complexes Si-1 and Si-2 are shown in Figure 4. The complexes Si-1 and Si-2 possess a high surface area of 258 m2/g and 185 m2/g, respectively, although it was lower compared to that of SiO2 (442 m2/g), which might be a result of the presence of the nickel metal as well as SiO2 transformation during synthesis [22,23]. The pore volume decreased from 0.69 cm3/g of SiO2 to 0.39 cm3/g (Si-1) and 0.27 cm3/g (Si-2), which might be due to pores collapsing at elevated temperatures during synthesis. The physisorption isotherms (Figure 4a) are typical of type IV based on the literature reported IUPAC classification [24]; this confirms that the synthesized complexes are mesoporous. The pore diameter of complex C3 (4.63 nm) and C6 (4.21 nm), as shown in Figure 4b, falls within the range for mesoporous materials (2 nm < size < 50 nm)22, which also confirms that complexes Si-1 and Si-2 are mesoporous.
FTIR spectroscopy characterization confirmed that the Schiff base complex C5 was supported on silica, resulting in Si-2, as shown in Figure S11. The peaks observed in the IR spectrum such as the Si–O–Si stretching frequency for silanol groups at 802 cm−1, the peak around 1553–1558 cm−1 is attributed to the presence of the C=N functional group. The peaks of silica and the characteristic peak of complex Si-2 appeared in the spectrum of complex Si-2/SiO2, which confirms that complex Si-2 was immobilized on the silica surface. The shift and decrease of the intensity of the v(Si-O) vibration band assigned to SiO2 around 800 cm−1 also confirms that complex Si-2 was successfully supported on silica. The metal loading on the supported complexes plays an important role in determining the productivity per gram of metal, hence the Ni loading on complexes Si-1 and Si-2 were determined using inductively coupled plasma mass spectrometry (ICP-MS). The complex Si-1 had 7.42% and the complex Si-2 had 3.31% Ni content.
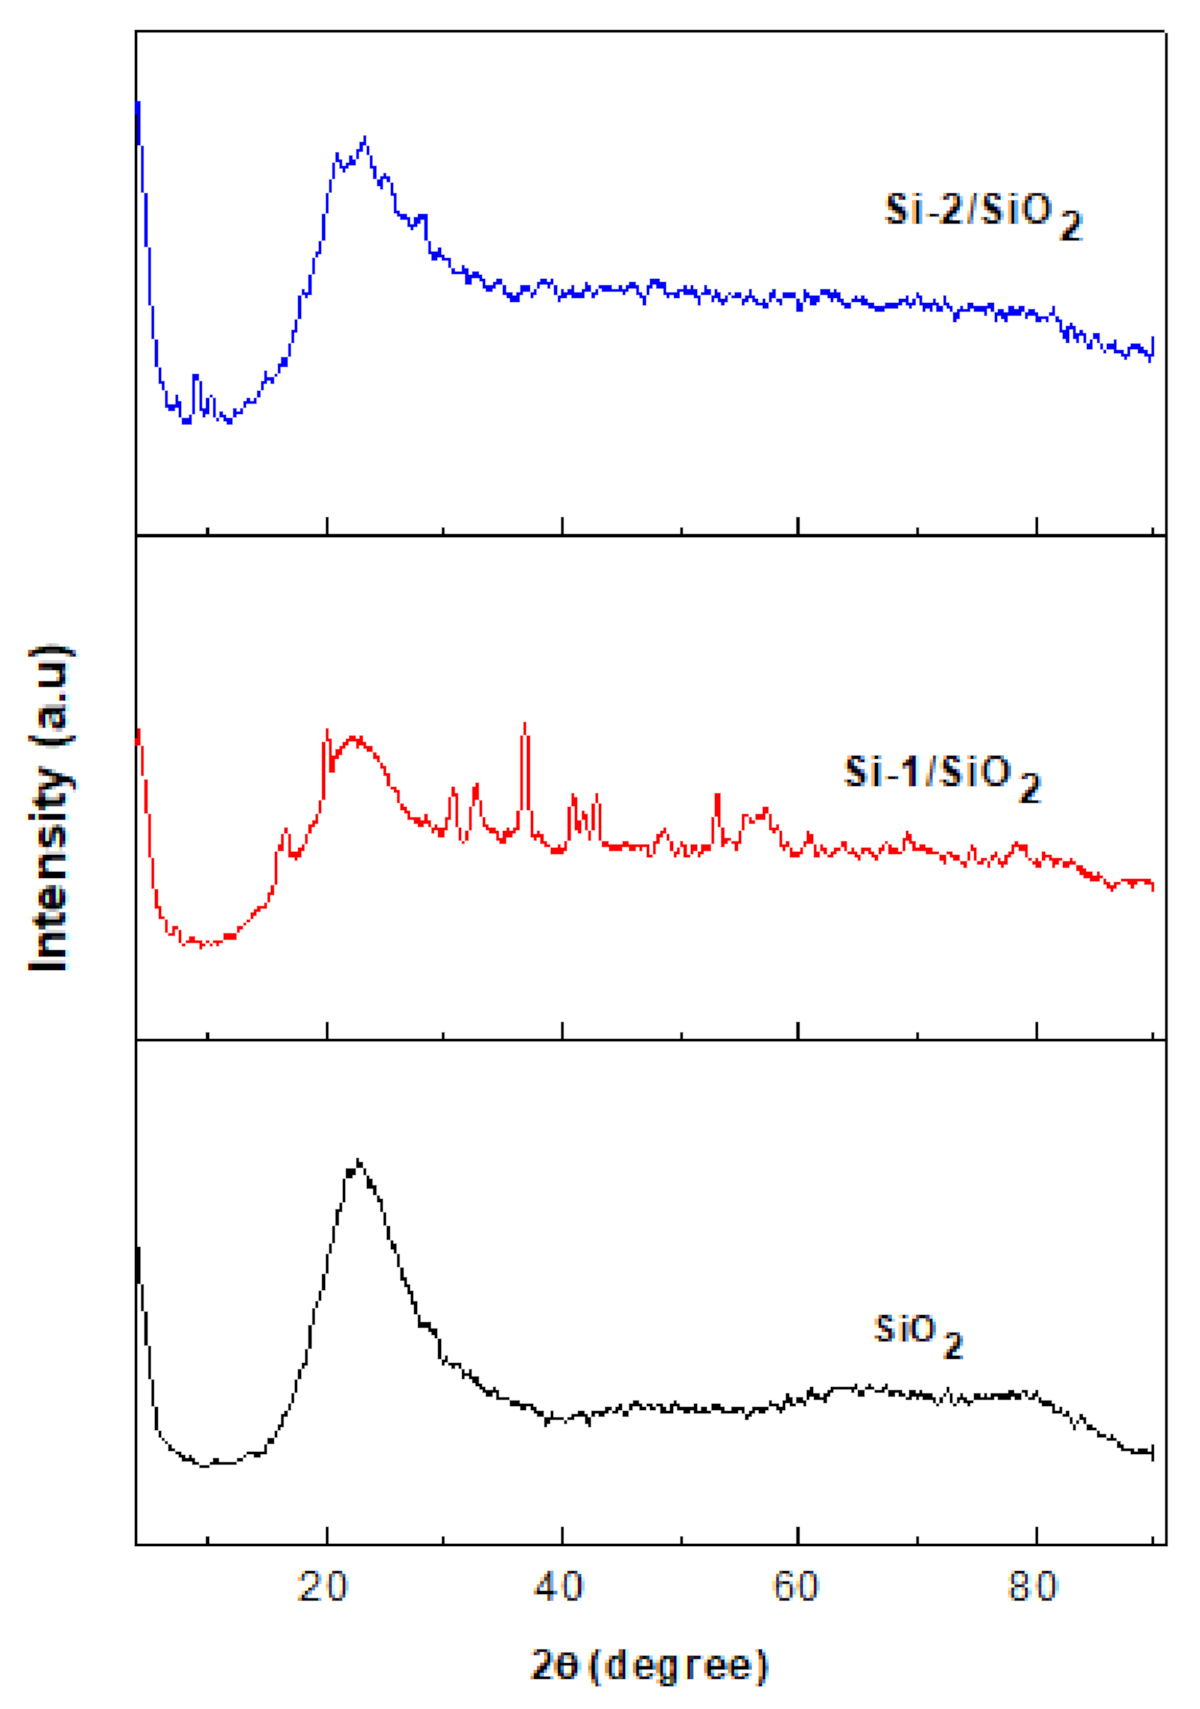
The XRD studies were performed in order to determine the phase composition of the supported catalysts. There were no new peaks observed for complex Si-2 (Figure 5), possibly might be due to low Ni metal loading, which was confirmed from the ICP-MS results. The complex Si-1 exhibited sharp (2Ɵ = 32°, 36°, 42°) and broad (2Ɵ = 22°) diffraction peaks, which means that it could be a mixture of both crystalline and amorphous in nature. There is no evidence of peaks characteristic of Ni nanoparticles, which confirms that the molecular catalyst had been supported successfully without reduction. However, all the diffraction patterns showed a broad peak around 2Ɵ = 22–24 °C, which is a characteristic peak of amorphous silica. This confirms that complex Si-1 and Si-2 are supported on silica. The diffraction pattern of complexes Si-1 and Si-2 differed from the pure SiO2 (Figure 5), also indicating that the complexes Si-1 and Si-2 were supported on SiO2, which has been reported in the literature [25,26].
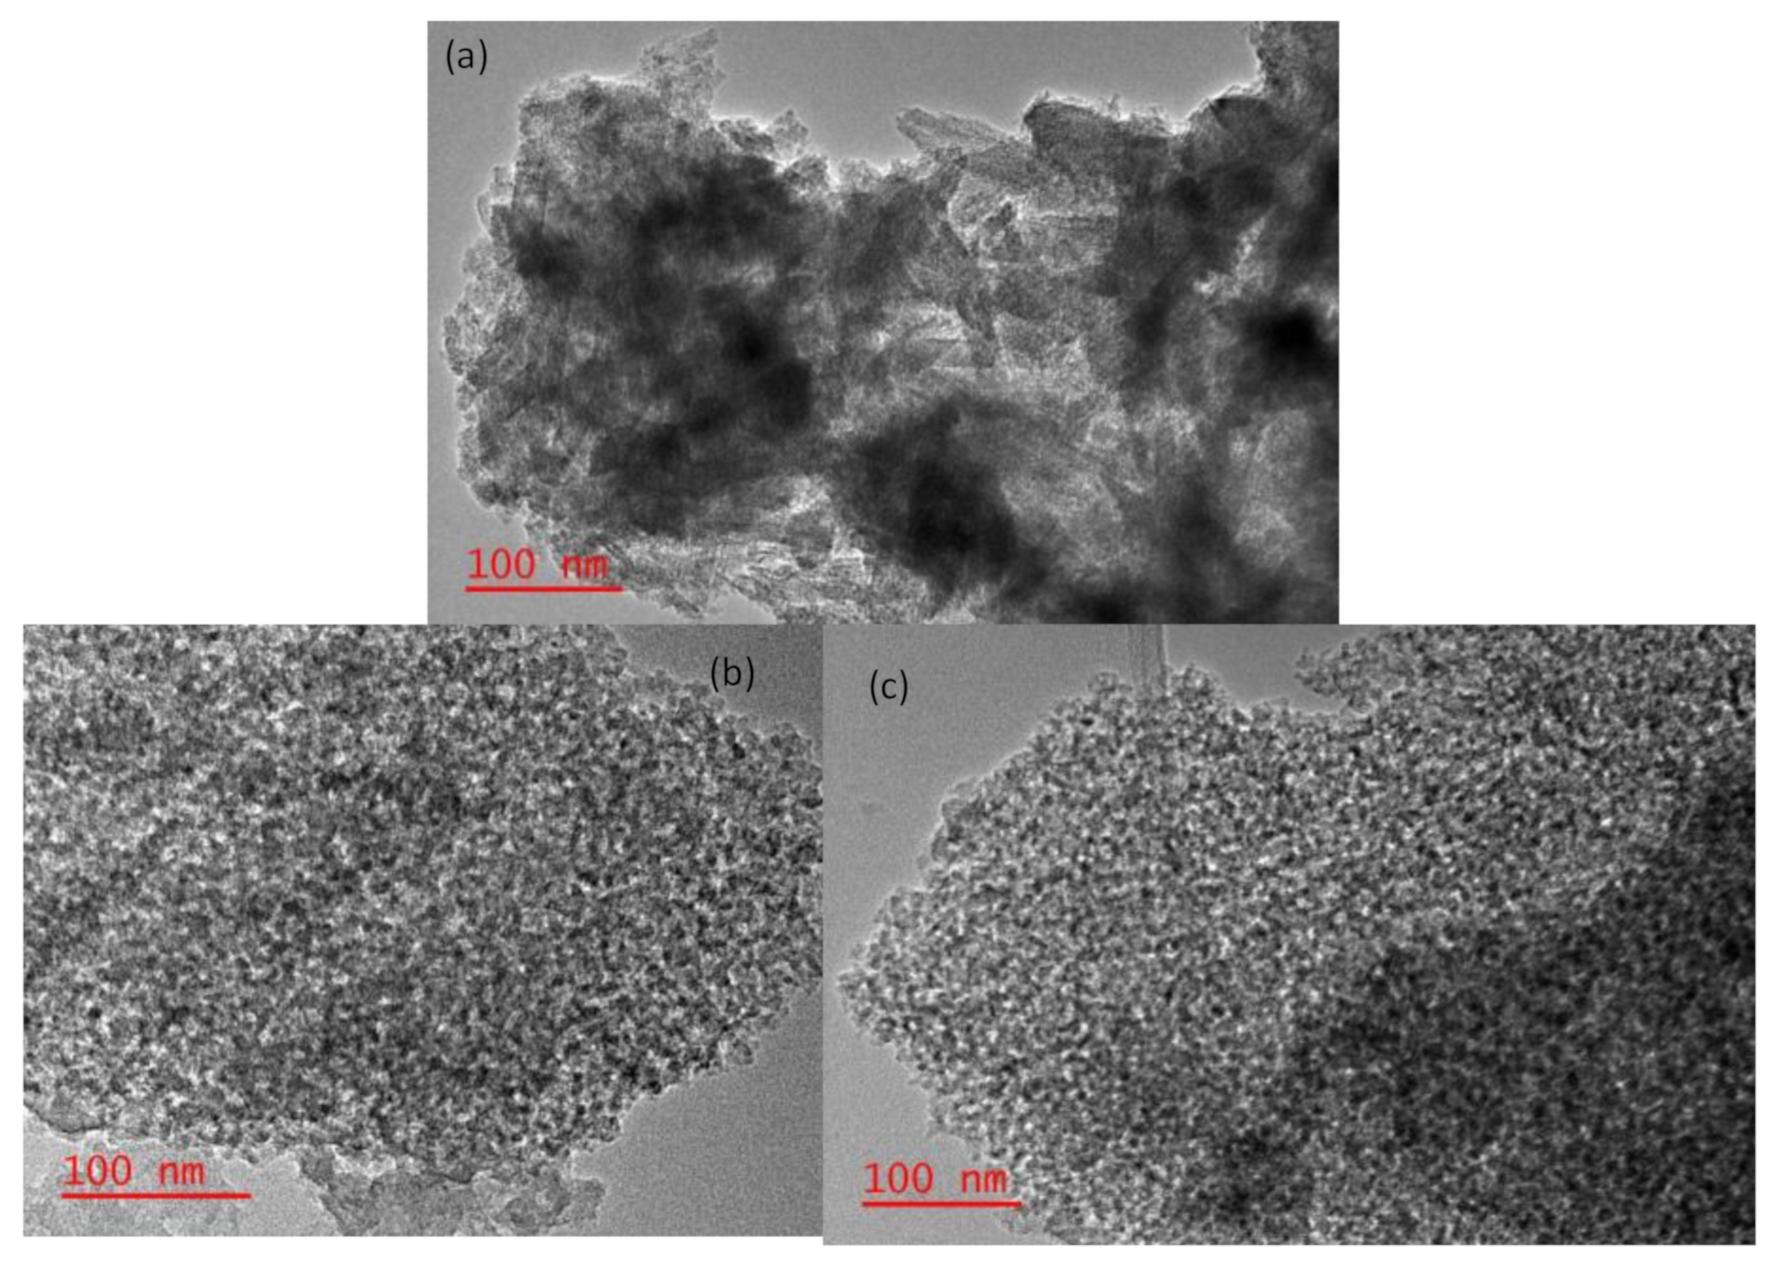
The TEM images of the silica support (Figure 6a) as well as the supported complexes SI-1 and Si-2 (Figure 6b,c) showed that the silica gel had pores that were retained even after complexes Si-1 and Si-2 had been anchored on it, although the pores were not so well defined. It was not possible to perform point scans along the diameter of the particles due to their small size and undefined pores.
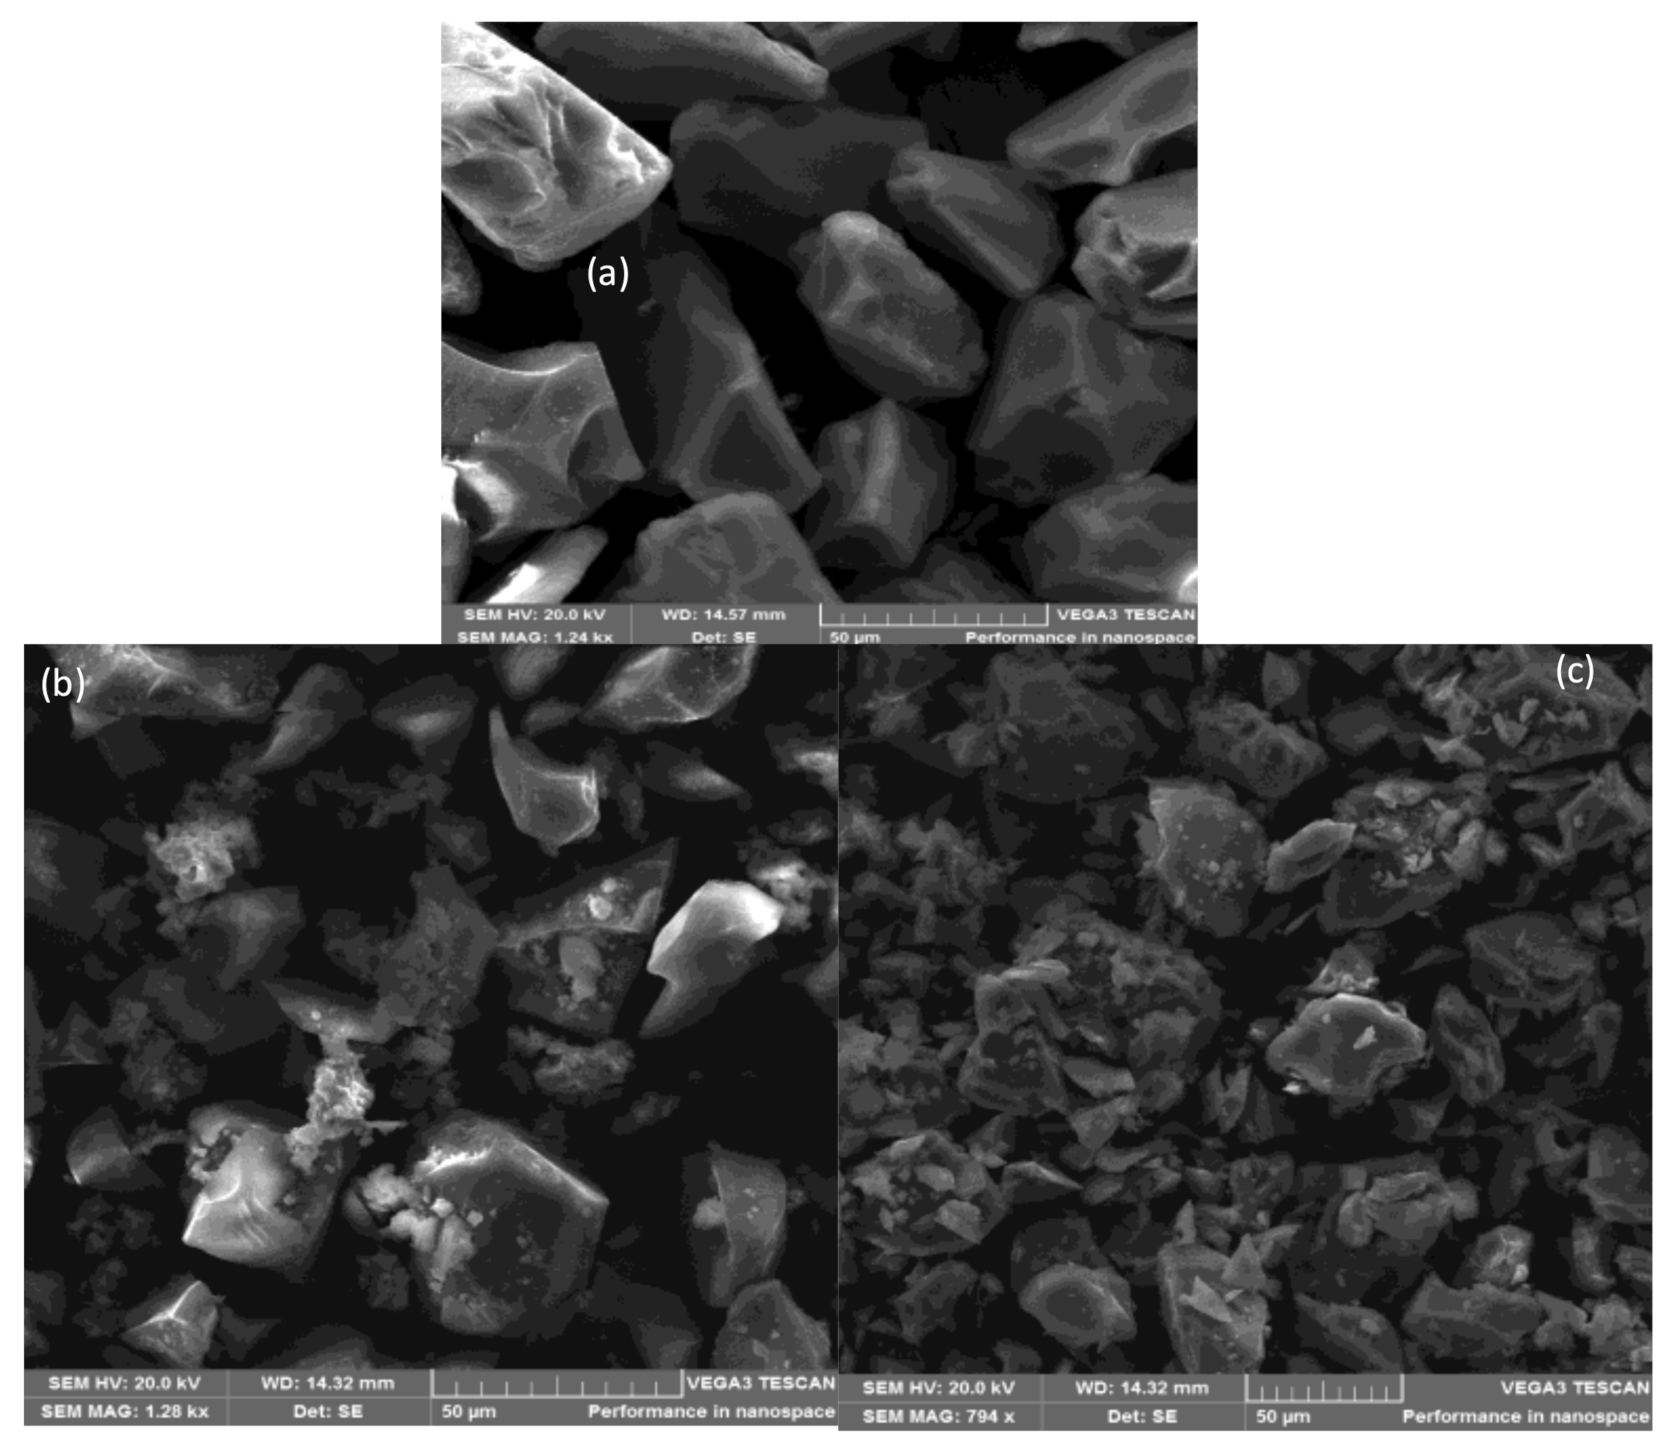
SEM characterization was performed in order to determine the surface morphology of complexes Si-1 and Si-2 over the silica support. The obtained images (Figure 7) showed that the type of catalyst supported on silica could significantly alter the particle morphology. The silica texture was retained in complex Si-1, which resulted in complex Si-1 exhibiting a more porous texture in comparison to complex Si-2.
The metal particle size distribution of the Ni catalysts was determined by EDX (Figure S12). It can be seen that Ni metal is highly dispersed on the SiO2 support in the complex Si-2 compared to Ni dispersion on the SiO2 support in complex Si-1, which might be due to the different nickel metal salts used in the synthesis of complexes Si-1 (NiCl2·6H2O) and Si-2 (Ni(OAc)2·4H2O).
The energy dispersive x-ray microanalysis (EDX) study was performed in order to determine the surface composition of the samples as shown below. As expected, the EDX results (Figure S12) revealed the presence of Si and O in silica (a) Si, O, C, Ni, P, and Cl elements in complex Si-1 (b) and Si, O, C, Ni, and P in complex Si-2 (c). However, there were some traces of iodine from the iodotrimethoxysilane used as a starting material during the preparation of complex Si-1.

2.5. Optimization for Reduction of Furfural in Hydrogen Atmosphere

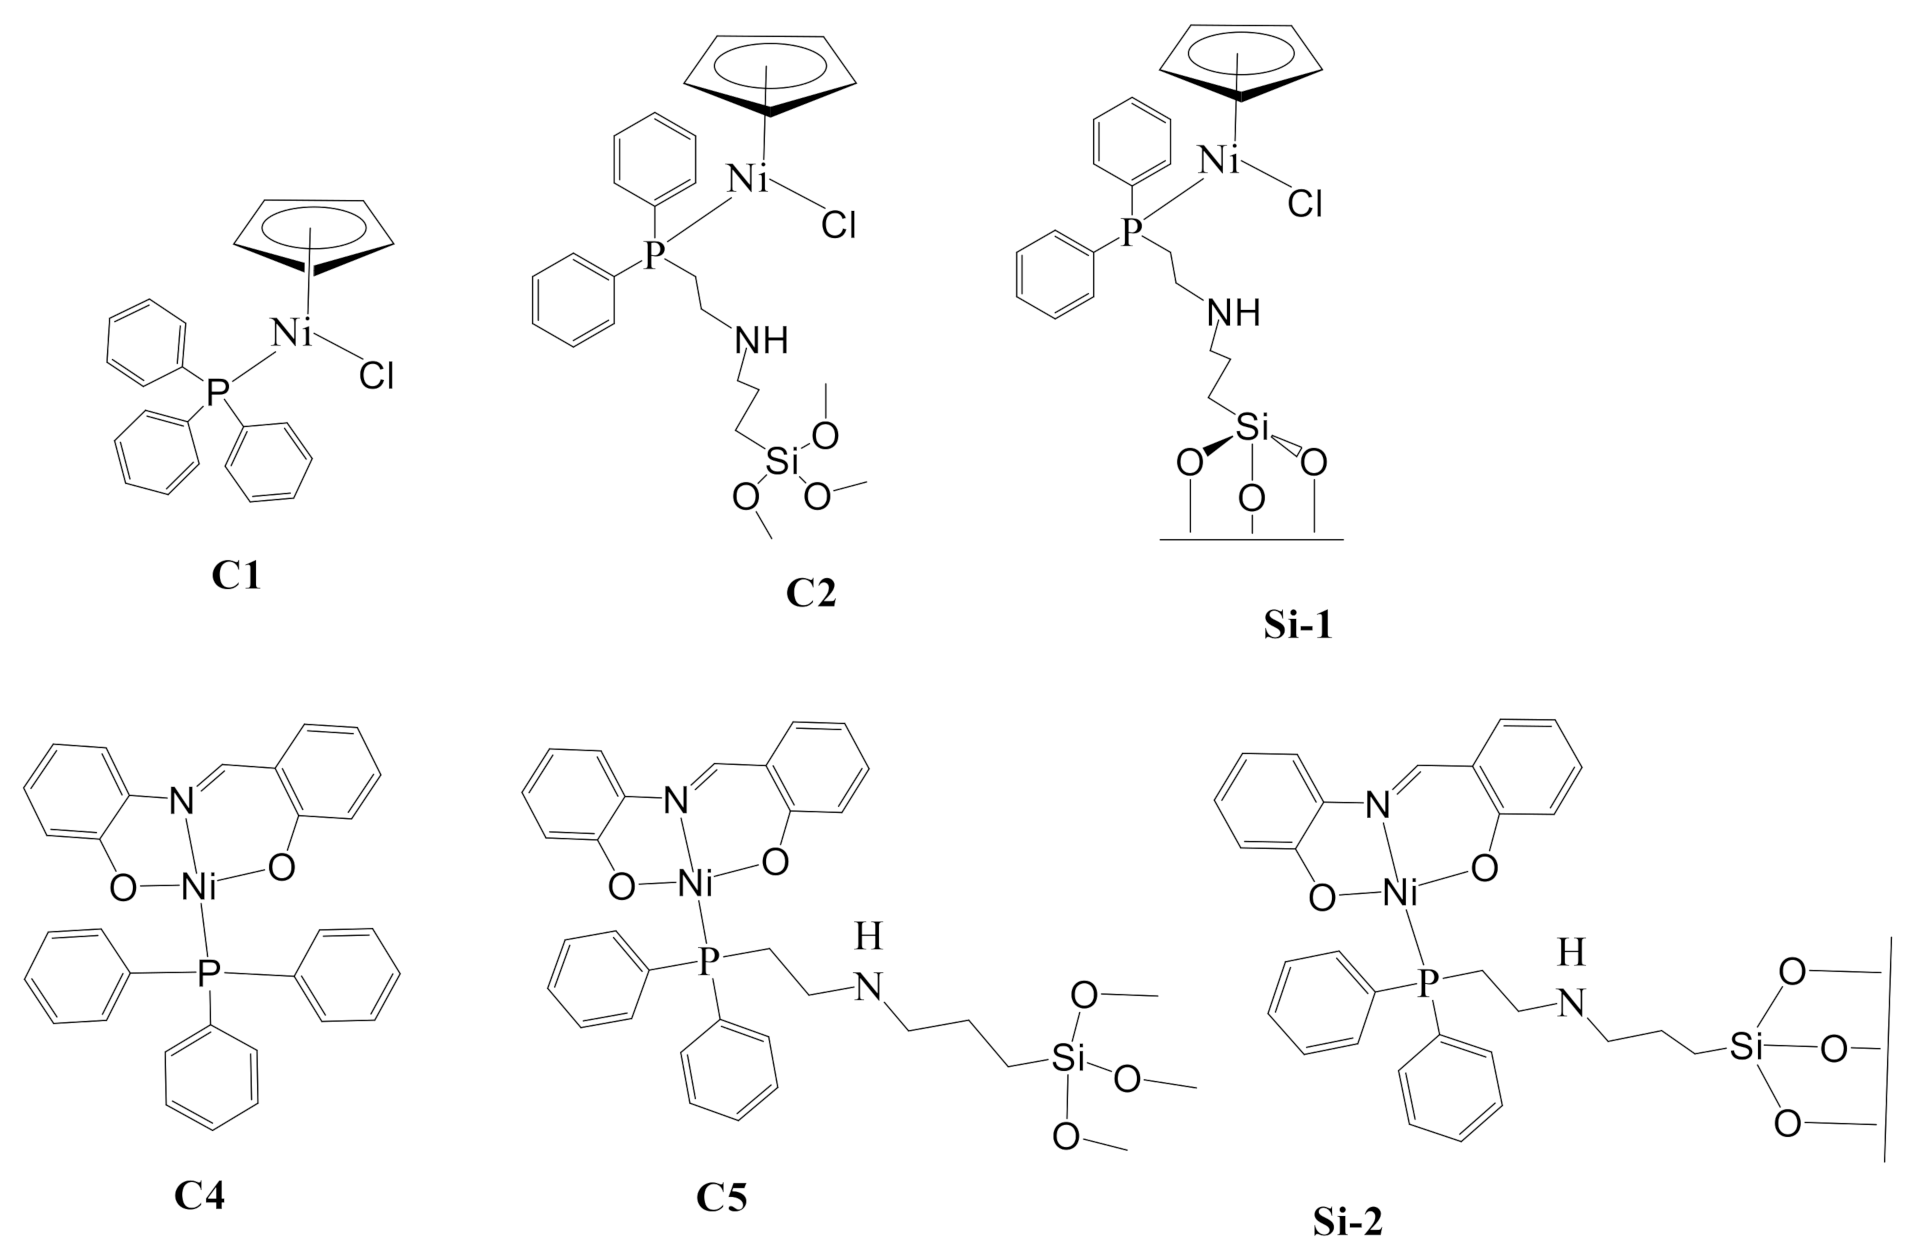
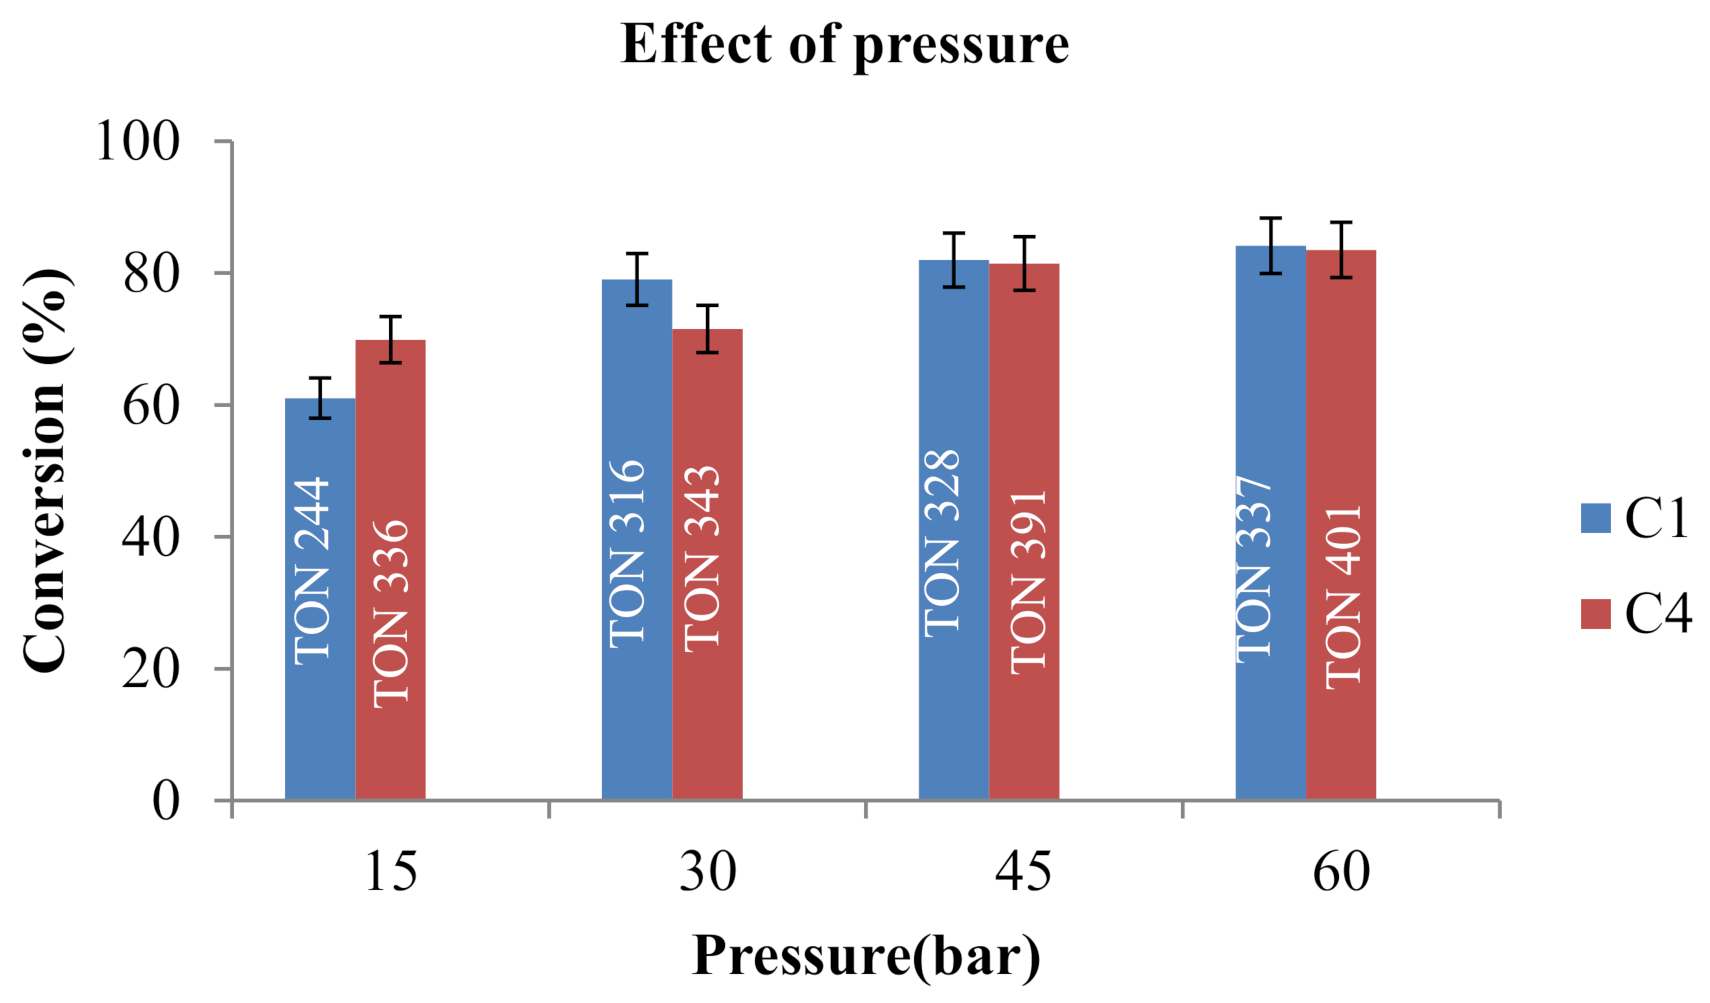
All catalytic experiments were performed in duplicate and the standard deviations are reported. The optimization of the reaction conditions were conducted using pre-catalysts C1 and C4 (Figure 8). Furfuryl alcohol was exclusively formed during catalysis and no additional products were formed. These catalysts displayed a selectivity of 100% and conversion was determined by 1H NMR spectroscopy. In order to establish the best catalytic conditions for all the catalyst precursors, various reaction parameters were investigated. First, the effect of hydrogen pressure on the reaction was tested (Figure 9).
From this study, it was observed that increasing the hydrogen pressure from 15 bar to 45 bar slightly increased FF conversion for both pre-catalysts (Figure 9). This may be attributed to the increased rate of formation of the catalytically active hydride species resulting in an increase in the FF conversion, and similar results have been reported by Liu et al. [27]. However, there was no significant increase in FF conversion when the hydrogen pressure was increased beyond 45 bar.
Reaction temperature, effect of solvent, catalyst loading, and effect of time were also investigated. The temperature range investigated was 100–160 °C at a fixed pressure of 45 bar and 40 bar for pre-catalysts C1 and C4, respectively. The pre-catalyst C1 showed the highest FF conversion at 140 °C with a turnover number (TON) of 389 and pre-catalyst C4 showed the highest FF conversion at 160 °C with a TON of 463. Both pre-catalysts also displayed 100% selectivity toward FA. The conversion of FF decreased when temperature was increased to 160 °C for pre-catalyst C1, which might have been due to catalyst decomposition at high temperatures compared to pre-catalyst C4, which was stable (Figure S14).
Both pre-catalysts C1 and C4 gave high FF conversion when ethanol was employed as the solvent (97% and 96%, respectively). There was no observed FF conversion when water or toluene were used as the solvent, which might be due to poor solubility of pre-catalysts C1 and C4 in both water and toluene (Table 1). Isopropanol gave 75% and 74% FF conversion for pre-catalysts C1 and C4, which was lower than that of ethanol, which might be attributed to the differences in alcohol dehydrogenation activity. This is similar to what has been reported in the literature by Puthiaraj et al. when the Pd precursors were employed in FF hydrogenation [28] Both ethanol and isopropanol were active in the FF hydrogenation, this indicated that the conversion of FF to FA using pre-catalysts C1 and C4 is favorable in the presence of organic polar solvents.
The conversion of FF increased with the increase in catalyst loading (0.5–3 mg). Pre-catalyst C1 showed 97% FF conversion with a TON of 389 while pre-catalyst C4 showed 96% FF conversion with a TON of 414 at 3 mg (0.2 mol%) catalyst loading (Figure S15). It has been previously observed in the literature that increasing the catalyst loading may result in more active sites, which increases catalytic activity and this is similar to what was observed when pre-catalysts C1 and C4 were employed [27].
A time study was also conducted with these catalyst precursors. The FF conversion increased gradually with prolonged reaction time, the highest turnover frequency (TOF) was recorded when the reaction was stopped in the first four hours (60 h−1 for pre-catalyst C1 and 59 h−1 for C4). However, the TON increased from 239 to 389 for pre-catalyst C1 as the time was increased from 4 h to 24 h and from 252 to 414 for pre-catalyst C4, Figure S16 hence 24 h was the optimum reaction time.

2.6. Hydrogenation of FF Using Different Metal Precursors

The catalytic reactions were performed with different Ni metal salts (Table 2) under the optimum conditions and all the metal salts were active in the reduction of furfural in hydrogen atmosphere, over 25% conversion was obtained with the rest of the metal precursors and were 100% selective. Of interest, was that NiCl2·6H2O and Ni(OAc)2·4H2O (Entry 1 and 2) showed poor results on FF conversion compared to synthesized metal precursors (Entry 3 and 4), which showed better performance. Synthesized metal precursors showed improvement in the conversion of FF to FA, which might be due to the presence of phosphine ligands that improved the catalytic activity of the metal precursors. Phosphine ligands are beneficial in homogeneous catalysis because they have high electron density, which increases the reactivity of complexes during the oxidative addition of substrate to the metal center, and their bulkiness improves the reductive elimination step during the catalytic cycle. Phosphines are also good σ-donor and π acceptor ligands and these electronic properties are effective in enhancing the catalytic activity of complexes, and the silica gel used as a support was active in FF hydrogenation, although the conversion was low (36%) with a TON of 174.

2.7. Catalyst Screening; Complexes C1, C2, Si-1, C4, C5 and Si-2

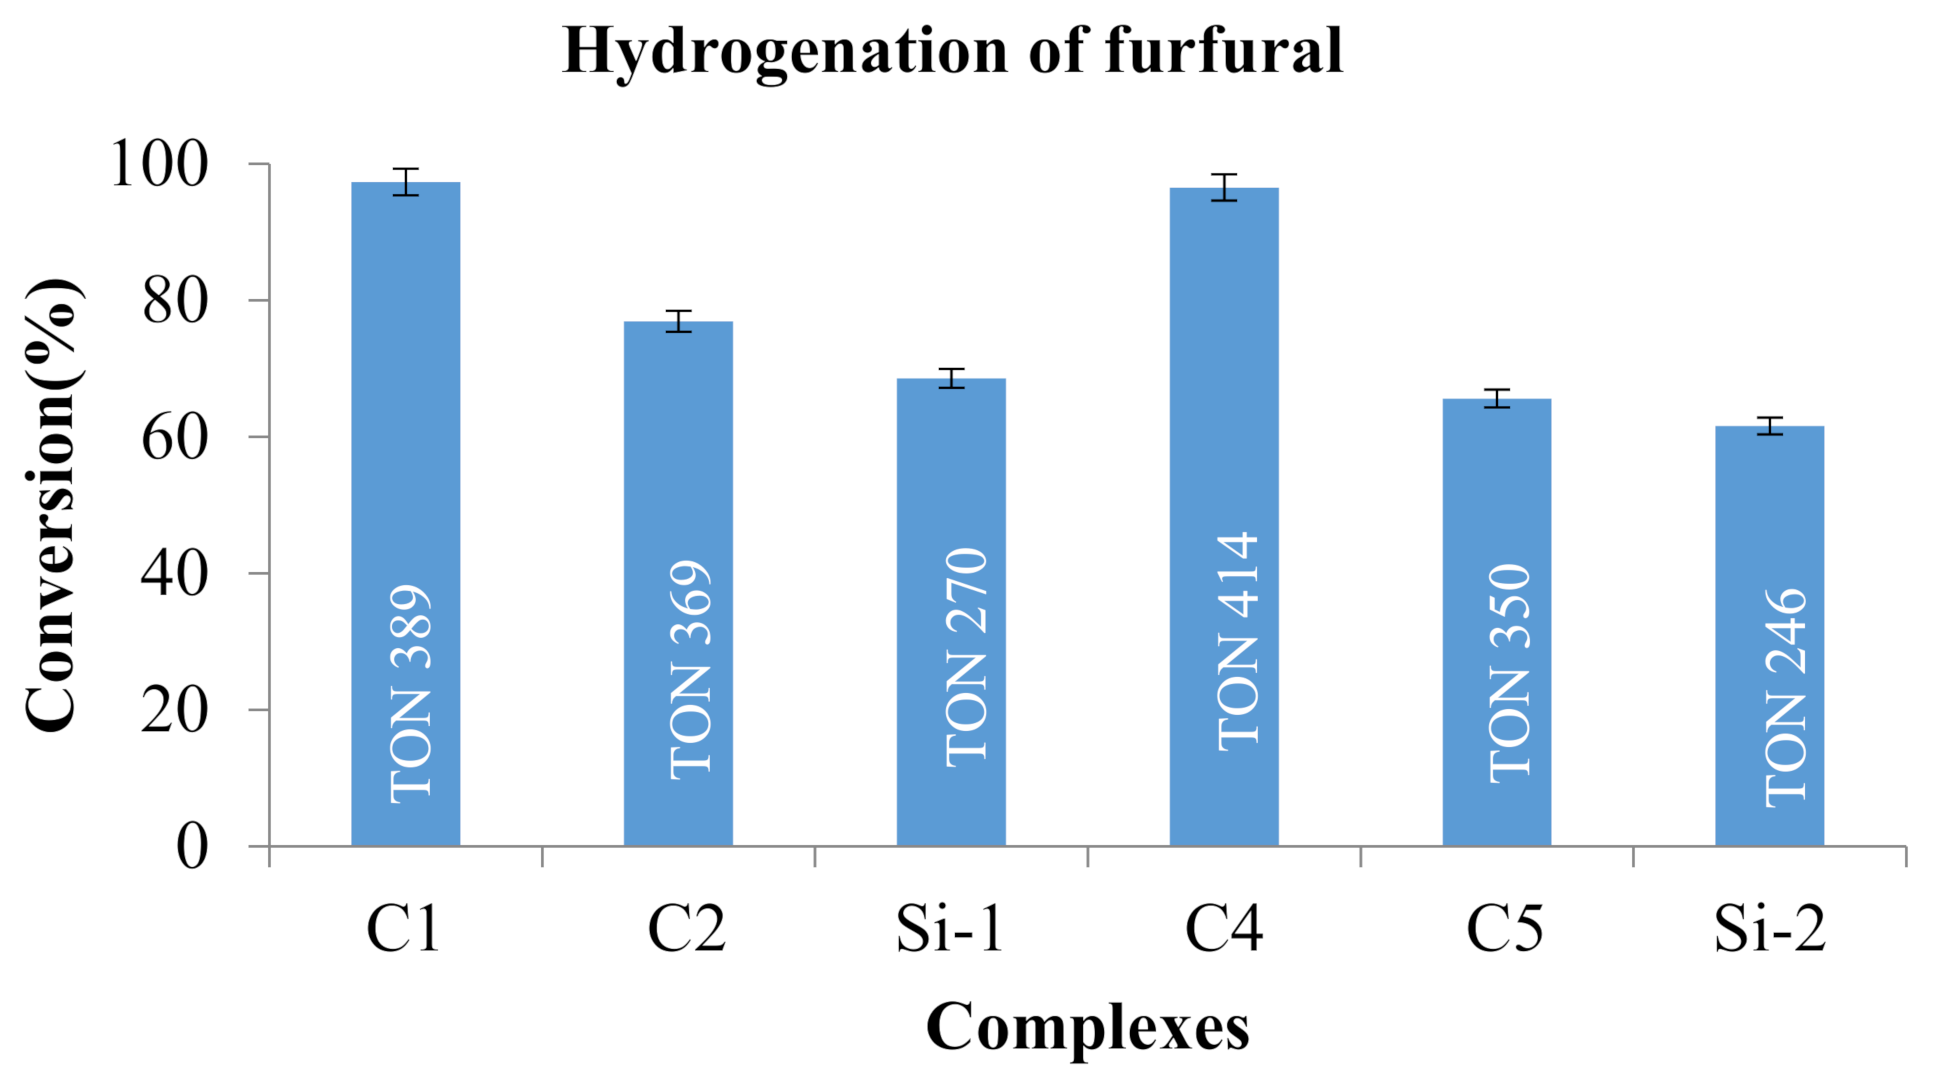
The reactions were performed with the complexes (C1, C2, Si-1, C4, C5, and Si-2) as pre-catalysts under the established optimum conditions under a hydrogen atmosphere. It was observed that all the complexes were active in the hydrogenation of FF and selectivity was 100% toward FA. The presence of triphenyl phosphine ligand in C1 and C4 resulted in higher FF conversion of 97% and 96%, respectively (Figure 10). This may be due to the phosphine being a good σ-donor and π acceptor and hence the electronic properties of the phosphine ligands are effective in enhancing the catalytic activity of the pre-catalysts.
Complexes C2 and C5, which contain diphenyl-phosphine and siloxane ligands had a lower FF conversion (68% and 65%, respectively). The FF conversion decreased when the pre-catalysts containing the siloxane ligand were employed (C2, Si-1, C5, and Si-2); this reflected that the presence of a different ligand (phosphine or siloxane) has an influence on the catalyst activity. Si-1 and Si-2, which were supported on silica, conversion of % was observed with 100% selectivity toward FA. The homogenous complexes containing triphenylphosphine ligand, C1 and C4 gave the highest FF conversion (97% and 95%, respectively). Homogenous complexes C2 and C5, which contain diphenyl-phosphine and siloxane ligands, had a lower FF conversion compared to C1 and C4. Heterogenous pre-catalysts C3 and C6 showed some activity in the conversion of FF to FA, however, the FF conversion was lower than what was expected. The pre-catalyst Si-1 had higher FF conversion (69%) compared to pre-catalyst Si-2 (61%), which could be as a result of higher surface area as well as higher metal loading in pre-catalyst Si-2. This was evident from the BET and ICP-MS results obtained during the characterization of the complexes.
The Ni (II) homogenous complexes C1 and C4 displayed high FF conversion (97% and 96%), which is comparable to the catalytic activity of the Pd(II) complexes reported by Moyo et al., where the Pd(II) catalysts displayed 100% FF conversion with 88% selectivity toward FA and 12% selectivity toward THFA [12]. However, when the Ni(II) catalysts were employed, selectivity was 100% toward furfuryl alcohol and no other product was formed. In addition, the reduction of FF using molecular hydrogen using Ni(II) catalysts required higher pressure (40–45 bar) whilst the Pd(II) catalysts required low pressure (20 bar).

2.8. Homogeneity Test

A mercury poisoning experiment was done in order to check if our catalytic systems were entirely homogenous. The distinction between homogeneous and heterogeneous was done using mercury poisoning tests [29] This test rules out the formation of any catalytically active Ni(0) nanoparticles. The obtained results showed a great decrease in FF conversion in the presence of mercury when pre-catalyst C1 was used, which shows that the catalytic system might have been a mixture of both homogenous and heterogenous. The reaction was promoted by both homogenous and nanoparticles, as shown by a slight decrease in FF conversion when using pre-catalysts C2, C4, and C5 (Figure S17) in the presence of mercury.

2.9. Recyclability Studies

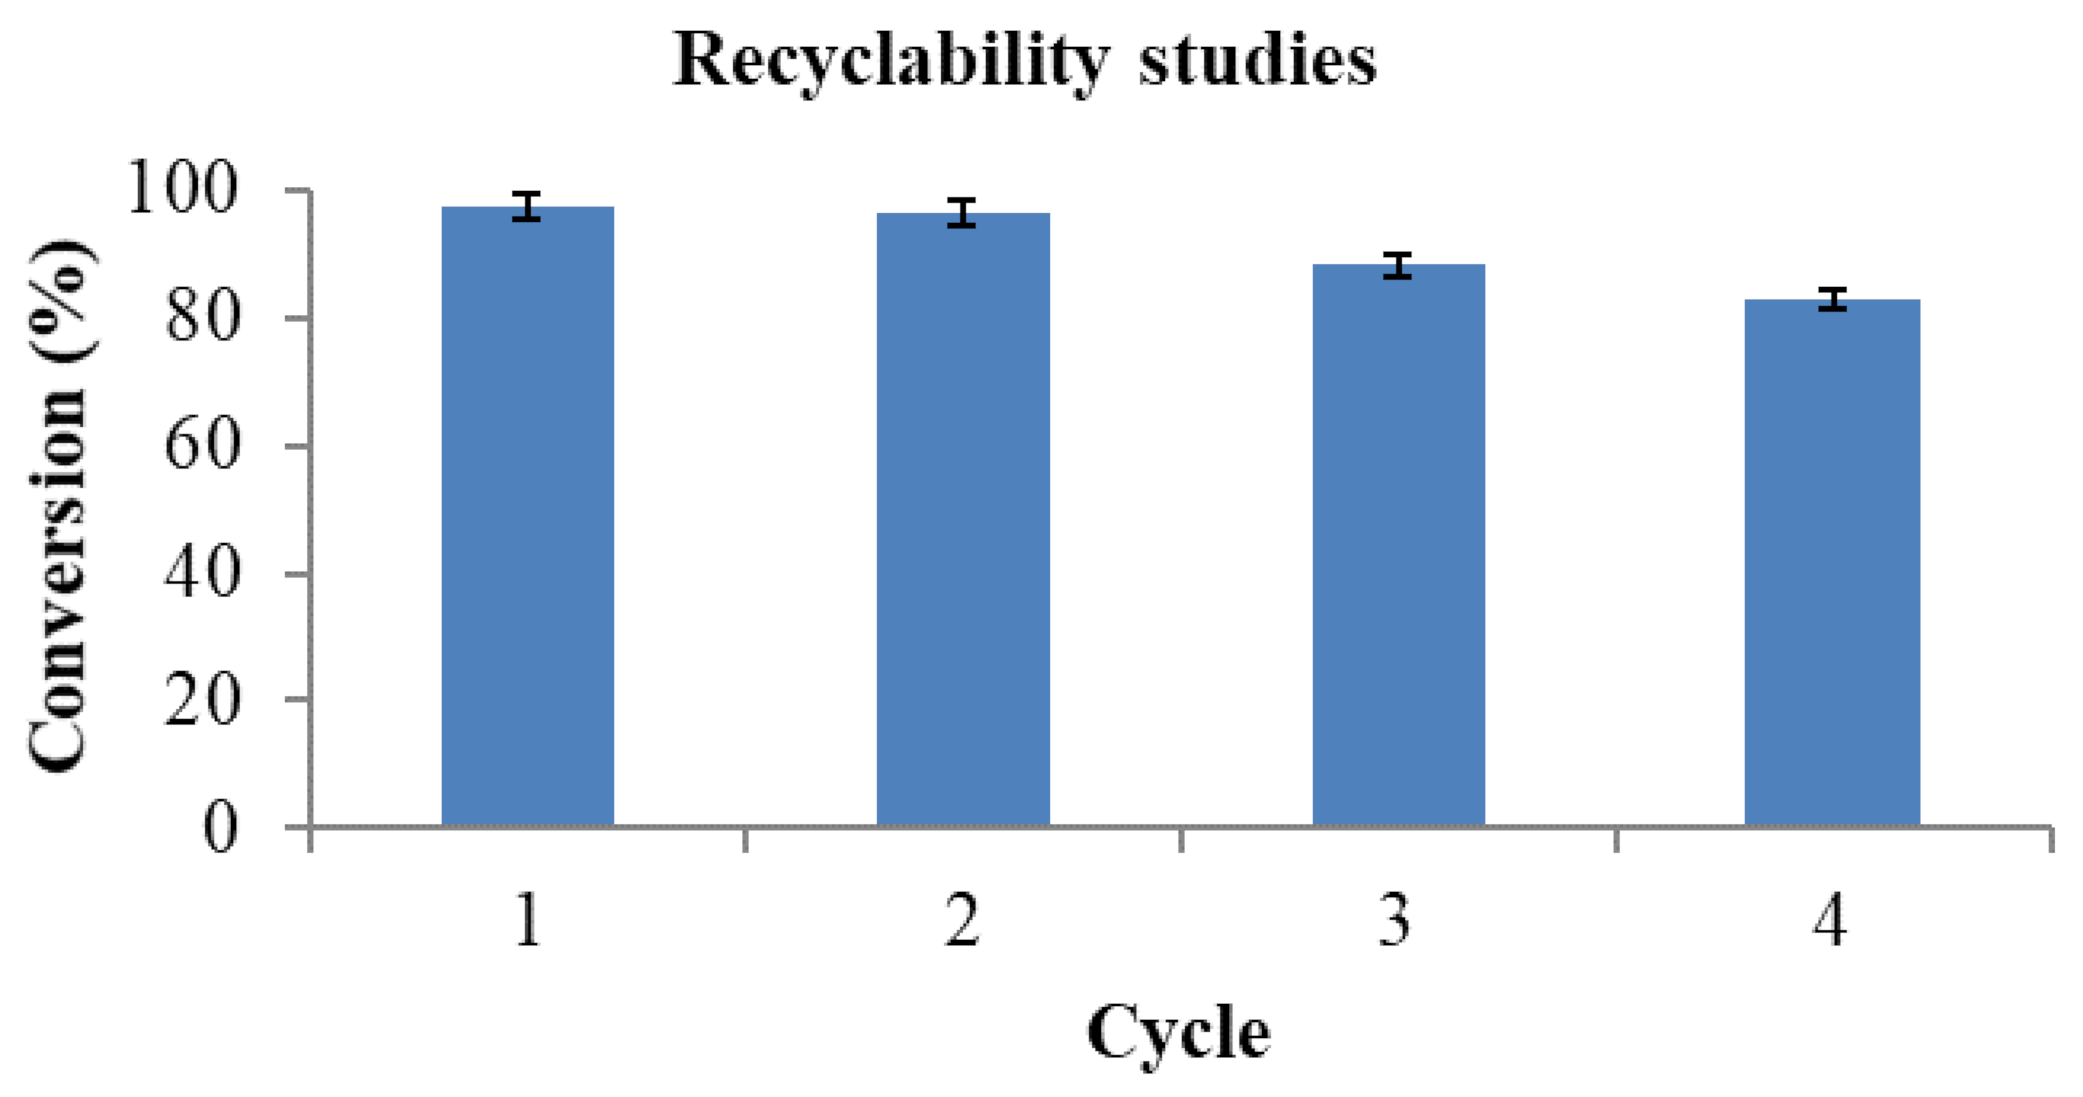
The stability of the pre-catalyst C1 was examined by conducting recyclability studies under optimized conditions. After stopping the reaction, the catalysis mixture was dissolved in ethanol and dried in a Schlenk tube under vacuum at 110 °C. Ethanol was added in the reactor vessel and dried under vacuum. The reactor vessel was recharged with furfural (2.4 mmol), hydrogen gas (45 bar), temperature (140 °C), and ethanol (5 mL). The reaction mixture was heated at 140 °C for 24 h and the procedure was repeated until the fourth cycle. The pre-catalyst C1 displayed excellent recyclability (Figure 11) and could be recycled efficiently three times without significant loss in activity. However, in the fourth cycle, a decrease in FF conversion was observed, which could be due to the partial decomposition of the active species during the reaction.

2.10. Recyclability Studies of Supported Pre-Catalysts Si-1 and Si-2

Recyclability test was performed using supported pre-catalysts Si-1 and pre-catalyst Si-2. Upon completion of the reaction, DMF was added as the internal standard and a sample was taken from the mixture for analysis. The crude mixture was filtered using gravity filtration followed by washing with ethanol five times, making sure that all the furfural was washed away. The pre-catalyst Si-1 was dried using an oven at 30 °C overnight and re-used for the next cycle. The same procedure was repeated four times. Both pre-catalysts Si-1 and Si-2 were still active even on the fourth cycle, however, the FF conversion decreased gradually from the first cycle (69%) to the fourth (32%) for pre-catalyst Si-1 and 61% to 40% for pre-catalyst Si-2 (Figures S19 and 20). The decrease in catalyst activity could be attributed to catalyst loss during the separation of products from the catalyst. The pre-catalyst Si-2 can be better recycled compared to Si-1, which was observed from the obtained results.

2.11. Catalytic Transfer Hydrogenation of Furfural

Catalytic transfer hydrogenation is considered less expensive compared to direct hydrogenation [30]. Transfer hydrogenation helps in reducing production costs by using organic molecules as hydrogen donors instead of molecular hydrogen. This makes transfer hydrogenation safer because there is no use of expensive molecular hydrogen, which also needs safe handling. Different parameters of the reaction system such as catalyst loading, different bases, reaction time, and temperature were investigated. Based on the previous experimental results obtained in the direct hydrogenation of FF, pre-catalyst C1 and C4 were chosen as the best performing catalysts and these were evaluated as pre-catalysts for the catalytic transfer hydrogenation of FF using formic acid as a hydrogen source.
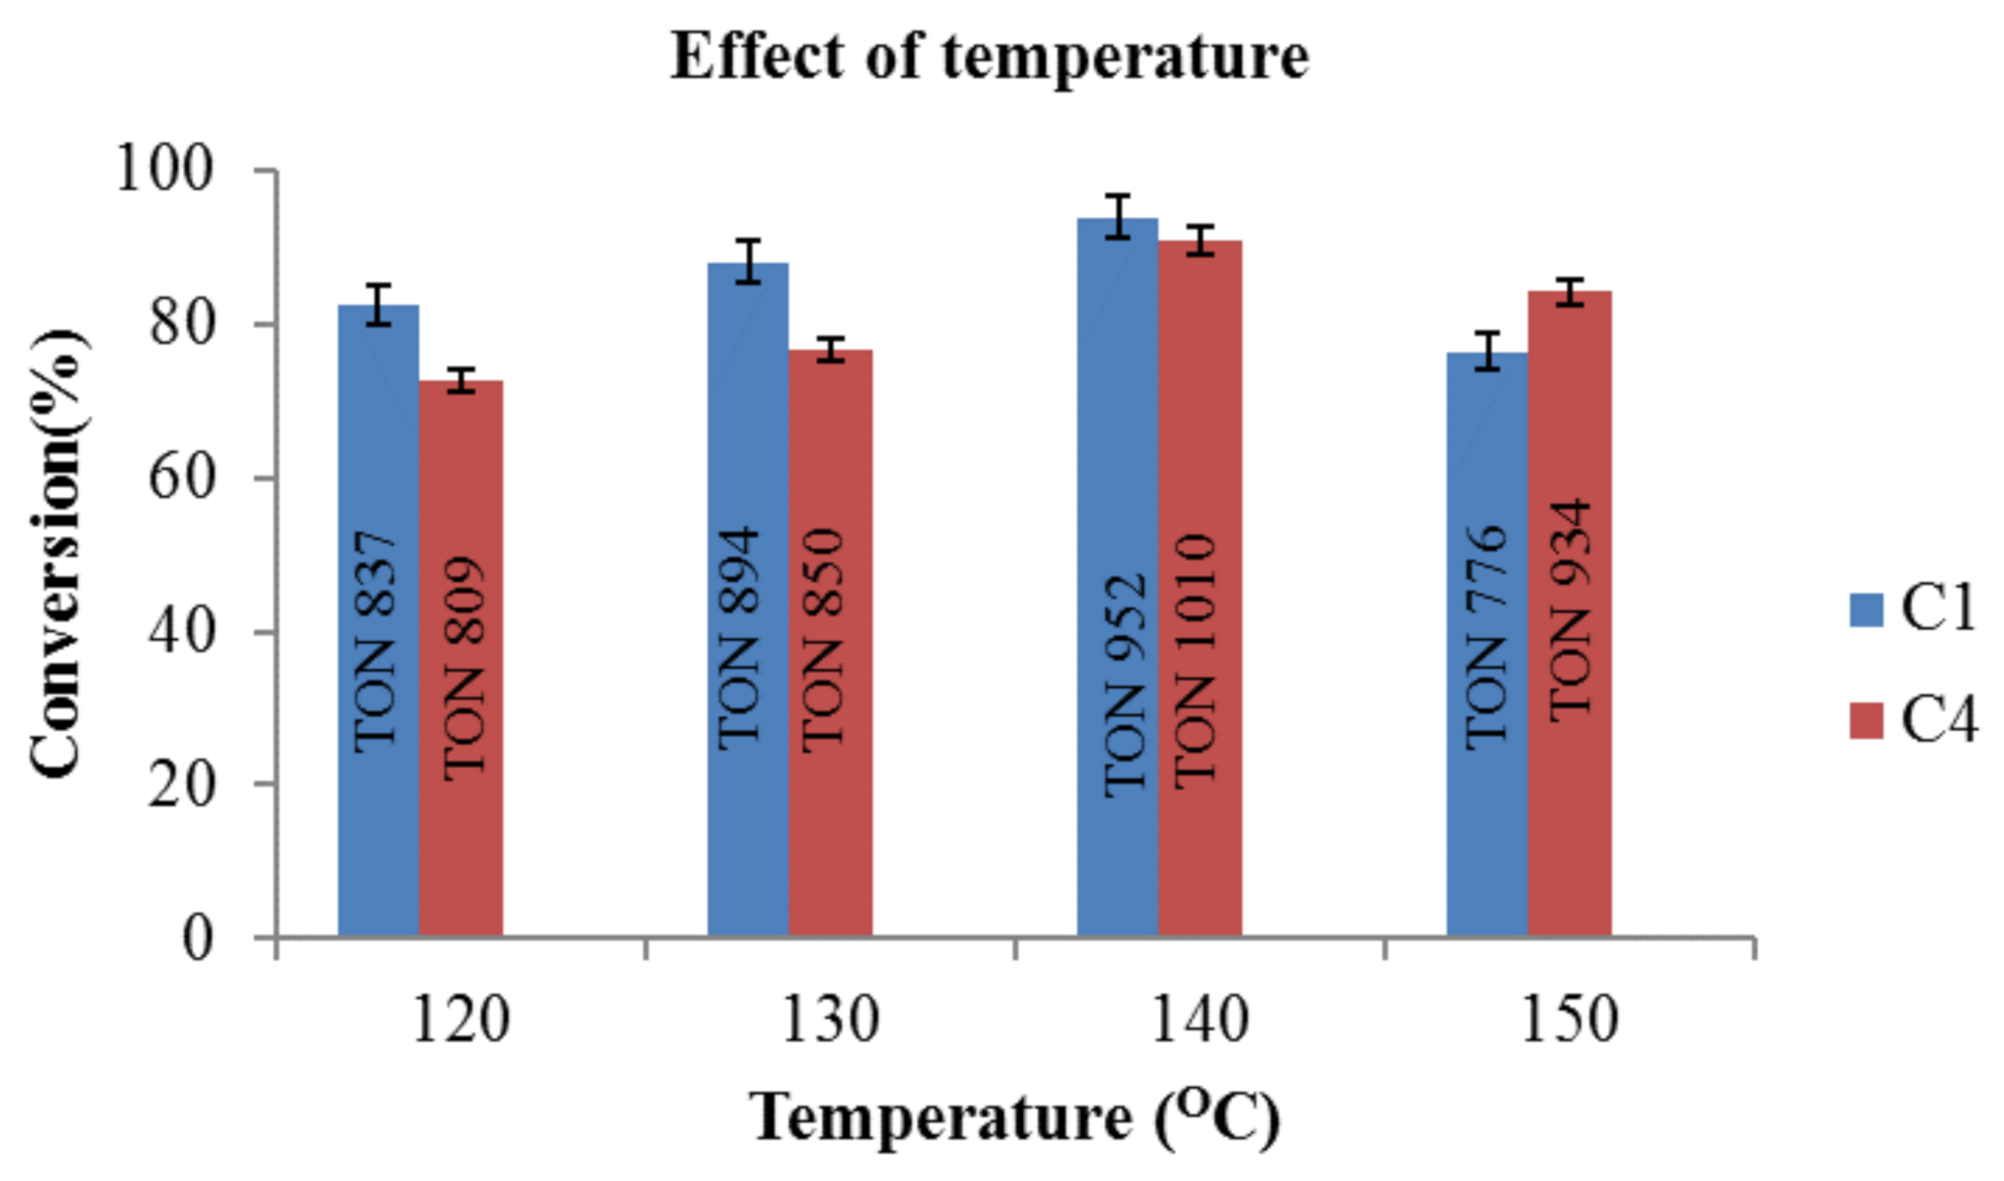
The reaction was performed using 0.05 mol% of complex C1 and C4 as pre-catalysts at different temperatures ranging from 120–140 °C (Figure 12). Both pre-catalysts showed an increase in furfural conversion as the temperature increased up to 140 °C where pre-catalyst C1 and C4 showed FF conversion of 93% and 90%, respectively. An increase in temperature to 150 °C gave less furfural conversion, which might be due to both catalysts being unstable at high temperatures when formic acid is used as the hydrogen source. The selectivity for both pre-catalysts was 100% toward FA. As a result, 140 °C was selected as the best temperature.
Optimization of the bases was performed using 1 equivalent of each of the bases at 140 °C, among the screened organic bases (Et3N, DBU, and pyridine) and inorganic base (KOH), only Et3N and DBU showed activity in the hydrogenation of FF (Figure S20). With 1 molar equivalent of Et3N, 93% FF conversion was obtained with a TON of 1859 when pre-catalyst C1 was used and pre-catalyst C4 gave 90% FF conversion with a TON of 1798. On the other hand, 1 molar equivalent of DBU also gave high conversion of FF (77% and 72%) for pre-catalyst C1 and C4, respectively. However, no product was obtained for both pre-catalysts when the reaction was performed in the presence of one equivalent of an organic base pyridine and inorganic base KOH. This might have been due to the potential of KOH and pyridine acting as coordinating bases, resulting in inhibition of the catalytic reaction. This can be due to the available nitrogen lone pair in pyridine, which might have coordinated and also in KOH, the oxygen atom in OH is known as a strong electron donor due to its available lone pair of electrons, the K+ cations might have coordinated with other groups. These types of interactions have been reported in the literature by Fernandez and co-workers when they employed PVA-KOH in structural modifications and ionic transport used for hydrogels in Zn/Air batteries [31]. Pre-catalysts C1 and C4 both displayed 100% selectivity toward FA and the results showed that both pre-catalysts C1 and C4 performed better with Et3N, therefore Et3N was used for all subsequent reactions.
To investigate the effect of base concentration on the catalytic reactions, Et3N in variable amounts (0 to 10 mmol) was utilized and no FF conversion was observed. It is important to note that in the absence of a base, no conversions were observed, which indicated that a base is required for the decomposition of formic acid into H2 and CO2 [32]. With 0.3 molar equivalent (3.3 mmol) of Et3N, 86% FF conversion was obtained using pre-catalyst C1 (Figure S21). No FF conversions were observed when pre-catalyst C4 was employed, which might be due to insufficient base present to produce H2 gas. Increasing the base to 5.0 mmol for pre-catalyst C1, the FF conversion remained as high as 86% whilst with pre-catalyst C4, the FF conversion increased to 78%, indicating the importance of sufficient base in the catalytic process. Further increase of the base to 1 molar equivalent (10 mmol) saw the FF conversion increased to 93% with a TON of 1737 and 90% with a TON of 1729 for pre-catalysts C1 and C4, respectively, based on the experimental results, the obtained 10 mmol of Et3N was chosen as the optimum base concentration.
The catalyst loading variation (0.05 mol%–2 mol%) was performed at a fixed temperature of 140 °C for 4 h in the presence of formic acid (Figure S22). The study revealed that as catalyst loading increased, there was a slight increase in FF conversion. Pre-catalyst C1 gave a TON of 1859 and C4 gave a TON of 1797, both pre-catalysts showed 100% selectivity to FA. The results obtained from the study indicated that transfer hydrogenation of FF was more efficient as it required lower catalyst loading in the absence of molecular hydrogen, which makes the production less expensive compared to the hydrogenation of FF using molecular hydrogen where higher catalyst loading was required.
The effect of reaction time was also investigated between 4 h and 12 h (Figure S23). It was observed that after 4 h, both pre-catalysts C1 and C4 did not show any significant increase in FF conversion. After 4 h, the same conversion was produced even when the reaction continued beyond 4 h.
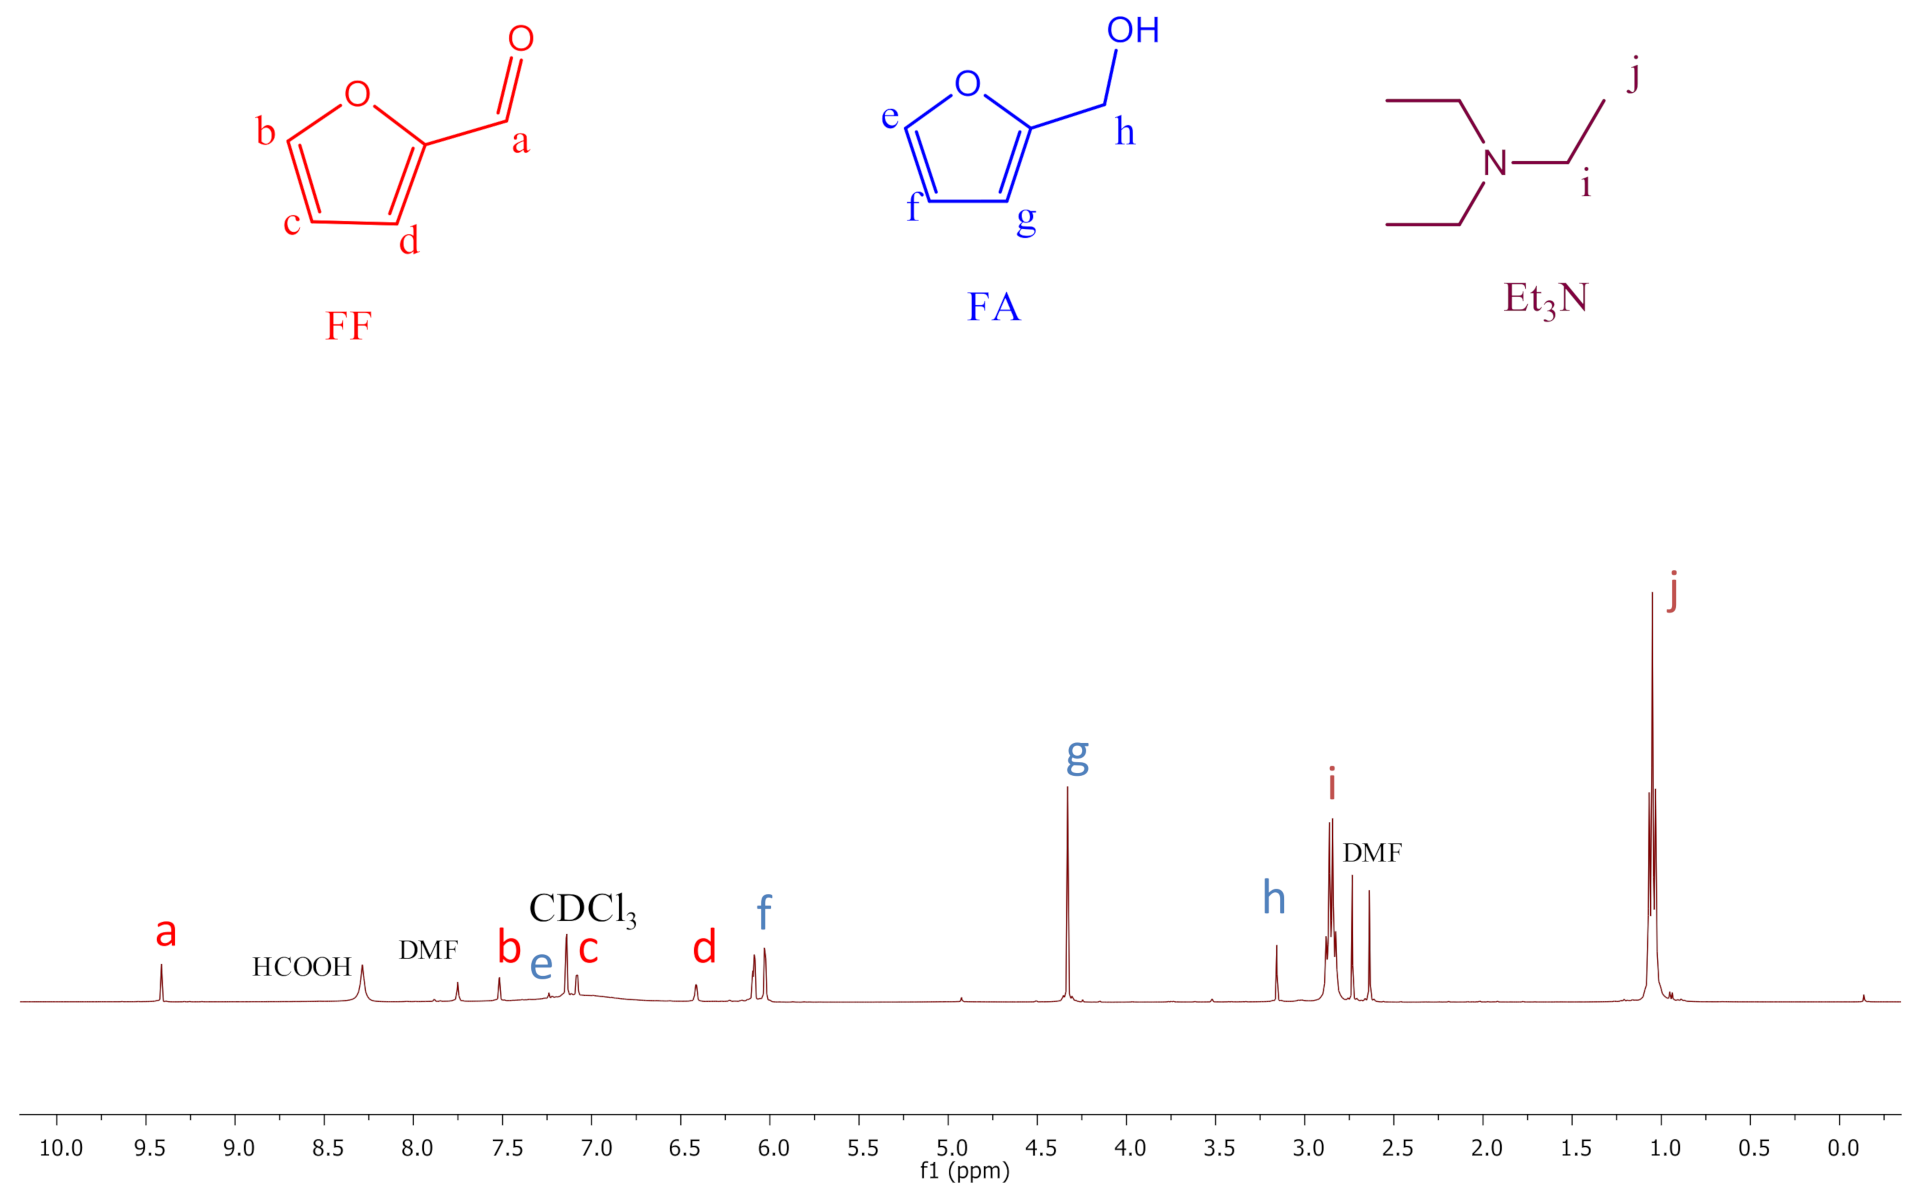
The 1H NMR spectrum of a sample from the reaction mixture is shown in Figure 13. The reaction mixture was also spiked with DMF as the internal standard.
The 1H NMR spectrum in Figure 12 showed that the pre-catalyst C1 was active in the transfer hydrogenation of FF to FA using formic acid as the hydrogen donor in the presence of the Et3N base. The spectrum also showed unreacted FF after the reaction, indicating that the pre-catalyst C1 did not completely convert FF. However, it is a good catalyst because it is able to convert FF to FA selectively.

2.12. Homogeneity Test

The homogeneity of the pre-catalysts C1 and C4 in the catalytic transfer of FF was determined using the mercury poisoning experiment [29]. The reaction was promoted by the molecular catalyst when pre-catalyst C1 (Figure S24) was employed compared to pre-catalyst C4, which showed a slight decrease in FF conversion, indicating minute activity from Ni(0).

2.13. Recyclability Studies

The stability of the pre-catalyst C1 was examined by conducting recyclability studies under the optimum conditions (Figure S25). The FF conversion decreased gradually from 92% in the first cycle to 87% in the third cycle, then decreased drastically in the fourth cycle (56%), which might be due to partial decomposition of the active species with each cycle. Most important to note was that the selectivity remained 100% toward FA throughout the recycling experiments.

2.14. Catalytic Transfer Hydrogenation of Other Substrates

This study was done to investigate the specificity of pre-catalysts C1 and C4, whether the catalysts were selective toward the aldehyde or the ring. The reactions were performed cinnamaldehyde and 2-thiophenecarboxaldehyde under optimum conditions obtained in the previous experiment. Both pre-catalysts showed some activity in the transfer hydrogenation of cinnamaldehyde and 2-thiophenecarboxaldehyde (Table 3).
The cinnamaldehyde conversion was 85% and 80% with TONs of 1709 and 1590 when pre-catalyst C1 and C4 were employed, respectively, and both pre-catalysts were 100% selective to cinnamyl alcohol (CA). When the substrate was changed to 2-thiophenecarboxaldehyde, the conversion decreased to 69% and 60% with TONs of 1371 and 1204 for pre-catalysts C1 and C4, respectively, and both pre-catalysts were 100% selective to 2-thiophenemethanol. Using the results obtained in both direct and transfer hydrogenation of FF, it was observed that pre-catalysts C1 and C4 were active toward alpha-β unsaturated substrates and both pre-catalysts were selective and hence can be employed in the industry for large scale production of the desired product.
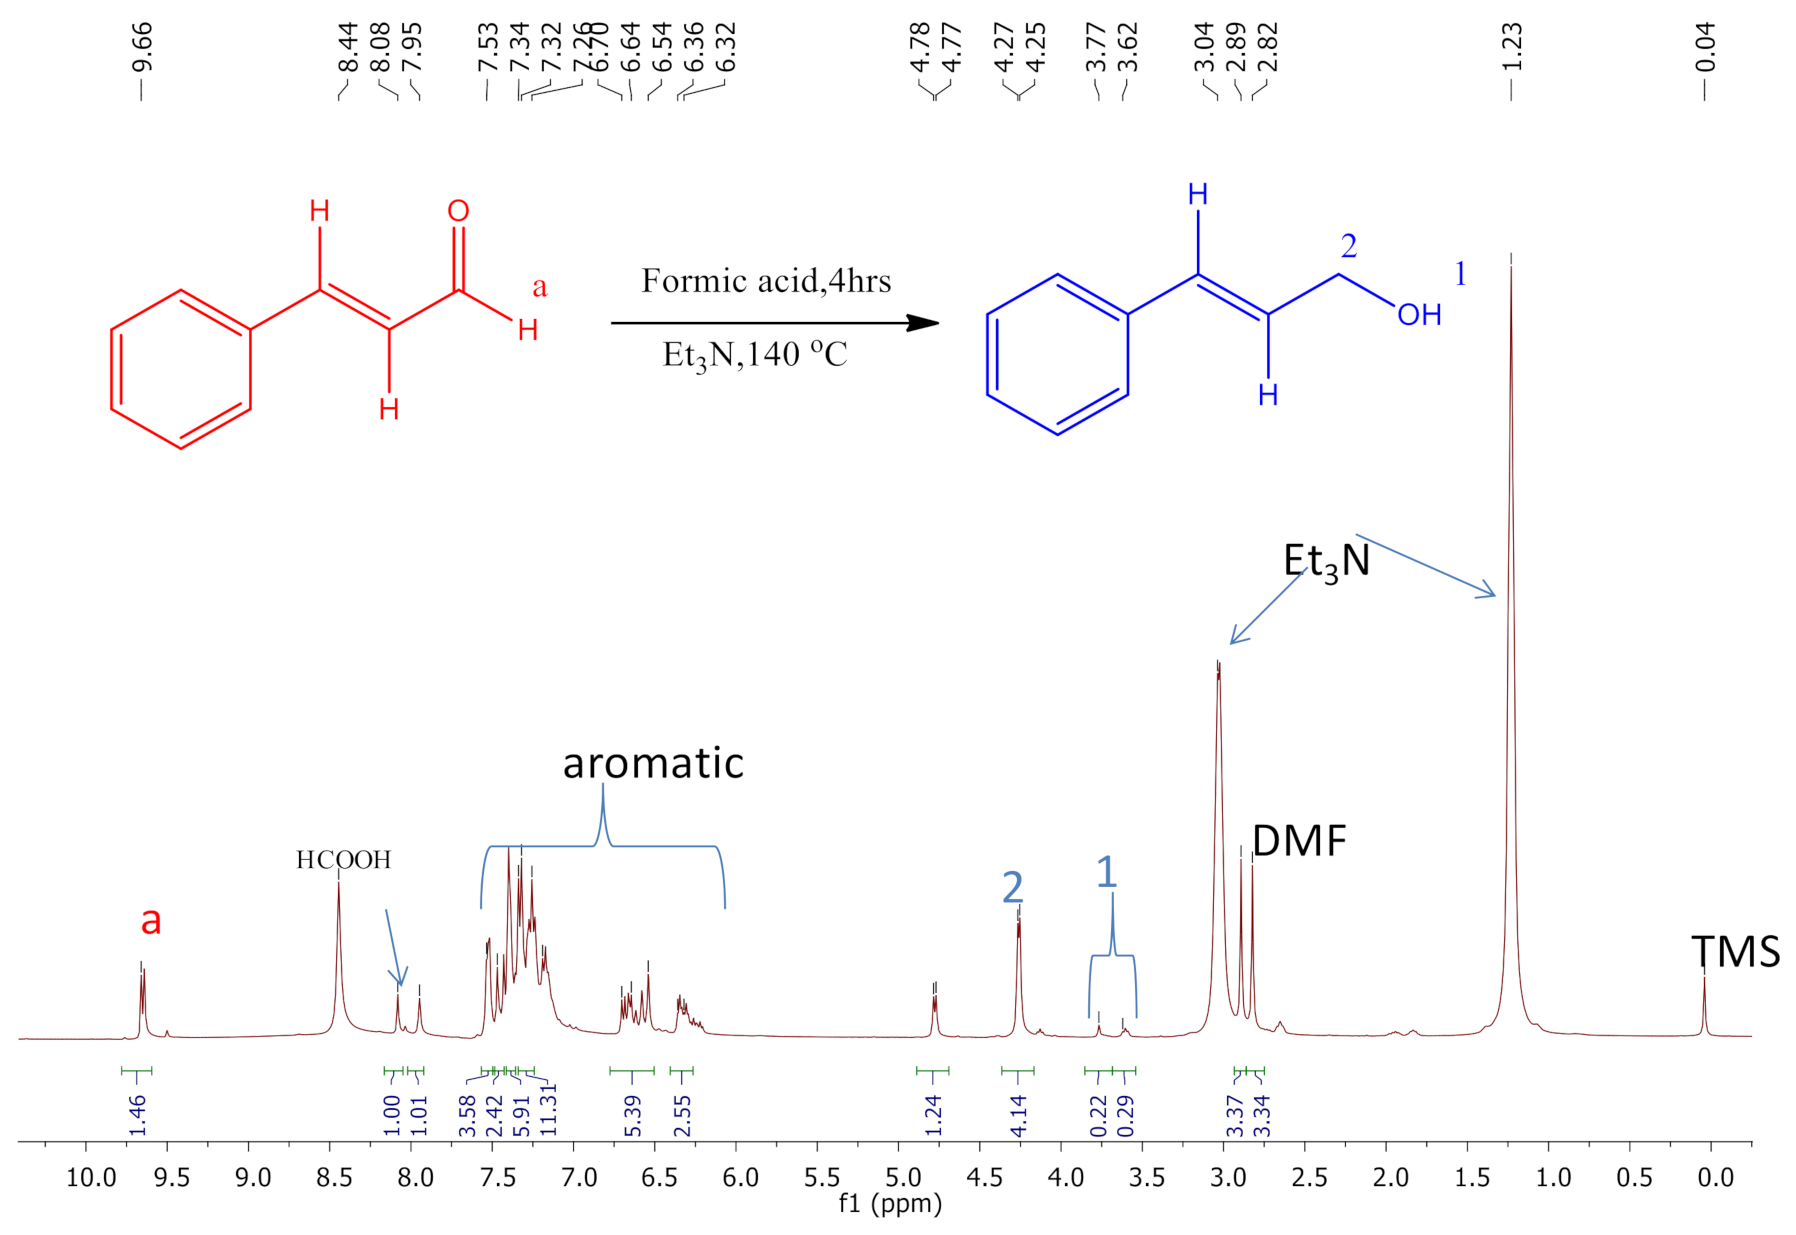
The 1H NMR spectrum of a sample from the hydrogenation of the cinnamaldehyde reaction mixture is shown in Figure 14. The reaction mixture was also spiked with DMF as an internal standard.
The 1H NMR spectrum (Figure 13) shows that the pre-catalyst C1 is active in the hydrogenation of cinnamaldehyde using formic acid as the hydrogen donor in the presence of Et3N. Using the obtained results, the pre-catalyst C1 is a good catalyst even with a different substrate due to the fact that the catalyst remained selective. However, it was observed that pre-catalyst C1 did not completely convert the cinnamaldehyde shown by the presence of unreacted cinnamaldehyde. The conversion was 85% with a TON of 1709, and the selectivity was 100% to cinnamyl alcohol.
The 1H NMR spectrum (Figure S26) showed that the pre-catalyst C1 was active in the hydrogenation of 2-thiophenecarboxaldehyde using formic acid as the hydrogen donor in the presence of Et3N. The study displayed that pre-catalyst C1 was 100% selective to 2-thiophenemethanol, although the spectrum showed unreacted 2-thiophenecarboxaldehyde, indicating that pre-catalyst C1 did not completely convert the 2-thiophenecarboxaldehyde. The conversion was 69% in 4 h with a TON of 1371.

2.15. In Situ NMR Studies of the Catalytic Reactions

An attempt to establish the mechanism of the catalytic process was conducted by the use of in situ NMR experiments. In a typical experiment, the catalyst precursor (C1 or C4) was dissolved in MeOD-d4 solvent in the presence of formic acid and allowed to heat for a specific time. The reaction progress was monitored by using 1H NMR spectroscopy. However, no nickel hydride species was observed. In another experiment, the Ni pre-catalyst was dissolved in MeOD-d4, and formic acid and furfural were added to the NMR tube. This mixture was heated and the NMR sample analyzed, but unfortunately, no hydride species was observed for this experiment, which is the most likely active species for this hydrogenation reaction. The same was observed when CDCl3 was used as a NMR solvent.

3. Materials and Methods

All reactions were performed under inert conditions using standard Schlenk techniques. Nickel chloride hexahydrate [Ni(H2O)6Cl2], nickel acetate tetrahydrate [Ni(OAc)2·4H2O], bis(cyclopentadienyl)nickel(II), triphenylphosphine(PPh3), 2(diphenylphosphino)ethylamine, 2-aminophenol, salicyaldehyde, furfural (FF), 3(Iodopropyl)trimethoxysilane, and silica gel were all obtained from Sigma-Aldrich and used without purification. The solvents tetrahydrofuran (THF), ethanol (EtOH), methanol (MeOH), diethyl ether, and toluene were purchased from Sigma-Aldrich and dried using a MBRAUN SPS-800 solvent drying system before use. The metal precursor Ni(PPh3)2Cl2 was prepared according to a literature procedure [17]. The ligand L2 was synthesized as described in the literature. 1H NMR, 13C{1H} NMR, 31P{1H} NMR, and 29Si{1H} NMR spectra were recorded on a Bruker Ultrashield 500 MHz in CDCl3. Mass spectrometry (ESI) was recorded on a Waters Synapt G2 spectrometer. Elemental analyses were performed on a Thermo Scientific FLASH 2000 CHNS-O analyzer. All hydrogenation reactions were performed in high pressure reactor vessels fitted into a high pressure autoclave reactor with in-built heating, cooling, and stirring systems. Conversions of the hydrogenation products were determined by nuclear magnetic resonance spectroscopy on the Bruker Ultrashield 500 MHz.

3.1. Synthesis and Characterization of L1

Ligand L1 was prepared by following a modified synthetic procedure reported in the literature [17]. Sodium hydride (0.0052 g, 0.218 mmol) was added to 2-(diphenylphosphino)ethylamine (0.051 g, 0.218 mmol) dissolved in diethyl ether (10 mL) and stirred at room temperature for 1 h under argon. (3-Iodopropyl)trimethoxysilane (0.063 g, 0.218 mmol) was added to the reaction mixture and stirred for 48 h at room temperature under argon. The solvent was removed using vacuum under reduced pressure to afford colorless oil. Yield: (0.113 g, 75%). 31P{1H} NMR (500 MHz, CDCl3): δ = −21.95 ppm

3.2. Synthesis and Characterization of L2

Ligand L2 was prepared in a condensation reaction between 2-aminophenol (0.101 g, 0.926 mmol) and salicylaldehyde (0.129 g, 0.926 mmol) in ethanol (50 mL). The solution was refluxed for 24 h during which the color of the solution was changed from brown to orange. The solvent was removed by rotary evaporation to afford an orange crystalline solid [18]. Yield: (0.168 g, 87%). Mp: 187–189 °C. 1H NMR (400 MHz, CDCl3): (δ, ppm) 12.28 (s, 1H, HOH), 8.68 (s, 1H, N=CHimine), 7.43 (t, 2H, HAr), 7.25 (m, 1H, HAr) 7.16 (d, 1H, HAr), 7.13 (m, 4H, HAr). 13C{1H} NMR (100 MHz, CDCl3): (δ, ppm) 163.85, 160.66 (N=CH), 149.95, 136.04, 133.65, 132.84, 128.81, 121.58, 119.48, 118.18, 117.08, 115.76. FTIR (vmax: cm−1) at v = 1625 cm−1 (C=N str.), Elemental analysis (%): Calculated for C13H11NO2: C, 73.23; H, 5.20; N, 6.57, Found: C, 73.63; H, 4.76; N, 5.65, High resolution ESI-MS (Stellenbosch, South Africa. (positive): m/z =214.0863 for [M + H]]+.

3.3. Synthesis of and Characterization of Complex C1

The nickel precursor [NiCl2(PPh3)2] (0.908 g, 1.388 mmol) was dissolved in THF (60 mL) under argon. To this was added Bis(cyclopentadienyl) nickel(II) (0.262 g, 1.388 mmol) and the reaction was left to stir under reflux at 60 °C for 6 h. The solvent was removed using vacuum under reduced pressure and the residue dissolved in hot benzene (5 mL), followed by recrystallization of the benzene filtrate in hexane (30 mL) at 0 °C to afford red purple crystals [17]. Yield: (1.098 g, 82%), Mp: 168–170 °C, 1H NMR (500MHz, CDCl3): (δ, ppm) 7.81 (m, 6H, HAr), 7.26 (m, 9H, HAr), 5.10 (s, 5H, Hcp). 31P{1H} NMR CDCl3, 28.88 ppm. 13C{1H} NMR (100 MHz, CDCl3): (δ, ppm) 134.19, 132.23, 130.62, 128.53, 94.66. Elemental analysis (%): Calculated for C24H23ClNiP: C, 66.03; H, 5.31, Found: C, 65.61; H, 4.59. High resolution ESI-MS (positive): m/z = 385.0657 for [M-Cl+ H]+.

3.4. Synthesis and Characterization of Complexes C2 and Si-1

L1 (0.318 g: 0.812 mmol) was dissolved in ethanol (20 mL) and transferred to a round bottomed flask. To the stirring ligand L1 was added nickel chloride hexahydrate (0.096 g, 0.404 mmol) dissolved in ethanol (30 mL) and the mixture was refluxed for 3 h at 75 °C under argon. The solvent was removed using vacuum under reduced pressure to afford a green oil (compound (i)). Added to the flask was nickelocene (0.156 g, 0.812 mmol) dissolved in tetrahydrofuran (40 mL) and refluxed for 24 h at 60 °C under argon. The solvent was removed under reduced pressure to afford a brown oily product (C2). Yield: (0.564 g, 69%). 31P{1H} NMR, (500MHz, CDCl3): 34.00 ppm, 29Si{1H} NMR, (500MHz, CDCl3): −43.03 ppm. High resolution ESI-MS (positive): m/z =593.1252 for [M-H]-. Elemental analysis (%): Calculated for C28H44ClNNiO3PSi: C, 69.96; H, 4.55; N, 2.63, Found: C, 71.07; H, 4.57; N, 2.45.
The complex C2 was modified with silica gel to obtain complex Si-1 [19]. C2 (0.0175 g, 0.0285 mmol) was dissolved in dry toluene (40 mL) and stirred for 10 min. Added to the solution was silica gel (0.0224 g, 0.332 mmol) and the reaction mixture was refluxed at 100 °C under dry argon atmosphere for 72 h. The solid phase was filtered using gravity filtration and washed with toluene:ethanol (1:1) and dried under vacuum at 30 °C for 24 h to afford a brown powder. Yield: (0.0275 g, 71%).

3.5. Synthesis and Characterization of Complex C4

Nickel acetate (0.0868 g, 0.349 mmol) and triphenylphosphine (0.0915 g, 0.349 mmol) dissolved in methanol (40 mL) was stirred for 15 min. To this added was Ligand L2 (0.0746 g, 0.349 mmol) and the mixture was refluxed at 80 °C for 2 h under argon. A brown precipitate formed, which was filtered using a Buchner funnel and dried under vacuum to afford the product as a brown crystalline solid [20]. Yield: (0.281 g, 75%). 1H NMR (400 MHz, CDCl3): (δ, ppm) 8.49 (d, 1H, N=CHimine), 7.85 (t, 5H, HAr), 7.70 (d, 1H, HAr), 7.42 (m,10H, HAr) 7.05 (t, 1H, HAr), 7.03 (t, 1H, HAr), 6.68 (m, 3H, HAr), 6.2 (d,1H, HAr), 13C{1H} NMR (100 MHz, CDCl3): (δ, ppm) 166.28, 163.19, 148.28, 139.13, 134.67, 132.77, 130.44, 128.33, 128.30, 121.78, 120.72, 118.13, 115.60, 114.39, 114.04. 31P{1H} NMR: δ = 14.97ppm. Elemental analysis (%): Calculated for C31H24NNiO2P: C, 57.57; H, 8.05; N, 2.24, Found: C, 58.69; H, 7.29; N, 1.66, FTIR (Vmax: cm−1): at v = 1606cm−1 (HC=N).

3.6. Synthesis and Characterization of Complexes C5 and Si-2

2(diphenylphosphino)ethylamine (0.122 g, 0.533 mmol) was dissolved in dry THF (50 mL) under argon. To this was added NaH (0.016 g, 0.533 mmol) and stirred at room temperature for 1 h. 3(Iodopropyl)trimethoxysilane (0.155 g, 0.533 mmol) was added to the reaction mixture and the solution was stirred at room temperature for 48 h. To this was added nickel acetate tetrahydrate (0.137 g, 0.533 mmol) and ligand L2 (0.213 g, 0.997 mmol), and the reaction mixture was stirred under reflux for 24 h. The solvent was removed using rotary evaporation and dried under vacuum to afford brown oil (C5) Yield: (0.332 g, 52%). 31P NMR (500 MHz, CDCl3): 31P{1H} NMR: 50.34ppm, 29Si NMR: δ= −21.35 ppm. FTIR (Vmax: cm−1): at v = 1573 cm−1 (HC=N str.), High resolution ESI-MS (negative): m/z = 694.7498 for [M+Cl-H], Elemental analysis (%): Calculated for C33H39N2NiO5PSi: C, 60.79; H, 6.56; N, 4.05, Found: C, 59.96; H, 5.02; N, 3.79.
The complex C5 was modified with silica gel to obtain complex Si−2 [19]. Into a round bottom flask containing 40 mL of dry toluene (0.0175 g, 0.0257 mmol) of C5 was added and the mixture was stirred for 10 min. To this was added 0.0224 g (0.332 mmol) of silica gel and the reaction mixture was refluxed at 100 °C under an argon atmosphere for 72 h [19]. The solid phase was filtered using gravity filtration and washed with toluene:ethanol (1:1) and dried under vacuum at 30 °C for 24 h to afford a yellow powder. Yield: (0.0351 g, 87%). FTIR (Vmax: cm−1) at v =1558 cm−1 (HC=N str.).

3.7. Catalytic Tests

3.7.1. Hydrogenation of FF under Hydrogen Atmosphere

Direct hydrogenation of furfural was carried out in a 60 mL stainless autoclave reactor equipped with a pressure gauge, an electric temperature controller, and a mechanical stirrer. For a typical experiment catalyst (0.06 mmol), furfural (2.4 mmol), and solvent (5 mL) were introduced into the reactor. The sealed autoclave was pressured to the desired pressure, the appropriate temperature was set, and the reaction conducted at a stirring speed of 800 rpm. At the end of the reaction, the reactor was cooled and slowly depressurized. 1H NMR spectroscopy was used to determine the conversion and product selectivity.

3.7.2. Transfer Hydrogenation Using a Hydrogen Carrier (Formic Acid)

Catalyst (0.005 mmol), triethylamine (10 mmol), formic acid (20 mmol), and furfural (10 mmol) were added to an autoclave reactor (50 mL). The mixture was purged three times with nitrogen gas and then heated to the desired temperature. The reaction was conducted at a stirring speed of 800 rpm for the desired reaction time. At the end of the reaction, the reactor was cooled and excess gas released. 1H NMR spectroscopy was used to determine the conversion and product selectivity. The conversion of FF was calculated as follows:
Conversion of FF (%) = (nF0nF)/nF0 × 100
where nF0 is the initial mole of FF and nF is moles of FF in the reaction mixture.

4. Conclusions

In summary, six Ni(II) pre-catalysts were synthesized and characterized using various spectroscopic and analytical techniques. All the complexes were active for a reduction of FF under hydrogen atmosphere. Pre-catalysts C1 and C4 showed excellent catalytic activity and all the pre-catalysts showed selectivity toward formation of furfuryl alcohol. Mercury poisoning tests showed that pre-catalyst C1 exhibited a drop in activity as a result of nanoparticles present, indicating that the catalytic reaction was a result of both homogenous and nanoparticle activity and pre-catalyst C4 exhibited a slight drop in activity due to nanoparticles, indicating that the catalytic reaction was mostly homogenous. The reaction was entirely homogenous when pre-catalysts C2 and C5 were employed. Recyclability experiments were performed using pre-catalysts C1, Si-1, and Si-2 and the results showed good recyclability when pre-catalysts C1 and C6 were employed. The pre-catalysts C1 and C4 showed greater activity for the hydrogenation of FF using formic acid as a hydrogen donor with good selectivity to furfuryl alcohol and reactions were complete in 4 h. Pre-catalysts C1 and C4 showed activity toward alpha-β unsaturated substrates and were selective to the saturation of the carbonyl functionality over alkene groups.

Supplementary Materials

The following are available online at https://www.mdpi.com/article/10.3390/catal11060684/s1, Figure S1 31P{1H} NMR spectrum for ligand L1 in CDCl3 (500 MHz), Figure S2 Infrared spectrum of ligand L2, Figure S2b. Mass spectrum of L2, Figure S3 31P{1H} NMR of complex C1 in CDCl3 (500 MHz), Figure S4 31P{1H} NMR spectrum of complex C2 in CDCl3 (500 MHz), Figure S5 Mass spectrum of complex C2, Figure S6 31P{1H} NMR for complex C4 in CDCl3 (500 MHz), Figure S7 31P{1H} NMR spectrum of complex C5, Figure S8 29Si NMR spectrum of complex C5, Figure S9 IR spectrum of complex C4, Figure S10 Infrared spectrum of complex C5, Figure S11 FT-IR spectra of silica gel (bottom), supported schiff base complex C6 (top), Table S1. The surface properties of silica gel and Ni (II) anchored catalysts C3 and C6, Figure S12. EDX images of silica gel (a), Ni (II) supported half-sandwich complex C3 (b) and schiff base complex C6 (c), Figure S13 EDX images showing Ni mapping on the supported half-sandwich complex C3 (a) and Schiff base complex C6 (b), Figure S14. Effect of temperature in the hydrogenation of FF, Figure S15. Effect of catalyst loading in the hydrogenation of FF, Figure S16. Effect of time in the hydrogenation of FF, Figure S17. Homogeneity test during the hydrogenation of FF to FA using pre-catalysts (C1, C2, C4, C5), Figure S18. Recyclability of pre-catalyst Si-1, Figure S19. Recyclability of pre-catalyst Si-2, Figure S20. Effect of base in the catalytic transfer hydrogenation of FF, Figure S21. Effect of base concentration in the catalytic transfer hydrogenation of FF, Figure S22. Effect of catalyst loading in the catalytic transfer hydrogenation of FF, Figure S23. Conversion as a function of time in the catalytic transfer hydrogenation of FF, Table S2 Results of TON and TOF versus time obtained from catalytic transfer hydrogenation of FF, Figure S24. Homogeneity test in the catalytic transfer hydrogenation of FF using pre-catalysts C1 and C4, Figure S25. Recyclability of precatalyst C1, Figure S26. 1H NMR spectrum of the transfer hydrogenation of 2-thiophenecarboxaldehyde to 2-thiophenemethanol using pre-catalyst C1 in CDCl3, DMF internal standard (500 MHz).

Author Contributions

Conceptualization, B.C.E.M. and L.C.M.; Methodology, B.C.E.M. and L.C.M.; Validation, M.K., L.C.M., B.C.E.M., M.K. and L.C.M.; Formal analysis M.K.; Investigation, M.K.; Resources, B.C.E.M.; Data curation, M.K.; Writing—original draft preparation, M.K.; Writing—review and editing B.C.E.M., L.C.M. and M.K.; Visualization, L.C.M.; Supervision, B.C.E.M. and L.C.M.; Project administration, B.C.E.M.; Funding acquisition, B.C.E.M. All authors have read and agreed to the published version of the manuscript.

Funding

The Royal Society and the National Research Foundation (South Africa) funded this research.

Acknowledgments

We are also thankful to the University of Johannesburg for use of their NMR facilities.

Conflicts of Interest

There are no conflict of interest to declare.

References

  1. de Jong, W.; Marcotullio, G. Overview of Biorefineries based on Co-Production of Furfural, Existing Concepts and Novel Developments. Int. J. Chem. React. Eng. 2010, 8, 2–27. [Google Scholar] [CrossRef]
  2. Liu, L.; Lou, H.; Chen, M. Selective hydrogenation of furfural over Pt based and Pd based bimetallic catalysts supported on modified multiwalled carbon nanotubes (MWNT). Appl. Catal. A Gen. 2018, 550, 1–10. [Google Scholar] [CrossRef]
  3. Climent, M.J.; Corma, A.; Iborra, S. Conversion of biomass platform molecules into fuel additives and liquid hydrocarbon fuels. Green Chem. 2014, 16, 516. [Google Scholar] [CrossRef] [Green Version]
  4. Liu, L.; Chang, H.; Jameel, H.; Park, S. Furfural production from biomass pretreatment hydrolysate using vapor-releasing reactor system. Bioresour. Technol. 2018, 252, 165–171. [Google Scholar] [CrossRef] [PubMed]
  5. Christoph, R.; Schmidt, B.; Steinberner, U.; Dilla, W.; Karinen, R. Glycerol. Ullmann’s Encycl. Ind. Chem. 1998, 16, 67–82. [Google Scholar]
  6. de Jong, E.; Stichnothe, H.; Bell, G.; Jørgensen, H. IEA Bioenergy Task 42–Bio-Based Chemicals: A 2020 Update; IEA Bioenergy: Paris, France, 2020; pp. 110–123. [Google Scholar]
  7. Taylor, M.J.; Jiang, L.; Reichert, J.; Papageorgiou, A.C.; Beaumont, S.K.; Wilson, K.; Lee, A.F.; Barth, J.V.; Kyriakou, G. Catalytic Hydrogenation and Hydrodeoxygenation of Furfural over Pt(111): A Model System for the Rational Design and Operation of Practical Biomass Conversion Catalysts. J. Phys. Chem. C 2017, 121, 8490–8497. [Google Scholar] [CrossRef] [PubMed]
  8. Hu, F.; Wang, Y.; Xu, S.; Zhang, Z.; Chen, Y.; Fan, J.; Yuan, H.; Gao, L.; Xiao, G. Efficient and Selective Ni/Al2O3–C Catalyst Derived from Metal–Organic Frameworks for the Hydrogenation of Furfural to Furfuryl Alcohol. Catal. Lett. 2019, 149, 2158–2168. [Google Scholar] [CrossRef]
  9. Zhang, W.; Zhu, Y.; Niu, S.; Li, Y. A study of furfural decarbonylation on K-doped Pd/Al2O3 catalysts. J. Mol. Catal. A Chem. 2011, 335, 71–81. [Google Scholar] [CrossRef]
  10. Li, C.; Xu, G.; Liu, X.; Zhang, Y.; Fu, Y. Hydrogenation of Biomass-Derived Furfural to Tetrahydrofurfuryl Alcohol over Hydroxyapatite-Supported Pd Catalyst under Mild Conditions. Ind. Eng. Chem. Res. 2017, 56, 8843–8849. [Google Scholar] [CrossRef]
  11. Wang, S.; Vorotnikov, V.; Vlachos, D.G. Coverage-Induced Conformational Effects on Activity and Selectivity: Hydrogenation and Decarbonylation of Furfural on Pd(111). ACS Catal. 2015, 5, 104–112. [Google Scholar] [CrossRef] [Green Version]
  12. Moyo, P.S.; Matsinha, L.C.; Makhubela, B.C.E. Pd(II) and Pt(II) catalysed selective synthesis of furfuryl alcohol: Solvent effects and insights into the mechanism. J. Organomet. Chem. 2020, 922, 121362. [Google Scholar] [CrossRef]
  13. Guerrero-Torres, A.; Jiménez-Gómez, C.P.; Cecilia, J.A.; García-Sancho, C.; Franco, F.; Quirante-Sánchez, J.J.; Maireles-Torres, P. Ni supported on sepiolite catalysts for the hydrogenation of furfural to value-added chemicals: Influence of the synthesis method on the catalytic performance. Top. Catal. 2019, 62, 535–550. [Google Scholar] [CrossRef]
  14. MacIntosh, K.L.; Beaumont, S.K. Nickel-Catalysed Vapour-Phase Hydrogenation of Furfural, Insights into Reactivity and Deactivation. Top. Catal. 2020, 23, 122–151. [Google Scholar]
  15. Giorgianni, G.; Abate, S.; Centi, G.; Perathoner, S.; van Beuzekom, S.; Soo-Tang, S.H.; van der Waal, J.C. Effect of the Solvent in Enhancing the Selectivity to Furan Derivatives in the Catalytic Hydrogenation of Furfural. ACS Sustain. Chem. Eng. 2018, 6, 16235–16247. [Google Scholar] [CrossRef]
  16. Jia, P.; Lan, X.; Li, X.; Wang, T. Highly Active and Selective NiFe/SiO2 Bimetallic Catalyst with Optimized Solvent Effect for the Liquid-Phase Hydrogenation of Furfural to Furfuryl Alcohol. ACS Sustain. Chem. Eng. 2018, 6, 13287–13295. [Google Scholar] [CrossRef]
  17. Barnett, K.W. Nickel complexes with organic and phosphorus ligands: An integrated set of inorganic experiments. J. Chem. Educ. 1974, 51, 300–422. [Google Scholar] [CrossRef]
  18. Sobola, A.O.; Watkins, G.M. Antimicrobial activity and Cu(II) complexes of Schiff bases derived from ortho-aminophenol and salicylaldehyde derivatives. J. Chem. Pharm. Res. 2013, 5, 147–154. [Google Scholar]
  19. Kursunlu, A.N.; Guler, E.; Dumrul, H.; Kocyigit, O.; Gubbuk, I.H. Chemical modification of silica gel with synthesized new Schiff base derivatives and sorption studies of cobalt (II) and nickel (II). Appl. Surf. Sci. 2009, 255, 8798–8803. [Google Scholar] [CrossRef]
  20. Kianfar, A.H.; Farrokhpour, H.; Dehghani, P.; Khavasi, H.R. Experimental and theoretical spectroscopic study and structural determination of nickel(II) tridentate Schiff base complexes. Spectrochim. Acta Part A Mol. Biomol. Spectrosc. 2015, 150, 220–229. [Google Scholar] [CrossRef]
  21. Kianfar, A.H.; Ebrahimi, M. Synthesis, characterization and structural determination of some nickel(II) complexes containing imido Schiff bases and substituted phosphine ligands. Spectrochim. Acta Part A Mol. Biomol. Spectrosc. 2013, 115, 725–729. [Google Scholar] [CrossRef]
  22. Leofanti, G.; Padovan, M.; Tozzola, G.; Venturelli, B. Surface area and pore texture of catalysts. Catal. Today 1998, 41, 207–219. [Google Scholar] [CrossRef]
  23. Shi, D.; Yang, Q.; Peterson, C.; Lamic-Humblot, A.-F.; Girardon, J.-S.; Griboval-Constant, A.; Stievano, L.; Sougrati, M.T.; Briois, V.; Bagot, P.A.J.; et al. Bimetallic Fe-Ni/SiO2 catalysts for furfural hydrogenation: Identification of the interplay between Fe and Ni during deposition-precipitation and thermal treatments. Catal. Today 2019, 334, 162–172. [Google Scholar] [CrossRef]
  24. Akinnawo, C.A.; Bingwa, N.; Meijboom, R. Surface properties vs activity of meso-ZrO2 catalyst in chemoselective Meerwein-Ponndorf-Verley reduction of citral: Effect of calcination temperature. Microporous Mesoporous Mater. 2021, 311, 110693–110721. [Google Scholar] [CrossRef]
  25. Dias, J.A.; Caliman, E.; Dias, S.C.L.; Paulo, M.; de Souza, A.T.C. Preparation and characterization of supported H3PW12O40 on silica gel: A potential catalyst for green chemistry processes. Catal. Today 2003, 85, 39–48. [Google Scholar] [CrossRef]
  26. Park, Y.; Kang, T.; Cho, Y.; Kim, P.; Park, J.; Yi, J. Finely-dispersed Ni/Cu catalysts supported on mesoporous silica for the hydrodechlorination of chlorinated hydrocarbons. Stud. Surf. Sci. Catal. 2003, 146, 637–640. [Google Scholar]
  27. Liu, L.; Lou, H.; Chen, M. Selective hydrogenation of furfural to tetrahydrofurfuryl alcohol over Ni/CNTs and bimetallic Cu-Ni/CNTs catalysts. Int. J. Hydrog. Energy 2016, 41, 14721–14731. [Google Scholar] [CrossRef]
  28. Puthiaraj, P.; Kim, K.; Ahn, W.-S. Catalytic transfer hydrogenation of bio-based furfural by palladium supported on nitrogen-doped porous carbon. Catal. Today 2019, 324, 49–58. [Google Scholar] [CrossRef]
  29. Crabtree, R.H. Resolving Heterogeneity Problems and Impurity Artifacts in Operationally Homogeneous Transition Metal Catalysts. Chem. Rev. 2012, 112, 1536–1554. [Google Scholar] [CrossRef]
  30. Villaverde, M.M.; Garetto, T.F.; Marchi, A.J. Liquid-phase transfer hydrogenation of furfural to furfuryl alcohol on Cu–Mg–Al catalysts. Catal. Commun. 2015, 58, 6–10. [Google Scholar] [CrossRef]
  31. Santos, F.; Tafur, J.P.; Abad, J.; Romero, A.J.F. Structural modifications and ionic transport of PVA-KOH hydrogels applied in Zn/Air batteries. J. Electroanal. Chem. 2019, 850, 113380–114392. [Google Scholar] [CrossRef]
  32. Fu, Z.; Wang, Z.; Lin, W.; Song, W.; Li, S. High efficient conversion of furfural to 2-methylfuran over Ni-Cu/Al2O3 catalyst with formic acid as a hydrogen donor. Appl. Catal. A Gen. 2017, 547, 248–255. [Google Scholar] [CrossRef]
Scheme 1. Synthesis of Ligand L1.
Catalysts 11 00684 sch001
Scheme 2. Synthesis of Ligand L2.
Catalysts 11 00684 sch002
Figure 1. 1H NMR spectrum of Ligand L2.
Catalysts 11 00684 g001
Scheme 3. Synthesis of complexes C1, C2, and Si-1.
Catalysts 11 00684 sch003
Figure 2. 1H NMR spectrum of complex C1.
Catalysts 11 00684 g002
Scheme 4. Synthesis of complexes C4, C5, and Si-2.
Catalysts 11 00684 sch004
Figure 3. 1H NMR spectrum of complex C4.
Catalysts 11 00684 g003
Figure 4. (a) N2 adsorption-desorption isotherms and (b) pore size distribution of the silica gel and Ni (II) complexes C3 and C6 supported on silica.
Catalysts 11 00684 g004
Figure 5. pXRD pattens of Ni (II) supported Schiff base complex Si-2 (top), supported half-sandwich complex Si-1 (middle) and silica gel (bottom).
Catalysts 11 00684 g005
Figure 6. TEM images of silica gel (a) Ni (II) supported half-sandwich complex C3 (b) and Schiff base complex C6 (c).
Catalysts 11 00684 g006
Figure 7. SEM images of silica gel (a) Ni(II) supported half-sandwich complex C3 (b) and Schiff base complex C6 (c).
Catalysts 11 00684 g007
Figure 8. Ni(II) O–N–O tridentate catalyst precursors (C1, C2, Si-1, C4, C5, Si-2).
Catalysts 11 00684 g008
Figure 9. The effect of hydrogen pressure in the hydrogenation of furfural using pre-catalysts C1 and C4. Conditions: ethanol (5 mL), substrate (FF, 2.4 mmol), for catalyst precursor complex C1 and C4 respectively, 0.06 mmol, time (24 h). Conversion and selectivity was determined by 1H NMR spectroscopy. Calculated standard deviations; C1: ±0.03, ±0.016, ±0.06, ±0.49; C4: ±0.69, ±0.26, ±0.19, ±0.39.
Catalysts 11 00684 g009
Figure 10. Hydrogenation of FF using all pre-catalysts.
Catalysts 11 00684 g010
Figure 11. Recyclability of pre-catalyst C1. Conditions: ethanol (5 mL), substrate (FF, 2.4 mmol), molecular hydrogen 45 bar, C1 (0.06 mmol), time (24 h). Conversion and selectivity was determined by 1H NMR spectroscopy. Calculated standard deviations; ±0.14, ±0.135, ±0.36, ±0.67.
Catalysts 11 00684 g011
Figure 12. Effect of temperature in the catalytic transfer hydrogenation of FF. Conditions: FF (10 mmol), Et3N (10 mmol), formic acid (20 mmol), catalyst precursors (C1 and C4; 0.05 mol%), time (4 h). Conversion determined by 1H NMR spectroscopy. Calculated standard deviations; C1: ±0.52, ±0.09, ±0.41, ±0.09; C4: ±0.03, ±0.27, ±0.70, ±0.075.
Catalysts 11 00684 g012
Figure 13. 1H NMR spectrum of the transfer hydrogenation of FF to FA using the pre-catalyst C1 in CDCl3, DMF internal standard (500 MHz). Conditions: substrate FF (10 mmol), Et3N (10 mmol), formic acid (20 mmol), catalyst precursor (C1; 0.05 mol%, 140 °C. Conversion determined by 1H NMR spectroscopy (500 MHz).
Catalysts 11 00684 g013
Figure 14. 1H NMR spectrum of the transfer hydrogenation of cinnamaldehyde to cinnamyl alcohol using pre-catalyst C1 in CDCl3, DMF internal standard (500 MHz). Conditions: substrate cinnamaldehyde (10 mmol), Et3N (10 mmol), formic acid (20 mmol), catalyst precursor (C1; 0.05 mol%, 140 °C, 4 h. Conversion determined by 1H NMR spectroscopy (500 MHz).
Catalysts 11 00684 g014
Table 1. Results obtained from hydrogenation of FF using different solvents.
EntryCatalyst PrecursorSolventConv. (%)TONTOFFA Sel. (%)
1C1/C4Water0---
2C1/C4Toluene0---
3C1Ethanol97.3146819100
4C4Ethanol96.5138618100
5C1Isopropanol75.2430113100
6C4Isopropanol74.229712100
Conditions: substrate (FF, 2.4 mmol), molecular hydrogen (45 bar, 40 bar) for catalyst precursor complex C1 and C4 respectively, 0.06 mmol, time (24 h). Conversion and selectivity was determined by 1H NMR spectroscopy. Calculate standard deviations; ±1.37, ±0.53, ±1.20, ±0.64, ±0.78, ±0.89.
Table 2. Results obtained from commercially available Ni complexes in the hydrogenation of FF using optimum conditions obtained from complex C1 and C4.
EntryNickel CatalystConv. (%)TONTOF
1NiCl2·6H2O26.07522
2Ni(OAc)2·4H2O38.49773
3NiCl2(PPh3)271.51743
42[PPh2ClNHSiO3]Ni67.4827011
Conditions: ethanol (5 mL), substrate (FF, 2.4 mmol), molecular hydrogen (45 bar, 40 bar), 0.06 mmol, time (24 h). Conversion and selectivity was determined by 1H NMR spectroscopy. Calculated standard deviations; ±0.04, ±0.64, ±0.48, ±0.14.
Table 3. Transfer hydrogenation of cinnamaldehyde and 2-thiophenecarboxaldehyde.
EntryComplexSubstrateConv. (%)TONTOFSelectivity
1C1cinnamaldehyde85.461709427Cinnamyl alcohol
2C4cinnamaldehyde79.521590398Cinnamyl alcohol
3C12-thiophenecarboxaldehyde68.5913713432-thiophenemethanol
4C42-thiophenecarboxaldehyde60.2212043012-thiophenemethanol
Publisher’s Note: MDPI stays neutral with regard to jurisdictional claims in published maps and institutional affiliations.