Article

Highly Dispersed Pd Species Supported on CeO2 Catalyst for Lean Methane Combustion: The Effect of the Occurrence State of Surface Pd Species on the Catalytic Activity

1
Key Laboratory of Medicinal Chemistry for Natural Resource-Ministry of Education, Advanced Analysis and Measurement Center, School of Chemical Science and Technology, Yunnan University, Kunming 650091, China
2
School of Materials Science and Engineering, Yunnan University, Kunming 650091, China
*
Author to whom correspondence should be addressed.
Catalysts 2021, 11(7), 772; https://doi.org/10.3390/catal11070772
Submission received: 10 June 2021 / Revised: 21 June 2021 / Accepted: 24 June 2021 / Published: 25 June 2021
(This article belongs to the Section Catalytic Materials)

Abstract

:
The correlation between the occurrence state of surface Pd species of Pd/CeO2 for lean CH4 combustion is investigated. Herein, by using a reduction-deposition method, we have synthesized a highly active 0.5% PdO/CeO2-RE catalyst, in which the Pd nanoparticles are evenly dispersed on the CeO2 nanorods CeO2-R. Based on comprehensive characterization, we have revealed that the uniformly dispersed Pd nanoparticles with a particle size distribution of 2.3 ± 0.6 nm are responsible for the generation of PdO and PdxCe1−xO2−δ phase with –Pd2+–O2−–Ce4+– linkage, which can easily provide oxygen vacancies and facilitate the transfer of reactive oxygen species between the CeO2-R and Pd species. As a consequence, the remarkable catalytic activity of 0.5% Pd/CeO2-RE is related to the high concentration of PdO species on the surface of the catalyst and the synergistic interaction between the Pd species and the CeO2 nanorod.

Graphical Abstract

1. Introduction

Natural gas, which contains 85% methane, has an extensive range of applications because of its abundant reserves, environmental friendliness and safety [1,2,3]. For example, natural gas as a vehicle fuel has the advantages of high calorific value, low exhaust pollution and cost-effectiveness. It has been popularized and applied all over the world. Nevertheless, methane is now considered to be more responsible for global warming than carbon dioxide, as it causes 20 times more greenhouse effect than carbon dioxide. Catalytic oxidation is a typical gas-solid catalytic reaction. It has become one of the most effective means to abate low concentration methane by opting for an appropriate catalyst to reduce the activation energy of the reaction and make it a flameless reaction at a lower ignition temperature of 250–350 °C [4].
For noble metal catalysts, supported Pd catalysts have attracted more concern owing to their pronounced catalytic activity for methane oxidation [5,6,7]. By comparison to the inert and non-reducible support, such as alumina, CeO2, not only has higher oxygen storage capacity, but can also greatly increase the rate of redox reaction rate, becoming a suitable carrier candidate for Pd-based catalyst [8,9,10,11].
The distinct crystal surfaces exposed to support preferentially affect the catalytic activity, since most heterogeneous catalytic reactions happen on the surface of the catalyst. In recent years, more and more attention has been paid to the rod CeO2 occupied by (110) and (100) facets since it has the lowest oxygen vacancy formation energy as well as the strongest reducibility among different morphology CeO2 support [12,13,14,15]. Nolan et al. [16] calculated the vacancy formation energy of CeO2 applying DFT corrected for on-site Coulomb interactions DFT+U; they found the vacancy formation energy of the crystal face was ranked in the order of (110) < (100) < (111). In 2005, Li et al. [17] observed that CeO2 nanorod exposed {100}/{100} planes had higher reactivity, which was responsible for higher catalytic performance in carbon monoxide oxidation. Recently, Lu et al. [18] found that CeO2-R exposed with (110) and (100) facets had lower oxygen vacancy formation energy and higher surface oxygen mobility. Moreover, the interactions between surface Pd species and CeO2 had been extensively investigated. They concluded that Pd species on CeO2-R and CeO2 nanocubes mainly formed PdxCe1−xO2−δ phase with a –Pd2+–O2−–Ce4+– bond, while PdOx phase was primarily distributed on the surface of CeO2 octahedrons. The formation of PdxCe1−xO2−δ phase was accompanied by the formation of more oxygen vacancies.
For supported Pd catalysts, the relationship between the occurrence state of Pd species and catalytic activity of lean methane oxidation is rarely reported. Guo et al. [19] researched the influence of the chemical state of Pd species on the catalytic performance for methane oxidation on Pd/CeO2, they associated the superior activity of methane oxidation with a high level of PdO and adsorbed oxygen, while PdxCe1−xO2−δ acts as a transition layer, more PdxCe1−xO2−δ will hinder the diffusion of lattice oxygen.
Therefore, in order to clarify the structure-activity relationship between surface Pd species occurrence state and catalytic activity of CH4 lean oxidation, herein, a variety of Pd/CeO2 catalysts with different Pd loading (0.3%, 0.5%, 1.0%) were prepared via reduction-deposition and impregnation. Based on comprehensive characterization, we reveal that the excellent catalytic activity is not only associated with the proportion of surface PdO species, but also closely bound to the oxygen vacancy and defect provided by PdxCe1−xO2−δ phase. Excess PdO species will prevent lattice oxygen migration from bulk CeO2 to surface Pd species.

2. Results and Discussion

2.1. Structural Properties and Morphologies of Samples

Figure 1 presents the XRD results of CeO2-R and Pd/CeO2 catalysts. The diffraction peaks assigned to cubic fluoride CeO2 crystal phase are observed in all the samples. Except for CeO2, there is no new diffraction peak related to Pd or PdOx species in the XRD pattern, owing to the low loading amount and high dispersion of Pd species. However, another possible reason may be that the Pd nanoparticles on the surface enter into CeO2 lattice to form PdxCe1−xO2−δ solid solution since the ionic radius of Pd2+ (0.97 Å) is smaller than that of Ce4+ (1.14 Å) [7,20]. In addition, both CeO2-R and Pd/CeO2 catalysts have similar grain size, indicating that the loading of Pd does not significantly change the grain size of CeO2-R. Figure S1 shows the nitrogen adsorption/desorption isotherm of the sample, by which the pore structure parameters can be measured. The mesopore structures in all samples can be evidenced by the typical IV adsorption isotherm with an H3-type hysteresis loop at relative pressures between 0.8 and 1.0. As shown in Table 1, the specific surface area of CeO2-R is 52.8 m2/g. When the Pd species are loaded, the specific surface area decreases obviously, which is mainly due to the pore blockage of CeO2-R by active Pd species. The specific surface area of 0.5% PdO/CeO2-RE is comparable to that of 1% PdO/CeO2-RE, indicating that there may be a dispersion threshold on the surface of CeO2-R, and higher Pd loading has a negligible effect on the dispersion.
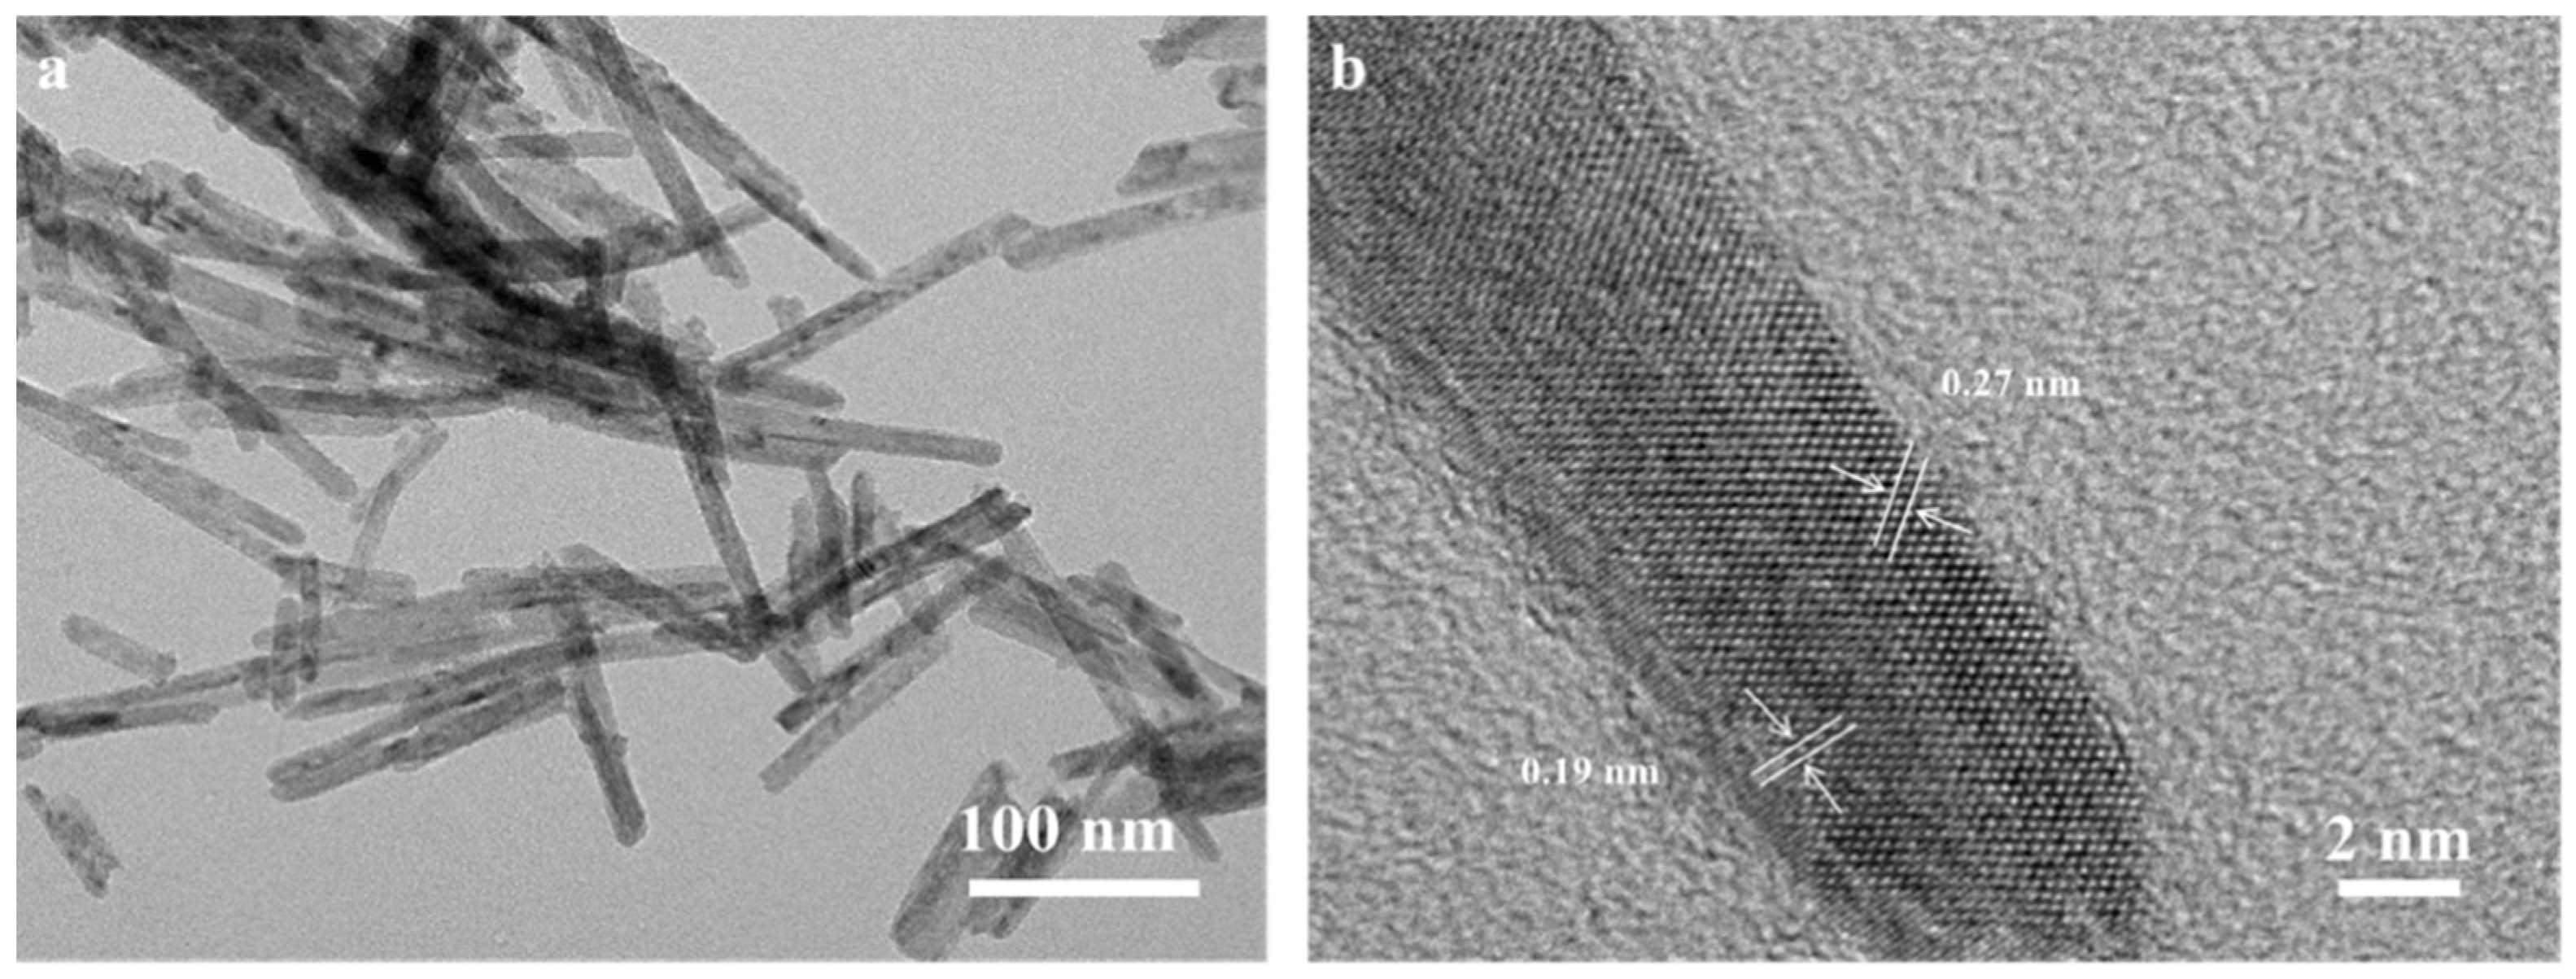
The TEM and HRTEM images of CeO2-R are presented in Figure 2. The CeO2-R performs a narrow diameter range of 9.8–12.5 nm and a length distribution between 60 and 200 nm, which has high crystallinity. It can be observed from Figure 2b that the lattice fringe with the spacings of 0.19 and 0.27 nm are assigned to the corresponding (1 1 0) and (1 0 0) crystal faces of CeO2-R.
As is illustrated in Figure 3, after reduction treatment with sodium cyanoborohydride, the surfaces of the three samples are all coated by Pd nanoparticles, indicating that loading Pd has no effect on the original morphology of CeO2-R. Interestingly, in the case of 0.5% Pd/CeO2-RE, it can be observed that a core-shell unit is successfully assembled and Pd nano grain with a particle size distribution of 2.3 ± 0.6 nm are homogeneously scattered on the surface of CeO2-R, the result indicates that the intimate contact occurs between Pd nanoparticles and CeO2-R. When the loading of Pd increases to 1.0%, the Pd nanoparticles obviously aggregate and grow up, the distribution of Pd nanoparticles is 6.9 ± 2.1 nm, as summarized in Figure 3i.
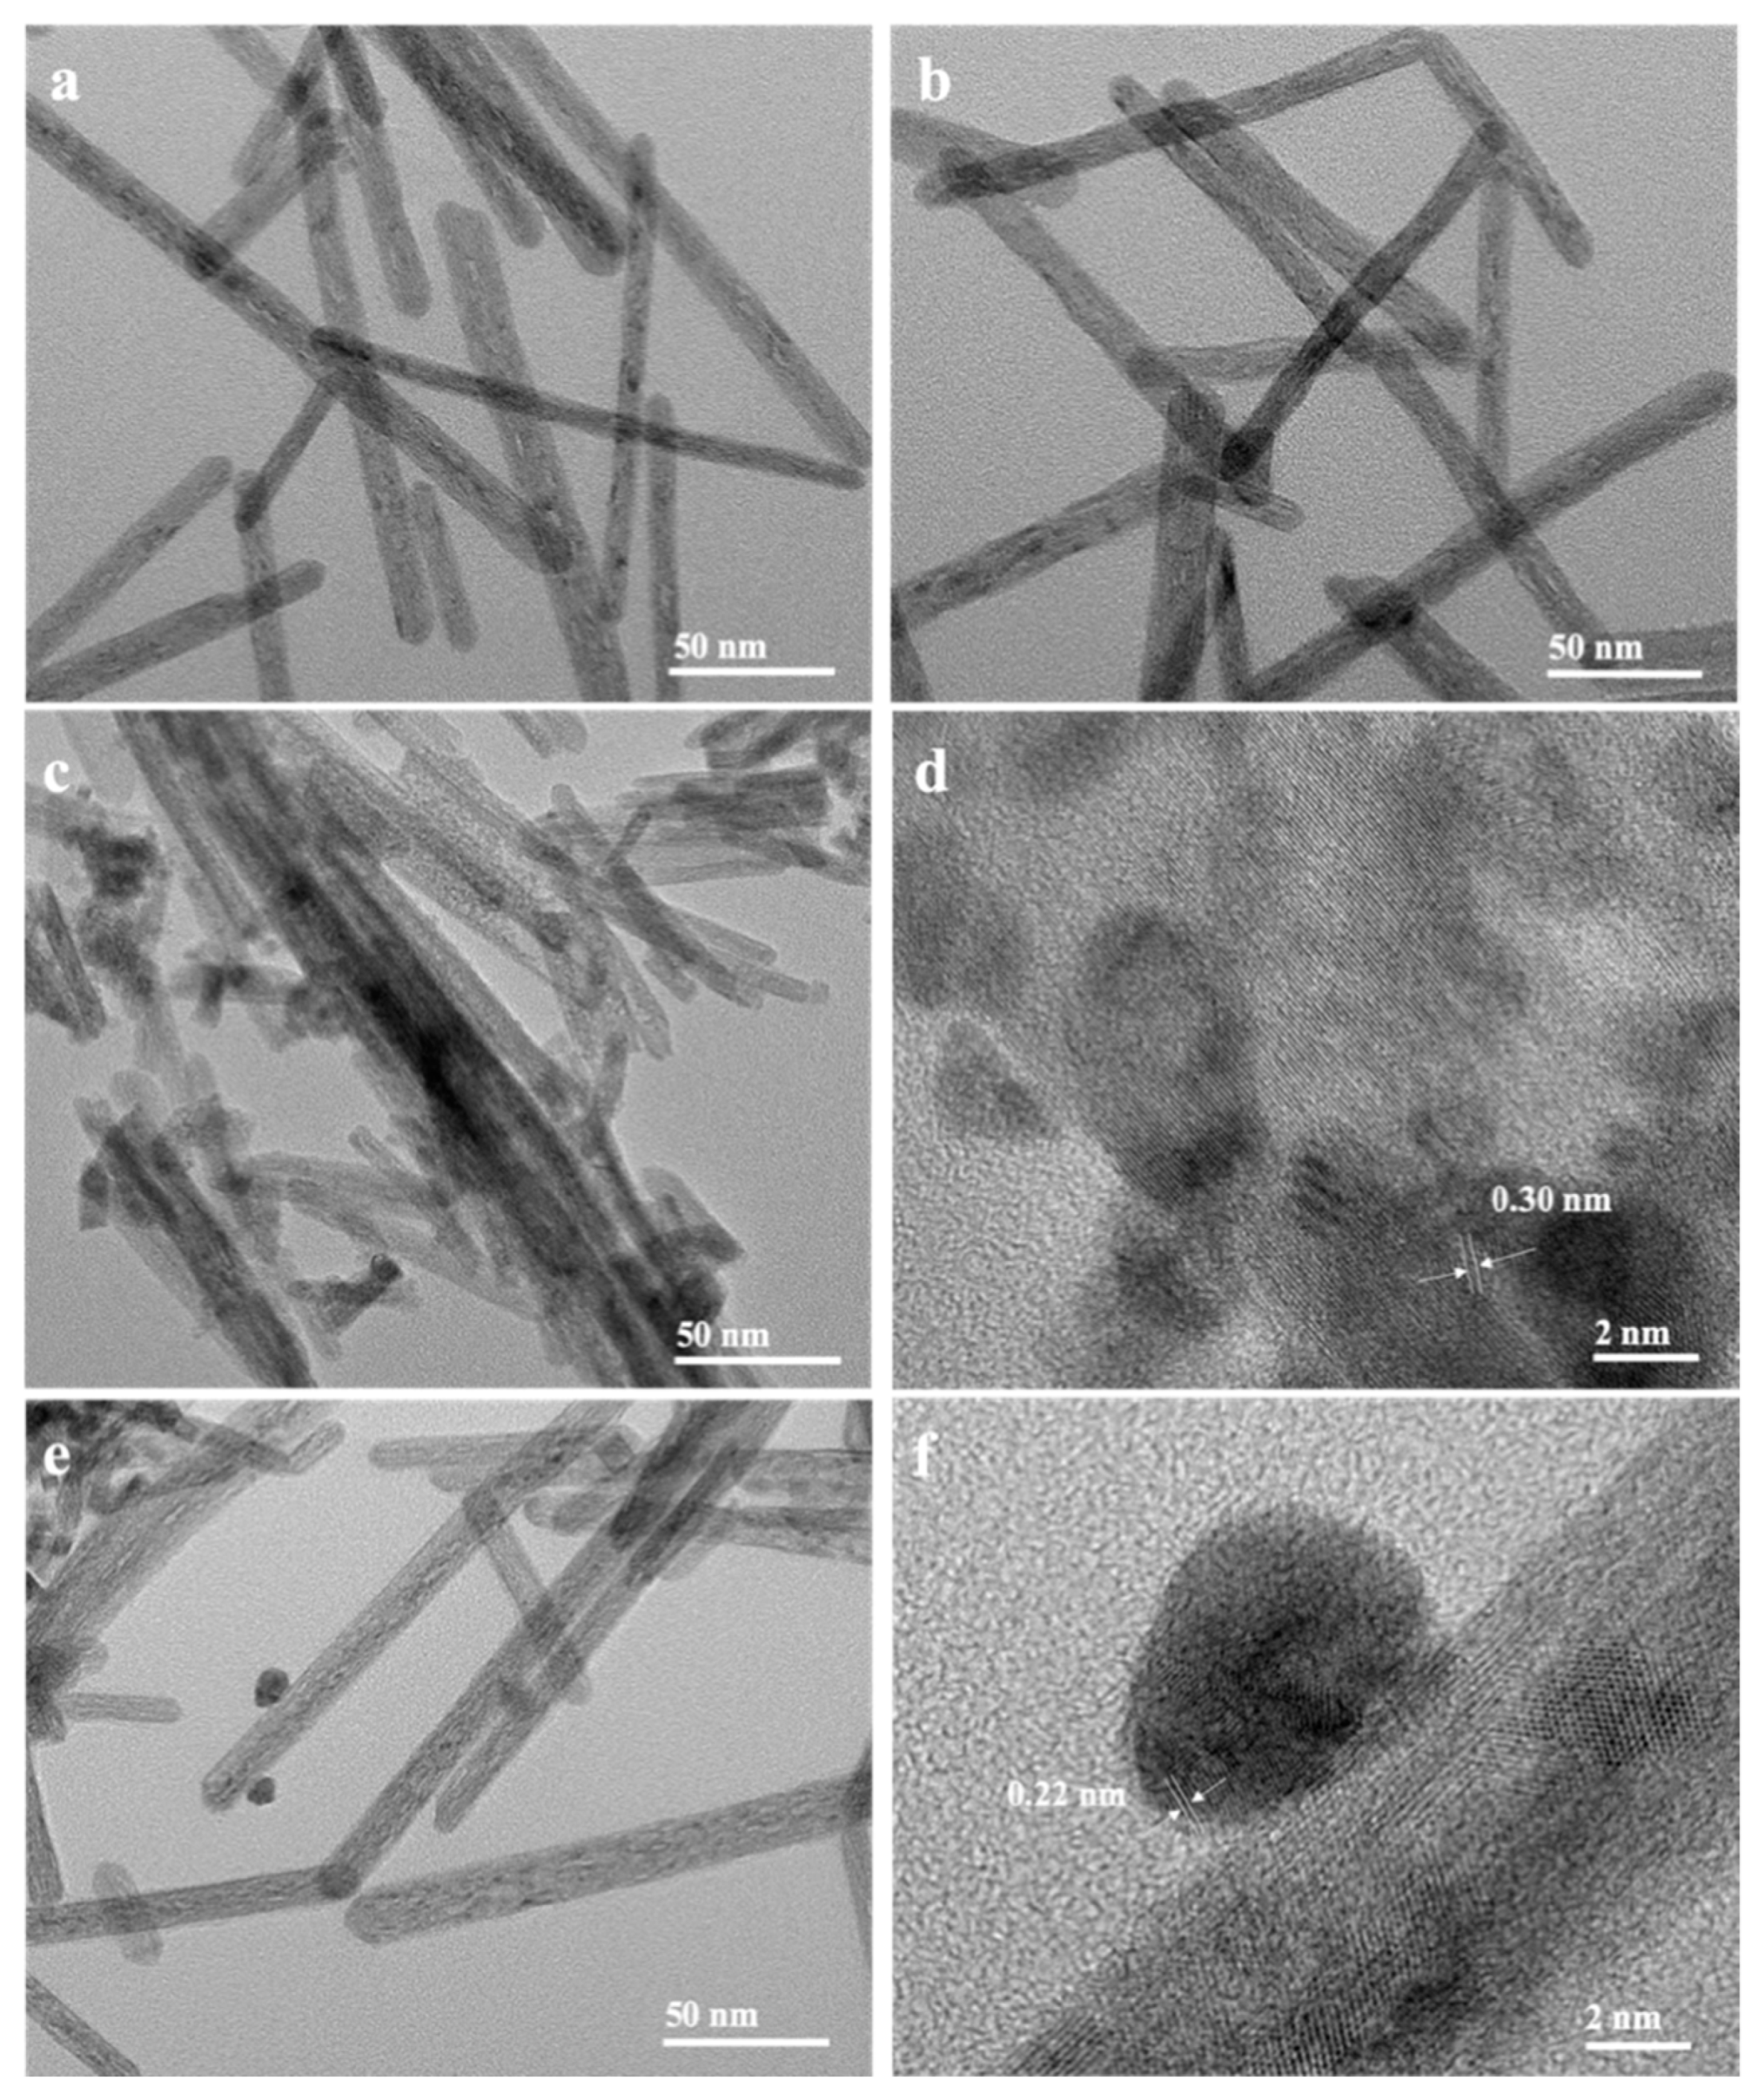
Figure 4 depicts the TEM and HRTEM pictures of 0.3% PdO/CeO2-RE, 0.5% PdO/CeO2-RE, 1% PdO/CeO2-RE and 0.5% PdO/CeO2-IM catalysts calcinated at 400 °C. As presented in Figure 4a,b, no PdO nanoparticles are observed over 0.3% PdO/CeO2-RE and 0.5% PdO/CeO2-RE. Notably, when subjected to calcination treatment, the PdO nanoparticles either disperse evenly on the surface or form PdxCe1−xO2−δ phase with the –Pd2+–O2−–Ce4+– linkages. Nevertheless, it can be seen that the PdO nanoparticles exist on the surface of 1% PdO/CeO2-RE (Figure 4c,d); its lattice fringe spacing is 0.3 nm, which corresponds to the PdO (1 0 0) plane. Additionally, Figure 4e,f shows that the Pd nanoparticles selectively exposed on (1 1 1) plane are attached on the surface of 0.5% PdO/CeO2-IM. The results reveal that the Pd species prepared by impregnation methods are partially entered into the CeO2 matrix, while the Pd species synthesized by the reduction-deposition method are primarily dispersed on the surface of CeO2, which can readily form PdO or incorporate into the lattice of CeO2 after the calcination.

2.2. Chemical and Electronic States

The XPS experiments are conducted to provide deep insight into the surface species composition and chemical states on Pd/CeO2. Figure 5 shows the XPS spectra of Pd 3d, Ce 3d and O 1s for the as-synthesized samples. As presented in Figure 5a, catalysts prepared by the reduction-deposition method all manifest two Pd 3d5/2 peaks at around 337.1 and 338.2 eV, respectively. The peak centered at 337.1 eV can be assigned to PdO species on the surface of PdO/CeO2 catalysts. The peaks that appeared at 338.2 eV can be attributed to PdxCe1−xO2−δ phase, which can be explained by the strong metal-support interaction promoting the incorporation of Pd ion into the CeO2 lattice to transform PdxCe1−xO2−δ phase [21,22,23,24,25]. In the case of 0.5% PdO/CeO2-IM, there is another peak that arose at 336.2 eV, which corresponds to Pd0. This finding coincides with the result of the TEM observation. The above results indicate that various occurrence states of Pd species exist on the surface of as-prepared samples.
The Ce 3d XPS spectra of as-prepared samples are shown in Figure 5b, which can be deconvolved into 8 groups. The doublets labelled as (u, v) are the characteristic peaks of Ce3+, and the doublets denoted as (u, v), (u′, v′) and (u″, v″) are assigned to Ce4+. The content of Ce3+ on the surface can be calculated by the area ratio of Ce3+/(Ce3+ + Ce4+), it can be summarized from Table 2 that the content of Ce3+ increases after Pd loading, which may be linked to the strong interaction between Pd species and CeO2, according to the previous literature [25,26,27], the appearance of Ce3+ is associated with the oxygen vacancy on the surface of CeO2, 0.3% PdO/CeO2-RE has the highest concentration of Ce3+ (0.25), followed by 0.5% PdO/CeO2-RE (0.24), 0.5% PdO/CeO2-IM (0.19) and 0.3% PdO/CeO2-RE (0.18).
To further study the oxygen vacancy on the sample surface, the O 1s XPS spectra are also studied. It is generally believed that the oxygen vacancy is usually associated with the ratio (Oα/Oβ) of the surface chemisorbed oxygen (Oα) and the lattice oxygen (Oβ) located in the bulk CeO2 [28,29,30]. As shown in Figure 5c, the ratios are as follows: 0.3% PdO/CeO2-RE > 0.5% PdO/CeO2-IM > 0.5% PdO/CeO2-IM > 1% PdO/CeO2-RE. Combined with the Ce 3d XPS spectra, it can be speculated that the more oxygen vacancies are generated, the higher the content of Ce3+ on the catalyst surface.

2.3. Redox Ability

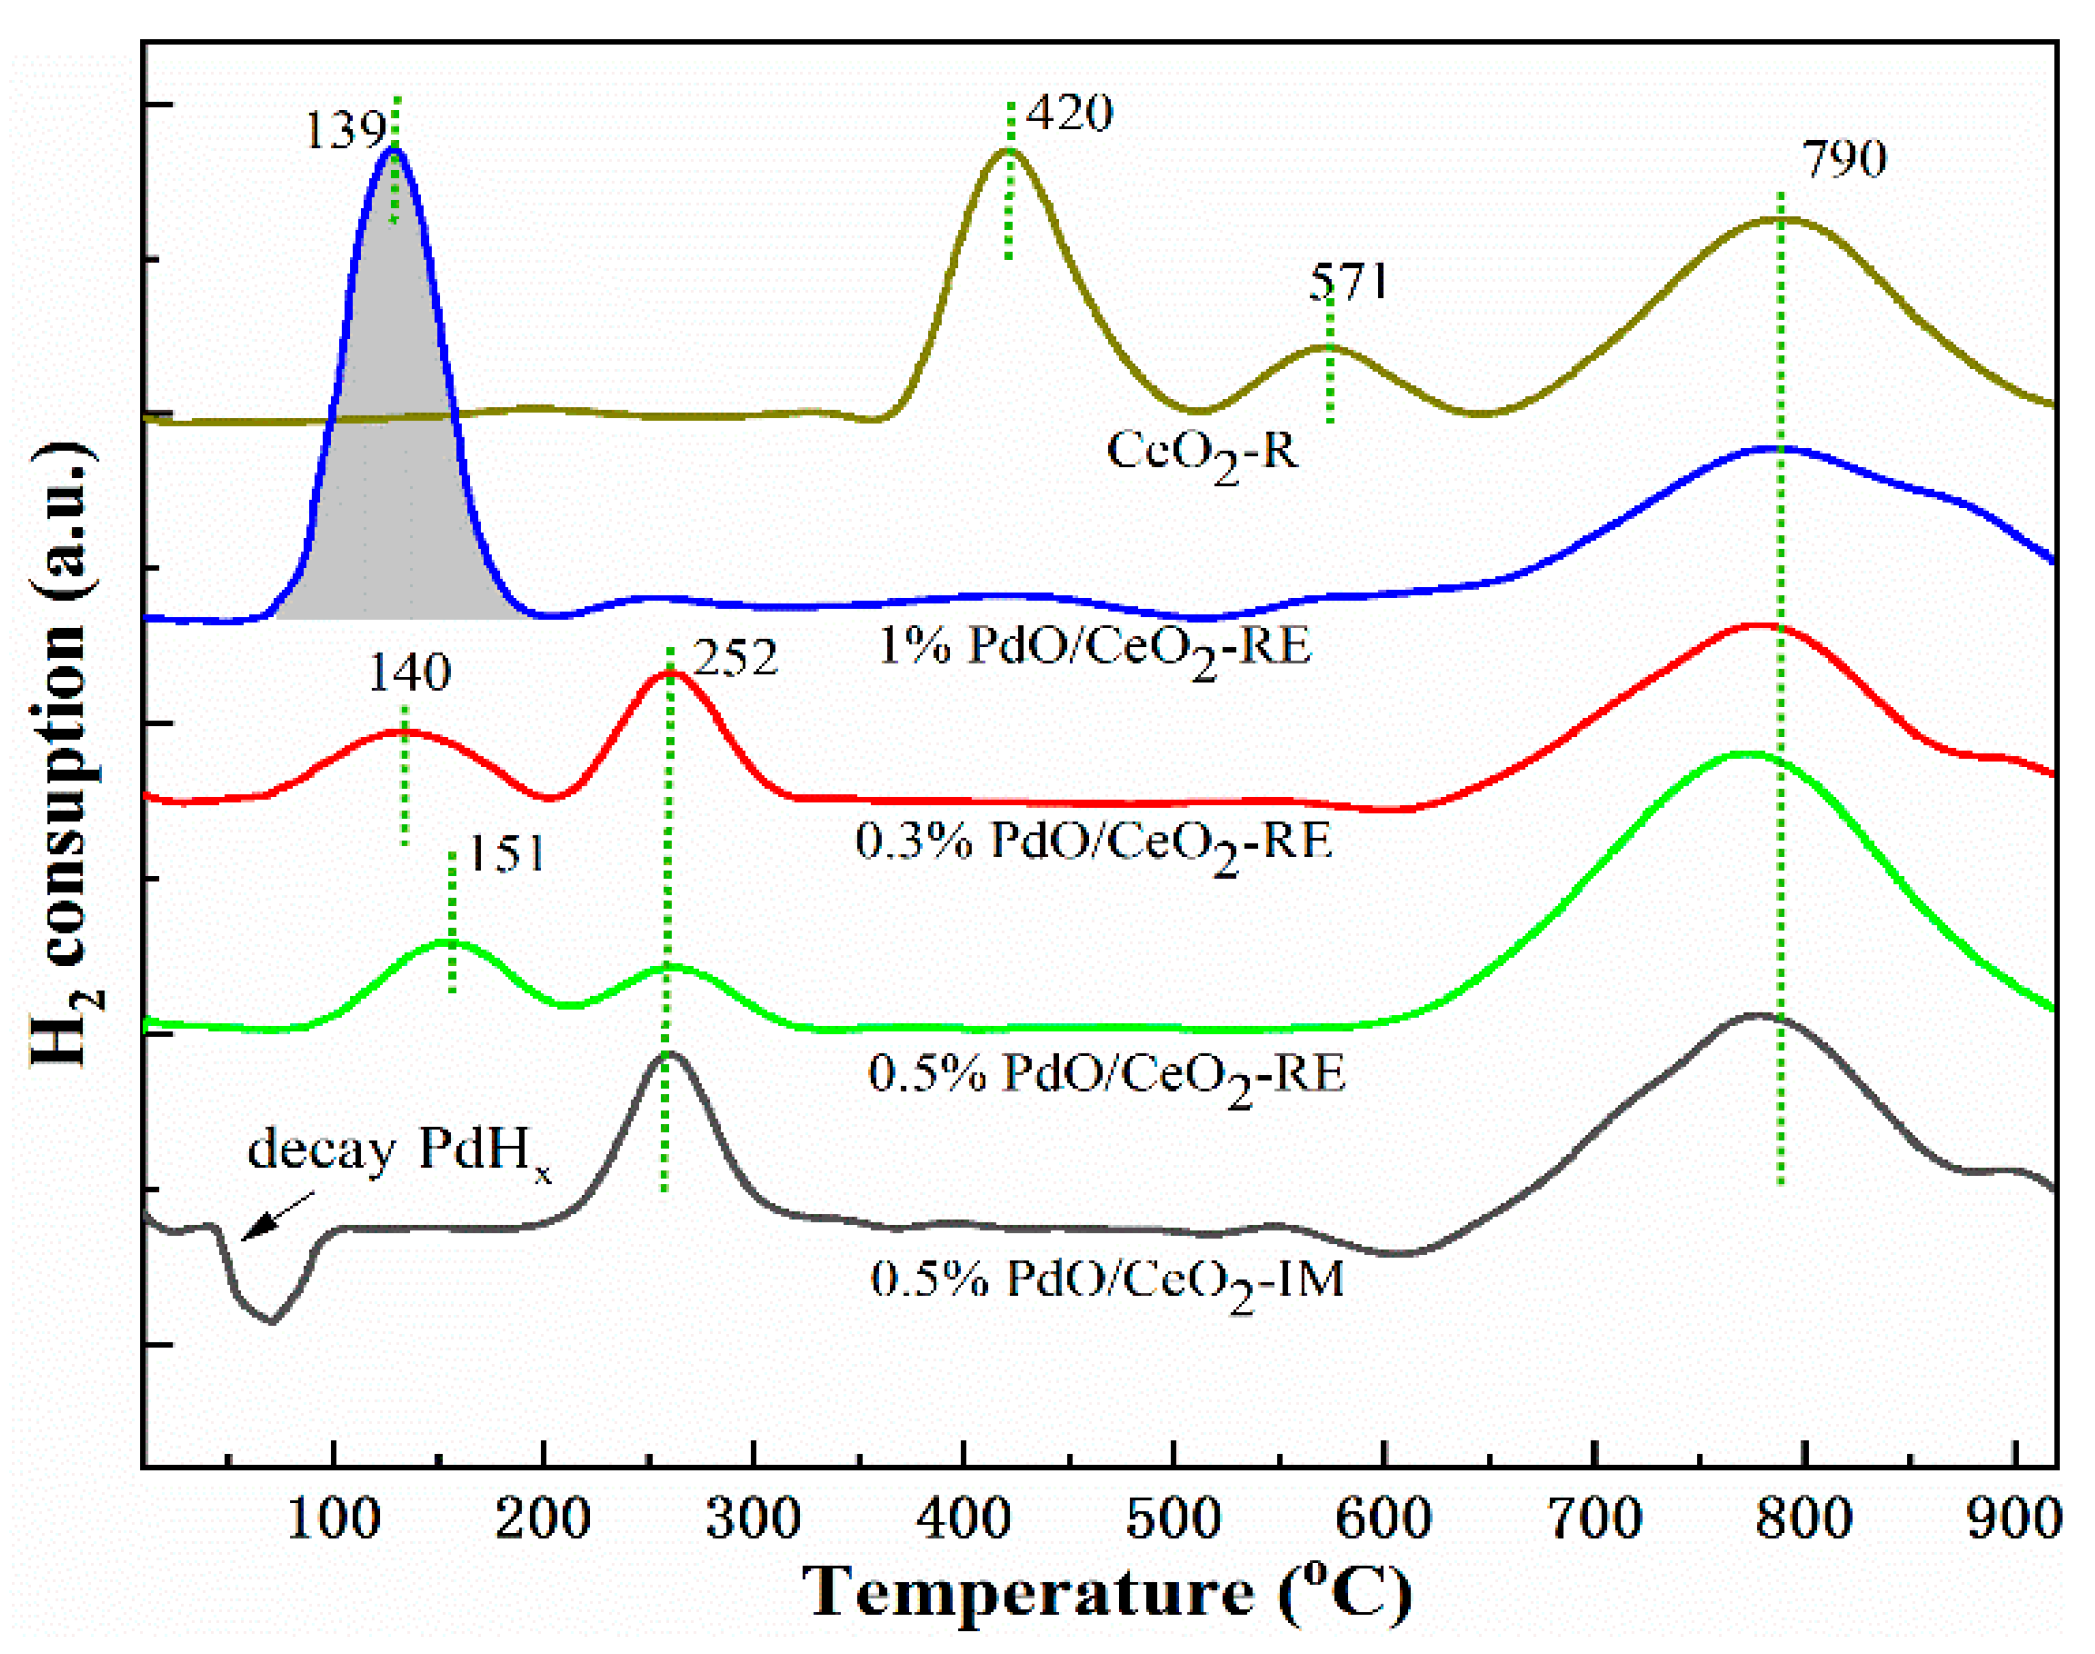
The H2-TPR test allows us to further explore the reducibility of surface Pd species, and the results are presented in Figure 6 and Table S1. The TPR profile of CeO2-R shows that the peaks at 420 °C and 571 °C correspond to the reduction of surface adsorbed oxygen and lattice oxygen species of the CeO2 support, while the peak at a high temperature (T > 700 °C) is generally ascribed to the reduction of interior lattice oxygen of bulk CeO2. Clearly, for Pd/CeO2 samples prepared by the reduction method, the reduction peak shifted toward low temperature (T < 200 °C), indicating that the presence of Pd species greatly enhances the reduction ability of CeO2.
In the H2-TPR profile of 1% PdO/CeO2-RE, there is a reduction peak before 200 °C, corresponding to the reduction of PdO species, and the H2 consumption is 106 μmol/g, which is significantly higher than the theoretical value (91.5 μmol/g) calculated from the actual Pd content (0.89%). The remaining hydrogen consumption is due to the hydrogen spillover effect between Pd and CeO2-R, which also reflects the strong metal support interaction [31]. For the 0.3% PdO/CeO2-RE and 0.5% PdO/CeO2-RE, the reduction peaks of PdO shift to 140 °C and 151 °C, and the H2 consumption is 19 μmol/g and 24 μmol/g, respectively, indicating that there are more PdO species in 0.5% PdO/CeO2-RE. However, the reduction peak at 252 °C can be considered to be the co-reduction peak of Pd species and lattice oxygen in PdxCe1−xO2−δ phase. However, unlike the catalyst prepared via the reduction-deposition method, 0.5% PdO/CeO2-IM has a negative peak before 100 °C, which is associated with the decomposition of Pd hydride phase. The appearance of Pd species on the surface is also evidenced by the above XPS results. Similarly, the high-temperature region peaks around 790 °C of all the Pd/CeO2 catalysts correspond to the reduction of bulk CeO2 hardly coupling with Pd species. Combined with the above analysis, highly dispersed Pd species loaded on the surface of CeO2 can significantly enhance the oxygen mobility of the carrier, so as to boost the catalytic oxidation of CH4.

2.4. Catalytic CH4 Oxidation

Figure 7a depicts the light-off curves of CeO2-R and Pd/CeO2 catalysts for methane oxidation. The order of catalytic activity is as follows: 0.5% PdO/CeO2-RE > 0.3% PdO/CeO2-RE > 0.5% PdO/CeO2-IM > 1% PdO/CeO2-RE > CeO2-R, according to the results of methane conversion. Of all the catalysts, CeO2-R presents the worst catalytic activity with a complete methane conversion temperature as high as 650 °C. The incorporation of Pd substantially promoted the oxidation of methane. Obviously, the catalytic activity of Pd/CeO2 catalysts varies with the change of composition, and this discrepancy is preliminarily ascribed to the change of surface Pd species occurrence state. Although 0.5% PdO/CeO2-RE and 0.5% PdO/CeO2-IM both have the same Pd loading, 0.5% PdO/CeO2-RE exhibits superior catalytic activity, in which the temperature of 90% methane conversion (T90) is 50 °C lower than that of 0.5% PdO/CeO2-IM. Meanwhile, the reaction rates, turnover frequency (TOF) and apparent activation energy (Ea) of Pd/CeO2 are shown in Table 2. The Ea can be calculated by the linear correlation between the ln r and 1/T as can be seen in Figure 7b. Among the four catalysts, the 0.5% PdO/CeO2-RE catalyst exhibits the highest TOF and the lowest Ea, which is conducive to the rapid oxidation of methane.

3. Discussion

In this work, a series of Pd/CeO2 catalysts are fabricated by reduction-deposition and impregnation. Compared with commercial cerium oxide, rod-like cerium oxide is screened as the support due to its excellent redox properties and abundant oxygen vacancy. When the reducing agent sodium borohydride is added, Pd nanoparticles are uniformly dispersed on the surface of CeO2-R, assembling an analogous CeO2@Pd core-shell structure due to the close Ce-Pd contact. After calcination, Pd is transformed into PdO without causing serious aggregation, in addition, some of Pd species and CeO2 form a PdxCe1−xO2−δ phase due to the strong interaction, which can be shown by the above characterization.
As shown in XPS, there are three main occurrence states of surface Pd species: Pd0, Pd2+ and Pdδ+ (2 < δ ≤ 4) in the form of PdxCe1−xO2−δ phase. It has been long recognized that the reaction rate of methane oxidation is closely related to the breaking of C-H bonds. Despite the controversy, PdO is generally considered as the main active phase in CH4 oxidation, which occurs through the Marsvan–Krevelen reaction mechanism [32,33,34]. The concentration of PdO species on the surface is proportional to Pd loading. The proportion of PdO species on the surface of 1% PdO/CeO2-RE is 81.34% and is higher than that of 0.5% PdO/CeO2-RE (72.66%) and 0.3% PdO/CeO2-RE (55.28%). Nevertheless, its catalytic activity is not optimal, and the main factor is that the higher the Pd loading, the more serious agglomeration of the PdO nanoparticles, which inhibits the replenishment and diffusion of oxygen from the bulk CeO2. Associated with TEM results, it is found that both 0.5% Pd/CeO2-RE and 0.5% PdO/CeO2-RE (the latter calcined at 400 °C) have uniform distributions of surface Pd species.
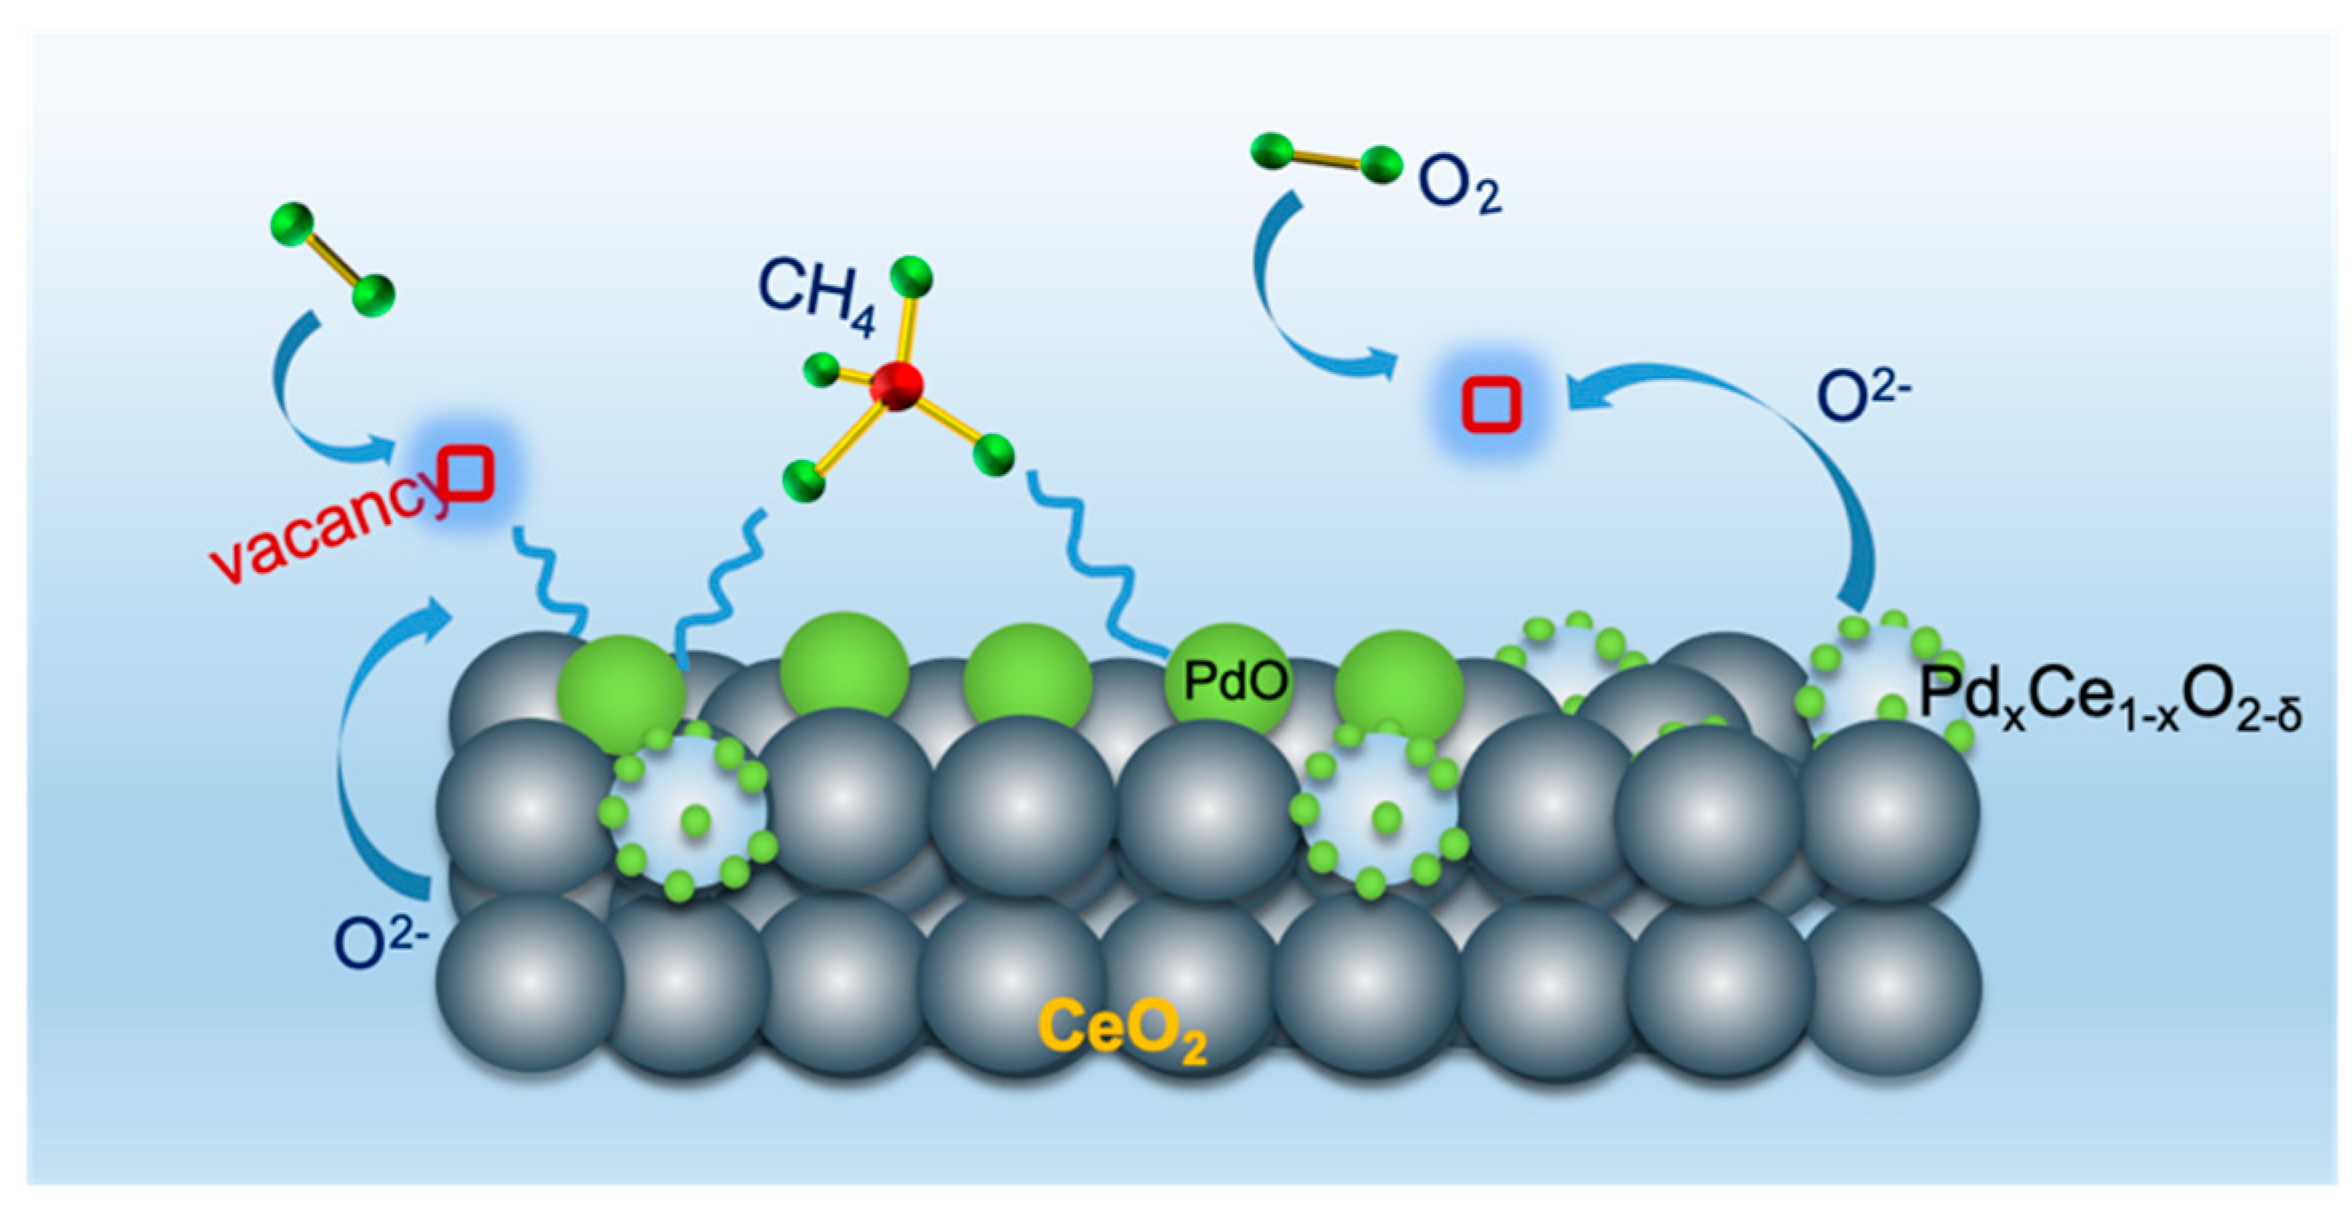
For CH4 oxidation under lean conditions, the mobility of surface oxygen also plays a pivotal role in the dissociation and reoxidation of PdO species and promotes catalytic activity to some extent. The presence of PdxCe1−xO2−δ phases, which are not far from the PdO particles, readily generates more oxygen vacancy and defects than CeO2 support (as shown in Figure 8). Additionally, the –Pd2+–O2−–Ce4+– linkage can stabilize PdO species to avoid growth at high temperatures, maximize the contact between active sites and reactants, and improve the utilization efficiency of active metals.
Among all the samples, 0.5% PdO/CeO2-RE exhibits the best catalytic activity with a T90 as low as 400 °C. Meanwhile, kinetic parameters such as reaction rate, TOF and Ea further confirm that 0.5% PdO/CeO2-RE has outstanding performance. In this work, sodium cyanoborohydride, as a mild reducing agent, has a weak reducing ability and could affect the size and occurrence state of surface Pd species. Compared with sodium borohydride, sodium cyanoborohydride is conducive to the formation of uniform ultrafine Pd nanoparticles. When the Pd loading is less than 0.5%, the distribution of Pd nanoparticles can be tailored to be 2.3 ± 0.6 nm, which is beneficial to enhance the interfacial interaction between Pd and CeO2-R, and then affect the occurrence state of surface Pd species. During the calcination process, strong interaction promotes the formation of the PdxCe1−xO2−δ phase at the interface. The H2 consumption peak at 252 °C in the H2-TPR profile shows that the presence of the PdxCe1−xO2−δ phase favors the oxygen mobility on the surface of CeO2. Although the sample 0.3% PdO/CeO2-Re has a higher specific surface area and smaller grain size in comparison with 0.5% PdO/CeO2-Re, we believe that the high content of PdO species on the surface is responsible for the high activity, and the surface Pd atomic ratio of 0.5% PdO/CeO2-Re (Table 2) is also high. In addition, it is worth mentioning that 0.5% PdO/CeO2-RE and 0.5% PdO/CeO2-IM have the same Pd loading, their reactivity is completely different, also reflecting the effect of the preparation method on the occurrence state of surface Pd species. Part of the Pd ions in 0.5% PdO/CeO2-IM prepared by impregnation method penetrates the CeO2 matrix, and it is difficult to completely oxidize to PdO at high temperature, as demonstrated by the XPS test.

4. Experimental Section

4.1. Catalyst Synthesis

4.1.1. Synthesis of Ceria Nanorods Support (CeO2-R)

The CeO2-R was prepared by hydrothermal method given in the literature [35]. Both 4.0 m·mol cerium nitrate hexahydrate and 0.48 m·mol sodium hydroxide were dissolved in 10 mL and 70 mL deionized water, and it was stirred continuously for 30 min. The mixture was then transferred to a 100 mL Teflon-lined autoclave and heated to 100 °C for 24 h and the as-prepared sample was collected by filtration and washed with deionized water and ethanol alternatively. The product was dried at 100 °C overnight and then calcined at 600 °C for 6 h to obtain ceria nanorods (designated as CeO2-R).

4.1.2. Synthesis of Pd/CeO2 Catalyst

The Pd/CeO2 catalyst was synthesized by reduction-deposition using sodium cyanoborohydride as a reducing agent. Normally, the required amount of palladium nitrate aqueous solution was added dropwise into the CeO2-R suspension. After impregnation, the reducing agent sodium cyanoborohydride (1.5 times the moles of palladium) was dropped with vigorous stirring for 4 h, then dried overnight at 373 K. A battery of catalysts with different palladium loading (0.3%, 0.5%, 1.0%) was obtained by calcining at 450 °C for 4 h. The catalysts were named according to the Pd content and the preparation method. For example, 0.5% PdO/CeO2-RE represents a catalyst with a Pd concentration of 0.5 wt% prepared by reduction method and calcinated at 400 °C, while 0.5% Pd/CeO2-RE refers to a catalyst prepared with this process except for calcination. Besides, the reference 0.5% PdO/CeO2-IM catalyst with Pd loading of 0.5 wt% was synthesized by the same procedure as above for 0.5% PdO/CeO2-RE except that the reductant was added. The accurate content of palladium in the final catalyst was analyzed by inductively coupled plasma atomic emission spectroscopy (ICP-AES).

4.2. Catalyst Characterization

XRD analysis of catalysts was carried out on a Rigaku TTRIII power diffractometer (Wilmington, MA, USA) operated at 30 kV and 15 mA with Cu Kαradiation source, the pattern data were collected in a 2θ range from 10 to 80° with a scan step of 2°/min. The mean crystalline size was calculated by the Scherrer equation based on the diffraction peak broadening [15,16].
H2-temperature-programmed reduction and CO chemical adsorption tests were conducted on Micro-meritics Chemisorb 2920II instrument (Norcross, GA, USA). In the H2-TPR test, 50 mg of sample was loaded at a quartz tube reactor, and pretreated at 150 °C in an Ar (80 mL/min) for 1 h, then the sample was reduced with 30 mL/min H2-N2 mixture and heated from 25 to 950 °C with a rate of 10 °C/min. The hydrogen consumption for each reduction peak is calibrated using the H2-TPR profile of copper oxide. For the CO chemical adsorption experiment, a 50 mg sample was pretreated at 200 °C for 1 h with 30 mL/min 10% H2-N2. After cooling down to room temperature, the sample was purged with He (30 mL/min) for 30 min, and then 5% CO/He was periodically introduced into the sample.
The specific surface area of synthesized samples was implemented on a Micromeritics NOVA 2000 instrument. The specific surface area was calculated by the Brunauer–Emmett–Teller (BET) method.
Transmission electron microscopy (TEM) and high-resolution TEM (HR-TEM) images were acquired on a JEM-2100 microscope (JEOL, Tokyo, Japan) with an operating voltage of 200 kV. The sample was ultrasonically dispersed in ethanol and a drop of the suspension was scooped onto a carbon film anchored by a 200-mesh copper grid.
X-ray photoelectron spectroscopy (XPS) was recorded on a Thermo-Fisher Scientific ESCALAB 250 (Waltham, MA, USA) with a monochromatized Al Kα excitation source. The electron binding energies were calibrated by the C 1s peak of adventitious carbon at 284.8 eV. Besides, the Pd content of Pd/CeO2 catalyst was analyzed by PerkinElmer ICP-AES (Waltham, MA, USA).

4.3. Evaluation of the Catalytic Performance

The catalytic oxidation of CH4 was performed in a continuous flow fixed-bed reactor. About 100 mg sample was placed into the tubular reactor (inner diameter = 5 mm) with quartz-wool plugs. Prior to each test, the catalyst was pretreated at 150 °C for 2 h under H2 atmosphere and subsequently cooled to room temperature. Then, a mixture gas of 0.5 vol% of CH4 and 3 vol% O2 in synthetic air was injected into the quartz tube microreactor at a flow rate of 30 mL/min, which corresponds to a weight hourly space velocity of 18,000 mL·g−1·h−1. In addition, the effect of different weight hourly space velocity (24,000, 30,000 and 60,000 mL·g−1·h−1) on CH4 oxidation activity was also discussed. The reaction activity was evaluated at 150–600 °C. The effluent gas was measured using an in-line GC7890A gas chromatograph equipped with a flame ionization detector (FID). The CH4 conversion ( X C H 4 ) was calculated by the following formula:
X C H 4 ( % ) = [ C H 4 ] i n [ C H 4 ] o u t [ C H 4 ] i n × 100
where [CH4]in and [CH4]out are the CH4 concentration in the inlet and outlet gas, respectively.
In order to calculate the apparent activation energy, kinetic experiments were carried out at a temperature range of 200–1400 °C, and the WHSV was controlled at a range of 18,000–60,000 mL·g−1·h−1 to ensure that the CH4 conversion is below 15%, so as to eliminate internal and external diffusion as well as transport limitations. The reaction rates ( r C H 4 (mol·gPd−1·s−1)) and turnover frequency (TOF (s−1)) were determined by the following formulas:
r C H 4 = X C H 4 C C H 4 V P m c a t w P d R T
T O F = r C H 4 M P d D P d  
where X C H 4 represents the conversion of CH4, C C H 4 is the concentration of CH4 in the feed gas, mcat is the catalyst weight (g), wPd is the Pd content in the catalyst determined by ICP-AES, V is the total flow rate (mL/min), R is the molar gas constant, T is the room temperature (K), MPd is the atomic weight of Pd, DPd is the Pd dispersion measured by CO chemical adsorption at 25 °C. Combined with the Arrhenius equations, the apparent activation energy (Ea) was calculated by plotting ln r vs. 1/RT.

5. Conclusions

A series of Pd/CeO2 catalysts with different surface Pd species occurrence states had been rationally engineered for lean methane combustion. The characterization of XRD, HRTEM, XPS, BET and H2-TPR reveal that the surface Pd species in the form of Pd0, PdO and PdxCe1−xO2−δ phase are highly dispersed on the rod-like CeO2. Here, 0.5% PdO/CeO2-RE behaves the remarkable catalytic activity with the lowest Ea (61.6 kJ/mol), which was mainly due to the high concentration of PdO and PdxCe1−xO2−δ phase species on the surface. The PdxCe1−xO2−δ phase at the interface can contribute to the formation of oxygen vacancy and defect, promote the active oxygen species transfer between PdO and CeO2. In brief, the presence of more PdO species and the oxygen vacancy provided by the PdxCe1−xO2−δ phase are responsible for excellent catalytic activity.

Supplementary Materials

The following are available online at https://www.mdpi.com/article/10.3390/catal11070772/s1, Figure S1: N2 adsorption-desorption isotherm of the as-synthesized catalysts, Table S1: H2 consumption of CeO2-R and Pd/CeO2 catalysts.

Author Contributions

Conceptualization, Y.L. and C.H.; data curation, Y.L. and C.H.; formal analysis, L.B. and Y.L.; investigation, L.B. and Y.L.; methodology, L.B. and Y.L.; project administration, L.B.; supervision, L.B.; validation, L.B.; visualization, L.B.; writing—original draft, Y.L.; writing—review and editing, L.B.; funding acquisition, L.B. The work described in this manuscript was carried out and written with contribution from both authors. All authors have read and agreed to the published version of the manuscript.

Funding

This work was supported by the National Natural Science Foundation of China (No. 21962022) and the Major Science and Technology Programs of Yunnan (202002AB080001-1).

Conflicts of Interest

The authors declare no conflict of interest.

References

  1. Yang, H.; Xie, P.; Ni, L.; Flower, R.J. Underestimation of CH4 emission from freshwater lakes in China. Environ. Sci. Technol. 2011, 45, 4203–4204. [Google Scholar] [CrossRef]
  2. Choudhary, T.V.; Banerjee, S.; Choudhary, V.R. Catalysts for combustion of methane and lower alkanes. Appl. Catal. A Gen. 2002, 234, 1–23. [Google Scholar] [CrossRef]
  3. Liu, C.J.; Ye, J.; Jiang, J.; Pan, Y. Progresses in the preparation of coke resistant Ni-based catalyst for steam and CO2 reforming of methane. ChemCatChem 2011, 3, 529–541. [Google Scholar] [CrossRef]
  4. Murata, K.; Mahara, Y.; Ohyama, J.; Yamamoto, Y.; Arai, S.; Satsuma, A. The Metal–Support Interaction Concerning the Particle Size Effect of Pd/Al2O3 on Methane Combustion. Angew. Chem. Int. Ed. 2017, 56, 15993–15997. [Google Scholar] [CrossRef]
  5. Son, I.H.; Lane, A.M.; Johnson, D.T. The study of the deactivation of water-pretreated Pt/γ-Al2O3 for low-temperature selective CO oxidation in hydrogen. J. Power Source 2003, 124, 415–419. [Google Scholar] [CrossRef]
  6. Rajasree, R.; Hoebink, J.H.B.J.; Schouten, J.C. Transient kinetics of carbon monoxide oxidation by oxygen over supported palladium/ceria/zirconia three-way catalysts in the absence and presence of water and carbon dioxide. J. Catal. 2004, 223, 36–43. [Google Scholar] [CrossRef]
  7. Singhania, A.; Krishnan, V.V.; Bhaskarwar, A.N.; Bhargava, B.; Parvatalu, D. Hydrogen-iodide decomposition over Pd–CeO2 nanocatalyst for hydrogen production in sulfur-iodine thermochemical cycle. Int. J. Hydrogen Energy 2018, 43, 3886–3891. [Google Scholar] [CrossRef] [Green Version]
  8. Gao, W.; Zhang, Z.; Li, J.; Ma, Y.; Qu, Y. Surface engineering on CeO2 nanorods by chemical redox etching and their enhanced catalytic activity for CO oxidation. Nanoscale 2015, 7, 11686–11691. [Google Scholar] [CrossRef] [PubMed]
  9. Tang, C.; Sun, B.; Sun, J.; Hong, X.; Deng, Y.; Gao, F.; Dong, L. Solid state preparation of NiO-CeO2 catalyst for NO reduction. Catal. Today 2017, 281, 575–582. [Google Scholar] [CrossRef]
  10. Du, X.; Zhang, D.; Shi, L.; Gao, R.; Zhang, J. Morphology dependence of catalytic properties of Ni/CeO2 nanostructures for carbon dioxide reforming of methane. J. Phys. Chem. C 2012, 116, 10009–10016. [Google Scholar] [CrossRef]
  11. Carrettin, S.; Blanco, M.C.; Corma, A.; Hashmi, A.S.K. Heterogeneous gold-catalysed synthesis of phenols. Adv. Synth. Catal. 2006, 348, 1283–1288. [Google Scholar] [CrossRef]
  12. Aneggi, E.; Boaro, M.; De Leitenburg, C.; Dolcetti, G.; Trovarelli, A. Insights into the dynamics of oxygen storage/release phenomena in model ceria-zirconia catalysts as inferred from transient studies using H2, CO and soot as reductants. Catal. Today 2006, 112, 94–98. [Google Scholar] [CrossRef]
  13. Avgouropoulos, G.; Ioannides, T.; Papadopoulou, C.; Batista, J.; Hocevar, S.; Matralis, H.K. A comparative study of Pt/γ-Al2O3, Au/α-Fe2O3 and CuO-CeO2 catalysts for the selective oxidation of carbon monoxide in excess hydrogen. Catal. Today 2002, 75, 157–167. [Google Scholar] [CrossRef]
  14. Jeong, M.; Nunotani, N.; Moriyama, N.; Imanaka, N. Effect of introducing Fe2O3 into CeO2-ZrO2 on oxygen release properties and catalytic methane combustion over PdO/CeO2-ZrO2-Fe2O3/γ-Al2O3 catalysts. Catal. Sci. Technol. 2017, 7, 1986–1990. [Google Scholar] [CrossRef]
  15. Kappis, K.; Papadopoulos, C.; Papavasiliou, J.; Vakros, J.; Georgiou, Y.; Deligiannakis, Y.; Avgouropoulos, G. Tuning the catalytic properties of copper-promoted nanoceria via a hydrothermal method. Catalysts 2019, 9, 138. [Google Scholar] [CrossRef] [Green Version]
  16. Nolan, M.; Parker, S.C.; Watson, G.W. CeO2 catalysed conversion of CO, NO2 and NO from first principles energetics. Phys. Chem. Chem. Phys. 2006, 8, 216–218. [Google Scholar] [CrossRef] [Green Version]
  17. Zhou, K.; Wang, X.; Sun, X.; Peng, Q.; Li, Y. Enhanced catalytic activity of ceria nanorods from well-defined reactive crystal planes. J. Catal. 2005, 229, 206–212. [Google Scholar] [CrossRef]
  18. Hu, Z.; Liu, X.; Meng, D.; Guo, Y.; Guo, Y.; Lu, G. Effect of Ceria Crystal Plane on the Physicochemical and Catalytic Properties of Pd/Ceria for CO and Propane Oxidation. ACS Catal. 2016, 6, 2265–2279. [Google Scholar] [CrossRef]
  19. Ma, J.; Lou, Y.; Cai, Y.; Zhao, Z.; Wang, L.; Zhan, W.; Guo, Y.; Guo, Y. The relationship between the chemical state of Pd species and the catalytic activity for methane combustion on Pd/CeO2. Catal. Sci. Technol. 2018, 8, 2567–2577. [Google Scholar] [CrossRef]
  20. Xu, J.; Harmer, J.; Li, G.; Chapman, T.; Collier, P.; Longworth, S.; Tsang, S.C. Size dependent oxygen buffering capacity of ceria nanocrystals. Chem. Commun. 2010, 46, 1887–1889. [Google Scholar] [CrossRef] [PubMed]
  21. Priolkar, K.R.; Bera, P.; Sarode, P.R.; Hegde, M.S.; Emura, S.; Kumashiro, R.; Lalla, N.P. Formation of Ce1−xPdxO2−δ solid solution in combustion-synthesized Pd/CeO2 catalyst: XRD, XPS, and EXAFS investigation. Chem. Mater. 2002, 14, 2120–2128. [Google Scholar] [CrossRef]
  22. Meng, L.; Lin, J.J.; Pu, Z.Y.; Luo, L.F.; Jia, A.P.; Huang, W.X.; Luo, M.F.; Lu, J.Q. Identification of active sites for CO and CH4 oxidation over PdO/Ce1−xPdxO2−δ catalysts. Appl. Catal. B Environ. 2012, 119–120, 117–122. [Google Scholar] [CrossRef]
  23. Gulyaev, R.V.; Stadnichenko, A.I.; Slavinskaya, E.M.; Ivanova, A.S.; Koscheev, S.V.; Boronin, A.I. In situ preparation and investigation of Pd/CeO2 catalysts for the low-temperature oxidation of CO. Appl. Catal. A Gen. 2012, 439–440, 41–50. [Google Scholar] [CrossRef]
  24. Zhang, X.; Li, W.; Zhou, Z.; Chen, K.; Wu, M.; Yuan, L. High dispersed Pd supported on CeO2 (1 0 0) for CO oxidation at low temperature. Mol. Catal. 2021, 508, 111580. [Google Scholar] [CrossRef]
  25. Peng, N.; Zhou, J.; Chen, S.; Luo, X.; Chen, Y.; Gong, M. Synthesis of neodymium modified CeO2-ZrO2-Al2O3 support materials and their application in Pd-only three-way catalysts. J. Rare Earths 2012, 30, 342–349. [Google Scholar] [CrossRef]
  26. Polster, C.S.; Zhang, R.; Cyb, M.T.; Miller, J.T.; Baertsch, C.D. Selectivity loss of Pt/CeO2 PROX catalysts at low CO concentrations: Mechanism and active site study. J. Catal. 2010, 273, 50–58. [Google Scholar] [CrossRef]
  27. Lei, Y.; Li, W.; Liu, Q.; Lin, Q.; Zheng, X.; Huang, Q.; Guan, S.; Wang, X.; Wang, C.; Li, F. Typical crystal face effects of different morphology ceria on the activity of Pd/CeO2 catalysts for lean methane combustion. Fuel 2018, 233, 10–20. [Google Scholar] [CrossRef]
  28. Tan, H.; Wang, J.; Yu, S.; Zhou, K. Support Morphology-Dependent Catalytic Activity of Pd/CeO2 for Formaldehyde Oxidation. Environ. Sci. Technol. 2015, 49, 8675–8682. [Google Scholar] [CrossRef] [PubMed]
  29. Peng, R.; Sun, X.; Li, S.; Chen, L.; Fu, M.; Wu, J.; Ye, D. Shape effect of Pt/CeO2 catalysts on the catalytic oxidation of toluene. Chem. Eng. J. 2016, 306, 1234–1246. [Google Scholar] [CrossRef]
  30. Gu, D.; Jia, C.J.; Bongard, H.; Spliethoff, B.; Weidenthaler, C.; Schmidt, W.; Schüth, F. Ordered mesoporous Cu-Ce-O catalysts for CO preferential oxidation in H2-rich gases: Influence of copper content and pretreatment conditions. Appl. Catal. B Environ. 2014, 152–153, 11–18. [Google Scholar] [CrossRef]
  31. Song, S.; Zhang, C.; Lou, Y.; Wu, Y.; Wang, L.; Guo, Y.; Zhan, W.; Guo, Y. Effects of water on CO catalytic oxidation over Pd/CeO2. J. Rare Earths 2020, 38, 891–898. [Google Scholar] [CrossRef]
  32. Burch, R.; Hayes, M.J. CH bond activation in hydrocarbon oxidation on solid catalysts. J. Mol. Catal. A Chem. 1995, 100, 13–33. [Google Scholar] [CrossRef]
  33. Trovarelli, A.; Llorca, J. Ceria Catalysts at Nanoscale: How Do Crystal Shapes Shape Catalysis? ACS Catal. 2017, 7, 4716–4735. [Google Scholar] [CrossRef]
  34. Monai, M.; Montini, T.; Gorte, R.J.; Fornasiero, P. Catalytic Oxidation of Methane: Pd and Beyond. Eur. J. Inorg. Chem. 2018, 2018, 2884–2893. [Google Scholar] [CrossRef]
  35. Wang, R.; Dangerfield, R. Seed-mediated synthesis of shape-controlled CeO2 nanocrystals. RSC Adv. 2014, 4, 3615–3620. [Google Scholar] [CrossRef]
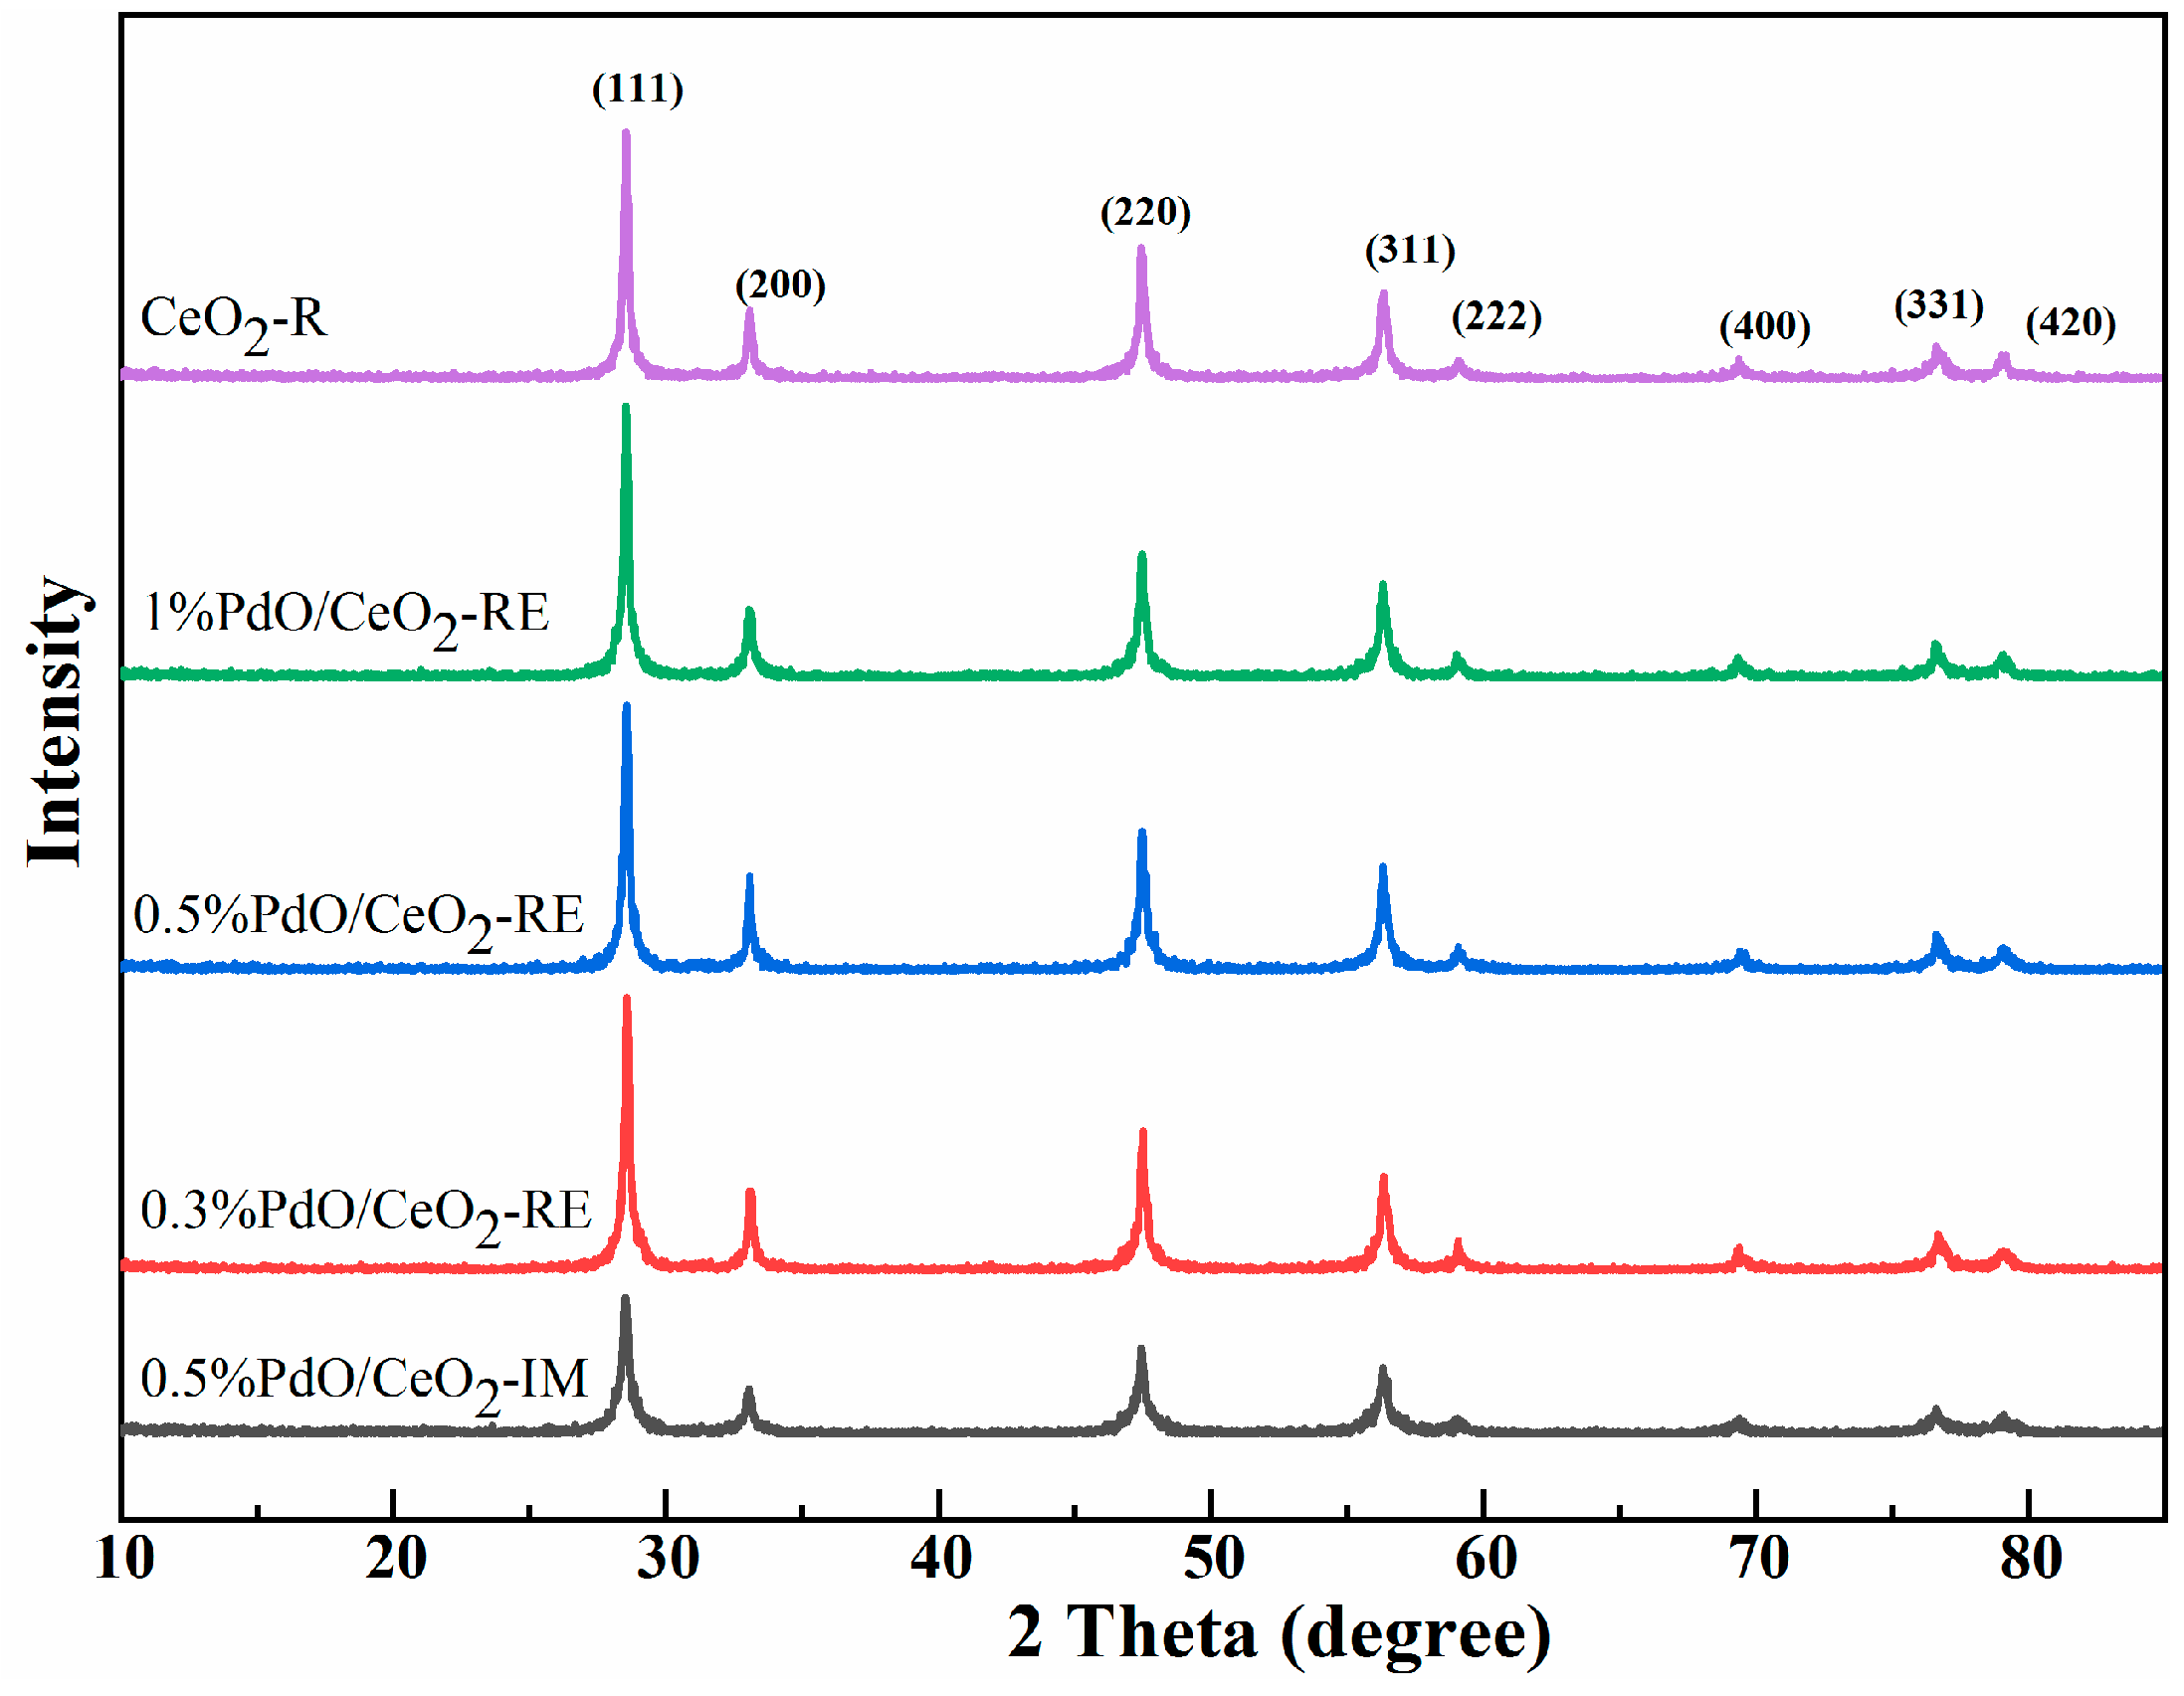
Figure 1. XRD pattern of CeO2-R and Pd/CeO2 catalysts.
Catalysts 11 00772 g001
Figure 2. TEM (a), HR-TEM (b) images of CeO2-R.
Catalysts 11 00772 g002
Figure 3. TEM, HRTEM images and Pd particle size distributions of (ac) 0.3% Pd/CeO2-RE, (df) 0.5% Pd/CeO2-RE and (gi) 1% Pd/CeO2-RE.
Catalysts 11 00772 g003
Figure 4. TEM and HRTEM images of (a) 0.3% PdO/CeO2-RE, (b) 0.5% PdO/CeO2-RE, (c,d) 1% PdO/CeO2-RE and (e,f) 0.5% PdO/CeO2-IM.
Catalysts 11 00772 g004
Figure 5. Pd 3d (a), Ce 3d (b) and O 1s (c) XPS spectra of the as-synthesized samples.
Catalysts 11 00772 g005
Figure 6. H2-TPR profile of CeO2-R and Pd/CeO2 catalysts.
Catalysts 11 00772 g006
Figure 7. CH4 conversion of CeO2-R and Pd/CeO2 catalysts (a) and ln r as a function of 1/T on Pd/CeO2 catalyst (b).
Catalysts 11 00772 g007
Figure 8. Schematic representation of the CH4 oxidation over the Pd/CeO2 catalyst.
Catalysts 11 00772 g008
Table 1. Pd content, dispersion and texture parameters of CeO2-R and Pd/CeO2 catalysts.
SamplesPd Loading a (wt%)Specific Surface Area b (m2/g)Pd Dispersion c (%)Grain Size d (nm)
CeO2-R-52.8-12.0
0.3% PdO/CeO2-RE0.3135.331.411.9
0.5% PdO/CeO2-RE0.4730.233.212.0
1% PdO/CeO2-RE0.8929.429.112.0
0.5% PdO/CeO2-IM0.4827.930.212.1
a Detected by ICP-AES. b Measured by N2 adsorption-desorption isotherm. c Measured by CO chemical adsorption. d Calculated by the Scherrer equation from the diffraction peak of (111).
Table 2. Chemical and structural data of CeO2-R and Pd/CeO2 catalysts.
SampleSurface Pd Species Content (%)Ce3+/(Ce3++Ce4+) (%)Oads/(Olat+Oads) (%)Pd Atomic (%)TOF a (×103 s−1)Ea (kJ/mol)
Pd2+PdxCe1−xO2−δPd0
CeO2-R0.160.41
0.3% PdO/CeO2-RE55.2844.720.250.490.1222.372.7
0.5% PdO/CeO2-RE72.6627.340.240.470.3625.561.6
1% PdO/CeO2-RE81.3418.660.180.431.345.093.1
0.5% PdO/CeO2-IM49.3337.9112.760.190.450.3010.574.2
a TOF values are calculated based on the conversion of methane at 360 °C.
Publisher’s Note: MDPI stays neutral with regard to jurisdictional claims in published maps and institutional affiliations.