Article

Improving the Conversion of Biomass in Catalytic Pyrolysis via Intensification of Biomass—Catalyst Contact by Co-Pressing

Department of Chemical Engineering, University College London, London WC1E 7JE, UK
*
Author to whom correspondence should be addressed.
Catalysts 2021, 11(7), 805; https://doi.org/10.3390/catal11070805
Submission received: 6 June 2021 / Revised: 24 June 2021 / Accepted: 29 June 2021 / Published: 30 June 2021
(This article belongs to the Section Biomass Catalysis)

Abstract

:
Biomass pyrolysis is a promising technology for fuel and chemical production from an abundant renewable source. It takes place usually in two stages; non-catalytic pyrolysis with further catalytic upgrading of the formed pyrolysis oil. The direct catalytic pyrolysis of biomass reduces the pyrolysis temperature, increase the yield to target products and improves their quality. However, in such one-stage process the contact between biomass and solid catalyst particles is poor leading to an excessively high degree of pure thermal pyrolysis reactions. The aim of this study was to enhance the catalyst-biomass contact via co-pressing of biomass and catalyst particles as a pre-treatment method. Catalytic pyrolysis of biomass components with HY and USY zeolites was studied using thermogravimetric analysis (TGA), as well as experiments in a pyrolysis reactor. The liquid and coke yields were characterized using gas chromatography, and TGA respectively. The TGA results showed that the degradation of the co-pressed cellulose occurred at lower temperatures compared to the pure thermal degradation, as well as catalytic degradation of non-pretreated cellulose. All biomass components produced better results using the co-pressing method, where the liquid yields increased while coke/char yields decreased. Bio-oil from catalytic pyrolysis of cellulose with HY catalyst mainly produced heavier fractions, while in the presence of USY catalyst medium fraction was mainly produced within the gasoline range. For hemicellulose catalytic pyrolysis, the catalysts had similar effects in enhancing the lighter fraction, but specifically, HY showed higher selectivity to middle fraction while USY has produced higher percentage of lighter fraction. Using with both catalysts, co-pressing had the best effect of eliminating the heavier fraction and improving the gasoline range fraction. Spent catalyst from co-pressed sample had lower concentrations of coke/char components due to the shorter residence times of volatiles, which suppresses the occurrence of secondary reactions leading to coke/char formations.

Graphical Abstract

1. Introduction

Biomass feedstock has received consistent attention due to their vast potential as sustainable materials to replace fossil fuels in energy applications and petrochemical production [1,2,3,4,5]. Biomass is composed of cellulose (40–60%), hemicellulose (20–40%), and lignin (20–35%). It also contains small amounts of pectin, protein, extractives, and ash [1,6,7,8,9]. Cellulose is a glucose polymer linked by a β-1-4-glycosidic bond [1,4,5,9]. Its structure is regular with higher crystallinity without any branched chains [10,11,12]. Hemicellulose is a complex polymer mainly composed of pentoses (xylose and arabinose) and hexoses (mannose, galactose, and glucose) [1,4,5,9,10,11,12] that are highly substituted with acetic acid [2]. Hemicellulose polysaccharides differ, in terms of their structures as well as physical and physicochemical properties [10,11]. Lignin, the third major constituent, is a cross-linked phenolic polymer comprised of three constituent monomers (p-hydroxyphenyl, guaiacyl, and syringyl) with no regular repeating structure [1,3,4,9,11]. Lignin is relatively hydrophobic [8] and aromatic in nature [2,10] with several hydroxyl and methoxy branched chains [2,7,11,13,14].
Biomass is described by high moisture content, low calorific value, large volume and low bulk density which poses difficulties in it is collection, processing, transportation and storage, as well as low conversion efficiency to hydrocarbon fuels [15]. The low bulk density associated with lignocellulosic biomass has been a consistent factor that negatively influences the pyrolysis product yields and compositions [16]. To address these issues different biomass pre-treatment techniques have been developed, which include the widely reported torrefaction and pelletization [15]. These technologies can convert biomass into densified products for pyrolysis process [16]. The densified products produced using these technologies have improved bulk density, handling efficiency and compositional quality, as well as conformance to specifications for conversion technologies [2].
Torrefaction is a biomass pre-treatment process where it is subjected to a mild thermal treatment at relatively low temperatures of around 200–350 °C in an inert atmosphere for the sake of densification [4,17,18,19]. On the other hand, pelletization involves compressing of the biomass by applying mechanical force to produce uniformly sized pellets [15,20,21,22]. Torrefaction and pelletization are often used as biomass pre-treatment processes prior to pyrolysis to improve the heat flow and mass transfer during pyrolysis [4,20,21,23], as well as to increase the total carbon yield and aromatic hydrocarbons in the bio-oil [20].
The application of catalysts in biomass pyrolysis can alter the pyrolysis products distribution and increase the yield to target products [24]. Various deoxygenation reactions are promoted at the acid sites of the catalyst [20,25,26,27], such as dehydration, decarboxylation, decarbonylation, hydrogen transfer, aldol condensation, Diels-Alder reaction, aromatization and rearrangement reactions that convert the oxygen containing compounds into different hydrocarbons. As such, different types of catalysts have been introduced to increase the quality of products over a range of deoxygenation processes [24]. The catalyst performance can be promoted by improving the physical contact between biomass and catalyst. This causes changes in the biomass decomposition mechanism and leads to the formation of products of catalytic pyrolysis with high selectivity. On the other hand, the decomposition can be achieved at lower reaction temperatures due to the improved contact between biomass and catalyst [28]. In order to achieve these objectives, a co-pressing method was adopted in this study which is similar in principle to pelletisation. Despite the improvement of the production of aromatic hydrocarbons by the use of catalyst, the actual yields are still below commercialization potential. Improving the process through pre-treatment process and other means is essential in order to upgrade the hydrocarbon production [29].
Furthermore, biomass is poor conductor of heat which leads to heat transfer difficulties during pyrolysis. Improving the contact between biomass and catalyst will directly influence the yield and properties of the bio-oil. Better physical surface contact between biomass and catalyst allows initiation of catalyzed reactions at relatively low temperatures as well as immediate interaction of evolved pyrolysis vapours with catalytic active sites. It also controls the rate of deoxygenation and aromatization reactions [30].
Tar formation is one of the problems during the upgrading of the pyrolysis oil [31]. These are higher molecular weight hydrocarbons that condense along the exit of the reactor and in exit pipes leading to blockages during pyrolysis [2]. Tar removal is one of the greatest technical challenges for the successful development of commercial biomass conversion technologies [2,32]. In most cases the amount of tar decreased drastically with temperature [33]. Therefore, one of the best methods of reducing tar formation is to operate at higher temperatures. Furthermore, due to their cracking activity acidic zeolite catalysts performed better in reducing the amount of tar compared to other catalysts [31,32]. Therefore, increasing the catalyst acidity results in the reduction of tar [33]. It was reported that, HY and HZSM-5 were the best catalysts in reducing the tar formation [31]. By selecting the right catalyst, it is possible to optimize hydrocarbon yield while minimizing char, coke and tar formations. As shown in the graphical abstract, the first set of experiments carried out without the pre-treatment procedure resulted in a dirty reactor and condensers due to the deposition of tar along the wall of the reactor, condensers and exit pipes. In extreme cases, the experiment needed to be interrupted to clean the exit which made the process impracticable. To address these worrisome issues, the co-pressing pre-treatment method was used and as shown in the graphical abstract, a very clean system with almost zero tar deposition was obtained. Other specific objectives set to achieve using the co-pressing method include, alleviating heat transfer difficulties during the pyrolysis by densifying the biomass into pellet and providing intimate contact between the biomass and catalyst. This ensures a higher conversion of oxygenates into hydrocarbons without increasing the temperature or requiring higher catalyst acidity enhancing the commercial feasibility of a biomass pyrolysis process.
In this work, the influence of the co-pressing method in catalytic pyrolysis of cellulose, hemicellulose and lignin with HY and USY zeolites was studied and compared with catalytic pyrolysis without any pre-treatment. HY and USY zeolites were selected due to their drastic effect in reducing the tar formation and improving the hydrocarbon production. For this purpose, we used thermogravimetric analysis, as well as reactor experiments to investigate the performance of the corresponding systems. We used gas chromatography for liquid product characterization in order to assess the product quality.

2. Results and Discussion

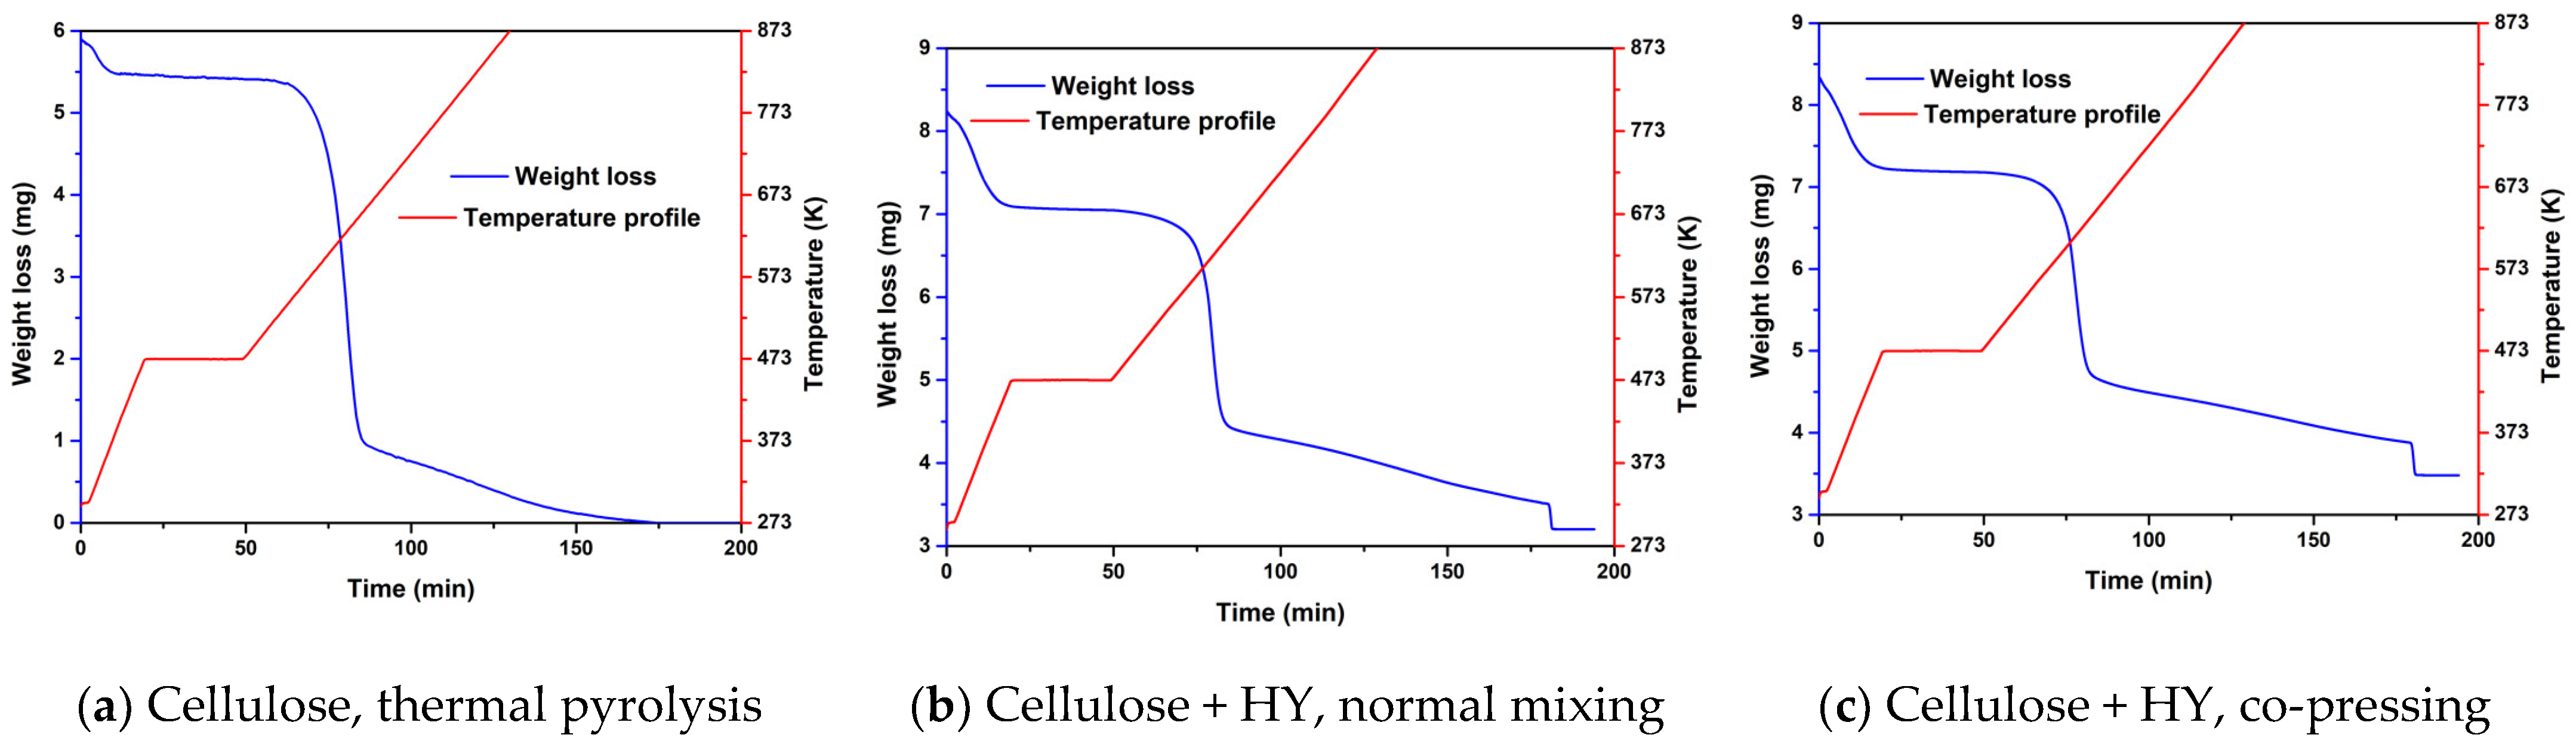
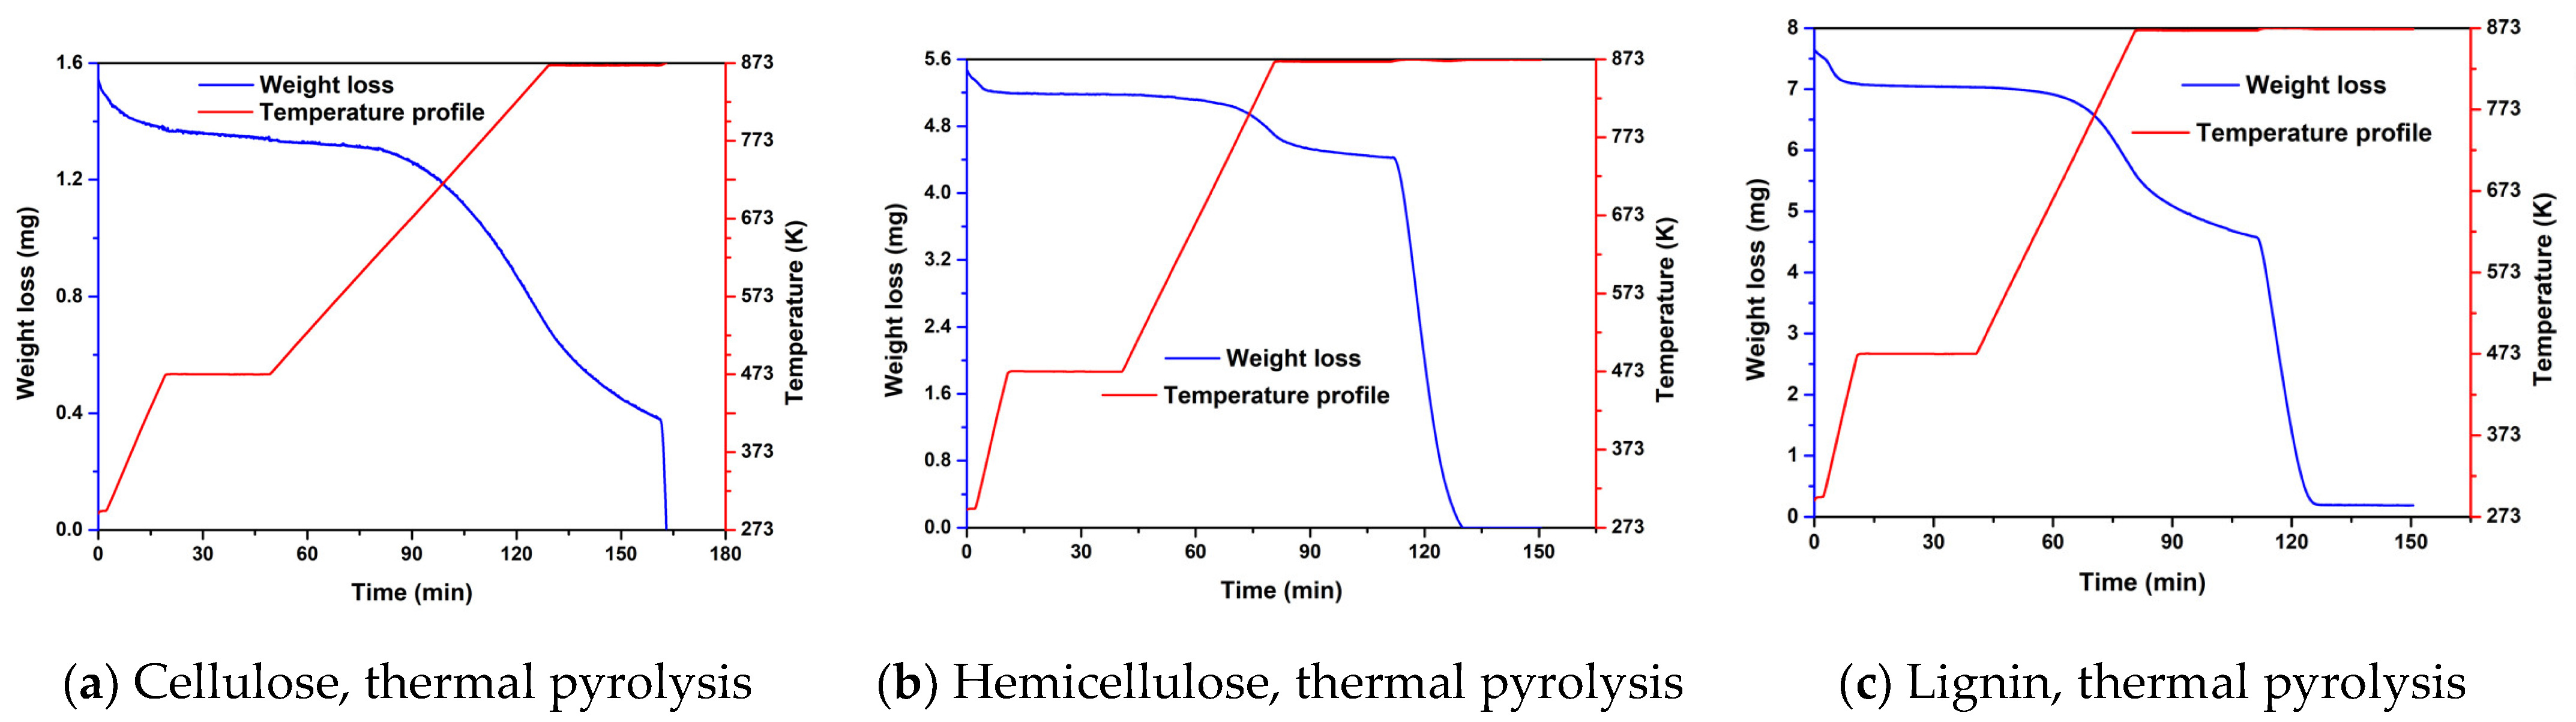
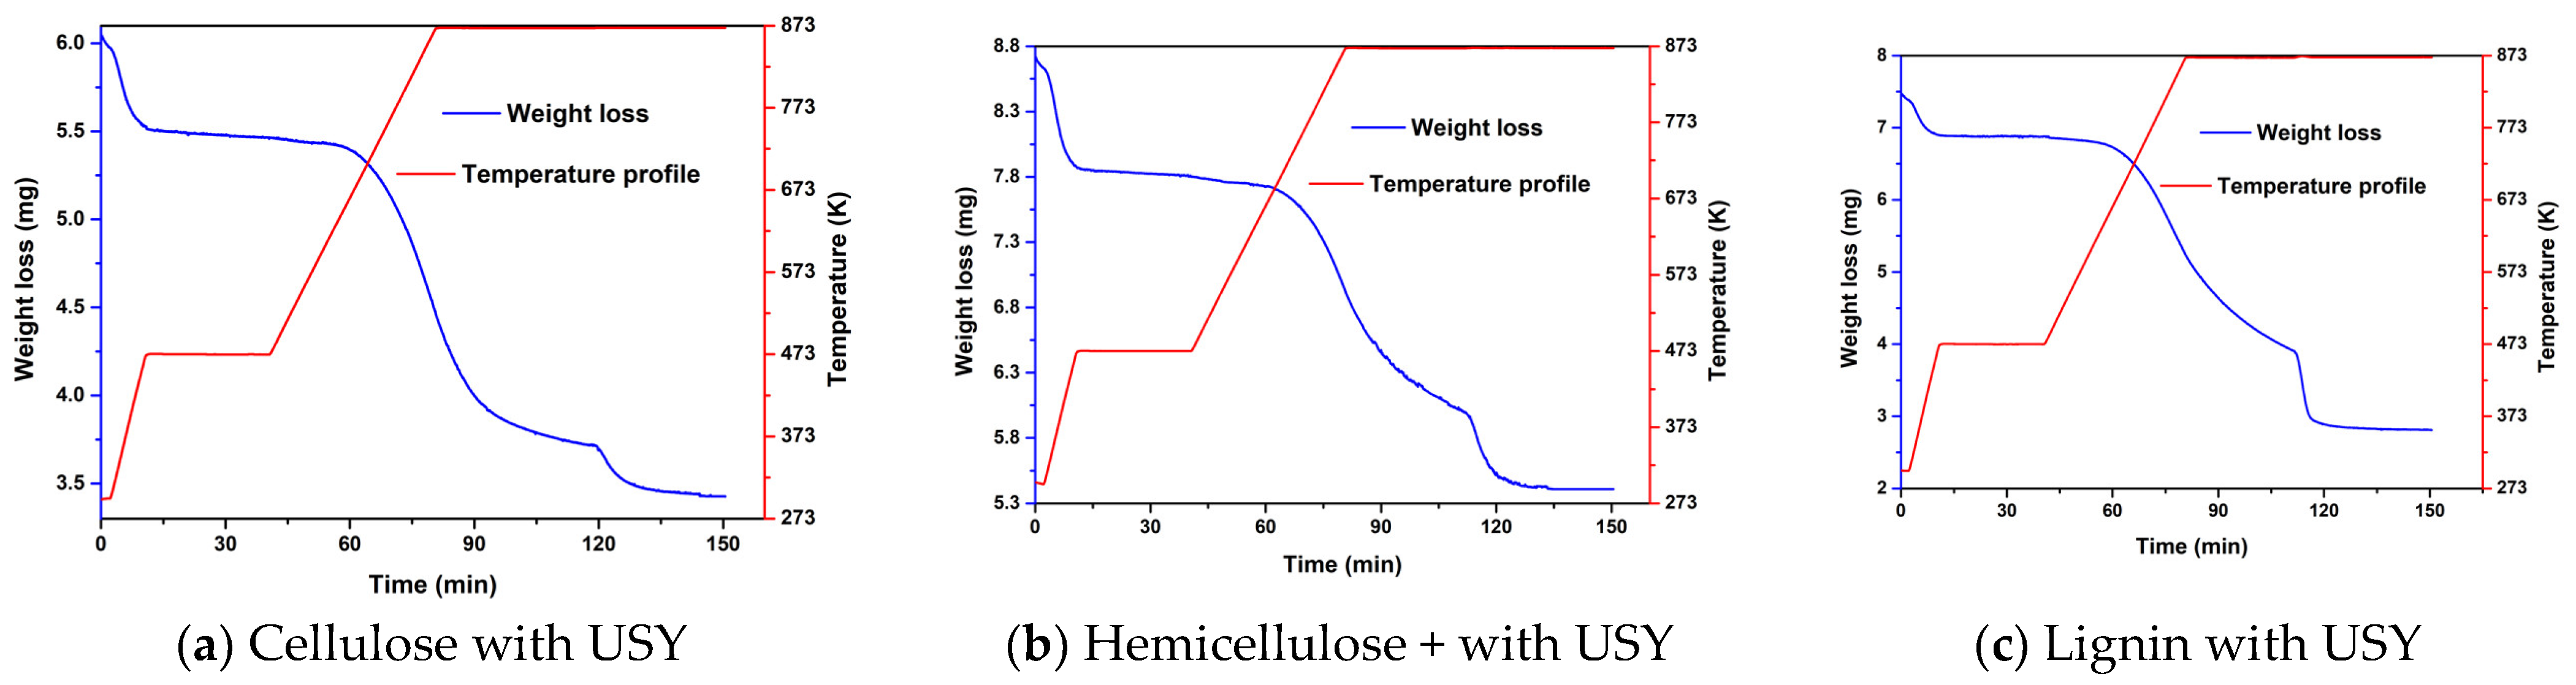
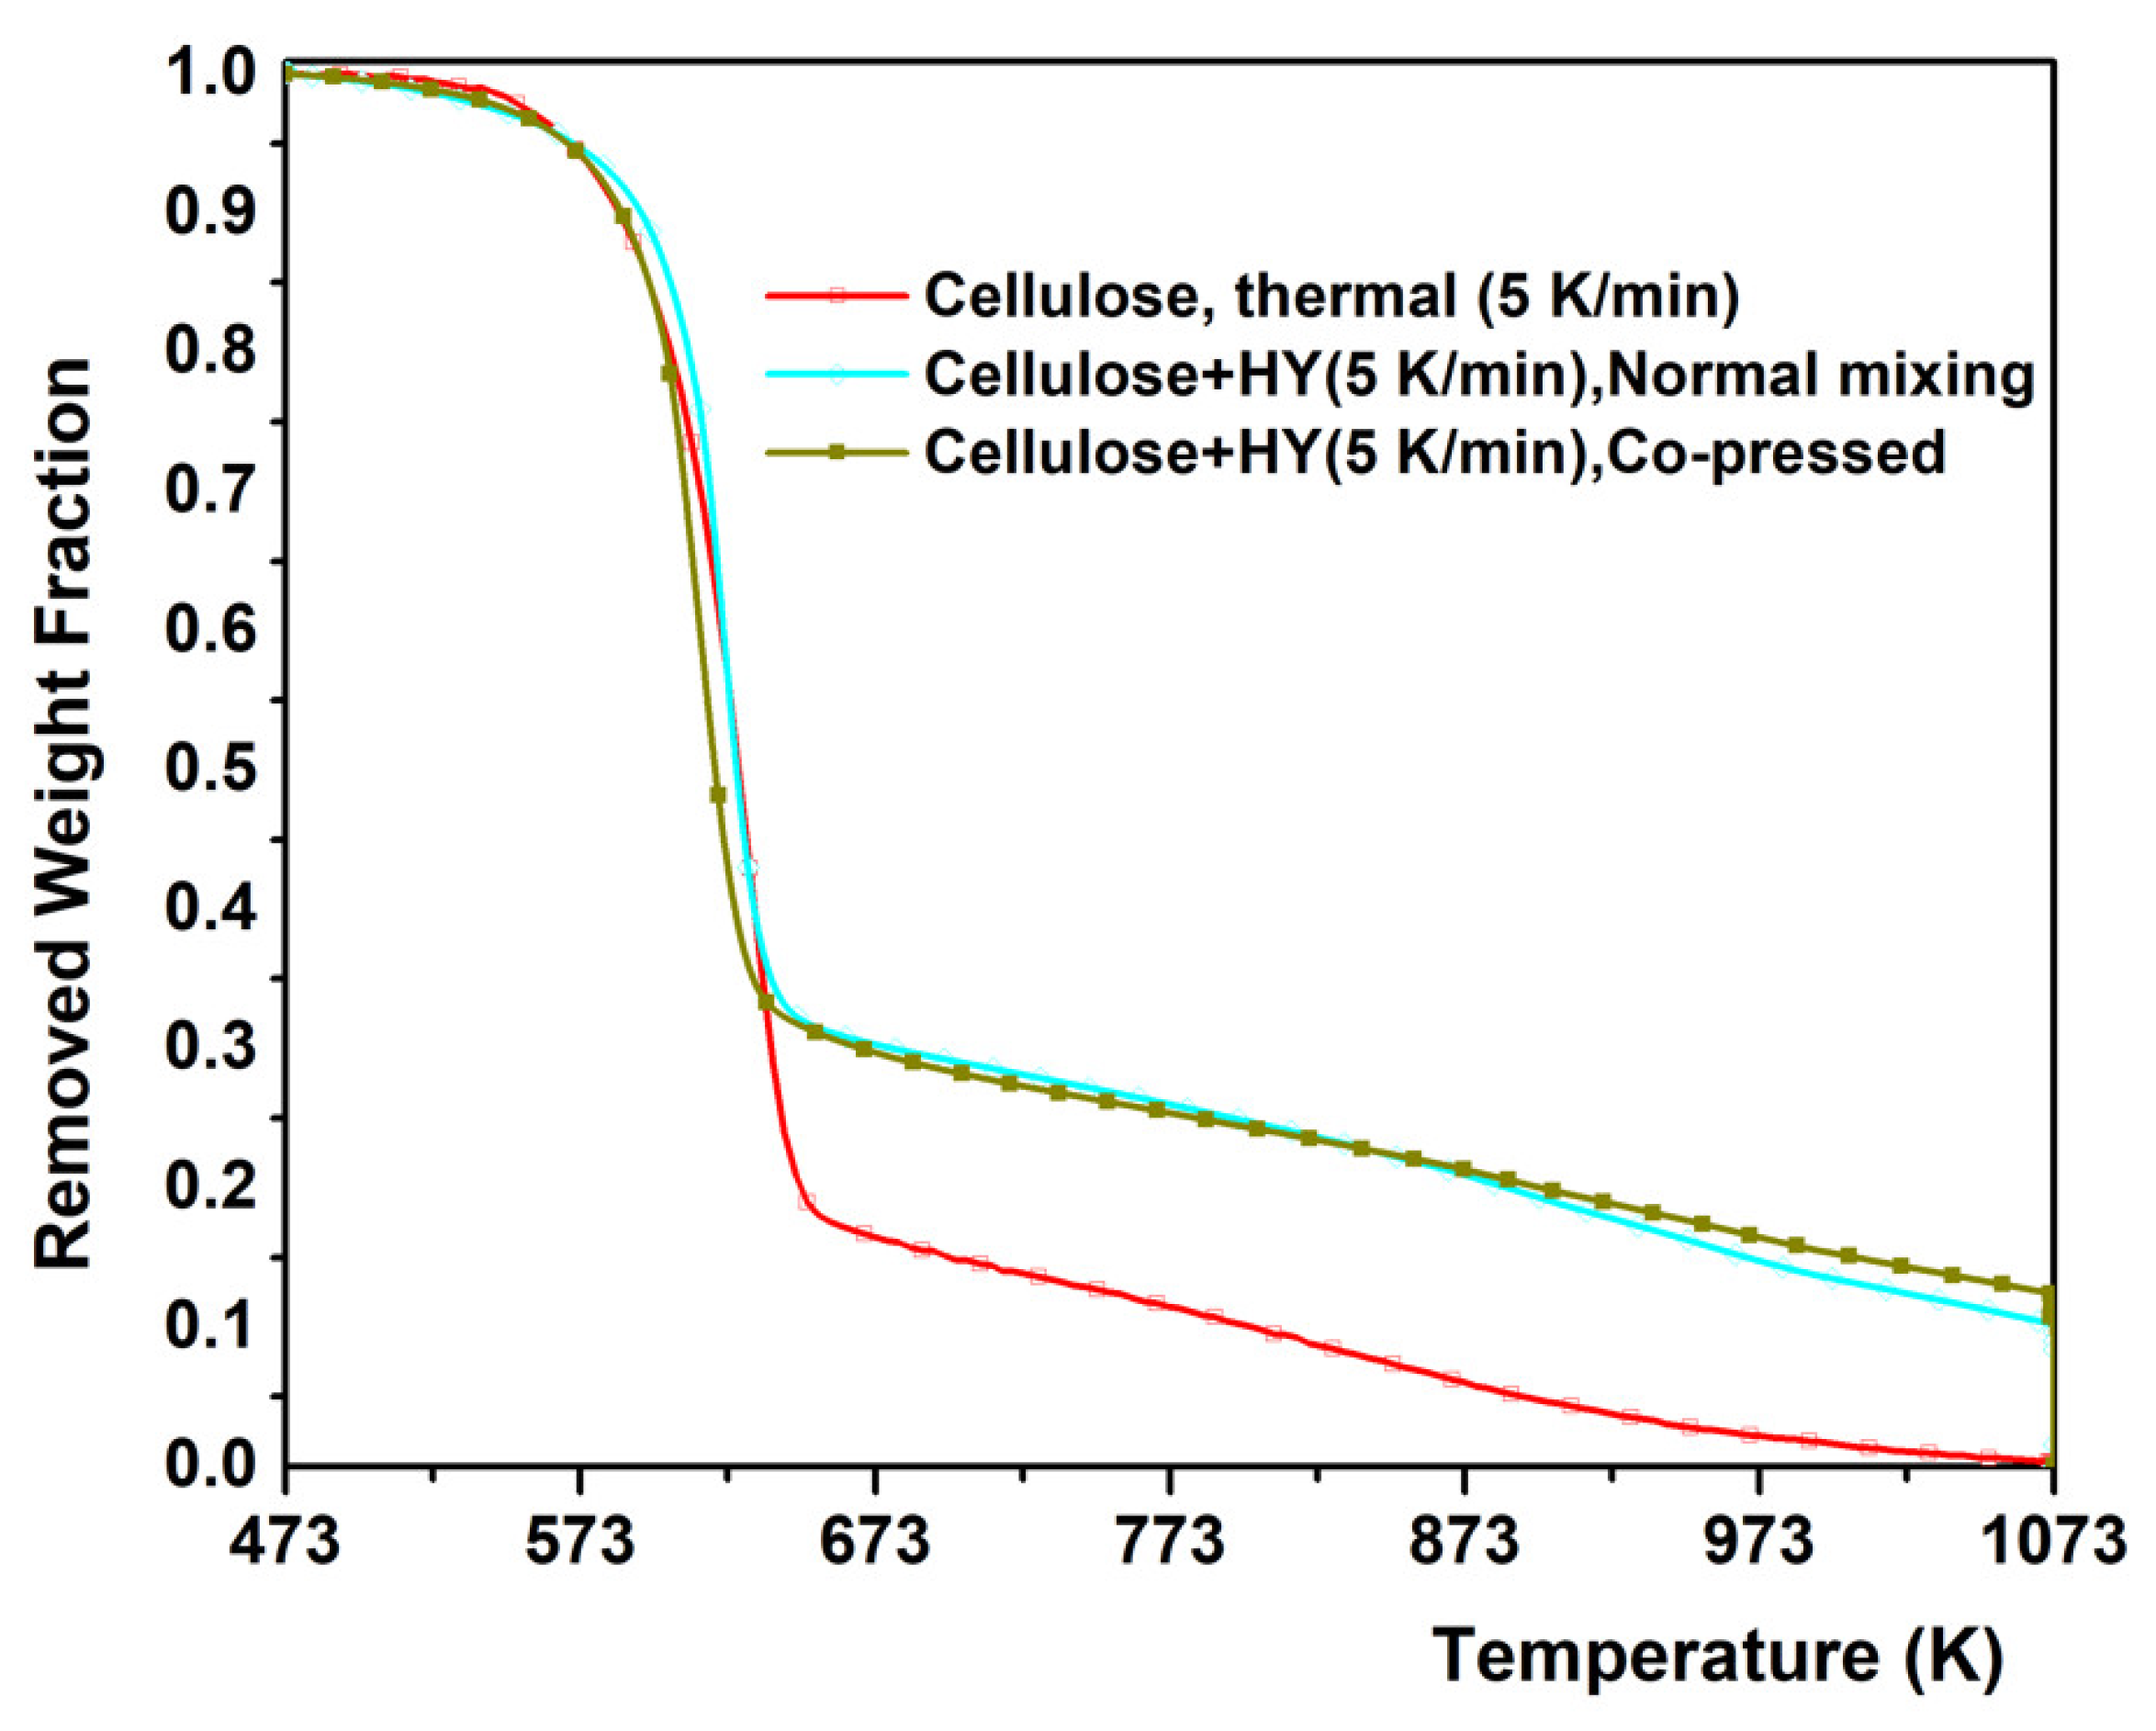
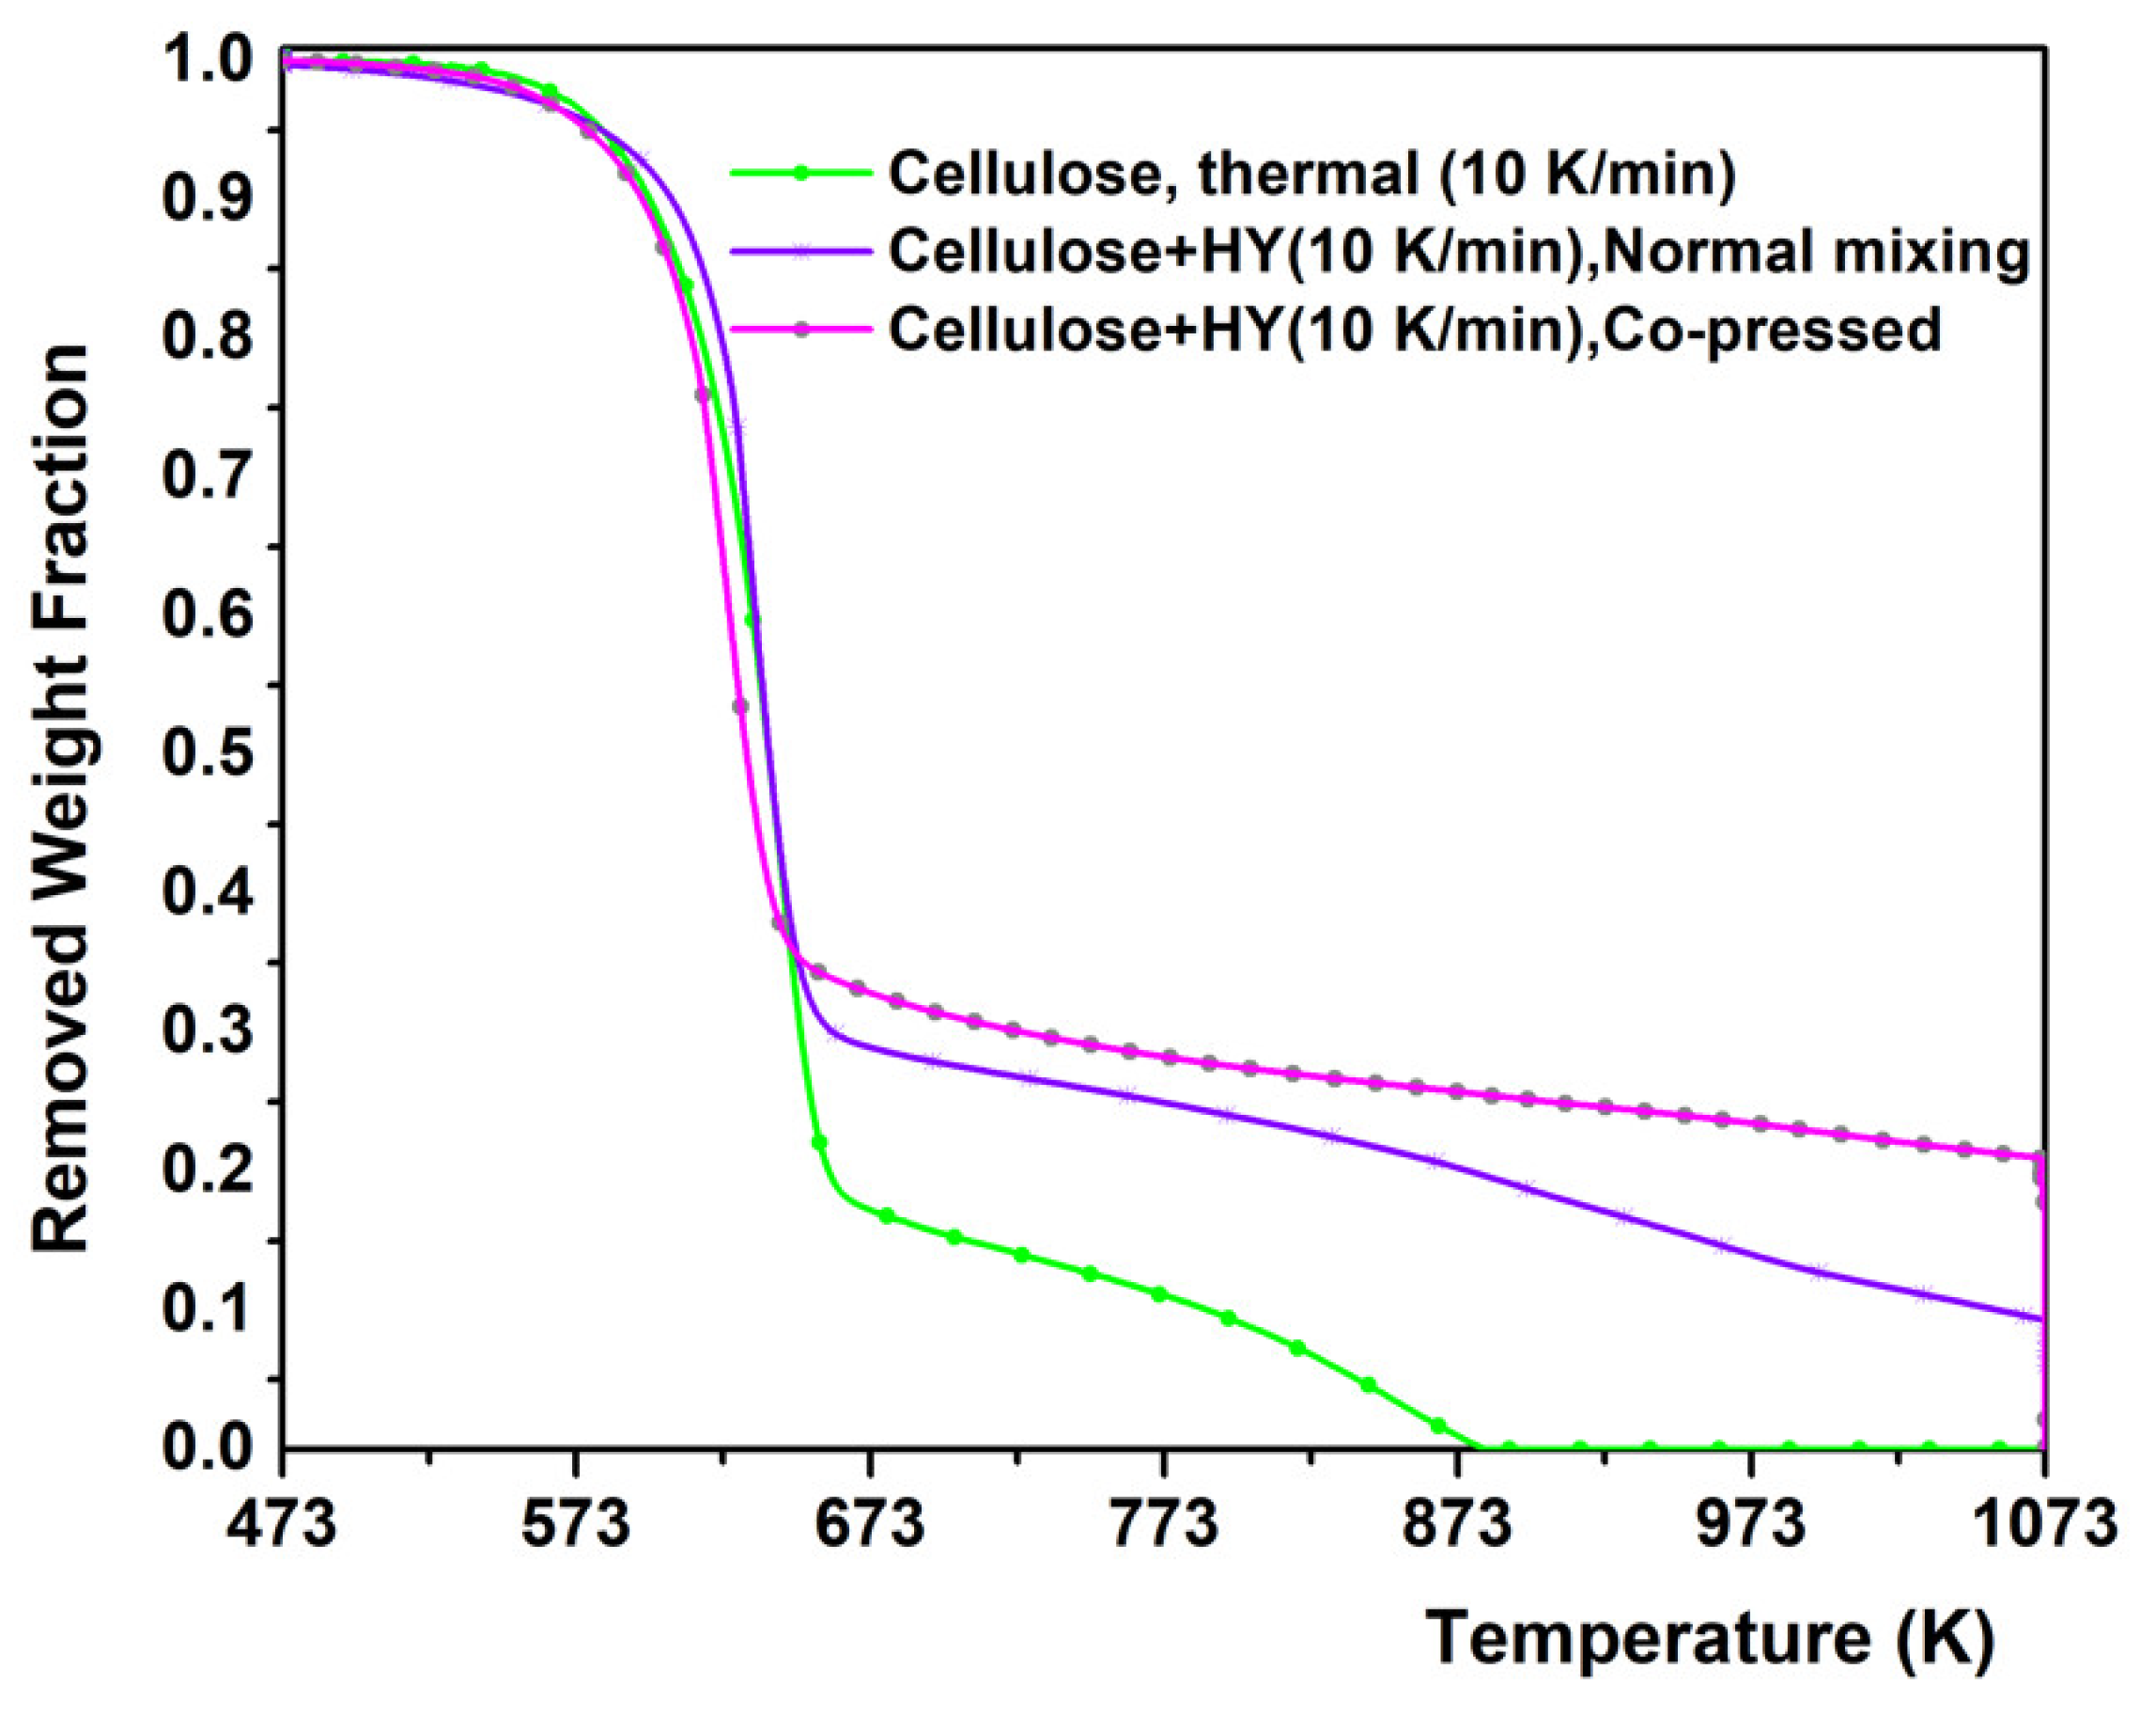
2.1. Experimental Results from TGA of Thermal and Catalytic Degradation of Cellulose

TGA of cellulose was performed in the absence and presence of HY catalyst at different heating rates to examine the effect of pre-treatment (co-pressing) in catalytic pyrolysis as shown in Figure 1 (5 K/min) and 2 (10 K/min) respectively. Raw TGA data are provided in Appendix A, Figure A1, Figure A2, Figure A3, Figure A4, Figure A5, Figure A6 and Figure A7. As the purpose of TGA experiments was to study the effect of pre-treatment via co-pressing and identify differences between normal mixing and co-pressing, only cellulose as biomass constituent and only HY catalyst were used. The results show two phases of pyrolysis: An initial steep decomposition followed by a much gentler decline later on.
Figure 1 shows that the main thermal pyrolysis of cellulose without catalyst at 5 K/min occurred within the range of 570–645 K, whereas at 10 K/min (Figure 2) the decomposition shifted to higher temperatures with the main degradation attained at 572–655 K. In contrast, the catalytic degradation of cellulose with HY catalyst via the normal mixing occurred at 580–648 K.
For the pre-treated sample via co-pressing method, the degradation took place at lower temperatures compared to the previous cases with the main degradation attained in the range of 565–630 K. The catalytic degradation of cellulose at 10 K/min shifted to higher temperature with the main degradation happens at 582–661 K, and 570–642 K for normal mixing and co-pressing methods, respectively (Figure 2). These results had indicated that the co-pressing method has improved catalytic degradation of cellulose by further lowering the decomposition temperature, in particular in the first decomposition stage.
As presented in Figure 1 and Figure 2, the first phase of cellulose decomposition involved an active pyrolytic stage or volatilization [34,35], which was extended up to 673 K. Depolymerisation of cellulose in this temperature range leads to the formation of levoglucosan due to the intramolecular dehydration reactions [35,36,37]. The next transformation was charring/coking or passive stage [34], which was the dominant process up to the final temperature (1073 K). At this stage levoglucosan further degraded to form secondary char or other volatile products [38] and the formation of char is favoured over other products [39]. The last process that took place at the final temperature in our TGA experiments, involved burning of the accumulated char/coke in the presence of air. For the thermal pyrolysis of cellulose there was no residual mass left at the end of the TGA heating. The lower heating rate had allowed longer residence time of volatiles inside cellulose particles and within the reactor, favouring secondary reactions such as cracking, re-condensation and polymerization, which eventually led to higher char formation up to 1073 K [40]. When the heating rate increased, the char residue decreased due to the higher intensity of the active pyrolytic process [1]. This agreed well with the experimental results conducted by Chen et al. [1] where the char residue decreased with increasing heating rate in TGA of cellulose thermal pyrolysis. When the heating rate increased from 5 to 10 K/min the amount of the solid residue (char and coke) obtained via normal mixing remained unchanged (10 wt.%) while with the co-pressed sample the amount has increased from (12 to 21 wt.%). Assuming that the presence of HY catalyst did not affect the production of char, the solid residue in catalytic pyrolysis was mainly composed of coke [41]. Therefore, more coke was generated with the co-pressed sample signifying the higher degree of catalytic hydrocarbon conversion which was strengthened with increased heating rate. The higher char/coke content can also be linked to the catalytic activity of the catalyst. HY is very active even at relatively low temperatures and effective in the initial degradation due to its higher surface area and acid site density [31,42,43,44,45]. In the presence of co-pressing method, HY produces higher amount of coke/char at lower temperatures and emits higher amount of volatiles during the coke/char stabilization at higher temperatures [46]. Furthermore, coke/char formation from gas phase volatiles may be facilitated at higher reaction temperature with subsequent conversion of the primary coke/char into secondary coke/char [47].
Similar to the devolatilization temperature obtained from cellulose thermal decomposition, Yang et al. [11] and Li et al. [41] reported decomposition temperature ranges of 588–673 K and 573–673 K during the non-catalytic TGA heating of cellulose. On the other hand, Liu et al. [48] and Wang et al. [49] also reported an increase in the maximum degradation temperature of cellulose when heating rate was increased. The restricted catalytic reaction during the TGA pyrolysis of cellulose can be explained by the kinetic diameter of cellulose (8.6 Å) which is larger than the pore size of HY zeolite (7.4 × 7.4 Å) [50]. In this case, catalytic reactions are limited to the acid sites located on the external surface of HY catalyst and the presence of coke/char from cellulose thermal/catalytic reactions reduces the availability of these acid sites. The available number of acid sites on the external surface of HY zeolite can be improved by maximizing the contact between the cellulose and HY zeolite as with the co-pressed sample. This would allow the degradation to take place at lower reaction temperature (Figure 1 and Figure 2), thereby enhancing the catalytic reaction of cellulose with HY catalyst. Corroborated results were also reported by Kim et al. [50] and Xue et al. [51] where similar degradation temperatures were obtained for noncatalytic and catalytic pyrolysis of cellulose using HY zeolite and mesoporous catalyst MCM-41. Similar results by Muhammad and Manos [42] showed that catalytic degradation can be improved by enhancing the contact between the catalyst and polymer.

2.2. Pyrolysis Reactor Experiments

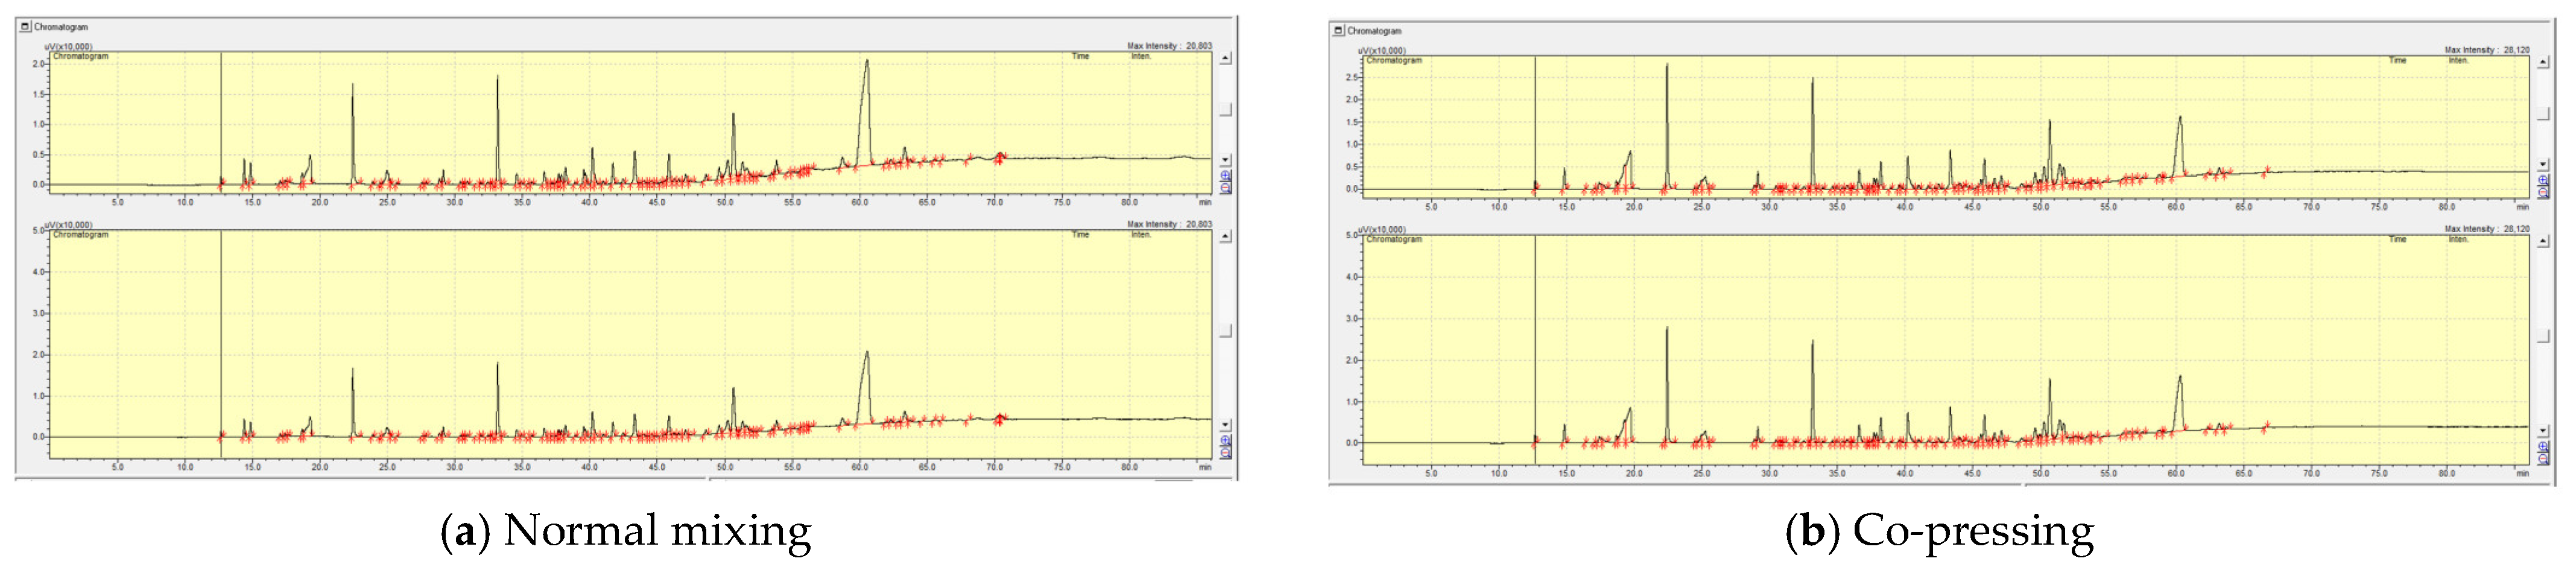
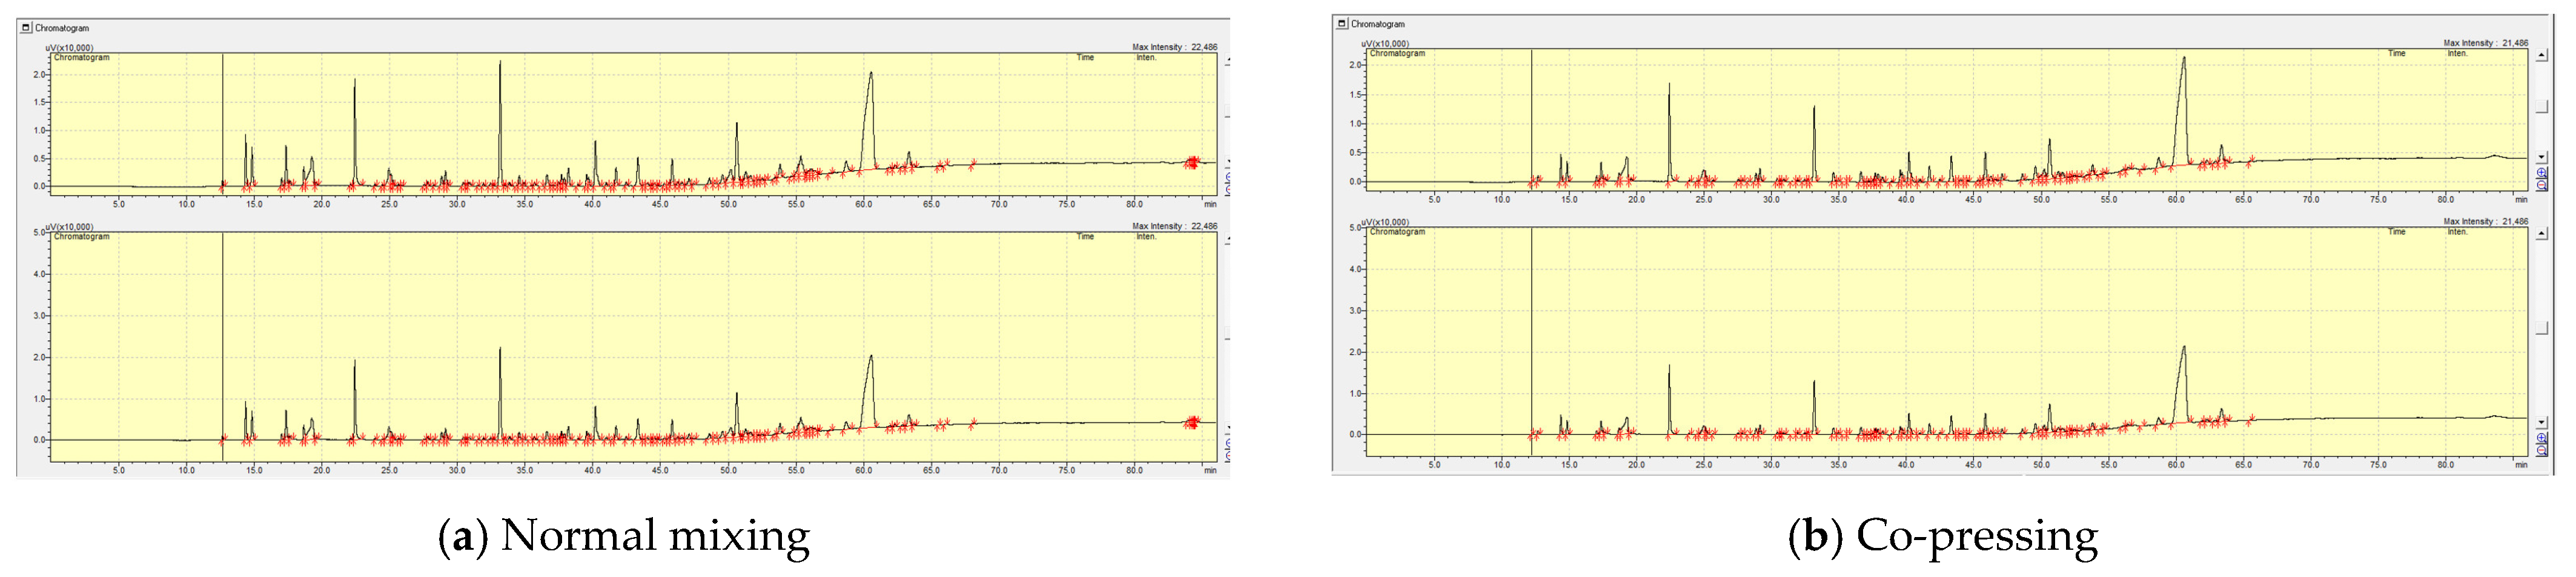
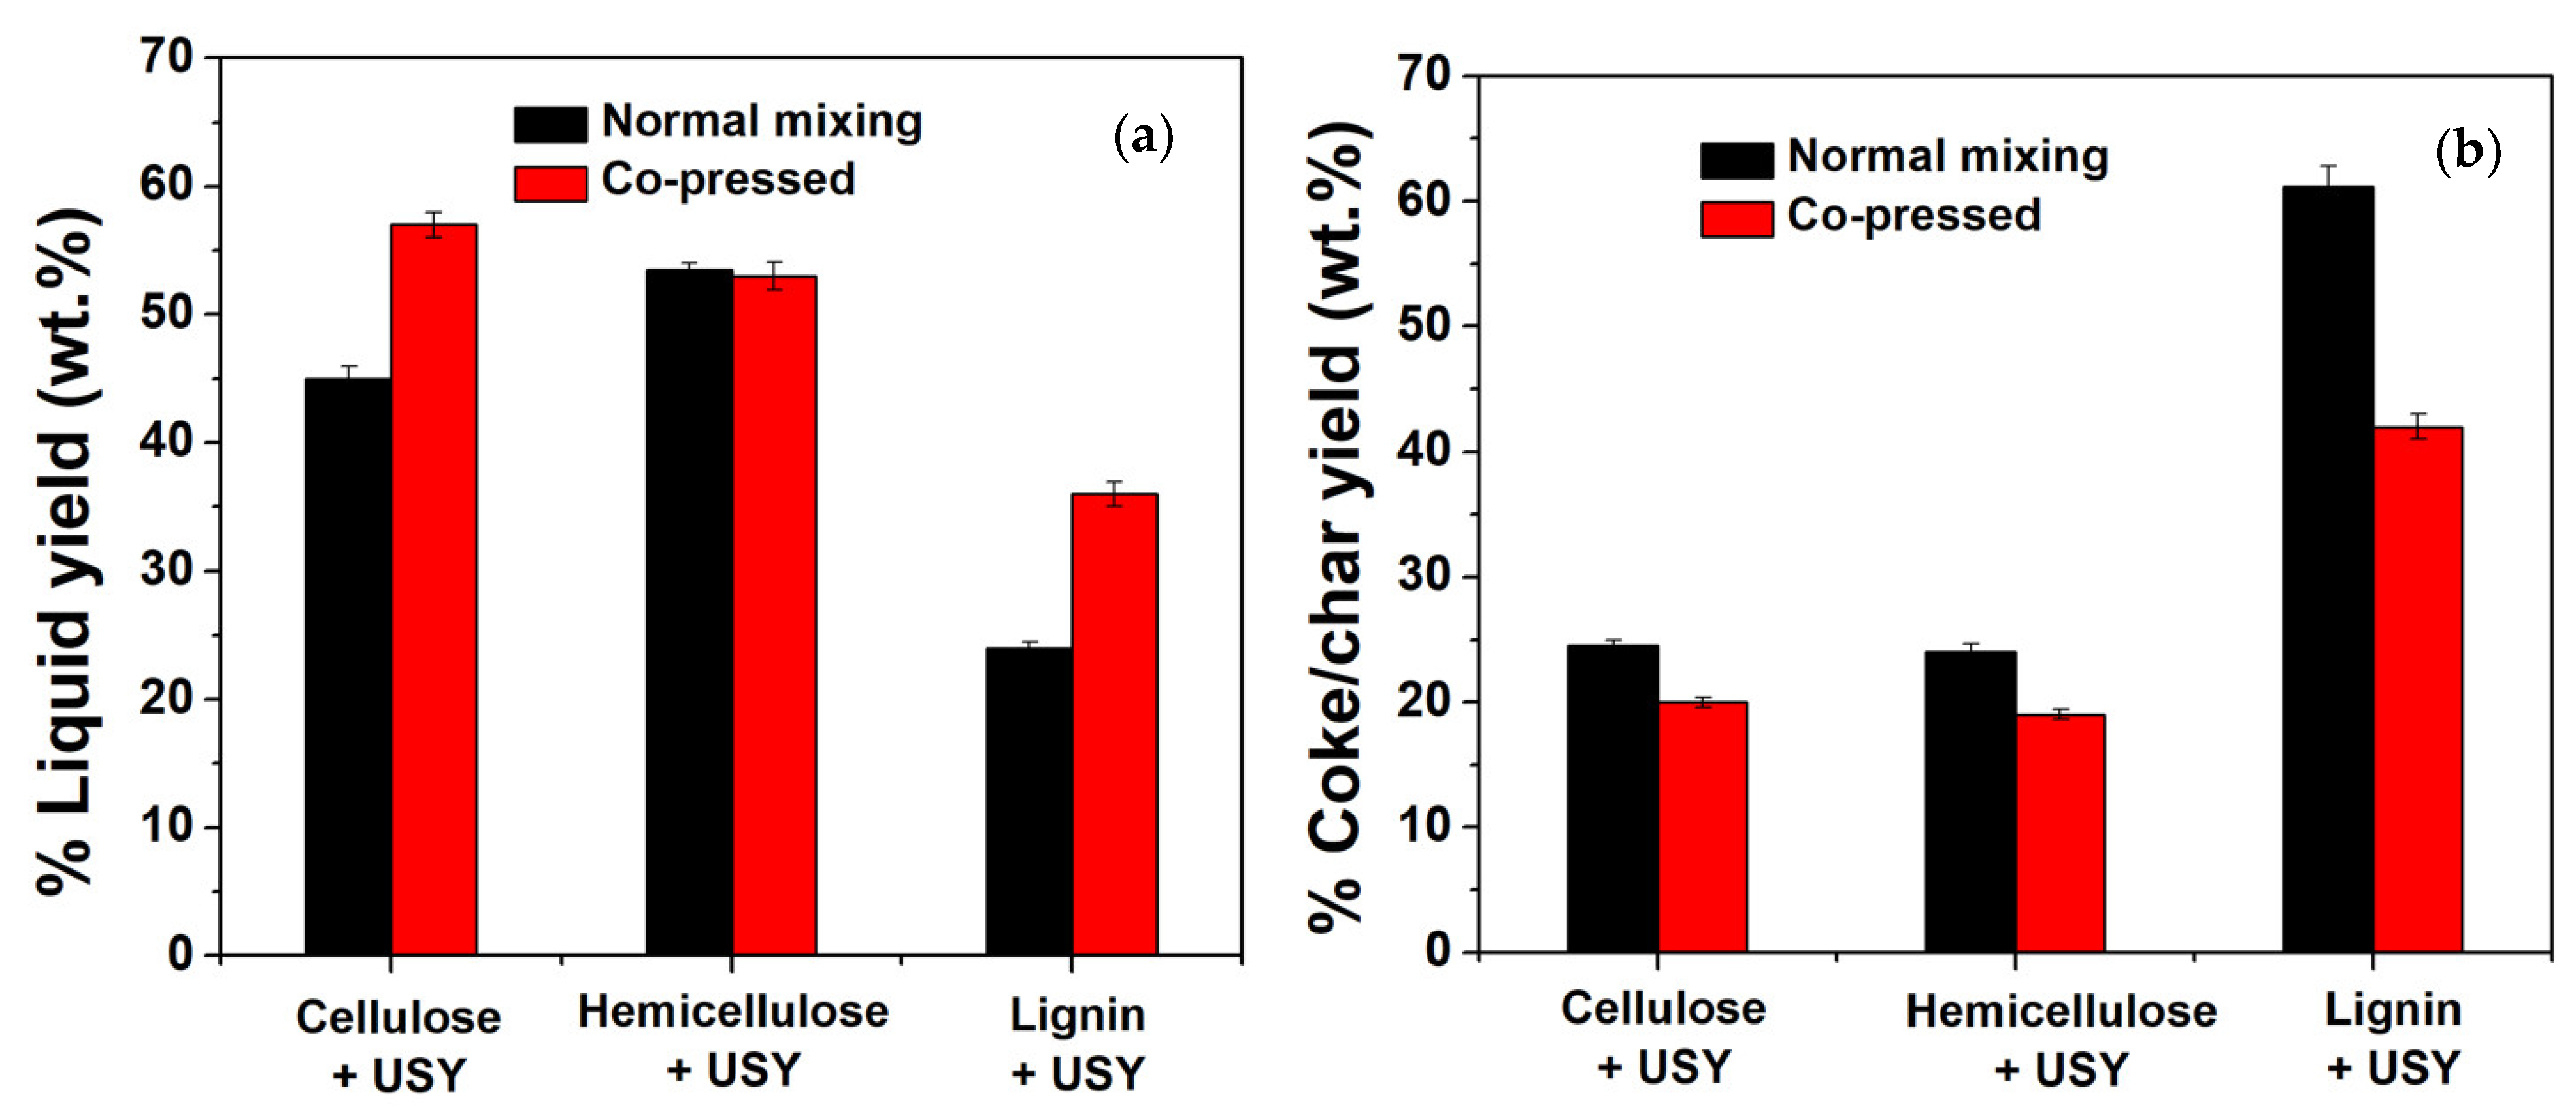
2.2.1. The Effect of Co-Pressing Pre-Treatment Method on Liquid Product Yields

Pyrolysis reactor experiments of biomass components and USY catalyst were carried out to study the effect of using pre-treatment method (co-pressing) on the performance of the product yields. Figure 3 shows the results of the product yields. Reproducibility experiments were carried out. Based on the calculated experimental error range of these experiments, error bars were added in the figures (Appendix A, Table A1). Based on Figure 3, 45.0% and 24.5% of liquid and coke/char yields were obtained from catalytic pyrolysis of cellulose using normal mixing. Using co-pressing, the values changed to 57.0% and 20.0% for the liquid, and coke/char yields, respectively. For Hemicellulose catalytic pyrolysis without pre-treatment, 53.5% and 24.0% of liquid and char/coke yields are produced. With co-pressing the values decreased to 53.0%, and 19.0%, respectively. Catalytic pyrolysis of lignin with USY showed similar trend with cellulose. The liquid yield increased from 24.0% to 36.0% while the coke/char yield decreased from 61.2%, to 42.0% for normal and co-pressed samples, respectively.
All three components of the biomass produce better results using the co-pressing method, where the liquid yields were increased and coke/char yields had decreased. Hemicellulose produces similar amount of liquid yields irrespective of the pre-treatment used. The presence of shorter molecule chain and more branches in hemicellulose makes it decompose faster as well as at lower temperatures [52,53]. The pyrolysis products formed, which are intensified with co-pressing, could be carried out by the inert gas easily [53], hence, the lower liquid yield with the co-pressed sample. Among the biomass component, lignin produces the lowest liquid yield as well as the highest coke/char yield. This can be explained by the complex structure of lignin that is difficult to decompose [11] and has a weaker catalytic effect compared with cellulose and hemicellulose [54,55]. The product yields from catalytic pyrolysis of lignin has been improved through co-pressing method resulting in higher liquid yield and lower coke/char yield respectively. Muhammad and Manos [56] reported an increase in liquid yield from 41.5% to 52.0% and decrease in coke/char yield from 25.0% to 26.0% for un-treated and co-pressed cellulose with USY, studied at 723 K and 10 mLN/min flow rate. The liquid yield from this study showed the same effect as presented in Figure 3, while the coke/char yield of the co-pressed sample has increased due to the lower N2 flow rate in the latter study, which has increased the residence time of the volatiles in the reactor.

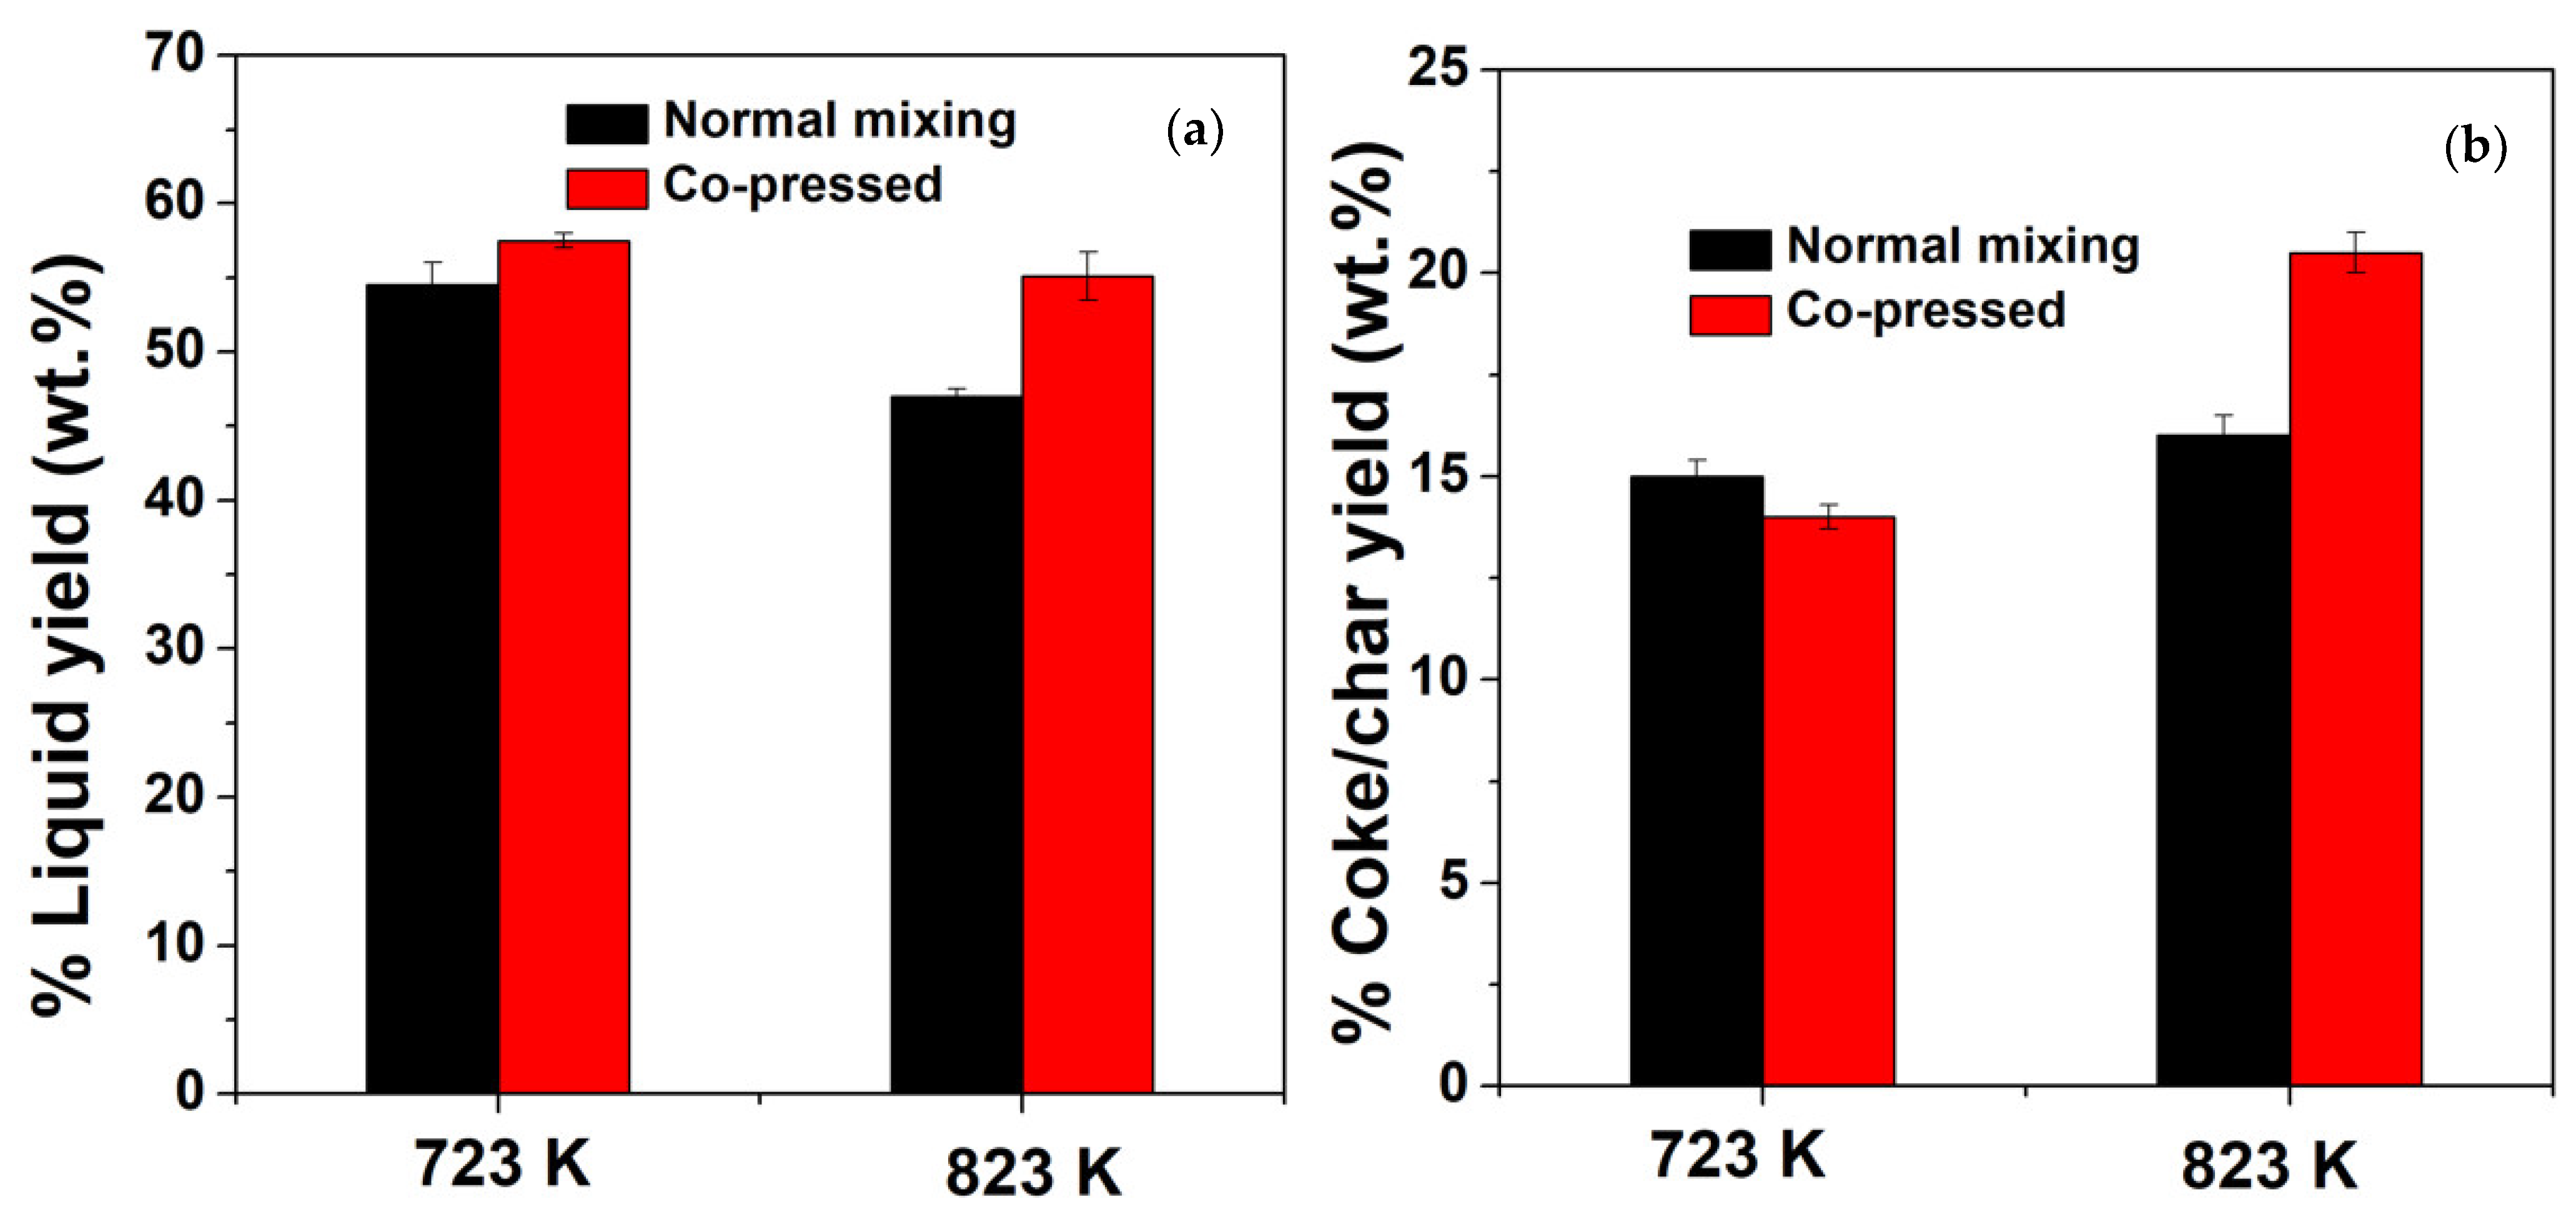
2.2.2. The Effect of the Reaction Temperature on the Product Yields of the Normal Mixing and Co-Pressed Samples

In order to extend the scope of application of the co-pressing method, pyrolysis reactor experiments were conducted at different reaction temperatures for the normal mixing and co-pressed samples of cellulose and HY catalyst. As shown in Figure 4, 54.5% and 15.0% of liquid and coke/char yields were obtained from catalytic pyrolysis of cellulose with HY using normal mixing at 723 K. There is a decrease in the liquid yield and increase in the coke/char yield to 47.0%, and 16.0%, respectively by increasing the temperature to 823 K. The same effect took place with the co-pressed sample when the reaction temperature was increased from 723 K to 823 K. The liquid yield has decreased from 57.5% to 55.1% while coke/char yield has increased from 14.0% to 20.5%. The differences between the performance of HY and USY zeolites were due to a combination of their acidity and their structure. The extraction of aluminium from the zeolitic framework creates mesopores in the USY structure which are absent in the parent Y zeolite. Comparing the performance of the pre-treatment across the reaction temperatures used, the co-pressed samples had produced higher liquid yield than the normal mixing at all the temperatures used. On the other hand, although the coke amount on the co-pressed sample was lower at 723 K than with normal mixing, at 823 K the picture was reversed, the coke amount on the co-pressed sample was higher.
In relation to the liquid yield, similar temperature trends were observed for both samples. Liquid yield decreased with temperature, but the effect was more pronounced with the normal mixing, while the coke/char from the co-pressed sample showed significant difference with temperature rise. These trends can be explained by the temperature dependence of the main cellulose pyrolysis products, which differs between isothermally driven pyrolysis (co-pressed sample) [57] and transport-limited driven pyrolysis (powder sample) [57,58]. The reduction in the bio-oil yield at 823 K was due to further reactions of the volatile primary products [59]. The severity of this effect is higher in normal mixing (powder sample pyrolysis) due to the longer residence time of volatile compounds in the reactor. For the co-pressed sample, the lower content of coke/char yield at 723 K could be attributed to further pyrolysis of coke/char precursors on the surface of the catalyst [57,60]. At 823 K, the co-pressed sample pyrolysis produces substantially more lighter oxygenates than normal mixing pyrolysis [57,58]. Therefore, a considerable amount of coke/char was deposited on the catalyst. The coke/char had stabilized at higher temperatures with the formation of more thermally stable polyaromatic coke/char through the gas phase reactions [46,47,58]. Hu et al. [59] studied the effect of temperature on catalytic co-pyrolysis of cellulose as well as seaweed on zeolitic catalysts. The bio-oil yield increased from 38.08% at 723 K to 45.15% at 773 K. However, it slightly decreased to 43.89% at 823 K and then further reduced to 36.00% at 873 K. The trend with temperature rise is similar, but the differences especially lower liquid yield from the latter study can be attributed to the differences in the catalysts and reactors used.

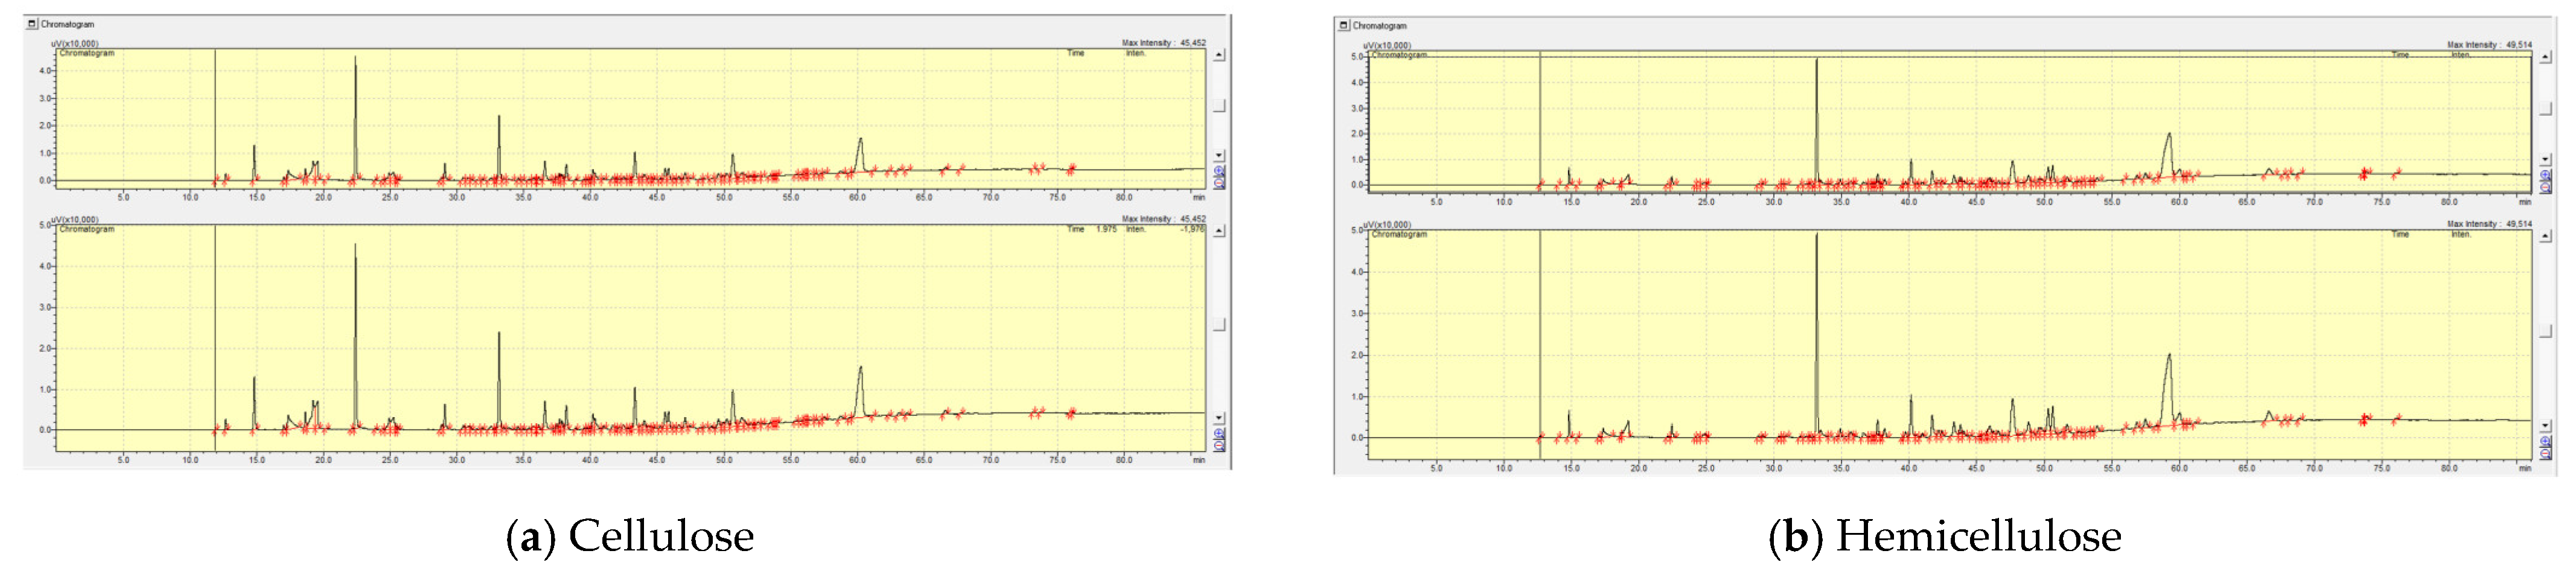
2.3. Liquid Product Characterisation

As it is impossible and impractical to identify the huge number of individual chromatographic peaks, we present the liquid analysis results in the form of a Boiling Point Distribution, according to the methodology described in Section 3.5 of the Experimental. Due to the complexity of the samples, the results would be discussed based on a simplified classification of three fractions. The lighter fraction, with components in the boiling point range from 272.70 K to 424.00 K, the middle fraction, with components in the boiling point range from 424.00 K to 526.70 K and the heavier fractions with components in the boiling point range from 526.70 K to 617.00 K.

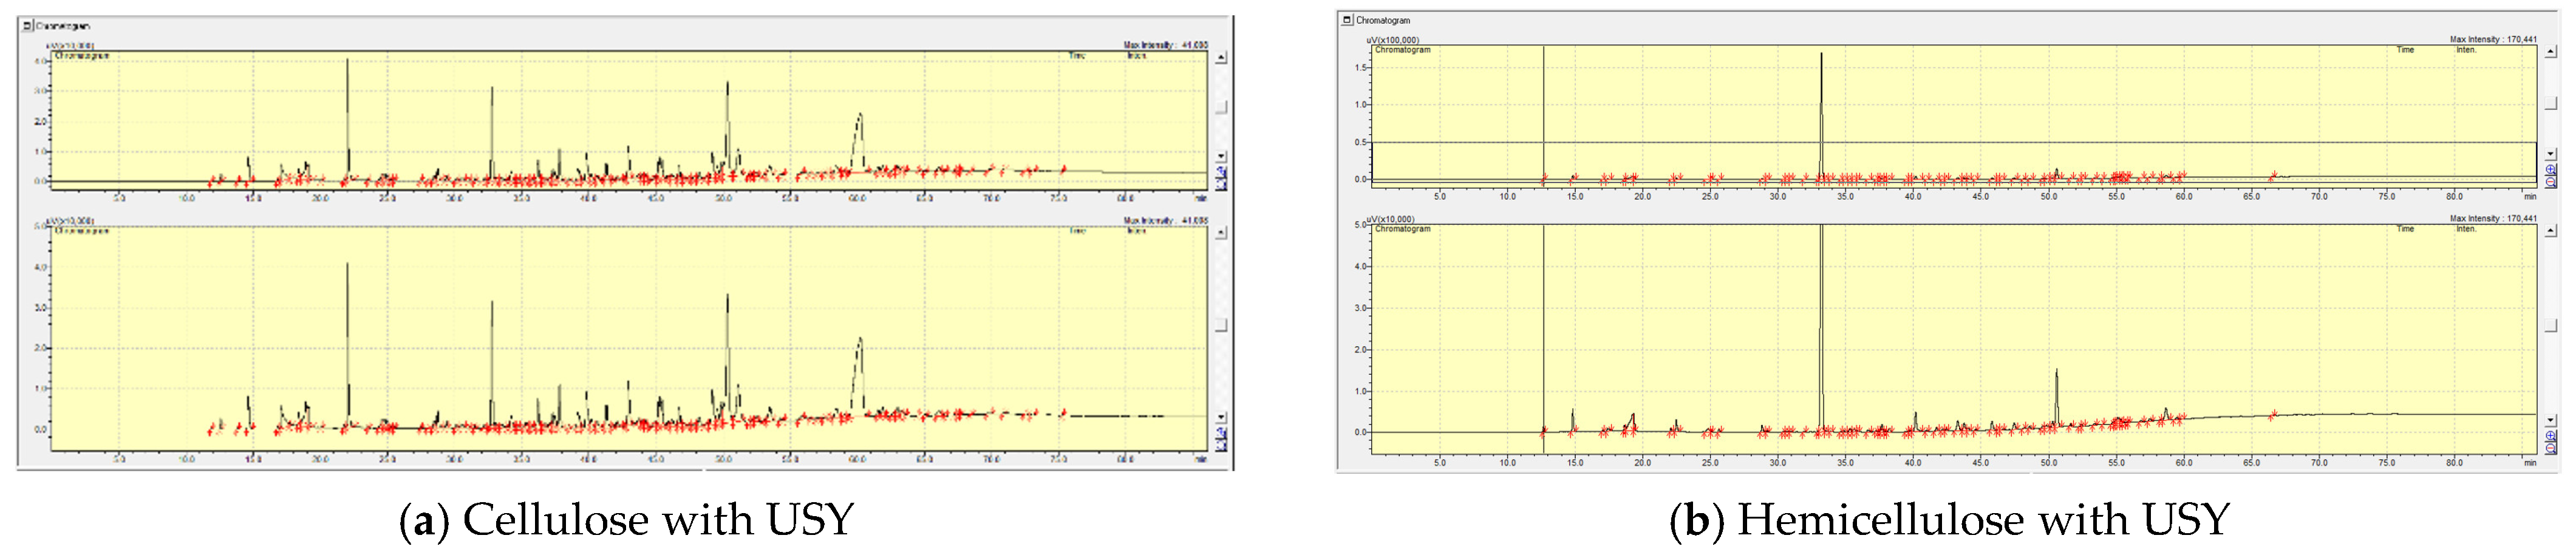
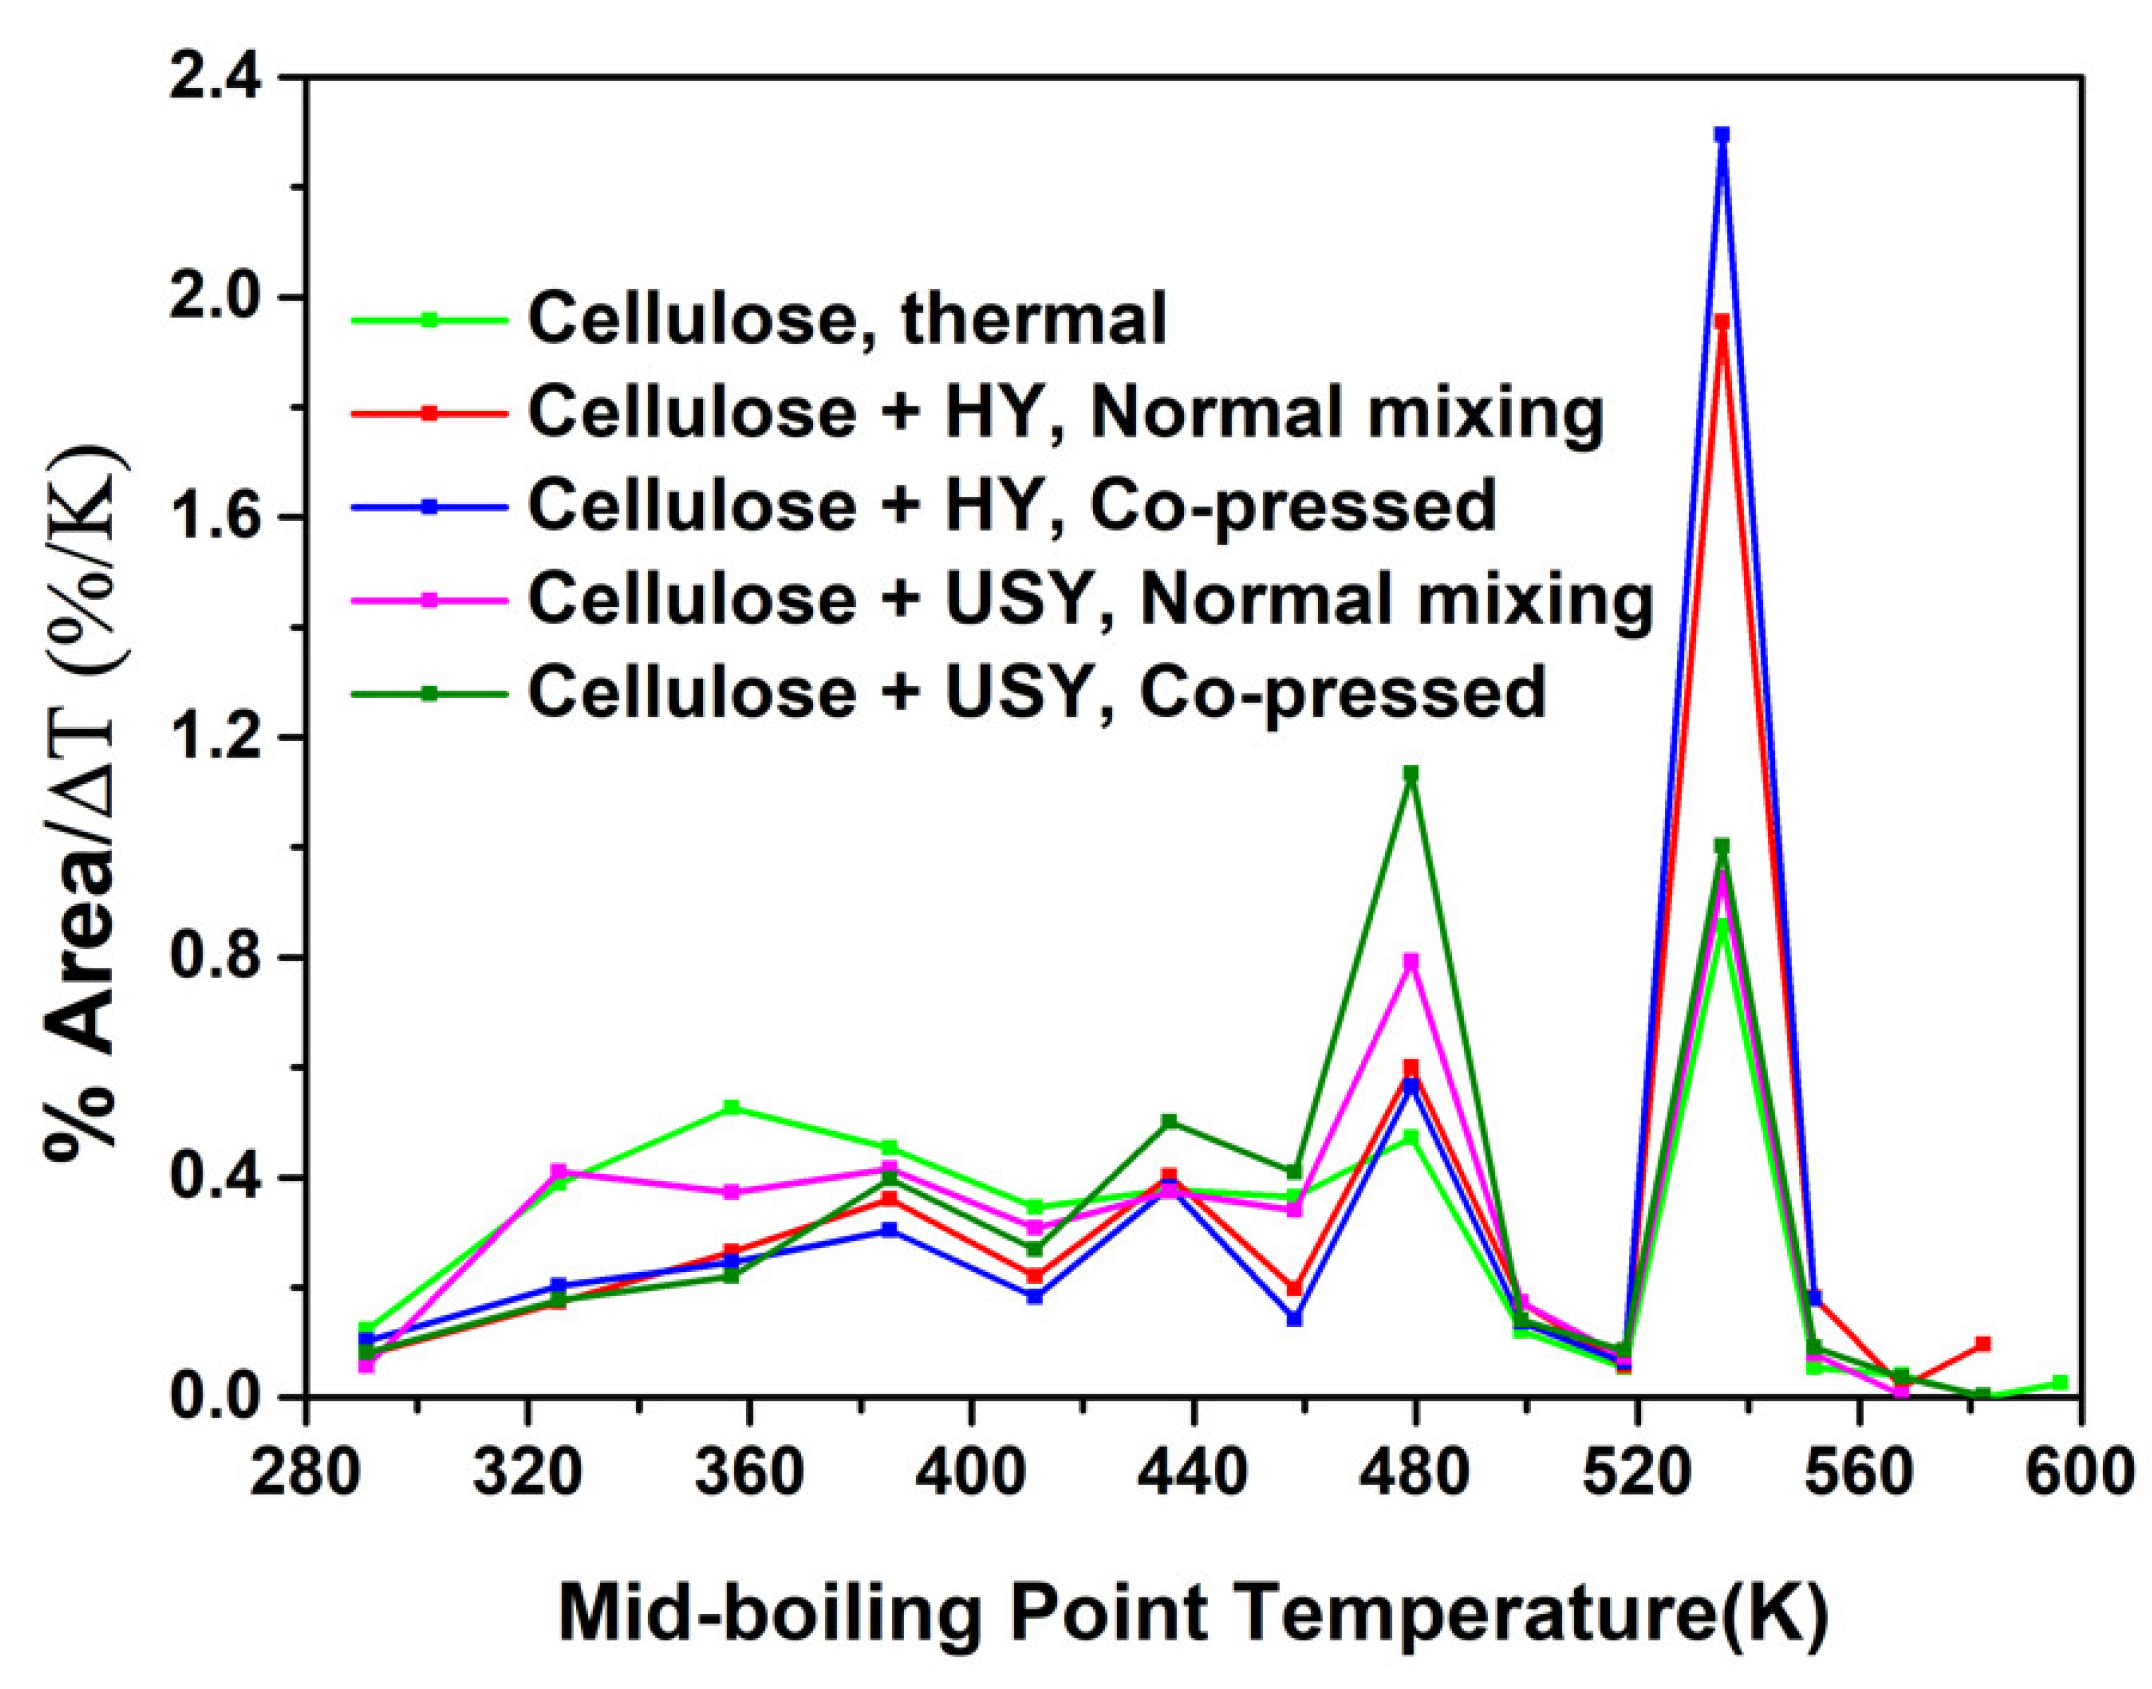
2.3.1. The Effect of Pre-Treatment (Co-Pressing Method) on the Boiling Point Distribution of the Bio-Oil from Catalytic Pyrolysis of Cellulose with HY and USY Catalysts

The results of the comparison of boiling point distribution of the bio-oil produced from catalytic pyrolysis of cellulose with HY and USY using the normal mixing and co-pressing method are presented in Figure 5. The thermal pyrolysis of cellulose produced mainly heavier fraction with also substantial amount of lighter fraction. On HY catalyst via normal mixing, the amount of the lighter fraction decreased significantly with an associated increase in the heavier fraction. For the co-pressed sample with HY catalyst, the pattern is similar to normal mixing with further decrease in lighter fraction and increase in heavier fraction. The application of USY zeolite has altered the selectivity in the boiling point distribution with the majority of the product within the middle fraction. The co-pressed cellulose with USY zeolite has further increased the amount of the middle fraction with predominance within the gasoline range fraction. The differences in the boiling point distribution of the two zeolite catalysts can be explained by their different structures and properties. As shown in Table 1, HY has higher surface area and acid density. The higher acid density obviously influences its higher initial degradation performance but the frequent deactivation and poor thermal stability are the main drawbacks in its application [42,56,61,62]. On the other hand, USY is the modified form of Y zeolite which exhibits very strong acidic sites [63,64], mesoporous system [64,65] and high thermal stability [62,63,64,65]. This modification happens under controlled conditions by steam treatment at high temperatures leading to the creation of active sites and mesopores that enhance the catalytic activity of USY zeolite [61,62,65,66,67]. The presence of these large cavities enable the macromolecules and heavy initial fragments from the primary reactions to diffuse readily into the internal acid sites, and be converted to hydrocarbons via a series of reactions, such as cracking, deoxygenation (dehydration, decarboxylation, and decarbonylation), and aromatization [29,68,69].
Due to its larger micropore size volume and high acid density produced mainly heavier fraction and this was supported by the findings from Lee et al. [29], Li et al. [41], and Park et al. [70]. They reported higher amounts of polycyclic aromatic hydrocarbons from catalytic pyrolysis of cellulose. The slow diffusion of the main products from cellulose thermal decomposition into the HY pores [69,71] due to coke/char deposition has also contributed to the higher amount of heavy fraction obtained [56]. However, USY was able to allow further cracking of the products and the boiling point distribution was shifted to middle fraction in consistency with its stronger acid sites, thus suggesting a more extended degree of conversion. Lee et al. [29] also pointed that mesoporous HY exhibited higher selectivity toward mono aromatic hydrocarbons while the normal HY produced larger amounts of poly aromatic hydrocarbons. Bertero et al. [72] reported high selectivity to gasoline range fraction over modified mesoporous FCC catalysts from catalytic pyrolysis of biomass. All these studies corroborated the performance of USY in enhancing the gasoline fraction during biomass catalytic pyrolysis. In terms of the co-pressing method, the improved catalytic effect over both catalysts make this among the most effective methods for catalytic biomass conversion into hydrocarbons over solid acid catalysts.

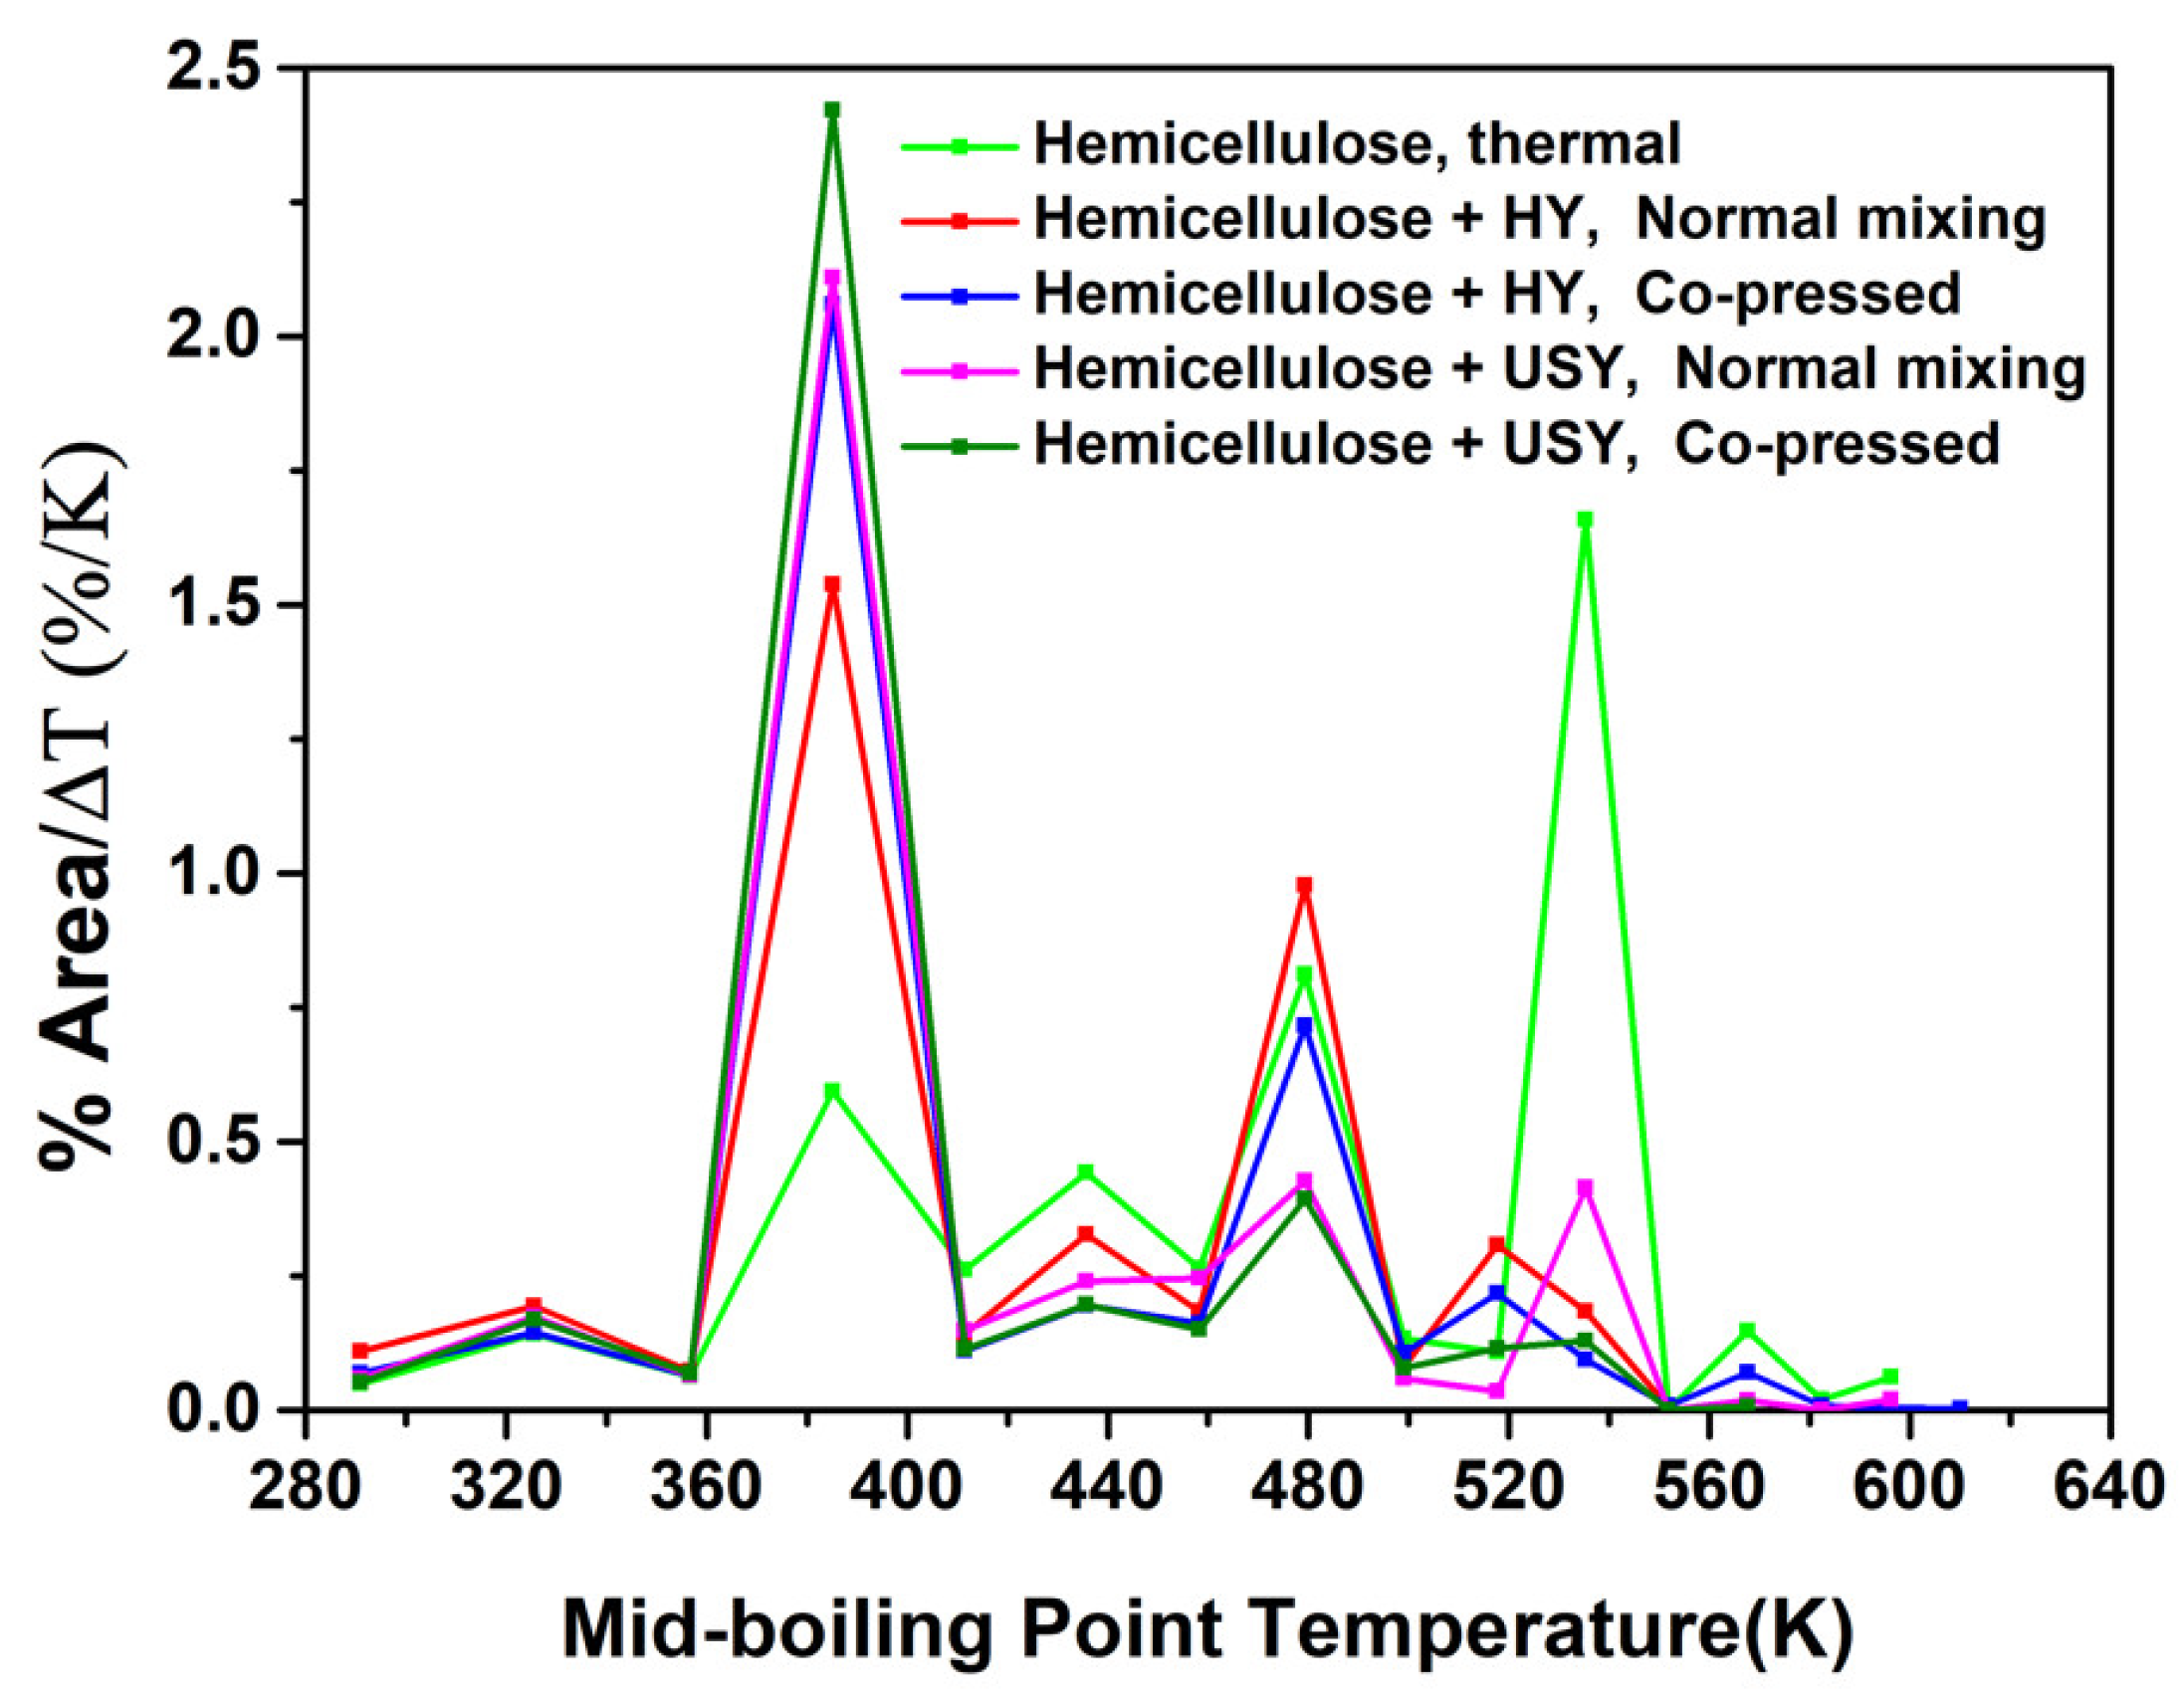
2.3.2. The Effect of Pre-Treatment (Co-Pressing Method) on the Boiling Point Distribution of the Bio-Oil from Catalytic Pyrolysis of Hemicellulose on HY and USY Catalysts

Hemicellulose the second most abundant biomass component was decomposed thermally and on HY and USY catalysts. The boiling point distribution of the bio-oil obtained is presented in Figure 6. The thermal pyrolysis of hemicellulose in the absence of catalyst produced predominantly heavier fraction in accordance with the mechanism of its thermal degradation. Thermal pyrolysis of hemicellulose exhibits similar competing pyrolysis pathways like cellulose, consisting of depolymerization to sugars and anhydrosugars, dehydration to furan and pyran ring derivatives and furanose, as well as pyranose ring-breakage to light oxygenated species [73,74,75]. The higher amount of these oxygenated compounds in the thermal pyrolysis of hemicellulose especially sugars and anhydro sugars resulted in the significant amount of the heavier fraction, as shown in Figure 6. Specifically, Räisänen et al. [76] reported dianhydroglucopyranoses, levoglucosan and hexadecanoic acid among the main pyrolytic products of mannose and arabinose thermal degradations. The heavy nature of the bio-oil in Figure 6 could be attributed to the presence of these compounds.
In relation to zeolites HY and USY, the boiling point distribution is mainly in the lower fraction with the heavier fraction largely consumed consequently improving the bio-oil quality. All zeolite catalysts had similar effects in enhancing the lighter fraction. In addition, HY showed higher selectivity to middle fraction while USY has produced higher proportion of lighter fraction. This could be explained by the extensive conversion with USY due to its strong acid sites and higher thermal stability. With both catalysts, co-pressing had the best effect of eliminating the heavier fraction and improving the gasoline range fraction. USY largely removed the oxygenated compounds including aldehydes, acids and ethers promoting the formation of isoalkanes and aromatics and leading to an improvement in octane and gasoline selectivity [77,78,79]. This is the reason why USY showed most distinct behaviour compared to the boiling point distribution of the thermal pyrolysis of hemicellulose. In a similar work, Wang et al. [77] used TG-FTIR to study the catalytic pyrolysis behaviour of Manchurian ash over four zeolite catalysts. They found that the Y-type zeolites showed the best result regarding dehydration and the consumption of oxygenated compounds such as acids, aldehydes ethers, and furans.

2.3.3. The Effect of Pre-Treatment (Co-Pressing Method) on the Boiling Point Distribution of the Bio-Oil from Catalytic Pyrolysis of Cellulose at Different Reaction Temperatures

Considering the prime importance of reaction temperature in pyrolysis experiment, the efficacy of co-pressing method was determined at different reaction temperatures as shown in Figure 7.
The effect of increasing reaction temperature is more pronounced with the normal mixing compared to the co-pressed sample due to the longer residence time of volatiles in the normal mixing. In all the cases, increasing the reaction temperature resulted in higher amount of lighter fraction and lower amount of heavier fraction. Higher reaction temperature supports the easy cleavage of bonds, thereby promoting the catalytic cracking of heavier fraction and the suppression of alkylation reactions [80]. Similar results were reported by Wong et al. [81] and Muhammad and Manos [56] where the increase in reaction temperature caused further cracking of oligomers to form smaller hydrocarbons and increase the lighter fraction.

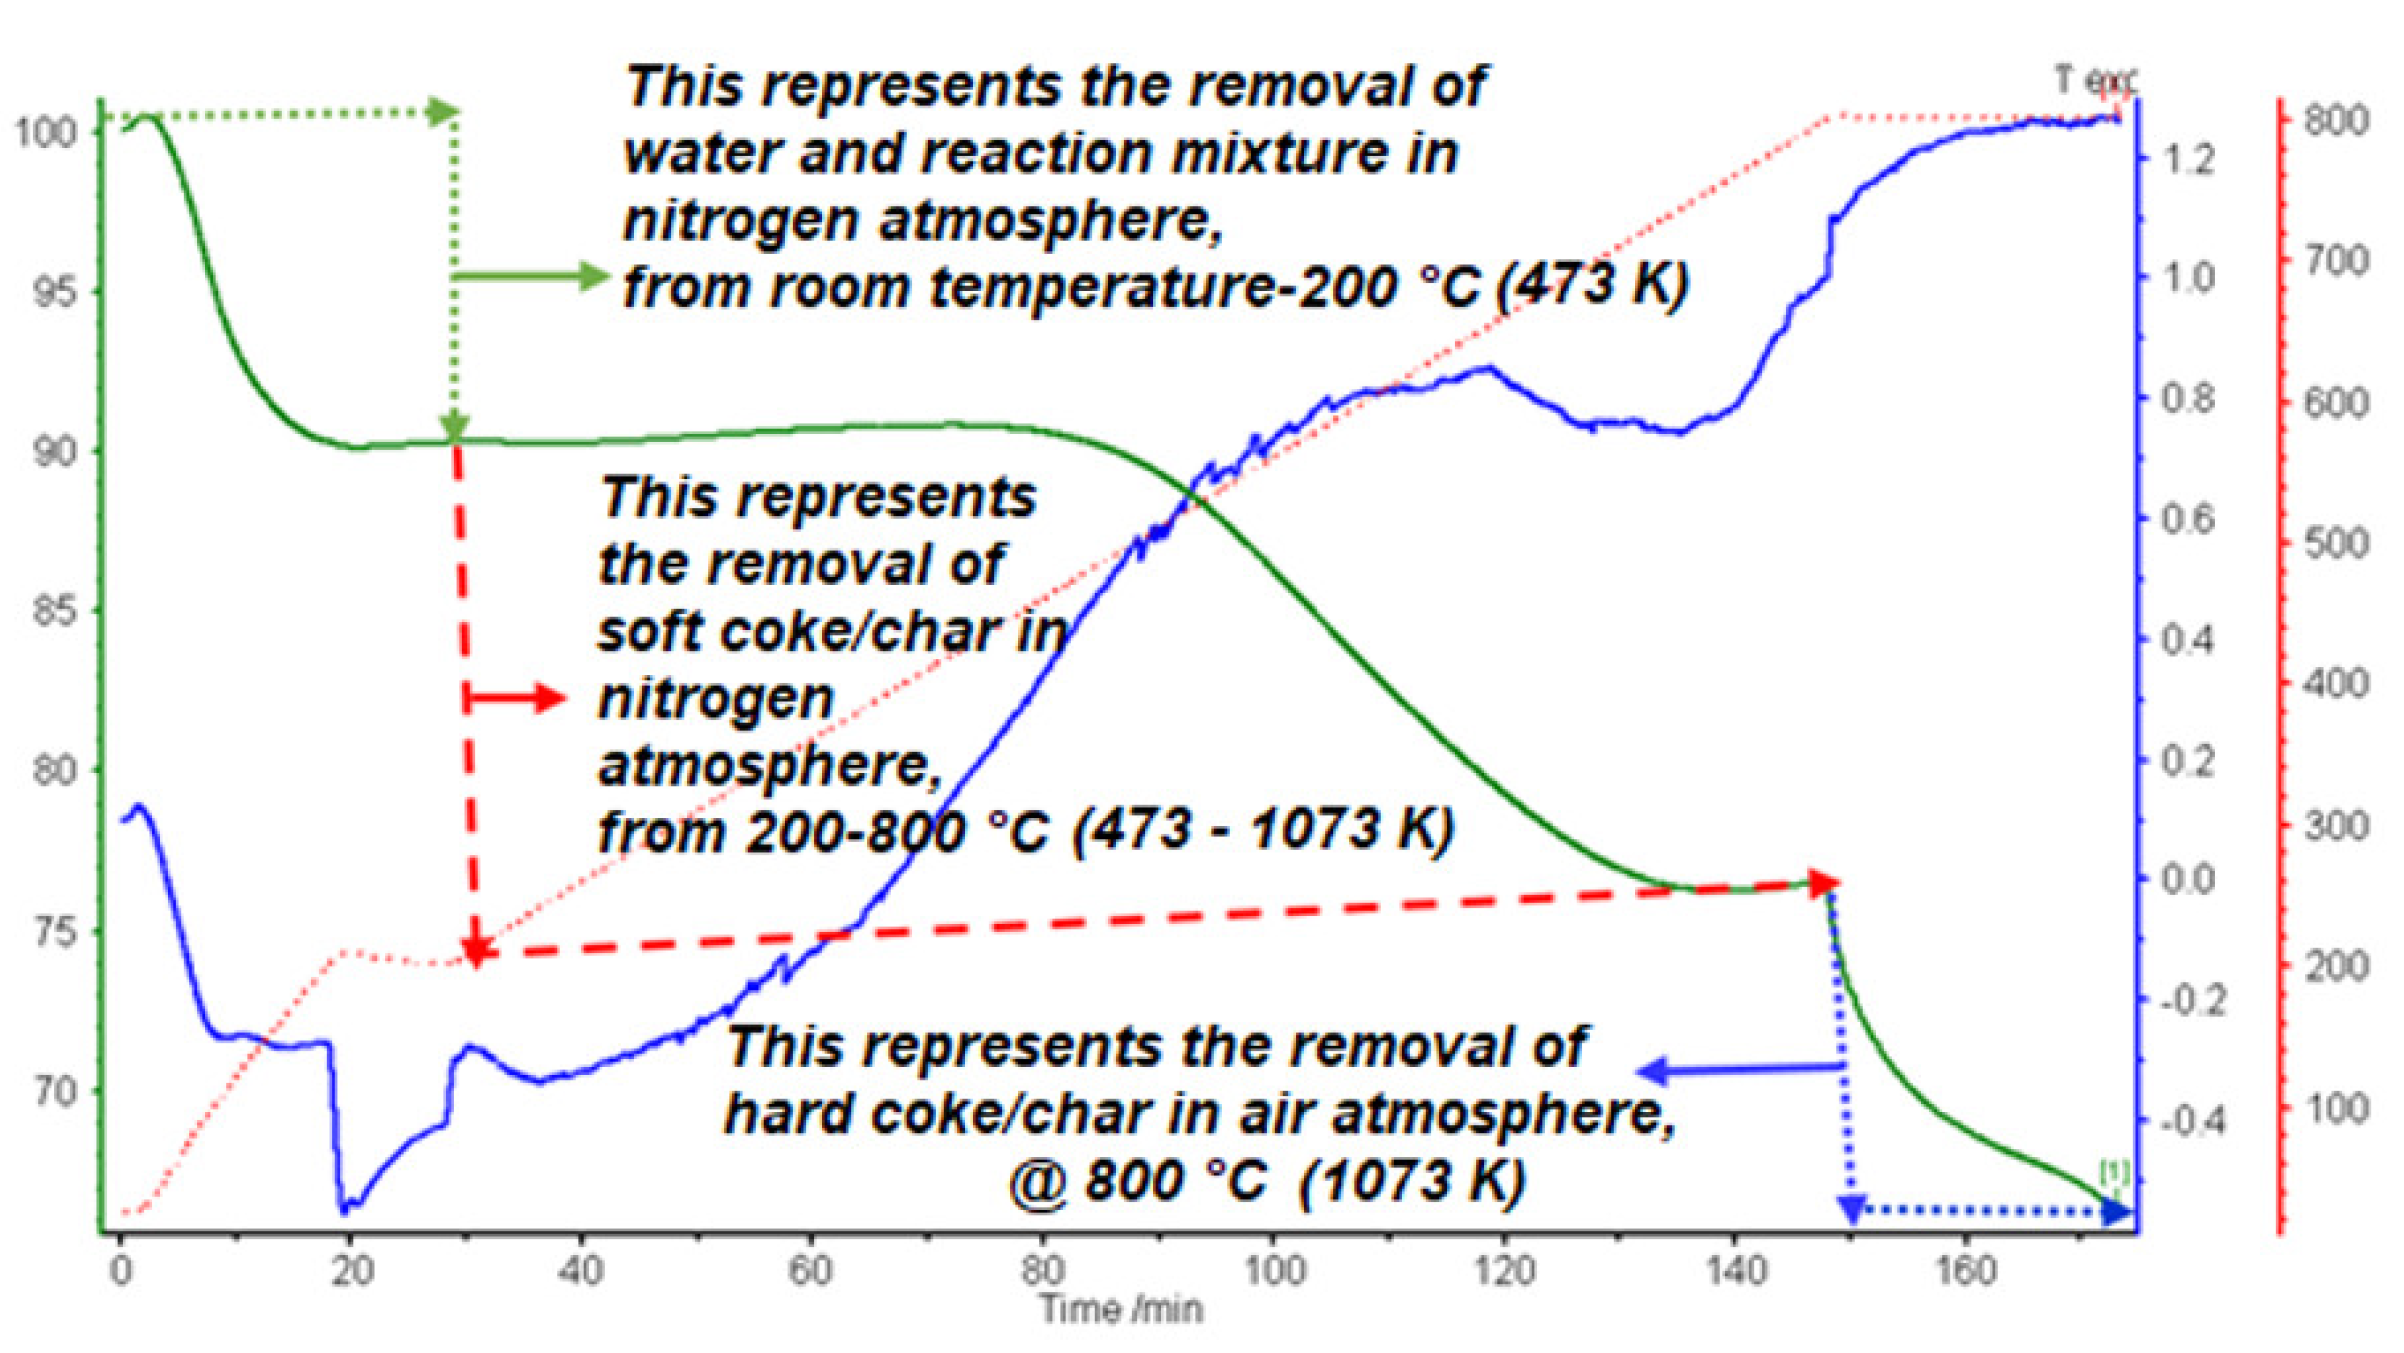
2.4. Coked/Charred Catalyst Characterization

Carbonaceous residue in form of char and coke are formed during thermal and catalytic conversion of biomass. The mechanisms of char and coke formation in biomass thermal pyrolysis are similar to those in catalytic pyrolysis [82]. Char is the primary solid product formed in non-catalytic pyrolysis of biomass [83], while coke is the carbon deposits formed during catalytic reaction of biomass [84,85]. Thermal coke can also be formed during the catalytic and non-catalytic conversion of bio-oil [86]. This type of coke is less condensed with high oxygen content compared to the catalytic coke which is more condensed with less oxygen content [87]. The formation of char and coke in biomass pyrolysis emerges from the polymerization, dehydration, decarboxylation and decarbonylation of anhydrosugars, furanic compounds, fragmented oxygenates and/or olefin components of the biomass [2]. Generally, coke formation causes catalyst deactivation often increasing undesirable product selectivity [2,85]. Whereas char may or may not deactivate the catalyst, depending on the position of its formation [2]. Solid residues obtained from this study are mixture of char/coke since the experiments were conducted in-situ. As explained previously, char is predominantly from thermal cracking whereas in the presence of catalyst mainly coke is obtained. This section has examined the nature of the char/coke deposited based on their relative volatilities and the results are presented in Table 2. For cellulose thermal and catalytic degradation with USY zeolite, the volatility of the char/coke components showed almost similar character. Thermal pyrolysis of cellulose produced 72.0% soft char and this amount increases to 78.0% in the presence of USY via the normal mixing method which is predominantly coke. This can be attributed to further conversion of cellulose char in the presence of USY, resulting in more volatiles components that were partly transformed into thermal coke. Co-pressed cellulose produced more hard coke compared to normal mixing because of the intimate contact it provides between the cellulose and USY, which enhanced not only its pyrolysis but its coke formation too [56]. Higher catalytic effect of the co-pressed sample at lower reaction temperature also leads to the lower formation of coke/char as shown by the coke concentration (Table 1).
Solid residue from hemicellulose thermal and catalytic pyrolysis had different thermal behaviour compared with the cellulose. The coke/char from thermal pyrolysis of hemicellulose is largely hard coke/char and in the presence of USY, the volatility of the coke/char is grossly reversed (Table 2).
Lignin also showed similar behaviour with hemicellulose where the presence of USY produced highly volatile coke/char compared to the thermal pyrolysis. This different degree of volatility in the coke/char character is strongly related to the structure of the biomass [87]. The process of coke formation is a shape selective reaction. Large molecules formed by thermal cracking of cellulose such as levoglucosan with molecular size larger than pore diameter of USY could not enter into the channels. These molecules undergo re-polymerization and condensation on the external catalyst surface and are deposited on catalyst surface as thermal coke [86]. It is known that coke in catalytic degradation of cellulose predominantly occur through re-polymerization reaction [63,88]. This type of coke is mostly volatile and easy to remove at lower temperatures [88]. However, the structures of hemicellulose and lignin are complicated with large numbers of branched side chains [6,86]. Usually, the more branching structures the components have, the easier they are to crosslink and form coke/char [89]. The structural diversity of hemicellulose and lignin could produce multiple types of oxygenated radicals. These macromolecular radicals are expected to undergo polymerization/condensation reactions to form char/coke during the thermal and catalytic degradation [87,90]. Henceforth, hemicellulose and lignin produced more complicated coke/char compared to cellulose. The coke/char concentration among the biomass components is of the following order lignin>cellulose>hemicellulose, in line with their thermal stability. The longer residence times of volatiles inside particles of the un-treated cellulose sample favored secondary reactions, which eventually resulted to high concentration of coke/char [91,92,93]. Bai et al. [94] also found that on larger particles, dehydration of polymerization products was stimulated, leading to higher coke/char concentration.

3. Experimental

3.1. Materials

The biomass model compounds were purchased from Sigma-Aldrich Co., Ltd. UK, including cellulose, hemicellulose and lignin all in powder form with average particle size of 100 µm. The cellulose was α-cellulose with CAS number (9004-34-6), and lignin was alkali lignin kraft in brown powder, with CAS number (8068-05-1). Hemicellulose is a combination of two model compounds, D-(−)-Arabinose (C5H1005) with CAS number 10323-20-3 and D-(+)-Mannose (C6H1206) with CAS number 3458-28-4. HY and USY zeolites were used as catalysts kindly provided by Grace Gmbh in powder form with an average particle size of 1 μm. The parent zeolite of USY was HY with a Si/Al ratio of 2.5. During the ultrastabilisation treatment with steam, aluminium was extracted from the Y zeolite framework and remained in the zoolite structure as extraframework aluminium resulting in a framework Si/Al ratio of USY of 5.7. The detailed properties of the catalysts are stated in Table 2.

3.2. Experimental Setup

The experimental rig is made up of a semi-batch pyrex reactor with two semi-circle infrared heating elements for fast heating connected to a temperature controller, mass flow controller and two condensers placed in ice baths for liquid products collection. Further details of the experimental equipment and procedure are given in our previous study [56] where a schematic diagram of the experimental setup was also presented. The initial amount of the cellulose, hemicellulose and lignin was equal to 2 g in all experiments. The biomass to catalyst ratio was maintained at 2:1. The experiment was usually run for 30 min. At the end of the experiment, the majority of the biomass had been converted to gas and liquid products, leaving in the reactor only catalyst with deposited coke/char. For all the pyrolysis experiments a constant nitrogen flow rate of 60 mLN/min was used and the final reaction temperature was between 723 and 823 K.

3.3. Pre-Treatment Process

In order to improve the catalytic pyrolysis behaviour of the biomass model compounds and enhance the quality of their product yields, a pre-treatment method using co-pressing of biomass and catalyst into pellets was employed in this research work and this was compared with normal mixing.

3.3.1. Normal Mixing

Normal mixing involves mixing of the biomass model compounds with the catalyst thoroughly using spatula. As normal mixing with catalyst resulted in very similar behavior as thermal degradation, a pre-treatment method prior to pyrolysis was considered essential.

3.3.2. Co-Pressing

This involves mixing of the biomass model compounds and catalyst thoroughly with a spatula as in a normal mixing. After this stage, the mixture was placed on a hydraulic press and pressed for 5 min at a weight of 3 tons for 5 times, providing intimate contact between the biomass and catalyst and a solidified biomass-catalyst pellet. The pellet was then crushed gently using hand to produce smaller pellets that could be placed inside the reactor.

3.4. Experimental Calculations

Conversion to volatile products was the fraction of the initial mass of the feed (cellulose, hemicellulose and lignin), reacted to form volatile products.
The percentage liquid yield is the mass of the liquid collected divided by the initial amount of the feed, i.e., the fraction of the original feed converted to the liquid products multiplied by 100:
Y l = m l / m f × 100
where Y l = liquid yield, m l = mass of liquid collected, m f = mass of the feed.
The percentage coke/char yield is the mass of the coke/char obtained after the experiment divided by the initial amount of the feed and represents the fraction of the original feed converted to coke/char multiplied by 100:
Y c = m c / m f × 100
where Y c = coke/char yield, m c = mass of coke/char obtained, m f = mass of the feed
The coke/char concentration is the amount of coke/char deposited on the catalyst divided by the catalyst mass and represents the amount of coke/char formed per g of catalyst. It is estimated by TGA and converted to yield based on the catalyst amount in the reactor, i.e., biomass to catalyst ratio,
C c = m c / m c a t
where C c = coke/char concentration, m c = mass of the coke/char deposited on the catalyst, m c a t = mass of the catalyst.

3.5. Liquid Sample Analysis

The liquid products were analysed on a Shimadzu 2014 gas chromatograph equipped with a flame ionization detector (FID) using a non-polar Rtx-1 DHA 100 m × 0.25 mm × 0.50 µm capillary column which enabled the component separation based on their volatility (Raw GC data are provided in Appendix A, Figure A1, Figure A2, Figure A3 and Figure A4). Details of the chromatographic conditions are given in reference [56]. A calibration mixture of normal alkanes C5–C20 (standard) was run before the analysis to assign retention times to each normal alkane of the standard calibration mixture enabling allocation of boiling points of the standard components to their corresponding retention times as shown in Table 3. Hence, the boiling distribution curve of the liquid was created [56]. The mass fraction of each component is set equal to the area fraction [95,96,97].

3.6. Thermal Gravimetric Analysis

The TGA measurements were carried out with Perkin Elmer Pyris TGA instrument. The TGA experiments were carried out under an inert atmosphere of flowing N2. After the pyrolysis experiment had finished, air was introduced, in order to burn the formed coke/char in order to estimate its amount. In a typical run, ca. 5–10 mg of cellulose biomass component and catalyst were blended in 2:1 ratio. After removal of water up to 473 K the sample was heated at the required heating rate up to 873 K held there for 30 min to complete the degradation [56].

Coke/Char Catalyst Characterisation and Calculation

The coke/char characterisation is shown in Figure 8. This method is simple and specific using the TGA of coked/charred catalyst. It provides information about the character of coke components, more specifically their volatility [56].
After removing of water and reaction mixture components up to 473 K, the coke/char components were classified into soft coke/char (removed between 473 K and 1073 K through volatilisation in inert nitrogen) and hard coke/char (removed by burning with airat 1073 K) as demonstrated in Figure 8.
S o f t   c o k e / c h a r   ( % )   = M a s s   o f   s o f t   c o k e / c h a r T o t a l   m a s s   o f   c o k e × 100
H a r d   c o k e / c h a r   ( % )   = M a s s   o f   h a r d   c o k e / c h a r T o t a l   m a s s   o f   c o k e / c h a r × 100
where M a s s   o f   s o f t   c o k e / c h a r is the total weight of the coke/char removed in nitrogen atmosphere from 473 K to 1073 K and M a s s   o f   h a r d   c o k e / c h a r is the total weight of the coke/char removed in air atmosphere at the final temperature (1073 K) while T o t a l   m a s s   o f   c o k e / c h a r correspond to the total weight of soft and hard coke/char respectively.

4. Conclusions

In this work, we have shown that pre-treatment of biomass before catalytic pyrolysis by co-pressing method can improve the degradation process. Co-pressing of the biomass and catalyst also had a positive impact on the quantity and quality of the liquid and coke/char yields. From the investigation on thermal and catalytic degradation of biomass components (cellulose, hemicellulose and lignin), the following can be concluded:
  • Co-pressing method has improved the catalytic degradation of cellulose by further lowering the decomposition temperature.
  • All the three biomass components produce a better result using the co-pressing method, where the liquid yields increased and coke/char yields decreased.
  • The co-pressed cellulose with HY catalyst had further decreased the amount of lighter oxygenated fraction from cellulose thermal cracking.
  • The application of USY catalyst has altered the selectivity in the boiling point distribution with the majority of the product within the middle fraction.
  • The co-pressed cellulose with USY catalyst has further increased the amount of the middle fraction predominantly within the gasoline range fraction.
  • The co-pressed hemicellulose with HY catalyst showed higher selectivity to middle fraction compared to the heavy fraction from the thermal cracking.
  • The co-pressed hemicellulose with USY catalyst has produced higher amount lighter fraction compared to the heavy fraction from the thermal cracking.
  • The improved catalytic effect of the co-pressed cellulose and USY catalyst has enhanced the formation of hard coke/char.
  • The higher catalytic effect of the co-pressed sample at lower reaction temperatures leads to lower concentration of coke/char on the catalyst.

Author Contributions

Conceptualization, G.M.; methodology, I.M. and G.M.; validation, I.M.; formal analysis, I.M. and G.M.; investigation, I.M.; writing—original draft preparation, I.M.; writing—review and editing, G.M.; supervision, G.M. All authors have read and agreed to the published version of the manuscript.

Funding

Financial support received from Petroleum Technology Development Fund (PTDF) for the sponsor of this research is gratefully acknowledged. A special thanks to the management of NICE (Nature Inspired Chemical Engineering) lab facility, University College London for the support received during the GC and TGA analysis.

Acknowledgments

The authors gratefully acknowledge PhD funding (IM) from Petroleum Technology Development Fund (PTDF), Nigeria.

Conflicts of Interest

The authors declare no conflict of interest.

Appendix A

Figure A1. GC raw data for thermal pyrolysis of (a) Cellulose and (b) Hemicellulose.
Catalysts 11 00805 g0a1
Figure A2. GC raw data for catalytic pyrolysis of cellulose with HY (723 K).
Catalysts 11 00805 g0a2
Figure A3. GC raw data for catalytic pyrolysis of cellulose with HY (823 K).
Catalysts 11 00805 g0a3
Figure A4. GC raw data for catalytic pyrolysis of (a) Cellulose with USY and (b) Hemicellulose with USY.
Catalysts 11 00805 g0a4
Figure A5. TGA raw data of (a) Cellulose, thermal pyrolysis, (b) Cellulose + HY, normal mixing and (c) Cellulose + HY, co-pressing.
Catalysts 11 00805 g0a5
Figure A6. TGA raw data of char/coke sample from (a) Cellulose, thermal pyrolysis, (b) Hemicellulose, thermal pyrolysis and (c) Lignin, thermal pyrolysis.
Catalysts 11 00805 g0a6
Figure A7. TGA raw data of char/coke sample from (a) Cellulose with USY, (b) Hemicellulose + with USY and (c) Lignin with USY.
Catalysts 11 00805 g0a7
Table A1. Raw data from reactor pyrolysis experiments.
Replicates Values
Experiment TypeLiquid YieldsCoke/Char Yields
123MeanSD123MeanSD
Cellulose: USY/Normal44.0046.0045.0045.001.0024.5024.0025.0024.500.50
Cellulose: USY/Pressed57.0056.0058.0057.001.0020.0020.4019.6020.000.40
Hemicellulose: SY/Normal53.0053.5054.0053.500.5023.3024.0024.7024.000.70
Hemicellulose: SY/Pressed54.1053.0051.9053.001.1018.6019.4019.0019.000.40
Lignin: USY/Normal24.0024.5023.5024.000.5062.8061.2059.6061.201.60
Lignin: USY/Pressed37.0035.0036.0036.001.0043.0041.0042.0042.001.00
Cellulose: HY/Normal,723K56.0054.5053.0054.501.5014.6015.4015.0015.000.40
Cellulose: HY/Pressed,723K57.5057.0058.0057.500.5013.7014.0014.3014.000.30
Cellulose: HY/Normal,823K46.5047.0047.5047.000.5015.5016.5016.0016.000.50
Cellulose: HY/Pressed,823K55.1056.7053.5055.101.6020.5020.0021.0020.500.50
SD = Standard deviation.

References

  1. Chen, W.H.; Eng, C.F.; Lin, Y.Y.; Bach, Q.V. Independent parallel pyrolysis kinetics of cellulose, hemicelluloses and lignin at various heating rates analyzed by evolutionary computation. Energy Convers. Manag. 2020, 221, 113165. [Google Scholar] [CrossRef]
  2. Du, S.; Valla, J.A.; Bollas, G.M. Characteristics and origin of char and coke from fast and slow, catalytic and thermal pyrolysis of biomass and relevant model compounds. Green Chem. 2013, 15, 3214–3229. [Google Scholar] [CrossRef]
  3. Alonso, D.M.; Bond, J.Q.; Dumesic, J.A. Catalytic conversion of biomass to fuel. Green Chem. 2010, 12, 1493–1513. [Google Scholar] [CrossRef]
  4. Kan, T.; Strezov, V.; Evans, T.; He, J.; Kumar, R.; Lu, Q. Catalytic pyrolysis of lignocellulosic biomass: A review of variations in process factors and system structure. Renew. Sustain. Energy Rev. 2020, 134, 110305. [Google Scholar] [CrossRef]
  5. Zhu, L.; Zhong, Z. Effects of cellulose, hemicellulose and lignin on biomass pyrolysis kinetics. Korean J. Chem. Eng. 2020, 37, 1660–1668. [Google Scholar] [CrossRef]
  6. Zheng, Y.; Tao, L.; Yang, X.; Huang, Y.; Liu, C.; Zheng, Z. Comparative study on pyrolysis and catalytic pyrolysis upgrading of biomass model compounds: Thermochemical behaviors, kinetics, and aromatic hydrocarbon formation. J. Energy Inst. 2019, 92, 1348–1363. [Google Scholar] [CrossRef]
  7. Yang, H.; Yan, R.; Chen, H.; Zheng, C.; Lee, D.H.; Liang, D.T. In-depth investigation of biomass pyrolysis based on three major components: Hemicellulose, cellulose and lignin. Energy Fuels 2006, 20, 388–393. [Google Scholar] [CrossRef]
  8. Huang, J.; He, C.; Wu, L.; Tong, H. Theoretical studies on thermal decomposition mechanism of arabinofuranose. J. Energy Inst. 2017, 90, 372–381. [Google Scholar] [CrossRef]
  9. Wang, S.R.; Ru, B.; Lin, H.Z.; Luo, Z.Y. Degradation mechanism of monosaccharides and xylan under pyrolytic conditions with theoretic modeling on the energy profiles. Bioresour. Technol. 2013, 143, 378–383. [Google Scholar] [CrossRef]
  10. Zhou, X.; Li, W.; Mabon, R.; Broadbelt, L.J. A critical review on hemicellulose pyrolysis. Energy Technol. 2017, 5, 52–79. [Google Scholar] [CrossRef]
  11. Yang, H.; Yan, R.; Chen, H.; Lee, D.H.; Zheng, C. Characteristics of hemicellulose, cellulose and lignin pyrolysis. Fuel 2007, 86, 1781–1788. [Google Scholar] [CrossRef]
  12. Parihar, A.; Bhattacharya, S. Cellulose fast pyrolysis for platform chemicals: Assessment of potential targets and suitable reactor technology. Biofuels Bioprod. Biorefin. 2020, 14, 446–468. [Google Scholar] [CrossRef]
  13. Brebu, M.; Tamminen, T.; Spiridon, I. Thermal degradation of various lignins by TG-MS/FTIR and Py-GC-MS. J. Anal. Appl. Pyrolysis 2013, 104, 531–539. [Google Scholar] [CrossRef]
  14. Bu, Q.; Lei, H.; Zacher, A.H.; Wang, L.; Ren, S.; Liang, J.; Wei, Y.; Liu, Y.; Tang, J.; Zhang, Q.; et al. A review of catalytic hydrodeoxygenation of lignin-derived phenols from biomass pyrolysis. Bioresour. Technol. 2012, 124, 470–477. [Google Scholar] [CrossRef]
  15. Chen, W.-H.; Peng, J.; Bi, X.T. A state-of-the-art review of biomass torrefaction, densification and applications. Renew. Sustain. Energy Rev. 2015, 44, 847–866. [Google Scholar] [CrossRef]
  16. Zadeh, Z.E.; Abdulkhani, A.; Aboelazayem, O.; Saha, B. Recent insights into lignocellulosic biomass pyrolysis: A critical review on pretreatment, characterization, and products upgrading. Processes 2020, 8, 799. [Google Scholar] [CrossRef]
  17. Siyal, A.A.; Mao, X.; Liu, Y.; Ran, C.; Fu, J.; Kang, Q.; Ao, W.; Zhang, R.; Dai, J.; Liu, G. Torrefaction subsequent to pelletization: Characterization and analysis of furfural residue and sawdust pellets. Waste Manag. 2020, 113, 210–224. [Google Scholar] [CrossRef]
  18. Chen, D.; Gao, A.; Ma, Z.; Fei, D.; Chang, Y.; Shen, C. In-depth study of rice husk torrefaction: Characterization of solid, liquid and gaseous products, oxygen migration and energy yield. Bioresour. Technol. 2018, 253, 148–153. [Google Scholar] [CrossRef]
  19. Ukaew, S.; Schoenborn, J.; Klemetsrud, B.; Shonnard, D.R. Effects of torrefaction temperature and acid pretreatment on the yield and quality of fast pyrolysis bio-oil from rice straw. J. Anal. Appl. Pyrolysis 2018, 129, 112–122. [Google Scholar] [CrossRef]
  20. Kumar, R.; Strezov, V.; Weldekidan, H.; He, J.; Singh, S.; Kan, T.; Dastjerdi, B. Lignocellulose biomass pyrolysis for bio-oil production: A review of biomass pre-treatment methods for production of drop-in fuels. Renew. Sustain. Energy Rev. 2020, 123, 109763. [Google Scholar] [CrossRef]
  21. Tumuluru, J.S.; Wright, C.T.; Hess, J.R.; Kenney, K.L. A review of biomass densification systems to develop uniform feedstock commodities for bioenergy application. Biofuels Bioprod. Biorefin. 2011, 5, 683–707. [Google Scholar] [CrossRef]
  22. Hoover, A.N.; Tumuluru, J.S.; Teymouri, F.; Moore, J.; Gresham, G. Effect of pelleting process variables on physical properties and sugar yields of ammonia fiber expansion pretreated corn stover. Bioresour. Technol. 2014, 164, 128–135. [Google Scholar] [CrossRef] [Green Version]
  23. Mani, S.; Tabil, L.G.; Sokhansanj, S. Effects of compressive force, particle size and moisture content on mechanical properties of biomass pellets from grasses. Biomass Bioenergy 2006, 30, 648–654. [Google Scholar] [CrossRef]
  24. Pang, Y.; Wu, D.; Chen, Y.; Xu, J.; Wu, J.; Zhai, M. Pyrolysis of pine pellets catalyzed by blast furnace gas ash. Chem. Eng. Process. Process. Intensif. 2020, 156, 108094. [Google Scholar] [CrossRef]
  25. Shi, Y.; Xing, E.; Wu, K.; Wang, J.; Yang, M.; Wu, Y. Recent progress on upgrading of bio-oil to hydrocarbons over metal/zeolite bifunctional catalysts. Catal. Sci. Technol. 2017, 7, 2385–2415. [Google Scholar] [CrossRef]
  26. Adjaye, J.; Bakhshi, N. Production of hydrocarbons by catalytic upgrading of a fast pyrolysis bio-oil. Part I: Conversion over various catalysts. Fuel Process. Technol. 1995, 45, 161–183. [Google Scholar] [CrossRef]
  27. Hernando, H.; Hernández-Giménez, A.M.; Ochoa-Hernández, C.; Bruijnincx, P.C.A.; Houben, K.; Baldus, M.; Pizarro, P.; Coronado, J.M.; Fermoso, J.; Čejka, J.; et al. Engineering the acidity and accessibility of the zeolite ZSM-5 for efficient bio-oil upgrading in catalytic pyrolysis of lignocellulose. Green Chem. 2018, 20, 3499–3511. [Google Scholar] [CrossRef]
  28. Richardson, Y.; Eibner, S.; Tanoh, S.; Broust, F.; Blin, J.; Julbe, A. The catalyst/biomass integration concept for the direct thermo-catalytic conversion of biomass into either syngas or added-value molecules. ISGC 2015. Available online: https://agritrop.cirad.fr/579912/ (accessed on 29 June 2021).
  29. Lee, H.W.; Kim, Y.-M.; Lee, B.; Kim, S.; Jae, J.; Jung, S.-C.; Kim, T.-W.; Park, Y.-K. Catalytic copyrolysis of torrefied cork oak and high density polyethylene over a mesoporous HY catalyst. Catal. Today 2018, 307, 301–307. [Google Scholar] [CrossRef]
  30. Kabakcı, S.B.; Hacıbektaşoğlu, S. Catalytic Pyrolysis of Biomass, Pyrolysis, Mohamed Samer. In Pyrolysis; Samer, M., Ed.; IntechOpen: London, UK, 2017. [Google Scholar] [CrossRef] [Green Version]
  31. Adjaye, J.; Bakhshi, N. Production of hydrocarbons by catalytic upgrading of a fast pyrolysis bio-oil. Part II: Comparative catalyst performance and reaction pathways. Fuel Process. Technol. 1995, 45, 185–202. [Google Scholar] [CrossRef]
  32. Cheah, S.; Jablonski, W.S.; Olstad, J.L.; Carpenter, D.; Barthelemy, K.D.; Robichaud, D.J.; Andrews, J.C.; Black, S.K.; Oddo, M.D.; Westover, T. Effects of thermal pretreatment and catalyst on biomass gasification efficiency and syngas composition. Green Chem. 2016, 18, 6291–6304. [Google Scholar] [CrossRef]
  33. Jin, Q.; Wang, X.; Li, S.; Mikulčić, H.; Bešenić, T.; Deng, S.; Vujanović, M.; Tan, H.; Kumfer, B. Synergistic effects during co-pyrolysis of biomass and plastic: Gas, tar, soot, char products and thermogravimetric study. J. Energy Inst. 2019, 92, 108–117. [Google Scholar] [CrossRef]
  34. Mishra, R.K.; Mohanty, K. Thermal and catalytic pyrolysis of pine sawdust (Pinus ponderosa) and Gulmohar seed (Delonix regia) towards production of fuel and chemicals. Mater. Sci. Energy Technol. 2019, 2, 139–149. [Google Scholar] [CrossRef]
  35. Gunasee, S.D.; Danon, B.; Gorgens, J.; Mohee, R. Co-pyrolysis of LDPE and cellulose: Synergies during devolatilization and condensation. J. Anal. Appl. Pyrolysis 2017, 126, 307–314. [Google Scholar] [CrossRef]
  36. Patwardhan, P.R.; Dalluge, D.L.; Shanks, B.H.; Brown, R.C. Distinguishing primary and secondary reactions of cellulose pyrolysis. Bioresour. Technol. 2011, 102, 5265–5269. [Google Scholar] [CrossRef]
  37. Scheirs, J.; Camino, G.; Tumiatti, W. Overview of water evolution during the thermal degradation of cellulose. Eur. Polym. J. 2001, 37, 933–942. [Google Scholar] [CrossRef]
  38. Koufopanos, C.A.; Papayannakos, N.; Maschio, G.; Lucchesi, A. Modelling of the pyrolysis of biomass particles. Studies on kinetics, thermal and heat transfer effects. Can. J. Chem. Eng. 1991, 69, 907–915. [Google Scholar] [CrossRef]
  39. Milosavljevic, I.; Oja, A.V.; Suuberg, E.M. Thermal Effects in Cellulose Pyrolysis: Relationship to Char Formation Processes. Ind. Eng. Chem. Res. 1996, 35, 653–662. [Google Scholar] [CrossRef]
  40. Fermoso, J.; Mašek, O. Thermochemical decomposition of coffee ground residues by TG-MS: A kinetic study. J. Anal. Appl. Pyrolysis 2018, 130, 358–367. [Google Scholar] [CrossRef] [Green Version]
  41. Li, X.; Zhang, H.; Li, J.; Su, L.; Zuo, J.; Komarneni, S.; Wang, Y. Improving the aromatic production in catalytic fast pyrolysis of cellulose by co-feeding low-density polyethylene. Appl. Catal. A Gen. 2013, 455, 114–121. [Google Scholar] [CrossRef]
  42. Muhammad, I.; Manos, G. Simultaneous pretreatment and catalytic conversion of polyolefins into hydrocarbon fuels over acidic zeolite catalysts. Process. Saf. Environ. Prot. 2021, 146, 702–717. [Google Scholar] [CrossRef]
  43. Manos, G.; Garforth, A.; Dwyer, J. Catalytic Degradation of High-Density Polyethylene over Different Zeolitic Structures. Ind. Eng. Chem. Res. 2000, 39, 1198–1202. [Google Scholar] [CrossRef]
  44. Kassargy, C.; Awad, S.; Burnens, G.; Kahine, K.; Tazerout, M. Experimental study of catalytic pyrolysis of polyethylene and polypropylene over USY zeolite and separation to gasoline and diesel-like fuels. J. Anal. Appl. Pyrolysis 2017, 127, 31–37. [Google Scholar] [CrossRef]
  45. Kubička, D.; Kikhtyanin, O. Opportunities for zeolites in biomass upgrading—Lessons from the refining and petrochemical industry. Catal. Today 2015, 243, 10–22. [Google Scholar] [CrossRef]
  46. Jeong, J.; Lee, H.W.; Jang, S.H.; Ryu, S.; Kim, Y.-M.; Park, R.-S.; Jung, S.-C.; Jeon, J.-K.; Park, Y.-K. Park In-Situ Catalytic Fast Pyrolysis of Pinecone over HY Catalysts. Catalysts 2019, 9, 1034. [Google Scholar] [CrossRef] [Green Version]
  47. Xiong, Z.; Wang, Y.; Syed-Hassan, S.S.A.; Hu, X.; Han, H.; Su, S.; Xu, K.; Jiang, L.; Guo, J.; Berthold, E.E.S.; et al. Effects of heating rate on the evolution of bio-oil during its pyrolysis. Energy Convers. Manag. 2018, 163, 420–427. [Google Scholar] [CrossRef]
  48. Liu, X.; Yao, Z.; Zhao, L.; Song, J.; Jia, J. Torrefaction of Sorghum Straw Pellets in a Stationary Reactor with a Feeding Screw. Energy Fuels 2020, 34, 5997–6007. [Google Scholar] [CrossRef]
  49. Wang, G.; Li, W.; Li, B.; Chen, H. TG study on pyrolysis of biomass and its three components under syngas. Fuel 2008, 87, 552–558. [Google Scholar] [CrossRef]
  50. Kim, B.-S.; Kim, Y.-M.; Lee, H.W.; Jae, J.; Kim, D.H.; Jung, S.-C.; Watanabe, C.; Park, Y.-K. Catalytic Copyrolysis of Cellulose and Thermoplastics over HZSM-5 and HY. ACS Sustain. Chem. Eng. 2016, 4, 1354–1363. [Google Scholar] [CrossRef]
  51. Xue, J.; Zhuo, J.; Liu, M.; Chi, Y.; Zhang, D.; Yao, Q. Synergetic Effect of Co-pyrolysis of Cellulose and Polypropylene over an All-Silica Mesoporous Catalyst MCM-41 Using Thermogravimetry–Fourier Transform Infrared Spectroscopy and Pyrolysis–Gas Chromatography–Mass Spectrometry. Energy Fuels 2017, 31, 9576–9584. [Google Scholar] [CrossRef]
  52. Balat, M. Mechanisms of Thermochemical Biomass Conversion Processes. Part 1: Reactions of Pyrolysis. Energy Sources 2008, 30, 620–635. [Google Scholar] [CrossRef]
  53. Ranzi, E.; Cuoci, A.; Faravelli, T.; Frassoldati, A.; Migliavacca, G.; Pierucci, S.; Sommariva, S. Chemical Kinetics of Biomass Pyrolysis. Energy Fuels 2008, 22, 4292–4300. [Google Scholar] [CrossRef]
  54. El Mansouri, N.-E.; Salvadó, J. Structural characterization of technical lignins for the production of adhesives: Application to lignosulfonate, kraft, soda-anthraquinone, organosolv and ethanol process lignins. Ind. Crop. Prod. 2006, 24, 8–16. [Google Scholar] [CrossRef]
  55. Jaea, J.; Tompsett, G.A.; Foster, A.J.; Hammond, K.D.; Auerbachac, S.M.; Lobo, R.F.; Huber, G.W. Investigation into the shape selectivity of zeolite catalysts for biomass conversion. J. Catal. 2011, 279, 257–268. [Google Scholar] [CrossRef]
  56. Muhammad, I.; Manos, G. Intensification of co-pyrolysis of plastic with biomass via pretreatment. Process. Saf. Environ. Prot. 2021, 146, 586–598. [Google Scholar] [CrossRef]
  57. Paulsen, A.D.; Mettler, M.S.; Dauenhauer, P.J. The Role of Sample Dimension and Temperature in Cellulose Pyrolysis. Energy Fuels 2013, 27, 2126–2134. [Google Scholar] [CrossRef]
  58. Mettler, M.S.; Mushrif, S.H.; Paulsen, A.D.; Javadekar, A.D.; Vlachos, D.; Dauenhauer, P.J. Revealing pyrolysis chemistry for biofuels production: Conversion of cellulose to furans and small oxygenates. Energy Environ. Sci. 2012, 5, 5414–5424. [Google Scholar] [CrossRef] [Green Version]
  59. Hu, Y.; Wang, H.; Lakshmikandan, M.; Wang, S.; Wang, Q.; He, Z.; Abomohra, A.E.-F. Catalytic co-pyrolysis of seaweeds and cellulose using mixed ZSM-5 and MCM-41 for enhanced crude bio-oil production. J. Therm. Anal. Calorim. 2020, 1–16. [Google Scholar] [CrossRef]
  60. Zhang, H.; Xiao, R.; Wang, D.; Zhong, Z.; Song, M.; Pan, Q.; He, G. Catalytic Fast Pyrolysis of Biomass in a Fluidized Bed with Fresh and Spent Fluidized Catalytic Cracking (FCC) Catalysts. Energy Fuels 2009, 23, 6199–6206. [Google Scholar] [CrossRef]
  61. Liu, Z.; Shi, C.; Wu, D.; He, S.; Ren, B. A Simple Method of Preparation of High Silica Zeolite Y and Its Performance in the Catalytic Cracking of Cumene. J. Nanotechnol. 2016, 2016, 1–6. [Google Scholar] [CrossRef] [Green Version]
  62. Meng, B.; Ren, S.; Liu, X.; Zhang, L.; Hu, Q.; Wang, J.; Guo, Q.; Shen, B. Synthesis of USY Zeolite with a High Mesoporous Content by Introducing Sn and Enhanced Catalytic Performance. Ind. Eng. Chem. Res. 2020, 59, 5712–5719. [Google Scholar] [CrossRef]
  63. Zhang, L.; Bao, Z.; Xia, S.; Lu, Q.; Walters, K.B. Catalytic Pyrolysis of Biomass and Polymer Wastes. Catalysts 2018, 8, 659. [Google Scholar] [CrossRef] [Green Version]
  64. Niwa, M.; Suzuki, K.; Isamoto, K.; Katada, N. Identification and Measurements of Strong Brønsted Acid Site in Ultrastable Y (USY) Zeolite. J. Phys. Chem. B 2006, 110, 264–269. [Google Scholar] [CrossRef]
  65. Tang, B.; Li, S.; Song, W.C.; Yang, E.C.; Zhao, X.J.; Guan, N.; Li, L. Hierarchical FAU-Type Hafnosilicate Zeolite as a Robust Lewis Acid Catalyst for Catalytic Transfer Hydrogenation. ACS Sustain. Chem. Eng. 2019, 7, 16329–16343. [Google Scholar] [CrossRef]
  66. Marcilly, C. Acido-Basic Catalysis Application to Refining and Petrochemistry. Technip 2006, 2, 689–717. [Google Scholar]
  67. Corma, A.; Orchillés, A. Current views on the mechanism of catalytic cracking. Microporous Mesoporous Mater. 2000, 35, 21–30. [Google Scholar] [CrossRef]
  68. Lee, H.W.; Kim, Y.-M.; Jae, J.; Jeon, J.-K.; Jung, S.-C.; Kim, S.C.; Park, Y.-K. Production of aromatic hydrocarbons via catalytic co-pyrolysis of torrefied cellulose and polypropylene. Energy Convers. Manag. 2016, 129, 81–88. [Google Scholar] [CrossRef]
  69. Kim, Y.-M.; Lee, H.W.; Jae, J.; Bin Jung, K.; Jung, S.-C.; Watanabe, A.; Park, Y.-K. Catalytic co-pyrolysis of biomass carbohydrates with LLDPE over Al-SBA-15 and mesoporous ZSM-5. Catal. Today 2017, 298, 46–52. [Google Scholar] [CrossRef]
  70. Park, Y.-K.; Siddiqui, M.Z.; Kang, Y.; Watanabe, A.; Lee, H.W.; Jeong, S.J.; Kim, S.; Kim, Y.-M. Increased Aromatics Formation by the Use of High-Density Polyethylene on the Catalytic Pyrolysis of Mandarin Peel over HY and HZSM-5. Catalysts 2018, 8, 656. [Google Scholar] [CrossRef] [Green Version]
  71. Li, X.; Li, J.; Zhou, G.; Feng, Y.; Wang, Y.; Yu, G.; Deng, S.; Huang, J.; Wang, B. Enhancing the production of renewable petrochemicals by co-feeding of biomass with plastics in catalytic fast pyrolysis with ZSM-5 zeolites. Appl. Catal. A Gen. 2014, 481, 173–182. [Google Scholar] [CrossRef]
  72. Bertero, M.; García, J.R.; Falco, M.; Sedran, U. Equilibrium FCC catalysts to improve liquid products from biomass pyrolysis. Renew. Energy 2019, 132, 11–18. [Google Scholar] [CrossRef]
  73. Patwardhan, P.R.; Brown, R.C.; Shanks, B.H. Product Distribution from the Fast Pyrolysis of Hemicellulose. ChemSusChem 2011, 4, 636–643. [Google Scholar] [CrossRef]
  74. Corma, A.; Huber, G.W.; Sauvanaud, L.; O’Connor, P. Processing biomass-derived oxygenates in the oil refinery: Catalytic cracking (FCC) reaction pathways and role of catalyst. J. Catal. 2007, 247, 307–327. [Google Scholar] [CrossRef]
  75. Wang, K.; Kim, K.H.; Brown, R.C. Catalytic pyrolysis of individual components of lignocellulosic biomass. Green Chem. 2014, 16, 727–735. [Google Scholar] [CrossRef]
  76. Räisänen, U.; Pitkänen, I.; Halttunen, H.; Hurtta, M. Formation of the main degradation compounds from arabinose, xylose, mannose and arabinitol during pyrolysis. J. Therm. Anal. Calorim. 2003, 72, 481–488. [Google Scholar] [CrossRef]
  77. Wang, S.; Liu, Q.; Wang, K.; Guo, X.; Luo, Z.; Cen, K.; Fransson, T. Study on Catalytic Pyrolysis of Manchurian Ash for Production of Bio-Oil. Int. J. Green Energy 2010, 7, 300–309. [Google Scholar] [CrossRef]
  78. Wang, S.; Zhou, Y.; Liang, T.; Guo, X. Catalytic pyrolysis of mannose as a model compound of hemicellulose over zeolites. Biomass Bioenergy 2013, 57, 106–112. [Google Scholar] [CrossRef]
  79. Guo, X.; Wang, S.; Zhou, Y.; Luo, Z. Catalytic pyrolysis of xylan-based hemicellulose over zeolites. Int. J. Energy Env. 2011, 5, 137–142. [Google Scholar] [CrossRef]
  80. Lee, H.W.; Farooq, A.; Jang, S.-H.; Kwon, E.E.; Jae, J.; Lam, S.S.; Jung, S.-C.; Park, Y.-K. Enhanced bioaromatics synthesis via catalytic co-pyrolysis of cellulose and spent coffee ground over microporous HZSM-5 and HY. Environ. Res. 2020, 184, 109311. [Google Scholar] [CrossRef]
  81. Wong, S.L.; Ngadi, N.; Abdullah, T.; Inuwa, I. Conversion of low density polyethylene (LDPE) over ZSM-5 zeolite to liquid fuel. Fuel 2017, 192, 71–82. [Google Scholar] [CrossRef]
  82. Carlson, T.R.; Jae, J.; Lin, Y.-C.; Tompsett, G.A.; Huber, G.W. Catalytic fast pyrolysis of glucose with HZSM-5: The combined homogeneous and heterogeneous reactions. J. Catal. 2010, 270, 110–124. [Google Scholar] [CrossRef]
  83. French, R.; Czernik, S. Catalytic pyrolysis of biomass for biofuels production. Fuel Process. Technol. 2010, 91, 25–32. [Google Scholar] [CrossRef]
  84. Zhang, H.; Cheng, Y.-T.; Vispute, T.P.; Xiao, R.; Huber, G.W. Catalytic conversion of biomass-derived feedstocks into olefins and aromatics with ZSM-5: The hydrogen to carbon effective ratio. Energy Environ. Sci. 2011, 4, 2297–2307. [Google Scholar] [CrossRef] [Green Version]
  85. Wang, K.; Brown, R.C. Catalytic pyrolysis of microalgae for production of aromatics and ammonia. Green Chem. 2013, 15, 675–681. [Google Scholar] [CrossRef]
  86. Rezaei, P.S.; Shafaghat, H.; Daud, W.M.A.W. Suppression of coke formation and enhancement of aromatic hydrocarbon production in catalytic fast pyrolysis of cellulose over different zeolites: Effects of pore structure and acidity. RSC Adv. 2015, 5, 65408–65414. [Google Scholar] [CrossRef]
  87. Wang, S.; Dai, G.; Yang, H.; Luo, Z. Lignocellulosic biomass pyrolysis mechanism: A state-of-the-art review. Prog. Energy Combust. Sci. 2017, 62, 33–86. [Google Scholar] [CrossRef]
  88. Ma, Z.; Van Bokhoven, J.A. Deactivation and Regeneration of H-USY Zeolite during Lignin Catalytic Fast Pyrolysis. ChemCatChem 2012, 4, 2036–2044. [Google Scholar] [CrossRef]
  89. Zong, P.; Jiang, Y.; Tian, Y.; Li, J.; Yuan, M.; Ji, Y.; Chen, M.; Li, D.; Qiao, Y. Pyrolysis behavior and product distributions of biomass six group components: Starch, cellulose, hemicellulose, lignin, protein and oil. Energy Convers. Manag. 2020, 216, 112777. [Google Scholar] [CrossRef]
  90. Wang, S.; Ru, B.; Lin, H.; Sun, W. Pyrolysis behaviors of four O-acetyl-preserved hemicelluloses isolated from hardwoods and softwoods. Fuel 2015, 150, 243–251. [Google Scholar] [CrossRef]
  91. Chew, J.J.; Doshi, V. Recent advances in biomass pretreatment—Torrefaction fundamentals and technology. Renew. Sustain. Energy Rev. 2011, 15, 4212–4222. [Google Scholar] [CrossRef]
  92. Shuping, Z.; Yulong, W.; Mingde, Y.; Chun, L.; Junmao, T. Pyrolysis characteristics and kinetics of the marine microalgae Dunaliella tertiolecta using thermogravimetric analyzer. Bioresour. Technol. 2010, 101, 359–365. [Google Scholar] [CrossRef]
  93. Huang, Y.; Kudo, S.; Masek, O.; Norinaga, K.; Hayashi, J.-I. Simultaneous Maximization of the Char Yield and Volatility of Oil from Biomass Pyrolysis. Energy Fuels 2013, 27, 247–254. [Google Scholar] [CrossRef] [Green Version]
  94. Bai, X.; Johnston, P.; Brown, R.C. An experimental study of the competing processes of evaporation and polymerization of levoglucosan in cellulose pyrolysis. J. Anal. Appl. Pyrolysis 2013, 99, 130–136. [Google Scholar] [CrossRef]
  95. Gobin, K.; Manos, G. Polymer degradation to fuels over microporous catalysts as a novel tertiary plastic recycling method. Polym. Degrad. Stab. 2004, 83, 267–279. [Google Scholar] [CrossRef]
  96. Akpanudoh, N.S.; Gobin, K.; Manos, G. Catalytic degradation of plastic waste to liquid fuel over commercial cracking catalysts: Effect of polymer to catalyst ratio/acidity content. J. Mol. Catal. A Chem. 2005, 235, 67–73. [Google Scholar] [CrossRef]
  97. Gulab, H.; Jan, M.R.; Shah, J.; Manos, G. Plastic catalytic pyrolysis to fuels as tertiary polymer recycling method: Effect of process conditions. J. Environ. Sci. Health Part A 2010, 45, 908–915. [Google Scholar] [CrossRef]
Figure 1. TGA of non-catalytic and catalytic degradation of cellulose using different pre-treatment methods; mass fraction against temperature (5 K/min).
Catalysts 11 00805 g001
Figure 2. TGA of non-catalytic and catalytic degradation of cellulose using different pre-treatment methods; mass fraction against temperature (10 K/min).
Catalysts 11 00805 g002
Figure 3. (a) Liquid and (b) coke/char yields for catalytic pyrolysis of cellulose with USY catalyst, showing the effect of using pre-treatment method (co-pressing) compared to normal mixing, (Cellulose 2 g, catalyst 1.0 g, reaction temperature 723 K, N2 flow rate 60 mLN/min).
Catalysts 11 00805 g003
Figure 4. (a) Liquid and (b) coke/char yields for catalytic pyrolysis of cellulose with HY catalyst, showing the effect of using the pre-treatment method (co-pressing) at different reaction temperature, (Cellulose 2 g, catalyst 1.0 g, flow rate 60 mLN/min).
Catalysts 11 00805 g004
Figure 5. Liquid boiling point distribution from catalytic pyrolysis of cellulose with HY and USY catalysts (Cellulose 2 g, catalyst 1.0 g, pyrolysis temperature = 723 K, N2 flow rate 60 mLN/min).
Catalysts 11 00805 g005
Figure 6. Liquid boiling point distribution from catalytic pyrolysis of hemicellulose with HY and USY catalysts (Hemicellulose 2 g, catalyst 1.0 g, pyrolysis temperature = 723 K, N2 flow rate 60 mLN/min).
Catalysts 11 00805 g006
Figure 7. Liquid boiling point distribution from catalytic pyrolysis of cellulose with HY catalyst at different reaction temperatures (Cellulose 2 g, catalyst 1.0 g, N2 flow rate 60 mLN/min).
Catalysts 11 00805 g007
Figure 8. Characterisation of coked/char sample via TGA.
Catalysts 11 00805 g008
Table 1. Coked/Charred catalyst classification.
SampleExperiment Type% Soft Coke/Char% Hard Coke/CharCoke/Char Concentration
CelluloseThermal72.028.0-
Cellulose + USYCatalytic (Normal mixing)78.022.00.59
Cellulose + USYCatalytic (Co-pressed)71.029.00.51
HemicelluloseThermal14.585.5-
Hemicellulose + USYCatalytic (Normal mixing)75.524.50.45
LigninThermal36.064.0-
Lignin + USYCatalytic (Normal mixing)73.027.01.45
Table 2. Catalysts Properties.
CatalystProperties
BET (m2/g)Micropore Volume (cm3/g)Micropore Surface Area (m2/g)External Surface Area (m2/g)Si/Al Ratio
HY590.00 ± 23.500.26532.4072.582.5
USY433.60 ± 14.080.19361.0272.585.7 (framework)
Table 3. Boiling point distribution intervals of calibration mixture.
Group of Carbon AtomBoiling Point (K)Group of Carbon AtomAverage Boiling Point (K)ΔT(K)Retention Time (min)
C4H10272.70C4H10–C5H12290.9536.50-
C5H12309.20C5H12–C6H14325.5532.7016.03
C6H14341.90C6H14–C7H16356.7529.7020.94
C7H16371.60C7H16–C8H18385.2027.2027.16
C8H18398.80C8H18–C9H20411.4025.2033.26
C9H20424.00C9H20–C10H22435.6523.3038.64
C10H22447.30C10H22–C11H24458.2021.8043.37
C11H24469.10C11H24–C12H26479.3020.4047.61
C12H26489.50C12H26–C13H28499.0519.1051.49
C13H28508.60C13H28–C14H30517.6518.1055.05
C14H30526.70C14H30–C15H32535.2517.1058.51
C15H32543.80C15H32–C16H34551.9016.2061.91
C16H34560.00C16H34–C17H36567.6015.2065.26
C17H36575.20C17H36–C18H38582.3514.3068.71
C18H38589.50C18H38–C19H40596.3013.6072.43
C19H40603.10C19H40–C20H42610.0513.9076.60
C20H42617.00C20H42+617.00-81.45
Publisher’s Note: MDPI stays neutral with regard to jurisdictional claims in published maps and institutional affiliations.

