Article

Adsorption Followed by Plasma Assisted Catalytic Conversion of Toluene into CO2 on Hopcalite in an Air Stream

by
Shilpa Sonar
1,2,
Jean-Marc Giraudon
1,
Savita Kaliya Perumal Veerapandian
2,
Jean-François Lamonier
1,
Rino Morent
2,
Axel Löfberg
1 and
Nathalie De Geyter
2,*
1
Centrale Lille, Univ. Lille, CNRS, Univ. Artois, UMR 8181-UCCS-Unité de Catalyse et Chimie du Solide, F-59000 Lille, France
2
Research Unit Plasma Technology (RUPT), Department of Applied Physics, Faculty of Engineering and Architecture, Ghent University, Sint-Pietersnieuwstraat 41 (B4), 9000 Ghent, Belgium
*
Author to whom correspondence should be addressed.
Catalysts 2021, 11(7), 845; https://doi.org/10.3390/catal11070845
Submission received: 15 June 2021 / Revised: 8 July 2021 / Accepted: 11 July 2021 / Published: 14 July 2021

Abstract

:
The abatement of toluene was studied in a sequential adsorption-plasma catalysis (APC) process. Within this process, Hopcalite was used as bifunctional material: as adsorbent (storage stage) and as catalyst via the oxidation of adsorbed toluene (discharge stage). It was observed that the desorption and oxidation activity of the adsorbed toluene was significantly affected the process variables. In addition, the adsorption time influenced the CO2 selectivity and CO2 yield by changing the interaction between the catalyst and the plasma generated species. At least four APC sequences were performed for each examined condition suggesting that Hopcalite is very stable under plasma exposure during all the sequences. Consequently, these results could contribute to advance the plasma–catalyst system with an optimal VOC oxidation efficiency. The catalytic activity, amount of toluene adsorbed, amount of toluene desorbed and product formation have been quantified by FT-IR. Moreover, the catalyst was characterized by XRD, H2-TPR, N2 adsorption–desorption analysis and XPS. Hopcalite shows a good CO2 selectivity and CO2 yield when the APC process is performed with an adsorption time of 20 min and a plasma treatment with a discharge power of 46 W which leads to a low energy cost of 11.6 kWh·m−3 and energy yields of toluene and CO2 of 0.18 (±0.01) g·kWh−1 and 0.48 (±0.06) g·kWh−1 respectively.

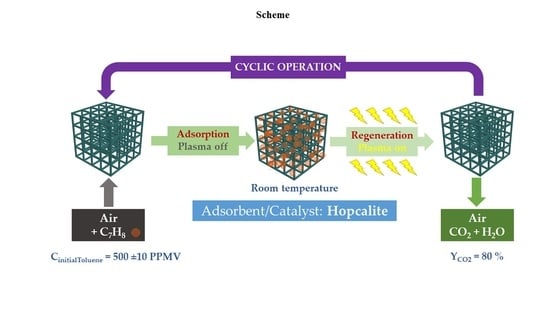
Graphical Abstract

1. Introduction

Owing to rapid industrialization and urbanization, the production of volatile organic compounds (VOCs) is increasing, which in turn is one of the main reasons for the development of photochemical smog [1,2]. Considering the harmful effect on the atmosphere and human health, the removal of VOCs is attracting a lot of researcher’s attention [3]. Among different VOCs, the removal of toluene is particularly important as it is one of the main VOCs serving as a significant contributor to the production of photochemical smog [4]. Numerous technologies such as adsorption [5], ozone oxidation [6], catalytic oxidation [5], and thermal catalytic combustion [7] have been used to address the abatement of high concentrations of VOCs. Each of these technologies has its own advantages and drawbacks.
Among these available removal technologies, non-thermal plasma (NTP) is a promising method for VOC removal. This is due to its non-equilibrium character, its fast reaction, its low energy cost, and the fact that the process operates at ambient temperature (the temperature of the energetic electrons can however reach 104–105 K) and atmospheric pressure. In this case, the availability of energy can break chemical bonds of reactive molecules which leads to a variety of reactive species such as free radicals, ions, excited atoms, and excited molecules. However, incomplete degradation of the VOCs, poor selectivity to CO2, toxic and unwanted byproducts formation (such as CO, O3, and organic intermediates) and overall low energy efficiencies make NTP systems impractical. Consequently, it is very important to find an alternative approach to address the major drawbacks associated with NTP systems. One of the most popular approaches used to optimize the process is to add a catalyst [8] either in the plasma reactor itself (in-plasma catalysis) or in the downstream of the plasma reactor (post-plasma catalysis). In the in-plasma catalysis configuration, plasma treatment can take place either in a continuous mode or in a sequential mode. However, in the continuous approach, electrical energy is continuously applied to the gas stream to be treated and, as a result, the energy consumption is high.
To reduce this energy consumption, the plasma process can be performed in a sequential mode. In this sequential mode or a so-called adsorption-plasma catalysis (APC) process, the VOC is first stored on the catalyst (storage stage) keeping the plasma discharge off. Then, the stored VOC is oxidized into CO2 by igniting the plasma (discharge stage) [9,10]. This interesting approach helps to reduce the high energy consumption of classical in-plasma catalysis systems which in turn contributes to an improved energy efficiency [11]. Sivachandrian et al. [12] found that the sequential process consumes ten times less energy to produce the same number of CO2 species than that of the continuous NTP treatment of isopropanol. In addition, the reviews on sequential adsorption-plasma systems written by Thevenet et al. [13], and Sultana et al. [14] also evidence that by amplifying the adsorption stage and/or shortening the discharge period, the energy consumption can be further reduced. In order to improve the catalytic efficiency, to reduce the unwanted byproducts and to limit the energy cost during an APC process, an efficient bifunctional catalytic material is required. First of all, the material should be a good adsorbent to increase the duration of the storage stage and thus to reduce the energy cost (i.e., adsorption/storage stage duration (t1) > discharge time (t2)). In addition, the material should possess good catalytic properties to improve the selectivity and yield of the targeted product (CO2), and to reduce the formation of unwanted products or byproducts. In recent years, different catalysts such as zeolites [15], metal organic frameworks (MOFs) [16], noble metals [17], metal oxides [18] and their combinations have been investigated in APC. For example, Qin et al. [18] applied Ag-Mn (F)/γ-Al2O3 catalysts for the sequential adsorption-plasma catalytic removal of toluene and reported higher CO2 selectivity, CO2 yield and better carbon balance compared to catalysts prepared using other impregnation sequences. Wang et al. [19] reported that different metals (Ag, Mn, Ce) supported on HZSM-5 played an important role in catalytic performance and byproduct suppression. Among the binary metal oxides, CuMnOx is a powerful catalyst used for the oxidation of small molecules at low temperature, and thus, it can be a good candidate for VOC removal through APC. This bimetallic oxide, widely known as Hopcalite, is a porous amorphous material which shows excellent performance in oxidation reactions such as CO oxidation [20,21] and VOC total oxidation [22]. Considering its porosity and catalytic performances in total oxidation reactions, Hopcalite can be an effective candidate as a bifunctional material in an APC process, acting as an adsorbent in the storage phase and as a catalyst during the discharge stage.
Veerapandian et al. [23] previously used Hopcalite (Purelyst MD101) as a bifunctional material in an APC process for the removal of 500 ppm of toluene in dry air. A three-step sequence has been adopted consisting of (i) an adsorption/storage stage (t1 ≈ 300 min) consisting of a quasi-sorbent saturation of Hopcalite followed by (ii) a desorption step by air flushing to get rid of the reversibly adsorbed toluene and finally (iii) a discharge step (t2 = 60 min) making use of an NTP generated in air at a discharge power of 44 W to oxidize adsorbed toluene into CO2 and to regenerate the bifunctional catalyst. It has been found that the CO2 yield and CO2 selectivity (based on the amount of irreversibly adsorbed toluene) were improved from 60% to 62% and from 86% to 93% respectively, while using NTP regenerated Hopcalite when compared to fresh calcined Hopcalite. The first NTP exposure resulted in a partial transformation of Hopcalite into crystallized Mn3O4 with a decrease in the specific surface area by a factor of 2 but an increase of adsorbed surface oxygen versus lattice oxygen as determined by XPS. Such structural and textural transformations occur likely due to the exothermicity of the oxidative transformation of adsorbed toluene into CO2. However, these NTP induced transformations actually promote the performance of the APC process towards the transformation of toluene into CO2.
However, in a real abatement process the previously mentioned approach overestimates the useful adsorption capacity as reaching the nominal toluene inlet concentration would imply the release of a substantial amount of VOC in the outlet stream. To overcome this issue, it is necessary to assess the useful adsorption capacity, i.e., the adsorption of toluene taking place until a given threshold concentration (tolerable in the outlet stream) is attained. In our previous study, this approach has also been followed, but in that case two other techniques were combined (adsorption and a thermal oxidation process) [24]. Within the context of an APC process, Liu et al. [25] followed the above mentioned strategy for the removal of benzene over AgMn/HZSM-5. In this study, the adsorption of benzene took place till 2 µmol·g−1 of benzene adsorbed and the plasma exposure in air was performed for 24 min. Although the study showed interesting results, it was lacking a thorough characterization of fresh and used catalysts to have a close view on the catalytic behavior.
In this study, the removal of toluene at high concentration (500 ppm) using an APC process has been investigated over Hopcalite. To reduce the VOC release at the exit of the reactor during the storage stage and to reduce the exothermicity of the NTP induced oxidation of adsorbed toluene over Hopcalite, the effect of low toluene storage stage time duration (t1) and of the applied discharge power P on the performance of the APC process have been studied in terms of catalytic and energetic performances. Furthermore, a four sequential APC experiment has also been performed to study the stability of Hopcalite with time. Finally, different physicochemical characterizations including XRD, H2-TPR, N2 adsorption–desorption analysis and XPS have been conducted to detect eventual modifications of the bifunctional material.

2. Results and Discussion

2.1. Effect of Toluene Exposure Time on APC Process Performances

The effect of toluene exposure time on the amount of adsorbed toluene has been investigated using a gaseous effluent of 500 ± 10 ppmv of toluene/air (0.2 L·min−1) at 25 °C. Five low-term toluene exposure times (5, 10, 20, 30, and 40 min) have been chosen allowing promotion of the amount of irreversibly adsorbed toluene. Figure 1a shows the toluene concentration profiles during the adsorption storage stage for all adsorption time spans under study. For the examined low toluene exposure times, the toluene concentration evolutions during the first 15 min match that of the FT-IR response observed during the purge of an empty reactor (Figure 1a). After reaching that time, the concentration of toluene increases as a function of time and the resulting curves mostly overlap. Taking into account these observations, it is considered that all introduced toluene is irreversibly adsorbed on the material until the slope of the toluene concentration becomes positive. Hence, at the beginning of the experiments, most of the toluene in the simulated exhaust gas is removed from the gas phase due to strong adsorption on the surface of Hopcalite. After ~15 min, the concentration of toluene at the outlet of the reactor gradually increases. This may be due to the lower availability of vacant surface sites which can get occupied by toluene which leads to the creation of repulsive forces between adsorbate present on the adsorbent surface and in the gas bulk phase. The total amount of toluene adsorbed on the Hopcalite packed bed increases quite linearly from 16.7 to 70.6 µmol·g−1 as a function of time (Table 1).
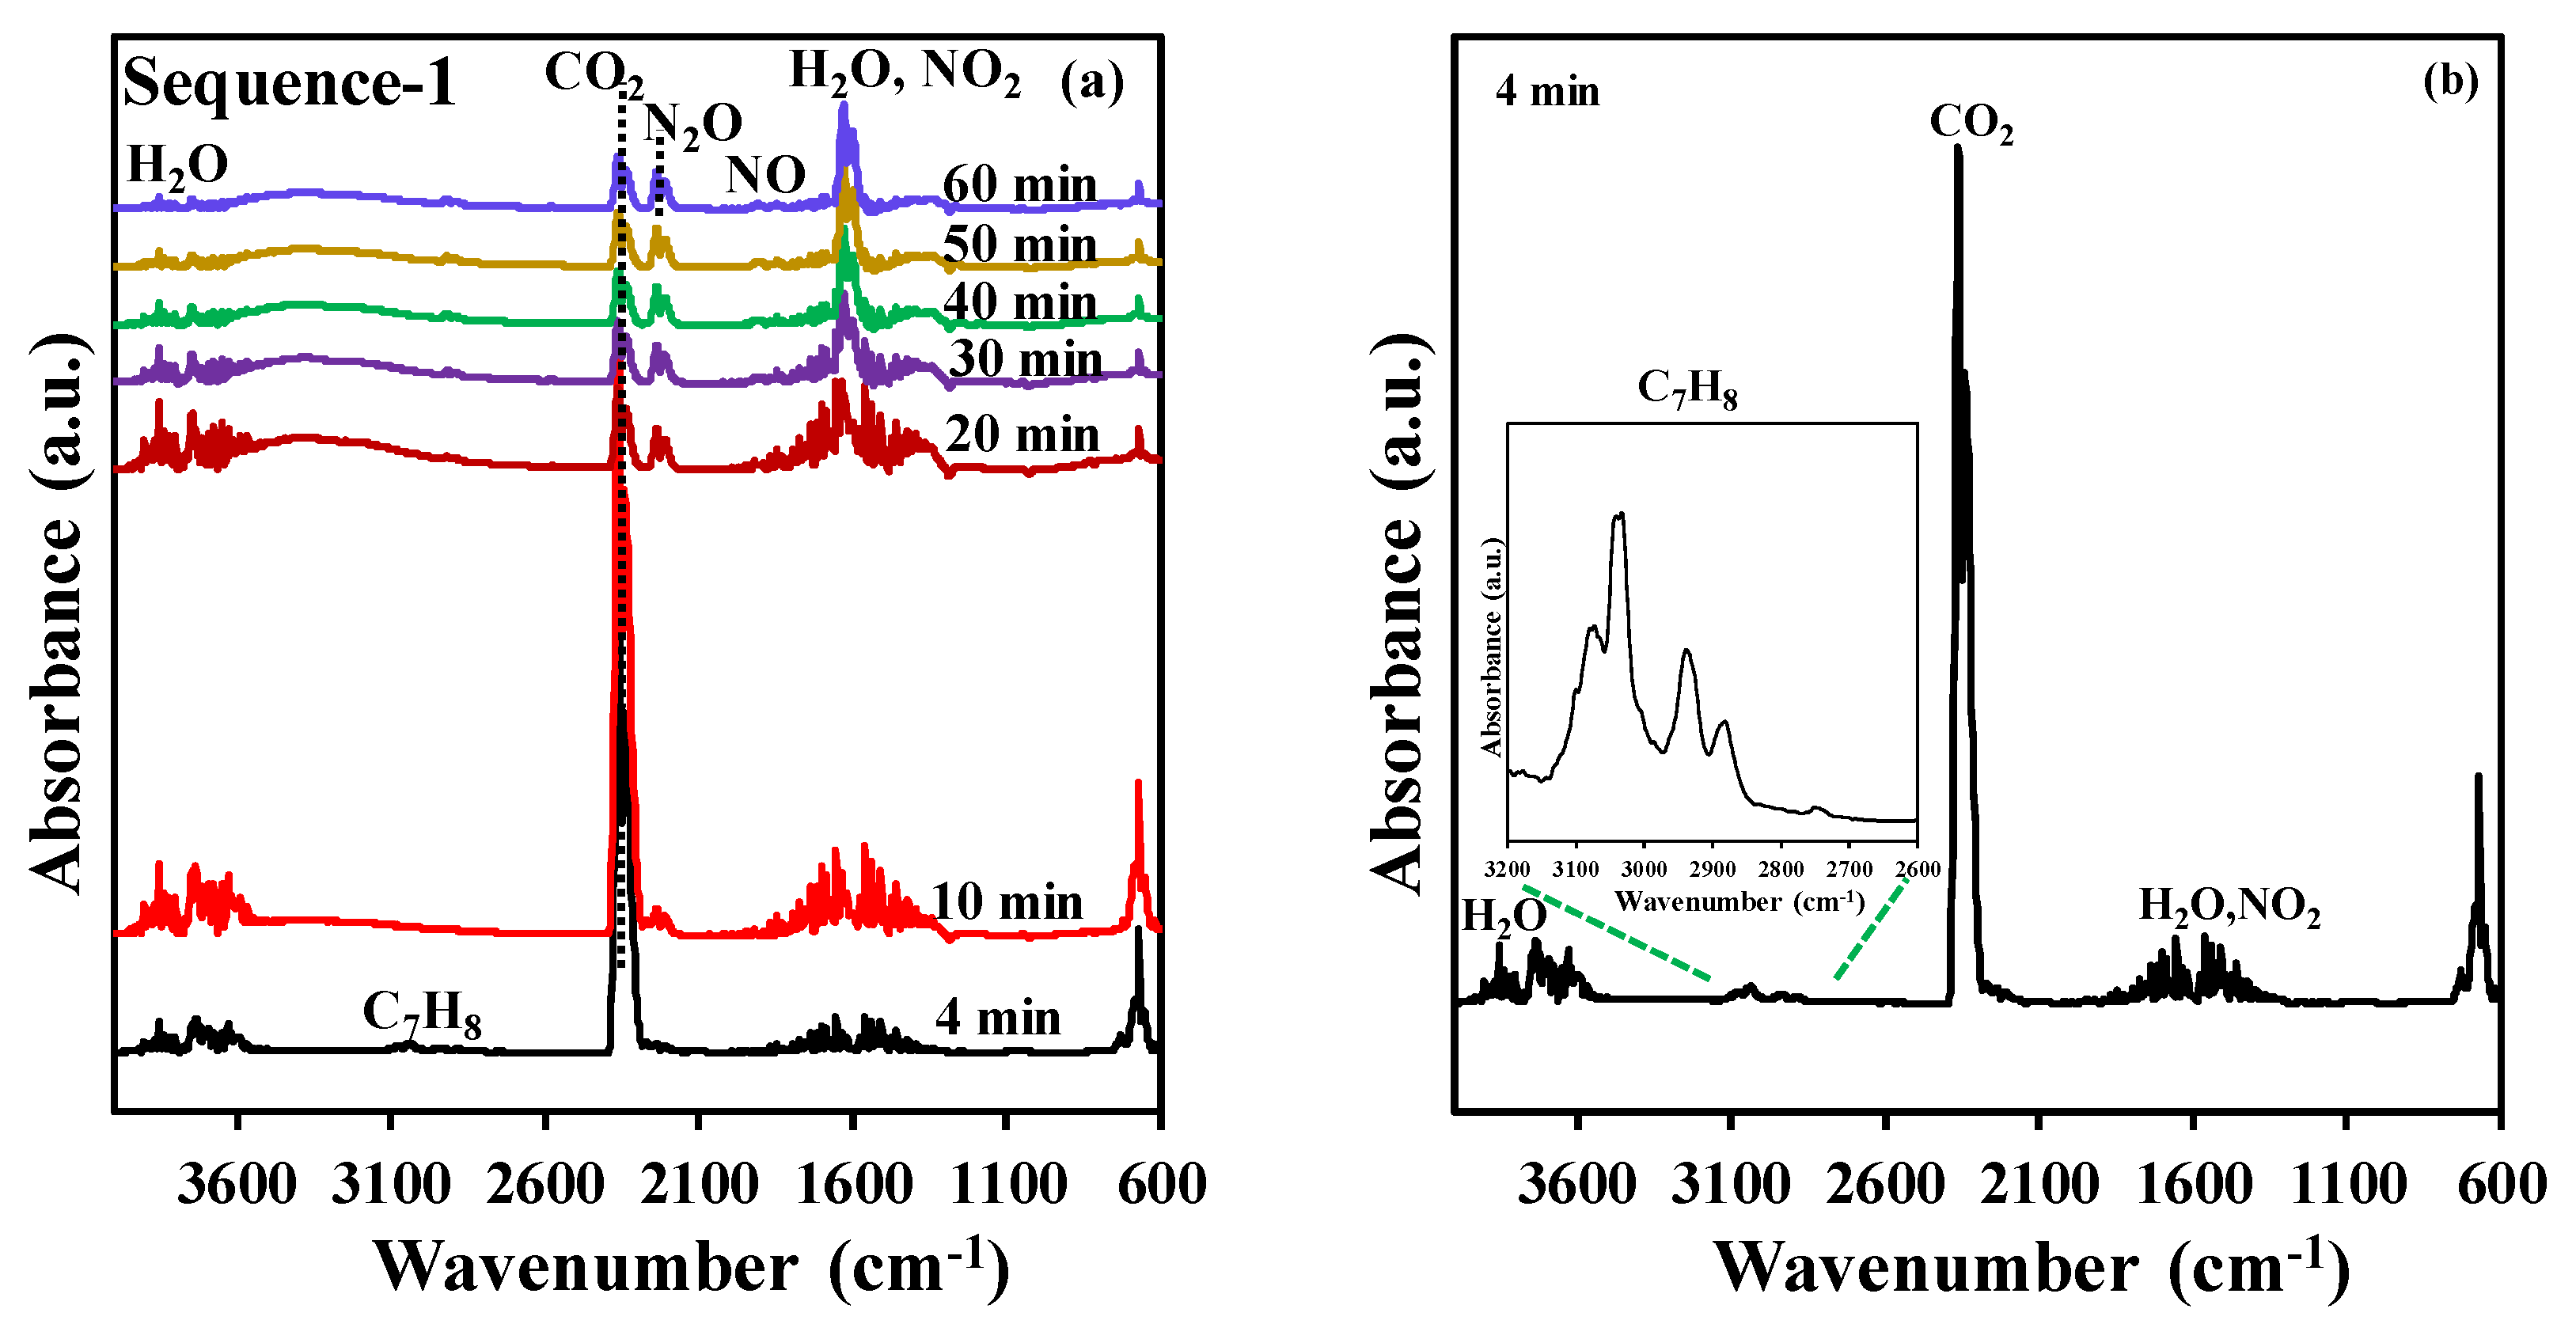
After the adsorption step, the NTP exposure step has been performed in dry air (0.2 L·min−1) at a discharge power of 46 W using a time span of 60 min. During NTP exposure, toluene, CO2, N2O, NO2, NO, and H2O are the only gaseous species detected at the outlet of the reactor by FT-IR, as shown in Figure 2. This work will only focus on the quantification of the desired end product (CO2) as the quantification of H2O, NO2, and N2O was not possible as the instrument was not calibrated for these species. Figure 2b represents an enlargement of the FT-IR spectrum (4 min of NTP exposure) of the effluent from the DBD reactor, which revealed the desorption of toluene at the beginning of the NTP discharge stage. To summarize, during the discharge stage, in addition to the desorption of reversibly adsorbed toluene molecules, an eventual break down of irreversibly adsorbed toluene into CO2 and H2O is observed. Interestingly, the formation of NOx species appears only after approx. 10 min of reaction and is observed continuously after 20 min. Thus, no or little NOx is produced during the CO2 production supposedly because the oxidation active sites are occupied by adsorbed toluene. Once toluene is fully converted, these sites become active for N2 oxidation. This feature opens the path for a significant reduction of NOx production by adjusting the NTP discharge time to the minimum required for the combustion of adsorbed toluene and the regeneration of the catalyst.
As shown in Figure 1b, during NTP exposure, toluene desorbs as one desorption peak in each experiment. The transient desorption of toluene is short in time, and the maximal desorbed toluene concentration is reached after 2 to 4.5 min of plasma exposure and returns to baseline after 12 min of plasma exposure. While the onset of the peak formation as well as the desorption peak maximum occur at the same time from a toluene exposure time above 10 min, these positions are shifted to a higher plasma exposure time when the toluene exposure time decreases below 10 min indicating that the species are more strongly bonded to the surface when the overall amount of adsorbed toluene is smaller. The amount of desorbed toluene varies from 0.2 to 15.1 µmol·g−1 (labelled as “qtoluene unconverted” in Table 1) to be compared to the total amount of toluene adsorbed (16.7 to 70.6 µmol·g−1). The difference between the adsorbed toluene and unconverted toluene is stated as “qtoluene converted”, which is in the range of 16.5–55.5 µmol·g−1. It thus turns out that the toluene conversion (%) decreases from 99% to 79% with increasing the storage stage duration t1.
As previously mentioned, when the NTP is ignited, CO2 is produced. As seen in Figure 1c, the CO2 concentration profiles are characterized by intense production envelopes revealing two steps of CO2 formation for all experiments. The transient productions reach the first maximum (shoulder) value between 1 and 3 min of plasma exposure and the second maximum value between 7 and 9 min of plasma exposure and return to baseline beyond 20 min of plasma treatment. This type of behavior has been previously observed over Hopcalite whether it is by thermal desorption [24] or NTP exposure [23]. Most of the CO2 produced in the first minutes of NTP exposure is released in the gas phase and some surface sites are thus liberated. As a consequence, incomplete oxidized intermediates may remain in the adsorbed phase and get further oxidized under NTP exposure. This can explain the delayed formation of CO2 (second step).
The total carbon mass balance recovered by in-situ NTP treatment has been determined by considering the total amount of adsorbed toluene as 100%. CO2 quantified at the reactor downstream has been taken into account. The temporal profiles have been integrated and their relative contributions as YCO2 in the carbon balance of the NTP regeneration have been calculated. Based on that, YCO2 values have been calculated and the resulting values are reported in Table 1. It can be seen that these values are overestimated in the case of the first experiment due to the high uncertainty coming from the very short toluene exposure time of 5 min. Within 60 min of NTP treatment, excluding the first experiment, 98% to 82% of the total carbon mass balance has been recovered with the CO2 contribution amounting from 91% to 61%. Anyhow, the efficiency for toluene abatement into CO2 in terms of selectivity and yield and carbon balance (Table 1) increases with decreasing the toluene exposure time over Hopcalite. Similar observations have been also reported by Kim et al. [26] and Huang et al. [27]. The increasing amount of adsorbed toluene has been claimed to have negative effects on both the desorption of unconverted toluene and the efficiency of the oxidation process. Some carbon deposits on the inner walls of the plasma reactor and/or adsorbed species remaining on the packed bed material after the in-situ NTP treatment can account for the small carbon deficiency observed in this study, as was already previously reported in literature [24,28] in line with the absence of other gaseous organic species in the outlet of the reactor (observed by FT-IR).
To assess the energetic performance of the sequential APC process, the energy costs for purifying 1 m3 air (EC, kWh·m−3) and the energy yields EY(Tol) and EY(CO2) (g·kWh−1) corresponding to the amount of energy spent (i) to decompose the VOC, and (ii) to produce CO2 (qCO2), respectively, have been determined (Table 2). The EC values have been estimated by dividing the energy consumed in the discharge stage by the volume of polluted air fed on Hopcalite using Equation (3). The EC values lie between 46.5 and 5.8 kWh·m−3. As expected, the energy cost rapidly decreases with increasing storage time. EY(Tol) and EY(CO2) have been estimated by dividing the amount of toluene adsorbed and CO2 produced (qCO2) by the energy consumed as defined in Equations (4) and (5) respectively. When increasing the storage stage time by a factor 8, the removal of 1 g of toluene and the production of 1 g of CO2 requires less energy when compared to a short storage time. This study thus reveals that the duration of the storage stage of the APC process strongly affects its energetic performance.

2.2. Effect of Discharge Power on APC Process Performances

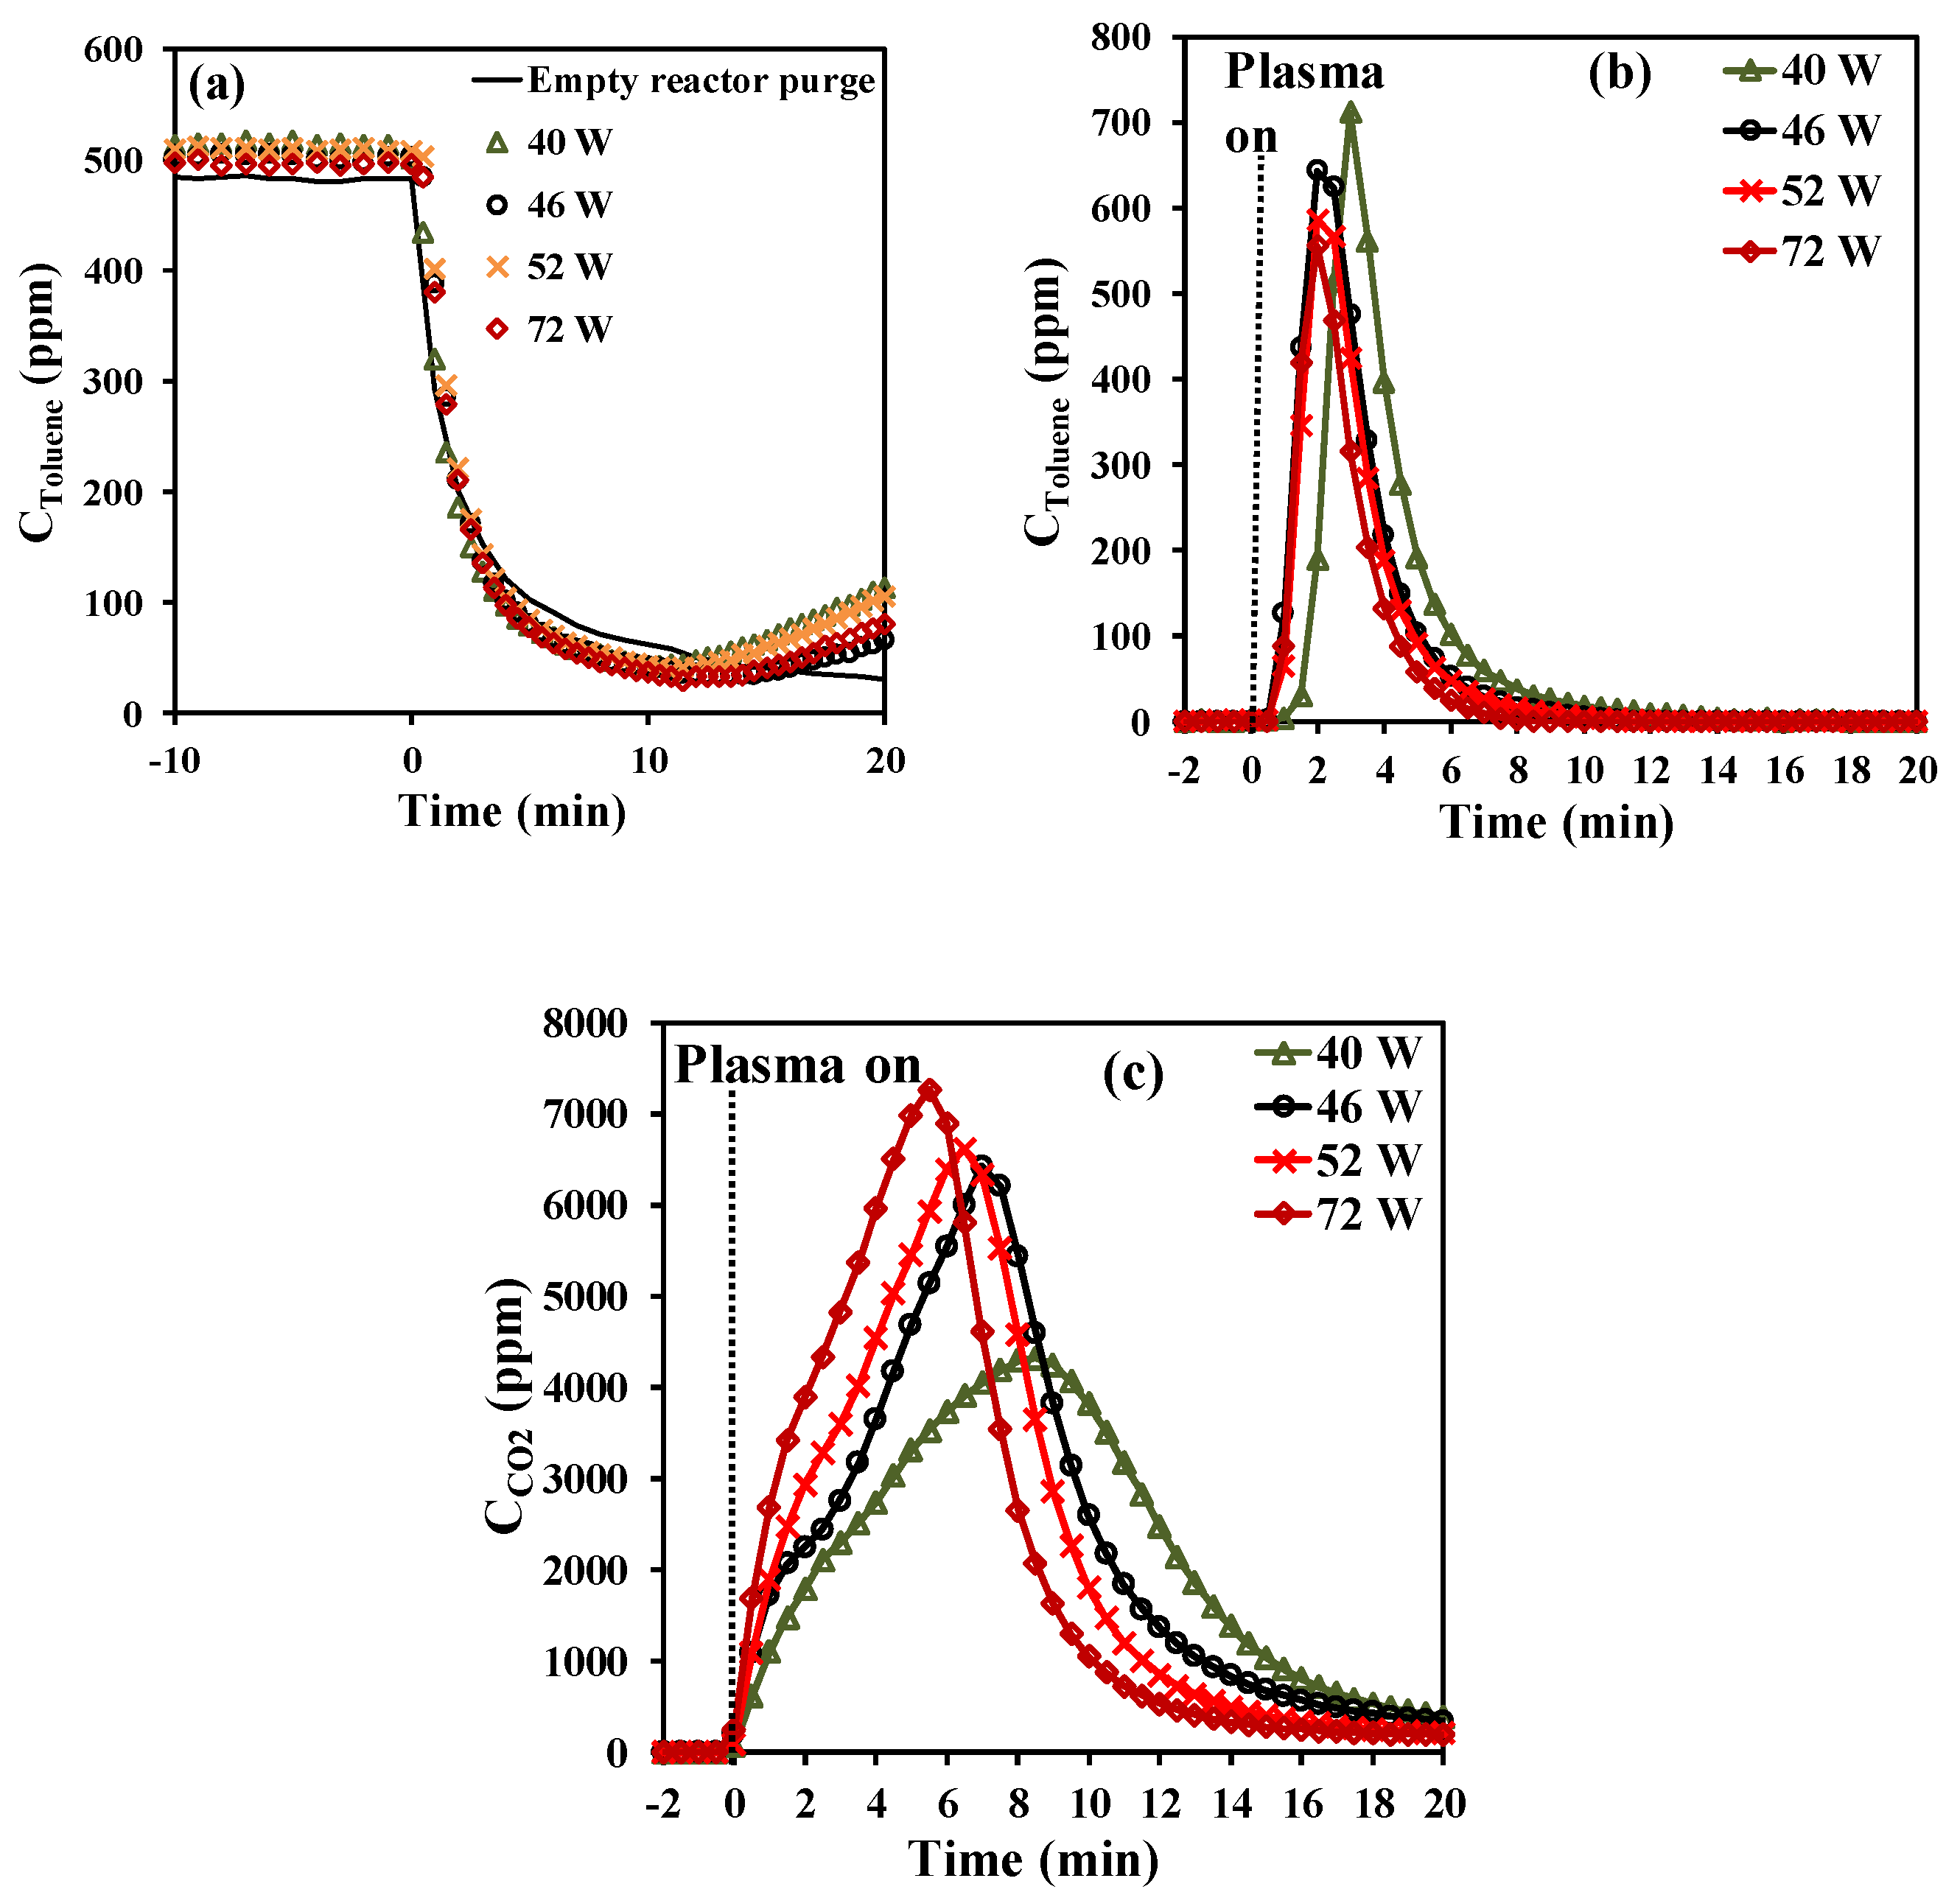
The effect of the adsorption time reveals that short adsorption periods favor the efficiency of the abatement process in terms of selectivity and yield towards complete oxidation of toluene, while longer adsorption periods are more favorable in terms of energy cost and efficiency. Therefore, for the further study over Hopcalite in this sequential abatement of toluene, a fixed adsorption time of 20 min has been chosen. The effect of the applied discharge power on the temporal evolution of toluene and CO2 during the NTP exposure has been investigated considering a storage time span (t1) of 20 min followed by an NTP discharge time (t2) of 60 min with an increased applied discharge power (40, 46, 52, and 72 W corresponding to a voltage amplitude of 6.5, 7.0, 7.5, and 8.0 kV, respectively), all other parameters being similar as before. It is noticed for all experiments that the temporal toluene profiles as shown in Figure 3a during the storage stage are quite similar to the temporal evolution of the amount of toluene adsorbed within the margin of error. Based on these temporal toluene profiles, the total amount of toluene adsorbed on the Hopcalite packed bed was determined and the results are presented in Table 3. The obtained qads values remain quite constant (43.8–45.4 µmol·g−1) as can be seen in Table 3. This can be attributed to the good efficiency of the NTP exposure for Hopcalite regeneration allowing to get at the start of each experiment a quasi-similar material.
As shown in Figure 3b, toluene desorbs again as one desorption peak in each experiment during NTP exposure. The transient desorption of toluene is however short in time: all toluene desorption profiles have a peak maximum at 2 min, except for the first desorption (40 W) whose maximum production occurs at 4 min. Consequently, the amount of toluene converted shows comparable values in the range 37–40 µmol·g−1 (see Table 3).
By opposition, the temporal profiles of the CO2 formed (qCO2) are significantly affected by the applied discharge power (Figure 3c). Although the envelope reveals again the two steps of CO2 formation for all experiments, the rate of qCO2 formation is strongly accelerated by the increase of plasma power as illustrated by an increase of the maximum CO2 concentration and the shortening of the overall oxidation process as plasma power increases. However, this is accompanied by a decrease in selectivity towards CO2 at powers above 46 W (see Table 3). Indeed, an optimum of selectivity and yield can be observed for a plasma power of 46 W. By using Equations (3) to (5), the EC, EY(Tol), and EY(CO2) values have also been determined and are reported in Table 3. The EC increases from 10 to 18 kWh·m−3 as power increases from 40 to 72 W. However, in the power range 40–52 W, there is a 25% decrease in EY(Tol) and EY(CO2). By opposition, when comparing the range of 40–52 W to 72 W, the energy yields drop by nearly half (50%). A low discharge power would therefore be recommended in terms of energy cost and efficiency when applying an APC abatement process.

2.3. Stability and Repeatability of Hopcalite in Adsorption-Plasma Catalysis

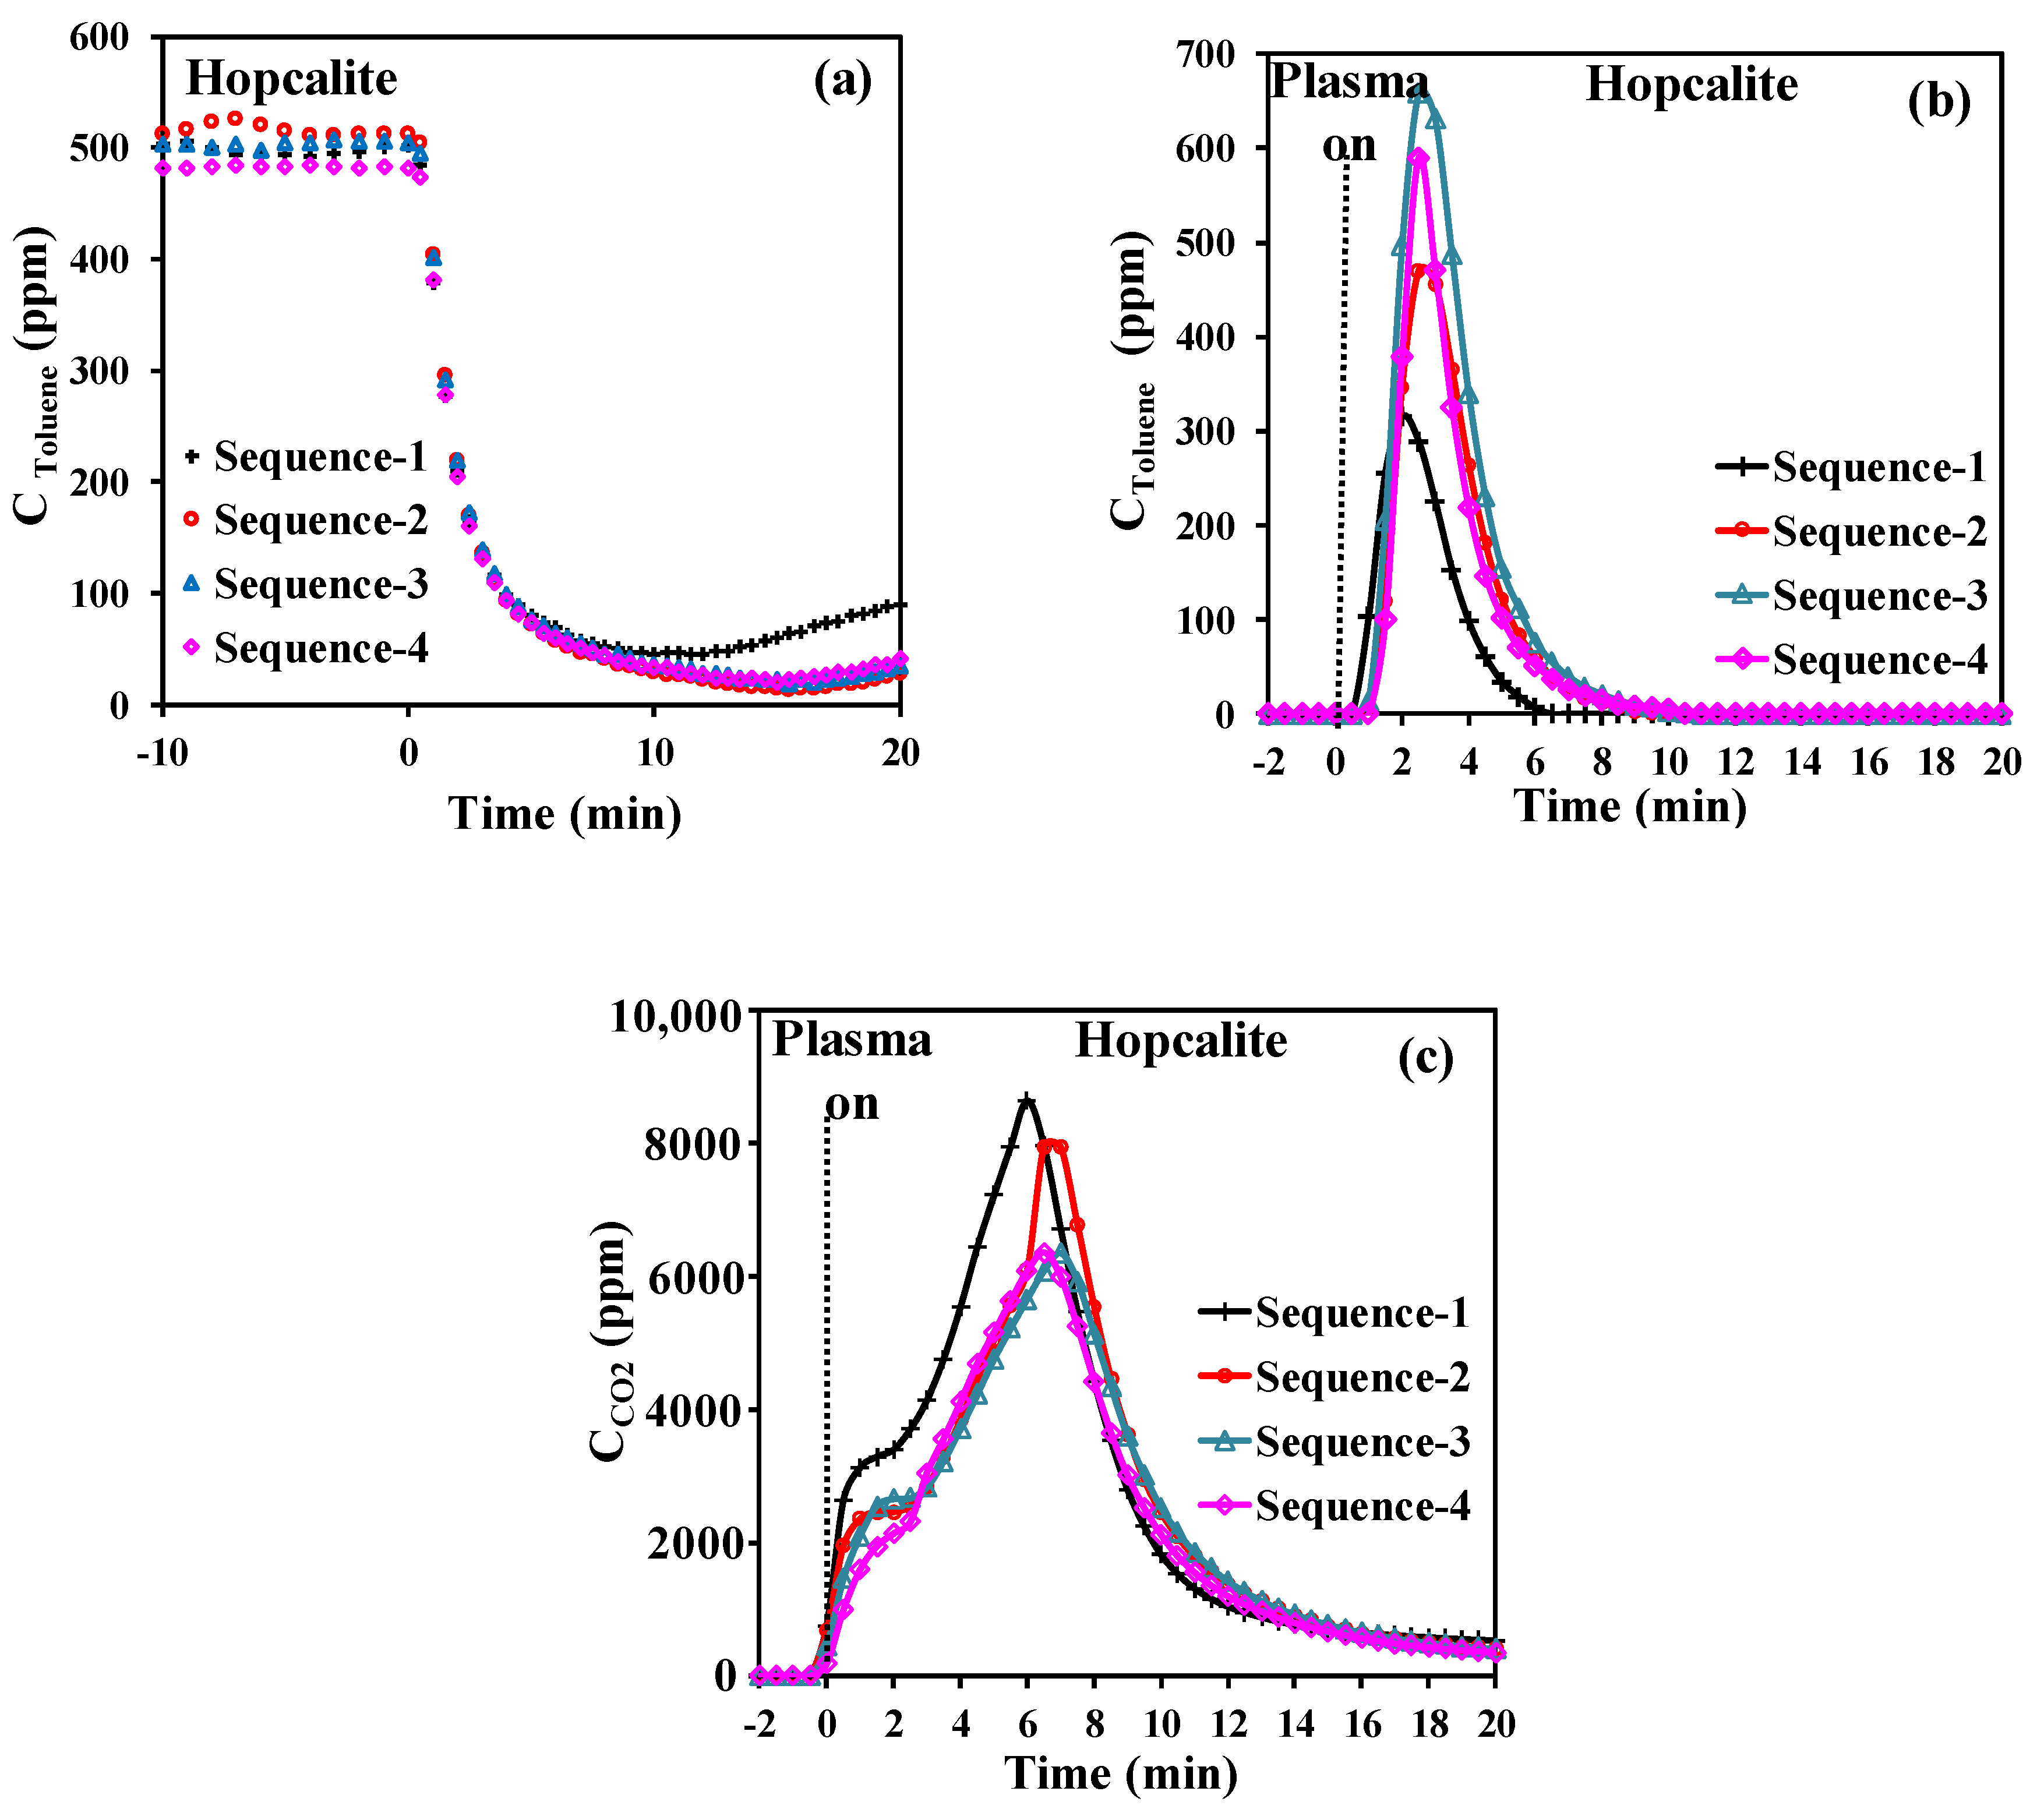
It is important that the adsorbent/catalyst performances of the bifunctional material are restored after plasma assisted regeneration. On purpose, Hopcalite for the adsorption of 500 ppm of toluene in dry air (0.2 L·min−1) for 20 min followed by air plasma exposure (0.2 L·min−1) for 60 min over four cycles of the APC technique has been investigated at a discharge power of 46 W. The time span of 20 min has been chosen to be a compromise between CO2 selectivity and energy performances. Figure 4a shows the concentration profile of gaseous toluene during the storage stage monitored over the 4 sequences. The useful toluene capacity is similar for all sequences as it remains constant at 46 ± 2 µmol·g−1 (Table 4). The lowest amounts of toluene adsorbed and toluene desorbed (Figure 4b) during the NTP exposure of 43.9 µmol·g−1 and 3.2 µmol·g−1, respectively, are observed for the first sequence. The temporal profiles of CO2 formed (Figure 4c) resemble those described before. It is noticed that the first qCO2 production is higher than the other ones and after that the envelopes are quasi-similar. Despite some variations between the different sequences, Hopcalite exhibited a rather good stability with a mean carbon balance (excluding the first sequence due to the deposition of some intermediates on the catalyst surface from the abatement of toluene) of about 88% and a CO2 selectivity of about 87%. Like previously, the EC, EY(Tol), and EY(CO2) values have been calculated by using Equations (3) to (5). The EC is stable at 11.6 kWh·m−3 for all sequences. Similarly, no significant discrepancies in EY(Tol) and EY(CO2) are found among the various sequences, with values of 0.18 (±0.01) g·kWh−1 and 0.48 (±0.06) g·kWh−1, respectively.

2.4. Characterization of Catalyst

The X-ray diffraction patterns of Hopcalite before and after a multi-sequential APC process (after 15 NTP exposures) are shown in Figure 5. Two low intense peaks localized at 37.2° and 68.2° in 2θ are shown for fresh Hopcalite indicating the presence of a mostly amorphous MnOx phase [29,30,31]. The peak at the higher 2θ angle is still present in the XRD profile after performing the multi-sequential APC process, but shifts to a lower 2θ angle, while also becoming more intense and broader. The broadening of the peak indicates that the material possesses a poor crystallinity after the APC process performed with multiple sequences.
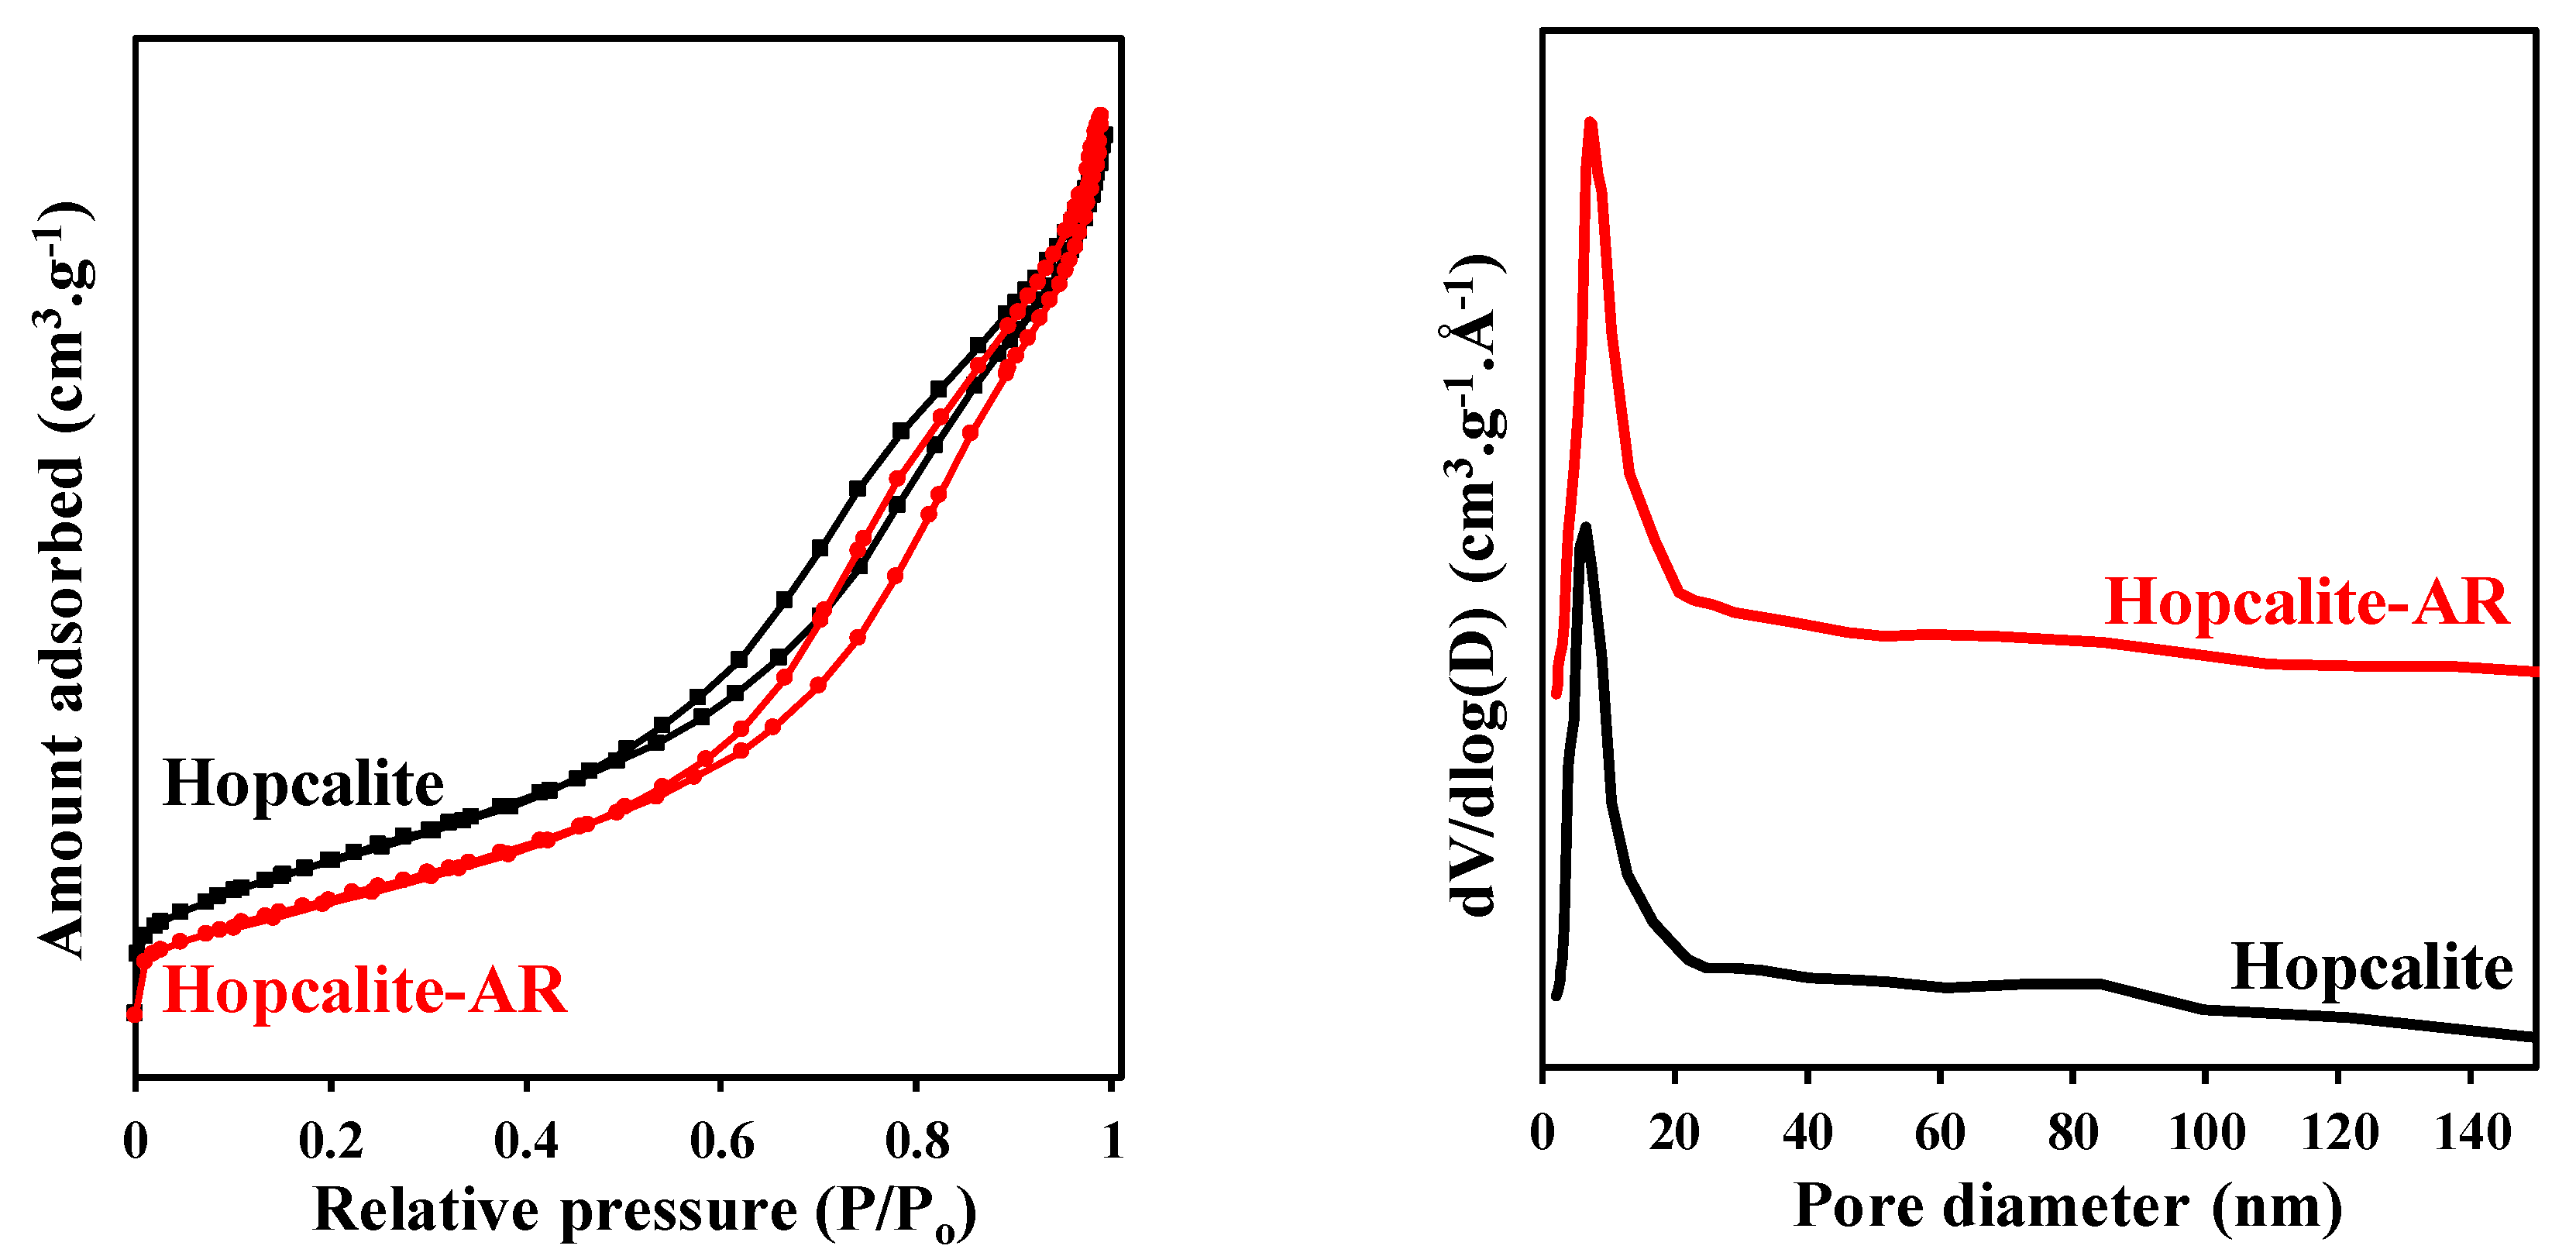
Figure 6 displays the N2 adsorption–desorption isotherms and pore size distribution (PSD) of the fresh Hopcalite and the Hopcalite after reaction (after 15 NTP exposures). A similar type IV isotherm with a hysteresis loop in the P/P0 range of 0.42–1.0 showing the mesoporous character of the material is observed. A small decrease of the SBET from 232 m2·g−1 to 195 m2·g−1 is noticed while the mean pore diameter and pore total volume maintain constant at 8 nm and 0.45 cm3·g−1 after multiple NTP exposures, respectively (c.f. Table 5).
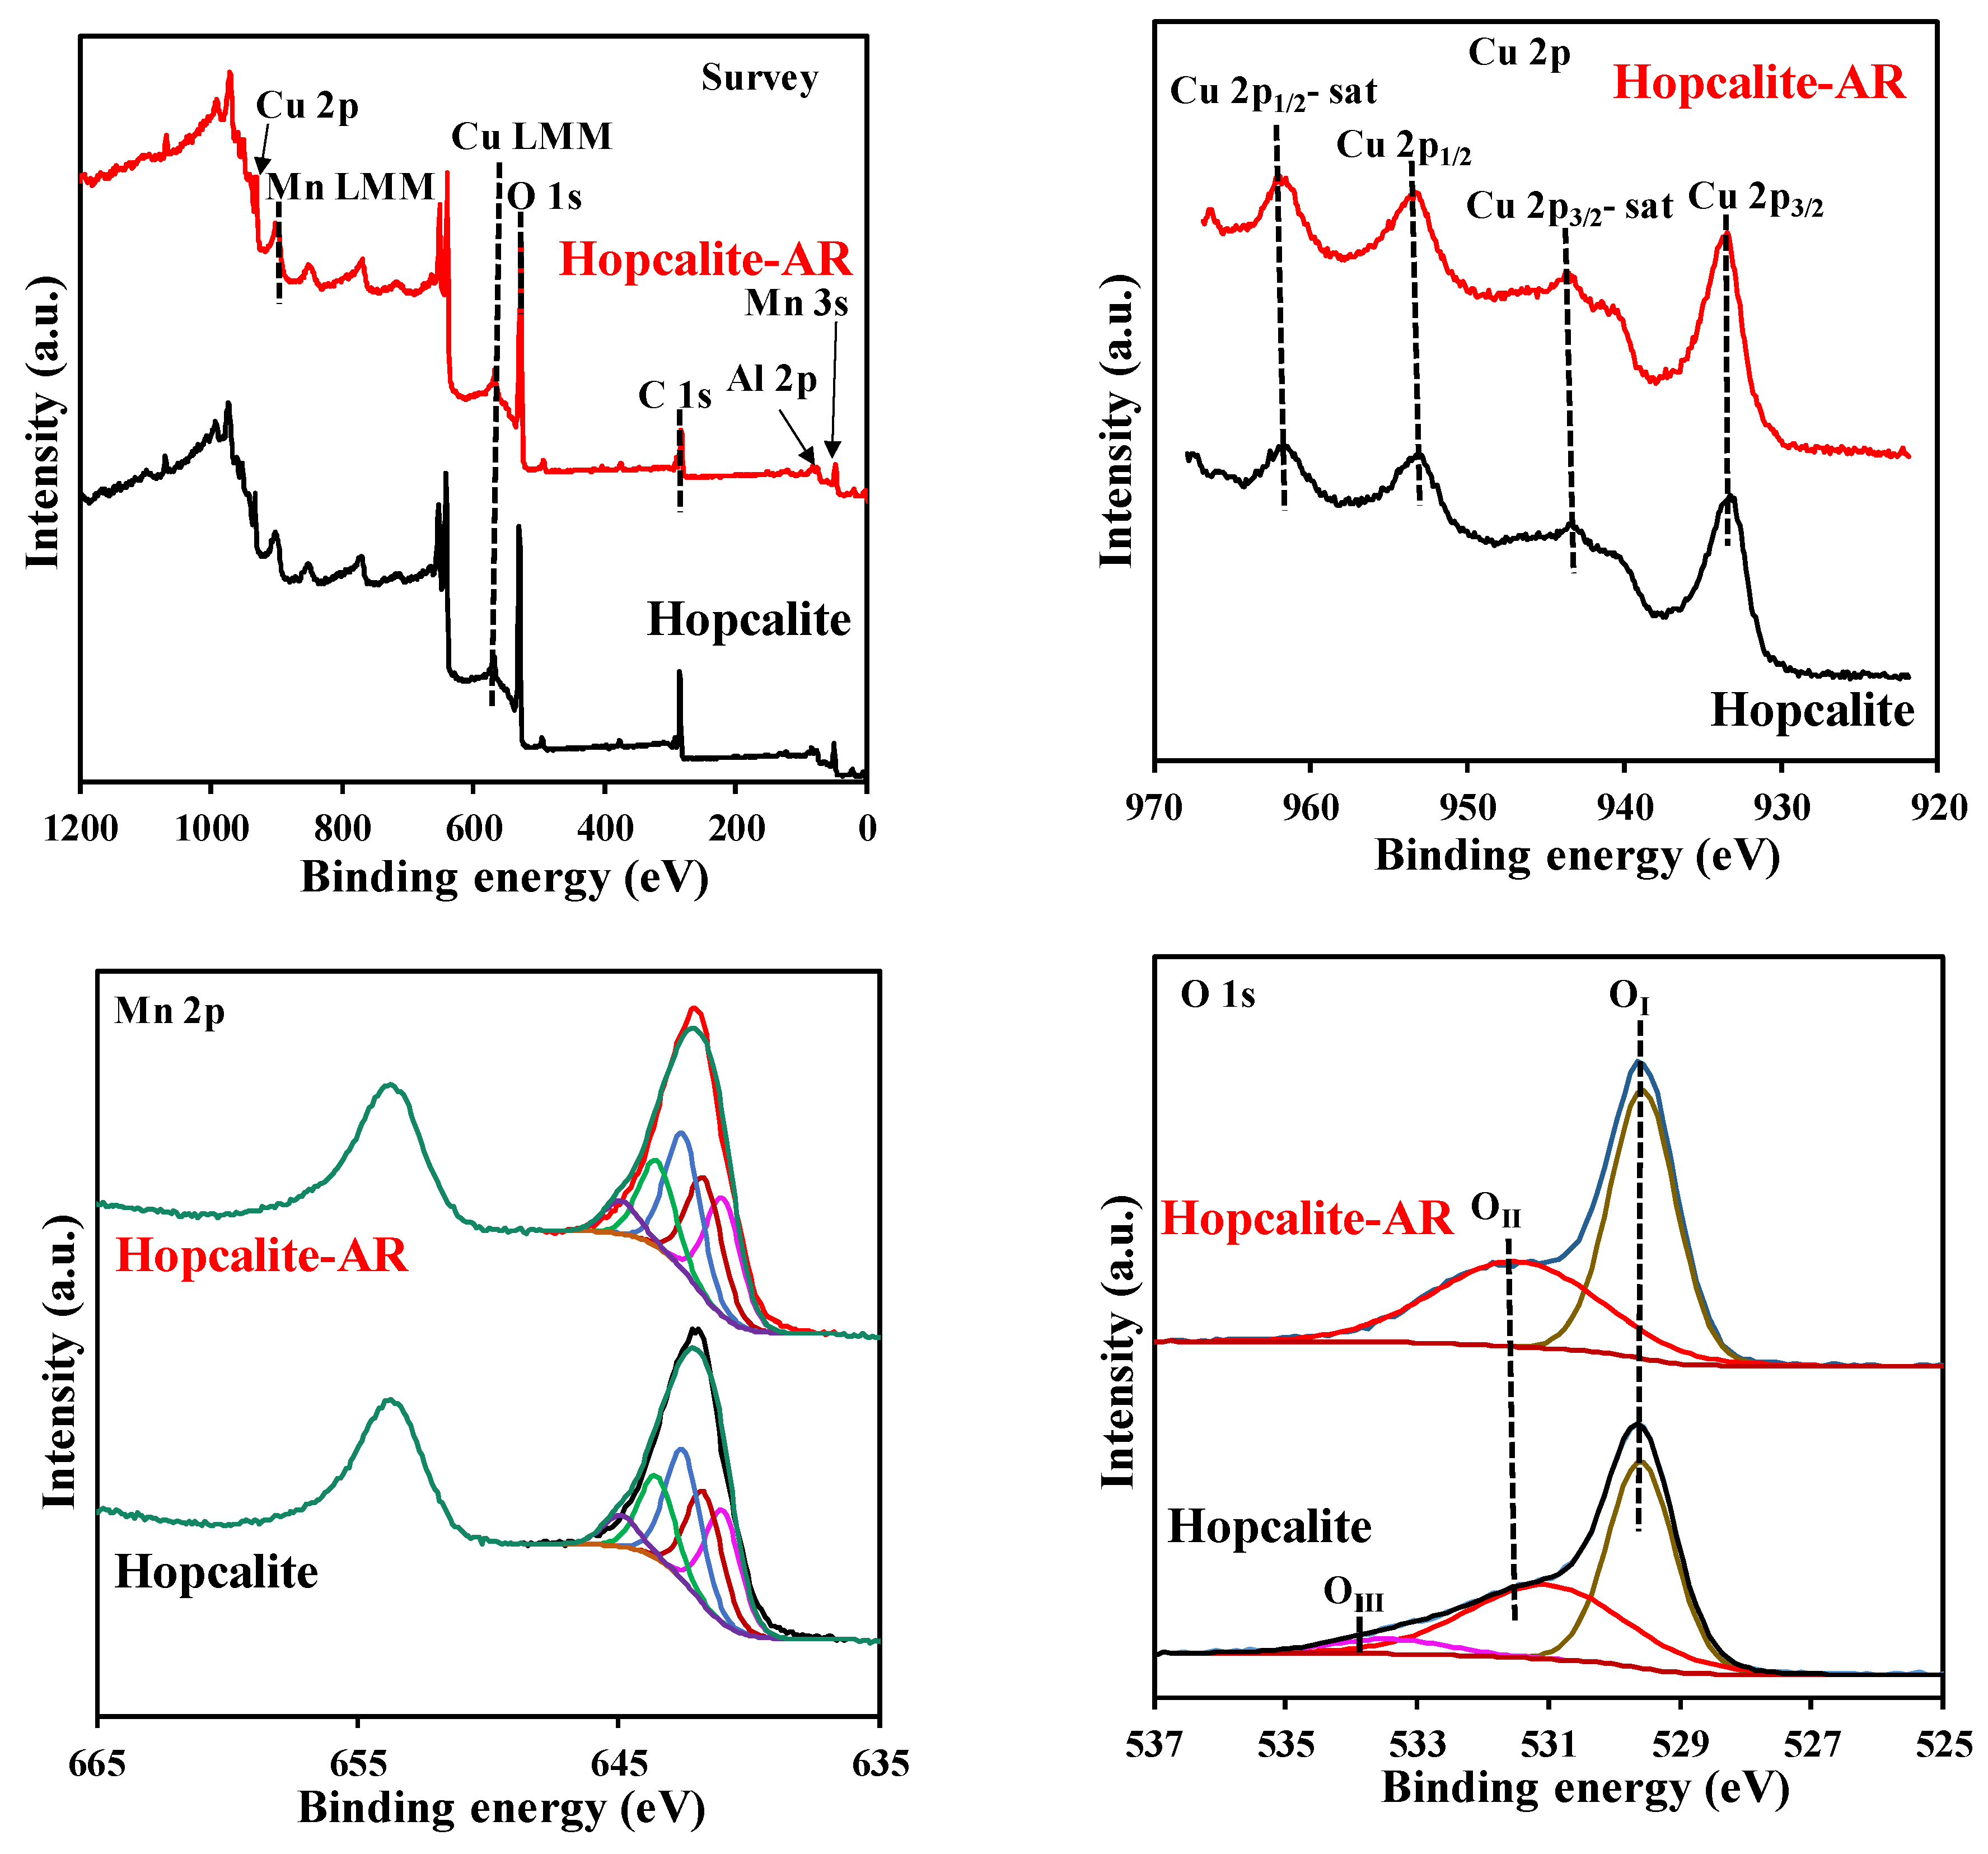
The surface state of Hopcalite before and after reaction was investigated by X-ray photoelectron spectroscopy (XPS) and the results are presented in Figure 7. The surface chemical states of the elements and the surface composition are also shown in Table 6 and Table 7 respectively. The XPS survey spectra reveal the presence of Cu, Mn, C, O, K, Na, and Al. The high-resolution Cu 2p envelopes are very similar before and after reaction. The Cu 2p3/2 peaks localized at binding energy of 933.4 eV ± 0.2 eV and the presence of satellites are indicative of divalent copper Cu2+ [28,32,33]. The Mn 2p3/2 envelopes can be successively decomposed considering a MnOOH species [34] in line with the Mn AOS (average oxidation state) of 3.1 estimated from the splitting of the two Mn 3s components [35]. The O 1s XPS spectra can be decomposed using three components: OI = 529.6 eV, OII = 531.1–531.5 eV and OIII = 533.4 eV. OI, OII and OIII have been assigned to surface lattice oxygen (O1att), surface adsorbed oxygen species (such as O2, O22− O, and OH/CO32− group) denoted as Osurf and adsorbed H2O on the surface, respectively [36]. It is also noteworthy to mention that the XPS composition (Table 7) is rather similar for Hopcalite before and after 15 NTP exposures. The Olatt/Oads ratio of 1.17 for pristine Hopcalite also increases to 1.27 after 15 multiple NTP exposures, while OIII species are absent on the latter sample (c.f. Table 6 and Table 7). This suggests that the presence of a high amount of surface active oxygen species will exert a productive effect upon building the exceptional reversibility of the surface redox cycle during toluene oxidation. This explains the good catalytic activity and maintained CO2 selectivity of several sequences performed on Hopcalite. In our previous work, Veerapandian et al. [23] proposed a detailed mechanism of toluene abatement. It was suggested that the catalytic oxidation of toluene follows a Mars and Van Krevelen mechanism. Accordingly, adsorbed toluene species are oxidized by the lattice oxygen and gas phased oxygen re-oxidizes the oxygen vacancy. In Hopcalite, Cu and Mn can get easily oxidized and reduced in the reaction cycle. As shown by the XPS data, Cu+-Cu2+ and Mn3+-Mn4+ redox couples are mostly responsible for the catalytic properties of the material.
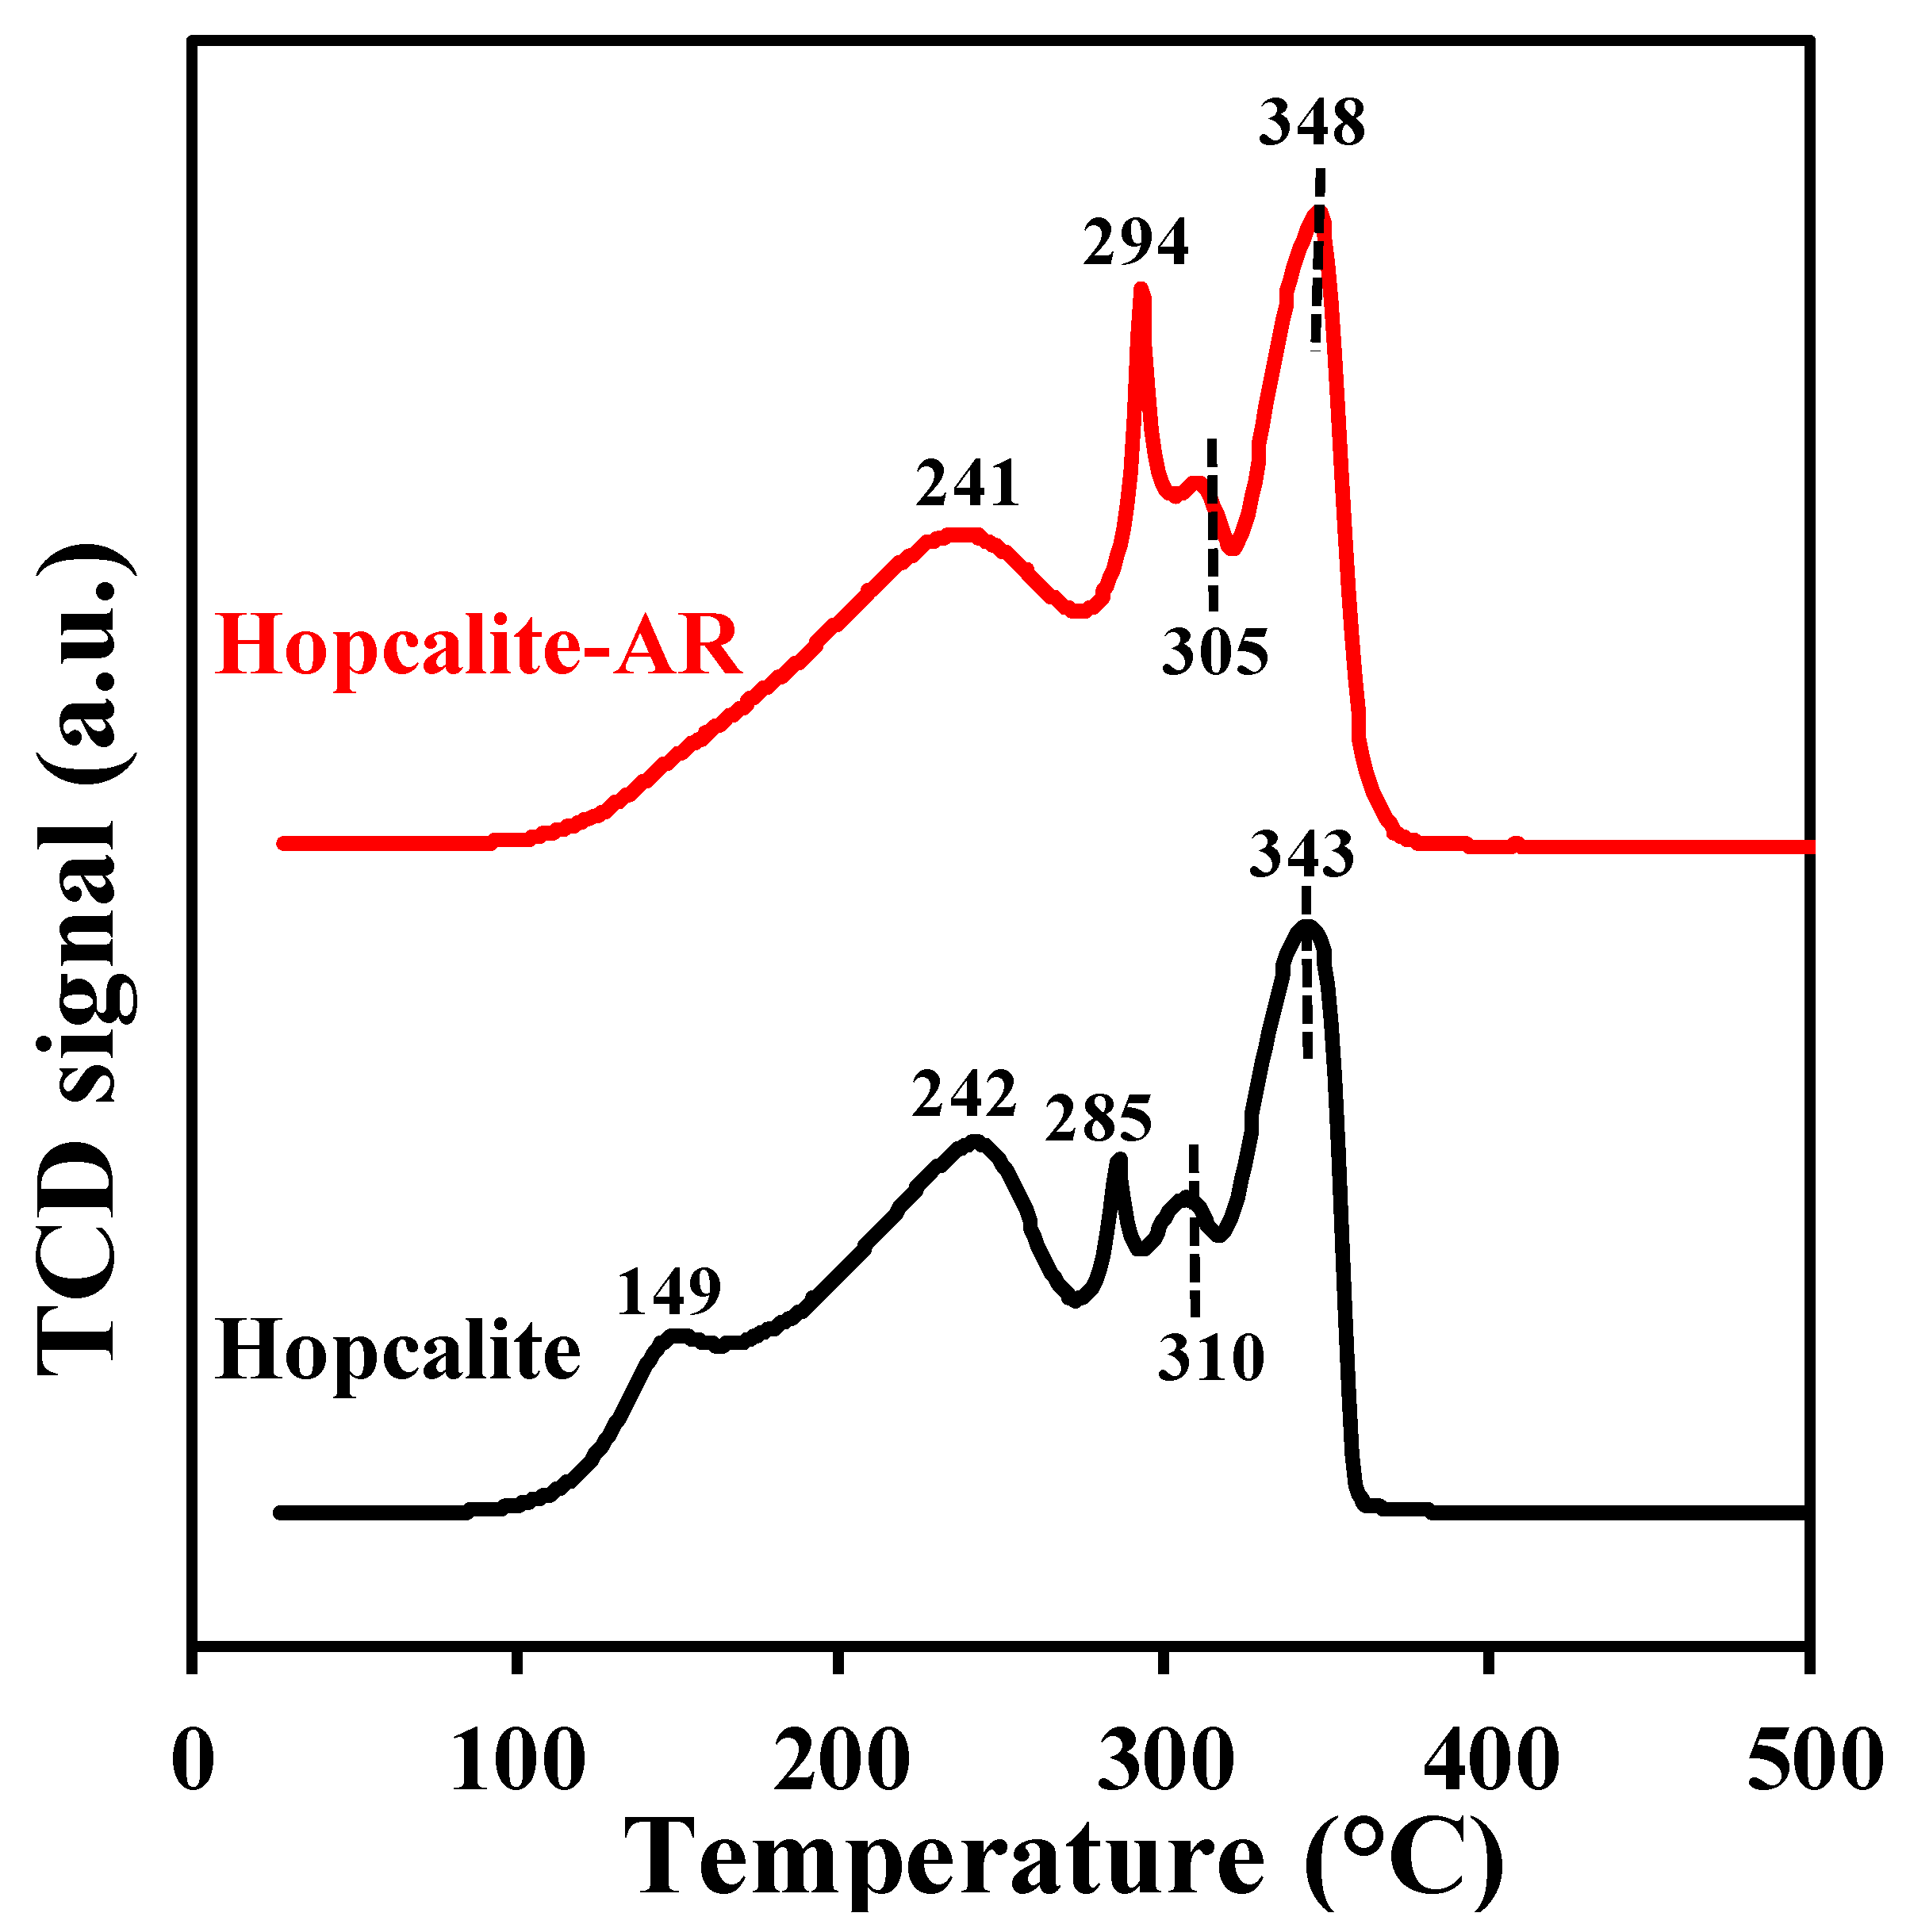
The H2-TPR profiles of the fresh Hopcalite and the Hopcalite after reaction (thus after 15 NTP exposures) shown in Figure 8 are complex [24] and quite similar except for the absence of the reduction peak at 149 °C for the Hopcalite after reaction. The absence of the peak at 149 °C for Hopcalite after reaction may be due to the reduction of CuOx into Cu (0) [31]. On the other hand, in comparison to the fresh catalyst, in which XPS and H2-TPR reveal the presence of the Cu2+, this latter species is absent in the H2 TPR profile of the used catalyst. However, the H2 consumption values are similar for the pristine and used Hopcalite (11 ± 2 mmol·g−1, c.f. Table 5). Moreover, the absence of the peak (at 149 °C) which corresponds to Cu2+ in H2 TPR does not influence the performance of Hopcalite in APC abatement of toluene.
The surface and bulk catalyst characterizations have confirmed that the structure, texture, reducibility, and surface composition of Hopcalite are mostly unaffected by the repeated sequences of toluene adsorption and plasma assisted oxidation. In addition, they also confirm the efficiency of the plasma process for the regeneration of the material.

3. Materials and Methods

3.1. Shaping and Activation of Hopcalite

Hopcalite (Purelyst MD101; CuO > 23 mol%, MnO2 > 69 mol%; PureSphere Co., Ltd., Nonsan-si, Korea) was purchased as pellets (diameter: 3 ± 0.5 mm: length: 10 mm). The pellets were crushed and the resulting powder was sieved to keep the particles of size range 200–300 μm. The black powder was calcined at 300 °C for 4 h in flowing dry air (2 °C·min−1, 0.2 L·min−1).

3.2. Material Characterization

Powder XRD patterns were obtained with a D8 Advanced Bruker AXS diffractometer (Cu Kα: 1.5406 Å). The 2θ angle was allowed to vary between 10° and 80° with a step size of 0.01° and an integration time of 1 s. N2 adsorption/desorption isotherms were measured at −196 °C using a Micrometrics TriStar II 3020 instrument. Prior to adsorption measurement, all samples were degassed at 150 °C for 5 h under vacuum (P = 0.05 mbar). The pore size distribution was obtained from the desorption branch of the isotherms using the Barrett–Joyner–Halanda (BJH) method. The total pore volume (Vp) was estimated from the amount of adsorbed nitrogen at P/P0 of 0.99. Hydrogen-temperature programmed reduction (H2-TPR) experiments were performed using a Micrometrics model autochem II. The materials (0.05 g) were submitted to a 5% H2/Ar gas mixture (50 mL·min−1) from 25 °C to 1000 °C (10 °C·min−1). XPS spectra were recorded with a KRATOS, AXIS Ultra spectrometer with an Al Kα anode (1486.6 eV) and a hemispherical analyzer with constant ∆E/E. Binding energies (BE) were corrected by taking the C 1s peak at 284.8 eV. CasaXPS was used for XPS peak fitting. The Cu/Mn ratio was estimated from Cu 2p1/2 and Mn 2p3/2 core-levels. The Mn 2p3/2 envelope has been decomposed considering the presence of Mn(III) species which can be formally simulated by MnOOH in accordance with the fits of Biesinger et al. [34] using a set of multiplet peaks with corresponding relative intensity, a full width at half maximum (FWHM) and differing in BE between each set of peaks by a fixed difference.

3.3. Experimental Adsorption-Plasma Catalysis (APC) Set-Up

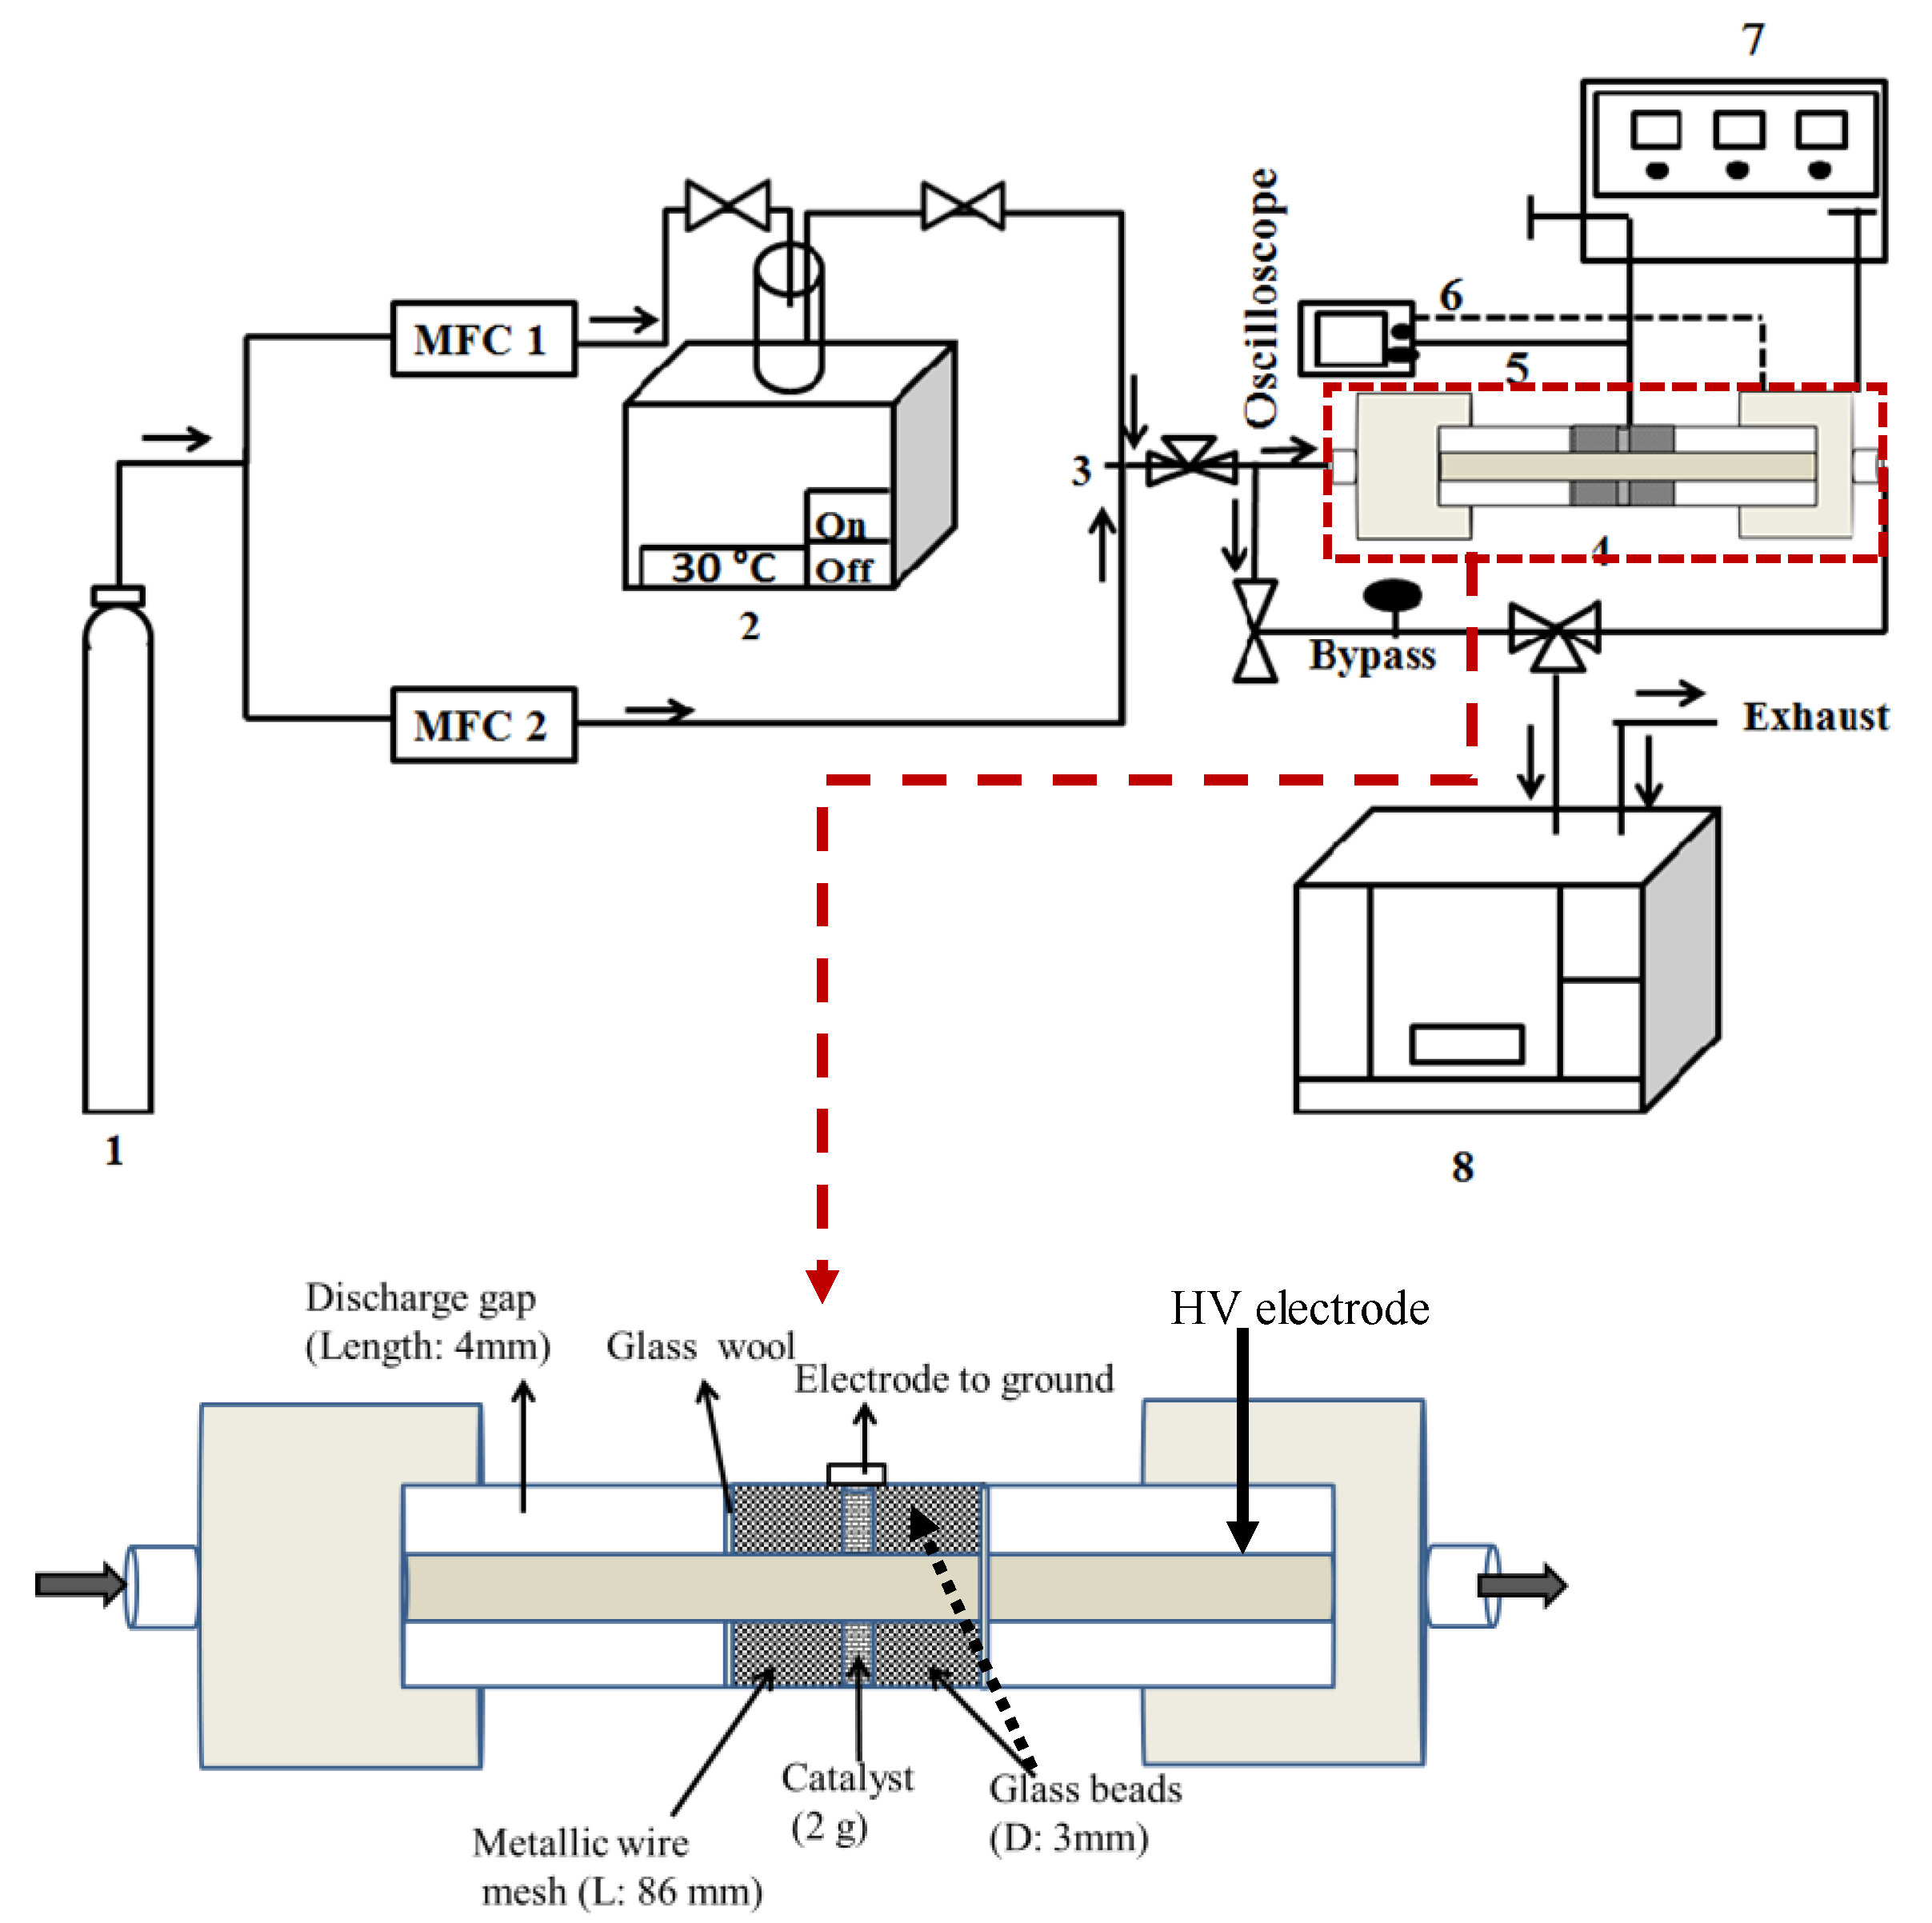
The experimental set-up given in Figure 9 was decomposed into three main components: (i) flue gas preparation, (ii) adsorption and non-thermal plasma reactor, and (iii) gas analysis. The initial toluene concentration C0 (Toluol ≥ 99.5%, Carl Roth) in dry air (Alphagaz 1, Air Liquide) and the total gas flow rate were maintained at 500 ± 10 ppm and 0.2 L·min−1, respectively, using mass flow controllers (MFC, El-flow®, Bronkhorst). The adsorption and subsequent plasma oxidation experiments were conducted at room temperature and atmospheric pressure. The description of the PBDBD (packed bed dielectric barrier discharge; AC power supply of 50 kHz) reactor was previously given [37]. The reactor was filled with 2 g of Hopcalite trapped between two layers of borosilicate glass beads (Sigma Aldrich, 3 mm diameter). The power injected in the plasma reactor was calculated by integrating the instantaneous voltage and current waveforms averaged over four cycles. The gaseous products were analyzed using a Fourier-transform infrared (FT-IR) spectrometer (Bruker, Tensor 27). The FT-IR is equipped with a DTGS (deuterated triglycine sulfate) detector and a gas cell with a 20 cm optical path length with ZnSe windows. After reaching steady state conditions, the FT-IR spectra averaged over 20 different samples are obtained with a resolution of 4 cm−1 and an aperture of 6 mm. OPUS (Bruker) software is used to collect and analyze the obtained spectra.
The toluene, CO and CO2 concentrations were estimated after calibration using standard gas mixtures.

3.4. Toluene Abatement through APC

The basic sequence for the APC process was divided into two steps: (i) toluene adsorption (t1: storage stage duration) at 25 °C followed by (ii) NTP exposure in dry air (t2: discharge stage duration). In this approach, the influence of process variables such as storage stage time span t1 and power P delivered by the plasma ignition on the efficiency of the APC process in terms of abatement performance as well as energy cost were first investigated. Finally, a four sequential APC experiment was performed using the optimized storage stage duration and NTP power to assess the stability and repeatability of the APC process with time.
As the high inlet concentration of toluene to be treated herein (500 ppm) might lead to an increase of weakly adsorbed VOC, i.e., reversibly adsorbed VOC, the t1 time span range relative to the adsorption storage stage investigated in this study was short (5 to 40 min). As a consequence, saturation of the Hopcalite packed bed plasma reactor was not completely achieved. Once t1 was reached, the toluene flow was stopped and allowed to purge. Then, the non-thermal plasma was ignited on the material. The time span t2 was set at 60 min to be sufficiently long to monitor the temporal evolution of all gaseous species at the reactor exit and to ensure a recovery of the surface of Hopcalite by NTP regeneration for another adsorption step. This procedure allowed to determine an optimized t1 storage time span in terms of minimizing the energy consumption of the process.
Before every experiment, the calcined Hopcalite (2 g) was dried at 150 °C for 4 h (2 °C·min−1; 0.2 L·min−1 of dry air).
Effect of the storage stage duration t1: In the first step, the stabilized flue gas (500 ± 10 ppm toluene/air; F1 = 0.2 L·min−1) was sent into the PBDBD reactor for a duration t1 ranging between 5 and 40 min (5, 10, 20, 30, and 40 min). In the second step, an air flow was sent through the reactor with an operating plasma (46 W) for a t2 of 60 min (F2 = 0.2 L·min−1).
Effect of the NTP power: After a storage duration t1 of 20 min performed in similar conditions as mentioned above, the air flow was sent through the reactor using a NTP at four different powers (40, 46, 52, and 72 W) for a t2 of 60 min. Intermediate experiments at a power of 46 W were performed before applying any change in applied power to validate that the characteristics of the APC process were unchanged at the start of each new sequence.
Effect of stability of the APC process: A four sequence APC experiment was performed under the same conditions as mentioned above with a storage duration t1 of 20 min and a discharge power P of 46 W.
Considering 1 g of catalyst, the amount of adsorbed toluene (qads) was estimated from the molar amount of gaseous toluene exposed to the catalyst for t1 from which the contribution of non-adsorbed toluene was retrieved. From the integration of the temporal profiles of unconverted toluene (qunconv) and CO2 formed during NTP exposure, the amount of toluene converted qconv (qads–qunconv) and of CO2 formed (qCO2) were calculated at 25 °C. CO2 selectivity (SCO2), CO2 yield (YCO2), energy cost (EC), and energy yield EY(Tol) and EY(CO2) were calculated by using the following equations:
S CO 2   ( % ) = q CO 2 7 × ( q ads q unconv ) × 100
Y CO 2   ( % ) = q CO 2 7 × q ads × 100
EC   ( kWh · m 3 ) = P × t 2 F 1 × t 1
EY ( Tol )   ( g · kWh 1 ) = 2 × q ads × 92.14 P × t 2
( g · kWh 1 ) = 2 × q CO 2 × 44.01 P × t 2

4. Conclusions

Hopcalite was investigated for toluene total oxidation in an APC process using a high toluene inlet concentration (500 ppm). The effect of the time span of the storage stage (t1) as well as the effect of the delivered power (P) during the discharge stage on the efficiency of the process have been particularly studied. As expected, the energy cost rapidly decreases with an increase in the storage time t1. Furthermore, the efficiency of the APC process in terms of EY(Tol) and EY(CO2) increases with increasing storage stage duration. Hence, limiting the amount of toluene adsorbed through a short adsorption time allows best performances in terms of CO2 selectivity and yield, but clearly also induces the least energy efficiency and the highest energy cost. When varying the power of the plasma, an optimum could be observed in terms of CO2 selectivity and energy consumption for a power of 46 W. Repetition of the adsorption–oxidation process showed that the performances were not affected by subsequent plasma treatments as could be confirmed by the characterization of the material after multiple APC sequences, which revealed no significant changes in catalyst properties.
This exploratory work clearly shows the high potential of sequential processes involving toluene adsorption followed by plasma catalytic oxidation. Clearly, optimal process conditions need to be determined for each individual abatement environment (actual inlet and tolerable outlet toluene concentrations, volumes and flow rates of streams, etc.). In the present study, the only carbon containing gaseous reaction product detected was CO2. An important aspect of such optimization process will be the determination of the nature of the by-products in order to ensure that no other toxic products are formed. However, further work has to be done to reduce the plasma on time and thus enhance the overall efficiency of the process.

Author Contributions

Conceptualization, J.-M.G., N.D.G. and A.L.; Funding acquisition, J.-F.L. and R.M.; Investigation, S.S., J.-M.G., S.K.P.V. and A.L.; Supervision, J.-M.G., N.D.G. and A.L.; Visualization, S.S.; Writing—original draft, S.S.; Writing—review and editing, J.-M.G., S.K.P.V., J.-F.L., R.M., N.D.G. and A.L. All authors have read and agreed to the published version of the manuscript.

Funding

The authors acknowledge the support of the European Union for funding this work through an INTERREG V France-Wallonie-Vlaanderen project “Depollutair”. The Fonds Européen de Développement Régional (FEDER), CNRS, Région Hauts-de-France, Ministère de l’Education Nationale de l’Enseignement Supérieur et de la Recherche and Chevreul Institut are acknowledged for funding of XPS spectrometers and XRD instruments. This research was carried out in the French-Belgium Associated International Laboratory “Plasma & Catalysis” supported by the Universities of Lille and Ghent.

Acknowledgments

The authors acknowledge the support of the European Union for funding this work through an INTERREG V France-Wallonie-Vlaanderen project “Depollutair”. The Fonds Européen de Développement Régional (FEDER), CNRS, Région Hauts-de-France, Ministère de l’Education Nationale de l’Enseignement Supérieur et de la Recherche and Chevreul Institut are acknowledged for funding of XPS spectrometers and XRD instruments. The authors would like to thank Olivier Gardoll, and Pardis Simon for their help with H2-TPR, and XPS analysis.

Conflicts of Interest

The authors declare no conflict of interest.

References

  1. He, C.; Cheng, J.; Zhang, X.; Douthwaite, M.; Pattisson, S.; Hao, Z. Recent Advances in the Catalytic Oxidation of Volatile Organic Compounds: A Review Based on Pollutant Sorts and Sources. Chem. Rev. 2019, 119, 4471–4568. [Google Scholar] [CrossRef]
  2. Dong, C.; Qu, Z.; Qin, Y.; Fu, Q.; Sun, H.; Duan, X. Revealing the Highly Catalytic Performance of Spinel CoMn2O4 for Toluene Oxidation: Involvement and Replenishment of Oxygen Species Using in Situ Designed-TP Techniques. ACS Catal. 2019, 9, 6698–6710. [Google Scholar] [CrossRef]
  3. Weng, X.; Sun, P.; Long, Y.; Meng, Q.; Wu, Z. Catalytic Oxidation of Chlorobenzene over MnxCe1-xO2/HZSM-5 Catalysts: A Study with Practical Implications. Environ. Sci. Technol. 2017, 51, 8057–8066. [Google Scholar] [CrossRef]
  4. Palacio, L.; Silva, J.; Ribeiro, F.; Ribeiro, M. Catalytic oxidation of volatile organic compounds with a new precursor type copper vanadate. Catal. Today 2008, 133–135, 502–508. [Google Scholar] [CrossRef]
  5. Yang, C.; Miao, G.; Pi, Y.; Xia, Q.; Wu, J.; Li, Z.; Xiao, J. Abatement of various types of VOCs by adsorption/catalytic oxidation: A review. Chem. Eng. J. 2019, 370, 1128–1153. [Google Scholar] [CrossRef]
  6. Chen, B.; Wu, L.; Wu, B.; Wang, Z.; Yu, L.; Crocker, M.; Zhu, A.; Shi, C. Catalytic Materials for Low Concentration VOCs Removal through “Storage-Regeneration” Cycling. ChemCatChem 2019, 11, 3646–3661. [Google Scholar] [CrossRef]
  7. Everaert, K.; Baeyens, J. Catalytic combustion of volatile organic compounds. J. Hazard. Mater. 2004, 109, 113–139. [Google Scholar] [CrossRef]
  8. Feng, X.; Liu, H.; He, C.; Shen, Z.; Wang, T. Synergistic effect and mechanism of non-thermal plasma catalysis system in volatile organic compounds removal: A review. Catal. Sci. Technol. 2018, 8, 936–954. [Google Scholar] [CrossRef]
  9. Mok, Y.; Kim, D. Treatment of toluene by using adsorption and nonthermal plasma oxidation process. Curr. Appl. Phys. 2011, 11, S58–S62. [Google Scholar] [CrossRef]
  10. Kim, H.; Ogata, A.; Futamura, S. Oxygen partial pressure-dependent behavior of various catalysts for the total oxidation of VOCs using cycled system of adsorption and oxygen plasma. Appl. Catal. B Environ. 2008, 79, 356–367. [Google Scholar] [CrossRef]
  11. Sivachandiran, L.; Thevenet, F.; Rousseau, A. Non-thermal plasma assisted regeneration of acetone adsorbed TiO2 surface. Plasma Chem. Plasma Process. 2013, 33, 855–871. [Google Scholar] [CrossRef]
  12. Sivachandiran, L.; Thevenet, F.; Rousseau, A. Isopropanol removal using MnXOY packed bed non-thermal plasma reactor: Comparison between continuous treatment and sequential sorption/regeneration. Chem. Eng. J. 2015, 270, 327–335. [Google Scholar] [CrossRef]
  13. Thevenet, F.; Sivachandiran, L.; Guaitella, O.; Barakat, C.; Rousseau, A. Plasma-catalyst coupling for volatile organic compound removal and indoor air treatment: A review. J. Phys. D Appl. Phys. 2014, 47, 224011. [Google Scholar] [CrossRef]
  14. Sultana, S.; Vandenbroucke, A.; Leys, C.; De Geyter, N.; Morent, R. Abatement of VOCs with alternate adsorption and plasma-assisted regeneration: A review. Catalysts 2015, 5, 718–746. [Google Scholar] [CrossRef]
  15. Xu, W.; Chen, B.; Jiang, X.; Xu, F.; Chen, X.; Chen, L.; Wu, J.; Fu, M.; Ye, D. Effect of calcium addition in plasma catalysis for toluene removal by Ni/ZSM-5: Acidity/basicity, catalytic activity and reaction mechanism. J. Hazard. Mater. 2020, 387, 122004. [Google Scholar] [CrossRef]
  16. Bahri, M.; Haghighat, F.; Rohani, S.; Kazemian, H. Metal organic frameworks for gas-phase VOCs removal in a NTP-catalytic reactor. Chem. Eng. J. 2017, 320, 308–318. [Google Scholar] [CrossRef]
  17. Zhu, B.; Zhang, L.-Y.; Li, M.; Yan, Y.; Zhang, X.-M.; Zhu, Y.-M. High-performance of plasma-catalysis hybrid system for toluene removal in air using supported Au nanocatalysts. Chem. Eng. J. 2020, 381, 122599. [Google Scholar] [CrossRef]
  18. Qin, C.; Huang, X.; Dang, X.; Huang, J.; Teng, J.; Kang, Z. Toluene removal by sequential adsorption-plasma catalytic process: Effects of Ag and Mn impregnation sequence on Ag-Mn/γ-Al2O3. Chemosphere 2016, 162, 125–130. [Google Scholar] [CrossRef]
  19. Wang, W.; Wang, H.; Zhu, T.; Fan, X. Removal of gas phase low-concentration toluene over Mn, Ag and Ce modified HZSM-5 catalysts by periodical operation of adsorption and non-thermal plasma regeneration. J. Hazard. Mater. 2015, 292, 70–78. [Google Scholar] [CrossRef]
  20. Dey, S.; Chandra, G. A Review of Synthesis, Structure and Applications in Hopcalite Catalysts for Carbon Monoxide Oxidation. Aerosol Sci. Eng. 2019, 3, 97–131. [Google Scholar] [CrossRef]
  21. Dey, S.; Dhal, G. Deactivation and regeneration of hopcalite catalyst for carbon monoxide oxidation: A review. Mater. Today Chem. 2019, 14, 100180. [Google Scholar] [CrossRef]
  22. Pei, J.; Han, X.; Lu, Y. Performance and kinetics of catalytic oxidation of formaldehyde over copper manganese oxide catalyst. Build. Environ. 2015, 84, 134–141. [Google Scholar] [CrossRef]
  23. Veerapandian, S.K.P.; Giraudon, J.-M.; De Geyter, N.; Onyshchenko, Y.; Krishnaraj, C.; Sonar, S.; Löfberg, A.; Leus, K.; Van Der Voort, P.; Lamonier, J.-F.; et al. Regeneration of Hopcalite used for the adsorption plasma catalytic removal of toluene by non-thermal plasma. J. Hazard. Mater. 2020, 402, 123877. [Google Scholar] [CrossRef]
  24. Sonar, S.; Giraudon, J.-M.; Veerapandian, S.K.P.; Bitar, R.; Leus, K.; Van Der Voort, P.; Lamonier, J.-F.; Morent, R.; DeGeyter, N.; Löfberg, A. Abatement of Toluene Using a Sequential Adsorption-Catalytic Oxidation Process: Comparative Study of Potential. Catalysts 2020, 10, 761. [Google Scholar] [CrossRef]
  25. Liu, Y.; Li, X.-S.; Liu, J.-L.; Wu, J.; Ye, D.; Zhu, A.-M. Cycled storage-discharge (CSD) plasma catalytic removal of benzene over AgMn/HZSM-5 using air as discharge gas. Catal. Sci. Technol. 2016, 6, 3788–3796. [Google Scholar] [CrossRef]
  26. Kim, H.-H.; Ogata, A.; Futamura, S. Atmospheric plasma-driven catalysis for the low temperature decomposition of dilute aromatic compounds. J. Phys. D Appl. Phys. 2005, 38, 1292–1300. [Google Scholar] [CrossRef]
  27. Huang, H.; Ye, D.; Leung, D.; Feng, F.; Guan, X. Byproducts and pathways of toluene destruction via plasma-catalysis. J. Mol. Catal. A Chem. 2011, 336, 87–93. [Google Scholar] [CrossRef]
  28. Reddy, A.; Gopinath, C.; Chilukuri, S. Selective ortho-methylation of phenol with methanol over copper manganese mixed-oxide spinal catalysts. J. Catal. 2006, 243, 278–291. [Google Scholar] [CrossRef]
  29. Xu, C.; Li, B.; Du, H.; Kang, F.; Zeng, Y. Supercapacitive studies on amorphous MnO2 in mild solutions. J. Power Sources 2008, 184, 691–694. [Google Scholar] [CrossRef]
  30. Njagi, E.; Chen, C.-H.; Genuino, H.; Galindo, H.; Huang, H.; Suib, S. Total oxidation of CO at ambient temperature using copper manganese oxide catalysts prepared by a redox method. Appl. Catal. B Environ. 2010, 99, 103–110. [Google Scholar] [CrossRef]
  31. Yang, M.; He, J. A copper-manganese composite oxide as QCM sensing layers for detection of formaldehyde gas. RSC Adv. 2018, 8, 22–27. [Google Scholar] [CrossRef] [Green Version]
  32. Ye, Z.; Giraudon, J.-M.; Nuns, N.; Simon, P.; De Geyter, N.; Morent, R.; Lamonier, J.-F. Influence of the preparation method on the activity of copper-manganese oxides for toluene total oxidation. Appl. Catal. B Environ. 2018, 223, 154–166. [Google Scholar] [CrossRef]
  33. Fierro, G.; Morpurgo, S.; Lo Jacono, M.; Inversi, M.; Pettiti, I. Preparation, characterisation and catalytic activity of Cu-Zn-based manganites obtained from carbonate precursors. Appl. Catal. A Gen. 1998, 166, 407–417. [Google Scholar] [CrossRef]
  34. Biesinger, M.; Payne, B.; Grosvenor, A.; Lau, L.; Gerson, A.; Smart, R. Resolving surface chemical states in XPS analysis of first row transition metals, oxides and hydroxides: Cr, Mn, Fe, Co and Ni. Appl. Surf. Sci. 2011, 257, 2717–2730. [Google Scholar] [CrossRef]
  35. Santos, V.; Pereira, M.; Órfão, J.-J.; Figueiredo, J. Catalytic oxidation of ethyl acetate over a cesium modified cryptomelane catalyst. Appl. Catal. B Environ. 2009, 88, 550–556. [Google Scholar] [CrossRef]
  36. Wang, F.; Dai, H.; Deng, J.; Bai, G.; Ji, K.; Liu, Y. Manganese Oxides with Rod-, Wire-, Tube-, and Flower-Like Morphologies: Highly Effective Catalysts for the Removal of Toluene. Environ. Sci. Technol. 2012, 46, 4034–4041. [Google Scholar] [CrossRef] [PubMed]
  37. Ye, Z.; Veerapandian, S.K.P.; Onyshchenko, I.; Nikiforov, A.; De Geyter, N.; Giraudon, J.-M.; Lamonier, J.-F.; Morent, R. An in-Depth Investigation of Toluene Decomposition with a Glass Beads-Packed Bed Dielectric Barrier Discharge Reactor. Ind. Eng. Chem. Res. 2017, 56, 10215–10226. [Google Scholar] [CrossRef]
Figure 1. Effect of toluene stage duration time (t1) on the concentration profiles of (a) toluene during the adsorption step (including a blank test without catalyst), (b) toluene during NTP exposure for the first 20 min (toluene desorption), and (c) CO2 during NTP exposure for the first 20 min (CO2 formation).
Catalysts 11 00845 g001
Figure 2. (a) Example of FT-IR spectra of the outlet gas at various times during plasma treatment (data collected for experiment using t1 = 20 min), (b) FT-IR spectrum at 4 min (inset: zoom within the 2600–3200 cm−1 range).
Catalysts 11 00845 g002
Figure 3. Effect of NTP power on the concentration profiles of (a) toluene during the adsorption step (including a blank test without catalyst), (b) toluene during NTP exposure for the first 20 min (toluene desorption), and (c) CO2 during NTP exposure for the first 20 min (CO2 formation).
Catalysts 11 00845 g003
Figure 4. Temporal profiles of toluene during adsorption (a), desorbed toluene during NTP exposure (b), CO2 evolution during NTP exposure, (c) over the 4 sequences.
Catalysts 11 00845 g004
Figure 5. The XRD patterns of Hopcalite before and after reaction (AR, meaning after 15 NTP exposures).
Catalysts 11 00845 g005
Figure 6. N2 adsorption–desorption isotherms and pore size distribution of fresh Hopcalite and Hopcalite after reaction (Hopcalite-AR).
Catalysts 11 00845 g006
Figure 7. XPS survey spectra and high resolution Cu 2p, Mn 2p, and O 1s spectra of Hopcalite and Hopcalite-AR.
Catalysts 11 00845 g007
Figure 8. H2-TPR profiles of Hopcalite before and after reaction (Hopcalite-AR).
Catalysts 11 00845 g008
Figure 9. Schematic diagram of the experimental set-up for adsorption and NTP abatement of toluene. 1. Dry air cylinder; 2. Toluene bubbler; 3. Mixing chamber; 4. Packed bed DBD reactor; 5. Resistor (46.4 Ω); 6. High voltage and current probe; 7. AC power source (50 kHz); 8. FT-IR spectrometer.
Catalysts 11 00845 g009
Table 1. Performances of the APC process as a function of storage time span t1.
Time t1
(min)
qtoluene adsorbed
(µmol·g−1)
qtoluene unconverted
(µmol·g−1)
qtoluene converted
(µmol·g−1)
qCO2 Formation
(µmol·g−1)
SCO2
(%)
YCO2
(%)
C Mass
Balance (%)
516.70.216.5127.4110109110
1026.01.724.3165.7979198
2043.87.036.9230.2897591
3060.612.548.1260.2776182
4070.615.155.5315.3816485
Table 2. Energetic performances of the APC process as a function of storage time span t1.
Time t1
(min)
EC
(kWh·m−3)
EY(Tol)
(gTolads·kWh−1)
EY(CO2)
(gCO2·kWh−1)
546.50.070.24
1023.20.100.31
2011.60.170.44
307.70.240.49
405.80.280.60
Table 3. Performances of the APC process as a function of NTP power.
Power
(W)
qtoluene adsorbed
(µmol·g−1)
qtoluene unconverted
(µmol·g−1)
qtoluene converted
(µmol·g−1)
qCO2 Formation
(µmol·g−1)
SCO2
(%)
YCO2
(%)
EC
(kWh·m−3)
EY(Tol)
(gTolads·kW·h−1)
EY(CO2)
(gCO2·kWh−1)
4045.47.238.1203.2766410.00.210.45
4643.87.036.9230.2897511.60.170.44
5244.26.138.2214.7806913.00.160.36
7244.74.340.4204.3726518.00.110.25
Table 4. Characteristic properties of the APC process over the 4 sequences.
Sequencesqtoluene adsorbed
(µmol·g−1)
qtoluene unconverted
(µmol·g−1)
qtoluene converted
(µmol·g−1)
qCO2 Formation (µmol·g−1)SCO2
(%)
YCO2
(%)
C Mass
Balance (%)
Sequence-143.93.240.7294.910396103
Sequence-247.75.342.4257.2867788
Sequence-345.77.338.4246.1917692
Sequence-444.85.339.5223.7807183
Table 5. Textural and redox properties of the fresh Hopcalite and Hopcalite after reaction (Hopcalite-AR).
MaterialsSBET a
(m2·g−1)
Vp b
(cm3·g−1)
Dp c
(nm)
H2 Consumption
(mmol·g−1)
Hopcalite2320.457.811.1
Hopcalite-AR1950.458.010.8
a: BET specific surface area; b: Total pore volume; c: Pore diameter.
Table 6. Binding energy of the elements (eV).
CatalystCu 2p3/2Mn 2p3/2OIOIIOIIIK 2p3/2 (FHWM)Na 1s
Hopcalite933.3641529.6531.0533.4292.5 (1.5)1070.4
Hopcalite-AR933.5641529.6531.5-292.5 (1.6)1071.1
Table 7. XPS composition of the materials.
CatalystCu/MnK/MnO/MnNa/MnOlatt/OadsΔE Mn3s/eV (Mn AOS)
Hopcalite0.260.113.10.061.175.14 (3.1)
Hopcalite-AR0.290.123.50.071.275.20 (3.1)
Publisher’s Note: MDPI stays neutral with regard to jurisdictional claims in published maps and institutional affiliations.