Article

Enhanced Activity for CO Preferential Oxidation over CuO Catalysts Supported on Nanosized CeO2 with High Surface Area and Defects

Department of Chemistry, Jiangxi Agricultural University, Nanchang 330045, China
*
Authors to whom correspondence should be addressed.
Catalysts 2021, 11(8), 884; https://doi.org/10.3390/catal11080884
Submission received: 4 July 2021 / Revised: 18 July 2021 / Accepted: 20 July 2021 / Published: 22 July 2021
(This article belongs to the Section Nanostructured Catalysts)

Abstract

:
Nanosizedceria (n-CeO2) was synthesized by a facile method in 2-methylimidazolesolution. The characterization results of XRD, N2 adsorption-desorption, Raman and TEM indicate that n-CeO2 shows a regular size of 10 ± 1 nm, a high surface area of 130 m2·g−1 and oxygen vacancies on the surface. A series of CuO/n-CeO2 catalysts (CuCeOX) with different copper loading were prepared for the preferential oxidation of CO in H2-rich gases (CO-PROX). All CuCeOX catalysts exhibit a high catalytic activity due to the excellent structural properties of n-CeO2, over which the 100% conversion of CO is obtained at 120 °C. The catalytic activity of CuCeOX catalysts increases in the order of CuCeO12 < CuCeO3 < CuCeO6 < CuCeO9. It is in good agreement with the order of the amount of active Cu+ species, Ce3+ species and oxygen vacancies on these catalysts, suggesting that the strength of interaction between highly dispersed CuO species and n-CeO2 is the decisive factor for the activity. The stronger interaction results in the formation of more readily reducible copper species on CuCeO9, which shows the highest activity with high stability and the broadest temperature “window” for complete CO conversion (120–180 °C).

1. Introduction

Proton exchange membrane fuel cells (PEMFCs) are the most promising hydrogen-based fuel cell systems for commercial applications [1]. Hydrogen as fuel for PEMFCs should be almost free of CO to avoid the deactivation of cell Pt electrodes. However, the fed hydrogen produced by the reforming of hydrocarbon fuels, even after low-temperature water gas shift (WGS) reaction, inevitably contains about 0.5–2.0 vol.% CO [2]. Thus, further CO removal in rich-H2 gases is required. Among the various methods for CO removal, preferential oxidation of CO (CO-PROX) has been considered as the most efficient and low-cost one [3]. Many different types of catalysts for CO-PROX system have been reported in recent years [3,4,5,6]. Of the reported catalysts, CuO-CeO2 couple oxide catalysts have attracted much attention because they are more active at low temperatures and have a lower cost compared to noble metal catalysts [3]. Ceria has high oxygen storing/releasing capacity and its structural properties play an important role in the catalytic performance of CuO/CeO2 catalysts, such as surface area, pore structure and surface defects [7,8]. Many studies confirmed that the high activity of CuO/CeO2 catalysts should be attributed to the strong interaction between highly dispersed CuO species and ceria [9,10,11]. The nano-scale CeO2 with high surface area supports the dispersion of copper species and promotes the interfacial activity [12]. Surface defects and oxygen vacancies on ceria can enhance the interaction between copper species and CeO2 [10,11,12]. Thus, nanosized CeO2 with high surface area or surface defect supported CuO catalysts display superior activity for CO-PROX in comparison with usually used CuO/CeO2 catalysts. Reis et al. [13] reported that CuO/CeO2-nanocrystalline catalysts (SBET = 92 m2·g−1) with copper loading of 1.0 wt.% exhibited an improved reactivity for CO-PROX reaction. The high activity was closely related to the finely dispersed CuO species strongly interacting with CeO2 nanocrystalline. Zou et al. [14] observed that CuO supported on ceria nanospheres (SBET = 133 m2·g−1) had a high low-temperature catalytic activity for CO PROX due to the formation of more active oxygen species on the surface of ceria nanospheres. Wang et al. [15] synthesized CuO/CeO2-nanocrystal catalysts for CO-PROX. The catalyst calcined at 500 °C (SBET = 97 m2·g−1) shows the highest catalytic activity, because much surface lattice defects on CeO2-nanocrystal supports strengthen the interaction between CuO and CeO2.
The synthetic methods of nanosized CeO2 most commonly reported in the literature are hydrothermal method and precipitation method in KOH, NaOH, or Na2CO3 solution [16,17,18]. The surface area of as prepared nanosized CeO2 is generally small, and the residual K+/Na+ has a negative effect on the catalytic performance [19,20]. Moreover, Ce3+/Ce4+ precursors are completely oxidized in this reaction condition, which is unfavorable for the generation of surface defects.
In this work, nanosized CeO2 with high surface area and surface defects (n-CeO2) was prepared in 2-methylimidazole solution. 2-methylimidazole can act as a stabilizer to limit particle growth and prohibit aggregation, and it is also expected to be a reducer to be oxidized by Ce4+ and form Ce3+ partly. The copper loading, as one of the important factors for preparation, has a great effect on catalytic performance for CuO/CeO2 catalysts. Thus, n-CeO2 supported CuO catalysts with different copper loading (3–12 wt.%) were prepared by impregnation method for CO-PROX. The samples were characterized by XRD, N2 adsorption-desorption, TEM, H2-TPR, XPS and Raman. The effects of structural parameters and copper content on catalytic activity were discussed.

2. Results and Discussion

2.1. Characterization of n-CeO2 and p-CeO2

Figure 1A shows the N2 adsorption-desorption isotherm and pore size distribution of n-CeO2 and p-CeO2. Table 1 lists the BET surface areas, average pore diameters and lattice parameters of n-CeO2 and p-CeO2. Their N2 adsorption-desorption isotherms both correspond to typical type IV isotherms. n-CeO2 exhibits an H2-type hysteresis loop in the relative pressure (P/P0) range from 0.4 to 1.0, suggesting the existence of mesopores due to the agglomeration of particles [10,17]. p-CeO2 shows an H3-type hysteresis loop in the relative pressure (P/P0) range from 0.8 to 1.0, which indicates the generation of irregular pores in p-CeO2 [16]. From the inset of Figure 1A, we can see that n-CeO2 shows a narrow distribution of pore size between 5 nm and 15 nm. For p-CeO2, the pore size distribution is wider and in the range of 5–50 nm. As listed in Table 1, the pore volumes of n-CeO2 and p-CeO2 are 0.176 and 0.083 m3·g−1, and the average pore diameters are 5.6 and 18.7 nm, respectively. n-CeO2 possesses a large surface area, reaching to 130 m2·g−1, while p-CeO2 exhibits a relatively small surface area of 35 m2·g−1. The larger pore volume and smaller pore size benefit faster diffusion of reactant gas in catalysts. The larger surface area is beneficial to the high dispersion of copper species which can form more potential active sites.
Figure 1B displays the XRD patterns of n-CeO2 and p-CeO2. As seen in Figure 1B, the strong diffraction peaks at 28.5, 33.1, 47.5 and 56.3° are clearly observed in n-CeO2 and p-CeO2, and match well the standard diffraction peaks for fluorite ceria (JCPDS 34-0394). For p-CeO2, the lattice parameter is 0.5414 nm, which is consistent with that of pure ceria. The lattice parameter of n-CeO2 is 0.5417 nm, a little larger than that of p-CeO2, implying that a portion of larger-radius Ce3+ ions (ionic radius 0.1143 nm) substitute Ce4+ (0.907 nm) in the n-CeO2 lattice. The substitution can result in the formation of lattice defects and oxygen vacancies on the surface of n-CeO2 [21]. UV-Raman characterization was performed to further obtain the information about oxygen vacancies in n-CeO2 and p-CeO2. As shown in Figure 1C, n-CeO2 and p-CeO2 display an intense band at about 464 cm−1 responding to the characteristic F2g vibration (Ce-O-Ce stretching) of fluorite structure CeO2. As compared with p-CeO2, n-CeO2 has a slight peak shift towards lower wavenumber, which is associated with the lattice expansion and the generation of oxygen vacancies. Moreover, a peak at 590 cm−1 related to oxygen vacancy for n-CeO2 was clearly observed, which confirms the presence of oxygen vacancy in n-CeO2.
TEM and HRTEM images of n-CeO2 are presented in Figure 2. As shown in Figure 2A, n-CeO2 displays an irregular polyhedral shape with the size of 10 ± 1 nm. Structural details can be seen from Figure 2B. Most of the spacing of lattice fringe in n-CeO2 is around 0.305 and 0.270 nm, which correspond to the (111) and (200) planes of CeO2, respectively. The selective area (red square, Figure 2B) HRTEM image is shown in Figure 2C. As can be clearly seen in the magnified image of the white square I and II in Figure 2C, several regions (dark pits in the red ellipses) show the quite different contrast which should be associated with the defects caused by the substitution of Ce3+ into n-CeO2 lattice and the formation of oxygen vacancies. The oxygen vacancies favor the adsorption and activation of surface oxygen species, and further increase the catalytic activity of catalysts for CO oxidation.

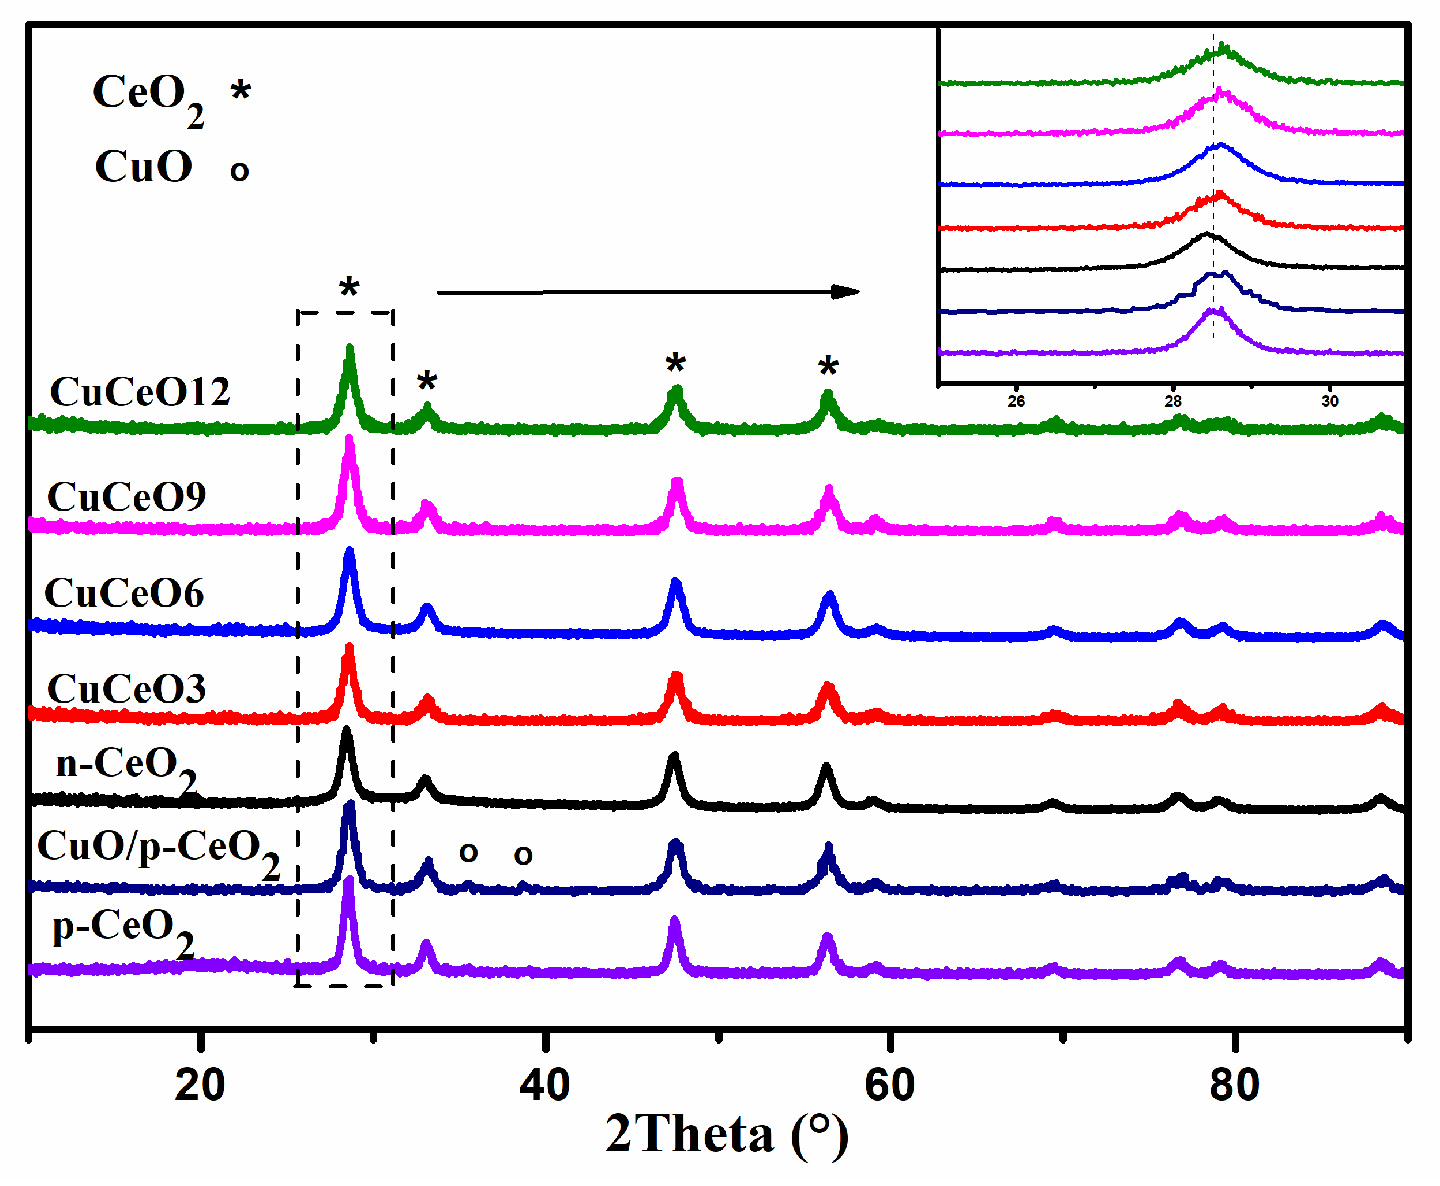
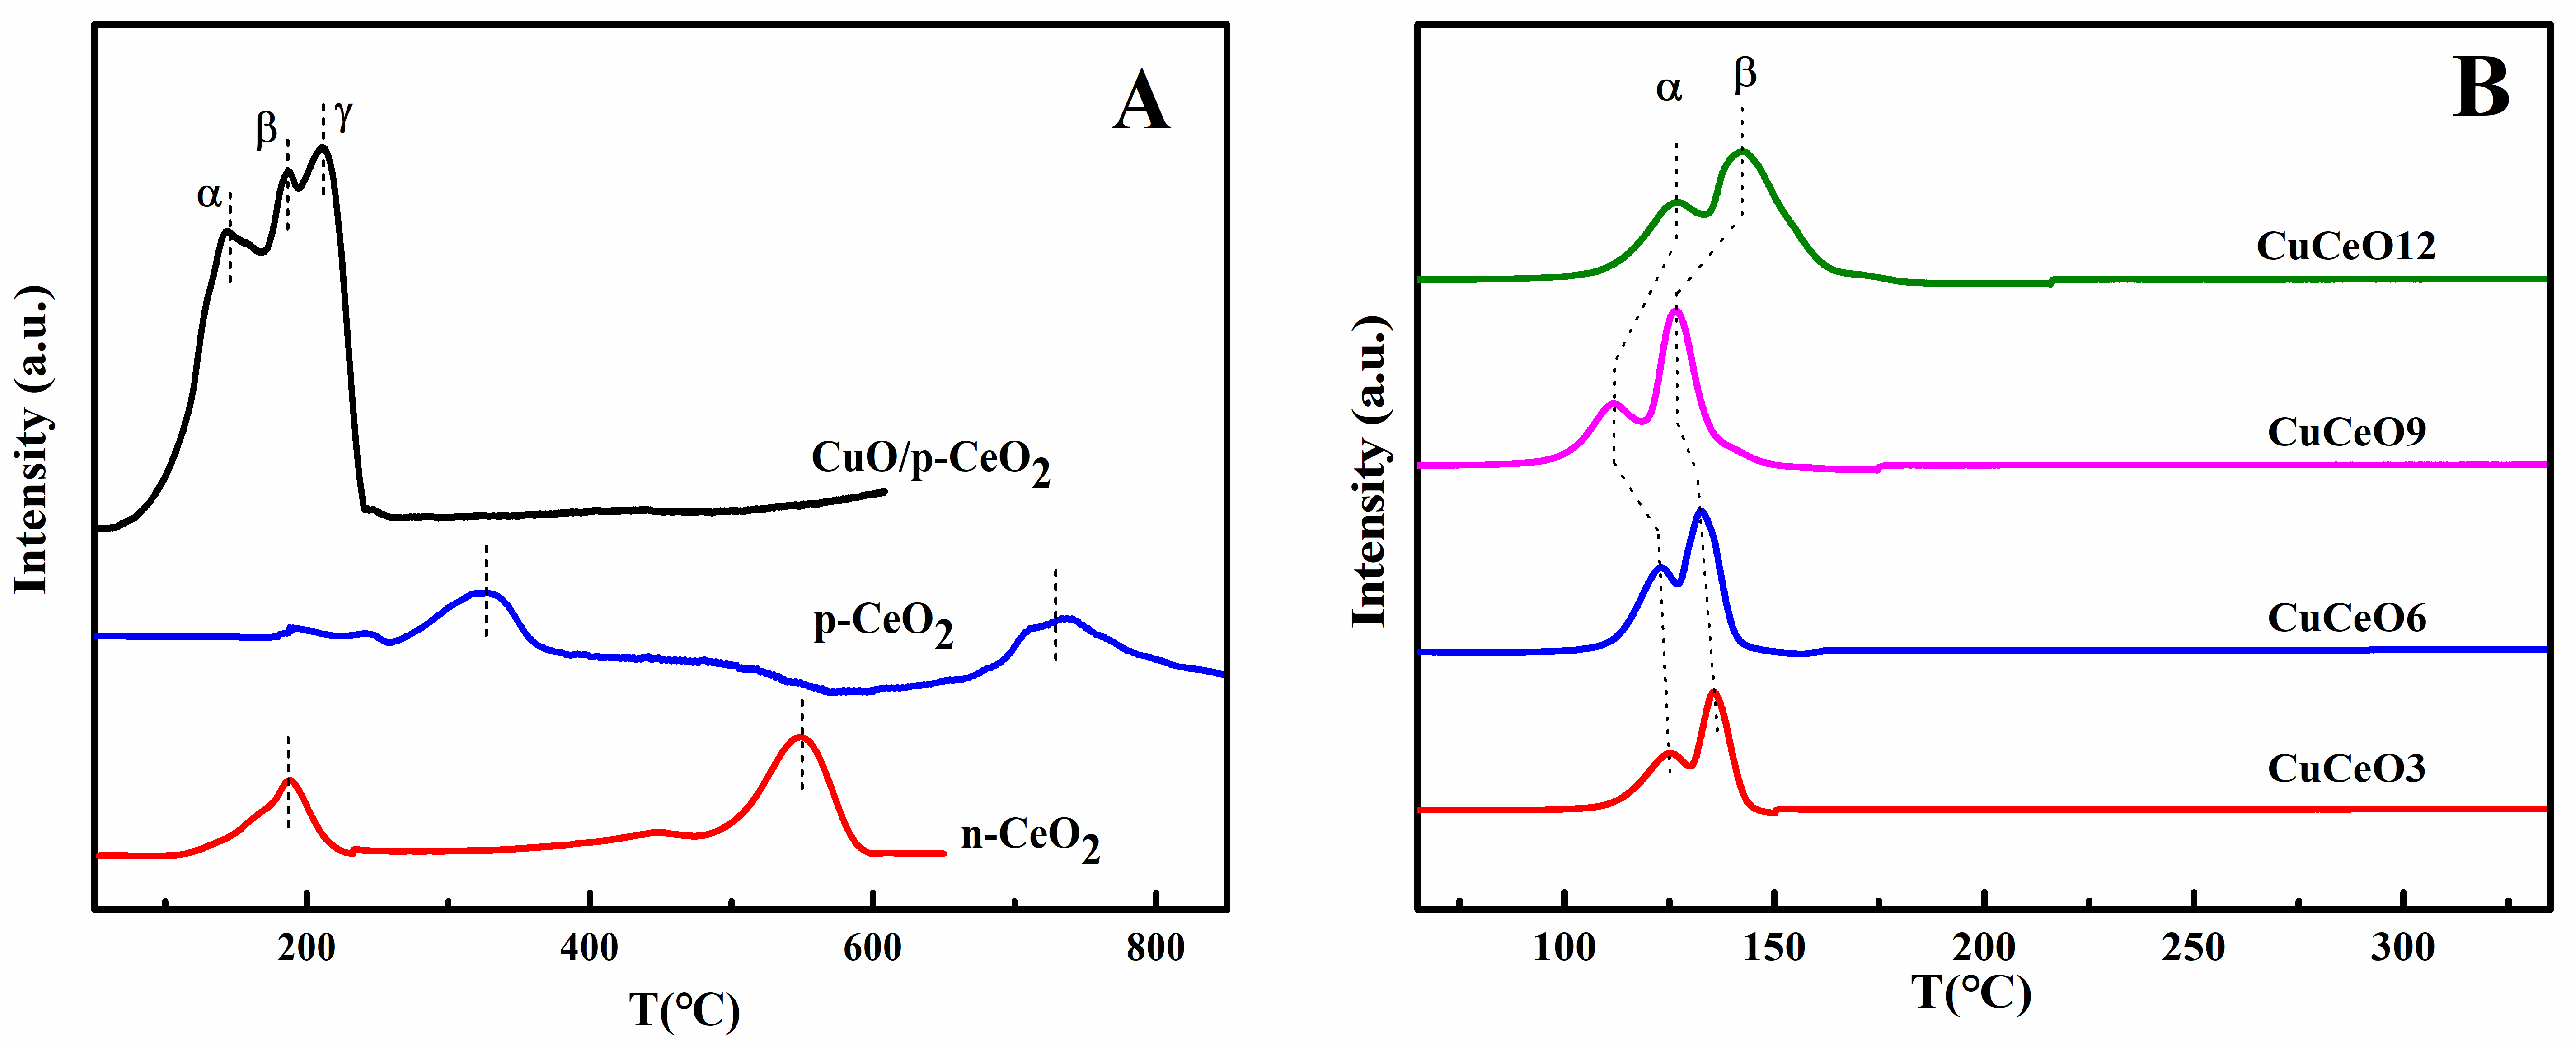
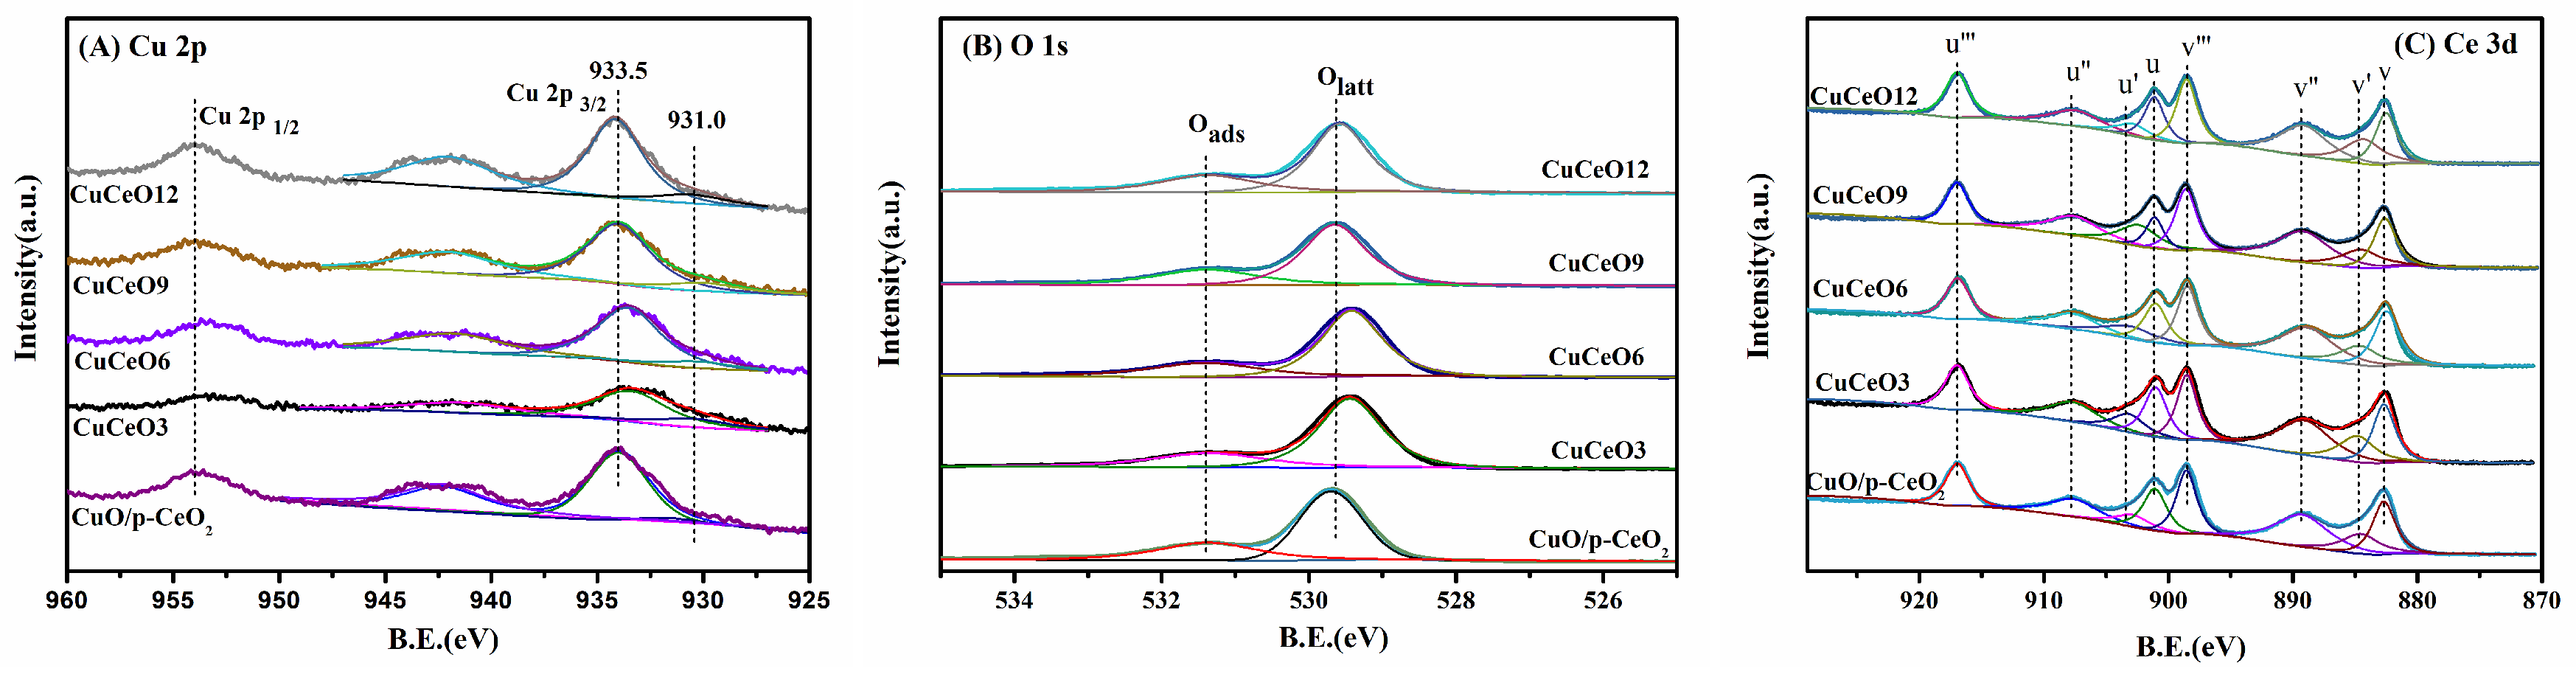
2.2. Characterization of CuO/p-CeO2 and CuCeOX Catalysts

Figure 3 shows the N2 adsorption-desorption isotherm and pore size distribution of CuO/p-CeO2 and CuCeOX catalysts. CuO/p-CeO2 exhibits a type IV isotherm with H3-type hysteresis loop. All of the CuCeOX catalysts display a typical type IV isotherm accompanied by an H2-type hysteresis loop, indicating that the porosity structures are maintained in CuCeOX catalysts. As listed in Table 1, the surface area and pore volume of CuO/p-CeO2 decrease obviously in comparison with p-CeO2. The surface areas of CuCeOX decrease to about 90 m2·g−1 and the average pore diameters increase slightly as compared with n-CeO2. The increase of copper loading from 3% to 9% causes a slight enhancement in pore volume which decreases sharply when the copper loading further increases to 12%. Figure 4 displays the XRD patterns of CuO/p-CeO2 and CuCeOX catalysts. As can be seen from Figure 4, all CuO/p-CeO2 and CuCeOX catalysts show the same peaks with n-CeO2. No typical characteristic peaks of CuO are detected for all CuCeOX catalysts, implying the well-dispersion of CuO species [22]. However, the diffraction peaks of CuO at 35.6°and 38.7° are observed over CuO/p-CeO2, indicating the existence of the bulk CuO, which may be related to the small surface area of p-CeO2. The inset of Figure 4 shows that the diffraction peak of CeO2 (111) shifts slightly to higher 2θ values for CuCeOX catalysts with the increase of copper loading. Meanwhile, the calculated lattice parameters of ceria in CuCeOX decrease slightly with the increase of Cu loading from 3% to 9% (listed in Table 1), suggesting that a portion of copper ions are incorporated into n-CeO2 lattices. It can further increase the defect concentration on n-CeO2 surface to improve the oxygen mobility, which is favorable for redox properties of catalysts [21,22]. With the copper loading increasing to 12%, the lattice parameter has no evident change compared to n-CeO2, indicating that the excessive loading of copper species probably blocks the incorporation of Cu2+ ions into the lattice of CeO2.
As can be seen from the TEM and HRTEM images of CuCeO9 presented in Figure 5A,B, CuCeO9 maintains the original shapes of n-CeO2 after the loading of CuO and mainly exposes (111) and (200) planes of CeO2. No CuO crystallite or amorphous CuO on the surface can be found in Figure 5B. Combined with the result of XRD, it is confirmed that the copper species exist as highly dispersed CuO species, which may be related to the high surface area of n-CeO2.
Figure 6 displays the H2-TPR profiles of n-CeO2, p-CeO2, CuO/p-CeO2 and CuCeOX catalysts, and Table 2 lists the reduction temperature and H2 consumptions of H2-TPR peaks. n-CeO2 and p-CeO2 both show two reduction peaks over 200 °C, corresponding to the reduction of surface and bulk oxygen species of CeO2 [17], respectively. The surface defects on n-CeO2 facilitate the formation of more active oxygen species. Thus, the reduction peaks for n-CeO2 obviously shift toward lower temperature compared to those for p-CeO2. All CuCeOX catalysts and CuO/p-CeO2 exhibit two reduction peaks below 200 °C, denoted as α and β, respectively. As shown in Table 2, the H2 consumption for CuCeOX catalyst increases with the increase of copper loading. Thus, the overlapped reduction peaks below 200 °C mainly belong to the reduction of copper species [18,23]. The reduction behaviors of CuO/CeO2 have been investigated by many researchers [24,25,26,27,28,29,30]. Generally, the peak α is attributed to the reduction of highly dispersed CuO with a strong interaction with CeO2, while the peak β should be ascribed to the reduction of copper species incorporated into CeO2 and large CuO clusters weakly interacted with CeO2. In addition, CuO/p-CeO2 also shows a reduction peak at 210 °C, denoted as peak γ, which should be assigned to the reduction of bulk CuO. It agrees well with the characterization of XRD. No peak belonging to the reduction of bulk CuO can be found in CuCeOX catalysts, which is consistent with the results of XRD and TEM. Usually, the position of reduction peaks can be used to evaluate the strength of the interaction between CuO and CeO2. The lower temperature of reduction peaks results in the stronger interaction between copper species and CeO2 [11]. For CuO/p-CeO2, the temperature of reduction peaks is significantly higher than that of CuCeOX catalysts, which may be due to the formation of bulk CuO on p-CeO2 inhibiting the interaction between copper species and p-CeO2. For CuCeOX catalysts, the temperature of peak α and β gradually decreases with the copper loading increasing from 3% to 9%, indicating that the interaction between highly dispersed CuO and n-CeO2 is enhanced gradually. The more highly dispersed CuO and more defects on the surface of n-CeO2 can enhance the interaction to lower the reduction temperature of peak α and β. With the copper loading further increasing to 12%, the temperature of peak α and β shifts to higher temperatures at 127 °C and 147 °C, respectively. It is probably because that excessive accumulation of copper species results in the formation of larger CuO clusters, which decreases the strength of interaction between copper species and n-CeO2. CuCeO9 shows the lowest reduction temperature of peak α and β, implying that the strength of interaction between copper species and n-CeO2 in CuCeO9 is the strongest and the copper species in CuCeO9 are more readily reducible than those on other catalysts.
The XPS spectra of Cu 2p, O 1s and Ce 3d of CuO/p-CeO2 and CuCeOX catalysts are displayed in Figure 7 and the results derived by XPS are summarized in Table 3. According to Table 3, the actual Cu content in CuCeOX and CuO/p-CeO2 determined by ICP measurement is very close to the nominal Cu content. The molar ratio of Cu/Cu+Ce on the surface of CuCeOX catalysts is far higher than that in bulk. Combined with the results of XRD and TEM, it suggests that a large amount of copper species are highly dispersed on the surface of CuCeOX catalysts. The Cu 2p spectra of CuCeOX and CuO/p-CeO2 are shown in Figure 7A. The main peak at around 933.5, combined with the shake-up satellite in the range of 938–947 eV, is assigned to the existence of Cu2+, and the weak peak at 931.0 eV represents the presence of the Cu+/Cu0 species [31]. Considering that CuO/p-CeO2 and CuCeOX catalysts were calcined in air during the preparation process, the existence of Cu0 seems to be impossible. The formation of Cu+ can be induced by the synergistic interaction between copper and ceria species during the calcining process [14,32]. Thus, most copper species are present in Cu2+ state and a small amount in Cu+ state for CuO/p-CeO2 and CuCeOX catalysts. The reduced degree of copper species can be estimated by the ratio of the intensity of the shake-up satellite peaks to that of the main Cu 2p3/2 peaks (Isat/Imp). The lower Isat/Imp values imply higher reduced degree of copper species on the surface [33]. According to the Isat/Imp values listed in Table 3, the relative amounts of Cu+ increase in the order of CuO/p-CeO2 < CuCeO12 < CuCeO3 < CuCeO6 < CuCeO9. Figure 7B shows the O 1s XPS spectra of CuO/p-CeO2 and CuCeOX catalysts. In addition to a main peak Olatt at 529.7 eV attributed to the lattice oxygen of CuO and CeO2, a shoulder peak Oads at higher binding energy ∼531.4 eV assigned to the adsorbed oxygen or hydroxyl/carbonate species is observed [34]. The relative surface concentration of Olatt can be calculated by the ratio of peak area. The value of Olatt/(Olatt + Oads) listed in Table 3 displays a slight decrease with the increase of surface Cu content, suggesting that the coverage of CuO results in the decrease of lattice oxygen content on the surface of CuO/p-CeO2 and CuCeOX catalysts.
Usually, the spectrum of Ce 3d can be resolved into eight components, and two groups of spin-orbital multiplets are labeled as u and v, corresponding to Ce 3d3/2 and Ce 3d5/2, respectively. As shown in Figure 7C, the bands labeled u′ (903.0 eV) and v′ (884.5 eV) represent the 3d104f1 initial electronic state corresponding to Ce3+, while the other six bands labeled u″′ (917.0 eV) and v″′ (898.5 eV), u″ (907.8 eV) and v″ (889.4 eV), u (901.0 eV) and v (882.6 eV) are associated with Ce4+. Obviously, Ce4+ and Ce3+ species coexist in CuO/p-CeO2 and CuCeOX catalysts. As reported, the concentration of Ce3+ is directly related to the amount of oxygen vacancies [35]. Generally, the ratio of Ce3+ can be estimated from the relative area of u′ and v′ peaks to the area of Ce 3d region according to the following equation [36]:
Ce 3 + ( % ) = S ( u ) + S ( v ) [ S ( u ) + S ( v ) ] × 100 %
It can be seen from Table 3 that the Ce3+ ions’ percentage of CuO/p-CeO2 is obviously lower than that of CuCeOX catalysts. For CuCeOX catalysts, the percentage of Ce3+ ions firstly increase with the copper loading increasing from 3% to 9%, and then decreases when the copper loading further increases to 12%. The highest relative concentration of Ce3+ is observed in CuCeO9, which means the most oxygen vacancies exist in CuCeO9. It is also confirmed by UV-Raman results discussed below. CuCeO9 contains higher amounts of Ce3+ and Cu+ species, which implies that the redox cycles between Cu2+/Cu+ and Ce3+/Ce4+ are more facile to occur in CuCeO9 than in other catalysts. Thus, CuCeO9 is expected to exhibit excellent activity for CO-PROX reaction.
As shown in Figure 8, all CuCeOX catalysts display an intense band at about 460 cm−1 and a slight downshift compared to n-CeO2. The shift is most likely due to the change of the fluorite crystal structure caused by the strong interaction between copper species and n-CeO2 [25]. Copper species incorporating into CeO2 also results in lattice defects and formation of oxygen vacancies. The broad peak related to oxygen vacancies at 584 cm−1 is observed in all CuCeOX catalysts. CuO/p-CeO2 also shows a weak peak at about 584 cm−1 as compared with p-CeO2. The relative concentration of oxygen vacancies can be evaluated by the ratio of peaks area between 584 cm−1 and 460 cm−1 (noted as A584/A460) [37]. According to A584/A460 ratios listed in Table 3, the relative concentration of oxygen vacancies follows the order of CuCeO9 > CuCeO6 > CuCeO3 > CuCeO12 > CuO/p-CeO2, which is in good agreement with the results of XPS characterization. CuCeO9 possess more oxygen vacancies as compared with other catalysts. For CuCeO12 and CuO/p-CeO2 catalysts, the generation of large CuO clusters and bulk CuO on the surface prevent copper ions from incorporating into CeO2 lattice to form oxygen vacancies to some extent. Oxygen vacancies can provide the site for the adsorption and activation of O2 [17]. The reaction of O2 + 2Ovacancy = 2Olattice is an important step of the CO-PROX reaction mechanism [38]. Thus, the presence of more oxygen vacancies has a positive effect on the activity of CuCeOX.

2.3. Catalytic Performance

The catalytic performance of the n-CeO2, p-CeO2, CuO/p-CeO2 and CuCeOX catalysts for CO-PROX reaction is shown in Figure 9A,B. It can be seen that the CO conversion of n-CeO2 is higher than that of p-CeO2 and the CO conversion for both of them is lower than 20% in the temperature range investigated. CuO/p-CeO2 shows lower CO conversion compared to CuCeOX catalysts, which achieves a complete CO conversion at 160 °C. All CuCeOX catalysts are rather active for the CO-PROX reaction. The CO conversion increases dramatically with increasing the reaction temperature in the range of 40–100 °C, and reaches 100% at 120 °C for all CuCeOX catalysts, and then begins to decrease slightly above 140–180 °C due to the competitive H2 oxidation. The activity of CuCeOX catalysts for CO-PROX is enhanced gradually with the content of copper increasing from 3% to 9%, followed by a small decrease for CuCeO12 catalyst. CuCeO9 shows higher activity as compared with other CuCeOX catalysts, for which the CO conversion approaches 100% at 100 °C with O2 selectivity of 100%. It also shows the broadest temperature “window” for complete CO conversion, from 120 °C to 180 °C. The selectivity of O2 shows a contrary trend compared to CO conversion, and decreases with the increase of reaction temperature. When the reaction temperature is higher than 120 °C, the competing adsorption of H2 and CO occurs in the CO PORX atmosphere [39]. Higher temperature facilitates the oxidation of H2 and results in the decrease of the selectivity of oxygen to CO2. The results of stabilities test over CuCeO9 catalyst are shown in Figure 9C. No obvious decline was observed in the conversion of CO in 54 h, indicating that the redox feature of CuCeO9 is quite stable.
According to the previous studies [38,40,41], the mechanism of CO-PROX over CuO/CeO2 can be explained as follows: CO is adsorbed on the surface of highly dispersed CuO species at CuO-CeO2 interfacial regions firstly and forms Cu+-CO species. Cu+-CO reacts with lattice oxygen nearby to produce CO2 accompanied by the generation of oxygen vacancies. Simultaneously, Ce4+ and Cu2+ are reduced into Ce3+ and Cu+. Then, gaseous oxygen is adsorbed on the vacancies and activated to lattice oxygen species. During the process, Ce3+ and Cu+ transform into Ce4+ and Cu2+, respectively. Highly dispersed CuO species are the active site and CeO2 acts as an oxygen supplier. Oxygen vacancy also plays an important role to provide the activated site for O2. The more highly dispersed CuO species and oxygen vacancies on the surface of n-CeO2 can promote the redox equilibrium of Ce4+ + Cu+ ↔ Ce3+ + Cu2+, and then enhance the CuO–CeO2 interaction in CuO/CeO2 catalysts. The results of structural characterization indicate that n-CeO2 possesses a large surface area and large amount of oxygen vacancies, which favor the high dispersion of CuO species on the surface and the enhancement of interaction between copper species and n-CeO2 supports. According to the reaction mechanism mentioned above, the high performance of CuCeOX catalysts should be related to the structural properties of n-CeO2. CuCeO9 possesses a higher content of active Cu+ species, more Ce3+ and oxygen vacancies, leading to the stronger interaction between highly dispersed CuO species and n-CeO2, which apparently promotes the activity for CO-PROX.

3. Materials and Methods

3.1. Catalyst Preparation

Nanosized CeO2 was synthesized by precipitation method. A total of 18.8 mmol of cerium (III) nitrate was dissolved in 20 mL distilled water, and then added dropwise to 100 mL aqueous solution containing 0.5 mol of 2-methylimidazole. The resultant suspension was stirred for about 6 h at 70 °C. After cooling to room temperature naturally, the precipitate was collected through centrifugation, washed with distilled water and ethanol several times and dried at 100 °C for 8 h. Then, the product was calcined in air at 500 °C for 4 h. The obtained sample was named as n-CeO2. For the purpose of comparison, p-CeO2 was prepared using NaOH solution (pH = 10) as precipitator by the same method.
The CuO-based catalysts were prepared by impregnation method. An appropriate amount of n-CeO2 was impregnated with an ethanol solution of copper acetate for 24 h, followed by drying at 80 °C for 8 h. Subsequently, the resultant solids were calcined in air for 4 h at 500 °C. The nominal contents of Cu were 3 wt.%, 6 wt.%, 9 wt.% and 12 wt.%, respectively. The corresponding catalyst samples were labeled as CuCeOX, where X stands for the loading of copper (wt.%). For the purpose of comparison, CuO/p-CeO2 catalyst was prepared using the same method with the copper loading of 9 wt.%.

3.2. Characterization

Inductively coupled plasma optical emission spectroscopy (ICP-OES) was employed to determine the content of Cu in catalysts, which was carried out on Agilent 720. X-ray diffraction (XRD) measurements were performed on a Bruker D8 Advance instrument (Bruker, Billerica, MA, USA) with Cu Kα radiation and operated at 40 kV and 40 mA. N2 adsorption-desorption isotherms were measured on Micromeritics Tristar II plus equipment (Micromeritics, Norcross, GA, USA) at −196 °C. Before the measurement, the samples were degassed at 200 °C in vacuum (0.13 Pa) for 5 h. The surface areas and pore size distribution were determined by Brunauer–Emmett–Taller (BET) method and Barrett–Joyner–Halenda (BJH) formula, respectively. Transmission electron microscopy (TEM) observations were carried out on a Thermo Fisher Scientific Talos F200X transmission electron microscope (Thermo Fisher, Waltham, MA, USA) at 200 kV. The sample was pretreated and held on a copper grid. H2 temperature-programmed reduction (H2-TPR) measurements were carried out on Micromeritics AutoChem II 2920. The 100 mg of sample was pretreated with He at 200 °C for 1 h, and then cooled to 50 °C. After that, the test was performed within the flow of 10% H2/Ar (40 mL·min−1) by heating up to 400 °C at a rate of 10 °C·min−1. The X-ray photoelectron spectra (XPS) were obtained using a Thermo Fisher Scientific Escalab 250Xi spectrometer with monochromatic Al Kα radiation (1486.6 eV) as the excitation X-ray source. All binding energies (BE) were referenced to the adventitious C 1s at 284.6 eV. UV-Raman spectra were recorded in Thermo Fisher Scientific Dxr2xi Evolution Raman spectrometer with a He-Gd laser of 325 nm excitation wavelength and a measurement range of 100–2000 cm−1.

3.3. Activity Test

The catalytic activity was measured by packing 100 mg catalyst in a fixed-bed quartz micro-reactor at atmospheric pressure. The composition of reaction gas was 1.5 vol.% CO, 1.5 vol.% O2, 50 vol.% H2 and 47 vol.% N2, and the space velocity was 60,000 mL/(gcat h). The gas composition was analyzed by an online Fuli GC-9670 gas chromatograph equipped with a thermal conductivity detector (TCD), using TDX-01 column for separating CO2 and 13X molecular sieve column for separating O2, N2 and CO. The conversion of CO and the selectivity of O2 were calculated as follows:
CO   conversion = [ CO ] i n [ CO ] o u t [ CO ] i n × 100 %
O 2   selectivity = 0.5 × ( [ CO ] i n [ CO ] o u t ) [ O 2 ] i n [ O 2 ] o u t × 100 %

4. Conclusions

In this work, nanostructure CeO2 (n-CeO2) was synthesized by a facile method only using Ce(NO3) and 2-methylimidazole as materials. For comparison, p-CeO2 was prepared in NaOH solution by the same method. As compared with p-CeO2, n-CeO2 as prepared exhibits a higher surface area of 130 m2·g−1 and possesses more surface defects, which must be associated with the role of 2-methylimidazole in the formation of n-CeO2. The soluble Ce3+ was oxidized by O2 to form a hydrated Ce4+ formulated Ce(H2O)x(OH)y(4−y)+. 2-methylimidazole can act as a template agent in this process to prevent the aggregation of Ce(H2O)x(OH)y(4−y)+ effectively, and was also used as a reducer to obtain Ce3+ from Ce4+. Using n-CeO2 as supports, a series of CuO-based catalysts (CuCeOX) with different copper loading were prepared and tested for CO-PROX system. The increase of copper loading has no obvious effect on the structural properties of CuCeOX catalysts. All CuCeOX catalysts exhibit a large surface area, which leads to a high dispersion of CuO species on the surface of catalysts. More oxygen vacancies on CuCeOX induced by intrinsic surface defects on n-CeO2 are in favor of the interaction between the highly dispersed CuO and n-CeO2. These may be the main reasons for their high activity for CO-PROX reaction. CuO/p-CeO2 catalyst was prepared with the copper loading of 9 wt.% for comparison. The smaller surface area of p-CeO2 increases the aggregation of copper species to form large CuO clusters and bulk CuO which contribute less to the catalytic activity. The lower oxygen vacancy density on p-CeO2 reduces the oxygen mobility. Thus, CuO/p-CeO2 shows a lower CO conversion compared to CuCeOX catalysts. The activity of CuCeOX catalysts for CO-PROX follows the order: CuCeO9 > CuCeO6 > CuCeO3 > CuCeO12, which is consistent with the amount of Ce3+ species, Cu+ species and oxygen vacancies on the catalysts. CuCeO9 exhibits the highest catalytic performance. The copper species on CuCeO9 are more readily reducible due to the stronger interaction between the highly dispersed copper species and n-CeO2.

Author Contributions

Conceptualization, L.G. and Q.L.; methodology, L.G. and X.H.; software, M.Q.; characterization analysis, X.L., Q.L. and L.G.; experiment, W.J., Y.L., W.D. and X.L.; resources, L.G.; data curation, W.J., Y.L. and X.L.; writing—original draft preparation, W. J, X.L. and L.G.; writing—review and editing, L.G.; supervision, L.G.; project administration, L.G. and Q.L. All authors have read and agreed to the published version of the manuscript.

Funding

This research was funded by the National Natural Science Foundation of China, grant number 21563014 and 21403093, and Natural Science Foundation of Jiangxi Province, grant number 21563014 and 21403093. The APC was funded by the National Natural Science Foundation of China, grant number 21563014.

Acknowledgments

We gratefully acknowledge the financial support from the National Natural Science Foundation of China (21563014, 21403093) and Natural Science Foundation of Jiangxi Province (20142BAB203014).

Conflicts of Interest

The authors declare no conflict of interest.

References

  1. Brian, B.C.H.; Heinzel, A. Materials for Fuel-Cell Technologies. Nature 2001, 414, 345–352. [Google Scholar]
  2. Devanathan, R. Recent developments in proton exchange membranes for fuel cells. Energy Environ. Sci. 2008, 1, 101–119. [Google Scholar] [CrossRef]
  3. Park, E.D.; Lee, D.; Lee, H.C. Recent progress in selective CO removal in a H2 rich stream. Catal. Today 2009, 139, 280–290. [Google Scholar] [CrossRef]
  4. Liu, K.; Wang, A.; Zhang, T. Rencent advance in preferential oxidation of CO reaction over platinum group metal catalysts. ACS Catal. 2012, 2, 1165–1178. [Google Scholar] [CrossRef]
  5. Wang, M.Q.; Yang, W.H.; Wang, H.H.; Chen, C.; Zhou, Z.Y.; Sun, S.G. Pyrolyzed Fe-N-C Composite as an Efficient Non-precious Metal Catalyst for Oxygen Reduction Reaction in Acidic Medium. ACS Catal. 2014, 4, 3928–3936. [Google Scholar] [CrossRef]
  6. Barroso-Martín, I.; Alberoni, C.; Rodríguze-Castellón, E.; Infantes-Molina, A.; Moretti, E. Recent advances in photo-assisted preferential CO oxidation in H2-rich stream. Curr. Opin. Green Sustain. Chem. 2020, 21, 9–15. [Google Scholar] [CrossRef]
  7. Gamarra, D.; Munuera, G.; Hungría, A.B.; Fernández-García, M.; Conesa, J.C.; Midgley, P.A.; Wang, X.Q.; Hanson, J.C.; Rodríguez, J.A.; Martínez-Arias, A. Structure-Activity relationship in nanostructured copper-ceria-based preferential CO oxidation catalysts. J. Phys. Chem. C 2007, 111, 11026–11038. [Google Scholar] [CrossRef]
  8. Montini, T.; Melchionna, M.; Monai, M.; Fornasiero, P. Fundamentals and catalytic applications of CeO2-based materials. Chem. Rev. 2016, 116, 5987–6041. [Google Scholar] [CrossRef]
  9. Gamarra, D.; Belver, C.; Fernández-García, M.; Martínez-Arias, A. Selective CO oxidation in excess H2 over copper-ceria catalysts: Identification of active entities/species. J. Am. Chem. Soc. 2007, 129, 12064–12065. [Google Scholar] [CrossRef]
  10. Qi, L.; Yu, Q.; Dai, Y.; Tang, C.; Liu, L.; Zhang, H.; Gao, F.; Dong, L.; Chen, Y. Influence of cerium precursors on the structure and reducibility of mesoporous CuO-CeO2 catalysts for CO oxidation. Appl. Catal. B Environ. 2012, 119, 308–320. [Google Scholar] [CrossRef]
  11. Wang, J.; Zhong, L.; Lu, J.; Chen, R.; Lei, Y.; Chen, K.; Han, C.; He, S.; Wan, G.; Luo, Y. A solvent-free method to rapidly synthesize CuO-CeO2 catalysts to enhance their CO preferential oxidation: Effects of Cu loading and calcination temperature. Mol. Catal. 2017, 443, 241–252. [Google Scholar] [CrossRef]
  12. Jampa, S.; Wangkawee, K.; Tantisriyanurak, S.; Changpradit, J.; Jamieson, A.M.; Chaisuwan, T.; Luengnaruemitchai, A.; Wongkasemjit, S. High performance and stability of copper loading on mesoporous ceria catalyst for preferential oxidation of CO in presence of excess of hydrogen. Int. J. Hydrogen Energy 2017, 42, 5537–5548. [Google Scholar] [CrossRef]
  13. Reis, C.G.M.; Almeida, K.A.; Silva, T.F.; Assaf, J.M. CO preferential oxidation reaction aspects in a nanocrystalline CuO/CeO2 catalyst. Catal. Today 2020, 344, 124–128. [Google Scholar] [CrossRef]
  14. Zou, Q.; Zhao, Y.; Jin, X.; Fang, J.; Li, D.; Li, K.; Lu, J.; Luo, Y. Ceria-nano supported copper oxide catalysts for CO preferential oxidation: Importance of oxygen species and metal-support interaction. Appl. Surf. Sci. 2019, 494, 1166–1176. [Google Scholar] [CrossRef]
  15. Wang, C.; Cheng, Q.P.; Wang, X.L.; Ma, K.; Bai, X.Q.; Tan, S.R.; Tian, Y.; Ding, T.; Zheng, L.R.; Zhang, J.; et al. Enhanced catalytic performance for CO preferential oxidation over CuO catalysts supported on highly defective CeO2 nanocrystal. Appl. Surf. Sci. 2017, 422, 932–943. [Google Scholar] [CrossRef]
  16. Xie, Y.; Wu, J.; Jing, G.; Zhang, H.; Zeng, S.; Tian, X.; Zou, X.; Wen, J.; Su, H.; Zhong, C.; et al. Structural origin of high catalytic activity for preferential CO oxidation over CuO/CeO2 nanocatalysts with different shapes. Appl. Catal. B Environ. 2018, 239, 665–676. [Google Scholar] [CrossRef]
  17. Guo, X.; Zhou, R. Identification of the nano/micro structure of CeO2 (rod) and the essential role of interfacial copper-ceria interaction in CuCe (rod) for selective oxidation of CO in H2-rich streams. J. Power Sources 2017, 361, 39–53. [Google Scholar] [CrossRef]
  18. Gong, X.; Liu, B.; Kang, B.; Xu, G.; Wang, Q.; Jia, C.J.; Zhang, J. Boosting Cu-Ce interaction in CuxO/CeO2 nanocube catalysts for enhanced catalytic performance of preferential oxidation of CO in H2-rich gases. Mol. Catal. 2017, 436, 90–99. [Google Scholar] [CrossRef]
  19. Castañeda, R.; Pascual, L.; Martínez-Arias, A. Influence of sodium impurities on the properties of CeO2/CuO for carbon monoxide oxidation in a hydrogen-rich stream. Catal. Commun. 2018, 108, 88–92. [Google Scholar] [CrossRef]
  20. Ramachandran, M.; Subadevi, R.; Sivakumar, M. Role of pH on synthesis and characterization of cerium oxide (CeO2) nano particles by modified co-precipitation method. Vacuum 2019, 161, 220–224. [Google Scholar] [CrossRef]
  21. Li, W.; Hu, Y.; Jiang, H.; Yang, S.; Li, C. Facile synthesis of multi-shelled hollow Cu/CeO2 microspheres with promoted catalytic performance for preferential oxidation of CO. Mater. Chem. Phys. 2019, 226, 158–168. [Google Scholar] [CrossRef]
  22. Guo, X.; Zhou, R. A new insight into the morphology effect of ceria on CuO/CeO2 catalysts for selective oxidation of CO in hydrogen-rich gas. Catal. Sci. Technol. 2016, 6, 3862–3871. [Google Scholar] [CrossRef]
  23. Gong, L.; Liu, C.; Liu, Q.; Dai, R.; Nie, X.; Lu, L.; Liu, G.; Hu, X. CuO/CeO2-MnO2 catalyst prepared by redox method for preferential oxidation of CO H2-rich gases. Catal. Surv. Asia 2019, 23, 1–9. [Google Scholar] [CrossRef]
  24. Arango-Díaz, A.; Cecilia, J.A.; Santos-Gómez, L.D. Characterization and performance in preferential oxidation of CO of CuO-CeO2 catalysts synthesized using polymethyl metacrylate (PMMA) as template. Int. J. Hydrogen Energy 2015, 40, 11254–11260. [Google Scholar] [CrossRef]
  25. Chen, S.; Li, L.; Hu, W.; Huang, X.; Li, Q.; Xu, Y.; Zuo, Y.; Li, G. Anchoring high-concentration oxygen vacancies at interfaces of CeO2-x/Cu toward enhanced activity for preferential CO oxidation. ACS Appl. Mater. Interfaces 2015, 7, 22999–23007. [Google Scholar] [CrossRef]
  26. Gu, D.; Jia, C.J.; Bongard, H.; Spliethoff, B.; Weidenthaler, C.; Schmidt, W.; Schüth, F. Ordered mesoporous Cu-Ce-O catalysts for CO preferential oxidation in H2-rich gases: Influence of copper content and pretreatment conditions. Appl. Catal. B Environ. 2014, 152, 11–18. [Google Scholar] [CrossRef]
  27. Hou, H.; Liu, Y.; Liu, B.; Jing, P.; Gao, Y.; Zhang, L.; Niu, P.; Wang, Q.; Zhang, J. Modulating the operation temperature window of CO preferential oxidation in H2-rich gases on three dimensionally ordered macroporous CeO2-CuO catalysts by tuning their composition and incooperating Fe2O3 and Co3O4. Int. J. Hydrogen Energy 2015, 40, 878–890. [Google Scholar] [CrossRef]
  28. Monte, M.; Gamarra, D.; Cámara, A.L.; Rasmussen, S.B.; Gyorffy, N.; Schay, Z.; Martínez-Arias, A.; Conesa, J.C. Preferential oxidation of CO in excess H2 over CuO/CeO2 catalysts: Performance as a function of the copper coverage and exposed face present in the CeO2 support. Catal. Today 2014, 229, 104–113. [Google Scholar] [CrossRef]
  29. Hossain, S.T.; Azeeva, E.; Zhang, K.; Zell, E.T.; Bernard, D.T.; Balaz, S.; Wang, R. A comparative study of CO oxidation over Cu-O-Ce solid solutions and CuO/CeO2 nanorods catalysts. Appl. Surf. Sci. 2018, 455, 132–143. [Google Scholar] [CrossRef]
  30. Cecilia, J.A.; Arango-Díaz, A.; Marrero-Jerez, J.; Núñez, P.; Moretti, E.; Storaro, L.; Rodríguez-Castellón, E. Catalytic behaviour of CuO-CeO2 system prepared by different synthetic methodologies in the CO-PROX reaction under CO2-H2O feed srteam. Catalysts 2017, 7, 160. [Google Scholar] [CrossRef]
  31. Wen, B.; He, M.Y. Study of the Cu-Ce synergism for NO reduction with CO in the presence of O2, H2O, and SO2 in FCC operation. Appl. Catal. B Environ. 2002, 37, 75–82. [Google Scholar] [CrossRef]
  32. Peng, C.T.; Lia, H.K.; Liaw, B.J.; Chen, Y.Z. Removal of CO in excess hydrogen over CuO/Ce1-xMnO2 catalysts. Chem. Eng. J. 2011, 172, 452–458. [Google Scholar] [CrossRef]
  33. Skårman, B.; Grandjean, D.; Benfield, R.E.; Hinz, A.; Andersson, A.; Wallenberg, L.R. Carbon monoxide on nanostructured CuOx/CeO2 composite particles characterized by HREM, XPS, XAS and high-energy diffraction. J. Catal. 2002, 211, 119–133. [Google Scholar] [CrossRef]
  34. Pu, Z.Y.; Lu, J.Q.; Luo, M.F.; Xie, Y.L. Study of oxygen vacancies in Ce0.9Pr0.1O2-δ solid solution by in Situ X-ray diffraction and in Situ Raman spectroscopy. J. Phys. Chem. C 2007, 111, 18695–18702. [Google Scholar] [CrossRef]
  35. Barbato, P.S.; Colussi, S.; Benedetto, A.D.; Landi, G.; Lisi, L.; Llorca, J.; Trovarelli, A. Origin of high activity and selectivity of CuO/CeO2 catalysts prepared by solution combustion synthesis in CO-PROX reaction. J. Phys. Chem. C 2016, 120, 13039–13048. [Google Scholar] [CrossRef]
  36. Fan, J.; Wu, X.; Wu, X.; Liang, Q.; Ran, R.; Weng, D. Thermal ageing of Pt on low-surface-area CeO2-ZrO2-La2O3 mixed oxides: Effect on the OSC performance. Appl. Catal. B Environ. 2008, 81, 38–48. [Google Scholar] [CrossRef]
  37. Li, X.; Quek, X.Y.; Ligthart, D.A.J.M.; Guo, M.; Zhang, Y.; Li, C.; Yang, Q.; Hensen, E.J.M. CO-PROX reactions on copper cerium oxide catalysts prepared by melt infiltration. Appl. Catal. B Environ. 2012, 123, 424–432. [Google Scholar] [CrossRef]
  38. Sedmak, G.; Hočevar, S.; Levec, J. Kinetics of selective CO oxidation in excess of H2 over the nanostructured Cu0.1Ce0.9O2−y catalyst. J. Catal. 2003, 213, 135–150. [Google Scholar] [CrossRef]
  39. Davó-Quiňonero, A.; Navlani-García, M.; Lozano-Castelló, D.; Bueno-López, A.; Anderson, J.A. Role of Hydrogen groups in the preferential oxidation of CO over copper oxide catalysts. ACS Catal. 2016, 6, 1723–1731. [Google Scholar] [CrossRef] [Green Version]
  40. Wang, W.W.; Du, P.P.; Zou, S.H.; He, H.Y.; Wang, R.X.; Jin, Z.; Shi, S.; Huang, Y.Y.; Si, R.; Song, Q.S.; et al. Highly dispersed copper oxide cluster as active species in copper-ceria catalyst for preferential oxidation of carbon monoxide. ACS Catal. 2015, 5, 2088–2099. [Google Scholar] [CrossRef]
  41. Polster, C.S.; Nair, H.; Baertsch, C.D. Study of active sites and mechanism responsible for highly selective CO oxidation in H2 rich atmospheres on a mixed Cu and Ce oxide catalyst. J. Catal. 2009, 266, 308–319. [Google Scholar] [CrossRef]
Figure 1. N2 absorption-desorption isotherms combined with the pore size distribution curves (inset) (A), XRD patterns (B) and UV-Raman profiles (C) of n-CeO2 and p-CeO2.
Catalysts 11 00884 g001
Figure 2. TEM image of n-CeO2 (A), HRTEM image of the selected area (red square in A) (B), HRTEM image of the selected area (red square in B) (C) and enlarged images of the regions I and II (white squares in C) with the corresponding models (Ce4+, blue ball; Ce3+, yellow ball; O, red ball; defects, white ellipse).
Catalysts 11 00884 g002
Figure 3. N2 absorption-desorption isotherm (A) and pore size distribution (B) of CuO/p-CeO2 and CuCeOX catalysts.
Catalysts 11 00884 g003
Figure 4. XRD patterns of CuO/p-CeO2 and CuCeOX catalysts (inset: 2θ from 25° to 31°).
Catalysts 11 00884 g004
Figure 5. TEM (A) and HRTEM (B) image of CuCeO9 catalyst.
Catalysts 11 00884 g005
Figure 6. H2-TPR profiles of n-CeO2, p-CeO2, CuO/p-CeO2 (A) and CuCeOX catalysts (B).
Catalysts 11 00884 g006
Figure 7. XPS spectra of CuO/p-CeO2 and CuCeOX catalysts: (A) Cu 2p; (B) O 1s; (C) Ce 3d.
Catalysts 11 00884 g007
Figure 8. UV-Raman spectra of CuO/p-CeO2 and CuCeOX catalysts.
Catalysts 11 00884 g008
Figure 9. Catalytic performance (the amount of catalyst is 100 mg, under the space velocity of 60,000 mL/(gcat·h) with a feed gas of 1.5 vol.% CO, 1.5 vol.% O2, 47 vol.% H2 and 50 vol.% N2): CO conversion (A) and CO2 selectivity (B) of n-CeO2, p-CeO2, CuO/p-CeO2 and CuCeOX catalysts; Variation of CO conversion with time over CuCeO9 at 100 °C (C).
Catalysts 11 00884 g009
Table 1. Textural characteristics of p-CeO2, n-CeO2, CuO/p-CeO2 and CuCeOX catalysts.
CatalystSBET
(m2·g−1)
Dpore
(nm)
Vpore
(cm3·g−1)
Lattice Parameters
(nm) a
p-CeO23518.70.0830.5414
n-CeO21305.60.1760.5417
CuCeO3958.90.1870.5411
CuCeO6949.40.1980.5409
CuCeO9929.30.1860.5405
CuCeO12866.40.1300.5417
CuO/p-CeO22420.30.0510.5413
a Obtained by using MDI Jade 5.0 software according to the data of XRD.
Table 2. H2 consumption amount a and reduction temperature of CuO/p-CeO2 and CuCeOX catalysts.
Catalystsα Peakβ Peakγ PeakTotal
Peak Temp. (°C)H2 Cons. (µmol·g−1)Peak Temp. (°C)H2 Cons. (µmol·g−1)Peak Temp. (°C)H2 Cons. (µmol·g−1)H2 Cons. (µmol·g−1)
CuO/p-CeO21426321856482107131993
CuCeO3124468136513--981
CuCeO6121616133851--1467
CuCeO91117161271291--2007
CuCeO121276671471775--2442
a CuO (99.99%) was used as the calibration standard sample for H2 consumption.
Table 3. ICP and XPS results of CuO/p-CeO2 and CuCeOX catalysts.
CatalystsCe3+/(Ce3++Ce4+)
(%)
Isat/ImpOlatt/Ototal
(%)
Cu Content
(wt.%) a
Cu/Cu+Ce
(at%) b
A584/A460
CuO/p-CeO211.790.4174.638.928.80.15
CuCeO316.610.3579.423.118.30.23
CuCeO617.830.3276.525.925.00.28
CuCeO920.820.2772.968.929.30.39
CuCeO1216.230.3869.4211.832.90.18
a Actual Cu content (wt.%) determined by ICP. b Surface atomic ratio Cu/Cu+Ce determined by XPS.
Publisher’s Note: MDPI stays neutral with regard to jurisdictional claims in published maps and institutional affiliations.

