Article

Ultrasound Assisted Synthesis of Gadolinium Oxide-Zeolitic Imidazolate Framework-8 Nanocomposites and Their Optimization for Photocatalytic Degradation of Methyl Orange Using Response Surface Methodology

1
Department of Convergence Science, Graduate School, Sahmyook University, Seoul 01795, Korea
2
Department of Animal Life Resources, Sahmyook University, Seoul 01795, Korea
3
Department of Chemistry, Sahmyook University, Seoul 01795, Korea
*
Author to whom correspondence should be addressed.
Catalysts 2021, 11(9), 1022; https://doi.org/10.3390/catal11091022
Submission received: 27 July 2021 / Revised: 20 August 2021 / Accepted: 21 August 2021 / Published: 24 August 2021
(This article belongs to the Section Environmental Catalysis)

Abstract

:
An ultrasound-assisted method was used to prepare gadolinium oxide (Gd2O3)-zeolitic imidazolate framework (ZIF)-8 nanocomposites. The surface morphology, particle size, and properties of the Gd2O3-ZIF-8 nanocomposites were examined using scanning electron microscopy (SEM), X-ray diffraction (XRD), Raman spectroscopy, and ultraviolet-visible (UV-vis) spectroscopy. The synthesized Gd2O3-ZIF-8 nanocomposites were used as a catalyst to degrade methyl orange (MO) under UV light irradiation at 254 nm. The color of the aqueous MO dye solution during photocatalytic degradation was examined using color spectroscopy. Response surface methodology (RSM) using a four-factor Box-Behnken design (BBD) was used to design the experiments and optimize the photocatalytic degradation of MO. The significance of the experimental factors and their interactions were determined using analysis of variance (ANOVA). The efficiency of Gd2O3-ZIF-8 nanocomposites for the photocatalytic degradation of MO reached 98.05% within 40 min under UV irradiation at 254 nm under the experimental conditions of pH 3.3, 0.4 g/L catalyst dose, 0.0630 mM MO concentration, and 431.79 mg/L H2O2 concentration. The kinetics study showed that the MO photocatalytic degradation followed a pseudo-first-order reaction rate law.

1. Introduction

Azo dyes make up more than half of the dyes produced globally, and anthraquinone dyes can be found abundantly [1]. Organic dyes are commonly released into wastewater. These dyes are hazardous to the environment if they are not destroyed and cause serious pollution [2]. Therefore, it is necessary to degrade such organic dye pollutants [3].
According to their raw materials, process principles, and pollutant characteristics, dye wastewater treatment methods can be classified into various categories, which include physical adsorption, membrane separation, biodegradation, electrochemical treatment, and photocatalysis [3]. The use of advanced oxidation processes (AOPs) is a major pathway for the near-ambient degradation of wastewater pollutants because the waste water pollutants can be degraded almost completely [4].
Photocatalytic degradation of organic dyes employed on metal oxide semiconductors has received a lot of interest in recent years. Owing to its good chemical durability, high thermal stability, and low phonon energy, Gd2O3 is a suitable semiconductor material for use as a photocatalyst [4]. It features a high refractive index and a suitable optical band gap, and is a potential candidate material for electronic and optoelectronic devices [4]. Gd2O3 is an n-type semiconductor that can be used as a photocatalyst to degrade organic pollutants in water [5]. However, for a single semiconductor, because the speed of the recombination of electrons and holes is fast, it leads to a decrease in the photocatalytic efficiency [6].
ZIF-8 is a type of metal organic framework (MOF) constructed from imidazolate organic ligands and Zn2+ metal ions. It exhibits higher thermal and chemical stability than other MOFs [7]. Owing to its structural features, pore cavities, and large surface area, ZIF-8 is desirable for many potential applications such as gas storage, membrane sieving separation, templating, catalysis, and sensing [7]. Therefore, the coupling of the semiconductor and the metal–organic framework is of great significance due to its porosity and large specific surface area [8]. The formation of hybrid composites between metal oxide semiconductors and MOFs has been shown to result in a synergistic effect in their photocatalytic performance [9,10]. Many studies have shown that metal oxide-ZIF-8 nanocomposites show better photocatalytic efficiency than the metal oxides and ZIF-8 alone [11]. TiO2/ZIF-8 composites have been used to enhance the photocatalytic degradation of rhodamine B [12], while ZIF-8 and ZnO composites have been used to degrade MO under visible light [13]. The combined SnO2 and ZIF-8 nanocomposites showed higher photocatalytic activity compared to a single-compound catalyst [14]. Herein, a composite photocatalyst was obtained by coupling Gd2O3 and ZIF-8 via a simple method.
An ideal photocatalyst for dye degradation should have high light absorption efficiency, efficient electron-hole separation, and large surface area. The absorbed photons are used for degrading MO while a larger surface area of the photocatalyst provides more contact points between the photocatalyst and the MO dye and thereby leads to faster photocatalytic degradation.
Response surface methodology (RSM) quantifies the relationships between the controllable parameters and the obtained response surfaces. In RSM, the experimental data is fitted to a polynomial equation using statistical and mathematical analysis [15]. The interactions between the operating parameters can be estimated using a limited number of experiments [15]. The two most popular experimental design methods for RSM are the central composite design (CCD) and Box-Behnken design (BBD) [16,17,18,19,20,21]. In this study, we carried out both synthesis of hybrid Gd2O3-ZIF-8 nanocomposites using an ultrasound assisted method and an RSM experiment based on BBD to obtain optimum conditions for photocatalytic degradation of MO dye. In addition, a kinetics study was performed to evaluate the photocatalytic degradation rate of MO.

2. Results and Discussion

2.1. Identification of Gd2O3-ZIF-8 Nanocomposites and Color Test of MO Dye Solution

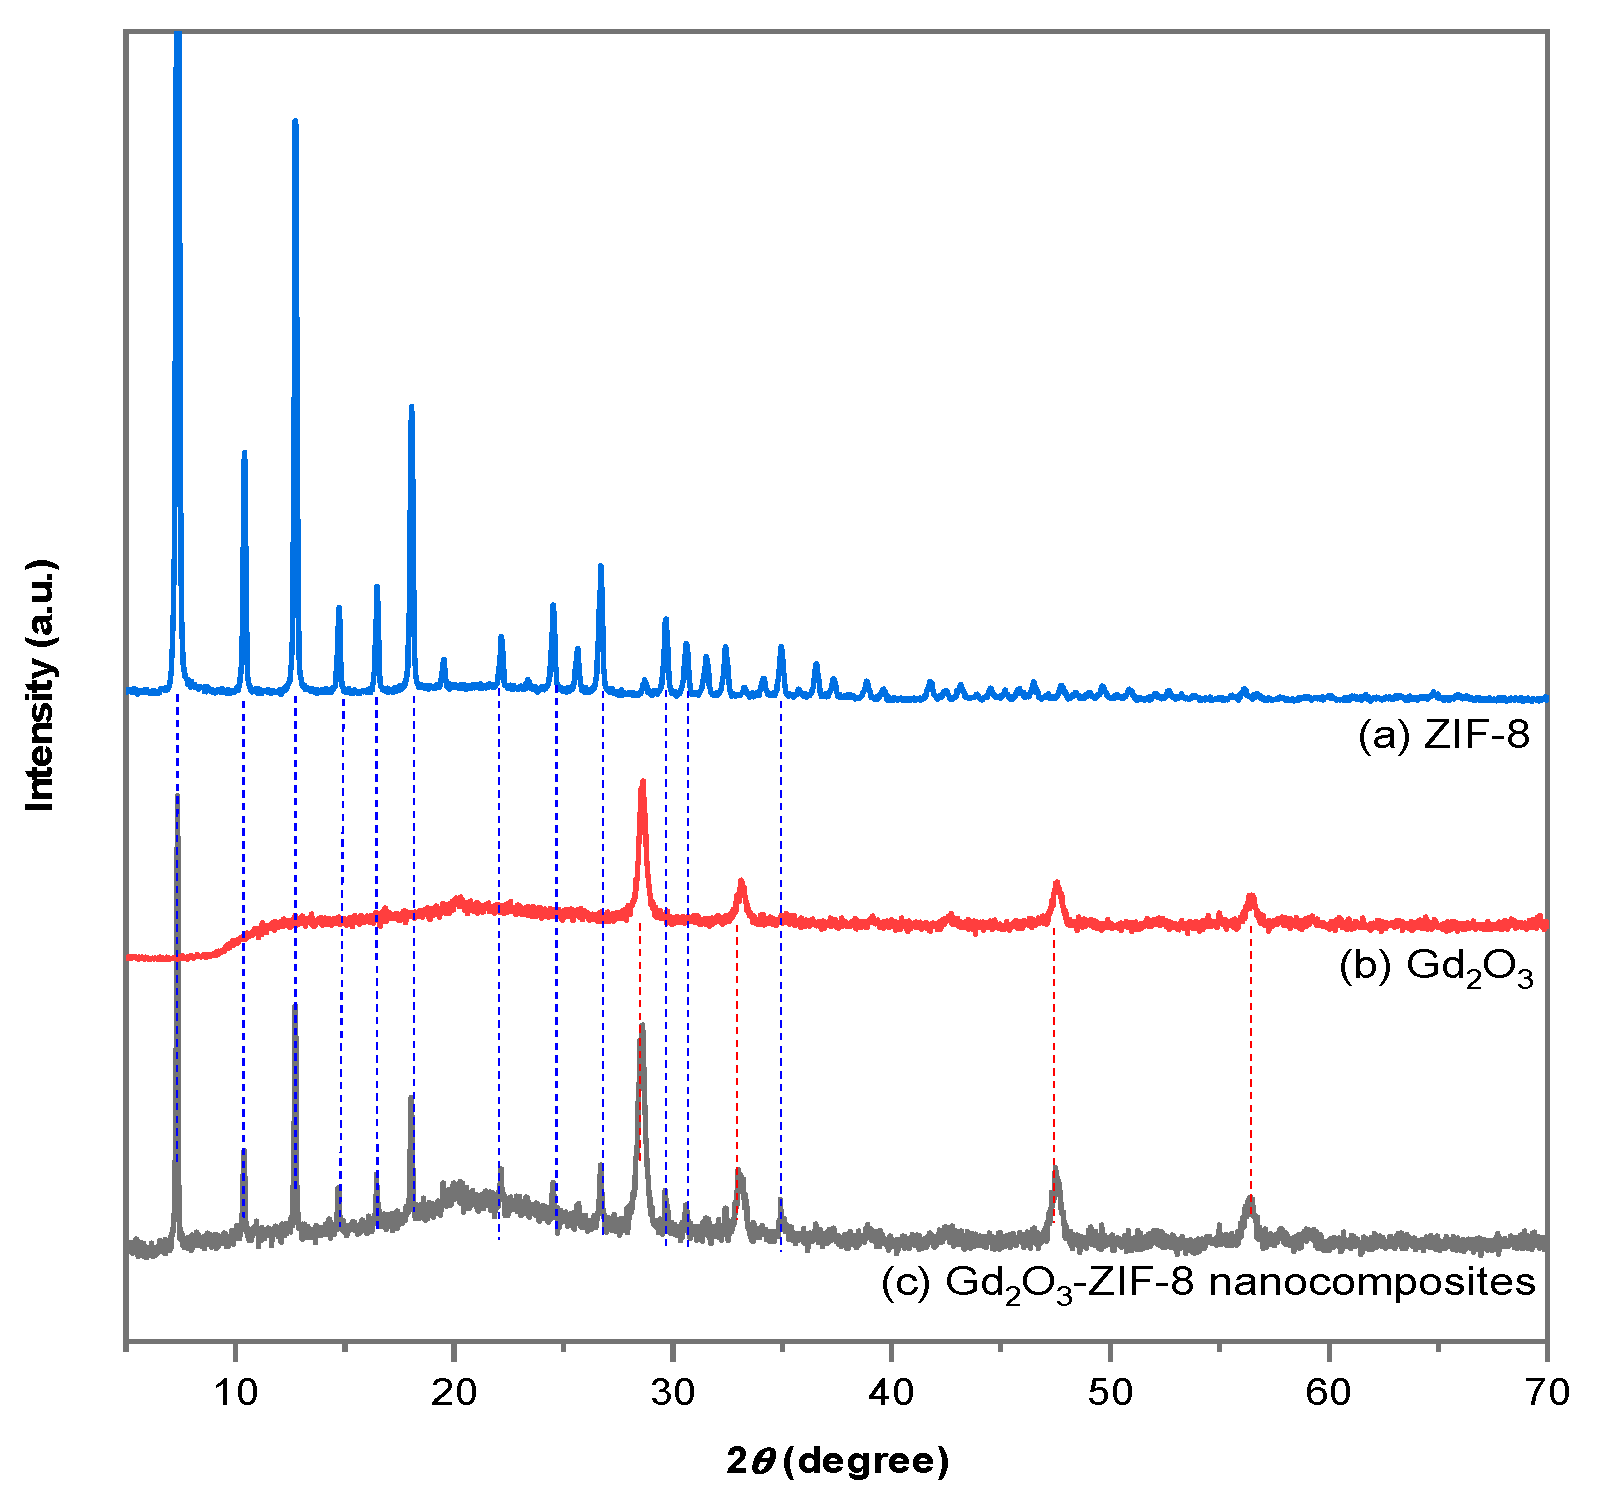
2.1.1. XRD Diffraction

The XRD results of hybrid Gd2O3-ZiF-8 nanocomposites are shown in Figure 1. The characteristic peaks of Gd2O3 nanowires and ZiF-8 could be found in Gd2O3-ZiF-8 nanocomposites. The XRD pattern in Figure 1 shows that Gd2O3 nanowires were observed at 2θ = 20.14°, 28.64°, 33.16°, 47.64°, and 56.53°, which correspond to the (211), (222), (400), (440), and (622) planes of the cubic phases (JCPDS 3-065-3181) [22]. The XRD peak values of ZIF-8 were observed at 2θ = 7.30°, 10.37°, 12.70°, 14.60°, 16.43°, 18.08°, and 22.15°, which correspond to the (011), (002), (112), (022), (013), (222), and (114) planes of the sodalite structure (JCPDS 00-062-1030) [23,24]. The crystallite size of the Gd2O3 nanowires in the synthesized Gd2O3-ZIF-8 nanocomposites was calculated using the Scherrer formula [25,26].
D   = K λ /   β c o s θ
where D is the crystallite size, K is the Scherrer constant, λ is the X-ray wavelength (CuK α =0.15406 nm), β is the full width at half maximum intensity of the XRD peak in radians, and θ is the Bragg angle. The average crystallite size of the Gd2O3 nanowires at 28.64° in the (222) plane was 22.14 nm.

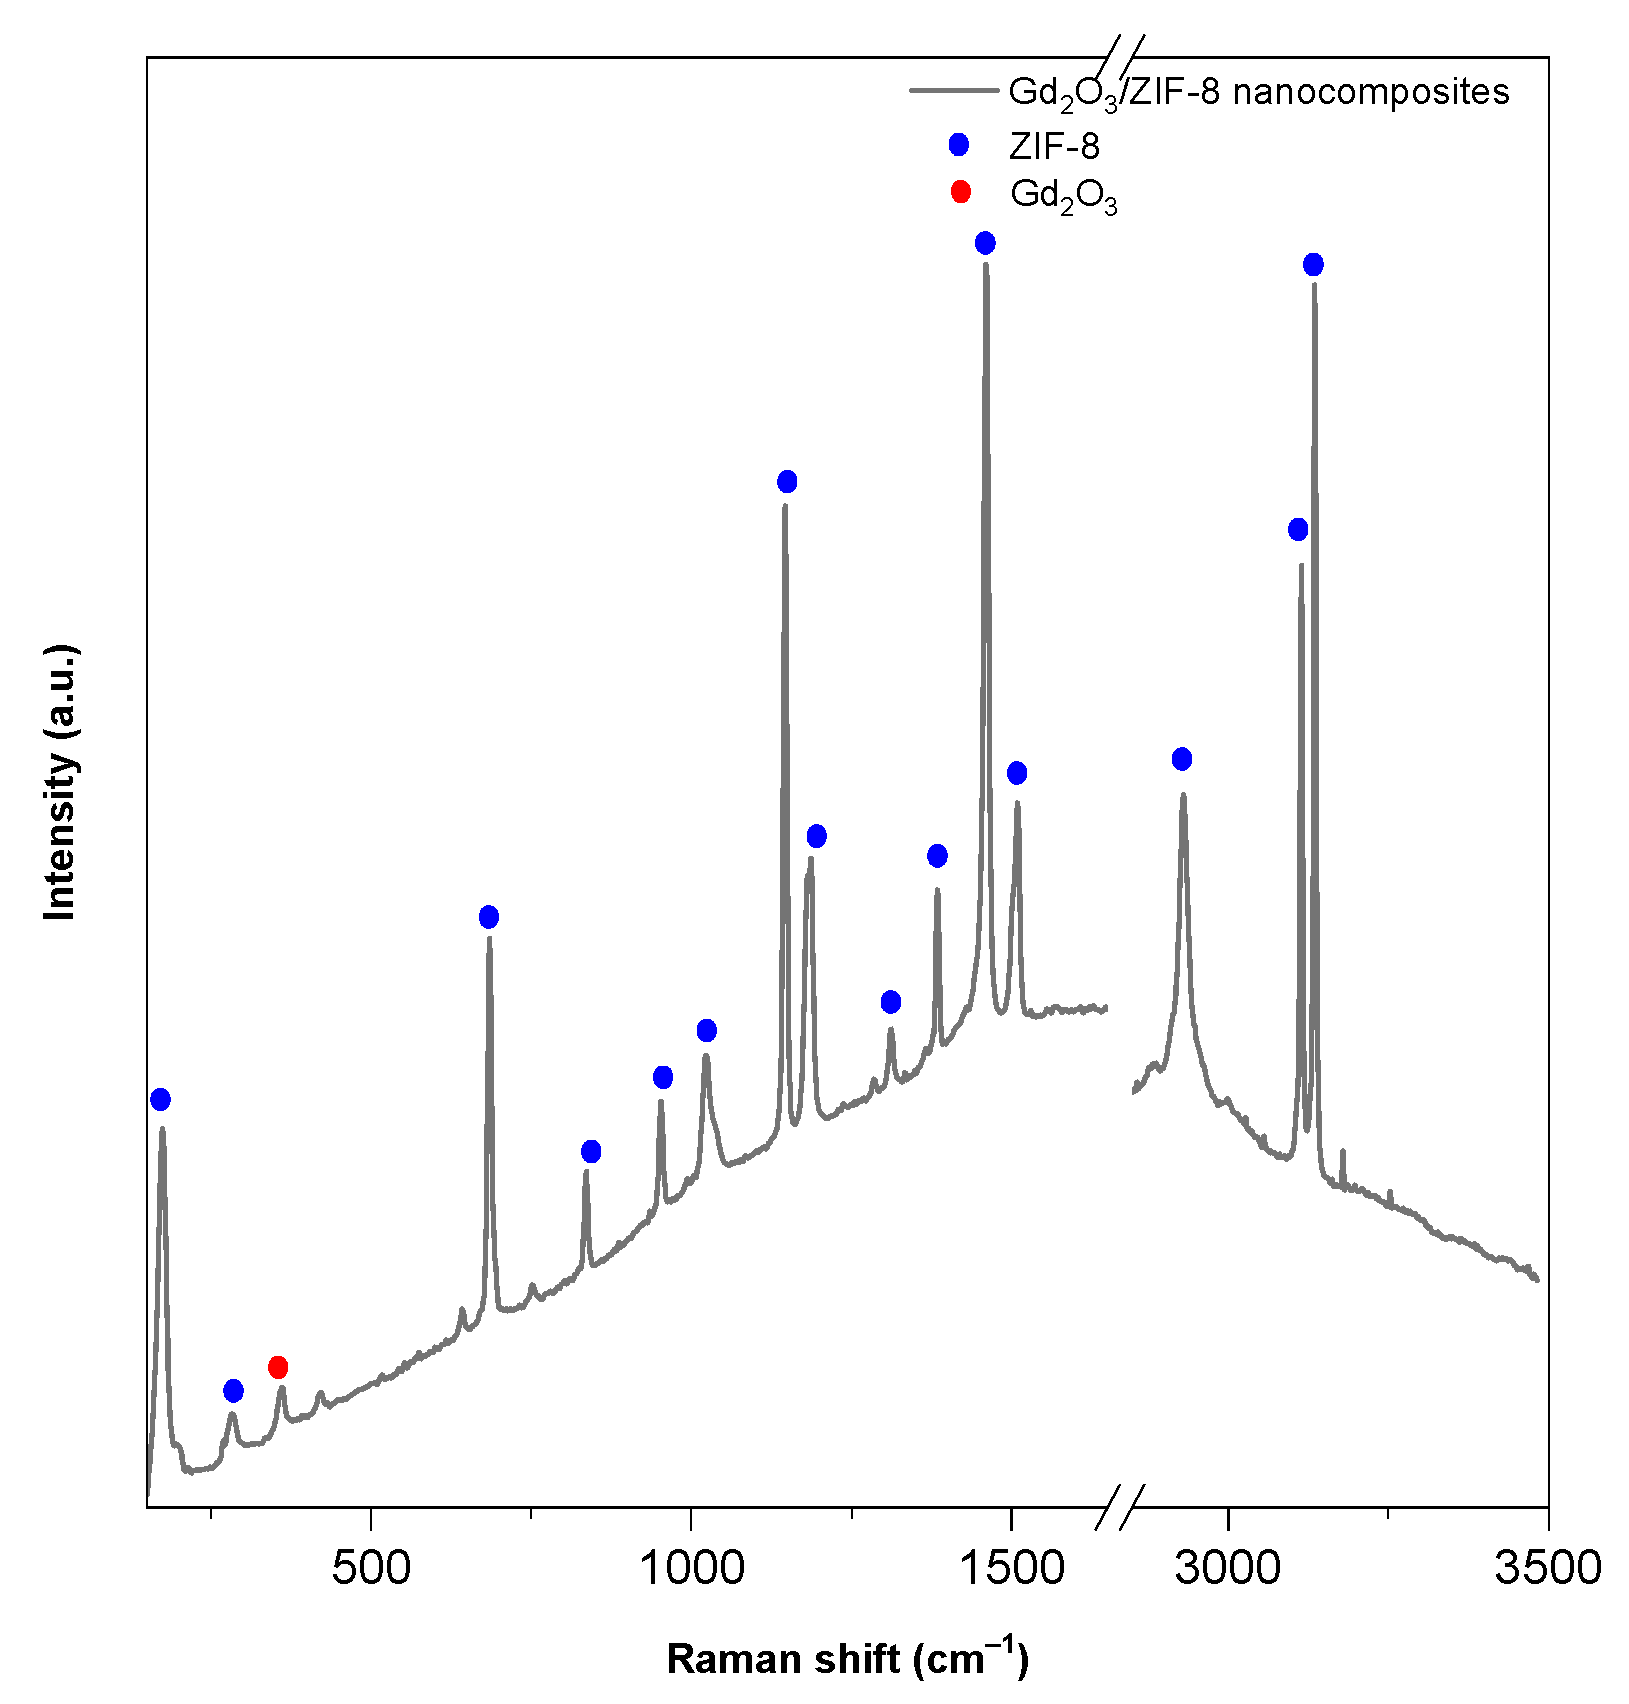
2.1.2. Raman Spectroscopy

The Raman spectroscopy results of hybrid Gd2O3-ZIF-8 nanocomposites show the prominent mode of Gd2O3 and major peaks of ZIF-8 in Figure 2 and the Raman shift ranges from 200 cm−1 to 3500 cm−1. A peak corresponding to the Fg + Ag mode of the Gd2O3 nanowires was observed at 358.41 cm−1 [22,26].
The major peaks of ZIF-8 were observed at 282 cm−1 (Zn–N stretching), 684 cm−1 (imidazolium ring puckering), 825 cm−1, 952 cm−1, 1032 cm−1(C–H bending), 1146 cm−1 (C–N stretching), 1180 cm−1 (C–N stretching + N–H wag), 1186 cm−1 (C–N stretching), 1311 cm−1 (N–H wag), 1384 cm−1 (CH3 bending), 1460 cm−1 (C–H bending), 1509 cm−1 (C–C stretching), 2930 cm−1 (methyl C–H stretching), 3113 cm−1, and 3135 cm−1 (imidazolium ring C–H stretching) [27,28].

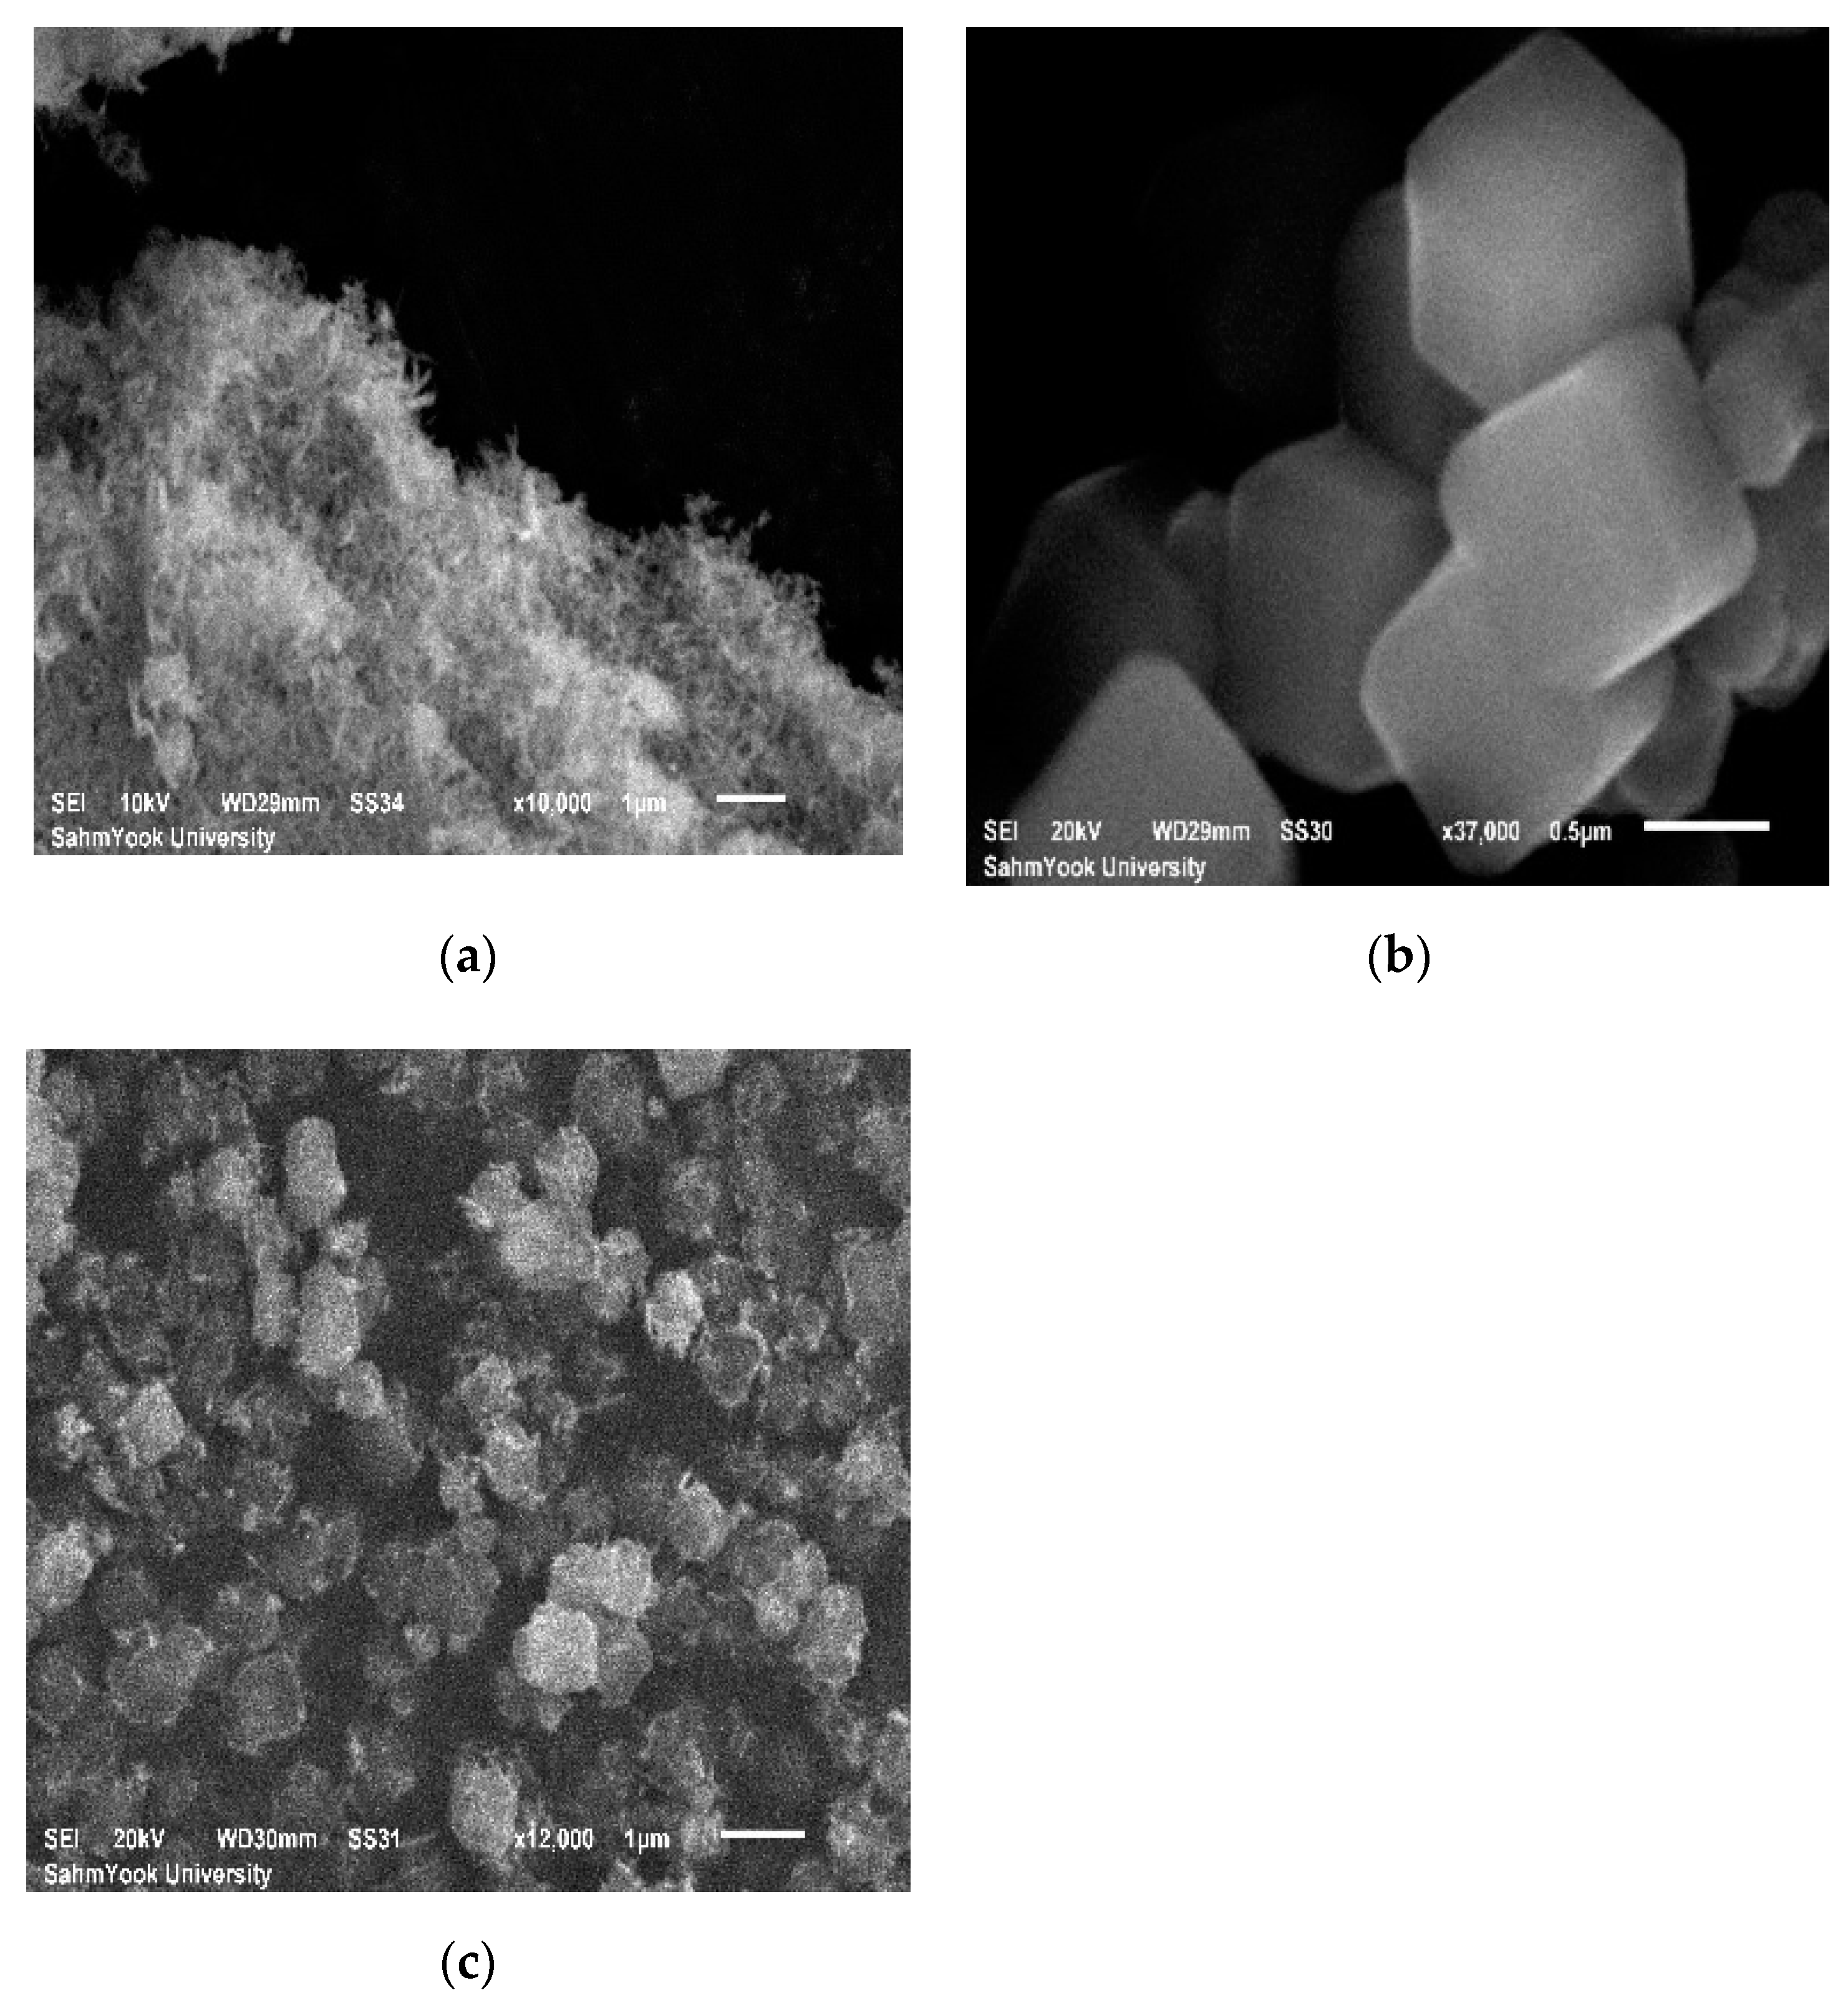
2.1.3. Scanning Electron Microscopy

The SEM results of hybrid Gd2O3-ZIF-8 nanocomposites are shown in Figure 3. The SEM image of the Gd2O3 shows that it had an aggregated nanowire-like shape (Figure 3a). The nanowire-like shape of Gd2O3 was placed on the cubic-shaped ZIF-8 (Figure 3b,c).

2.2. Investigation of Photocatalytic Activity for Degradation of MO using Gd2O3-ZIF-8 Nanocomposites

The property of light absorption was measured to identify the absorption band of Gd2O3-ZIF-8 nanocomposites that corresponds to the light irradiation at 254 nm in Figure S1. The absorption peak of the Gd2O3-ZIF-8 nanocomposites was observed at 208 nm in UV-vis spectroscopy in Figure S1a. The bandgap energy of Gd2O3-ZIF-8 nanocomposites was evaluated to be 4.85 eV in Figure S1b. Therefore, the photocatalyst of Gd2O3-ZIF-8 nanocomposites could absorb light irradiation at 254 nm.
Figure 4a shows the photocatalytic degradation of MO observed through UV-vis spectrophotometry at constant time intervals. The UV-vis spectrophotometry data confirms that the absorption peaks of the MO solution decreased with time.
Upon UV irradiation, the electrons in the valence band of the photocatalyst moved into the conduction band. This resulted in the continuous generation of holes (h+) in the valence band and electrons (e) in the conduction band. The generation of electron-hole pairs contributed to the activity of the photocatalyst. Holes with high oxidative ability oxidized OH ions into ·OH radicals in the aqueous MO solution. Valence band holes and conduction band electrons combined with hydroxide ions and oxygen to produce ·OH and ·O2 radicals. The ·OH and ·O2 radicals could act as oxidizing agents to the MO dye molecules [4,5,29]. The role of each component in the Gd2O3-ZIF-8 nanocomposites is as a co-photocatalyst due to the enhanced rate of photocaltalytic degradation of MO when Gd2O3 and ZIF-8 are combined than when only Gd2O3 is alone [6,26].

2.3. Kinetics Study for Photocatalytic Degradation of MO

To determine the photocatalytic kinetic model, the degradation of MO dye is examined with two kinetic models, including the first-order kinetic model and the second-order kinetic model, as expressed in the following equations. First-order kinetic model [30,31]:
lnCt = −k1t + lnC0
Second-order kinetic model [32,33]:
1/Ct = −k2t + 1/C0
where C0 (mM) and Ct (mM) are assigned as concentration of MO dyes at time = 0 and time = t (min−1), respectively. k1 (min−1) and k2 (min−1) represent the rate constants of first-order and second-order, respectively. Accordingly, the fitting results from experimental investigations into two distinct kinetic models are demonstrated in Figure S2, where higher R2 (0.9943) among the two examined models appears in the first-order kinetic model, validating the underlying kinetics for MO dye degradation under ultraviolet irradiation at 254 nm.
The linear behavior of the curve confirms that the degradation of MO followed a pseudo-first-order reaction rate law as shown in Figure 4b and the value of R2 (coefficient of determination) for the pseudo-first-order reaction kinetics was 0.9943.

2.4. Color Test of Photocatalytic Degradation of MO Dye Solution

The changes in ΔL, Δa, Δb, and ΔE are listed in Table 1. The increase in ΔL indicates that the MO solution became whiter because of photocatalytic degradation. The negative values of Δa and Δb indicate that the MO solution tended to become less reddish owing to photocatalytic degradation. The total color change, ΔE, indicates the color difference between two colors under UV light irradiation [34,35]. Before the color of the solution was measured by a color spectrophotometer, the solution was centrifuged for 1 min to remove the photocatalyst from the solution. Then, we measured the color of only liquid solution with a color spectrophotometer. Therefore, the aggregation of photocatalyst did not affect measuring the color of the solution. The color change of the MO photocatalytic degradation was measured within the range of 0 to 100. Figure 5 shows the chromaticity diagram using the calculated x and y coordinates of a given color in the CIE 1931 color space. The color of the MO solution in the CIE1931 color space changed from red to green and from yellow to blue with increasing UV light exposure time because of photocatalytic degradation.

2.5. Box-Behnken Design with Response Surface Methodology (RSM)

The photocatalytic degradation of MO using Gd2O3-ZIF-8 nanocomposites is optimized by a four-factor and three-level BBD design consisting of 27 sets of experimental data for the optimization reactions, including replication at the center point [25,36]. Four independent variables, namely the initial pH ( X 1 ), catalyst dose ( X 2 ), MO concentration ( X 3 ), and H2O2 concentration ( X 4 ), were assessed. The photocatalytic degradation efficiency of MO was used as the response variable (Y). Table 2 shows the low (−1), medium (0), and high (+1) levels and the ranges of the independent variable parameters. The experimental data and response for the photocatalytic degradation of MO are shown in Table 3.

2.5.1. Effect of pH

In Figure 6a, the effect of pH was investigated by varying only the pH from 3 to 7 while the other conditions remained the same. Under acidic conditions, the MO was negatively charged, and the photocatalyst surface positively charged [29]. Electrostatic attraction occurred between the MO and the photocatalyst. The transformation of the MO dye molecules to CO2 and H2O under radical attack in the photocatalytic reaction was attributed to electrostatic attraction [37,38].

2.5.2. Effect of Photocatalyst Concentration

In Figure 6b, the effect of the photocatalyst concentration was investigated by varying only the photocatalyst dose from 0.1 g/L to 0.3 g/L while the other conditions remained the same. Increasing the concentration of the photocatalyst in the MO solution may decrease the transmission of light [3]. Therefore, excess photocatalyst in solution could interfere with the photocatalytic degradation of the MO solution [36].

2.5.3. Effect of MO Concentration

After 40 min, the MO photocatalytic degradation efficiency decreased when the MO concentration increased from 0.0630 to 0.0105 mM (Figure 6c). Within the experimental range, the pseudo-first-order rate constant k1 decreased with an increase in the MO concentration based on Equation (10) [3]. These results indicate that the absorption of light on the photocatalyst surface decreased at higher concentrations. Moreover, the photocatalytic degradation of MO occurred on the surface of the active sites of the photocatalyst [39].

2.5.4. Effect of H2O2 Concentration

H2O2 and metal oxide nanoparticles have been used to increase the photocatalytic degradation rate of MO [40]. The addition of H2O2 in the presence of catalyst was studied [41]. Figure 6d shows the effect of the H2O2 concentration on the photocatalytic degradation of MO.

2.6. Optimization for Photocatalytic Degradation of MO Using Response Surface Methodology (RSM)

RSM was applied to predict the percentage efficiency (%) of the photocatalytic degradation of MO using the Gd2O3-ZIF-8 nanocomposites photocatalyst under the variation of four parameters, namely, the pH, catalyst dose (g/L), MO concentration (mM), and H2O2 concentration (mg/L). We obtained the predicted degradation percentage using Design Expert 11 statistical software (Stat-Ease, Minneapolis, MN, USA) in Figure S3.
As shown in Table 3, the resulting photocatalytic degradation efficiency of MO fell in the range of 32.12 to 94.79%. The quadratic polynomial regression model in Equation (4) was used to obtain the degradation percentage of MO:
Degradation ( % ) = 64.46 14.04   X 1 + 5.39   X 2 10.71   X 3 + 9.51   X 4   3.36   X 1 X 2   0.51   X 1 X 3 4.24   X 1 X 4 + 1.87   X 2 X 3 + 1.79 X 2 X 4 1.04   X 3 X 4   + 3.75   X 1 2 5.90   X 2 2 + 3.29   X 3 2 16.46   X 4 2
where X 1 , X 2 , X 3 , and X 4 represent the coded values of the pH, photocatalyst dose, initial MO solution concentration, and H2O2 concentration, respectively. The accuracy of the model was verified by analysis of variance (ANOVA), and the results are presented in Table 4. The fitness of the BBD model was obtained by applying the suitability equation to the quadratic polynomial model based on the experimental data in Table 4 [15]. The obtained experimental data were scattered very closely to the trend line of the predicted data, as shown in Figure 7 [36]. The statistical parameters evaluated were the value of R 2 , the lack of fit (LOF), the p value, and the F value [42]. A regression model with a R 2 value greater than 0.9 is considered to have a high correlation between the experimental and predicted values [42]. In this study, the R 2 correlation factor obtained was 0.9988, indicating an excellent correlation and a satisfactory model for predicting the best conditions for MO degradation using the Gd2O3-ZIF-8 nanocomposites. The p value is an indicator of the statistical significance and interaction ability of each variable, wherein variables with lower p values have greater significance. In the present study, ANOVA for the regression model was highly significant because of the very small p value ˂ 0.0001, and a correspondingly large F value (710.13) was obtained. The lack of fit value obtained for the F value was 2.02 and had a larger p value (0.3762) > 0.05, indicating that the lack of fit was not significant [42,43,44,45]. Therefore, the regression model is reliable for predicting the effects of variables affecting the photocatalytic degradation of MO by the Gd2O3-ZIF-8 nanocomposites and can be used to direct the design space.
The linear and quadratic terms that affect the photocatalytic degradation of MO were highly significant, with p ˂ 0.0001. Meanwhile, the interaction terms X1X2 and X1X4 were significant, with p ˂ 0.0001 (Table 4) [16]. However, the interaction term X1X3 was not significant within the range assessed in this study. In Figure 6, the influence of a single factor on the degradation of MO was evaluated when all the other factors were maintained at the constant values for which the coded values of these factors are zero and lie between their low and high values. The pH and MO concentration negatively affected the photocatalytic degradation of MO. The efficiency of the photocatalytic degradation of MO decreased as the pH of the solution increased from 3 to 7. (X2) and (X4) showed a positive effect on the photocatalytic degradation. The photocatalytic degradation of MO using the Gd2O3-ZIF-8 nanocomposites showed an upward trend with an increase in (X2) and (X4). This increase is attributed to the increase in the number of active sites on the photocatalyst surface.
Figure 8a,b show the interaction between the pH and photocatalyst dose at constant concentrations of MO and H2O2. Figure 8c,d show the interaction between the pH and concentration of H2O2 at constant concentrations of MO and the photocatalyst. The results clearly show that the effect of pH was more significant than those of the other factors in the photocatalytic degradation of MO, which could be attributed to the surface charge of the photocatalyst and the structural change of MO under different solution pH values. In runs 1 and 23, the degradation efficiency increased from 46.93% to 75.89% when the solution pH decreased from 7 to 3. The photocatalytic degradation efficiency increased from 43.85 to 57.62% when the catalyst dose increased from 0.1 g/L in run 8 to 0.5 g/L in run 15. In addition, when the concentration of H2O2 increased from 111 mg/L to 555 mg/L, the degradation efficiency increased from 32.12% to 48.63%. Meanwhile, the interaction between both factors was highly significant (p < 0.0001). This suggests that a high percentage of MO degradation can be achieved with a high H2O2 concentration as well as a low pH, which can be seen from the direct proportionality between the H2O2 concentration and the pH in Figure 8c,d. In addition, a high concentration of H2O2 and photocatalyst at low pH increased the availability of local electrons on the surface of the photocatalyst, thereby increasing the photocatalytic degradation rate. In general, the photocatalytic degradation of MO increased when a larger amount of photocatalyst was used in the reaction because the number of active sites increased when there was a high surface-to-volume ratio. In addition, the abundant availability of active sites allowed ·OH radicals and MO to be easily adsorbed onto the surface of the photocatalyst followed by the fast exchange of electrons between the reactants. As a result, MO degradation occurred rapidly. However, a slight decline in the photocatalytic degradation percentage was observed when the amount of photocatalyst used exceeded the optimal dosage.

2.7. Optimum Condition and Model Verification

Within the experimental conditions of the parameters we used, the RSM method was to determine the optimal condition for the photocatalytic degradation of MO. Therefore, we have limited experimental conditions for the following: The pH ranges from 3 to 7, the dose of catalyst ranges from 0.1 g/L to 0.5 g/L, the concentration of MO ranges from 0.0630 mM to 0.1050 mM, and the concentration of H2O2 ranges from 111 mg/L to 555 mg/L.
The optimization function in Design Expert 11.0 was used to obtain the optimum conditions for the photocatalytic degradation of MO under four constraints: (1) The maximum photocatalytic degradation percentage was 97.24% at the initial pH of 3.3, photocatalyst dose of 0.4 g/L, MO concentration of 0.0635 mM, and H2O2 concentration of 431 mg/L. The experiment showed a photocatalytic degradation percentage of 98.05% under the optimum conditions compared with the photocatalytic degradation of 97.24% obtained from the regression model. In addition, the conditions for obtaining the highest MO photocatalytic degradation percentage at (2) the minimum weight of photocatalyst, (3) the minimum volume of H2O2, and (4) neutral pH are also listed in Table 5 [45]. The results show that the experimental design was effectively applied for optimizing the photocatalytic degradation of MO.

3. Materials and Methods

3.1. Materials

Gadolinium nitrate hexahydrate (Gd(NO3)3·6H2O), ethylamine (C2H5NH2), zinc acetate dihydrate (Zn(CH3COO)2·2H2O), 2-methylimidazole (CH2C3H3N2), polyvinylpyrrolidone ((C6H9NO)n, average mol wt. 10,000, PVP), methyl orange (C14H14N3NaO3S, MO), and hydrogen peroxide (H2O2, 30%, w/w) were purchased from Yakuri Pure Chemicals (Tokyo, Japan), Sigma-Aldrich (St. Louis, MO, USA), Merck (KGaA, Darmstadt, Germany), and Daejung Chemicals (Siheung, Korea). All the chemicals were used without further purification.

3.2. Measurement Methods

The structure pattern and average crystallite size of Gd2O3-ZIF-8 nanocomposites were investigated using an X-ray diffractometer (Bruker, D8 ADVANCE, Karlsruhe, Germany) with a Cu Kα radiation source (0.1504 nm). The morphology of the synthesized Gd2O3-ZIF-8 nanocomposite photocatalyst was observed at an accelerating voltage of 10–20 kV using scanning electron microscopy (SEM, JEOL Ltd., JSM-6510, Tokyo, Japan). The vibrational states of the synthesized Gd2O3-ZIF-8 nanocomposites were investigated by Raman spectroscopy (532 nm excitation, BWTEK i-Raman Plus, Newark, DE, USA). Photocatalytic degradation of the MO dye was carried out using a UV lamp (Light intensity is 4 W, 254 nm) and was confirmed by UV-vis spectroscopy (Shimazu UV-1601 PC, Tokyo, Japan). The color of MO dye solution was observed using a color spectrophotometer (Colormate, Scinco, Seoul, Korea).

3.2.1. Preparation of Gd2O3 Nanowires

Gd2O3 nanowires were synthesized using the following hydrothermal procedure: 0.9 g of Gd(NO3)3·6H2O was dissolved in 25 mL of deionized water. 0.5 mL of C2H5NH2 was then added slowly to the Gd(NO3)3 aqueous solution under vigorous stirring. The obtained white precipitate solution was heated for 12 h in an oven at 120 °C. The mixture was centrifuged several times after cooling and washed with deionized water to obtain gadolinium hydroxide. The gadolinium hydroxide was dried at 80 °C in an oven and then annealed in an electric furnace at 700 °C for 4 h in an Ar atmosphere to obtain Gd2O3 [22].

3.2.2. Ultrasound Assisted Synthesis of Gd2O3-ZIF-8 Nanocomposites

Gd2O3 nanowires (10 mg), PVP (0.1 g), and 2-methylimidazole (0.263 g) were dispersed in 20 mL of methanol with stirring for 30 min. 20 mL of a methanol solution of Zn(CH3COO)2·2H2O (0.146 g) was then added to the solution. The solution was sonicated for 30 min at 750 W. The precipitate was washed several times with methanol and collected after centrifugation to obtain the Gd2O3-ZIF-8 nanocomposites [46].

3.2.3. Photocatalytic Activity of MO Degradation using Gd2O3-ZIF-8 Nanocomposites

The photocatalytic degradation of MO by the Gd2O3-ZIF-8 nanocomposites was performed in an aqueous MO dye solution under UV irradiation at 254 nm.
The initial pH values were adjusted to 3, 5, and 7 using 1 M aqueous HCl solution. The photocatalyst was added to the prepared MO solution and kept under constant stirring in the dark for adsorption. After adsorption-desorption equilibrium was reached between the MO dye and the catalyst in the solution for 30 min, the solution was irradiated under UV light at 254 nm with regular intervals, after which the photocatalytic degradation of MO was observed by UV-vis spectrophotometry. The photocatalytic degradation efficiency was measured using the following equation (Equation (5)) [21,47]:
Photocatalytic   degradation   efficiency   ( % ) = C 0 C / C 0   ×   100
where C0 is the initial MO concentration after adsorption-desorption equilibrium has been reached under dark conditions (t = 0), and C is the MO concentration after 40 min. The values for the photocatalytic degradation of MO are shown in Table 2.

3.2.4. Evaluation of Color Change during Photocatalytic Degradation of MO

The CIELAB method was used to determine the color parameters L, a, and b. L indi -cates the lightness, and a and b are the chromaticity coordinates. The a parameter represents the red (+) to green (−) components. The b parameter represents the yellow (+) to blue (−) components. L can vary from white (100) to black (0) [48]. The colors of the initial and final solutions were measured using a color spectrophotometer. The total color change (ΔE) for each solution was calculated as follows:
Δa = a0at
Δb = b0bt
ΔL = L0Lt
ΔE = (Δa2 + Δb2 + ΔL2)1/2
where a0, b0, and L0 are the initial color parameters; at, bt, and Lt the final parameters at the reaction time t (min); and Δa, Δb, and ΔL are the differences between the initial and final parameter values [34,35].

3.2.5. Experimental Design with RSM

The experimental design was based on the Box-Behnken design (BBD) with four factors at three levels. Table 1 shows the independent variables, experimental ranges, and coded levels of the tested variables in the BBD. The initial pH ( X 1 ), dose of catalyst ( X 2 ), concentration of MO ( X 3 ), and concentration of H2O2 ( X 4 ) were selected as the independent variables. The predicted photocatalytic degradation efficiency of MO (Y) was used as the dependent variable. A quadratic polynomial equation (Equation (10)) was used to fit the response variables [20,45]:
Y =   β 0   + i = 1 k β i X i   +   i = 1 k β i i X i 2   +   i = j k 1 j = i + 1 k β i j X i X j
where β 0 is a constant coefficient, β i are the linear interaction coefficients, β i i are the quadratic interaction coefficients, β i j are the cross-factor interaction coefficients, k is the number of factors investigated in the experiment, and X i , and X j are independent variables [45]. In the analysis of variance (ANOVA), the significance and suitability of the model were assessed using the lack of fit (LOF), F value, p value, and coefficient of determination ( R 2 ). Surface plots (3D) and contour plots (2D) of MO photocatalytic degradation efficiency (%) were employed to demonstrate the effect of two interaction variables on the response (% degradation) based on the model Equation (10).

4. Conclusions

In this study, Gd2O3-ZIF-8 nanocomposites were successfully prepared using an ultrasound-assisted synthesis method and characterized by XRD, Raman spectroscopy, SEM, and UV-vis spectroscopy. The photocatalytic degradation of MO using Gd2O3-ZIF-8 nanocomposites as catalyst under various conditions was studied in detail. The color changes between the initial and final Lab values were confirmed in the coordinate diagram. The optimization of the MO photocatalytic degradation process was studied using response surface methodology based on the Box–Behnken design. The proposed regression model was highly reliable. Under optimal conditions (pH 3.3, 431 mg/L of H2O2, 0.0635 mM of MO, and 0.4 g/L of photocatalyst), the photocatalytic degradation percentage of MO was 98.05% after 40 min. The photocatalytic degradation of MO using Gd2O3-ZIF-8 nanocomposites was found to follow the pseudo-first-order kinetics rate law.

Supplementary Materials

The following are available online at https://www.mdpi.com/article/10.3390/catal11091022/s1, Figure S1: (a) UV-vis spectrum and (b) Tauc’s plot for the bandgap energy of the Gd2O3-ZIF-8 nanocomposites, Figure S2: Kinetics study for photocatalytic degradation of MO (a) first-order kinetic model and (b) second-order kinetic model, Figure S3: Predicted photocatalytic degradation percentage of MO using Design Expert 11 statistical software (Stat-Ease, Minneapolis, MN, USA).

Author Contributions

Conceptualization, W.-B.K.; methodology, S.-G.J., J.-W.K.; writing—original draft preparation, S.-G.J., J.-W.K.; writing—review and editing, W.-B.K. All authors have read and agreed to the published version of the manuscript.

Funding

This research was supported by research foundation of Sahmyook University.

Data Availability Statement

In the data presented in this study are available in article.

Conflicts of Interest

The author declare that they have no conflict of interest.

References

  1. Ghiasi, E.; Azim, M. Removal of various textile dyes using LaMn(Fe)O3 and LaFeMn0.5O3 nanoperovskites; RSM optimization, isotherms and kinetics studies. J. Inorg. Organomet. Ploym. Mater. 2020, 30, 2789–2804. [Google Scholar] [CrossRef]
  2. Zhang, M.; Shang, Q.; Wan, Y.; Cheng, Q.; Liao, G.; Pan, Z. Self-template synthesis of double-shell TiO2@ ZIF-8 hollow nanospheres via sonocrystallization with enhanced photocatalytic activities in hydrogen generation. Appl. Catal. B Environ. 2019, 241, 149–158. [Google Scholar] [CrossRef]
  3. Wang, Y.; Zhou, S.; Zhao, G.; Li, C.; Liu, L.; Jiao, F. Fabrication of SnWO4/ZnFe-layered double hydroxide composites with enhanced photocatalytic degradation of methyl orange. J. Mater. Sci. Mater. Electron. 2020, 31, 12269–12281. [Google Scholar] [CrossRef]
  4. Dhanalakshmi, S.; Kumar, P.S.; Karuthapandian, S.; Muthuraj, V.; Prithivikumaran, N. Design of Gd2O3 nanorods: A challenging photocatalyst for the degradation of neurotoxicity chloramphenicol drug. J. Mater. Sci. Mater. Electron. 2019, 30, 3744–3752. [Google Scholar] [CrossRef]
  5. Surendra, T.V.; Mohana, R.S.; Khan, M.R. Biogenic approach to synthesize rod shaped Gd2O3 nanoparticles and its optimization using response surface methodology-Box–Behnken design model. Biotechnol. Prog. 2019, 3, e2823–e2834. [Google Scholar]
  6. Liu, Y.; Liu, Z.; Huang, D.; Cheng, M.; Zeng, G.; Lai, C.; Zhang, C.; Zhou, C.; Wang, W.; Jiang, D.; et al. Metal or metal-containing nanoparticle@ MOF nanocomposites as a promising type of photocatalyst. Coord. Chem. Rev. 2019, 388, 63–78. [Google Scholar] [CrossRef]
  7. Jing, H.P.; Wang, C.C.; Zhang, Y.W.; Wang, P.; Li, R. Photocatalytic degradation of methylene blue in ZIF-8. RSC Adv. 2014, 4, 54454–54462. [Google Scholar] [CrossRef]
  8. Qi, X.; Shang, F.; Wang, T.; Ma, Y.; Yan, Y. In situ coupling of TiO2(B) and ZIF-8 with enhanced photocatalytic activity via effective defect. CrystEngComm 2020, 22, 4250–4259. [Google Scholar] [CrossRef]
  9. Chen, Y.; Li, J.; Yue, G.; Luo, X. Novel Ag@nitrogen-doped porous carbon composite with high electrochemical performance as anode materials for lithium-ion batteries. Nano-Micro Lett. 2017, 9, 32–42. [Google Scholar] [CrossRef] [PubMed] [Green Version]
  10. Faraji, A.; Mehrdadi, N.; Mahmoodi, N.M.; Pardakhti, A. Enhanced photocatalytic activity by synergic action of ZIF-8 and NiFe2O4 under visible light irradiation. J. Mol. Struct. 2021, 1223, 129028. [Google Scholar] [CrossRef]
  11. Li, R.; Li, W.; Jin, C.; He, Q.; Wang, Y. Fabrication of ZIF-8@ TiO2 micron composite via hydrothermal method with enhanced absorption and photocatalytic activities in tetracycline degradation. J. Alloys Compd. 2020, 825, 154008–154017. [Google Scholar] [CrossRef]
  12. Zeng, X.; Huang, L.; Wang, C.; Wang, J.; Li, J.; Luo, X. Sonocrystallization of ZIF-8 on electrostatic spinning TiO2 nanofibers surface with enhanced photocatalysis property through synergistic effect. ACS Appl. Mater. Inter. 2016, 8, 20274–20282. [Google Scholar] [CrossRef]
  13. Zheng, H.B.; Wu, D.; Wang, Y.L.; Liu, X.P.; Gao, P.Z.; Liu, W.; Rebrov, E.V. One-step synthesis of ZIF-8/ZnO composites based on coordination defect strategy and its derivatives for photocatalysis. J. Alloys Compd. 2020, 838, 155219–155229. [Google Scholar] [CrossRef]
  14. Chandra, R.; Singh, V.; Tomar, S.; Nath, M. Multi-core-shell composite SnO2 NPs@ZIF-8: Potential antiviral agent and effective photocatalyst for waste-water treatment. Environ. Sci. Pollut. Res. 2019, 26, 23346–23358. [Google Scholar] [CrossRef]
  15. Garcia, B.B.; Lourinho, G.; Romano, P.; Brito, P.S.D. Photocatalytic degradation of swine wastewater on aqueous TiO2 suspensions: Optimization and modeling via Box-Behnken design. Heliyon 2020, 6, e03293–e03300. [Google Scholar] [CrossRef] [PubMed]
  16. Gholamnia, R.; Abtahi, M.; Saeedi, R.; Khaloo, S.S. Synthesis and characterization of a new magnetic adsorbent for removal of 4-nitrophenol: Application of response surface methodology. Water Sci. Technol. 2019, 80, 1430–1442. [Google Scholar] [CrossRef]
  17. Azimi, F.; Nabizadeh, R.; Hassanvand, M.S.; Rastkari, N.; Nazmara, S.; Naddafi, K. Photochemical degradation of toluene in gas-phase under UV/visible light graphene oxide-TiO2 nanocomposite: Influential operating factors, optimization, and modeling. J. Environ. Health Sci. 2019, 17, 671–683. [Google Scholar] [CrossRef]
  18. Chawla, P.; Sharma, S.K.; Toor, A.P. Optimization and modeling of UV-TiO2 mediated photocatalytic degradation of golden yellow dye through response surface methodology. Chem. Eng. Commun. 2019, 206, 1123–1138. [Google Scholar] [CrossRef]
  19. Mortazavian, S.; Saber, A.; James, D.E. Optimization of photocatalytic degradation of Acid Blue 113 and Acid Red 88 textile dyes in a UV-C/TiO2 suspension system: Application of response surface methodology (RSM). Catalysts 2019, 9, 360. [Google Scholar] [CrossRef] [Green Version]
  20. Ghadiri, S.K.; Alidadi, H.; Tavakkoli, N.N.; Javid, A.; Roudbari, A.; Talebi, S.S.; Rezania, S. Valorization of biomass into amine-functionalized bio graphene for efficient ciprofloxacin adsorption in water-modeling and optimization study. PLoS ONE 2020, 15, e0231045–e0231063. [Google Scholar] [CrossRef] [Green Version]
  21. Nam, S.N.; Cho, H.; Han, J.; Her, N.; Yoon, J. Photocatalytic degradation of acesulfame K: Optimization using the Box–Behnken design (BBD). Process Saf. Environ. Prot. 2018, 113, 10–21. [Google Scholar] [CrossRef]
  22. Kang, J.G.; Min, B.K.; Sohn, Y. Synthesis and characterization of Gd(OH)3 and Gd2O3 nanorods. Ceram. Int. 2015, 41, 1243–1248. [Google Scholar] [CrossRef]
  23. Paul, A.; Vyas, G.; Paul, P.; Srivastava, D.N. Gold-nanoparticle-encapsulated ZIF-8 for a mediator-free enzymatic glucose sensor by amperometry. ACS Appl. Nano Mater. 2018, 1, 3600–3607. [Google Scholar] [CrossRef]
  24. Zhou, K.; Mousavi, B.; Luo, Z.; Phatanasri, S.; Chaemchuen, S.; Verpoort, F. Characterization and properties of Zn/Co zeolitic imidazolate frameworks vs. ZIF-8 and ZIF-67. J. Mater. Chem. A 2017, 5, 952–957. [Google Scholar] [CrossRef]
  25. Pinheiro, D.; Devi, K.S.; Jose, A.; Karthik, K.; Sugunan, S.; Mohan, M.K. Experimental design for optimization of 4-nitrophenol reduction by green synthesized CeO2/g-C3N4/Ag catalyst using response surface methodology. J. Rare Earths 2020, 38, 1171–1177. [Google Scholar] [CrossRef]
  26. Jeon, S.; Ko, J.W.; Ko, W.B. Synthesis of Gd2O3 Nanoparticles and Their Photocatalytic Activity for Degradation of Azo Dyes. Catalysts 2021, 11, 742. [Google Scholar] [CrossRef]
  27. Tanaka, S.; Fujita, K.; Miyake, Y.; Miyamoto, M.; Hasegawa, Y.; Makino, T.; Denayer, J.F. Adsorption and diffusion phenomena in crystal size engineered ZIF-8 MOF. J. Phys. Chem. C 2015, 119, 28430–28439. [Google Scholar] [CrossRef] [Green Version]
  28. Kumari, G.; Jayaramulu, K.; Maji, T.K.; Narayana, C. Temperature induced structural transformations and gas adsorption in the zeolitic imidazolate framework ZIF-8: A Raman study. J. Phys. Chem. A 2013, 117, 11006–11012. [Google Scholar] [CrossRef] [PubMed]
  29. Liu, J.; Sun, Y.; Li, Z. Ag loaded flower-like BaTiO3 nanotube arrays: Fabrication and enhanced photocatalytic property. CrystEngComm 2012, 14, 1473–1478. [Google Scholar] [CrossRef]
  30. Chiu, Y.H.; Chang, T.F.M.; Chen, C.Y.; Sone, M.; Hsu, Y.J. Mechanistic insights into photodegradation of organic dyes using heterostructure photocatalysts. Catalysts 2019, 9, 430. [Google Scholar] [CrossRef] [Green Version]
  31. Wojnárovits, L.; Pálfi, T.; Takács, E. Kinetics and mechanism of azo dye destruction in advanced oxidation processes. Radiat. Phys. Chem. 2007, 76, 1497–1501. [Google Scholar] [CrossRef]
  32. Hsiao, P.H.; Timjan, S.; Kuo, K.Y.; Juan, J.C.; Chen, C.Y. Optical management of CQD/AgNP@ SiNW arrays with highly efficient capability of dye degradation. Catalysts 2021, 11, 399. [Google Scholar] [CrossRef]
  33. Hsiao, P.H.; Li, T.C.; Chen, C.Y. ZnO/Cu2O/Si nanowire arrays as ternary heterostructure-based photocatalysts with enhanced photodegradation performances. Nanoscale Res. Lett. 2019, 14, 244. [Google Scholar] [CrossRef] [PubMed] [Green Version]
  34. Polleto, M. Comparative study of wood flour photodegradation of two wood species submitted to artificial weathering. Maderas Cienc. Tecnol. 2017, 19, 141–148. [Google Scholar] [CrossRef] [Green Version]
  35. Baysal, E.; Degirmentepe, S.; Simsek, H. Some surface properties of thermally modified scots pine after artificial weathering. Maderas Cienc. Tecnol. 2014, 16, 355–364. [Google Scholar] [CrossRef] [Green Version]
  36. Lin, Y.P.; Mehrvar, M. Photocatalytic treatment of an actual confectionery wastewater using Ag/TiO2/Fe2O3: Optimization of photocatalytic reactions using surface response methodology. Catalysts 2018, 8, 409. [Google Scholar] [CrossRef] [Green Version]
  37. Sakthivel, S.; Neppolian, B.; Shankar, M.V.; Arabindoo, B.; Palanichamy, M.; Murugesan, V. Solar photocatalytic degradation of azo dye: Comparison of photocatalytic efficiency of ZnO and TiO2. Sol. Energy Mater. Sol. Cells 2003, 77, 65–82. [Google Scholar] [CrossRef]
  38. Hosseini, S.A.; Saeedi, R. Photocatalytic Degradation of Methyl Orange on Bi2O3 and Ag2O-Bi2O3 Nano Photocatalysts. Bull. Chem. React. Eng. Catal. 2017, 12, 96–105. [Google Scholar] [CrossRef] [Green Version]
  39. Ghavami, M.; Mohammadi, R.; Koohi, M.; Kassaee, M.Z. Visible light photocatalytic activity of reduced graphene oxide synergistically enhanced by successive inclusion of γ-Fe2O3, TiO2, and Ag nanoparticles. Mater. Sci. Semicond. Process 2014, 26, 69–78. [Google Scholar] [CrossRef]
  40. Haji, S.; Benstaali, B.; Al-Bastaki, N. Degradation of methyl orange by UV/H2O2 advanced oxidation process. Chem. Eng. Sci. 2011, 168, 134–139. [Google Scholar] [CrossRef]
  41. Elmolla, E.S.; Chaudhuri, M. Photocatalytic degradation of amoxicillin, ampicillin and cloxacillin antibiotics in aqueous solution using UV/TiO2 and UV/H2O2/TiO2 photocatalysis. Desalination 2010, 252, 46–52. [Google Scholar] [CrossRef]
  42. Pang, Y.L.; Law, Z.X.; Lim, S.; Chan, Y.Y.; Shuit, S.H.; Chong, W.C.; Lai, C.W. Enhanced photocatalytic degradation of methyl orange by coconut shell–derived biochar composites under visible LED light irradiation. Environ. Sci. Pollut. Res. 2021, 28, 27457–27473. [Google Scholar] [CrossRef]
  43. Sabour, M.R.; Amiri, A. Comparative study of ANN and RSM for simultaneous optimization of multiple targets in Fenton treatment of landfill leachate. Waste Manag. 2017, 65, 54–62. [Google Scholar] [CrossRef]
  44. Doğdu, O.G.; Baldan, P.N.; Ökten, H.E.; Yalçuk, A. A box–behnken design (Bbd) optimization of the photocatalytic degradation of 2, 4-dichlorophenoxyacetic acid (2, 4-d) using TiO2/H2O2. Desalin. Water Treat. 2018, 123, 188–195. [Google Scholar]
  45. Abd, R.N.F.; Shamsuddin, M. Catalytic reduction of 4-nitrophenol over biostabilized gold nanoparticles supported onto thioctic acid functionalized silica-coated magnetite nanoparticles and optimization using response surface methodology. Inorg. Nano-Metal Chem. 2020, 50, 489–500. [Google Scholar]
  46. Fu, F.; Zheng, B.; Xie, L.H.; Du, H.; Du, S.; Dong, Z. Size-controllable synthesis of zeolitic imidazolate framework/carbon nanotube composites. Crystals 2018, 8, 367. [Google Scholar] [CrossRef] [Green Version]
  47. Yan, S.C.; Li, Z.S.; Zou, Z.G. Photodegradation of rhodamine B and methyl orange over boron-doped g-C3N4 under visible light irradiation. Langmuir 2010, 26, 3894–3901. [Google Scholar] [CrossRef]
  48. Kurz, W.; Yetisen, A.K.; Kaito, M.V.; Fuchter, M.J.; Jakobi, M.; Elsner, M.; Koch, A.W. UV-Sensitive Wearable Devices for Colorimetric Monitoring of UV Exposure. Adv. Opt. Mater. 2020, 8, 1901969–1901977. [Google Scholar] [CrossRef] [Green Version]
Figure 1. XRD patterns of synthesized (a) ZIF-8, (b) Gd2O3, and (c) Gd2O3-ZIF-8 nanocomposites.
Catalysts 11 01022 g001
Figure 2. Raman spectra of the synthesized Gd2O3-ZIF-8 nanocomposites.
Catalysts 11 01022 g002
Figure 3. SEM images of (a) Gd2O3 nanowires, (b) ZIF-8, and (c) Gd2O3-ZIF-8 nanocomposites.
Catalysts 11 01022 g003
Figure 4. (a) UV-vis absorption spectra and (b) kinetics study of MO dye photocatalytic degradation.
Catalysts 11 01022 g004
Figure 5. The CIE chromaticity diagram for photocatalytic degradation of MO using Gd2O3-ZIF-8 nanocomposites.
Catalysts 11 01022 g005
Figure 6. The variation of the deviation from the reference point for photocatalytic degradation using Gd2O3-ZIF-8 nanocomposites with (a) X 1 : pH, (b) X 2 : dose of catalyst, (c) X 3 : concentration of MO, and (d) X 4 : concentration of H2O2.
Catalysts 11 01022 g006
Figure 7. Plot of the experimental and predicted response obtained for photocatalytic degradation of MO using Gd2O3-ZIF-8 nanocomposites.
Catalysts 11 01022 g007
Figure 8. Response surface graphs and plots for photocatalytic degradation (%): (a,b) between pH and catalyst dose with the remaining factors fixed at 0.084 mM MO concentration and 333 mg/L H2O2 concentration, and (c,d) between pH and H2O2 concentration with the remaining factors fixed at 0.3 g/L catalyst dose and 0.084 mM MO concentration.
Catalysts 11 01022 g008
Table 1. Time-dependent color changes of MO solution using Gd2O3-ZIF-8 nanocomposites as photocatalyst.
Times ΔL Δa Δb ΔE
0 min0000
10 min8.73−7.8−22.6825.52
20 min12.78−12.94−50.0654.11
30 min15.7−13.06−67.0670.10
40 min16.3−12.98−70.1573.17
Table 2. Experimental design levels of chosen model parameters.
Range and Levels
Independent VariablesUnitSymbolLow (−1)Medium (0)High (+1)
pH- X 1 357
Dose of catalystg/L X 2 0.10.30.5
Concentration of methyl orangemM X 3 0.06300.08400.1050
Concentration of H2O2mg /L X 4 111333555
Table 3. Experimental conditions of coded variables for the various runs of Box-Behnken design and the obtained experimental and predicted MO photocatalytic degradation percentages.
Degradation Percentage Degradation Percentage
Run X 1 X 2 X 3 X 4 ExperimentalPredictedRun X 1 X 2 X 3 X 4 ExperimentalPredicted
1101046.9346.2515011057.6258.39
2000064.7664.461600−1−152.2251.45
3001−132.1232.1117−10−1094.7995.74
4001148.6349.06180−10144.8044.43
5110050.3550.3019010−135.5436.18
6010159.5958.7820000063.7264.46
70−1−1069.7469.042110−1067.8568.68
80−11043.8543.892201−1076.0376.07
9−1−10067.8967.6023−101075.8975.34
10−100178.7879.54241−10045.9846.24
11−100−152.2952.0425−110085.6985.09
12000064.9064.46260−10−127.9128.99
13100142.6642.982700−1172.8872.55
14100−133.1232.44-------
Table 4. ANOVA of the BBD quadratic polynomial model for photocatalytic degradation of MO using Gd2O3-ZIF-8 nanocomposites.
SourceSum of SquaresDfMean SquareF Valuep Value
Model7655.6914546.84710.13<0.0001Significant
X 1 2364.7112364.713070.86<0.0001-
X 2 348.021348.02451.95<0.0001-
X 3 1375.6911375.691786.50<0.0001-
X 4 1085.6211085.621409.81<0.0001-
X 1 X 2 45.10145.1058.56<0.0001-
X 1 X 3 1.0311.031.340.2702-
X 1 X 4 71.86171.8693.32<0.0001-
X 2 X 3 13.96113.9618.130.0011-
X 2 X 4 12.79112.7916.610.0015-
X 3 X 4 4.3114.315.590.0357-
X 1 ²75.00175.0097.40<0.0001-
X 2 ²185.881185.88241.38<0.0001-
X 3 ²57.79157.7975.05<0.0001-
X 4 ²1445.0811445.081876.62<0.0001-
Residual9.24120.7700---
Lack of Fit8.41100.84082.020.3762Insignificant
Pure Error0.832320.4162---
Total7664.9426----
R2 = 0.9988; adequate precision = 102.0570.
Table 5. The obtained optimum conditions for the photocatalytic degradation of MO using Gd2O3-ZIF-8 nanocomposites.
NO.X1X2X3X4ExperimentalPredictedDeviation (%)
1.3.30.400.063543198.0597.240.82
2.3.00.100.063041985.2285.530.36
3.3.00.400.063020383.1083.630.64
4.7.00.390.063537568.2269.291.57
Publisher’s Note: MDPI stays neutral with regard to jurisdictional claims in published maps and institutional affiliations.

