Abstract
The present research reports the synthesis of ZrO2-doped TiO2 photocatalysts at different ZrO2 contents (1, 3 and 5% wt.) synthesized by the sol–gel method. The samples were characterized by transmission electron microscopy (TEM), scanning electron microscopy (SEM), X-ray diffraction, attenuated total reflectance-Fourier transform infrared, ultraviolet–visible, X-ray photoelectron spectroscopy and N2 adsorption–desorption analysis. The photocatalytic activity of the ZrO2-doped TiO2 was investigated against the dyes methyl orange and rhodamine B through mineralization studies. The ZrO2-doped TiO2 samples presented a semiglobular-ovoid agglomerate shape around 500–800 nm. The samples presented high crystallinity of the TiO2 anatase phase, XPS suggested the formation of Zr–O–Ti bonds and the samples were classified as mesoporous materials with slight changes in the optical features in comparison with pure TiO2. Our study shows that the ZrO2-doped TiO2 composites exhibited a higher photocatalytic activity than just utilizing the synthetized TiO2 and a commercial P25. The different degradation behaviors are attributed to differences in the textural properties, and to the different optical absorptions of the samples due to structural defects created by the level of doping of Zr4+ ions into the TiO2 lattice. Reaction kinetics parameters were calculated by the Langmuir–Hinshelwood model, and a third run cycle of the ZrO2-doped TiO2 at 1% wt. achieved a photocatalytic degradation of 78.1 and 75.5% for RhB and MO, respectively.
1. Introduction
Currently, there is a special interest in the elimination of synthetic dyes from fabric effluents that, in most of cases, have azo compounds [1,2]. The world manufacture of dyes is close to 800,000 tons per year, and between 10% and 15% of synthetic dyes are lost throughout the diverse processes of the fabric industry [3]. The release of dye effluents into water bodies is dangerous due to the high impact on the photosynthesis of aquatic organisms, as well as the carcinogenic nature and mutagenicity of dyes and their byproducts [4]. Therefore, the molecules that are a threat to the environmental balance and human health should be completely removed before being released to the environment through effluents.
On one hand, TiO2 is classified as an n-type semiconductor due to oxygen deficiency, and it is extensively used in the pharmaceutical and food industry, for hydrogen production and as a photocatalyst due to its good physical and chemical stability, low cost, easy preparation, reusability, optical electronic features and non-toxicity. In fact, its production and use are expected to increase by around 500% by the year 2025 [5]. However, due to its relatively high band gap (3.2 eV for the anatase phase), it uses only a particular fraction of the solar spectrum [6]. Furthermore, pure TiO2 presents a low quantum efficiency due to the fast recombination of its photogenerated species (e−/h+) [7]. The photoactivity of TiO2 is strongly delimited by factors such as the interaction between the active surface and the chemical nature of the pollutants, efficiency to prevent the charge transfer recombination and the type of reactive oxygen species created by the e-/h+ pairs in the aqueous medium [8,9]. TiO2 features can be improved by adding another metal oxide such as ZrO2, SiO2, La2O3 and Al2O3 to produce new crystalline phases with different features than the original oxides [10]. A diversity of surface modification approaches have been applied to improve the photocatalytic activity of TiO2. These chemical modifications include hybridization with other semiconductors through metal deposition, carbon material coating, non-metal doping and anion absorption [11]. The modifications are aimed to modify the band gap and/or extend the excitation wavelength, reduce the rate of charge carrier recombination, increase the stability of the photoactive crystalline phase and increase the quality and quantity of the surface-active sites [6].
On the other hand, zirconium oxide (ZrO2) is an n-type semiconductor, and it has demonstrated interesting features such as its thermal stability, surface area, porosity, non-toxicity, resistance to chemical corrosion and strong mechanical stability. These features are comparable to those of TiO2, and both oxides could have a better performance in photodegradation applications when formed as a composite [12,13,14]. Even though ZrO2 is considered as an inefficient photocatalyst due to its wide bad gap value (~5 eV), doping a small amount of ZrO2 into TiO2 has been reported to enhance the photoactivity of the mixed oxides TiO2-ZrO2 [10]. Furthermore, the incorporation of ZrO2 in the TiO2 network can avoid the anatase-to-rutile phase transformation, prolong the lifetime of photoinduced e-/h+ pairs, modify the surface acidity through OH groups, reduce the dielectric constant and the crystal size of TiO2, improve the thermal stability and increase the surface area, promoting photocatalytic activity [7,15,16]. TiO2 modified with ZrO2 can be prepared by methods such as coprecipitation, the sol–gel process, polymer gel templating, homogeneous precipitation, evaporation-induced self-assembly, hydrothermal methods and the microwave-assisted solution combustion method. Nevertheless, it is believed that the sol–gel method has advantages such as good homogeneity in the size and shape of particles, ease of composition control, reproducibility, a low temperature of reaction, an inexpensive equipment cost and good electrical and optical features to prepare nanomaterials in their mixed oxide form [16,17]. In the case of ZrO2-doped TiO2 used for photocatalytic applications, it has been thought that the photocatalytic activity of this type of material depends on the morphology, surface area, band gap energy and crystal size rearrangement. Nevertheless, a clear relationship between them has not been established [18].
In this context, Guerrero-Araque et al. [18] prepared ZrO2-TiO2 heterostructures with 5 mol % of ZrO2 synthesized by the sol–gel route and annealed at four different temperatures (300–600 °C) for the degradation of 2,4-dichlorophenol. They mentioned that the materials calcined at 400 and 500 °C presented a better degradation due to the optimum number of energetic states that act as electron traps and decrease the e-/h+ pair recombination, whereas for materials annealed at 300 and 600 °C, these energetic states act as an energy barrier that reduces the effective charge transfer. In other study, Yaacob et al. [10] prepared hybrid ZrO2-TiO2 photocatalysts synthesized through the sol–gel process and calcined at 500, 600 and 700 °C for their evaluation of phenol degradation. The authors found that the photodegradation activity for phenol was in the following order: ZrO2-TiO2 photocatalysts > pure TiO2 photocatalysts > pure ZrO2 photocatalysts. The higher photoactivity of ZrO2-TiO2 was attributed to the duration of the excitation of electrons from the hybrid photocatalysts, and most electrons from the conduction band of ZrO2 easily transferred to the conduction band of TiO2 from thermodynamic considerations, which inhibits the e-/h+ pair recombination. Both studies concluded that the modification of the textural properties such as the surface area, pore volume, pore diameter, crystallinity, crystal size and shape of the nanostructure plays an important role in the band gap values, which is related to photocatalytic activity of the photocatalyst. Precursors also play a role in the features of the mixed oxides ZrO2-TiO2. For example, chloride precursors such as ZrCl4 and TiCl4 for the synthesis of TiO2-ZrO2 metal oxides are widely used due to their low cost and availability. However, these precursors present disadvantages such as dimerization behavior [19]. The use of alkoxides for metal oxide synthesis presents advantages such as a high solubility, easy transformation into chemically reactive forms of hydrated oxides on hydrolysis and a high chemical quality of the final products, as well as control of the nanoparticle size [20,21,22]. It must be highlighted that the physicochemical properties are strongly related to the chemical nature of the precursor, the synthesis method and the thermal treatment.
In this work, we report the synthesis of TiO2-ZrO2 nanocomposites as photocatalysts at different Zr4+ contents prepared by the sol–gel route for the photodegradation of RhB and MO. Therefore, with the proposed contents of ZrO2 (1, 3 and 5% wt.) into the TiO2 lattice, we try to elucidate an optimum % wt. to determine the saturation limit by avoiding deformation of the TiO2 lattice, and to obtain a better photodegradation percentage using, as model molecules, the MO and RhB molecules with a high presence in wastewater from the textile industry [23].
2. Results
2.1. X-ray Diffraction
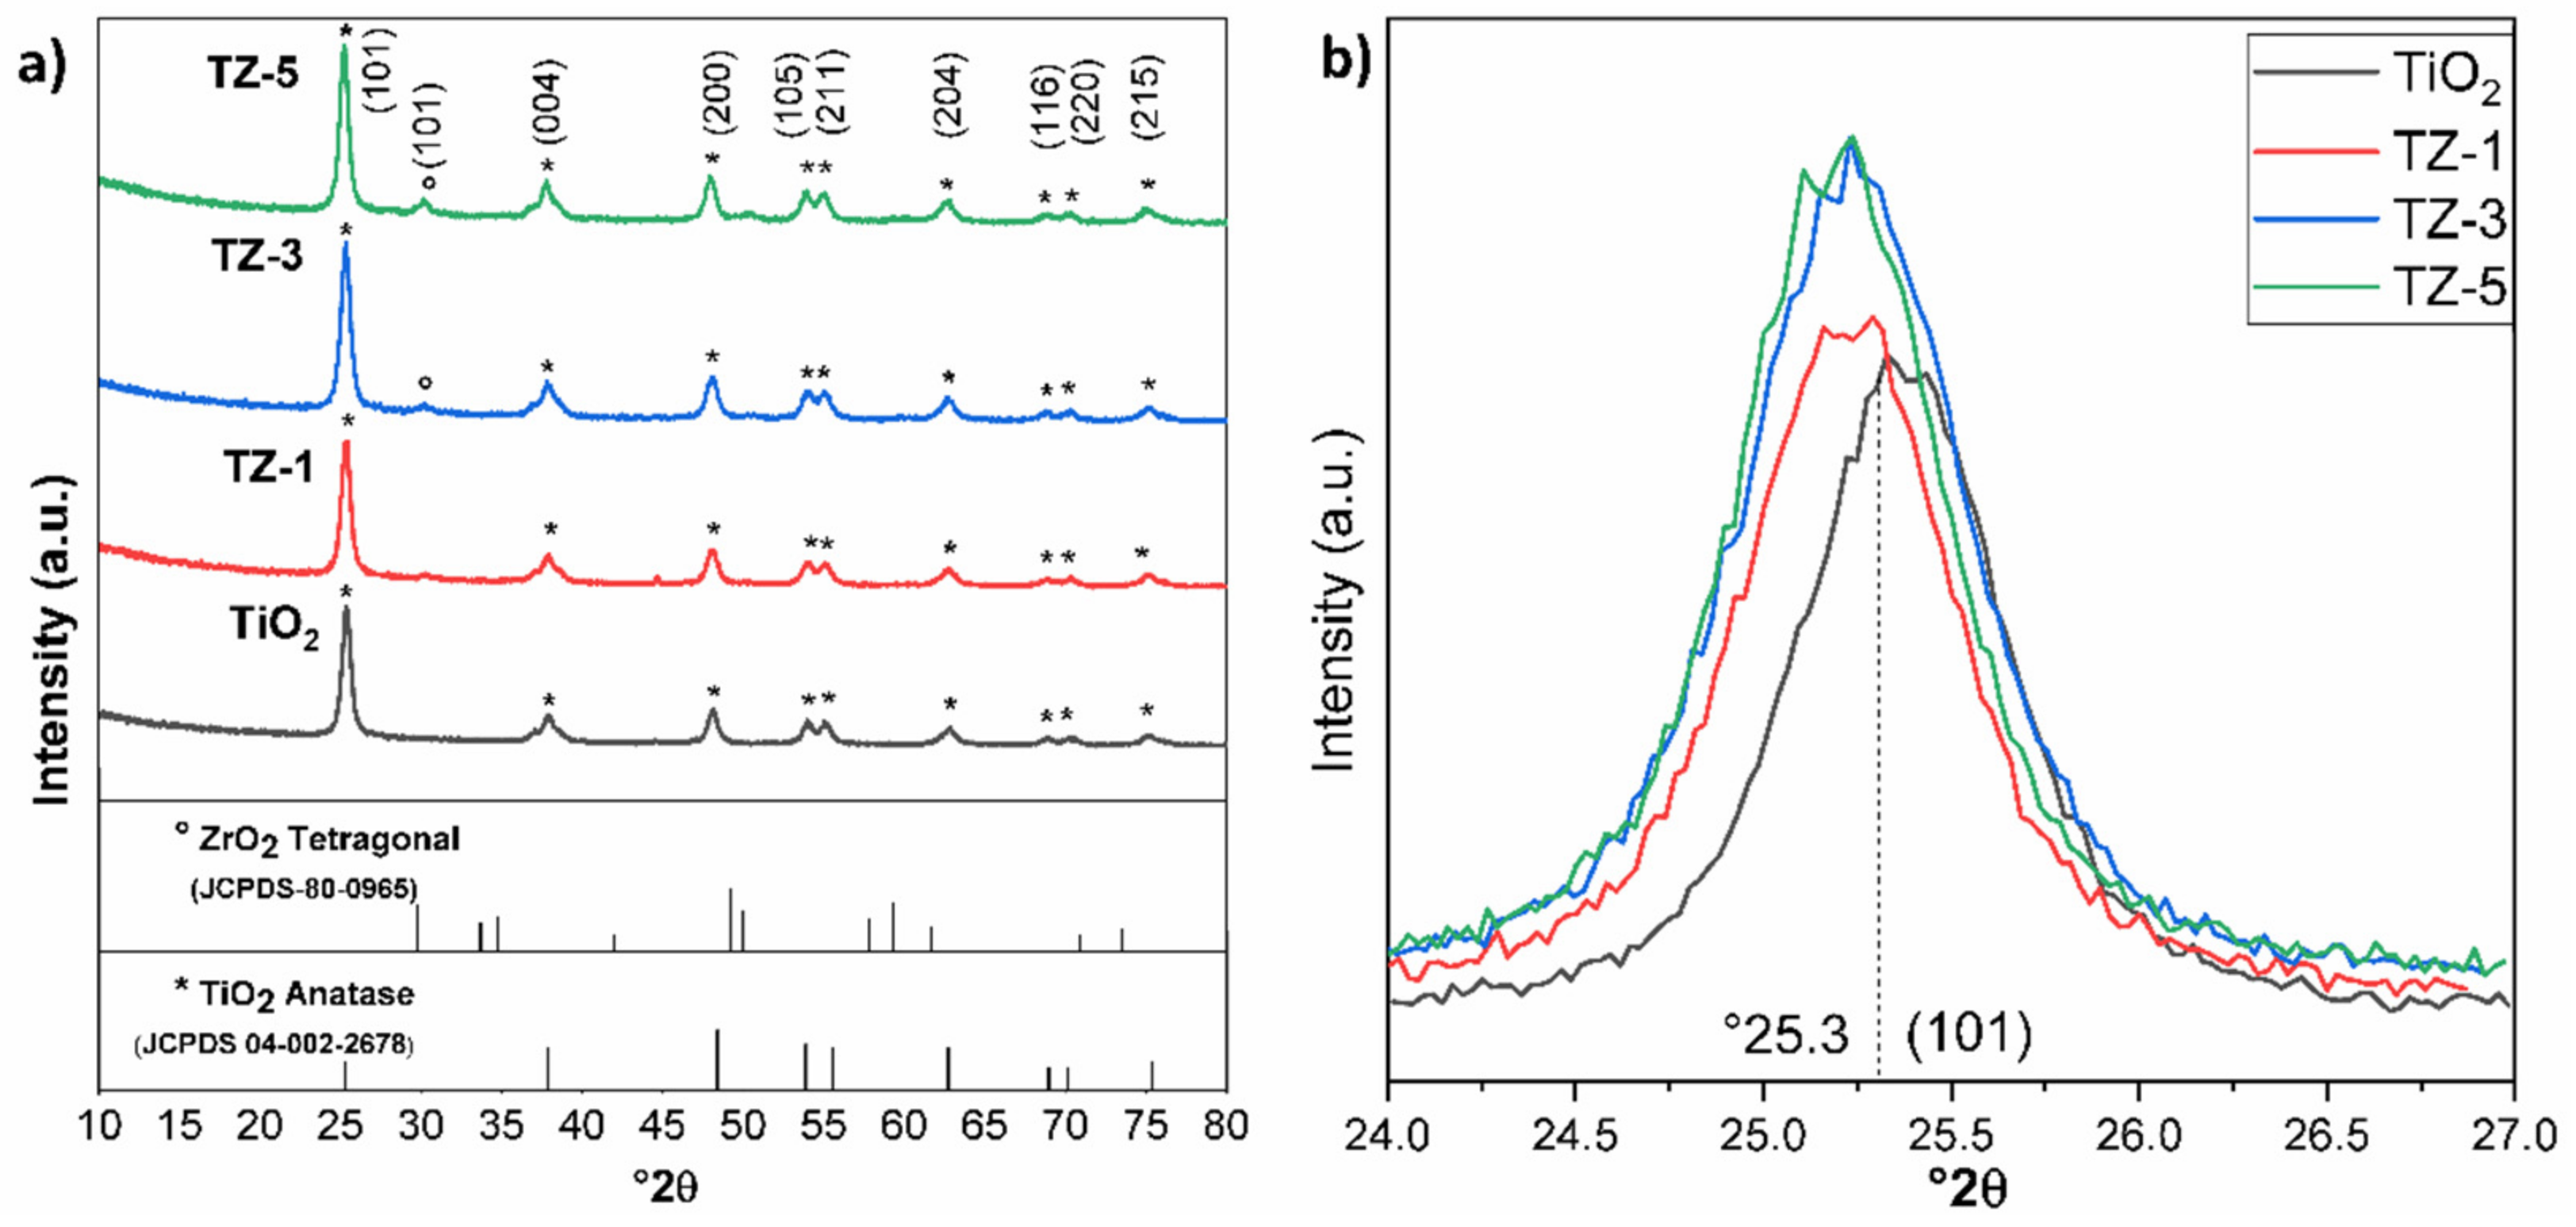
Figure 1a shows the X-ray diffraction patterns of the samples. The X-ray pattern of TiO2 shows well-defined signal characteristics of the anatase phase (JCPDS 04-002-2678) at 25.3°, 37.8°, 48.06°, 53.8°, 55.07°, 62.7° 68.8°, 70.3° and 75°. These signals are related to the diffraction planes (Miller index) of (101), (004), (200), (105), (211), (204), (116), (220) and (215), respectively [24]. The same diffraction signals were found for the ZrO2-doped TiO2 photocatalysts prepared with different ZrO2 loads (1, 3 and 5% wt.). The shapes of the well-defined peaks are an indication that the nanomaterials were well crystallized. These results point out that the anatase phase was kept even after the addition of ZrO2. When the TiO2 was doped with 1% wt. of ZrO2, no diffraction signals belonging to ZrO2 were observed. However, a very small diffraction signal was observed approximately at 30.05° corresponding to the (101) diffraction plane of the tetragonal phase of pure ZrO2 (JCPDS-80-0965) [15] at 3 and 5% wt. of the Zr4+ content. This small signal at 30.05° suggests that ZrO2 is dispersed on the TiO2 surface nanoparticle, forming a segregation of polycrystalline structures for the TZ-3 and TZ-5 samples. In this sense, Thejaswini et al. [25] prepared mesoporous worm-like ZrO2-doped (1, 2, 3, 4 and 5 molar % ratios) TiO2 monolith materials for Naphthol Green B photodegradation, achieving ≥99% dye dissipation under optimized experimental conditions, where the highest molar ratio did not show any other crystallinity phase. Recently, Q. Li et al. [26] studied the photocatalytic degradation of MO using mesoporous composite materials m-TiO2-ZrO2 with 1, 3 and 5 molar ratios of Zr. In their XRD, it was possible to observe that at the 5 molar ratios of Zr, diffraction signals belonging to ZrO2 were present. However, at lower molar ratios, no diffraction signals of ZrO2 were seen. In other study, Pirzada et al. [7] prepared TiO2/ZrO2 nanocomposite heterostructures via the sol–gel process from ZrOCl2 and titanium (IV) isopropoxide, with Zr/Ti molar ratios of 3, 6, 9, 12 and 15%. In their study, the authors mentioned that only the presence of the anatase phase with a substantial appearance of tetragonal ZrO2 peaks was seen for the samples with 9, 12 and 15% Zr/Ti molar ratios.
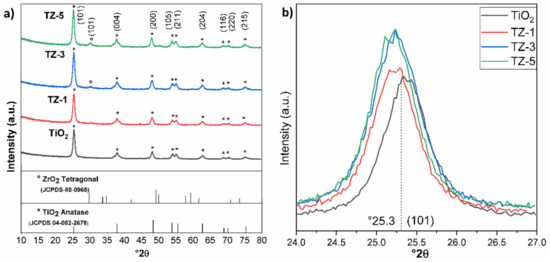
Figure 1.
XRD patterns of the nanocomposite samples. (a) shows the different ZrO2 contents, and (b) shows the amplification of the strongest reflection at 2θ = 25.3°.
On the other hand, Figure 1b shows a slight shift in the diffraction signal in comparison with TiO2. This displacement is due to the incorporation of Zr4+ which causes an increase in the lattice parameters of TiO2 anatase, thus slightly shifting the maximum of the peak to a lower angle for the TiO2-ZrO2 samples [25,27]. However, for the TZ-3 and TZ-5 samples, a segregation of the crystalline phases was seen due to the saturation of Zr4+ ions inside the TiO2 structure, which generated the formation of ZrO2 crystals on the TiO2 anatase structural surface, creating polycrystalline phases. Results with a slight shift were reported by Thejaswini et al. [25], where a slight peak deviation of 2θ was observed from 25.5 to 25.3 (101) for the TiO2-ZrO2 monoliths in comparison to pure TiO2 anatase.
The obtained values of the crystal size shown in Table 1 suggest that increasing the Zr4+ amount reduces the crystal size of the photocatalysts. The reduction in the crystal size with the increased amount of Zr4+ ions is attributed to several causes, mainly a reduction in the nanoparticle nucleation during hydrolysis/condensation, a decrement in the grain boundaries during the sintering process, dissimilar nuclei and the coordination geometry [7,15,28]. The approximate crystallite sizes of TiO2 and the TiO2-ZrO2 nanocomposite were calculated with Scherrer’s equation [29].

Table 1.
Physicochemical properties of TiO2, TZ-1, TZ-3 and TZ-5 samples.
2.2. TEM-SAED Images
Figure 2a,e show the HR-TEM for the TZ-1 and TZ-5 photocatalysts, which show an interlayer spacing (d) value of 0.353 and 0.356 nm, respectively. These values also support the existence of the anatase phase structure of TiO2 and correspond to the (101) lattice planes of anatase [30]. The differences in the d-spacing between the TZ-1 sample (0.353 nm) and pure TiO2 (0.348 nm) are a strong indication of the incorporation of Zr4+ into the TiO2 structure [31]. On the other hand, Figure 2b,f show the selected area of electron diffraction of the TZ-1 and TZ-5 samples, where the rings and the similar diffraction patterns are indicative of the TiO2 anatase phase. The rings belonging to the TZ-1 sample (Figure 2b) present homogeneity in shape and agree with the XRD results. However, for the TZ-5 sample (Figure 2f), it is important to highlight that it shows discontinuous rings with spots which suggest that the nanoparticles are formed of larger crystallites according to the results found by Maurya and Bhatia et al. [32]. In addition, the values of d-spacing found from the ring patterns agree, within acceptable limits, with the reported d-spacing values for the anatase phase according to JCPDS (04-002-2678). Figure 2d,h present the nanoparticle size distribution belonging to the TZ-1 and TZ-5 samples. The measured average nanoparticle size was 11.3 ± 2.8 and 11.25 ± 4 nm for TZ-1 and TZ-5, respectively. In this sense, N. Yaacob et al. [33] mentioned that a TiO2 nanoparticle size under 14 nm suggests that the anatase phase nanoparticles are highly stable. In addition, it has been reported that the aggregation and crystallization of TiO2 are associated with the synthesis route. Furthermore, the calcination temperature and the precursor concentration are other factors that favor the agglomeration and crystallization of nanoparticles during synthesis by the sol–gel method [34].
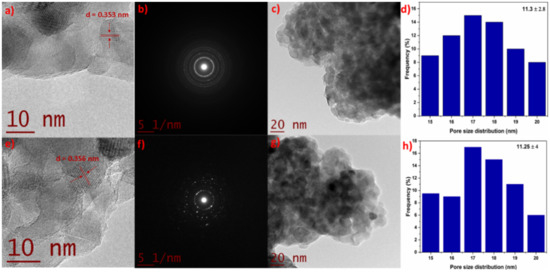
Figure 2.
HR-TEM, SAED pattern, TEM and the size distribution of TZ-1 (a–d) and TZ-5 (e–h) samples.
2.3. SEM Studies
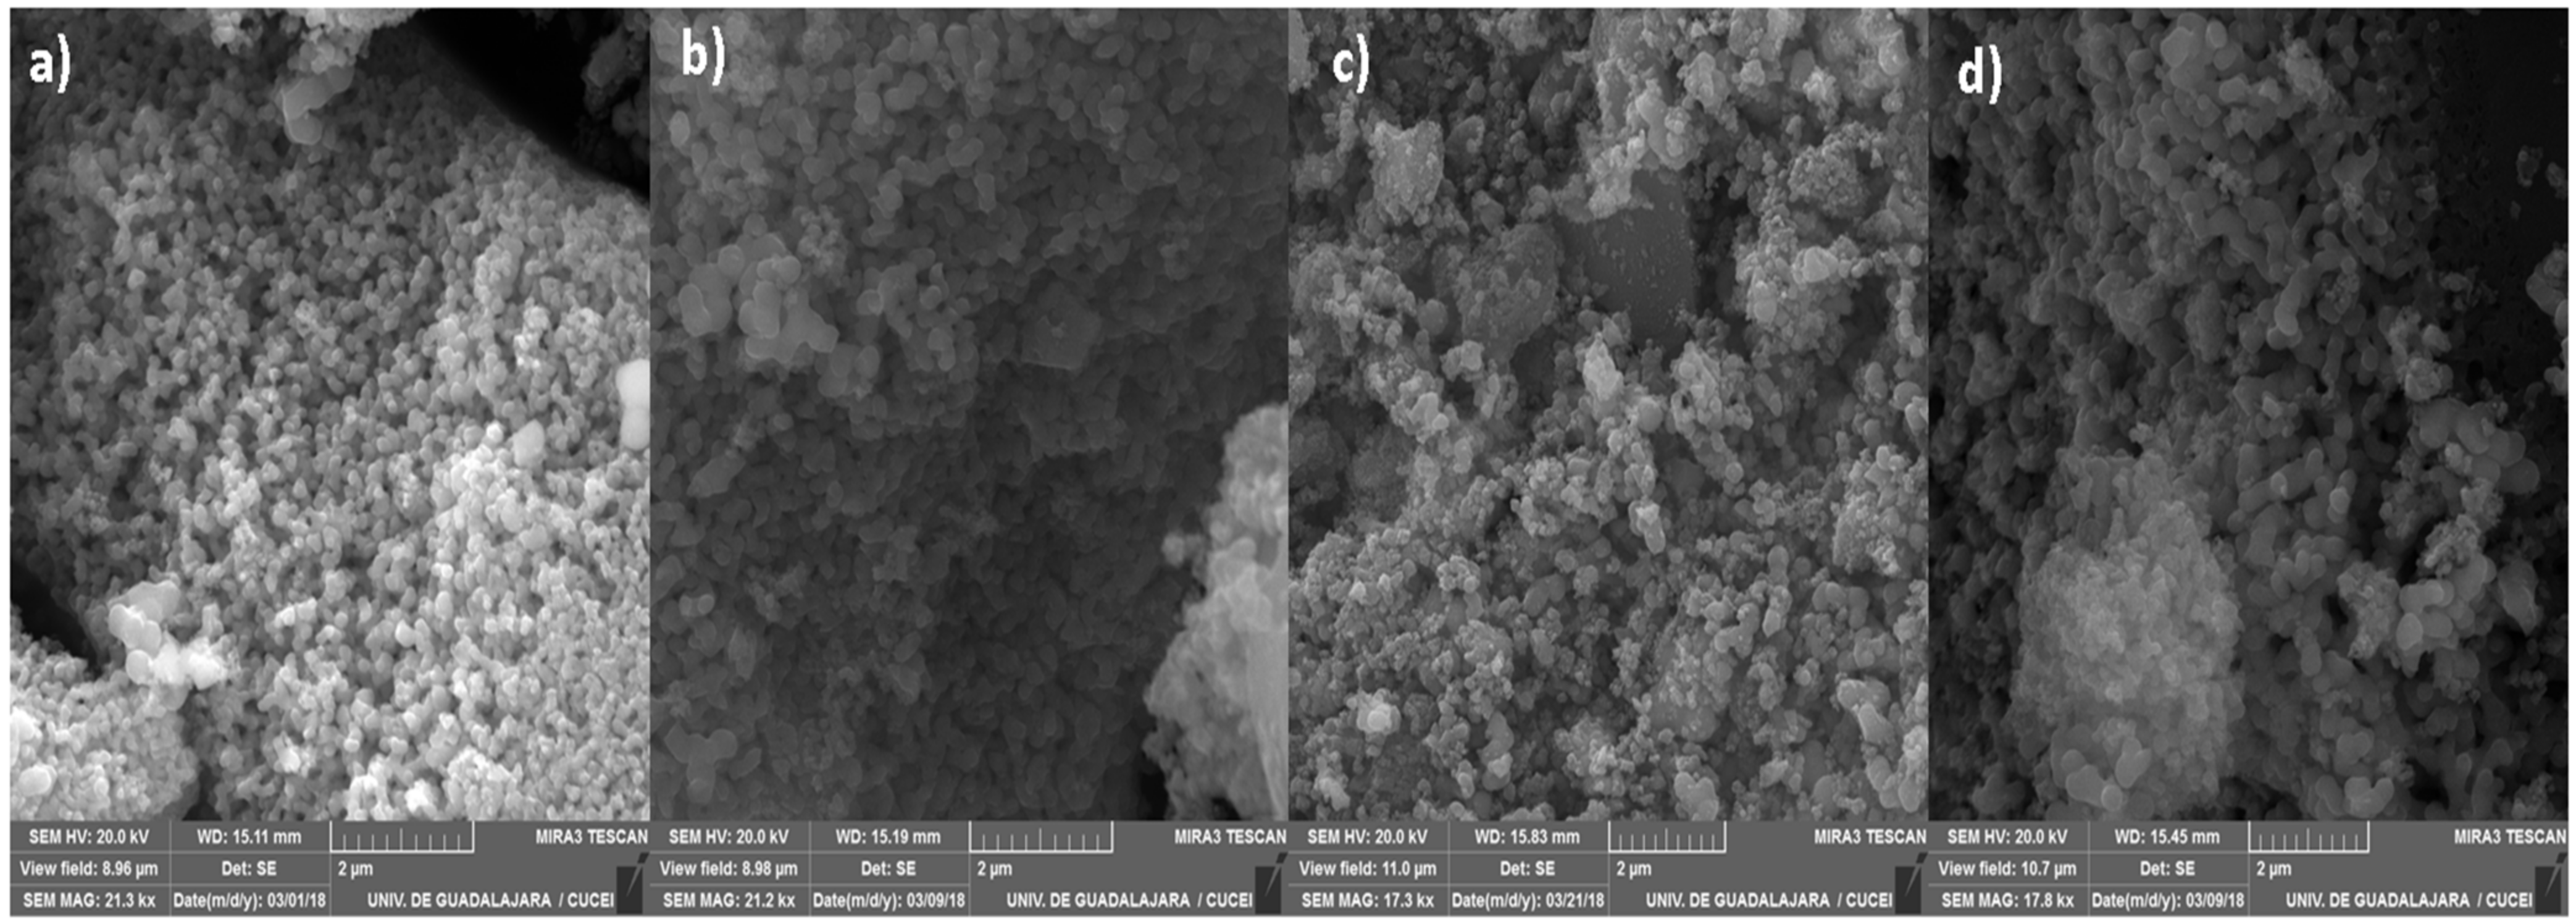
Figure 3 shows SEM micrographs of the synthesized nanomaterials. These point out the formation of agglomerates with a semiglobular structure created during the thermal treatment, which are in good agreement with similar works reported in the literature [35,36]. Moreover, a well-defined porous network design is also observed, especially in the TiO2 and TZ-1 samples. The micrographs from the TZ-3 and TZ-5 samples show a higher agglomeration and poor nucleation of agglomerates in comparison with the TiO2 and TZ-1 micrographs, in which the surface roughness and a broad network of pores between the agglomerates are observable. In addition, the micrograph of TZ-5 shows an increase in irregular shapes in comparison to the other samples. This is probably due to the increasing content of ZrO2 in the material. The agglomeration process in the synthesis of nanomaterials through the sol–gel method is probably due to the simultaneous hydrolysis and polycondensation of the metal alkoxide precursors, thus leading to the formation of an extended network, which is a typical feature in the sol–gel method [37,38]. Moreover, different structures such as colloidal particles, precipitations or gels can be prepared depending on the reaction conditions under which metal oxides are synthetized. Furthermore, the final product is influenced by the kinetics of hydrolysis and the condensation process of the alkoxide precursor [37].
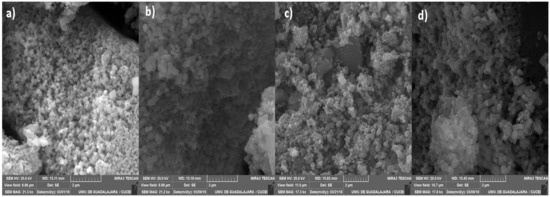
Figure 3.
SEM micrographs of nanocomposites: (a) TiO2, (b) TZ-1, (c) TZ-3 and (d) TZ-5.
2.4. FTIR
Figure 4 shows the IR spectra of the samples in the range of 4000 to 500 cm−1. The bands centered at 640 cm−1, 605 cm−1 and 550 cm−1 are typical for TiO2 (anatase phase) and correspond to the stretching modes from the Ti–OH, Ti–O and O–Ti–O bonds, respectively [39,40,41,42]. The bands located between 700 and 500 cm−1 are generally assigned to the stretching vibration modes characteristic of Ti–OH and Ti–O–Ti bonds. The presence of the peaks around 1630 cm−1 and between 3200 and 3500 cm–1 is attributed to the bending vibrations of the adsorbed O–H groups belonging to the presence of adsorbed water [33,43,44]. The IR spectra from TiO2-ZrO2 show bands in a range from 2000 to 2300 cm−1 due to the presence of CO2 in the atmosphere around the sample when it was manipulated to be analyzed [25].
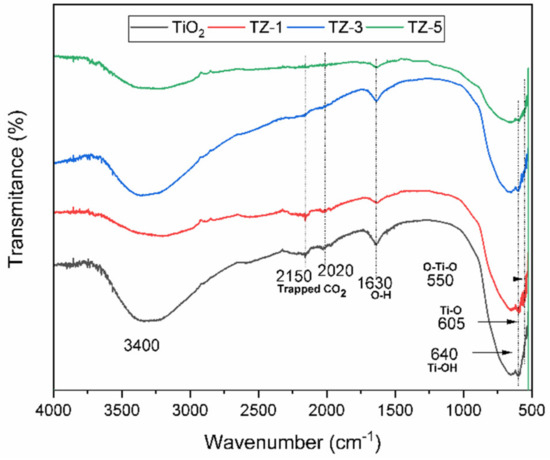
Figure 4.
FTIR-ATR spectra for TiO2, TZ-1, TZ-3 and TZ-5 samples.
2.5. UV–Vis Absorption
To determine the Kubelka–Munk function, analysis of the diffused reflectance spectra of the samples was carried out through Equation (1):
The band gap values were acquired from the (F(R)·hv)n vs. hv plot, also known as Tauc’s plot. The values of n = 1/2 apply for an indirect allowed transition [10]. Figure 5a shows the UV–Vis spectra for the TiO2, TZ and P25 samples. All photocatalysts displayed an optical absorption under 425 nm, which suggests the electron Ti–O transition of TiO2. The insertion of cations (Zr4+) inside the crystal structure of TiO2 modifies the electronic structure and thus the band gap, promoting a shift in the absorption spectra. The spectra of Figure 5a depict a bathochromic shift in TiO2 to higher wavelengths with the increased ZrO2 content. The bathochromic effect probably occurs due to the charge transfer between the electrons of the d orbitals of Zr and Ti atoms of the conduction band (Cb) or valence band (Vb) between semiconductors. The shift is related to the modification of the band gaps as a result of the lattice defects generated by the embedding of Zr4+ ions inside the TiO2 lattice, introducing new energy levels within the band gap of TiO2 [45]. The embedding of Zr4+ ions in the TiO2 lattice is feasible, as reported in [25], due to the corresponding electronegativity (1.54) and ionic radius (0.072 nm) of Zr4+ ions with the electronegativity (1.54) and ionic radius (0.065) of Ti4+ ions [46]. The values of the band gap energies obtained from Tauc’s plot (Figure 5b) for TiO2, TZ-1, TZ-3, TZ-5 and P25 were 3.05 eV, 3.1 eV, 3.01 eV, 2.96 eV and 3.0 eV, respectively. As there is not much difference in the optical properties among samples, as seen in Figure 5, we suggest that the photocatalytic effect does not just rely upon the optical properties of our samples, and that the textural properties can also play an important role [47].
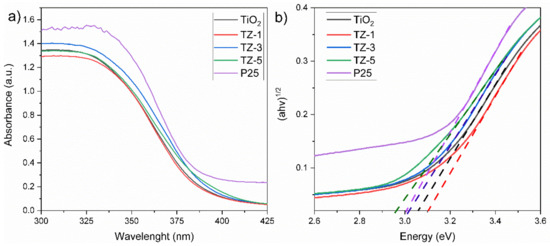
Figure 5.
UV–Vis spectra of nanocomposites (a), and Tauc’s plot (b).
2.6. N2 Adsorption–Desorption
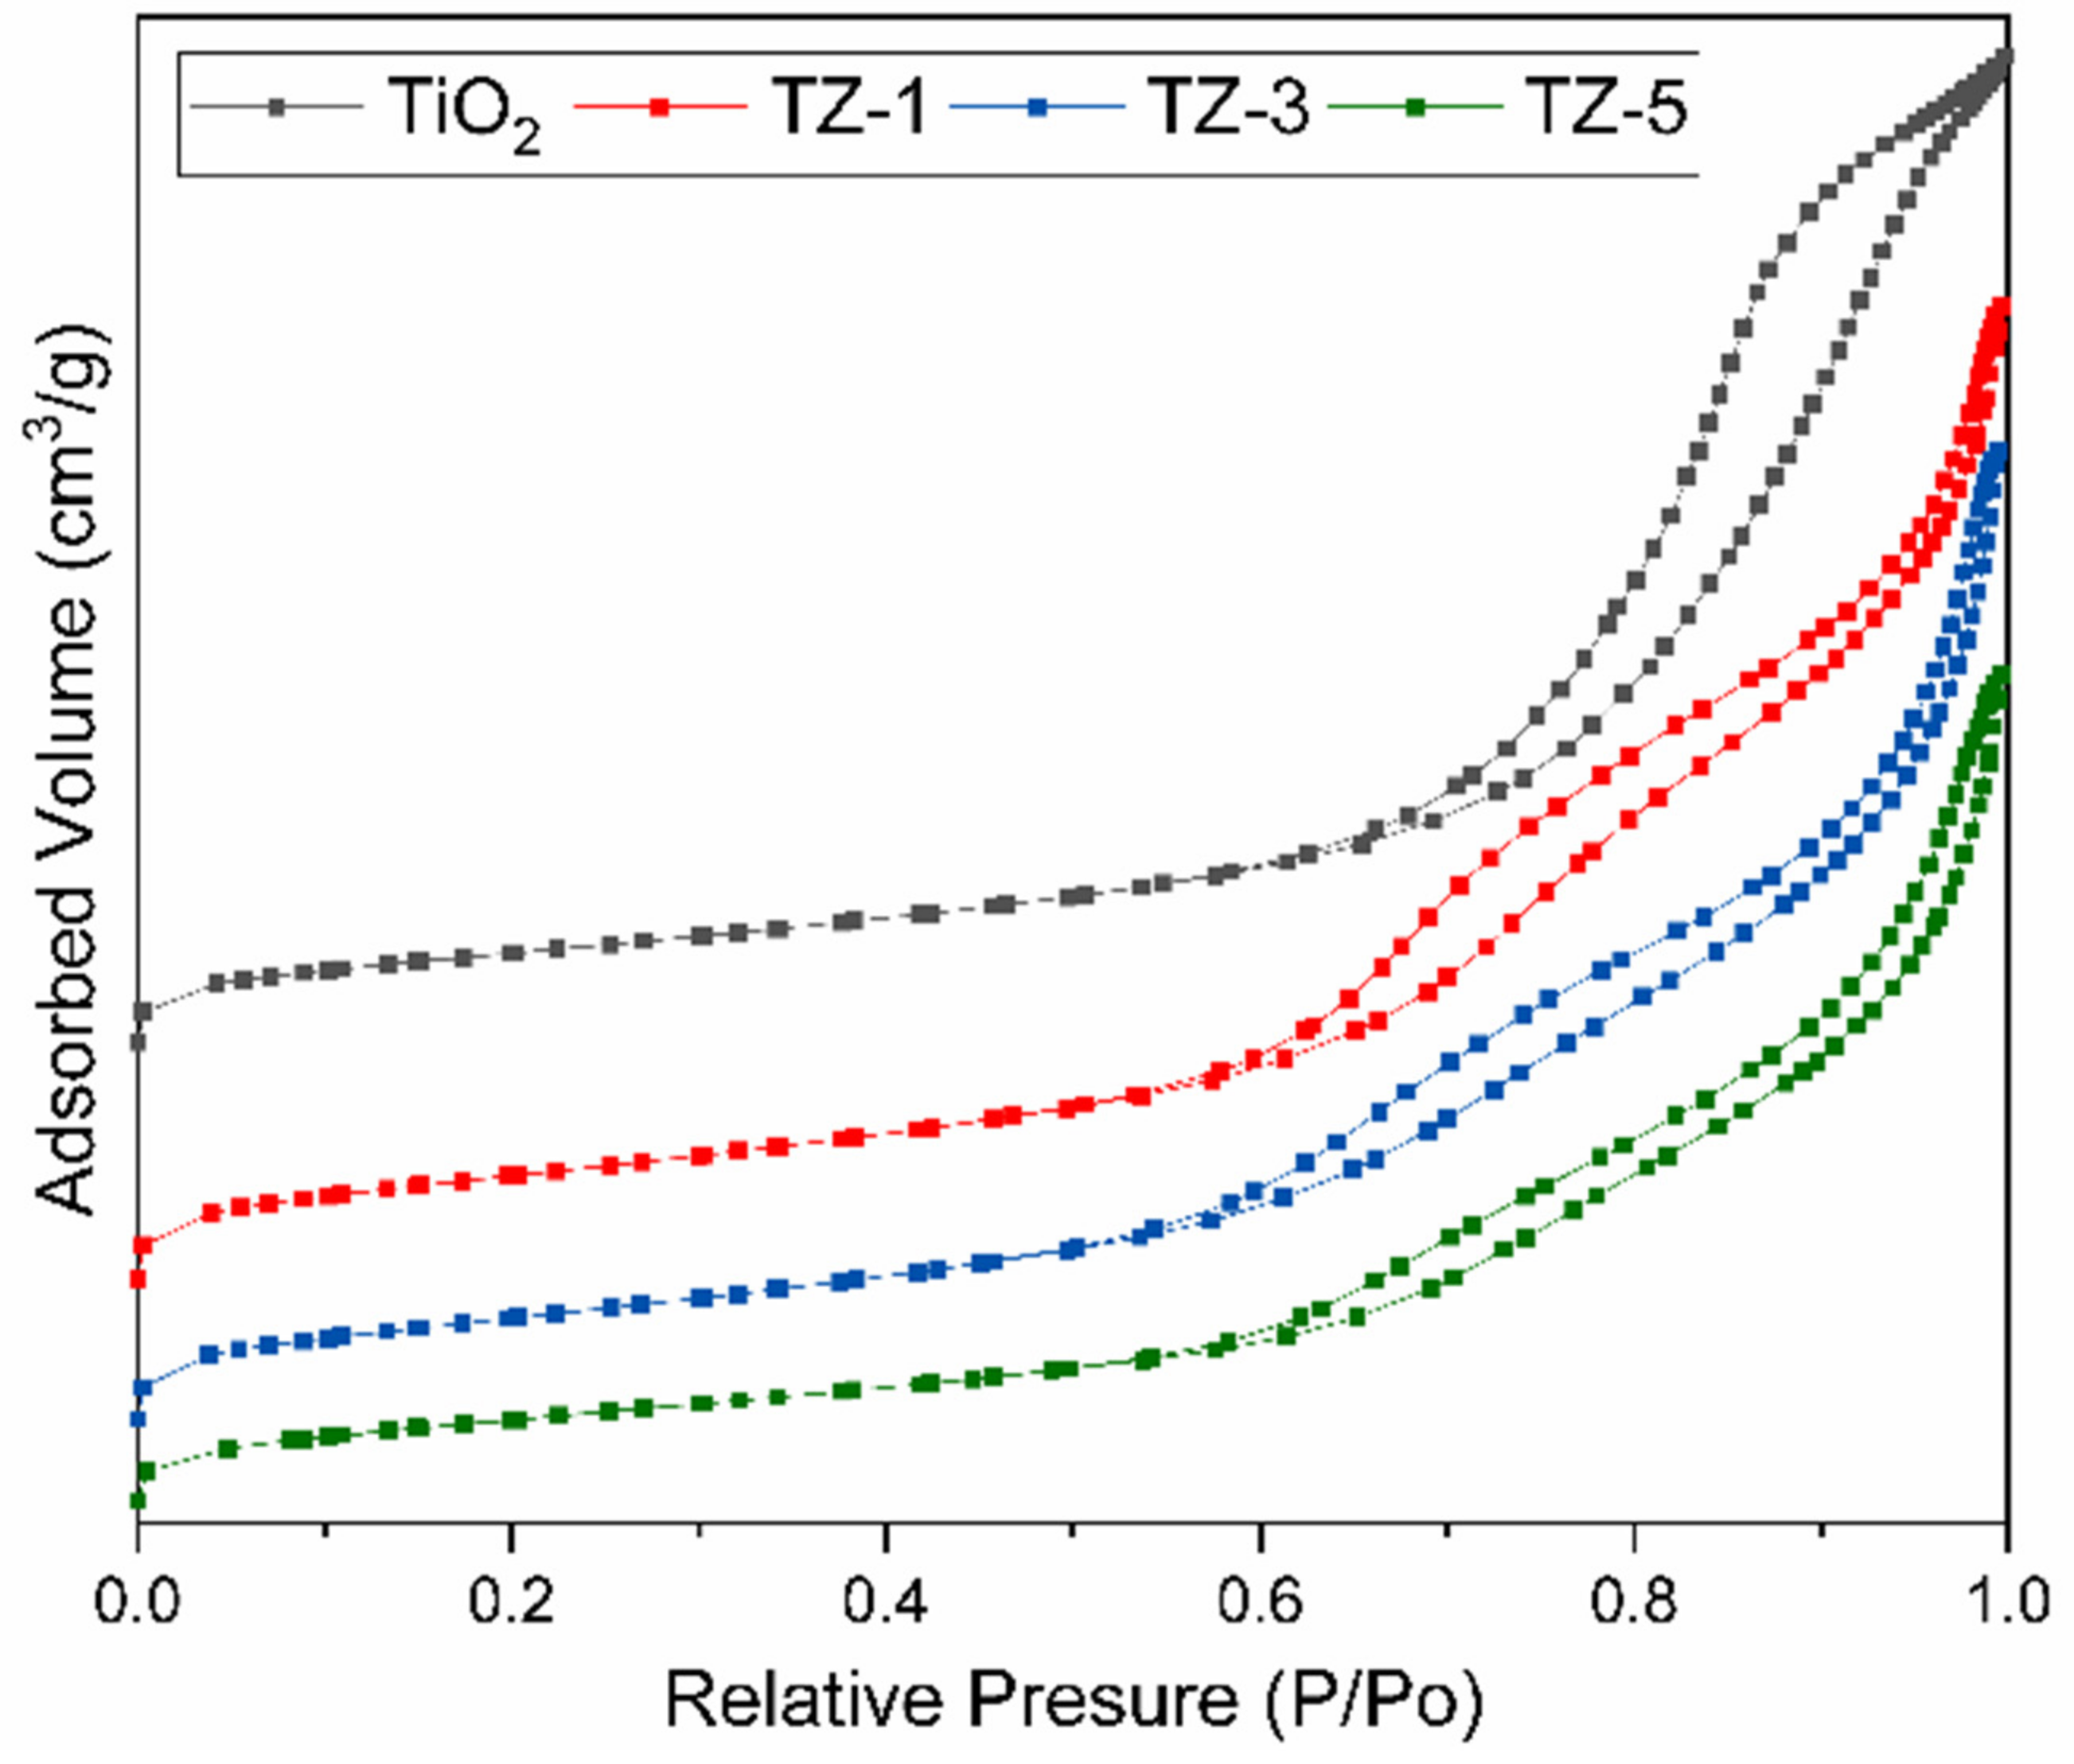
The porosity of the samples was examined by N2 adsorption–desorption studies. Figure 6 shows the N2 adsorption–desorption isotherms, and Table 1 displays the textural properties of the photocatalysts. On one hand, the isotherms of the photocatalysts were identified as type IV and corresponded to mesoporous materials according to the IUPAC classification [48]. The isotherms show that the presence of and an increment in Zr4+ ions in the TiO2 lattice generated a modification of the isotherm shape. This is attributed to the saturation of the TiO2 network due to the Zr4+ insertion and the formation of ZrO2 crystals on the TiO2 surface. Similar results of isotherm shape changes due to the modification of TiO2 with ZnO and MgO were previously reported by Anaya Esparza et al. [49]. Additionally, the samples had three different hysteresis types: H2 type for pure TiO2, H4 type for TZ-1 and TZ-3 and H3 type for the TZ-5 samples [50]. The hysteresis loop related to the isotherms is attributed to the secondary process of capillary condensation of N2 gas carried out inside the pores, which confirms a mesoporous structure formation [51,52]. On the other hand, at higher Zr4+ ion concentrations, the surface area and pore size increase, but the pore volume decreases, as seen in Table 1. A higher surface area can be associated with an increase in surface-active sites, and this could play an important role in the photocatalytic activity. These increases in the areas and pore sizes promote the diffusion of pollutants during photocatalytic activity, which increases the photodegradation reaction rate due to the higher contact area between the pollutant molecules and the powder structure [53]. Moreover, the smaller crystallite size generated a higher surface-to-volume ratio that helped to improve the photoactivity.

Figure 6.
N2 gas adsorption–desorption isotherms of TiO2, TZ-1, TZ-3 and TZ-5 samples.
2.7. XPS Analysis
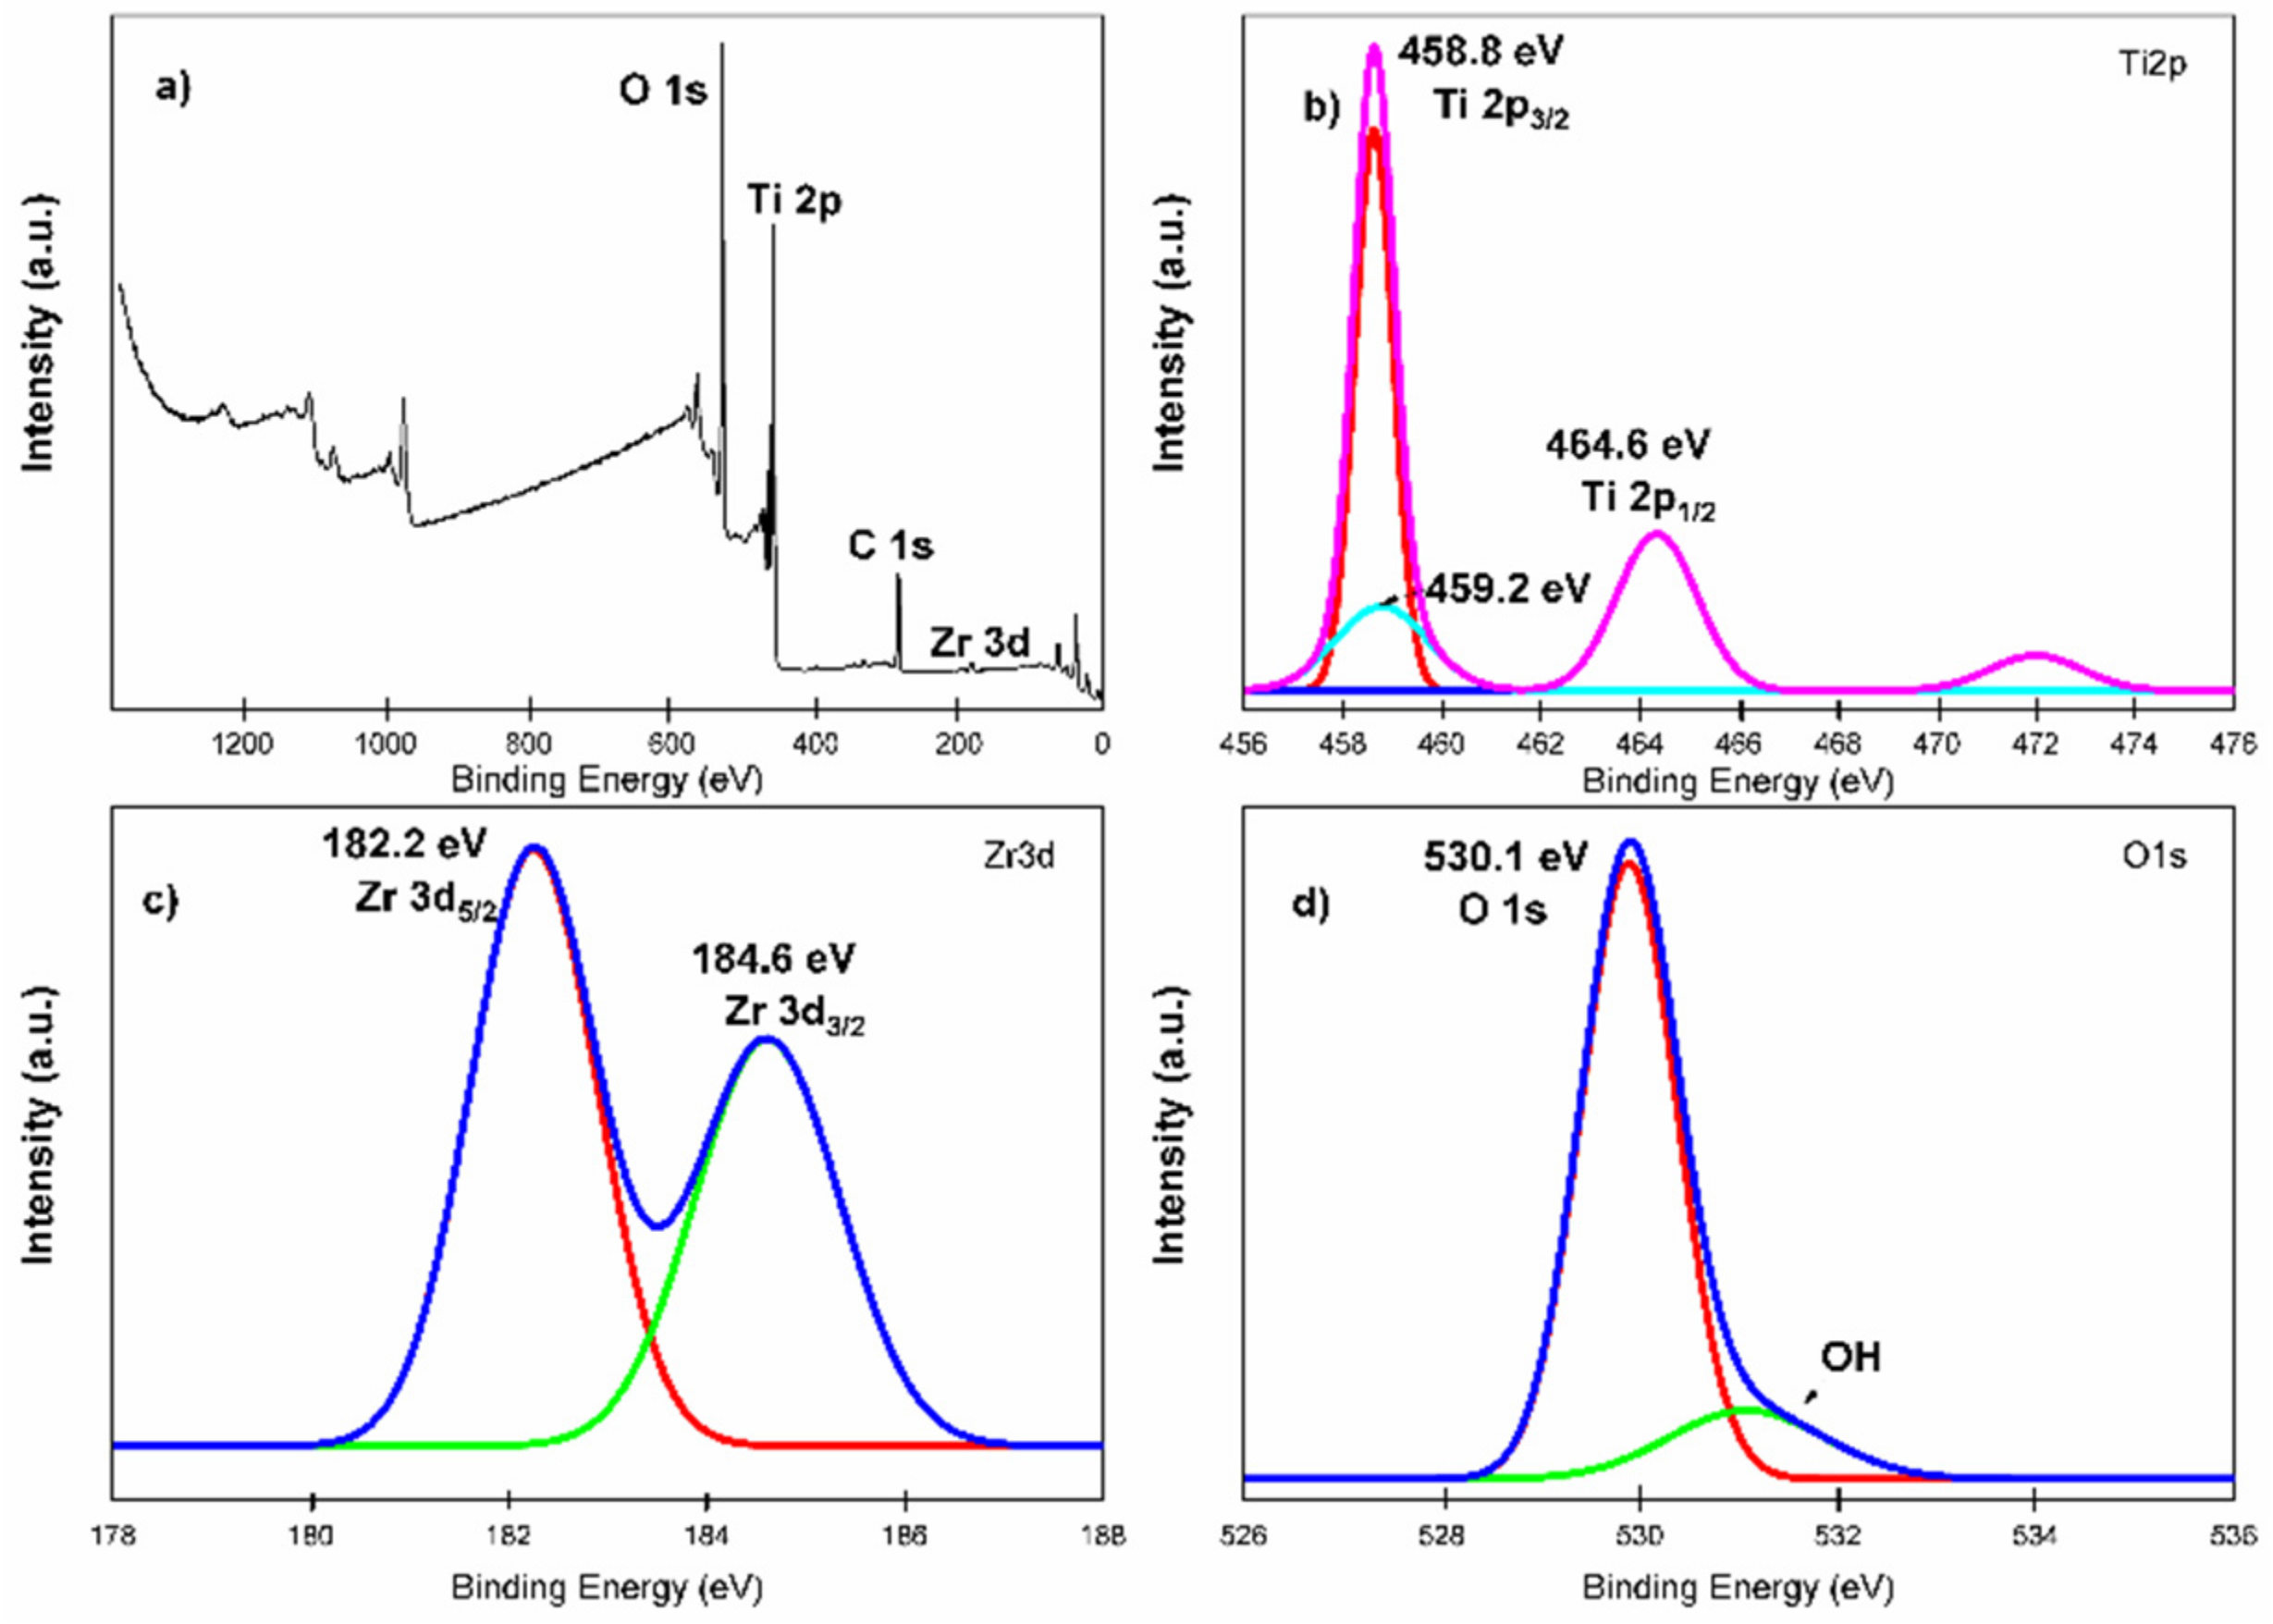
Figure 7 shows the XPS analysis for the TZ-1 sample with binding energy signals agreeing with titanium (2p), oxygen (1s) and zirconium (3d) states. The peaks of Ti 2p with binding energies at 464.6 eV and 458.8 eV correspond to the Ti 2p1/2 and Ti 2p3/2 chemical states (Ti–O bond), respectively [54]. The difference of 5.8 eV in the bonding energy between Ti 2p1/2 and Ti 2p3/2 peaks indicates the existence of the Ti4+ chemical state in the TZ-1 heterojunction photocatalyst [55]. The Zr 3d peaks suggest the existence of the Zr4+ oxidation state in the TZ-1 photocatalyst at 182.2 eV and 184.6 eV that correspond to Zr 3d5/2 and Zr 3d3/2 chemical states, respectively. The Ti 2p and Zr 3d signals in Figure 7b,c indicate that Ti and Zr are present as TiO2 and ZrO2, respectively [56]. Furthermore, the presence of the peak at 459.2 eV in Figure 7b suggests Ti–Zr bonds in the TZ-1 sample [57]. On the other hand, the O1s binding energy peak at 530.1 eV is an indication that confirms the existence of crystal lattice oxygen , Figure 7d. In addition, the small shoulder peak at 531.5 eV reveals the presence of surface hydroxyl oxygen (OH) groups, which demonstrates the hydrophilic nature (hydroxyl groups) of the TZ photocatalysts. The XPS spectrum suggests that ZrO2 was incorporated into the anatase structure to create the hybridized ZrO2–TiO2 structure, and this supports the idea that the Zr4+ ions are surrounded by –O–Ti bonds, creating a Zr–O–Ti bonding structure [54,58]. The incorporation of Zr4+ into TiO2 to form TiO2–ZrO2 heterojunction photocatalysts is attributed to ZrO2 being hybridized with TiO2 to form a TiO2–ZrO2 structure, and a hetero-condensation that promoted the Zr–O–Ti bonding creation [33,54].
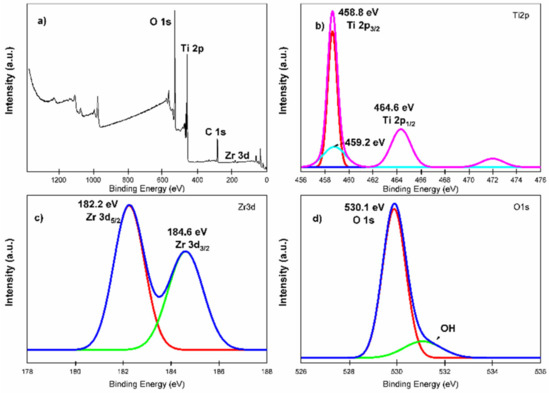
Figure 7.
XPS analysis for TZ-1 photocatalyst material. (a) Full survey spectra, (b) expanded spectra of Ti2p, (c) expanded spectra of Zr3d and (d) expanded spectra of O1s.
2.8. Photodegradation Studies
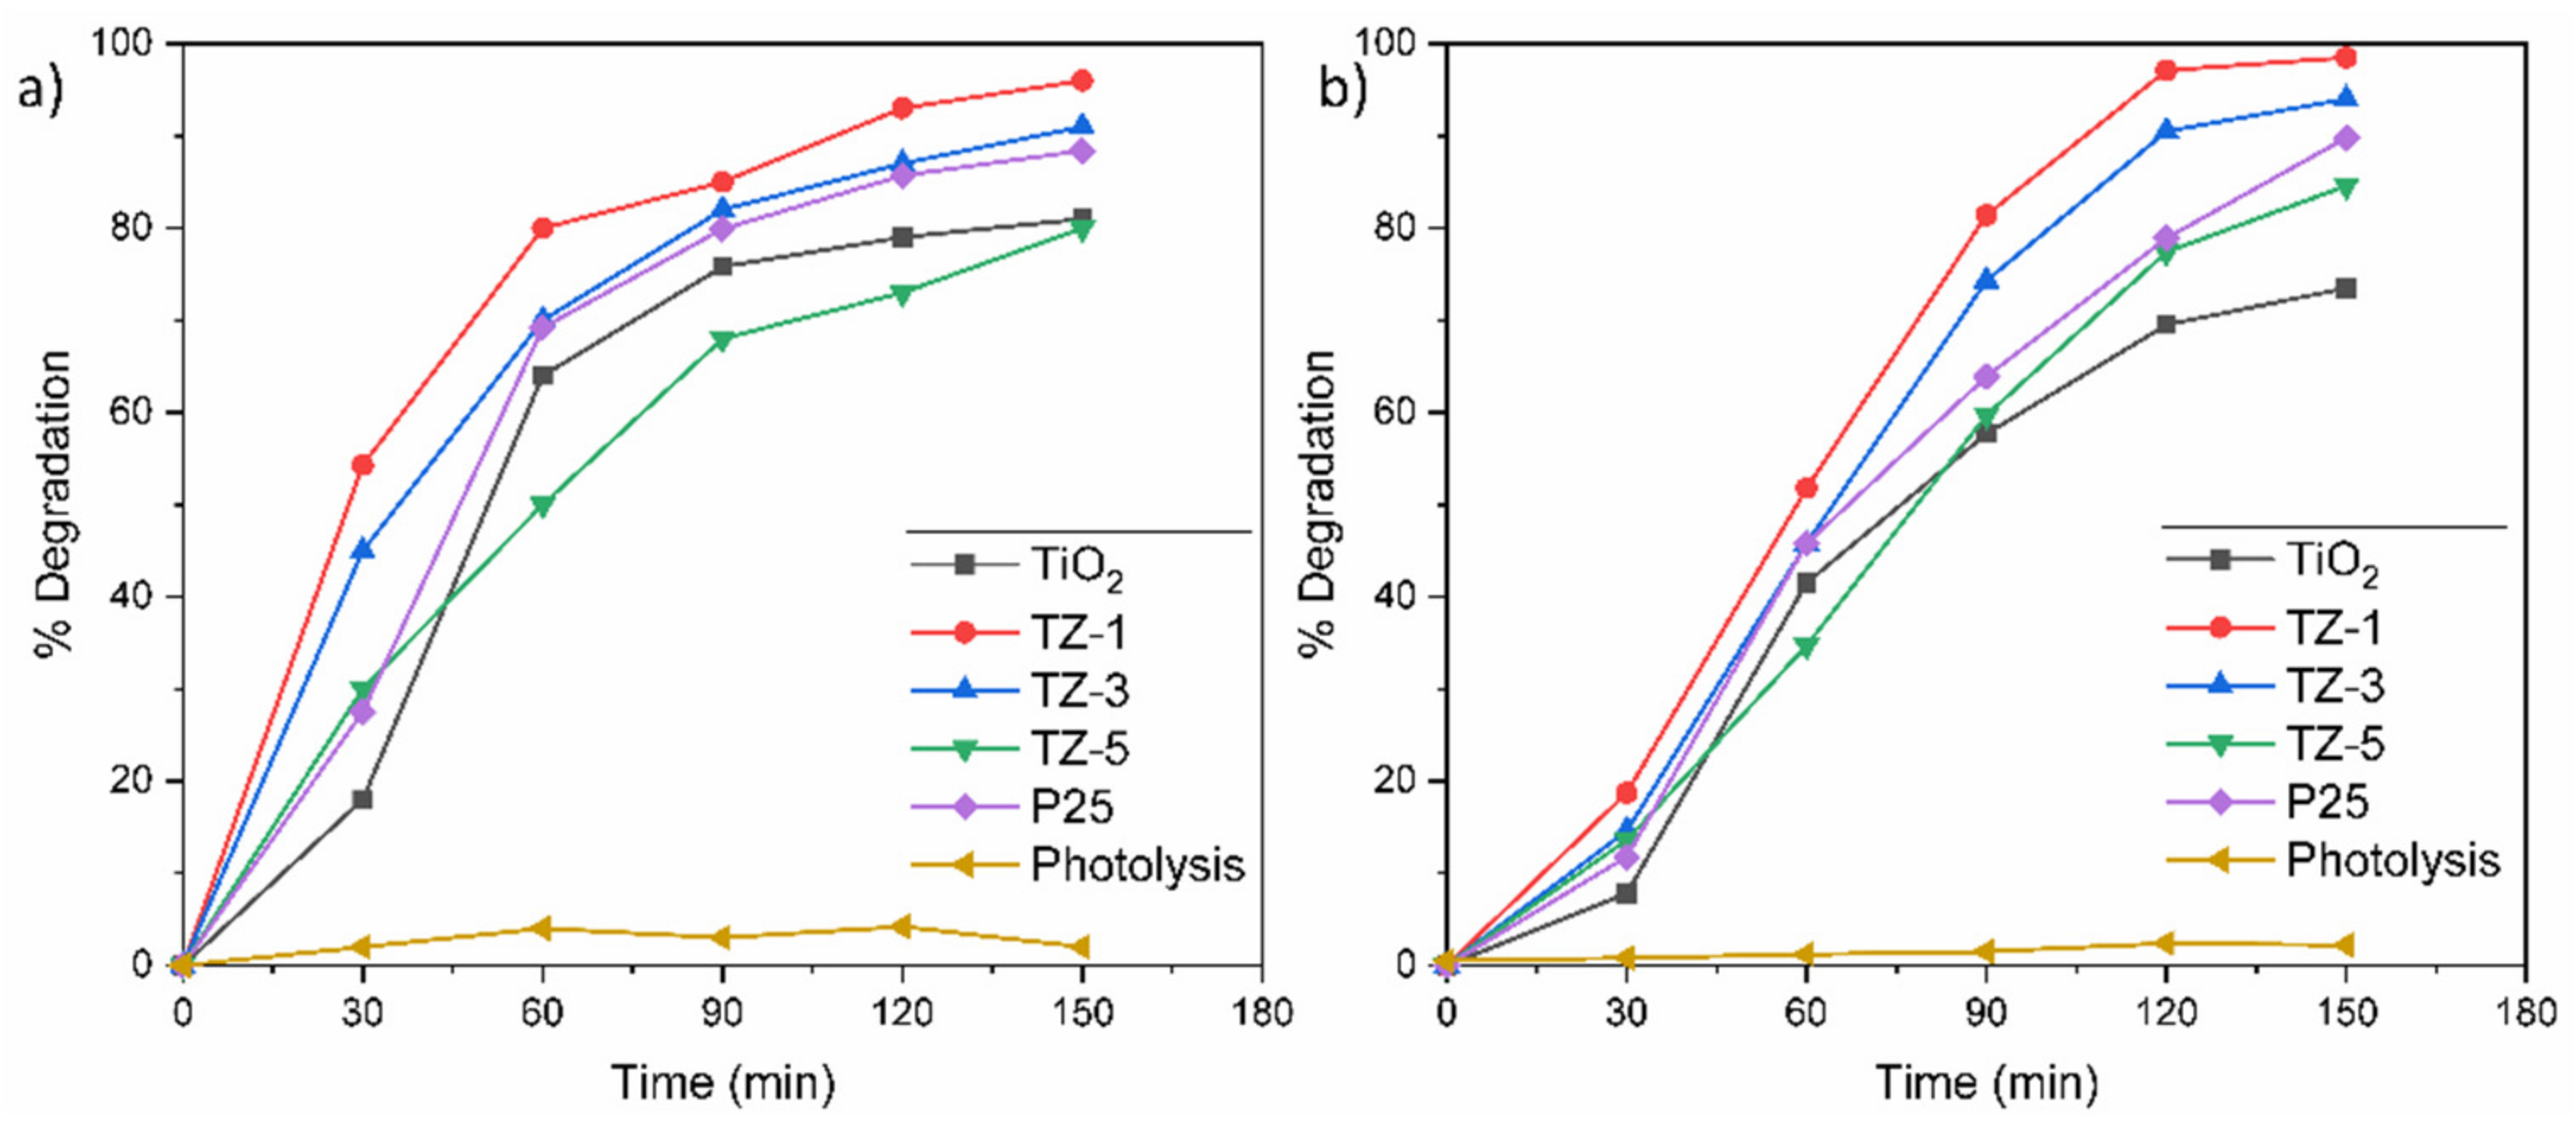
On one hand, Figure 8a shows the degradation curves at 30 ppm of RhB for the samples TiO2, TZ-1, TZ-3, TZ-5 and P25, where their corresponding degradation values were 81.2%, 96.5%, 91%, 80.3% and 89.8%, respectively. The difference between TiO2 and TZ-1 was of 15.3%, whereas between TZ-1 and P25, it was of 6.7%. On the other hand, Figure 8b shows the degradation curves at 30 ppm of MO for the samples TiO2, TZ-1, TZ-3, TZ-5 and P25, where their corresponding degradation values were 75.5%, 99%, 96.3%, 84.6% and 90%, respectively. The difference in photodegradation between TiO2 and TZ-1 was of 23.5%, whereas between TZ-1 and P25, it was of 9%. The slightly higher increase in photodegradation found in MO solution for the TZ samples may be due to the easy separation of the azo bond (chromophore breakup) of the MO dye in comparison with the cyclic structure of RhB [59]. As it is possible to observe, the addition of Zr in the TiO2 structure increased the photocatalytic effect over the dyes. However, the higher ZrO2 content in the TiO2 lattice reduced the efficiency of the photocatalyst, as shown for the TZ-5 sample in both dyes. Although the TZ-5 sample had a higher surface area value than P25, its degradations were lower than those achieved by P25. The lower values from TZ-5 can be attributed to the excess of defects present in the TZ-5 sample. For their part, TiO2 and P25 probably had a higher recombination of e−/h+ pairs by affecting the photodegradation, and hence their degradations were lower than those of TZ-1 and TZ-3. In particular, P25 (composed of ~30% rutile and 70% anatase) presented a better performance than TiO2 and TZ-5, attributed to the transfer of electrons from Cb of anatase to those of rutile TiO2. Figure 8a,b also show the results without a photocatalyst to discard the photolysis effect. The results of the photolysis do not show a significant reduction of the dye. Therefore, the irradiation with UV light by itself is not capable of degrading the dye, and the photodegradation results were obtained in a pure photocatalytic regime.
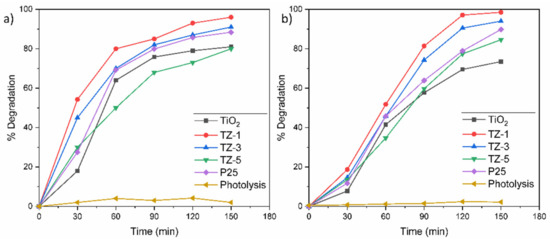
Figure 8.
Degradation percentage of (a) RhB and (b) MO solutions.
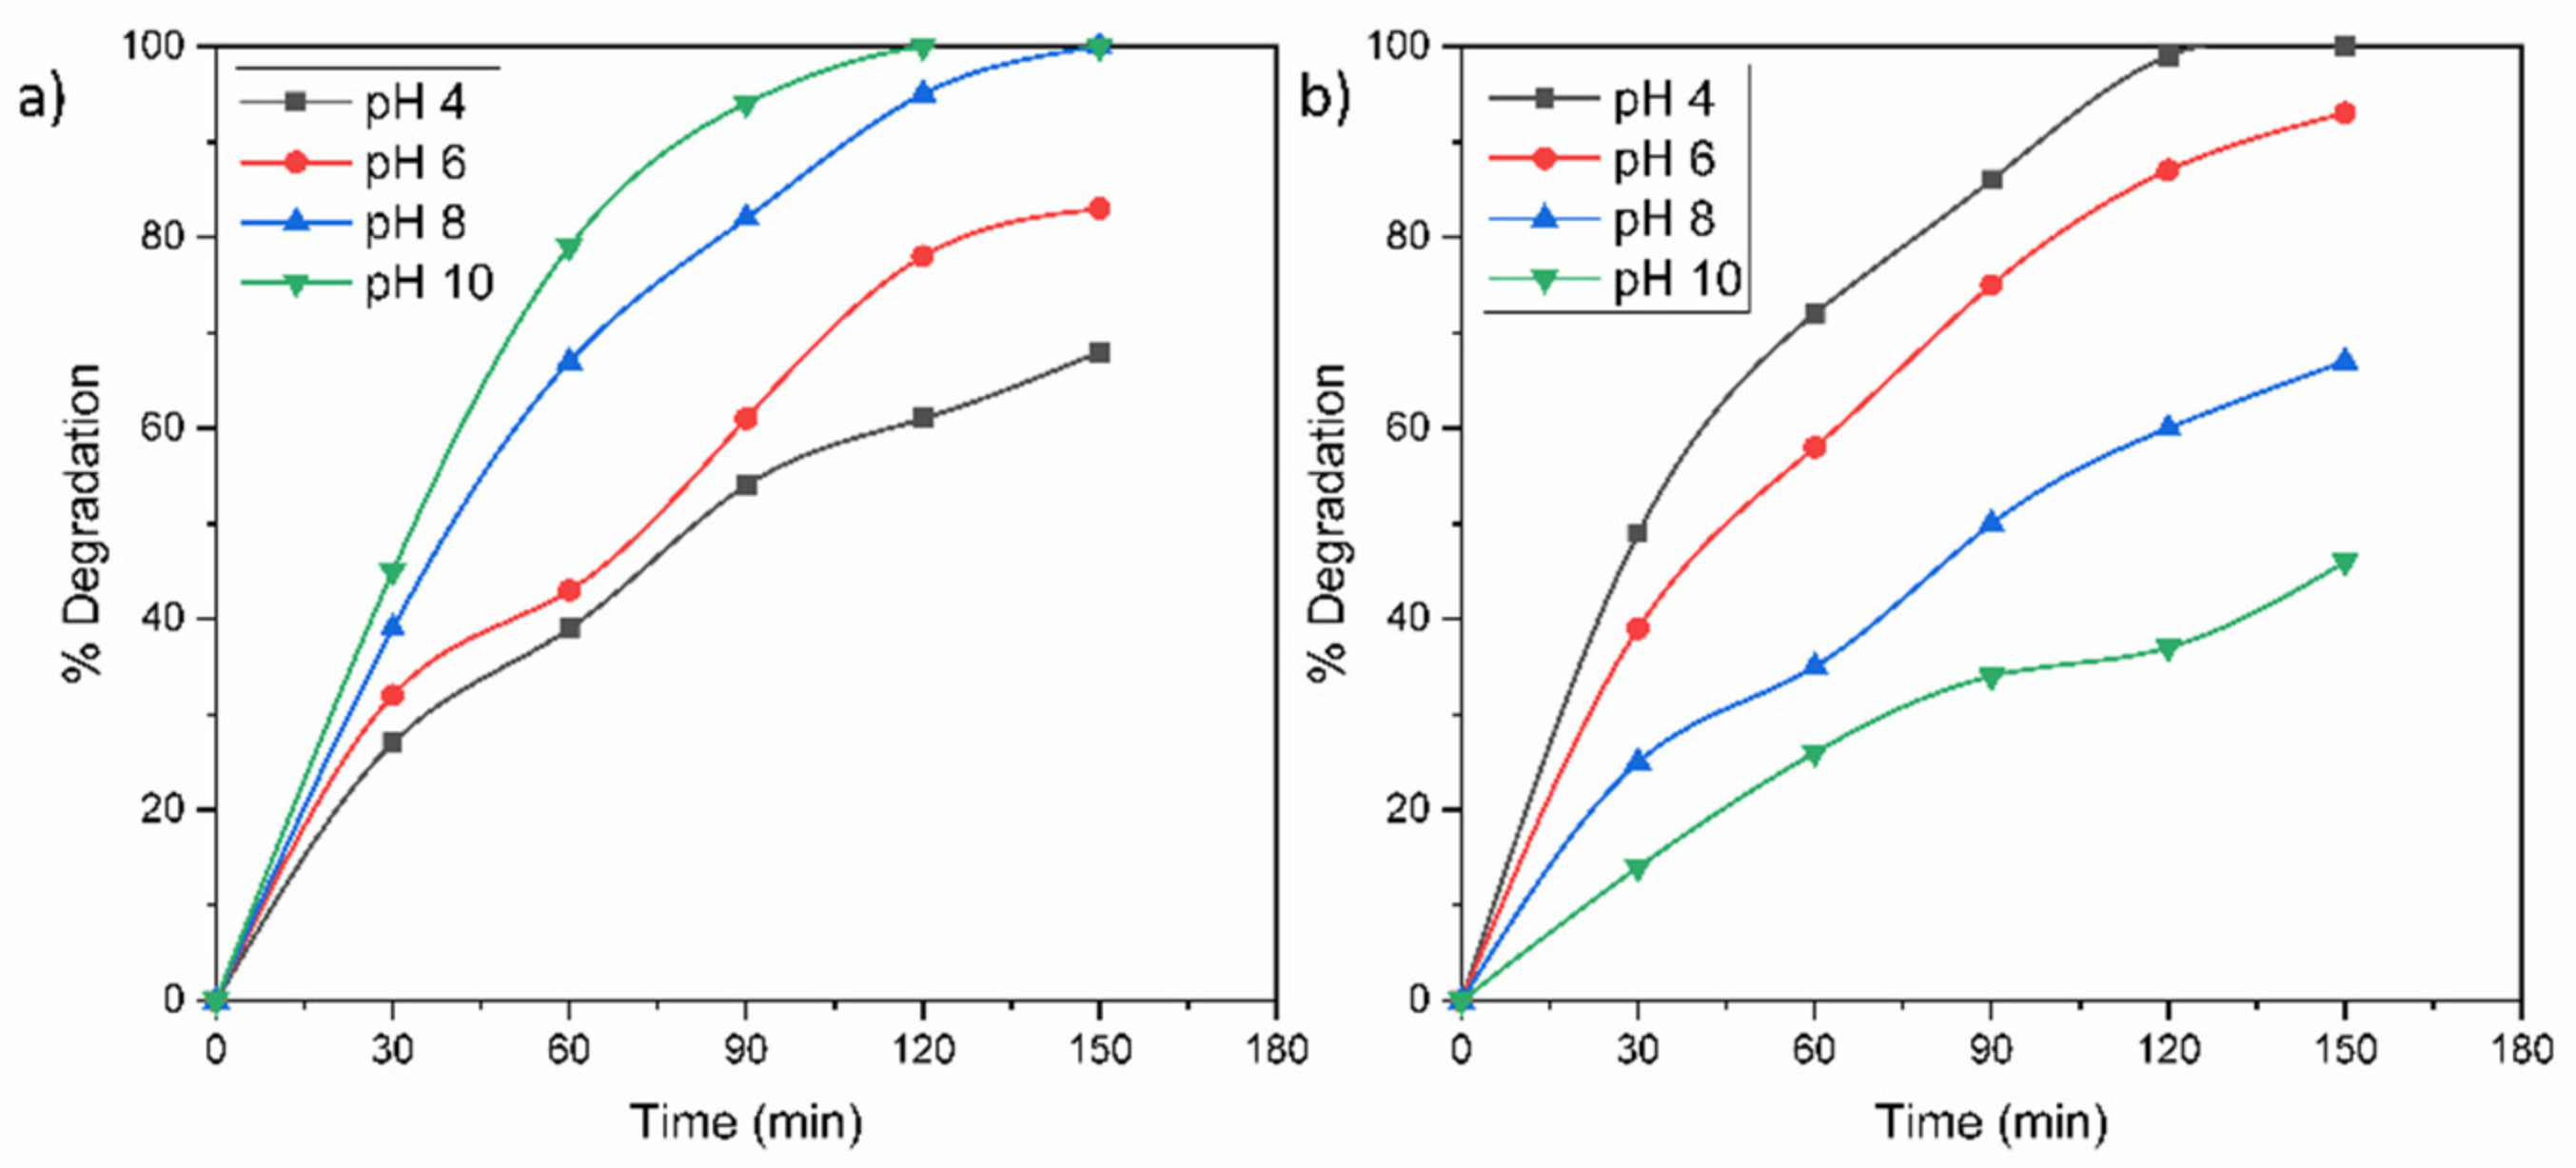
In order to know the performance of the TZ-1 sample under the effect of the pH, the TZ-1 sample was evaluated on the removal of RhB and MO at different pH values. The protonation and deprotonation of a photocatalyst surface are carried out at an acid or alkaline medium, respectively. Moreover, the pH dictates the size of aggregates that are formed. Hence, the pH solution is an important factor that affects the photocatalytic degradation of a pollutant. According to the results displayed in Figure 9a, the acid conditions were not favorable for degrading RhB. At acid pH values, the adsorption of the cationic RhB molecule became restricted to the positively charged photocatalyst surface due to an electrostatic repulsive force between positive charges. Therefore, the RhB dye presented an improved degradation under alkaline conditions due to the attraction between the cationic -NH2-+ groups of the RhB molecule and the negatively charged surface of the photocatalyst in the alkaline medium. Furthermore, possibly in the alkaline medium, the •OH radicals were easier to produce by oxidizing a major amount of hydroxide ions disposable on the TZ-1 sample surface; hence, the efficacy of the photoactivity was improved. On the other hand, the degradations of MO were improved with decrements in pH values from 10 to 4, Figure 9b. In fact, the total removal of MO was achieved at 120 min at pH 4, Figure 9b. The enhancement of the photoactivity under the acid medium is attributed to the anionic nature of the MO dye. Due to the protonated (positively charged) surface of photocatalyst in acid conditions, an attractive electrostatic union is created between the photocatalyst surface and the negatively charged sulfonated groups (–SO3–) of MO; hence, the dye adsorption on the powder surface is enhanced as well as the photodegradation. This process eases the faster and effective dissipation of the dye adsorption under light irradiation. Conversely, in alkaline conditions, the deficient photodegradation of MO is attributed to the repulsion between the negative TiO2 surface and the anionic groups of MO.
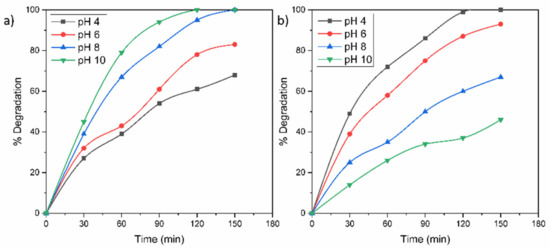
Figure 9.
Effect of solution pH on the photocatalytic degradation of (a) RhB and (b) MO molecules.
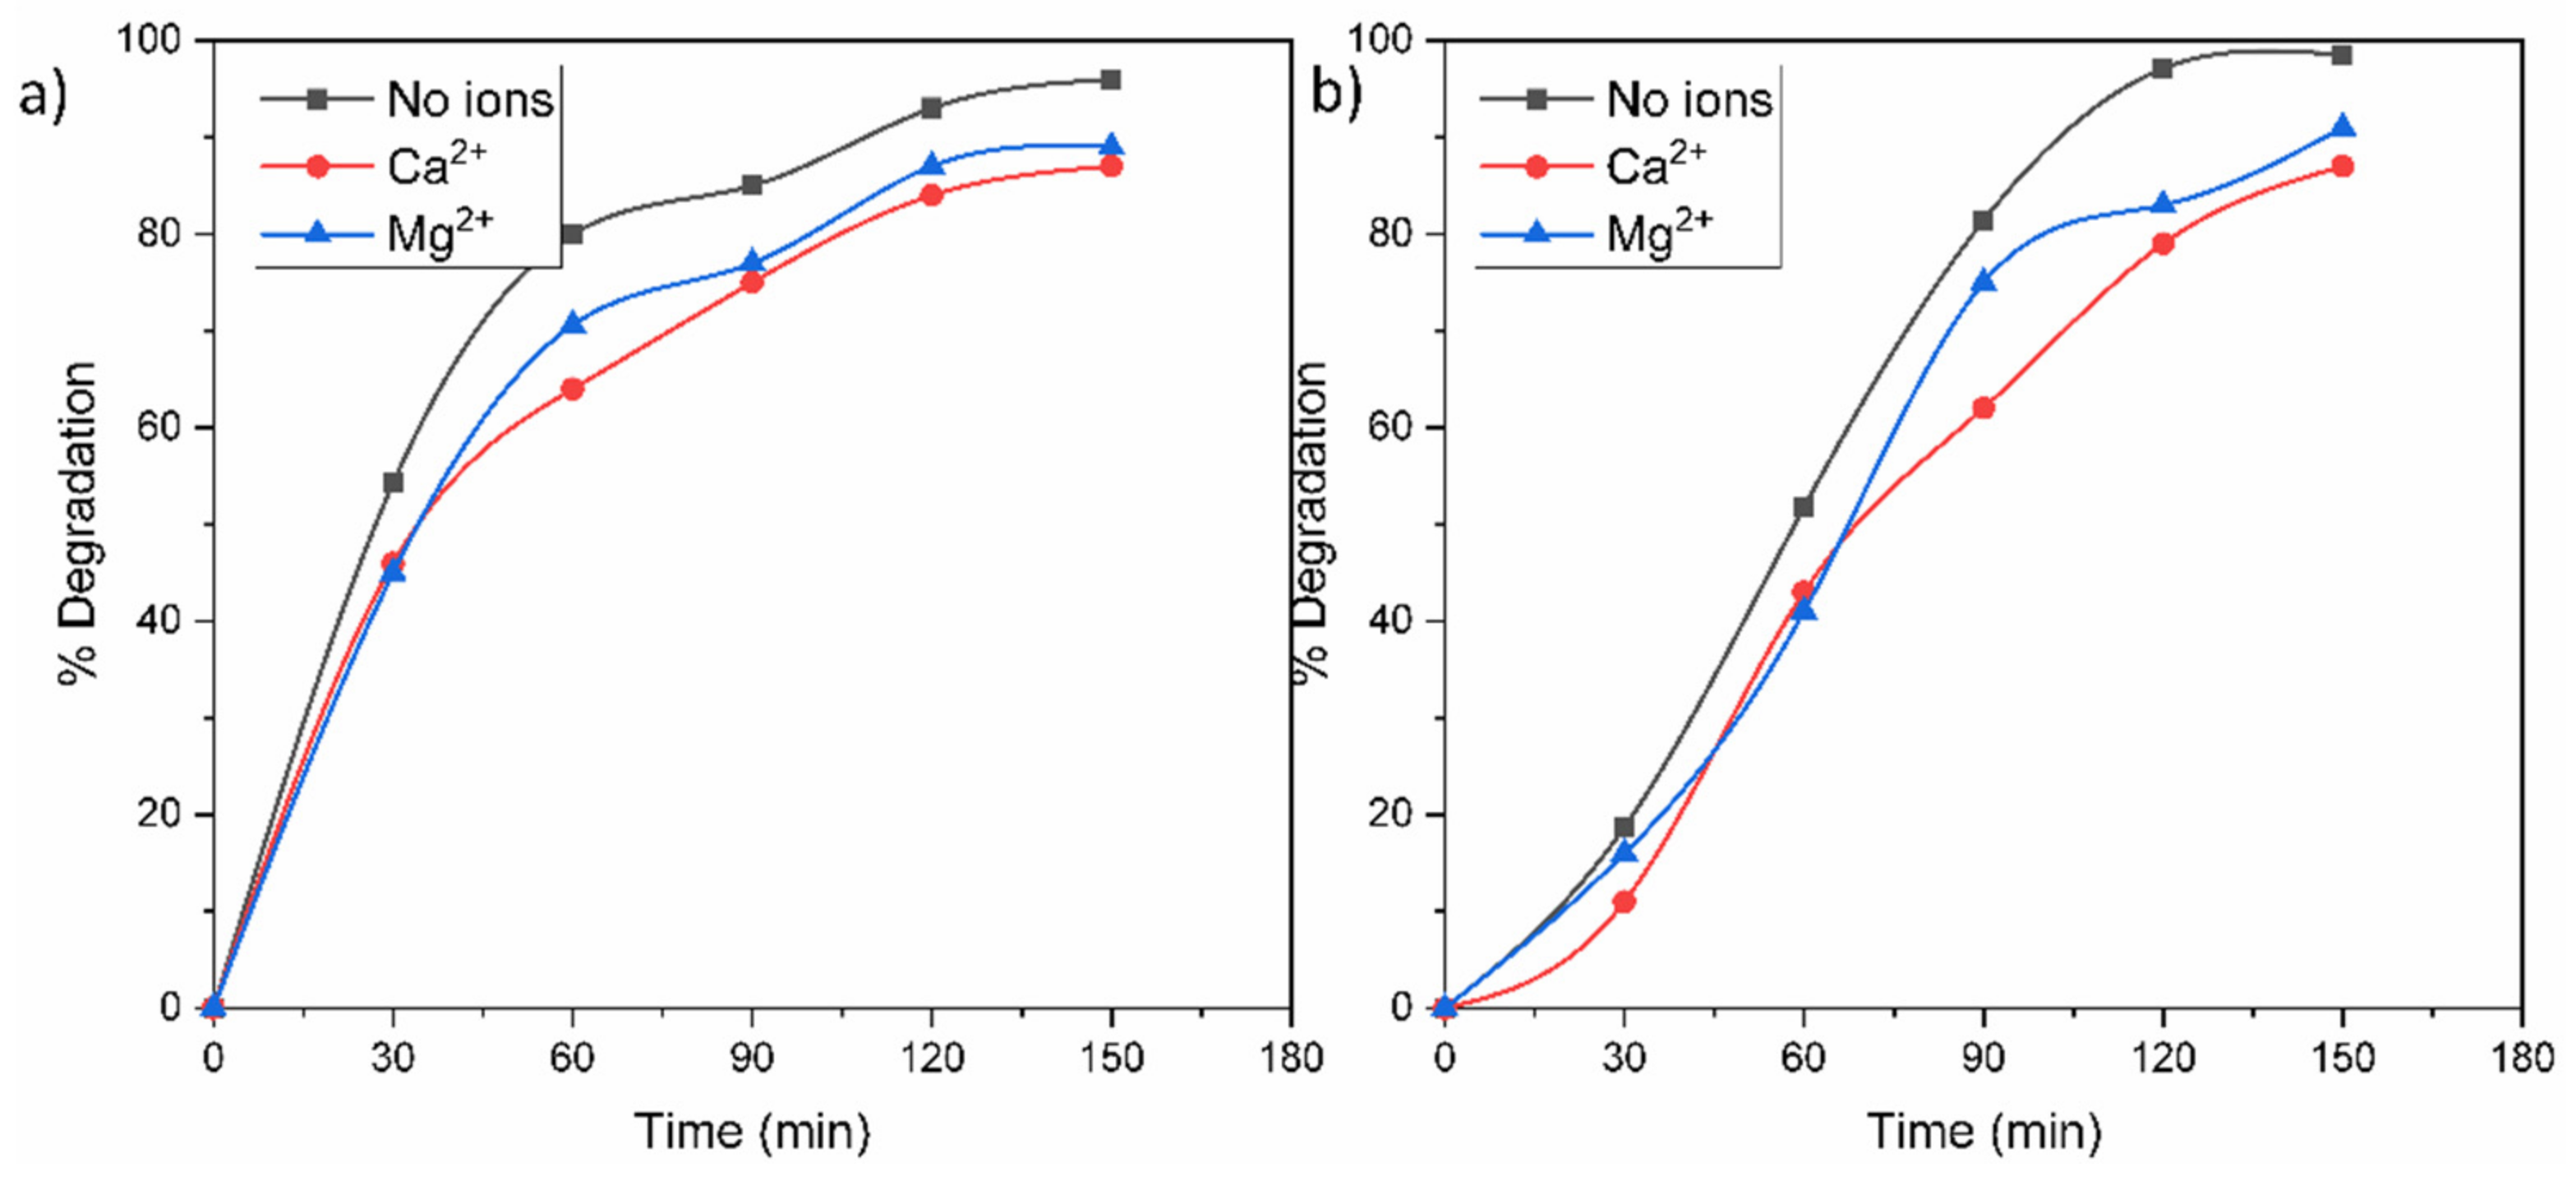
The presence of inorganic ions in contaminated water can affect a photocatalytic process because these ions can be adsorbed on the surface of a photocatalyst and deactivate it. For this reason, Figure 10 shows the photocatalytic degradations of MO and RhB in the presence of Ca2+ and Mg2+ ions in the solution. According to the results, the photodegradations of the dyes in the cations’ presence displayed a similar but lower trend compared to the results shown in Figure 8. This behavior is attributed to the fact that both cations are in their highest and most stable oxidation state, and it is not possible for them to capture e−/h+ in solution. The slight inferior photodegradation in Ca2+ can be derived from the presence of Cl− anions from CaCl2, which can react with the generated h+ and •OH to form chlorine radicals. In addition, the cationic ions could have a shield effect over some active sites of the surface photocatalyst.
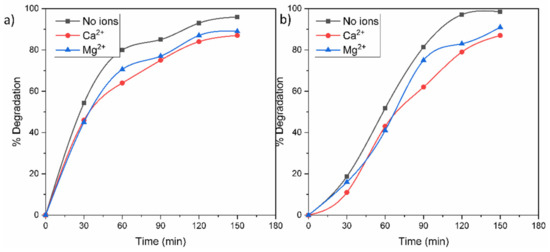
Figure 10.
Effect of Ca2+ and Mg2+ ions on the photocatalytic degradation of (a) RhB and (b) MO molecules.
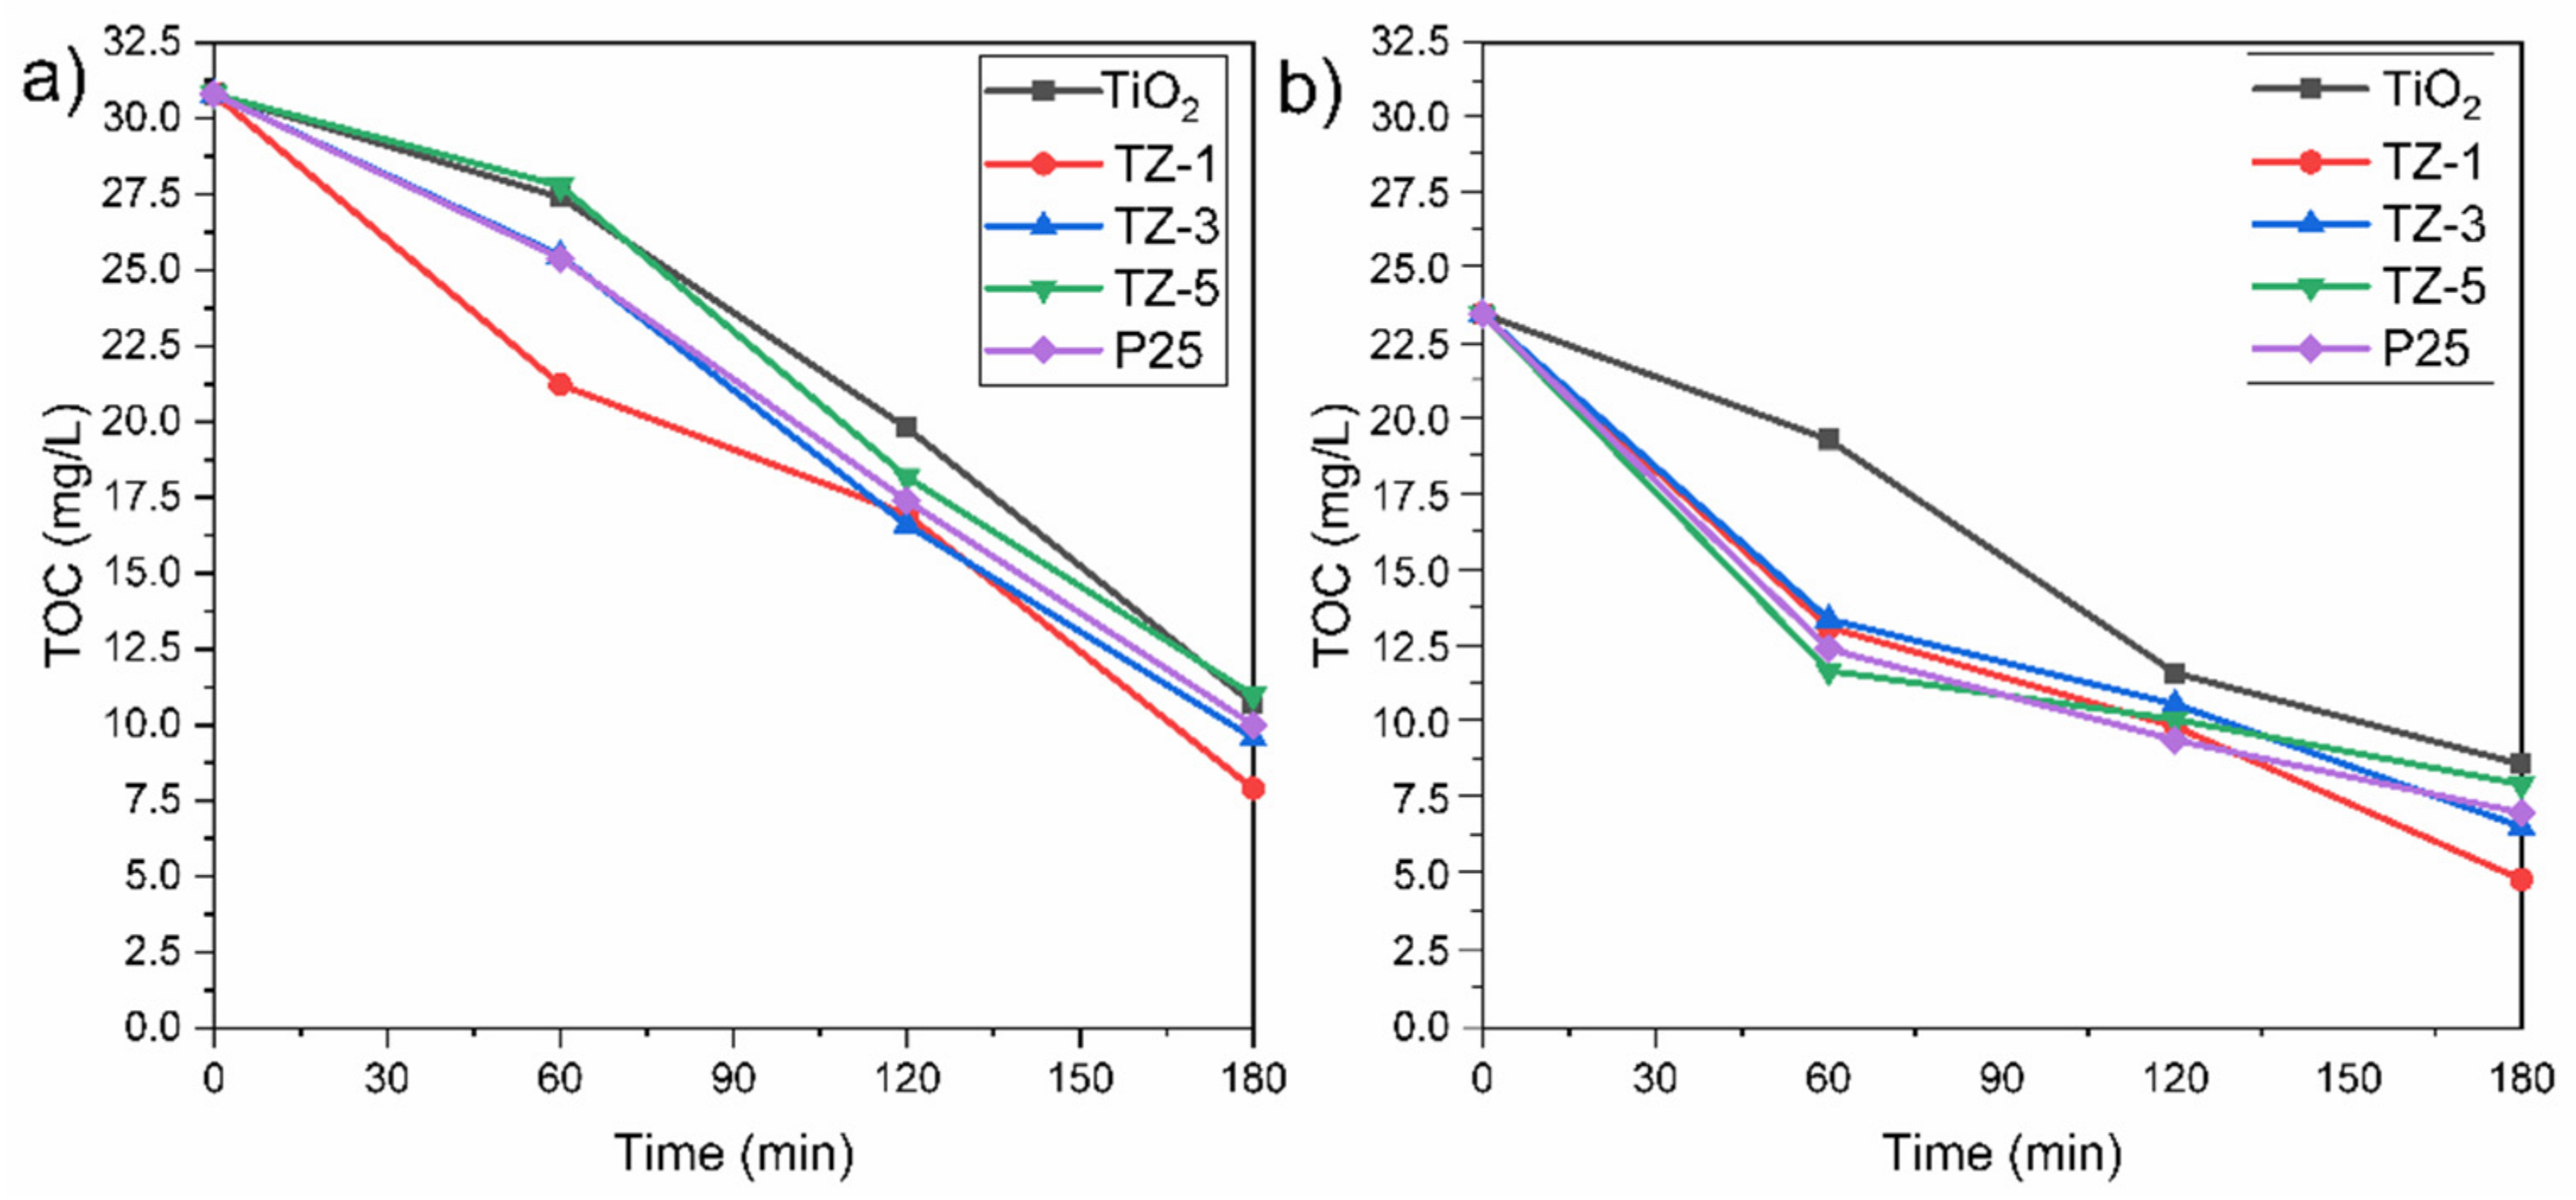
Generally, the decolorization of dyes is not an indication that the dyes have been completely oxidized into innocuous final products such as C2O and H2O. The oxidation of dyes can lead to the generation of byproducts, which can be more dangerous than the original pollutants. Due to this, it was necessary to evaluate the mineralization grade achieved by the photocatalysts. The TOC removal achieved by the photocatalytic samples is shown in Figure 11 for a concentration of 30 ppm of MO and RhB. The higher TOC content in the RhB solution than in the MO solution can be attributed to the differences in the size of the dye molecules, as well as differences in the molecular weight. The initial value of TOC for the RhB solution was 30.8 mg/L, and the final TOC values for the TiO2, TZ-1, TZ-3, TZ-5 and P25 samples were 10.7, 7.9, 9.56, 10.9 and 10 mg/L, respectively. For the RhB solution, the TZ-1 sample achieved a removal of TOC value of 74.3%. On the other hand, the initial value of TOC for the MO solution was 23.56 mg/L, and the final TOC values achieved by TiO2, TZ-1, TZ-3, TZ-5 and P25 were 8.7, 4.9, 6.64, 8.04 and 6.9 mg/L, respectively. The TOC removal percentage of MO gradually increased with time and achieved a removal value of 79.2% for TZ-1, the sample with the best performance. Compared with the degradation percentages of MO and RhB seen in Figure 8a,b, the removal percentage of TOC was lower under the same conditions. This is attributed to the fact that the dye was fragmented into smaller organic molecular substances such as carboxylic acids to be oxidized to simpler inorganic compounds during the photodegradation reaction. The TZ-1 photocatalyst achieved the highest TOC degradation in both dyes compared to the other TZ samples.
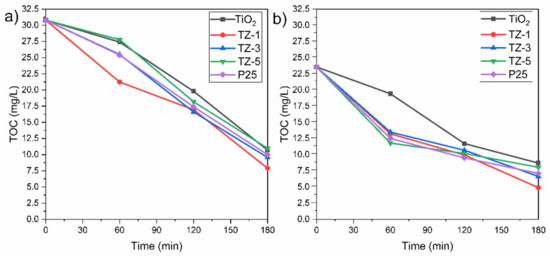
Figure 11.
Profiles of TOC removal for (a) RhB and (b) MO by TiO2, TZ-1, TZ-3 and TZ-5.
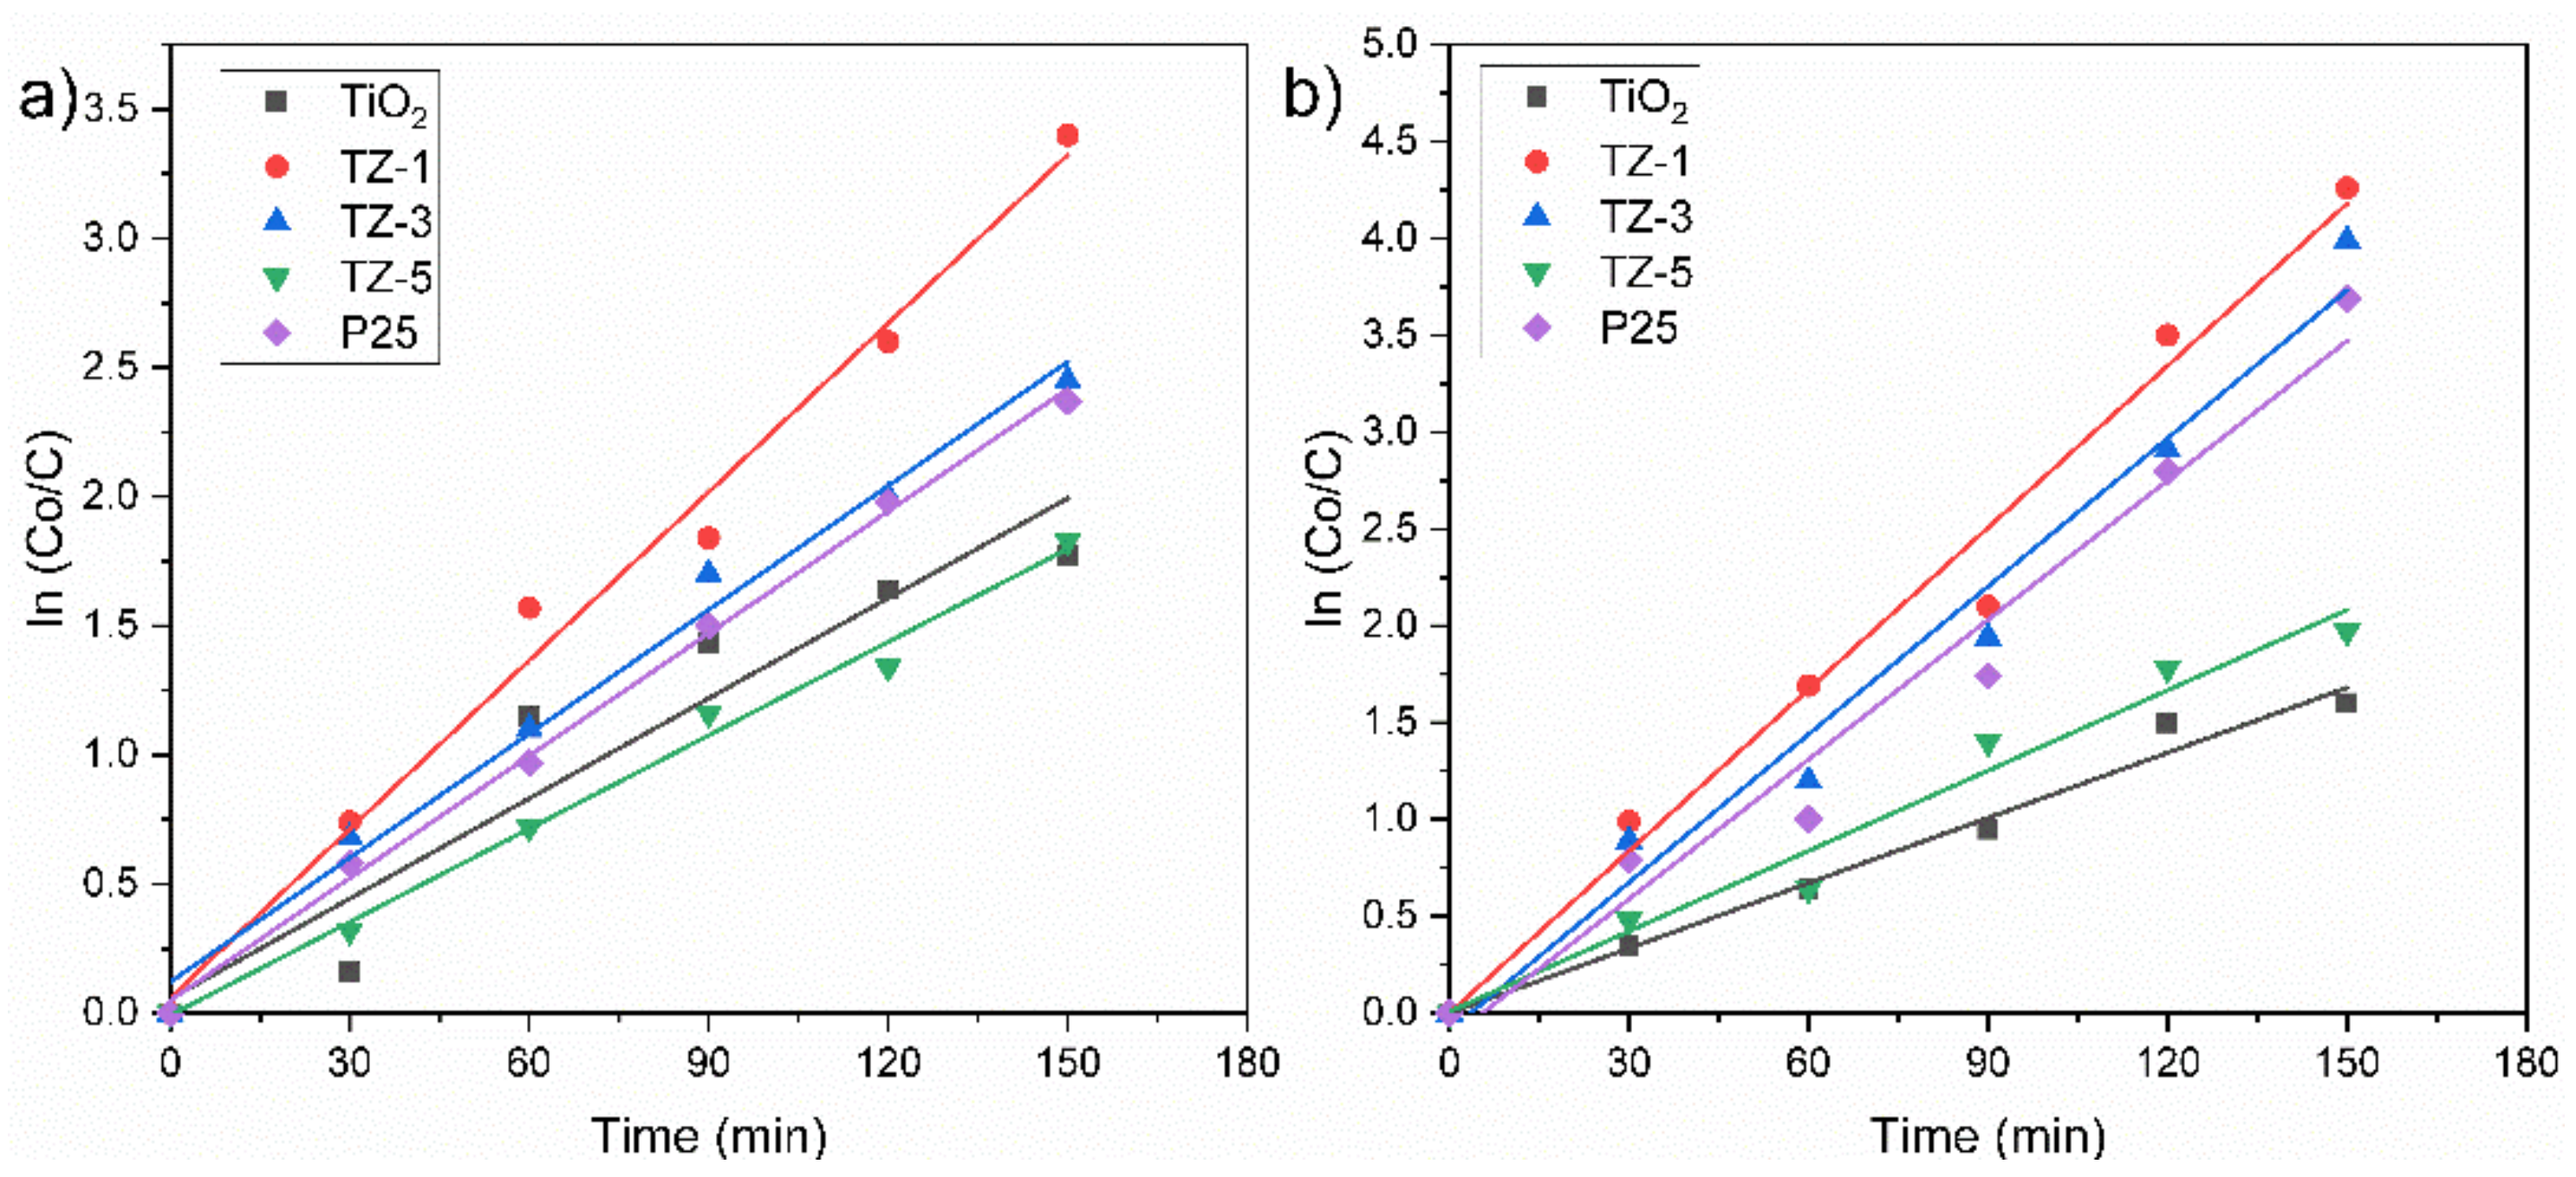
The Langmuir–Hinshelwood (L–H) model is the accepted mechanism to describe the kinetics of the photodegradation of an organic compound on the surface of a metal oxide:
where k is the rate constant, K is the adsorption coefficient, and C is the dye concentration. When C is millimolar, KC is negligible; thus, Equation (2) is simplified to an apparent pseudo-first-order kinetics [60].
Alternatively,
By plotting ln(Co/C) vs. time, the apparent pseudo-first-order rate constant kapp is calculated from the slope of the obtained straight line. The half-life time (degradation of pollutant to 50%) was calculated by the following equation:
This L–H model was applied to these reactions due to the following presumptions: (i) the reaction system is in dynamic balance, (ii) the reaction is carried out on the surface of photocatalysts between a radical and an adsorbed molecule in solution, (iii) there are no limits for the competition between byproducts, (iv) the e−/h+ pairs for the metal oxide are active on the surface sites and (v) the reaction is carried out with species in solution [61]. The obtained experimental data agree with a pseudo-first-order reaction represented by the slope of the fitted line for the ln(Co/C) vs. irradiation time (t) graph, Figure 12. The degradation percentage of RhB achieved by all samples was in the following order: TZ-1 (96.5%) > TZ-3 (91%) > P25 (89.8%) > TiO2 (81.2%) > TZ-5 (80.3%), whereas their corresponding kapp values were 0.02176 min−1 > 0.01698 min−1 > 0.01450 min−1 > 0.01279 min−1 > 0.01132 min−1, as shown in Table 2. For its part, the degradation percentage of MO achieved by all samples was in the following order: TZ-1 (99%) > TZ-3 (96.3%) > P25 (90%) > TZ-5 (84.6%) > TiO2 (75.5%), whereas their corresponding kapp values were 0.1172 min−1 > 0.01086 min−1 > 0.00969 cm−1 > 0.00925 min−1 > 0.0091 min−1, as shown in Table 2. In addition, the half-life times also were calculated (Table 2) and agree with the 50% of the dye concentration according to the values of the curves presented in Figure 8a,b. Based on these previous results, the degradation rates of the dyes were increased by adding a tiny quantity of ZrO2 in TiO2, and the highest degradation rate was achieved at 1% of Zr content for both dyes. The improvement in photocatalytic activity in the TZ samples in comparison with only TiO2 and P25 suggests the formation of a heterojunction between ZrO2 and TiO2 which favored the photocatalytic activity of the mixed oxide samples. With a particular addition of ZrO2 (1% wt.), there was the creation of lattice defects which generated oxygen vacancies. These oxygen vacancies can trap the photogenerated species and prolong their life which improves the photoactivity. However, higher loads of ZrO2 in TiO2 produced a defect excess and the formation of polycrystals by increasing the recombination of e−/h+ pairs, affecting the degradation of the dyes due to the fewer active site.

Figure 12.
Kinetics profile of (a) RhB and (b) MO by TiO2, TZ-1, TZ-3 and TZ-5.
Table 2.
Kinetic parameters of the different reactions presented by TiO2 and TZ samples.
The increased photodegradation of MO and RhB caused by the TZ samples can be attributed to the captures of electrons and is suggested as follows: it has been established that the doping of metal atoms provokes the creation of new phases dispersed into TiO2, trapping the photogenerated species () by avoiding the recombination of [25]. The created energy levels basically act as electron capture centers, helping in the separation of the photogenerated pairs [56]. However, an excess of the defects favors the recombination process, decreasing the photoactivity [33]. The separation can be carried out between TiO2 and in the mixed oxide because the energy level of TiO2 for Vb and Cb is contained inside the band gap of . Therefore, under irradiation of a photon that is energetically superior to the band gap energy of semiconductors, excited electrons of and migrate from their respective Vb to Cb, generating pairs. After that, some of the photogenerated electrons () of are captured by the Cb of TiO2, whereas holes () from TiO2 are trapped by the Vb of , helping to decrease the recombination process by improving the charge separation [62]. Therefore, the oxygen, as a strong electron acceptor, generates superoxide radicals when it reacts with the captured e- from located in Cb of . On the other hand, the h+ from TiO2 captured by the Vb of is now totally available to carry out the oxidation reaction of H2O to produce hydroxyl radicals (•OH) [63]. Finally, the superoxide and hydroxyl radicals (•OH) degrade the organic molecules to simpler compounds by producing CO2 and O as overall byproducts [25,45]. This process of migration and capture of photogenerated charges due to the presence of dispersed impurities improved the pair separation and reduced the recombination rate, as shown in the proposed mechanism, Figure 13. The reaction process is expressed from Equation (6) to Equation (13).
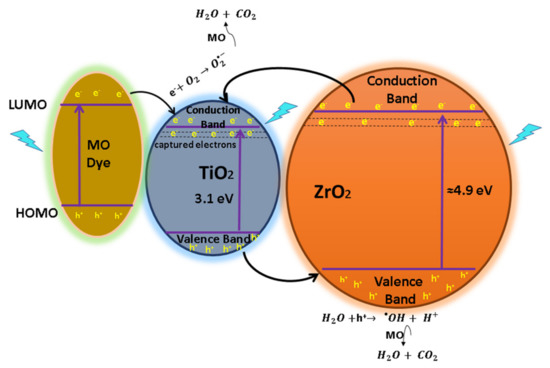
Figure 13.
Diagram of e−/h+ pair separation and the possible reaction mechanism for the TZ-1 photocatalysts under UV irradiation with dye sensitization.
On the other hand, the dye can be excited by light. Under illumination, the dyes adsorbed into the powder structure produce a photosensitizing effect and create free electrons to enter the photocatalyst internal structure. This mechanism is known as dye sensitization. Here, the dye molecules adsorbed on the surface of the photocatalyst are irradiated with photons and are photoexcited from the highest occupied molecular orbital (HOMO) to lowest unoccupied molecular orbital (LUMO) [64]. After, photoexcited electrons from the LUMO are captured by Cb of the photocatalyst, and the dye turns into a cationic radical. This radical is now susceptible to the photodegradation to produce less harmful products. The e− in the Cb of the photocatalyst is trapped by oxygen to generate and thus the photodegradation of the dye. Generally, when dye molecules are adsorbed on the catalyst structure, the dye sensitization mechanism is carried out.
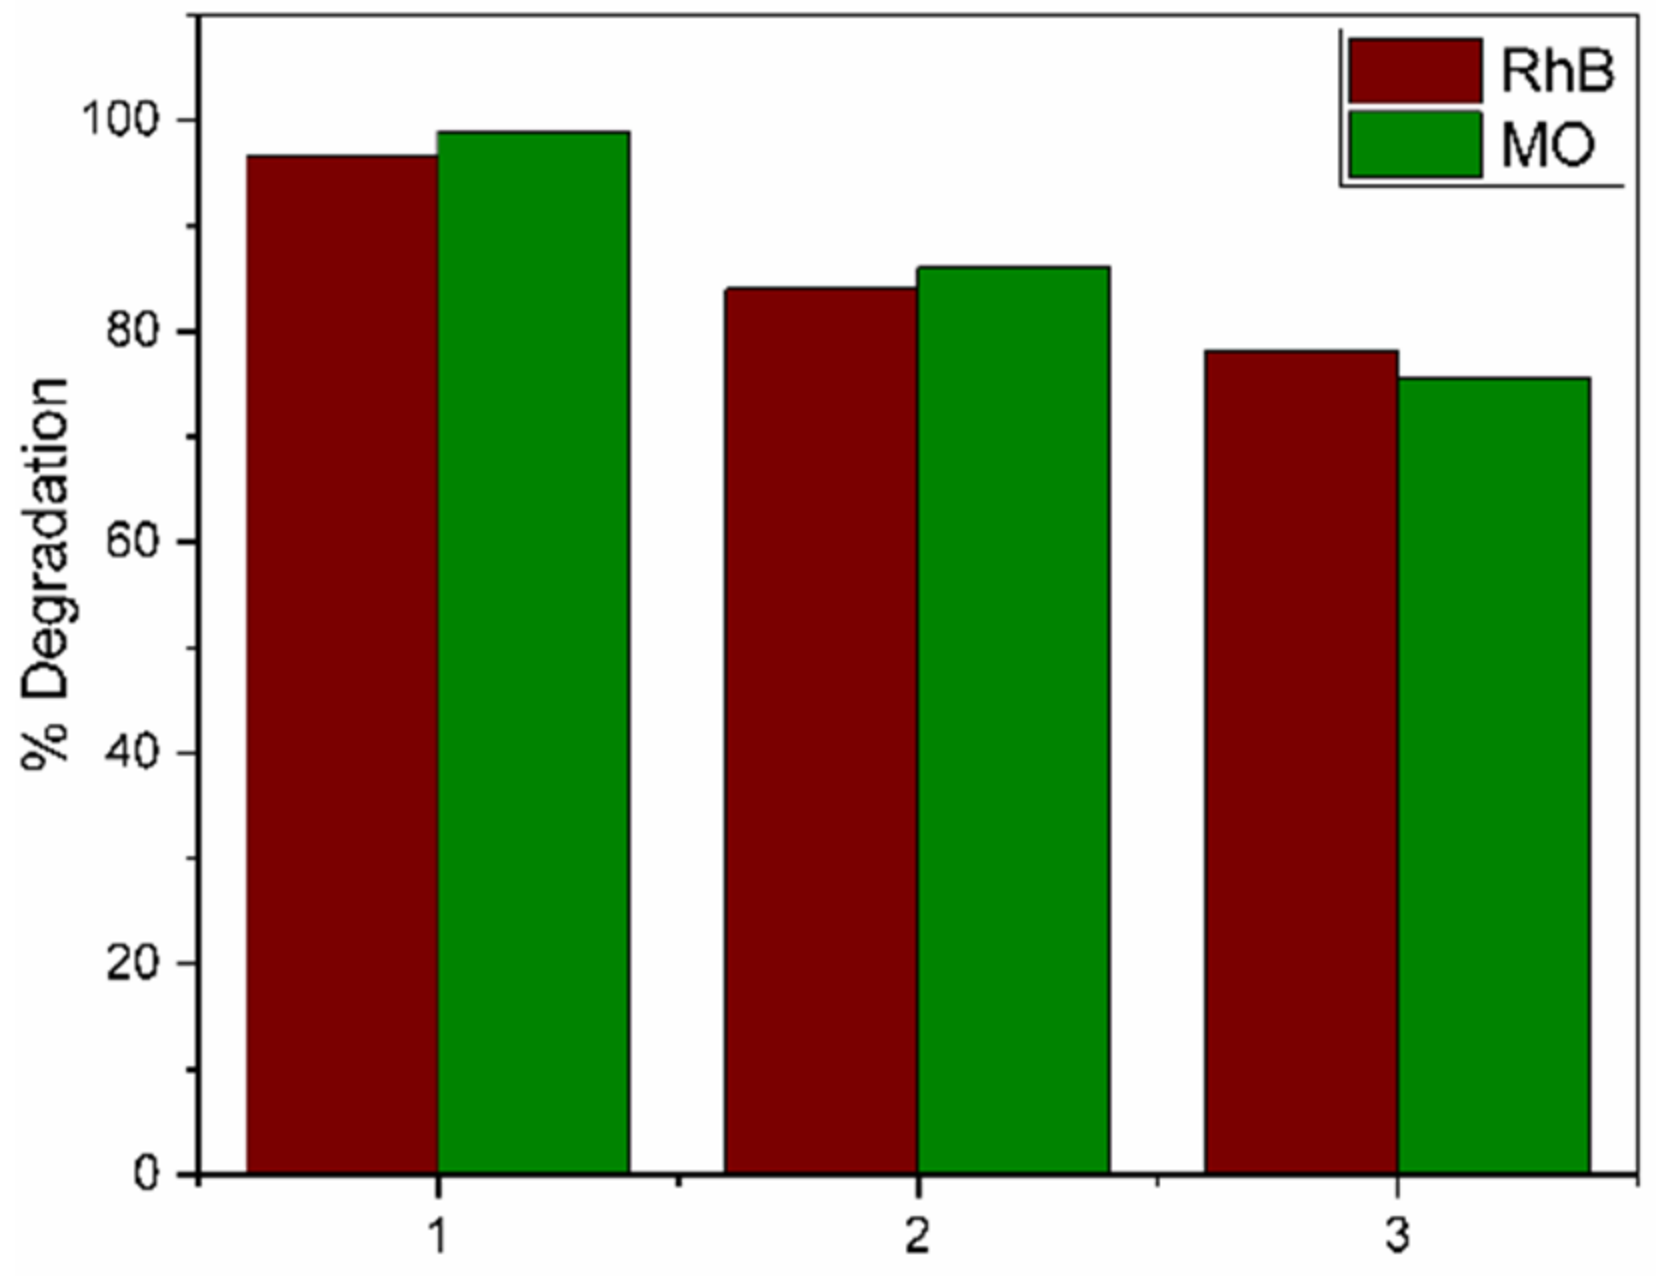
An important economic aspect of any photocatalyst is its reutilization. The reuse of the TZ-1 sample was tested in a solution of RhB and MO at 30 ppm, as shown in Figure 14. The photocatalyst was recovered after each cycle by centrifugation, and it was washed with distilled water and ethanol to be dried for 2 h at 80 °C. The results show that the photoactivity after three procedures achieved 78.1% when it was evaluated in the RhB solution at 3 h of the reaction, whereas for a solution of MO under the same conditions, it achieved 75.5% in dye removal. The decrease in photoactivity is attributed to the loss of surface area and to the deposition of byproducts at the surface of the photocatalyst. This probably led to a loss of active sites, agglomeration of nanoparticles and a decrease in the samples’ crystallinity, as other studies have suggested [33].
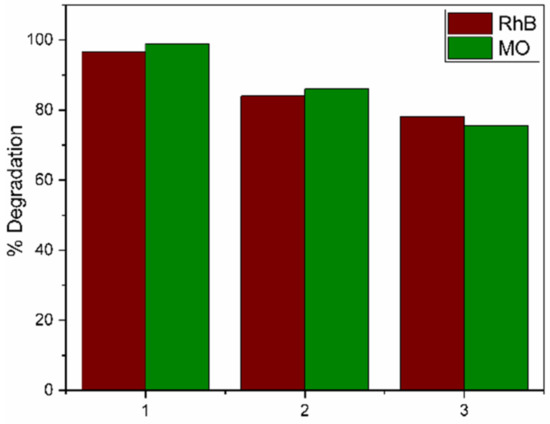
Figure 14.
Photocatalytic degradations by the TZ-1 sample after 3 cycles for RhB and MO.
3. Discussion
Through the XRD studies, the particle size values were found to be similar to those found in the TEM images, whereas the rings in the SAED patterns corresponded to their respective XRD diffraction patterns. For its part, the absorption edge of TiO2 presented a shift to a higher wavelength as the ZrO2 load was increased. This bathochromic shift is attributed to the modification of the band gap from the lattice defects as a result of the substitution of Zr into the TiO2 lattice. These results agree with those of XRD, which show differences in the crystal sizes as the ZrO2 load changes, and the presence of a shift to a lower angle of the principal signal diffraction, as it was seen. According to the result from N2 adsorption–desorption, the samples displayed a type IV isotherm as a result of a strong interaction between nanoparticles by generating mesoporous internal cavities. This finding is supported by the TEM analysis in Figure 2c,g, where the nanoparticles present high agglomeration with well-defined free volumes among them. Additionally, in the TEM images, the nanoparticles are below 12 nm in size, and the results seem to be consistent with the creation of inter-particulate pores. In FTIR analysis, the presence of a broad band between 3200 and 3500 cm−1 attributed to OH groups was observed. In this sense, the existence of hydroxyl groups on the photocatalyst surfaces helps to improve the e−/h+ pair separation under UV irradiation, by trapping the Cb electrons to favor the formation of surface (•OH) to promote dye degradation [25]. The TZ-1 and TZ-3 samples presented the highest photodegradations, but their bands attributed to OH groups were less intense in comparison with those of TiO2. Nevertheless, TiO2 and P25 probably had a higher recombination rate. It must be highlighted that the TZ-5 sample presented a higher surface area but not a better photodegradation in comparison with the TZ-1 and P25 samples, which had a lower surface area. In this sense, some authors have proposed that an excess of the defects created at a high Zr content in the TiO2 structure favors the recombination process, decreasing the photoactivity [7,33,56]. Recently, N. Yaacbo et al. [33] investigated the photodegradation performance of the ZrO2-TiO2 heterojunction on oily wastewater. The authors mentioned that a determinate quantity of ZrO2 into TiO2 affects the crystallinity of ZrO2-TiO2 heterojunction photocatalysts through anatase phase stabilization which can be more favorable for photocatalytic applications. In their study, they concluded that a higher ZrO2 content, decreasing the separation of the e–/h+ pairs, modified the creation of surface radicals, affecting the photocatalytic activity, and that the incorporation of Zr4+ into TiO2 provokes dissimilar defects depending upon the ZrO2 content. In our study, the TZ-1 sample presented a Zr4+ substitution by Ti4+ in the TiO2 anatase structure; the same result was found in the TZ-3 and TZ-5 samples. However, for the samples with 3 and 5% wt. of Zr4+, the presence of polycrystals in both samples was observed. This segregation of crystals can be attributed to the fact that contents above 1% of Zr4+ in TiO2-ZrO2 saturate the anatase phase structure, favoring the formation of ZrO2-independent crystals. These ZrO2-independent crystals did not form a heterojunction with TiO2, which directly decreased the photoactivity of the TZ3 and TZ-5 samples compared to TZ-1. According to the aforementioned result, the insertion of Zr4+ ions into the TiO2 structure and the lack of formation of ZrO2 crystals according to X-ray analysis in the TZ-1 sample improved the photocatalytic degradation of the dyes, probably due to an unsaturated TiO2 anatase structure, which produced a higher inhibition of the recombination process.
4. Materials and Methods
4.1. Synthesis of Nanocomposites
The TiO2-ZrO2 nanocomposites were prepared through the sol–gel method with titanium (IV) butoxide (C16H36O4Ti, Sigma-Aldrich 97%, St. Louis, MO, USA) and zirconium (IV) butoxide (C16H36O4Zr, Aldrich 90%) as precursors. The reactions began by mixing 44 mL of ethanol (Aldrich 99.4%), 18 mL of distilled water and the adequate amounts of C16H36O4Zr to obtain solids with 1, 3 and 5% wt. of ZrO2 at room temperature. Subsequently, the solutions were heated under reflux at 70 °C, and 44 mL C16H36O4Ti was added slowly to the reactors. The solutions were kept under stirring for 24 h. Afterwards, the formed gels were recovered and dried at 70 °C for 24 h. The obtained solids were ground into fine powders and annealed at 400 °C for 5 h. A TiO2 sample was prepared in the same way but without zirconium (IV) butoxide addition. The synthesized TiO2 and TiO2-ZrO2 photocatalysts with 1, 3 and 5% wt. of Zr4+ were labeled as TiO2, TZ-1, TZ-3 and TZ-5, respectively.
4.2. Characterization Techniques
Diffraction patterns were obtained by using an X-ray diffractometer (Panalytical Empyrean, Almelo, Netherlands) equipped with Cu Kα radiation (λ = 0.154 nm) in a 2θ range of 10°–80° to identify the crystalline phases. SEM images were obtained with scanning electron microscopy operating at 20 kV (Tescan, Brno, Czech Republic). TEM images were obtained using an HRTEM instrument (Jeol, Peabody, MA, USA) operated at 200 kV. The FTIR-ATR spectrum of the samples was recorded with an FTIR-ATR (Perkin Elmer, Waltham, MA, USA) spectrometer. The IR spectrum from 4000 to 400 cm−1 was recorded in attenuated diffuse reflectance mode with 10 scans and 4 cm−1 resolution. Mid-IR measurements were carried out with ATR technique. The UV–Vis DRS absorption spectra were acquired using a UV–Vis spectrophotometer (Shimadzu UV-2600, Kyoto, Japan) using an integration sphere. The equipment was previously calibrated with BaSO4 as reference. Textural properties of supports were determined by N2 adsorption–desorption with a Micromeritics, ASAP 2010 (Norcross, GA, USA). The samples were treated at 200 °C for 3 h in vacuum. N2 adsorption isotherms were measured at liquid N2 temperature (77 K), ranging from 10-6 to 1.0 P/P0, the N2 pressures. The Brunauer–Emmett–Teller and Barret–Joyner–Halenda methods were used to calculate the surface areas and the pore size distributions, respectively. Finally, TOC analysis was conducted using a TOC-L analyzer, (Shimadzu, SC, MD, USA).
4.3. Photocatalytic Studies
Photocatalytic studies were carried out at 298 K inside a cylindrical glass batch reactor. The reactor was prepared with an aqueous solution of 350 mL of the pollutant solution at 30 ppm and 200 mg of the photocatalyst. The solution was irradiated with a UV lamp (low-pressure mercury lamp) placed in an axial position within the reactor and protected by a quartz tube. At the beginning, the solution was maintained in the dark for 30 min to achieve the adsorption equilibrium between the photocatalyst and pollutant solution. After that, the light was turned on and water samples were taken every 30 min for 2.5 h and analyzed with an UV–Vis spectrophotometer. The dye concentration was calculated from the corresponding maximum absorption wavelength. The absorbance was proportional to the Beer–Lambert law in the range of the studied dye concentrations. The degradation percentages of the dyes were calculated by the following equation (Equation (1)):
where Co is the initial concentration of pollutant, and Ct corresponds to its concentration at time t. Furthermore, the photocatalytic experiments were carried out three times to verify the reproducibility. As additional experiments, the catalysts were evaluated under different pH values of the dye solutions and in the presence of Ca2+ and Mg2+ ions from CaCl2 and Mg(NO3)2 at 10 mg/L.
5. Conclusions
The materials synthesized in this study presented the anatase phase of TiO2, the crystalline arrangement with more photoactivity of TiO2. This anatase phase of TiO2 was slightly modified by the insertion of Zr4+ ions in its structure according to XRD and XPS analysis. Through SEM analysis, it was observed that the samples presented a high agglomeration grade and a semiglobular morphology, which was modified with the Zr increments in the TZ samples. TEM studies showed a nanoparticle size under 14 nm, which is favorable because it suggests that the anatase phase nanoparticles are highly stable. A decrease in the crystal size was seen as the Zr content increased. This performance is attributed to the presence of a Zr–O–Ti bond in the nanocomposite, impeding the growth of anatase crystals by creating the formation of dissimilar boundaries. Moreover, the formation of a heterojunction was created through direct heterogeneous nucleation and growth of ZrO2 within TiO2 throughout the thermal stage in the synthesis route. Through the UV–Vis studies, it was demonstrated that the doped zirconium creates new energy levels in the TiO2 structure due to the bathochromic shift, trapping the photogenerated species (e−/h+) by helping to avoid the recombination of the e−/h+ pairs. In the N2 adsorption–desorption analysis, it was seen that the TiO2 surface modification created a change in the isotherm shape. The values of the surface area, pore size and pore volume were also modified regarding TiO2. Our study shows that ZrO2–doped TiO2 composites exhibited a higher photocatalytic activity than just utilizing TiO2 or the commercial P25. Under acidic or basic conditions, the degradation of a dye in solution is determined by electrostatic interactions between the photocatalyst surface and the charge of the groups composing the dye molecule. The Zr-doped TiO2 photocatalyst at 1% wt. achieved the highest TOC removal in both dyes compared to the other photocatalysts. Finally, a third run cycle of the TZ-1 sample achieved a photocatalytic degradation of 78.1 and 75.5% for RhB and MO, respectively.
Author Contributions
Methodology, V.R.-S. and R.R.-T.; investigation, V.R.-S.; resources, A.P.-L.; writing—original draft preparation, V.R.-S.; writing—review and editing, A.P.-L. and V.R.-S.; visualization, O.A.G.V.; supervision, V.F.M.-R.; project administration, V.F.M.-R. and A.P.-L. All authors have read and agreed to the published version of the manuscript.
Funding
This research received no external funding.
Data Availability Statement
Not applicable.
Acknowledgments
Ruiz-Santoyo thanks the National Council for Science and Technology (CONACYT) for scholarship 633566. Dedicated to the memory of V. F. Marañón-Ruíz.
Conflicts of Interest
The authors declare no conflict of interest.
References
- Chung, K.T. Azo dyes and human health: A review. J. Environ. Sci. Health Part C Environ. Carcinog. Ecotoxicol. Rev. 2016, 34, 233–261. [Google Scholar] [CrossRef] [PubMed]
- Pandey, A.; Singh, P.; Iyengar, L. Bacterial decolorization and degradation of azo dyes. Int. Biodeterior. Biodegrad. 2007, 59, 73–84. [Google Scholar] [CrossRef]
- Hassaan, M.A.; El Nemr, A. Health and Environmental Impacts of Dyes: Mini Review. Am. J. Environ. Sci. Eng. 2017, 1, 64–67. [Google Scholar] [CrossRef]
- Ben Mansour, H.; Houas, I.; Montassar, F.; Ghedira, K.; Barillier, D.; Mosrati, R.; Chekir-Ghedira, L. Alteration of in vitro and acute in vivo toxicity of textile dyeing wastewater after chemical and biological remediation. Environ. Sci. Pollut. Res. 2012, 19, 2634–2643. [Google Scholar] [CrossRef]
- Weir, A.; Westerhoff, P.; Fabricius, L.; Hristovski, K.; Von Goetz, N. Titanium dioxide nanoparticles in food and personal care products. Environ. Sci. Technol. 2012, 46, 2242–2250. [Google Scholar] [CrossRef] [Green Version]
- Pelaez, M.; Nolan, N.T.; Pillai, S.C.; Seery, M.K.; Falaras, P.; Kontos, A.G.; Dunlop, S.M.P.; Hamilton, W.J.J.; Byrne, J.A.; O’Shea, K.; et al. A review on the visible light active titanium dioxide photocatalysts for environmental applications. Appl. Catal. B Environ. 2012, 125, 331–349. [Google Scholar] [CrossRef] [Green Version]
- Pirzada, B.M.; Mir, N.A.; Qutub, N.; Mehraj, O.; Sabir, S.; Muneer, M. Synthesis, characterization and optimization of photocatalytic activity of TiO2/ZrO2 nanocomposite heterostructures. Mater. Sci. Eng. B 2015, 193, 137–145. [Google Scholar] [CrossRef]
- Hisatomi, T.; Kubota, J.; Domen, K. Recent advances in semiconductors for photocatalytic and photoelectrochemical water splitting. Chem. Soc. Rev. 2014, 43, 7520–7535. [Google Scholar] [CrossRef]
- Khan, M.M.; Adil, S.F.; Al-Mayouf, A. Metal oxides as photocatalysts. J. Saudi Chem. Soc. 2015, 19, 462–464. [Google Scholar] [CrossRef] [Green Version]
- Yaacob, N.; Ismail, A.F.; Sean, G.P.; Nazri, A.M.N. Structural and photocatalytic properties of co-doped hybrid ZrO2–TiO2 photocatalysts. SN Appl. Sci. 2019, 1, 252. [Google Scholar] [CrossRef] [Green Version]
- Lee, S.Y.; Park, S.J. TiO2 photocatalyst for water treatment applications. J. Ind. Eng. Chem. 2013, 19, 1761–1769. [Google Scholar] [CrossRef]
- Zhang, D.; Zeng, F. Structural, photochemical and photocatalytic properties of zirconium oxide doped TiO2 nanocrystallites. Appl. Surf. Sci. 2010, 257, 867–871. [Google Scholar] [CrossRef]
- Dhandapani, C.; Narayanasamy, R.; Karthick, S.N.; Hemalatha, V.K.; Selvam, S.; Hemalatha, P.; Kumar, M.S.; Kirupha, S.D.; Kim, H.J. Drastic photocatalytic degradation of methylene blue dye by neodymium doped zirconium oxide as photocatalyst under visible light irradiation. Optik 2016, 127, 10288–10296. [Google Scholar] [CrossRef]
- Basahel, S.N.; Ali, T.T.; Mokhtar, M.; Narasimharao, K. Influence of crystal structure of nanosized ZrO2 on photocatalytic degradation of methyl orange. Nanoscale Res. Lett. 2015, 10, 1–13. [Google Scholar] [CrossRef] [Green Version]
- Kambur, A.; Pozan, G.S.; Boz, I. Preparation, characterization and photocatalytic activity of TiO2-ZrO2 binary oxide nanoparticles. Appl. Catal. B Environ. 2012, 115, 149–158. [Google Scholar] [CrossRef]
- Shao, G.N.; Imran, S.M.; Jeong, S.; Engole, M.; Abbas, N.; Haider, M.S.; Jae, S.; Taik, H. Sol–gel synthesis of photoactive zirconia–titania from metal salts and investigation of their photocatalytic properties in the photodegradation of methylene blue. Powder Technol. 2014, 258, 99–109. [Google Scholar] [CrossRef]
- Mohammadi, M.R.; Fray, D.J. Synthesis and characterisation of nanosized TiO2-ZrO2 binary system prepared by an aqueous sol-gel process: Physical and sensing properties. Sens. Actuators B Chem. 2011, 155, 568–576. [Google Scholar] [CrossRef]
- Guerrero-Araque, D.; Ramírez-Ortega, D.; Acevedo-Peña, P.; Zanella, R.; Gómez, R. Photocatalytic degradation of 2,4-dichlorophenol on ZrO2–TiO2: Influence of crystal size, surface area, and energetic states. J. Mater. Sci. Mater. Electron. 2020, 31. [Google Scholar] [CrossRef]
- Pérez-Larios, A.; Rico, J.L.; Anaya-Esparza, L.M.; Vargas, O.A.G.; González-Silva, N.; Gómez, R. Hydrogen production from aqueous methanol solutions using T-Zr mixed oxides as photocatalysts under UV radiation. Catalysts 2019, 9, 938. [Google Scholar] [CrossRef] [Green Version]
- Castro-Beltrán, A.; Luque, P.A.; Garrafa-Gálvez, H.E.; Vargas-Ortiz, R.A.; Hurtado-Macías, A.; Olivas, A.; Almaral-Sánchez, J.L.; Alvarado-Beltrán, C.G. Titanium butoxide molar ratio effect in the TiO2 nanoparticles size and methylene blue degradation. Optik (Stuttg) 2018, 157, 890–894. [Google Scholar] [CrossRef]
- Xia, Y.; Zhang, C.; Wang, J.X.; Wang, D.; Zeng, X.F.; Chen, J.F. Synthesis of Transparent Aqueous ZrO2 Nanodispersion with a Controllable Crystalline Phase without Modification for a High-Refractive-Index Nanocomposite Film. Langmuir 2018, 34, 6806–6813. [Google Scholar] [CrossRef]
- Sakka, S. Preface to the first edition. In Handbook of Sol-Gel Science and Technology; Springer: Cham, Germany, 2018. [Google Scholar] [CrossRef]
- Karunakaran, C.; Magesan, P.; Gomathisankar, P.; Vinayagamoorthy, P. Photocatalytic degradation of dyes by Al2O3-TiO2 and ZrO2-TiO2 nanocomposites. Mater. Sci. Forum 2013, 734, 325–333. [Google Scholar] [CrossRef]
- Nithya, N.; Bhoopathi, G.; Magesh, G.; Nesa, C.D. Materials Science in Semiconductor Processing Neodymium doped TiO2 nanoparticles by sol-gel method for antibacterial and photocatalytic activity. Mater. Sci. Semicond. Process. 2018, 83, 70–82. [Google Scholar] [CrossRef]
- Thejaswini, V.L.T.; Prabhakaran, D.; Maheswari, M.A. Synthesis of mesoporous worm-like ZrO2-TiO2 monoliths and their photocatalytic applications towards organic dye degradation. J. Photochem. Photobiol. A Chem. 2017, 344, 212–222. [Google Scholar] [CrossRef]
- Li, Q.; Feng, C.; Wu, P.; Yuan, X.; Hu, H.; Xue, G. Photocatalytic performance of mesoporous composites of TiO2–ZrO2 and phosphotungstic acid. J. Mater. Sci. 2019, 55, 3195–3211. [Google Scholar] [CrossRef]
- Wang, Y.M.; Liu, S.W.; Lü, M.K.; Wang, S.F.; Gu, F.; Gai, X.Z.; Cui, X.P.; Pan, J. Preparation and photocatalytic properties of Zr4+-doped TiO2 nanocrystals. J. Mol. Catal. A Chem. 2004, 215, 137–142. [Google Scholar] [CrossRef]
- Nguyen, C.H.; Fu, C.C.; Juang, R.S. Degradation of methylene blue and methyl orange by palladium-doped TiO2 photocatalysis for water reuse: Efficiency and degradation pathways. J. Clean. Prod. 2018, 202, 413–427. [Google Scholar] [CrossRef]
- McManamon, C.; Holmes, J.D.; Morris, M.A. Improved photocatalytic degradation rates of phenol achieved using novel porous ZrO2-doped TiO2 nanoparticulate powders. J. Hazard. Mater. 2011, 193, 120–127. [Google Scholar] [CrossRef]
- Dai, S.; Wu, Y.; Sakai, T.; Du, Z.; Sakai, H.; Abe, M. Preparation of Highly Crystalline TiO2 Nanostructures by Acid-assisted Hydrothermal Treatment of Hexagonal- structured Nanocrystalline Titania/Cetyltrimethyammonium Bromide Nanoskeleton. Nanoscale Res. Lett. 2010, 5, 1829–1835. [Google Scholar] [CrossRef] [PubMed] [Green Version]
- Luo, Q.; Cai, Q.; Li, X.; Pan, Z.; Li, Y. Chen, X.; Yan, Q. Preparation and characterization of ZrO2/TiO2 composite photocatalytic film by micro-arc oxidation. T. Nonferr. Metal. Soc. 2013, 23, 2945. [Google Scholar] [CrossRef]
- Maurya, A.; Bhatia, N. Microwave Assisted Sol Gel Synthesis of Magnesium Oxide (MgO). Int. J. Eng. Res. Dev. 2017, 13, 1–6. [Google Scholar]
- Yaacob, N.; Pei, G.; Aina, N.; Nazri, M.; Fauzi, A.; Nidzhom, M.; Abidin, Z.; Naidu, M. Simultaneous oily wastewater adsorption and photodegradation by ZrO2–TiO2 heterojunction photocatalysts. J. Water Process Eng. 2021, 39, 101644. [Google Scholar] [CrossRef]
- Miguel, A.L.; Yahia, E.M. Effect of TiO2-ZnO-MgO Mixed Oxide on Microbial Growth and Toxicity against Artemia salina Effect of TiO2-ZnO-MgO Mixed Oxide on Microbial Growth and Toxicity against Artemia salina. Nanomaterials 2019, 7, 992. [Google Scholar] [CrossRef] [Green Version]
- Jose, K.M.S. Streptomycin loaded TiO2 nanoparticles: Preparation, characterization and antibacterial applications. J. Nanostruct. Chem. 2016, 7, 43–57. [Google Scholar] [CrossRef] [Green Version]
- Catauro, M.; Tranquillo, E.; Dal Poggetto, G.; Pasquali, M.; Dell’Era, A.; Ciprioti, S.V. Influence of the heat treatment on the particles size and on the crystalline phase of TiO2 synthesized by the sol-gel method. Materials 2018, 11, 2364. [Google Scholar] [CrossRef] [Green Version]
- Simonsen, M.E.; Søgaard, E.G. Sol-gel reactions of titanium alkoxides and water: Influence of pH and alkoxy group on cluster formation and properties of the resulting products. J. Sol-Gel Sci. Technol. 2010, 53, 485–497. [Google Scholar] [CrossRef] [Green Version]
- Danks, A.E.; Hall, S.R.; Schnepp, Z. The evolution of ‘sol–gel’ chemistry as a technique for materials synthesis. Mater. Horizons 2016, 3, 91–112. [Google Scholar] [CrossRef] [Green Version]
- López, R.; Gómez, R.; Oros-Ruiz, S. Photophysical and photocatalytic properties of TiO2-Cr sol-gel prepared semiconductors. Catal. Today. 2011, 166, 159–165. [Google Scholar] [CrossRef]
- Yeung, K.L.; Leung, W.K.; Yao, N.; Cao, S. Reactivity and antimicrobial properties of nanostructured titanium dioxide. Catal. Today. 2009, 143, 218–224. [Google Scholar] [CrossRef]
- McDevitt, N.T.; Baun, W.L. Infrared absorption study of metal oxides in the low frequency region (700–240 cm−1). Spectrochim. Acta. 1964, 20, 799–808. [Google Scholar] [CrossRef]
- Vaizoğullar, A.İ.; Balci, A.; Uğurlu, M.; Karaoğlu, M.H. Synthesis of TiO2 and ZrO2/TiO2 Composite Microspheres and Their Photo-Catalytic Degradation of Methylene Blue, Afyon Kocatepe. Univ. J. Sci. Eng. 2016, 16, 54–60. [Google Scholar] [CrossRef] [Green Version]
- Abdennouri, M.; Elhalil, A.; Farnane, M.; Tounsadi, H.; Mahjoubi, F.Z.; Elmoubarki, R.; Sadiq, M.; Khamar, L.; Galadi, A.; Baâlala, M.; et al. Photocatalytic degradation of 2,4-D and 2,4-DP herbicides on Pt/TiO2 nanoparticles. J. Saudi Chem. Soc. 2015, 19, 485–493. [Google Scholar] [CrossRef] [Green Version]
- Chen, Y.; Ding, H.; Sun, S. Preparation and characterization of ZnO nanoparticles supported on amorphous SiO2. Nanomaterials 2017, 7, 217. [Google Scholar] [CrossRef] [PubMed] [Green Version]
- Anwer, H.; Mahmood, A.; Lee, J.; Kim, K.H.; Park, J.W.; Yip, C.K.A. Photocatalysts for degradation of dyes in industrial effluents: Opportunities and challenges. Nano Res. 2019, 12, 955–972. [Google Scholar] [CrossRef]
- Venkatachalam, N.; Palanichamy, M.; Arabindoo, B.; Murugesan, V. Enhanced photocatalytic degradation of 4-chlorophenol by Zr4+ doped nano TiO2. J. Mol. Catal. A Chem. 2007, 266, 158–165. [Google Scholar] [CrossRef]
- Guerrero-araque, D.; Ramírez-ortega, D.; Acevedo-peña, P.; Tzompantzi, F.; Calderón, H.A.; Gómez, R. Interfacial charge-transfer process across ZrO2 -TiO2 heterojunction and its impact on photocatalytic activity. J. Photochem. Photobiol. A Chem. 2017, 335, 276–286. [Google Scholar] [CrossRef] [Green Version]
- Pérez-Verdejo, A.; Sampieri, A.; Pfeiffer, H.; Ruiz-Reyes, M.; Santamaría, D.J.; Fetter, G. Nanoporous composites prepared by a combination of SBA-15 with Mg-Al mixed oxides. Water vapor sorption properties. Beilstein J. Nanotechnol. 2014, 5, 1226–1234. [Google Scholar] [CrossRef]
- Anaya-Esparza, L.M.; Montalvo-González, E.; González-Silva, N.; Méndez-Robles, M.D.; Romero-Toledo, R.; Yahia, E.M.; Pérez-Larios, A. Synthesis and characterization of TiO2-ZnO-MgO mixed oxide and their antibacterial activity. Materials 2019, 12, 698. [Google Scholar] [CrossRef] [Green Version]
- Meynen, V.; Cool, P.; Vansant, E.F. Verified syntheses of mesoporous materials. Microporous Mesoporous Mater. 2009, 125, 170–223. [Google Scholar] [CrossRef]
- Alothman, Z.A. A review: Fundamental aspects of silicate mesoporous materials. Materials 2012, 5, 2874–2902. [Google Scholar] [CrossRef] [Green Version]
- Silvestri, S.; Foletto, E.L. Preparation and characterization of Fe2O3/TiO2/clay plates and their use as photocatalysts. Ceram. Int. 2017, 43, 14057–14062. [Google Scholar] [CrossRef]
- Fan, X.; Chen, X.; Zhu, S.; Li, Z.; Yu, T.; Ye, J.; Zou, Z. The structural, physical and photocatalytic properties of the mesoporous. J. Mol. Catal. A Chem. 2008, 284, 155–160. [Google Scholar] [CrossRef]
- Li, M.; Li, X.; Jiang, G.; He, G. Hierarchically macro-mesoporous ZrO2-TiO2 composites with enhanced photocatalytic activity. Ceram. Int. 2015, 41, 5749–5757. [Google Scholar] [CrossRef]
- Lou, X.W.; Zeng, H.C. Complex α-MoO3 Nanostructures with External Bonding Capacity for Self-Assembly. Am. Chem. Soc. 2003, 125, 2697–2704. [Google Scholar] [CrossRef] [PubMed]
- Wang, F.; Pan, K.; Wei, S.; Ren, Y.; Zhu, H.; Wu, H.; Zhang, Q. Solvothermal preparation and characterization of ordered-mesoporous ZrO2/TiO2 composites for photocatalytic degradation of organic dyes. Ceram. Int. 2021, 47, 7632–7641. [Google Scholar] [CrossRef]
- Tian, J.; Shao, Q.; Zhao, J.; Pan, D.; Dong, M.; Jia, C.; Ding, T.; Wu, T.; Guo, Z. Microwave Solvothermal Carboxymethyl Chitosan Templated Synthesis of TiO2/ZrO2 Composites toward Enhanced Photocatalytic Degradation of Rhodamine B. J. Colloid Interface Sci. 2019, 541, 18–29. [Google Scholar] [CrossRef]
- Guerrero-Araque, D.; Acevedo-Peña, P.; Ramírez-Ortega, D.; Gómez, R. Improving photocatalytic reduction of 4-nitrophenol over ZrO2-TiO2 by synergistic interaction between methanol and sulfite ions. R. Soc. Chem. 2017, 41, 12655–12663. [Google Scholar] [CrossRef]
- Rodríguez-Cabo, R.C.B.; Rodríguez-Palmeiro, I.; Rodil, R.; Rodil, E.; Arce, A.; Soto, A. Photocatalytic degradation of methyl orange, methylene blue and rhodamine B with AgCl nanocatalyst synthesised from its bulk material in the ionic liquid [P6 6 6 14]Cl. Water Sci. Technol. 2016, 75, 128–140. [Google Scholar] [CrossRef] [PubMed]
- Konstantinou, I.K.; Albanis, T.A. TiO2-assisted photocatalytic degradation of azo dyes in aqueous solution: Kinetic and mechanistic investigations: A review. Appl. Catal. B Environ. 2004, 49, 1–14. [Google Scholar] [CrossRef]
- Gołąbiewska, A.; Kobylański, M.P.; Zaleska-Medynska, A. Fundamentals of metal oxide-based photocatalysis. Met. Oxide-Based Photocatal. 2018, 3–50. [Google Scholar] [CrossRef]
- Lee, K.M.; Lai, C.W.; Ngai, K.S.; Juan, J.C. Recent developments of zinc oxide based photocatalyst in water treatment technology: A review. Water Res. 2016, 88, 428–448. [Google Scholar] [CrossRef] [PubMed]
- Xu, A.W.; Gao, Y.; Liu, H.Q. The preparation, characterization, and their photocatalytic activities of rare-earth-doped TiO2 nanoparticles. J. Catal. 2002, 207, 151–157. [Google Scholar] [CrossRef]
- Prasanna, V.L.; Rajagopalan, V. A New Synergetic Nanocomposite for Dye Degradation in Dark and Light. Sci. Rep. 2016, 6, 1–10. [Google Scholar] [CrossRef]


Publisher’s Note: MDPI stays neutral with regard to jurisdictional claims in published maps and institutional affiliations. |
© 2021 by the authors. Licensee MDPI, Basel, Switzerland. This article is an open access article distributed under the terms and conditions of the Creative Commons Attribution (CC BY) license (https://creativecommons.org/licenses/by/4.0/).