Article

Influence of Pressure on Product Composition and Hydrogen Consumption in Hydrotreating of Gas Oil and Rapeseed Oil Blends over a NiMo Catalyst

Department of Petroleum Technology and Alternative Fuels, University of Chemistry and Technology Prague, Technická 5, 166 28 Prague, Czech Republic
*
Author to whom correspondence should be addressed.
Catalysts 2021, 11(9), 1093; https://doi.org/10.3390/catal11091093
Submission received: 4 August 2021 / Revised: 1 September 2021 / Accepted: 8 September 2021 / Published: 10 September 2021

Abstract

:
This study describes the co-hydrotreating of mixtures of rapeseed oil (0–20 wt%) with a petroleum feedstock consisting of 90 wt% of straight run gas oil and 10 wt% of light cycle oil. The hydrotreating was carried out in a laboratory flow reactor using a sulfided NiMo/Al2O3 catalyst at a temperature of 345 °C, the pressure of 4.0 and 8.0 MPa, a weight hourly space velocity of 1.0 h−1 and hydrogen to feedstock ratio of 230 m3∙m−3. All the liquid products met the EU diesel fuel specifications for the sulfur content (<10 mg∙kg−1). The content of aromatics in the products was very low due to the high hydrogenation activity of the catalyst and the total conversion of the rapeseed oil into saturated hydrocarbons. The addition of a depressant did not affect the cold filter plugging point of the products. The larger content of n-C17 than n-C18 alkanes suggested that the hydrodecarboxylation and hydrodecarbonylation reactions were preferred over the hydrodeoxygenation of the rapeseed oil. The hydrogen consumption increased with increasing pressure and the hydrogen consumption for the rapeseed oil conversion was higher when compared to the hydrotreating of the petroleum feedstock.

Graphical Abstract

1. Introduction

The production of renewable fuels has been growing worldwide driven by government requirements and incentives which are mainly linked to efforts to reduce greenhouse gas emissions. The hydrotreating of vegetable oils and animal fats is an excellent way to produce a high-quality renewable diesel fuel component. This diesel fuel component is commonly called Hydrotreated Vegetable Oil or Hydrodeoxygenated Vegetable Oil (HVO), Hydrotreated Esters and Fatty Acids (HEFA), renewable synthetic diesel, or renewable paraffinic diesel fuel from the hydrotreatment.
Vegetable oils and animal fats are composed mainly of C14–C24 fatty acid triglycerides, while the C18 fatty acid triglycerides are often the most abundant ones. All naturally occurring fatty acids have an even number of carbon atoms. Unsaturated fatty acids with one or more double bonds dominate in most vegetable oils and are also common in fish oils. Saturated fatty acids are common in fats from mammals (pork fat, tallow) [1,2].
The total worldwide capacity of all the installed units for the HVO production is approximately 4.5 million tonnes per year [3]. In addition, there are companies that co-process triglyceride feedstocks with petroleum distillates [3]. Conventional gas oil hydrotreating offers a robust and flexible process to convert a wide variety of triglyceride feedstocks into HVOs that are compatible with the existing diesel fuel infrastructure and engines.
The product from the hydrotreating of a triglyceride feedstock is mainly composed of n-alkanes that are stable, have a high cetane number, low density, but high cold filter plugging point (CFPP). Therefore, HVO production usually includes an isomerisation unit for the improvement of the low-temperature properties [1,2]. The products from these units may then contain a large content of isoalkanes and only a small content of n-alkanes [4].
Hydrogenation of the double bonds contained in the unsaturated acyls of the triglycerides usually precedes the conversion of triglycerides to alkanes. At least two reaction pathways are then involved in the conversion of the saturated triglycerides [5].
One mechanism involves a hydrodeoxygenation (HDO) reaction which produces water, propane, and n-alkanes of the full length of the fatty acid chains. Therefore, the formed n-alkanes have an even number of carbon atoms in their molecules. By this reaction, one mole of saturated glyceride reacts with 12 moles of hydrogen and forms one mole of propane, six moles of water, and three moles of n-alkanes.
By the other mechanism, which is usually called hydrodecarboxylation (HDCx), one mole of triglycerides reacts with three moles of hydrogen creating one mole of propane, three moles of carbon dioxide, and three moles of n-alkanes with one carbon atom less than the fatty acids involved in the triglycerides. Therefore, the formed n-alkanes have an odd number of carbon atoms in their molecules. The carbon dioxide generated by the HDCx method can be partially reduced by hydrogen to carbon monoxide and water.
According to the results of other authors, hydrodecarbonylation (HDCn) is together with HDO and HDCx involved in the triglyceride conversion to hydrocarbons [6,7]. By this reaction, one mole of saturated triglyceride reacts with six moles of hydrogen and forms one mole of propane, three moles of water, and three moles of n-alkanes. The formed n-alkanes have an odd number of carbon atoms in their molecules similar to the n-alkanes from the HDCx pathway. The consumption of hydrogen on the HDCn of one mole of saturated triglyceride is the same as in its HDCx pathway, in which three moles of CO2 formed by the reaction react with three moles of hydrogen and are converted to three moles of CO and three moles of water. The CO2 produced by HDCx and mostly the CO generated either by HDCn or by the reduction of CO2 by hydrogen can react with another hydrogen to form methane and water.
The relative proportion of the HDO, HDCx, and HDCn reactions in the conversion of the triglyceride feedstock and the extent of methanation of the resulting carbon oxides are of major importance in the hydrotreating as these influence the hydrogen consumption, liquid product yield, composition, and the possible processing of the gaseous products and heat balance of the process.
The amount of triglyceride feedstocks available to produce diesel fuels is relatively small compared to the number of middle petroleum distillates. Therefore, a 2.5–30 wt% triglyceride feedstock has typically been used in its co-processing with middle petroleum fractions [5,8,9].
The co-processing of triglyceride feedstocks with petroleum distillates is usually performed using sulfided NiMo/Al2O3 or CoMo/Al2O3 catalysts, at a temperature of 340–380 °C, a hydrogen pressure of 4–8 MPa, hydrogen to feedstock ratio of 240–500 m3∙m−3 and a WHSV of 1.0–1.5 h−1 [5,8,9,10]. With a higher content of triglyceride feedstock in the mixture being treated (20–30 wt%), higher hydrogen to feedstock ratio is often used when compared to processing mixtures with a lower triglyceride feedstock content to compensate for the higher hydrogen consumption [5]. With a WHSV greater than 1.0 h−1, the sulfur content in the obtained product is usually higher than 10 mg∙kg−1 [5,10].
The desulfurisation of a mixed feedstock containing middle petroleum distillates and a triglyceride feedstock is usually a control reaction that determines the setting of the reaction conditions for the hydrotreating of these mixed feedstocks. The reaction temperature, pressure and hydrogen purity, the weight hourly space velocity (WHSV), and the hydrogen to feedstock ratio must be set to obtain a liquid product with a required sulfur content (e.g., 10 mg∙kg−1 in the EU). The complete conversion of the triglyceride feedstock into linear alkanes is usually performed under relatively milder reaction conditions. During the hydrotreating using a sulfided NiMo/Al2O3 catalyst, a pressure of 5 MPa, a WHSV of 1.0 h−1, the complete deoxygenation of the rapeseed oil was achieved at a temperature of 270 °C [11].
This study aimed at determining the effect of the hydrogen pressure on the hydrogen consumption and properties and composition of the products from the hydrotreating of typical feedstocks for diesel production and mixtures with 5, 10, 15, and 20 wt% of rapeseed oil.

2. Results

2.1. Mass Balance of the Hydrotreating Experiments

The F0 feedstock and the blends of the F0 feedstock with 5, 10, 15, or 20 wt% of the rapeseed oil (RO) were hydrotreated at pressures of 4 and 8 MPa, a temperature of 345 °C, hydrogen to feedstock ratio of 240 m3·m−3 and a WHSV of ca 1.0 h−1 (feedstock flow rate of 100 g·h−1). The used pressure of the individual experiments, the labelling of the products, and the liquid product yield are given in Table 1. As seen, the yield of liquid products from the hydrotreating of the F0 feedstock (P4-0, P8-0) was 98.8 and 99.9 wt%, respectively. The yield of the liquid products decreased with an increasing RO content due to the gaseous by-product formation from the RO conversion (propane, carbon oxides). The yield of the liquid products was slightly improved by increasing the hydrogen pressure from 4 to 8 MPa. The higher pressure suppressed the cracking reactions and increased the amount of hydrogen in the products, mainly due to the hydrogenation of the aromatics, as is shown below.
The water formed during the HDO and HDCn of the RO, which was visible as the bottom layer, was removed with a syringe. From the products obtained, light compounds with a boiling point up to 150 °C were removed by distillation. The mass balance of the distillation is shown in Table 2. The yield of the stabilised product was about 99.0 wt% and the distillate yield was 0.5–1.0 wt%. The losses were caused by the leak of a small content of light compounds during the distillate handling and a small portion of the light liquid products remained inside the distillation column. High yields of the stabilised liquid product from the hydrotreating and the low yields of the distillate indicate that the rate of feedstock hydrocracking was very low.

2.2. Group-Type Composition

Rapeseed oil typically does not contain aromatic hydrocarbons; therefore, the content of dicyclic aromatic hydrocarbons (DAHs) and tricyclic aromatic hydrocarbons (TAHs) in the feedstock decreased as the RO content increased (Figure 1). The content of the DAHs and TAHs in the hydrotreating products was significantly lower compared to the corresponding feedstock. Neither the DAH nor TAH contents in the products changed significantly with an increasing RO content in the feedstock. At 8 MPa, a lower content of TAHs and DAHs was achieved than at 4 MPa.
The DAHs and TAHs were hydrogenated to monocyclic aromatic hydrocarbons (MAHs) and these were partially converted to saturated hydrocarbons (SHCs) (Figure 2), mainly at 8 MPa. The content of SHCs in the products was higher compared to the corresponding feedstock also due to the conversion of the RO to alkanes. At 4 MPa, the content of SHCs increased and the content of MAHs decreased with an increasing RO content in the feedstock. At 8 MPa, a higher SHC content was achieved than at 4 MPa, but the SHC content did not increase with an increasing RO content in the feedstock.

2.3. Content of n-Alkanes

The content of the n-alkanes in the stabilised liquid products is given in Table 3. It can be seen that the C16− and C19+ n-alkane contents did not show any significant differences because the C16 and C20+ acyl groups in the RO formed only 5.9 wt% and 2.9 wt% of all the RO acyls, respectively. The C18 acyls in the RO accounted for 91.1 wt% of all the RO acyls; therefore, the content of C17 and C18 n-alkanes in the products increased with an increasing amount of RO in the feedstock. At 4 MPa, the ratio of C17/C18 n-alkanes in the products increased with an increasing amount of RO in the feedstock. This suggests that the hydrodeoxygenation (HDO) reaction is inhibited, probably due to a higher concentration of oxygen compounds derived from the RO conversion in the reaction mixture. At 8 MPa, the inhibitory effect of the oxygen compounds did not appear as the C17/C18 ratio of n-alkanes in the products did not change depending on the increasing amount of RO in the feedstock.

2.4. Content of Sulfur, Nitrogen, and Polyaromatics

The RO contained only 4 mg∙kg−1 of sulfur; therefore, the sulfur content in the feedstock decreased with an increasing RO content. With an increasing RO content in the feedstock, the sulfur content in the stabilised hydrotreating products also decreased (Table 4). At 8 MPa, products with a lower sulfur content were obtained compared to the products obtained at 4 MPa. The desulfurisation of the feedstock reached 99.7 wt% and 99.9 wt% at 4 MPa and 8 MPa, respectively. The desulfurisation activity of the catalyst practically did not depend on the RO content in the feedstock. A slightly higher desulfurisation rate of the feedstock containing 15–25 wt% RO compared to a pure petroleum feedstock in the hydrotreating on a NiMo/Al2O3 catalyst was reported by Donnis et al. [5]. However, this was finally attributed to a slight deactivation of the catalyst in the pilot plant test and not to promote the effect of the RO [5].
The nitrogen content in the products was very low, the denitrogenation efficiency was 98.3 wt% and 98.9 wt% at 4 and 8 MPa, respectively. At 8 MPa, the nitrogen content was a bit lower compared to 4 MPa. The used catalyst had a high hydrogenation activity; therefore, the content of the polycyclic aromatic hydrocarbons (PAHs) in the products was very small. The content of PAHs was practically independent of the content of the RO in the feedstock. At 8 MPa, the products had a lower PAH content compared to the products obtained at 4 MPa (Table 4).

2.5. Physicochemical Properties

Compared to the feedstock, the density of the P4-0 and P8-0 products decreased from 852 kg∙m−3 (initial value) to 840 kg∙m−3 and 834 kg∙m−3, respectively (Table 5). This was due to the conversion of the TAHs and DAHs to monocyclic aromatic hydrocarbons (MAHs) and saturated hydrocarbons. For the same reason, the cetane index of the products increased.
The density of the products decreased and the cetane index increased as more RO was processed (Table 5), which mainly corresponds to the increasing amount of the n-alkanes formed at the RO conversion (Table 3). The CFPP was not affected much by the rapeseed oil content in the feedstock, although C17 and C18 n-alkanes were formed during the RO conversion.
The density of the products obtained at 8 MPa was slightly lower than that of the products obtained at 4 MPa because the content of saturated hydrocarbons in the products increased with increasing pressure (Figure 2). The viscosity of the products hardly changed with an increasing hydrotreating pressure and RO content in the feedstock.
The low density and high cetane index of the alkanes arising from the RO hydrotreating would allow the use of a higher content of middle distillates from the thermal or catalytic cracking in the production of diesel fuels as the high density and low cetane index of these low-value streams limit their amount in diesel pool [12].
To improve the low-temperature properties of the products, different concentrations (100, 200, 300 and 500 mg·kg−1) of a commercial depressant (Infineum R288) were added to the selected products obtained by hydrotreating the feedstocks containing 0, 10 and 20 wt% of RO. The results (Table 6) show that the depressant did not sufficiently improve the CFPP of the products that were prepared by hydrotreating the feedstock containing 10 and 20 wt% of RO. For the P4-0 product obtained by hydrotreating a feedstock that did not contain RO, the CFPP decreased from −3 to −21 °C when 500 mg kg−1 of the depressant was added. The inactivity of the depressant in reducing the CFPP value of the products prepared by hydrotreating the feedstocks containing RO corresponds to the results published in the work of Šimáček et al. [13]. The depressants Keroflux® 3566 (BASF) and Infineum R 288 (Infineum) showed negligible efficiency in the mixtures of mineral diesel fuels and 5–30 wt% of the product from the RO hydrotreating while the CFPP of the pure mineral diesel fuel dropped from −12 to ca −30 °C when 500 mg∙kg−1 of the depressant (flow improvers) was added [13]. This phenomenon probably relates to a high content of C17 and C18 n-alkanes that have a high melting point. The growth of crystals can be so fast that the depressants are not able to keep the dispersed microcrystalline structure of the system. This leads to the formation of large crystals that block the filter of the CFPP testing device. The different shapes of growing crystals can also play an important role.

2.6. Composition of Gaseous Products

It can be seen from Figure 3 and Figure 4 that the CO2, CO, methane, and propane content in the gaseous products increased depending on an increasing amount of the RO in the feedstock, as expected. The methane and propane contents in the gaseous products from hydrotreating the pure mineral feedstock were very low, around 0.30 and 0.25 vol%, respectively (Figure 3). The content of ethane, butane, and C4+ hydrocarbons in the gaseous products was also very low, each ranging from 0.1 to 0.2 vol%; they were not dependent on the amount of RO in the feedstock. This indicates the very small extent of cracking of these feedstocks.
The increasing amount of methane depending on the increasing amount of RO in the feedstock (Figure 3B) was caused by the methanation of CO, the methanation of CO2 probably did not occur under the used reaction conditions [14,15,16]. The methanation reaction is promoted by increasing pressure, so the amount of methane in the products obtained at 8 MPa was higher than in the products obtained at 4 MPa. The greater extent of the methanation and hydrogenation of the aromatics (Figure 1 and Figure 2) at 8 MPa resulted in greater consumption of hydrogen. The volume of gaseous products decreased and this led to an increase in the content of propane and methane in the gaseous products (Figure 3). The CO content in the gaseous products obtained at 8 MPa was lower than in the products obtained at 4 MPa, which was largely due to its methanation (Figure 4).

2.7. Share of the HDO, HDCx and HDCn in the RO Conversion

In accordance with the increase in the ratio of the C17/C18 n-alkanes in the liquid products gained at 4 MPa, the share of the HDO reaction in the RO conversion decreased with an increasing RO content in the feedstock (Figure 5A). At 8 MPa, the share of HDO in the RO conversion hardly changed. The share of HDCx (Figure 5B) increased and, conversely, the share of HDCn in the RO conversion (Figure 5C) decreased at both pressures depending on the increasing RO content in the feedstock. At the higher pressure, the greater part of the RO was converted by the HDO and a lower part by the HDCx and HDCn compared to the lower pressure. The 30% share of the HDO in the RO conversion at 4 MPa and 15 wt% RO in the raw material is similar to that reported in the literature [5].
A large part of the CO formed during the HDCn of the RO was converted to methane (Figure 5D). The share of methanation of the CO decreased with the increasing RO content in the feedstock and decreasing pressure. At 4 MPa and 15 wt% RO in the feedstock, about 38 % of the CO was converted by methanation, which is only slightly more than the 30% reported by Donnis et al. [5] from their experiments under similar reaction conditions and a 15 wt% RO in the feedstock.

2.8. Hydrogen Consumption

When hydrotreating the F0 feedstock, the hydrogen was consumed mainly for the dearomatisation of the feedstock (Table 7). At 8 MPa, the hydrogenation of the TAHs, DAHs and MAHs contained in the F0 feedstock was greater (Figure 1 and Figure 2), therefore, the hydrogen consumption at this pressure (P8-0 product) was doubled compared to the hydrotreating of this feedstock at 4 MPa (P4-0 product). The products obtained by hydrotreating the F0 feedstock at both pressures were deeply desulfurised and denitrogenated (Table 4), the hydrogen consumption for the HDS and HDN of the F0 feedstock at 8 MPa was only 5.5% and 0.8% of total hydrogen consumption, respectively.
In all the hydrotreated feedstocks, most of the hydrogen was consumed for the dearomatisation (Table 7). In the experiments performed with 15 and 20 wt% of the RO in the feedstock at 4 MPa, the hydrogen consumption related to the conversion of the RO into hydrocarbons was ca 330 dm3·kg−1 including methanation. It is more than reported by Donnis et al. [5] at similar experiments (280 m3∙m−3, i.e., ca 305 m3∙kg−1). This difference is mainly caused by the higher level of HDO in the RO conversion and the higher extent of the methanation in our research. At 8 MPa, the hydrogen consumption related to the conversion of the pure RO into hydrocarbons was 383–405 dm3·kg−1 (including methanation). The higher hydrogen consumption at 8 MPa was caused by the greater share of HDO in the RO conversion and the greater extent of methanation, compared to hydrotreating at 4 MPa. The hydrogen consumption increased with an increasing RO content in the feedstock, as more hydrogen was consumed for the RO hydrotreating compared to the HDA, HDS, and HDN of the petroleum feedstock.
The experiments were performed at the same hydrogen flow rate, so the excess hydrogen at the reactor inlet decreased with an increasing RO content in the feedstock and pressure. The hydrotreating of the F0 petroleum feedstock was performed at a hydrogen excess of 6.3 and 2.7, while the hydrotreating of the F20 feedstock containing 20 wt% of RO was performed at a hydrogen excess of only 1.7 and 1.2 for the pressures of 4 and 8 MPa, respectively. The smaller hydrogen excess did not negatively influence the desulfurisation of the feedstock containing up to 20 wt% RO.
The TAHs present in the feedstock were largely converted to DAHs. The resulting DAHs, as well as the DAHs presented originally in the feedstock, were largely hydrogenated to MAHs, and these newly formed MAHs as well as MAHs from the feedstock were partly converted to saturated compounds. The total amount of TAHs, DAHs, and MAHs removed from the feedstocks in each experiment is presented in Table 8. It is clear from the data that the higher hydrogen consumption at 8 MPa was mainly due to the greater removal of MAHs at 8 MPa compared to hydrotreating at 4 MPa.
Table 8 also shows the relative removal of the individual types of aromatics by hydrogenation during the individual hydrogenation reactions. The total amount of TAHs, DAHs in g∙h−1 removed by hydrogenation decreased slightly with an increasing RO content in the feedstock because their amount in the feedstock decreased as the RO content in the feedstock increased. The relative amounts of TAHs and DAHs removed by hydrogenation did not change with an increasing amount of RO in the feedstock. At 8 MPa, ca 90% of the TAHs and DAHs were converted to DAHs and MAHs, respectively. At 4 MPa, only 70% of the TAHs and DAHs were converted to DAHs and MAHs, respectively.
The hydrogenation of MAHs is more difficult than the hydrogenation of DAHs and TAHs, as evidenced by the relatively smaller amount of MAHs removed (Table 8). The amount of MAHs removed was much greater at 8 MPa than at 4 MPa, due to the higher hydrogen partial pressure. At the higher pressure, the amount of removed MAHs decreased with the increasing RO content in the feedstock which was probably caused by the decreasing excess of hydrogen (Table 7). At 4 MPa, the amount of MAHs removed surprisingly increased with the increasing amount of RO in the feedstock. This increase could not be satisfactorily explained.

3. Materials and Methods

3.1. Materials

The basic feedstock for the hydrotreating was a mixture containing 90 wt% of straight run gas oil (SRGO) and 10 wt% of light cycle oil (LCO) from fluid catalytic cracking. This mixture is referred to as “F0”. The SRGO and LCO were obtained from the production of summer diesel fuel in the Unipetrol RPA refinery in Kralupy nad Vltavou, the Czech Republic. At the given quality of SRGO and LCO, 10–12 wt% of the LCO is the usual content in the feedstock used for diesel fuel production. The basic properties of the F0 feedstock are summarised in Table 9.
The F0 feedstock and its mixtures with 5, 10, 15, or 20 wt% of commercial food-grade rapeseed oil (RO) were hydrotreated. The acyl profile of the RO showed that the C18 acyls accounted for more than 91 wt%. The RO contained 4 mg·kg−1 of sulfur and 8 mg·kg−1 of nitrogen.

3.2. Hydrotreating

A tubular fixed bed reactor with the co-current downflow of feedstock and hydrogen was used for the hydrotreating. A schematic scheme of the reactor was presented in our previous work [17]. The internal diameter of the reactor was 30 mm and the total length was 658 mm. The temperature in the reactor was maintained at the desired level by six independent heating zones of an electric furnace, which provided an almost isothermal temperature along the catalyst bed zone.
A commercial hydrorefining sulfided NiMo/Al2O3 catalyst was used for the hydrotreating under typical hydrotreating conditions, i.e., a temperature of 345 °C, a WHSV of 1.0 h−1, a pressure of 4.0 and 8.0 MPa, and hydrogen to feedstock ratio of 240 m3∙m−3. The reaction conditions were chosen so that the obtained liquid product met the requirements of EN 590 for the sulfur content in diesel fuels (less than 10 mg∙kg−1). The hydrogen to feedstock ratio of 240 m3∙m−3 was considered sufficient for the hydrotreating of the feedstock with a relatively low sulfur content (ca 2800 mg∙kg−1) and 20 wt% of rapeseed oil [18].
The bottom zone of the reactor (up to 150 mm) was filled with glass beads (diameter of 2.5 mm) and two 30 mm long layers of SiC particles (diameter ranges of 0.63–0.80 mm and 0.25–0.30 mm) were placed on the top of the glass beads.
The middle part of the reactor (catalyst bed zone) was filled with a commercial hydrorefining NiMo/Al2O3 catalyst with a particle size range of 0.25–0.42 mm. The catalyst was mixed with SiC particles (size of 0.25–0.30 mm) in a volume ratio of 1:1. The total catalyst mass in the bed was 97.6 g, corresponding to the volume of 98 cm3.
The upper (preheating) part of the reactor with a length of 30 mm was filled with SiC particles (size of 0.25–0.30 mm). The rest of the preheating zone (138 mm) was filled with glass beads (diameter of 2.5 mm). The reaction temperature was measured via 14 thermocouples in two concentric Thermo probes with an outer diameter of 6 mm.
The catalyst was activated in situ using drying, wetting, and sulfiding steps at 4 MPa. The catalyst was dried for 2 h in a hydrogen flow (23 dm3∙h−1) at 120 °C. After the drying, the catalyst was wetted with a reformate and isomerate mixture (1:1 wt%) at a weight hourly space velocity (WHSV) of ca 1.0 h−1, at 120 °C, for 4 h. The catalyst was sulfided using a mixture of SRGO and dimethyl disulfide (DMDS) with a total sulfur content of 2.6 wt%, at 230 °C, for 6 h, and WHSV of 1.0 h−1. The temperature was then increased to 350 °C with a heating rate of 20 °C∙h−1. Finally, in order to stabilise the activity of the catalyst, SRGO without DMDS was hydrotreated for 24 h, at 350 °C, 4 MPa, and hydrogen to feedstock ratio of 240 m3∙m−3.
The liquid and gaseous phases in the reactor outlet were separated by a high-pressure separator. The gas was continuously take away at the top of the separator by the pressure controller. The hydrotreated product accumulated on the bottom of the separator was sent to a low-pressure separator. During the collection of the liquid product, the off-gas sample was taken into Tedlar gas sampling bags with a volume of 5 dm3. At the end of the hydrotreating, the conditions from the first experiment were repeated and approximately the same level of desulfurisation was achieved.

3.3. Processing of the Liquid Products

The hydrogen sulfide and ammonia were removed from liquid products by stripping with hydrogen with a flow rate of 30 dm3∙min−1 for 2 h. The water formed during the HDO and HDCn of the RO was visible as a bottom layer and was separated with a syringe before distillation.
The liquid products were stabilised by the distillation in a Fischer HMS 500 distillation apparatus. The distillation started at atmospheric pressure and then continued under a reduced pressure of 5 kPa till the temperature of 64 °C which corresponds to 150 °C under atmospheric pressure.

3.4. Analysis of the Liquid and Gaseous Products

The simulated distillation of liquid products (Thermo Fisher TRACE GC ULTRA gas chromatograph, Milano, Italy) according to the extended ASTM D2887 standard was used for the verification of the conversion of the rapeseed oil to hydrocarbons. The cetane index was calculated according to EN ISO 4264 using the density and the simulated distillation data that was converted to ASTM D86 equivalent results. The conversion was performed according to ASTM D2887.
The total sulfur and nitrogen contents in the liquid products were determined according to the ASTM D5453 and ASTM D4629 procedures, respectively, on a Trace Elemental Instruments Xplorer-NS (Delft, The Netherlands). The density was measured on an Anton Paar DMA 4000 (Graz, Austria) according to the EN ISO 12185. The kinematic viscosity was determined according to the ASTM D7042 using an Anton Paar SVM 3000 (Graz, Austria). The cold filter plugging point (CFPP) was measured on an Anton Paar Callisto 100 (Blankenfelde-Mahlow, Austria) coupled to a Julabo FL 601 (Seelbach, Germany) cryostat according to EN 116.
The content of n-alkanes in the liquid products was determined using a gas chromatograph (HP 6890) with a flame ionisation detector (GC-FID). The standard mixture of the C6–C30 n-alkanes was measured under the same conditions as the samples for the identification of n-alkanes in the liquid products. The parameters of GC-FID analysis were presented in previous work [19].
High-performance liquid chromatography (HPLC) with refractometric detection and normal phase arrangement (according to the EN 12916) was used for the group-type composition of the liquid products.
The analysis of the gaseous products was performed using a Hewlett Packard HP 6890 gas chromatograph equipped with two detectors: a flame ionisation detector (FID) for the detection of the hydrocarbons (C1–C5) and a thermal conductivity detector (TCD) for the detection of the permanent gases. The effluent flowing out of the column was split into the detectors using a Y-piece Siltek MXT Connector (Restek). The content of hydrogen with a small response in the TCD was calculated as the residue to 100 vol%. The experimental parameters of the analysis were published in a previous article [10].

3.5. Calculation of Hydrogen Consumption

The consumption of hydrogen for the individual reactions taking place during the hydrotreatment of the feedstocks was calculated from the mass balance and the composition of the feedstocks and the liquid and gaseous products. The calculation procedure is described in detail in the Supplementary Materials.

4. Conclusions

The petroleum feedstock (F0) and the blends of the F0 feedstock with 5, 10, 15, or 20 wt% of RO were hydrotreated at pressures of 4 and 8 MPa, a temperature of 345 °C, hydrogen to feedstock ratio of 240 m3·m−3 and a WHSV of ca 1.0 h−1.
The yield of the liquid products decreased with an increasing RO content in the feedstock due to the formation of the gaseous by-product from the RO conversion (propane, carbon oxides). The yield of the liquid products was slightly higher at 8 MPa compared to 4 MPa because the higher pressure supported the HDO reaction pathway of the RO conversion, which produces octadecane.
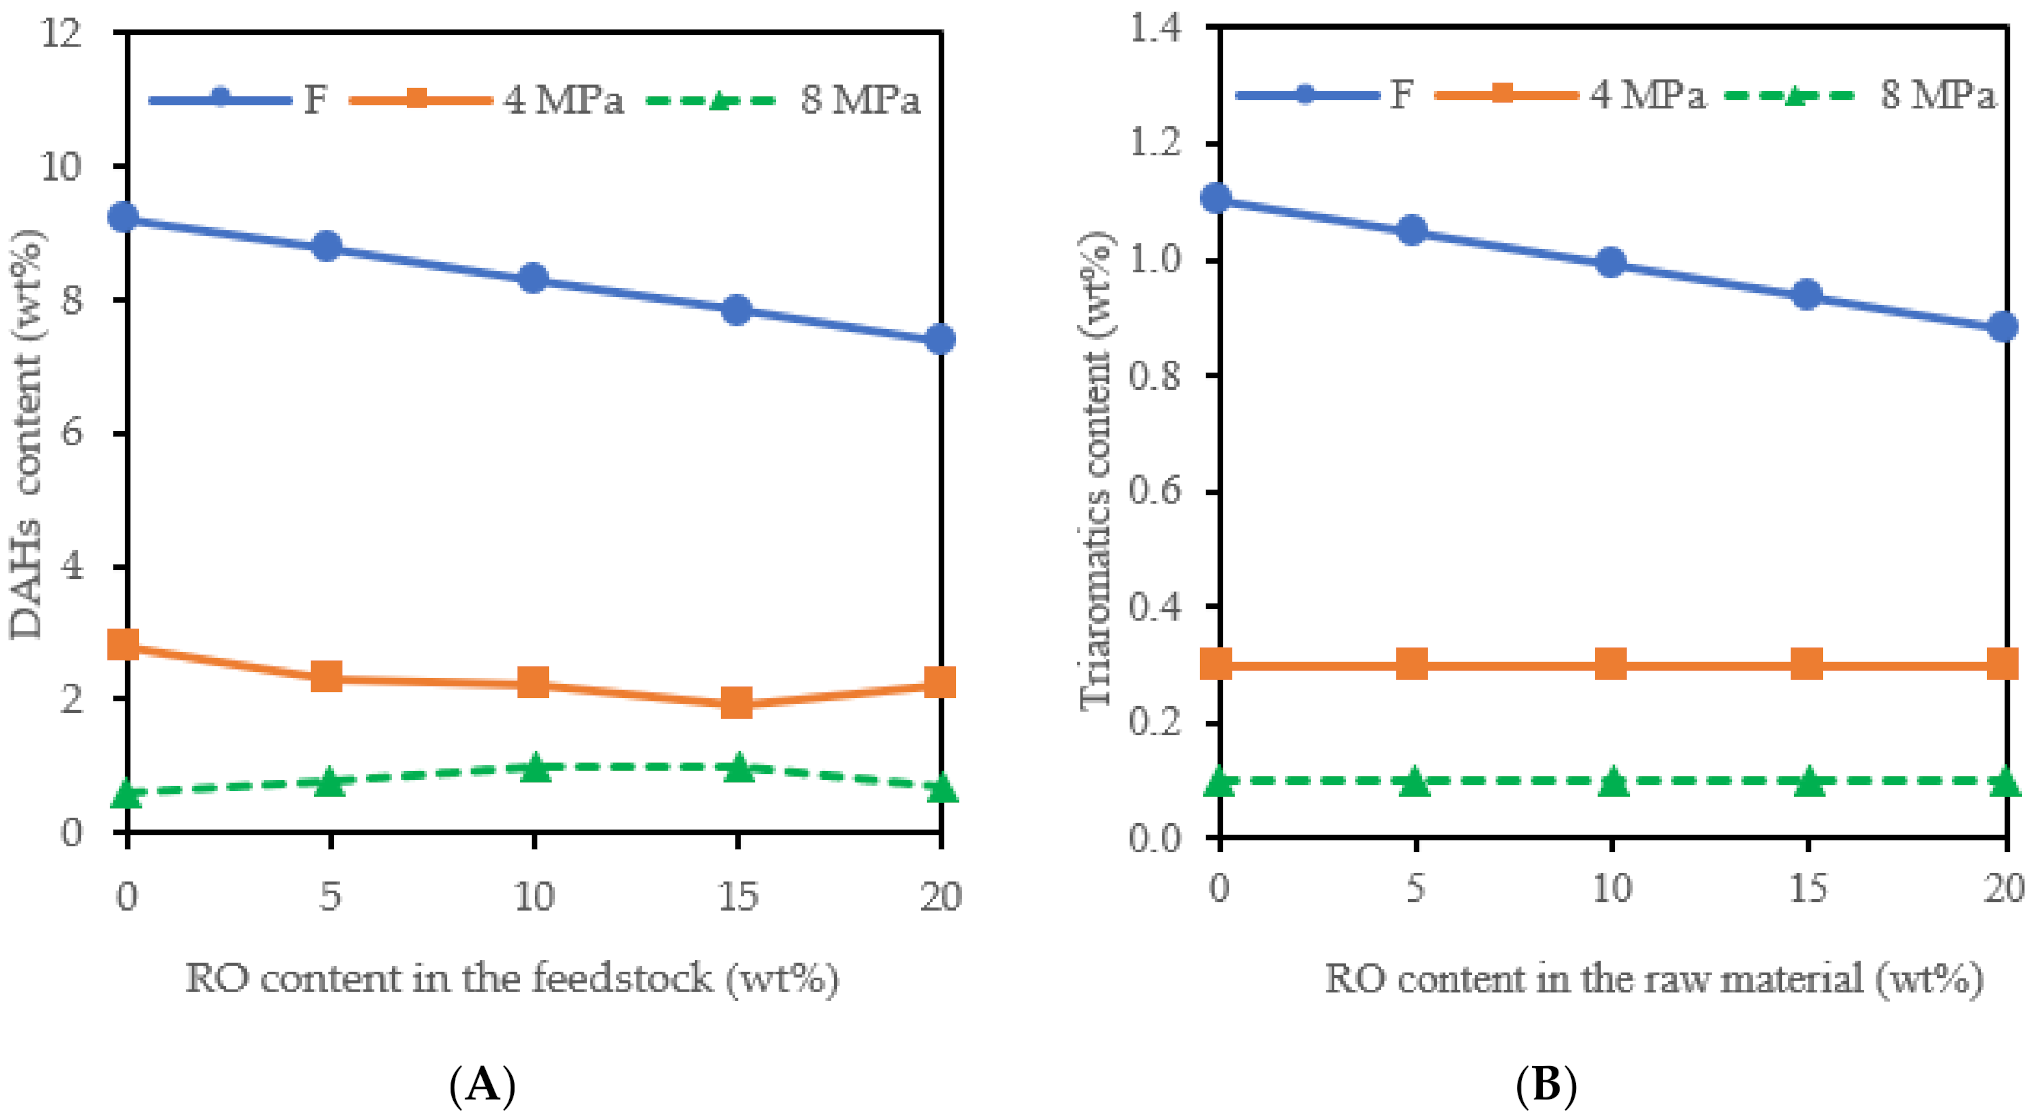
At the lower pressure, a bigger part of the RO was converted by the HDCx and HDCn reaction pathways that produce heptadecane and gaseous carbon oxides. At 8 MPa, ca 90% of the total amount of the TAHs and DAHs entering into the reactor were converted to DAHs and MAHs, respectively. At 4 MPa, the TAHs and DAHs were converted to DAHs and MAHs only by 70 to 80%. The greater hydrogenation rate of the aromatics that occurred at the higher pressure also slightly contributed to the higher yield of the liquid product.
In the case of the F0 feedstock, the pressure of 8 MPa caused the hydrogen consumption to double when compared to hydrotreating at 4 MPa. The hydrogen consumption related to the conversion of the pure RO into hydrocarbons including methanation was ca 330 dm3·kg−1 and 383–405 dm3·kg−1 at 4 MPa and 8 MPa, respectively. The higher hydrogen consumption at 8 MPa was caused by the greater share of the HDO in the RO conversion and the greater extent of the methanation, compared to hydrotreating at 4 MPa. The hydrogen consumption increased with an increasing RO content in the feedstock, as more hydrogen was consumed for the RO hydrotreating than the HDA, HDS, and HDN of the petroleum feedstock.

Supplementary Materials

The following are available online at https://www.mdpi.com/article/10.3390/catal11091093/s1.

Author Contributions

Conceptualisation, J.B.; methodology, J.B.; validation, D.T. and M.S.; formal analysis, M.S. and P.Š.; investigation, D.T. and M.S.; resources, J.B.; data curation, P.S. and J.B.; writing—original draft preparation, D.T. and J.B.; writing—review and editing, P.S., P.Š. and J.B.; visualisation, P.S.; supervision, J.B.; project administration, J.B. All authors have read and agreed to the published version of the manuscript.

Funding

This research received no external funding.

Acknowledgments

The work was supported by the Ministry of Education, Youth and Sports of the Czech Republic from the National Sustainability Programme (NPU I LO1613, MSMT-43760/2015) and institutional support of the research organisation (CZ60461373).

Conflicts of Interest

The authors declare no conflict of interest.

References

  1. Neste. Hydrotreated Vegetable Oil (HVO)—Premium Renewable Biofuel for Diesel Engines; Neste Oil Proprietary Publication: Espoo, Finland, 2014. [Google Scholar]
  2. Topsoe: Renewables. Available online: https://renewables.topsoe.com/haldor-tops%C3%B8e-renewables-about (accessed on 28 January 2020).
  3. Douvartzides, S.L.; Charisiou, N.D.; Kyriakos, N.; Papageridis, K.N.; Maria, A.; Goula, M.A. Green diesel: Biomass feedstocks, production technologies, catalytic research, fuel properties and performance in compression ignition internal combustion engines. Energies 2019, 12, 809. [Google Scholar] [CrossRef] [Green Version]
  4. Šimáček, P.; Souček, I.; Pospíšil, M.; Vrtiška, D.; Kittel, H. Impact of hydrotreated vegetable oil and biodiesel on properties in blends with mineral diesel fuel. Therm. Sci. 2019, 23, 1769–1777. [Google Scholar] [CrossRef]
  5. Donnis, B.; Egeberg, R.G.; Blom, P.; Knudsen, K.G. Hydroprocessing of bio-oils and oxygenates to hydrocarbons. Understanding the reaction routes. Top. Catal. 2009, 52, 229–240. [Google Scholar] [CrossRef]
  6. Pattanaik, B.-P.; Misra, R.-D. Effect of reaction pathway and operating parameters on the deoxygenation of vegetable oils to produce diesel range hydrocarbon fuels: A review. Renew. Sustain. Energy Rev. 2017, 73, 545–557. [Google Scholar] [CrossRef]
  7. Hermida, L.; Abdullah, A.-Z.; Mohamed, A.-R. Deoxygenation of fatty acid to produce diesel-like hydrocarbons: A review of process conditions, reaction kinetics and mechanism. Renew. Sustain. Energy Rev. 2015, 42, 1223–1233. [Google Scholar] [CrossRef]
  8. Templis, C.; Vonortas, A.; Sebos, I.; Papayannakos, N. Vegetable oil effect on gasoil HDS in their catalytic co-hydroprocessing. Appl. Catal. B Environ. 2011, 104, 324–329. [Google Scholar] [CrossRef]
  9. Bezergianni, S.; Dimitriadis, A.; Meletidis, G. Effectiveness of CoMo and NiMo catalysts on co-hydroprocessing of heavy atmospheric gas oil–waste cooking oil mixtures. Fuel 2014, 125, 129–136. [Google Scholar] [CrossRef]
  10. Straka, P.; Blažek, J.; Toullis, D.; Ihnát, T.; Šimáček, P. The Effect of the Reaction Conditions on the Properties of Products from Co-hydrotreating of Rapeseed Oil and Petroleum Middle Distillates. Catalysts 2021, 13, 442. [Google Scholar] [CrossRef]
  11. Horáček, J.; Tišler, Z.; Rubáš, V.; Kubička, D. HDO catalysts for triglycerides conversion into pyrolysis and isomerization feedstock. Fuel 2014, 121, 57–64. [Google Scholar] [CrossRef]
  12. Tomášek, J.; Matějovský, L.; Lamblová, M.; Blažek, J. Properties and composition of the products from hydrotreating of straight-run gas oil and its mixtures with light cycle oil over sulfidic Ni-Mo/Al2O3 catalyst. ACS Omega 2020, 5, 27922–27932. [Google Scholar] [CrossRef] [PubMed]
  13. Šimáček, P.; Kubička, D.; Šebor, G.; Pospíšil, M. Fuel Properties of Hydroprocessed Rapeseed Oil. Fuel 2010, 89, 611–615. [Google Scholar] [CrossRef]
  14. van Herwijnen, T.; van Doesburg, H.; de Jong, W.-A. Kinetics of the methanation of CO and CO2 on a nickel catalyst. J. Catal. 1973, 28, 391–402. [Google Scholar] [CrossRef]
  15. Shekhawat, D.; Spivey, J.-J.; Berry, D.-A. Fuel Cells: Technologies for Fuel Processing; Elsevier: Oxford, UK, 2011; p. 394. ISBN 978-0-444-53563-4. [Google Scholar]
  16. Lorentz, C.; Laurenti, D.; Zotin, J.-L.; Geantet, C. Comprehensive GC × GC chromatography for the characterization of sulfur compound in fuels: A review. Catal. Today 2017, 292, 26–37. [Google Scholar] [CrossRef]
  17. Vozka, P.; Orazgaliyeva, D.; Šimáček, P.; Blažek, J.; Kilaz, G. Activity comparison of Ni-Mo/Al2O3 and Ni-Mo/TiO2 catalysts in hydroprocessing of middle petroleum distillates and their blend with rapeseed oil. Fuel Process. Technol. 2017, 167, 684–694. [Google Scholar] [CrossRef]
  18. Blažek, J.; Kochetkova, D.; Shumeiko, B.; Váchová, V.; Straka, P. Effect of the hydrogen to feedstock ratio on the hydrotreating of the mixture of petroleum middle distillates and rapeseed oil. Paliva 2020, 12, 42–52. [Google Scholar] [CrossRef]
  19. Kochetkova, D.; Blažek, J.; Šimáček, P.; Staš, M.; Beňo, Z. Influence of rapeseed oil hydrotreating on hydrogenation activity of CoMo catalyst. Fuel Process. Technol. 2016, 142, 319–325. [Google Scholar] [CrossRef]
Figure 1. DAH (A) and TAH (B) content in the feedstocks (F) and the hydrotreated products (pressure of 4 and 8 MPa).
Catalysts 11 01093 g001
Figure 2. The content of SHCs (A) and MAHs (B) in the feedstocks (F) and the hydrotreated products (pressure of 4 and 8 MPa).
Catalysts 11 01093 g002
Figure 3. The content of propane (A) and methane (B) in the gaseous hydrotreated products (pressure of 4 and 8 MPa).
Catalysts 11 01093 g003
Figure 4. The content of CO2 (A) and CO (B) in the gaseous hydrotreated products (pressure of 4 and 8 MPa).
Catalysts 11 01093 g004
Figure 5. Share of the HDO (A), HDCx (B) and HDCn (C) in the RO conversion and share of the CO converted by methanation (D).
Catalysts 11 01093 g005
Table 1. RO content in the feedstock, the reaction pressure, the labelling of the obtained products, and the liquid product yield.
RO Content (wt%)Pressure (MPa)Product LabellingYield (wt%)
04P4-098.8
5P4-597.9
10P4-1097.5
15P4-1594.0
20P4-2094.9
08P8-099.9
5P8-599.7
10P8-1097.5
15P8-1596.7
20P8-2095.0
Table 2. The mass balance of the liquid products′ stabilisation (wt%).
ProductStabilised Product YieldDistillate YieldLosses
P4-098.90.490.61
P4-599.00.760.24
P4-1099.00.930.07
P4-1599.10.690.21
P4-2099.50.390.11
P8-098.50.670.83
P8-599.30.440.26
P8-1098.30.820.88
P8-1599.20.590.21
P8-2099.30.550.15
Table 3. The content of n-alkanes in the liquid products.
ProductContent (wt%)n-C17/n-C18
Ratio
n-C16−n-C17n-C18n-C19+
P4-07.51.51.65.10.9
P4-57.73.83.35.21.2
P4-107.36.44.84.41.3
P4-157.610.25.44.61.9
P4-207.913.16.44.32.0
P8-07.31.61.45.11.1
P8-57.63.63.15.51.1
P8-107.95.65.45.11.0
P8-158.57.77.54.81.0
P8-207.09.38.65.21.1
Table 4. Contents of the sulfur, nitrogen, and PAHs in the hydrotreating products.
ProductSulfur (mg∙kg−1)Nitrogen (mg∙kg−1)PAHs (wt%) a
F0280017810.3
P4-08.933.1
P4-57.532.6
P4-108.432.5
P4-157.332.2
P4-206.832.6
P8-03.220.7
P8-53.020.8
P8-102.521.1
P8-152.821.1
P8-202.320.8
a Sum of the dicyclic (DAHs) and tricyclic aromatic hydrocarbons (TAHs).
Table 5. Properties of the F0 feedstock and hydrotreated products.
ProductDensity at 15 °C (kg∙m−3)Viscosity at 40 °C (mm2∙s−1)Cetane IndexCFPP (°C)
F08523.6053−2
P4-08403.4555−3
P4-58333.4857−4
P4-108353.4958−4
P4-158343.4959−4
P4-208293.4762−3
P8-08343.5057−3
P8-58323.5259−3
P8-108313.6060−3
P8-158293.5362−3
P8-208273.5263−4
Table 6. Effect of the depressant on the CFPP of the products.
ProductCFPP (°C)
Amount of Depressant (mg∙kg−1)
0100200300500
P4-0−3−5−7−9−21
P4-10−4−5−6−8−9
P4-20−3−4−5−2−2
P8-10−3−5−7−8−8
P8-20−4−4−5−7−7
Table 7. The hydrogen consumption (m3·m−3) for the individual reactions, the total hydrogen consumption (in sum), and excess hydrogen at the inlet of the reactor in the hydrotreated ( Ex H In ) feedstocks.
ProductDB in RO *HDOHDCxHDCnMetha-nationHDSHDNHDAIn Sum E x H I n
P4-00.00.00.00.00.03.50.528.632.66.3
P4-54.65.80.53.23.13.30.531.252.23.6
P4-109.110.91.45.94.43.20.529.865.22.7
P4-1513.812.73.67.94.93.00.434.680.82.0
P4-2018.416.45.49.57.02.80.430.490.41.7
P8-00.00.00.00.00.03.60.560.464.52.7
P8-54.66.30.62.83.73.40.556.778.62.0
P8-109.113.71.24.97.83.20.550.390.71.7
P8-1513.820.62.56.09.73.10.445.5101.61.4
P8-2018.426.74.17.010.42.90.443.1113.01.2
* DB in RO-saturation of double bonds in the RO.
Table 8. Total amount of TAHs, DAHs and MAHs removed in each experiment and the relative removal of each type of aromatics.
ProductTAHs (g∙h−1)DAHs (g∙h−1)MAHs (g∙h−1)TAHs (%)DAHs (%)MAHs (%)
P4-00.87.35.0737321
P4-50.87.36.1727726
P4-100.76.95.8717626
P4-150.76.77.8707937
P4-200.55.87.0687436
P8-01.09.615.7919459
P8-51.09.014.8919259
P8-100.98.212.7909054
P8-150.87.711.2908951
P8-200.87.510.4899249
Table 9. The properties of the F0 feedstock.
ParameterValue
Density at 15 °C (kg∙m−3)857
Viscosity at 40 °C (mm2∙s−1)3.52
Sulfur (mg∙kg−1)2800
Nitrogen (mg∙kg−1)178
Cetane index50
Saturated hydrocarbons (wt%)72.7
Monoaromatics (wt%)17.0
Diaromatics (wt%)9.2
Triaromatics (wt%)1.1
Rapeseed oil (wt%)0.0
Publisher’s Note: MDPI stays neutral with regard to jurisdictional claims in published maps and institutional affiliations.

