Article

Influence of Substrate Concentration on Kinetic Parameters of Ethanol Dehydration in MFI and CHA Zeolites and Relation of These Kinetic Parameters to Acid–Base Properties

Department of Physical Chemistry, Faculty of Chemical Technology, University of Pardubice, Studentská 573, CZ-532 10 Pardubice, Czech Republic
*
Authors to whom correspondence should be addressed.
Catalysts 2022, 12(1), 51; https://doi.org/10.3390/catal12010051
Submission received: 21 December 2021 / Revised: 30 December 2021 / Accepted: 31 December 2021 / Published: 3 January 2022
(This article belongs to the Section Catalytic Materials)

Abstract

:
The catalytic activity of zeolites is often related to their acid–base properties. In this work, the relationship between the value of apparent activation energy of ethanol dehydration, measured in a fixed bed reactor and by means of a temperature-programmed surface reaction (TPSR) depending on the amount of ethanol in the zeolite lattice and the value of activation energy of H/D exchange as a measure of acid–base properties of MFI and CHA zeolites, was studied. Tests in a fixed bed reactor were unable to provide reliable reaction kinetics data due to internal diffusion limitations and rapid catalyst deactivation. Only the TPSR method was able to provide activation energy values comparable to the activation energy values obtained from the H/D exchange rate measurements. In addition, for CHA zeolite, it has been shown that the values of ethanol dehydration activation energies depend on the amount of ethanol in the CHA framework, and this effect can be attributed to the substrate clustering effects supporting the deprotonation of zeolite Brønsted centers.

1. Introduction

Zeolites have been among the most important heterogeneous catalytic groups since the middle of the last century, when they began to be used in technologically important oil conversion processes [1,2]. At present, the interest of research groups is shifting to the study of the possibilities of using zeolites in the conversion of natural gas or renewable raw materials into more valuable materials and compounds indispensable in the chemical industry [3,4,5]. One of the possible ways for conversions of natural gas into more valuable products is a methanol to olefin reaction (MTO). The UOP/Hydro MTO process uses zeotype SAPO-34 (CHA structure) and is considered a promising way of converting natural gas to unbranched olefins via methanol [6,7,8].
Besides of the molecular sieve effect and the shape selectivity control effect, the acid–base properties of zeolites play a key role in the most important catalytic applications of zeolites [9,10]. Since the introduction of zeolites as acid catalysts, great efforts have been made to characterize the number, strength and availability of potentially active acid sites and to correlate these values with their catalytic activity. Many characterization methods have been developed to determine acid–base characteristics, and these methods are based on various theoretical methods (DFT [9,11,12,13,14,15,16]) or experimental techniques (MAS NMR [13,14], Raman spectroscopy [17], FTIR spectroscopy [10,11,14,17,18,19,20,21] or temperature programmed desorption (TPD) of probe molecules [15,16,20]). All of these methods share one common disadvantage: the assumption that the acid–base properties of the zeolite catalyst do not change under actual reaction conditions. The activity ranking of various zeolites in given catalytic reactions very frequently does not correspond to the acidity ranking measured by probe molecules at distinctly lower temperatures compared to the reaction condition. This difference is attributed to the confinement effect of the microporous structure of zeolites. One of the possible way how to solve this complication is to adapt some well defined probe reaction as tool for acidity scaling. The correlation of the results obtained by measuring the kinetic characteristics of a suitably chosen probe reaction with the results of mentioned acid–base characterization methods offers the possibility to bridge the gap between the somewhat artificial conditions of the measurement of acid–based properties and the conditions of the actual catalytic application. An appropriately selected probe reaction can then be used as a “pragmatic scale” of the acid–base properties of the zeolitic catalyst. Unfortunately, there is no one universal or generally accepted probe reaction and many reactions have been tested for this purpose—e.g., cracking of alkanes [11,13,22,23], dehydration of alcohols (methanol [4,9,24,25] or ethanol [14,26,27,28,29]), and isotopic exchange reaction [30,31,32].
Zeolites, as strong solid acids, can stabilize dissociated ionic pairs. Thus, protonation of bases with mediocre proton affinity (that usually happen at elevated temperature) can be used for definition of other acidity scale. Several experimental approaches for the estimation of the protonation temperature or kinetics of protonation of various probe molecules like aromatics [31,33] or acetonitrile [34] have been tested. Bordiga et al. [35] through the FTIR experiments with the adsorption of water and methanol molecules on H-SSZ-13 (CHA zeolite type) observed that the abstraction of proton from the zeolite framework occurs at high surface coverages when H2O generates clusters that have a sufficiently high proton affinity, whereas at low surface coverages the formation of H3O+ was not observed. Substrate clustering effects were also reported for small-pore zeolites by di Iorio et al. [36] who tried to explain observed high-pressure inhibition of methanol dehydration turnover rates by clustering of molecules of adsorbed substrate which can increase the apparent barriers to form kinetically relevant transition states. Recently, similar substrate clustering effects on the kinetics of methanol and ethanol dehydration over chabazite zeolites were reported also by Bates et al. [37,38,39] who claimed that such solvent-mediated charge interactions which influence the free energy landscape have broader implications for kinetics of heterogeneous catalyzed reactions.
The aim of this study was to look in more detail at the dependence of the kinetic parameters of the ethanol dehydration on reaction variables, especially ethanol concentration in the reaction mixture, and compare them with H/D isotopic exchange parameters as acidity descriptors. For these purposes, ethanol dehydration was measured in a classical continuous flow catalytic test setup at two significantly different ethanol concentrations and also by the temperature-programmed surface reaction method. The kinetics of H/D isotopic exchange between deuterated Brønsted acid sites in zeolites and ethane was studied on the same catalysts. The study was conducted on CHA zeolites with various Si/Al ratios as a representative of small-pore zeolites and MFI zeolite as a representative medium-pore zeolite.

2. Results and Discussions

2.1. Materials Characterization

SEM images of the crystallites of all tested zeolites are presented in the Supplementary Information (SI) Figure S1. The crystallites are approximately of the cubic symmetry with a typical average size around 2 μm for MFI-30 sample and approximately 0.5 μm for the CHA-7.5. The CHA-14 sample exhibits relatively broad distribution of the crystallite sizes in the range of 80–200 nm.
XRD patterns of all three tested zeolites (Figure S2) clearly confirms correct crystalline structure of all samples matching also their structure with the simulated powder diffractograms from the IZA database [40]. No other crystalline phases or amorphous phase broad peaks were detected in recorded XRD patterns.
Nitrogen adsorption isotherms measured at 77 K (Figure S3) are all of type I (Ia for CHA zeolites or Ib for MFI-30 sample) according to IUPAC classification [41] typical for microporous zeolitic materials. The less steep isotherm for CHA-7.5 in the region of medium pressures is related to the smaller external surface of this sample in comparison with the CHA-14 sample. This assumption is supported by the SEM images of both samples, where the particles of the CHA-14 sample are smaller and more polydisperse than particles of the CHA-7.5 sample. The volume of micropores and the BET area for our samples correspond to previously published values for MFI [42,43] and CHA zeolites [44,45].
In order to determine the number of Brønsted acid centers in the studied zeolites, NH3-TPD experiments were performed on parent fresh zeolites (meaning on samples ion-exchanged into NH4+ forms by classical ion exchange in aqueous solution of ammonium nitrate [see the Materials and Methods section]). The NH3-TPD curves monitored at the mass 16 amu are presented in SI (Figure S4). The integral of desorbed ammonia during these experiments is summarized in Table 1 and provides information about the amount of Brønsted acid sites in the zeolitic samples studied in this work [46]. The obtained amounts of Brønsted sites correspond well to nominal values of Si/Al ratio of all samples.
Properties of zeolites investigated in this study are discussed in more detail in Supplementary Information.

2.2. FTIR Ethane H/D Exchange Study

Recently, H/D isotopic exchange reaction was proposed as a suitable probing reaction for assessment of the Brønsted acid site (BAS) strength due to it being a simple mechanism with no side reaction and the fact that proton transfer is the initial step of all hydrocarbon activations on BAS [30,31,32]. In our experiments, the kinetics of the H/D exchange reaction is monitored by the time-resolved IR spectra recording during the interaction of ethane with pre-deuterated zeolite at constant temperature. The IR spectra of the original proton zeolites and their deuterated counterparts are reported in Figure S6 in Supplementary Information. They exhibit OH vibrational bands related to the terminal silanols and bridging OH groups typical for CHA and MFI zeolite structures. Detailed description and assignment are in SI. Upon contact of a fully deuterated zeolite with ethane (50 mbar) at elevated temperature, a continuous decrease in the intensity of deuterated BAS vibrational bands with a simultaneous increase in the intensity of the protonated ones is clearly observable. Changes in the intensities of OD and OH bands investigated as a function of time can be described by pseudo-first order kinetics due to selected experimental conditions. Due to the more pronounced noise of the spectra in the region of OH vibrations due to the fluctuating moisture content in the atmosphere around the cuvette during the measurement, the region of OD vibrations was chosen to evaluate the kinetic data. Plotting the logarithm of the OD bands intensities ratio (I/I0) as a function of time (see Figure S7) confirms the suitability of the chosen kinetic model, and the rate constant of isotopic exchange at a given temperature can be determined from the slopes of linear dependences. The temperature dependence of the rate constants obtained from the data in Figure S7 is shown for all three samples studied in Figure 1A. It is evident that rate constants differ slightly from sample to sample, however, in the whole temperature range, the order of the samples’ (sorted by their k’) values remains the same: MFI-30 > CHA-7.5 > CHA-14. The activation energies of isotopic exchange obtained from Arrhenius plot (Figure 1B) are summarized in Table 1.

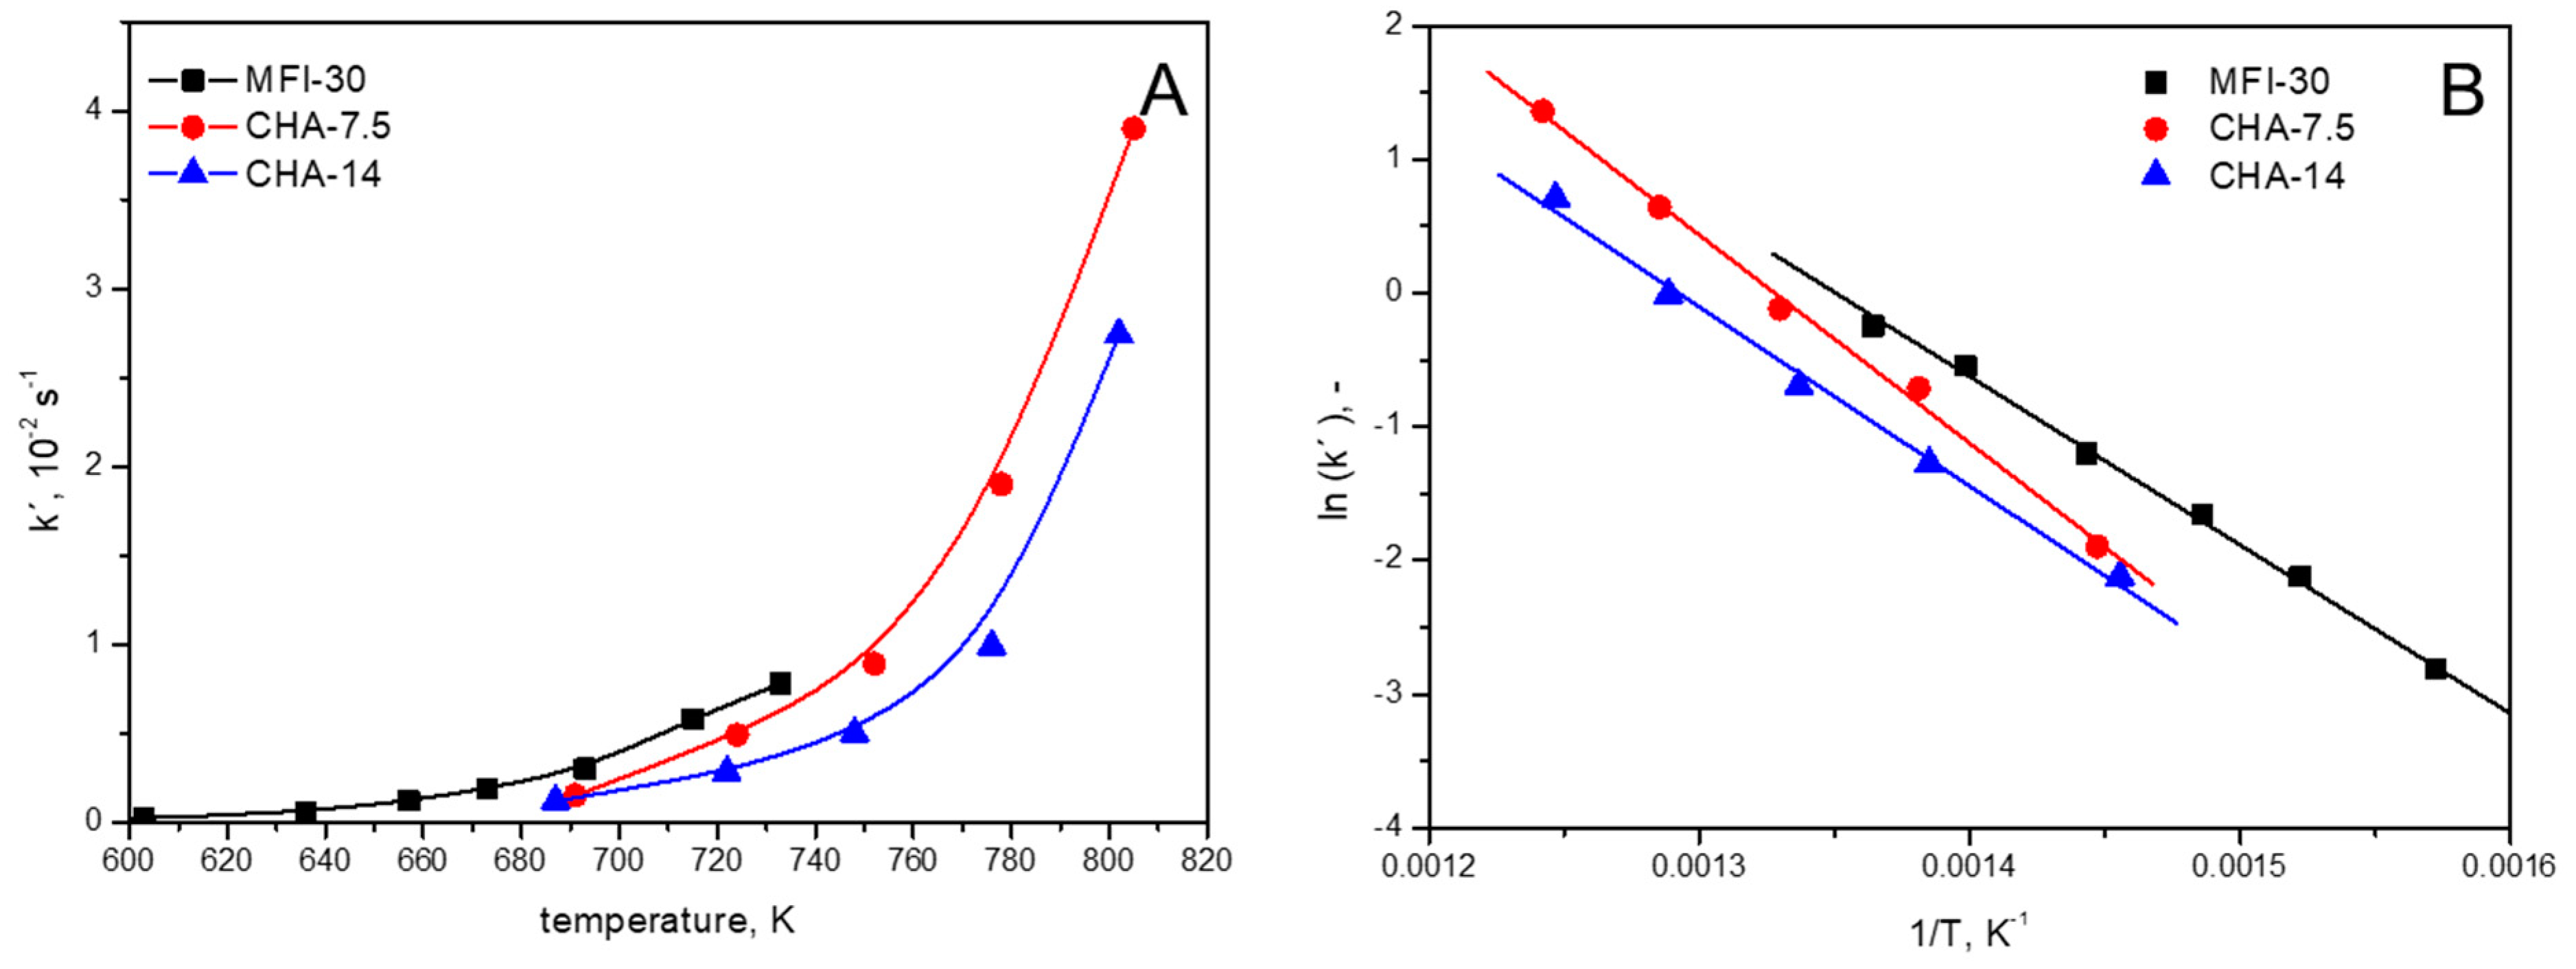
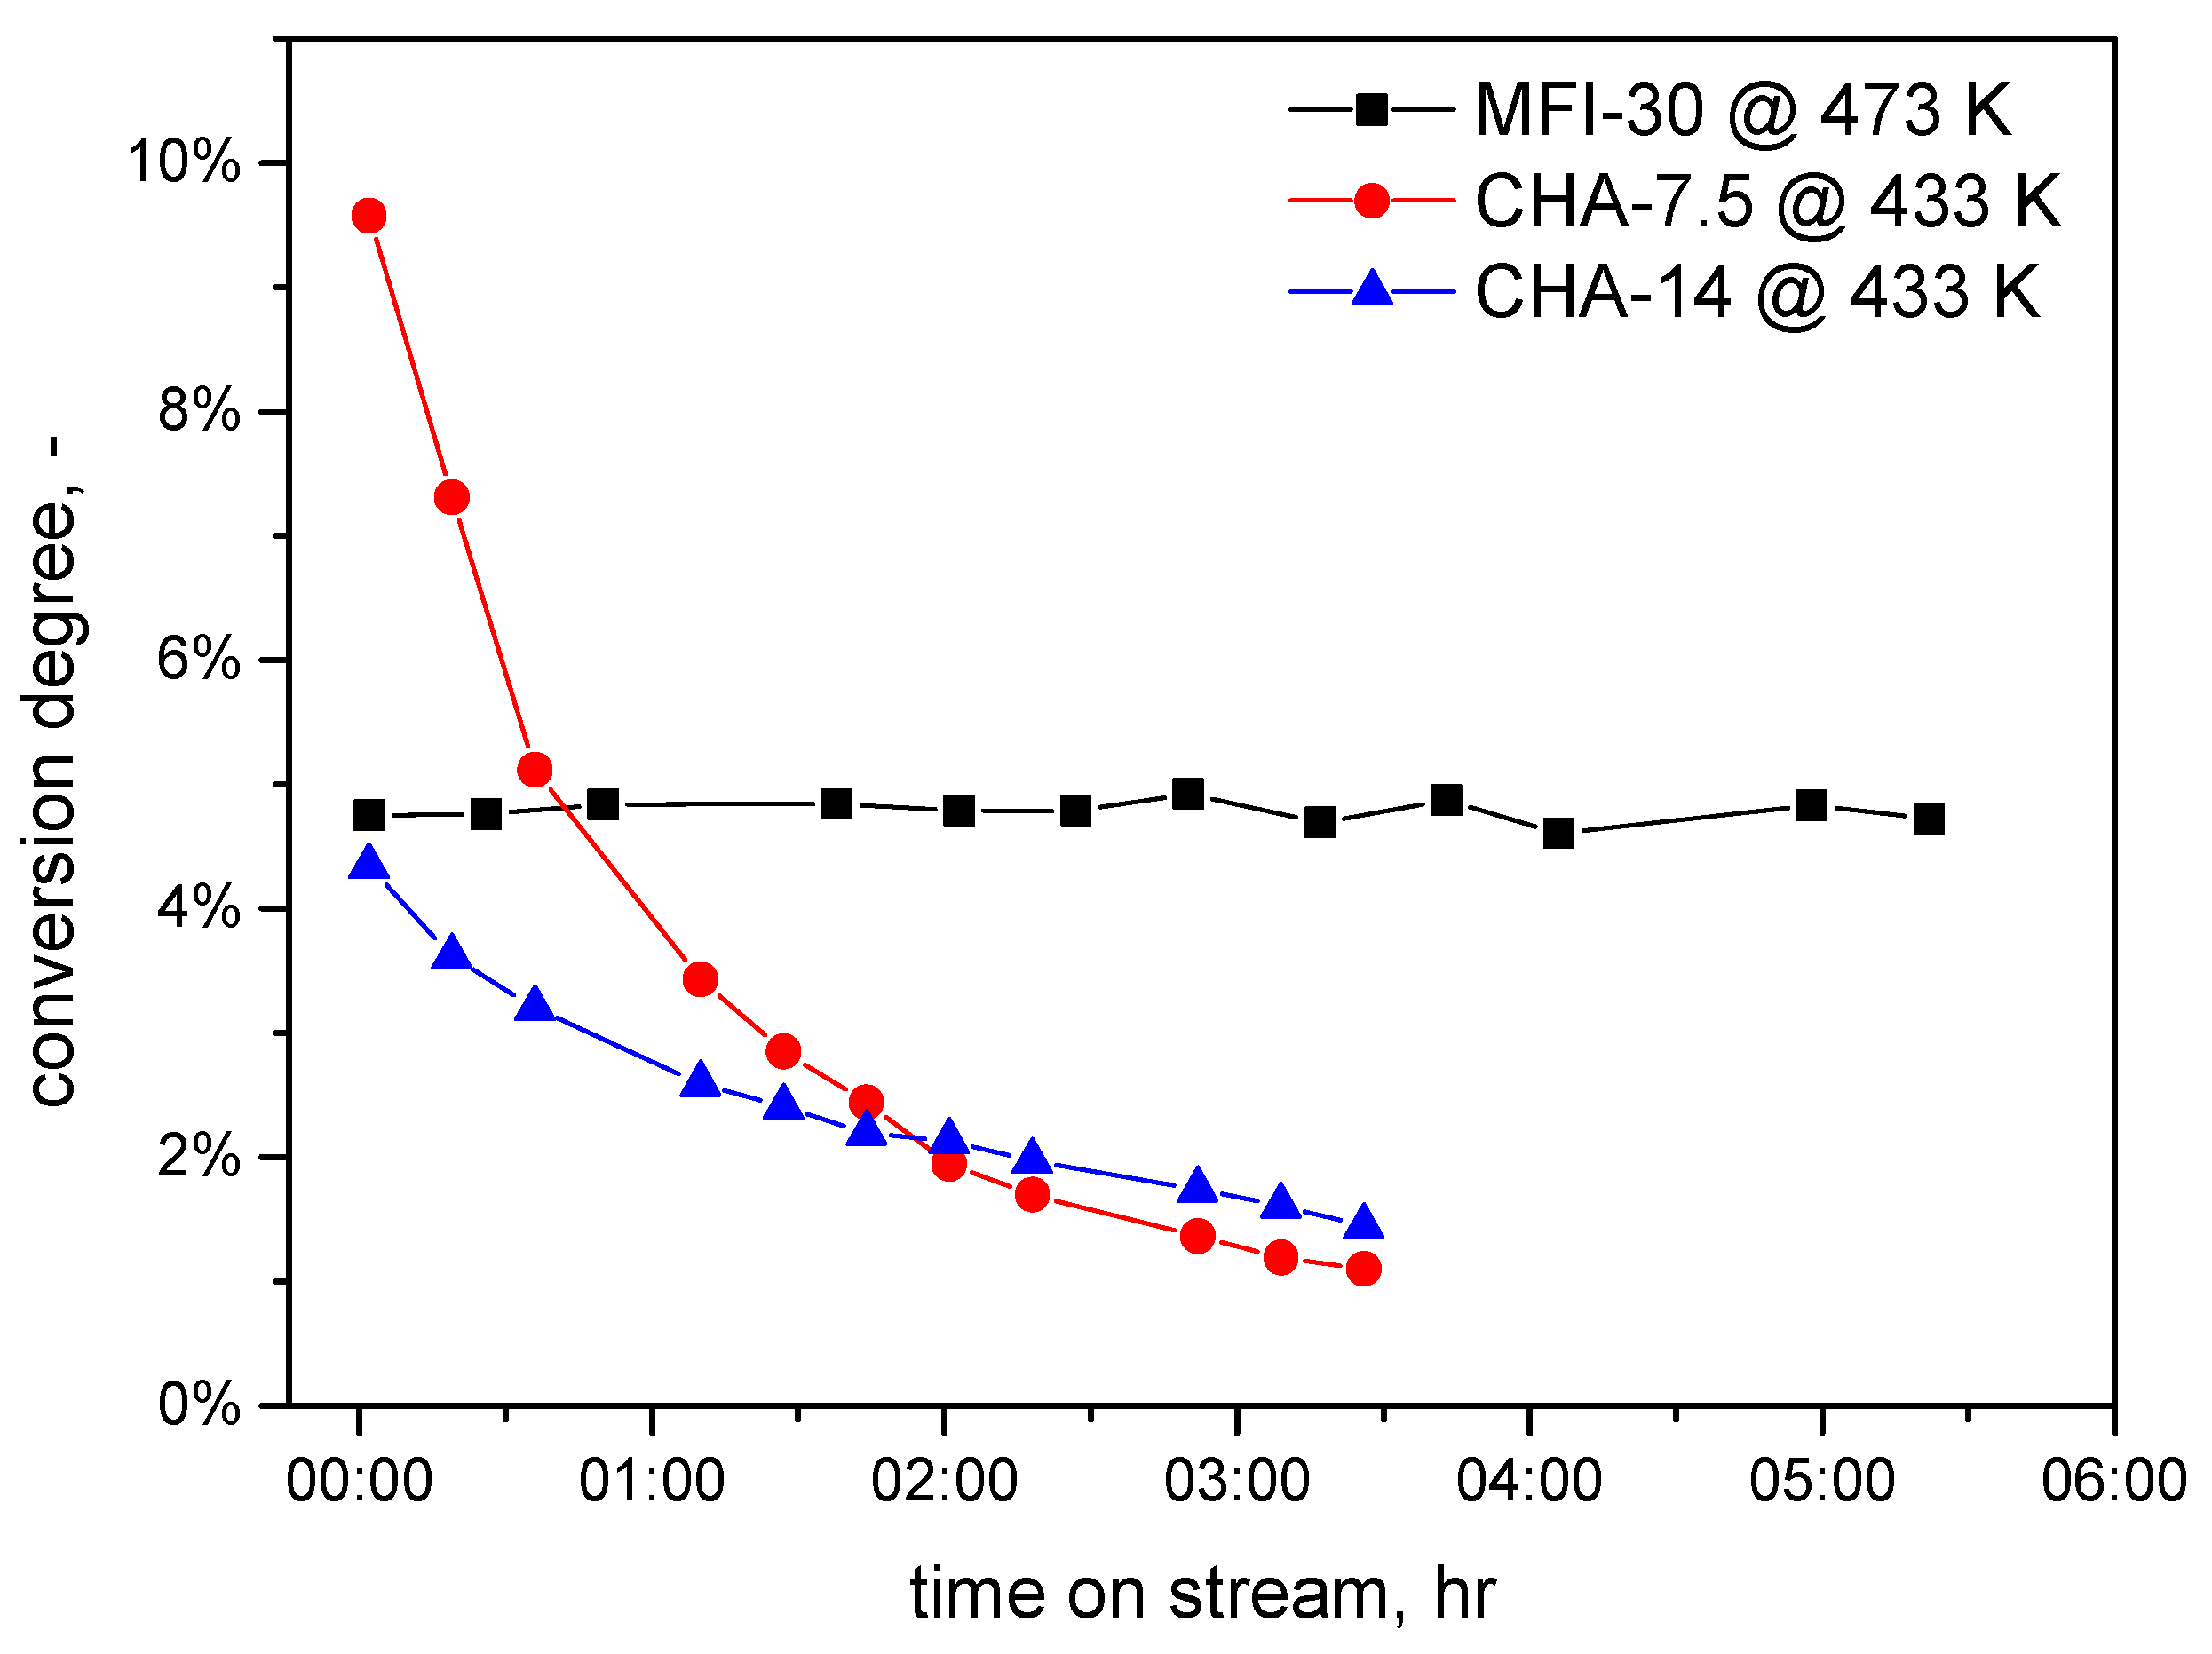
2.3. Fixed Bed Ethanol Dehydration Tests

The typical time on stream (TOS) course of the dependence of the activity of the tested catalyst samples in the dehydration of the ethanol are presented in Figure 2. It is clearly seen, that whereas the MFI-30 sample does not exhibit any significant deactivation within the TOS = 6 h, both tested samples of chabazite zeolite rapidly deactivated. Deactivation is faster for the sample of CHA-7.5 than for CHA-14, so it is directly related to the number of present acid sites in the zeolite sample. This means that the deactivation occurs most likely due to coke deposits formed from the ethanol by its condensation to longer chain compounds, and the dehydration reaction temperature does not allow their efficient transport in the small pores of the CHA zeolite channel system. The DTA-TG analysis of a spent sample of CHA-7.5 catalyst conducted in open-air crucible is presented in Figure S5 in the SI. Obtained data clearly indicate that in the region 523–973 K, an exothermic process occurs accompanied by ca. 9% weight loss what confirms assumption of coke formation. This behavior can be expected because the CHA zeotype materials were many times referred [3,17,19,47,48,49,50] as active catalysts in methanol to olefins (MTO) or ethanol to olefins reactions and is in-line with this fact; they also exhibited significantly higher selectivity to ethylene under our catalytic test conditions compared to MFI zeolite.
Rapid deactivation of both CHA samples was the reason why only catalytic data from the initial stage of the reaction (TOS = 2 min) were taken for the evaluation of catalytic behavior of all tested catalysts in the catalytic dehydration of ethanol. The obtained data from this initial stage of reaction are summarized in the Table 2 for both measured ethanol inlet concentrations.
The volatile products of the reaction were solely the diethylether (DE) and ethylene. The dominant reaction product was diethylether, with a selectivity in the range of 91–99% in all fixed-bed catalytic tests performed. The TOF values obtained at the same temperature depended on the inlet partial pressure of ethanol and their values are approximately one order larger on the CHA samples in comparison with the MFI-30 sample. Such a result is in contradiction with the results published about the MFI and CHA zeolite activity in the MTO reaction [47,50,51] or methanol dehydration [24] where the reported activity of MFI zeolites was higher than [24,47] or comparable with CHA zeolites [50,51]. Nevertheless, it should be noted that published data were obtained under completely different reaction conditions (higher reaction temperatures and higher loads of catalysts sufficient to reach close to 100% conversion degree) and cannot be compared directly with the data published in this work.
The values of the ethanol reaction order calculated using Equation (6) (see Section 3.4) did not have any apparent trend and all fell into the range of 0.1–0.6, suggesting the participation of the adsorbed complexes on the rate limiting step of reaction like in the case of kinetics of the methanol dehydration over CHA zeolites published di Iorio et al. [52]. The published experimental ethanol adsorption isotherms on MFI zeolite catalyst [26] are in their limiting plateau region for the ethanol partial pressures used in our work, which also supports this assumption.
The values of the apparent activation energies do not correspond to the values from the H/D exchange experiments. This effect can be caused by the internal diffusion inside the zeolite micropores. In the article [53], the reduced diffusion coefficient for ethanol in MFI silicalite D/Rc2 = 0.18 min−1 for 35 °C was determined by gravimetric measurement indicating that spatial concentration gradients can be generated for higher conversion degree values in crystallites of MFI zeolites. The effect of slower ethanol transport has also been experimentally observed in TAP experiments for ethanol dehydration in MFI zeolite [28]. The effects of internal diffusion limitation could be expected even more important in narrow-pore CHA zeolite. According to the theory of heterogeneous catalysis (e.g., [54]), internal diffusion can reduce the value of apparent activation energy by up to half of the actual activation energy of the reaction, which is consistent with our results. The only exception is the experiment with MFI-30 zeolite and 10% ethanol in the input reaction mixture. In this case, the combination of small conversion and larger pores causes the rate limiting step to be the catalytic reaction itself and not the mass transport, leading hence to an apparent activation energy value similar to that obtained from H/D exchange measurements.

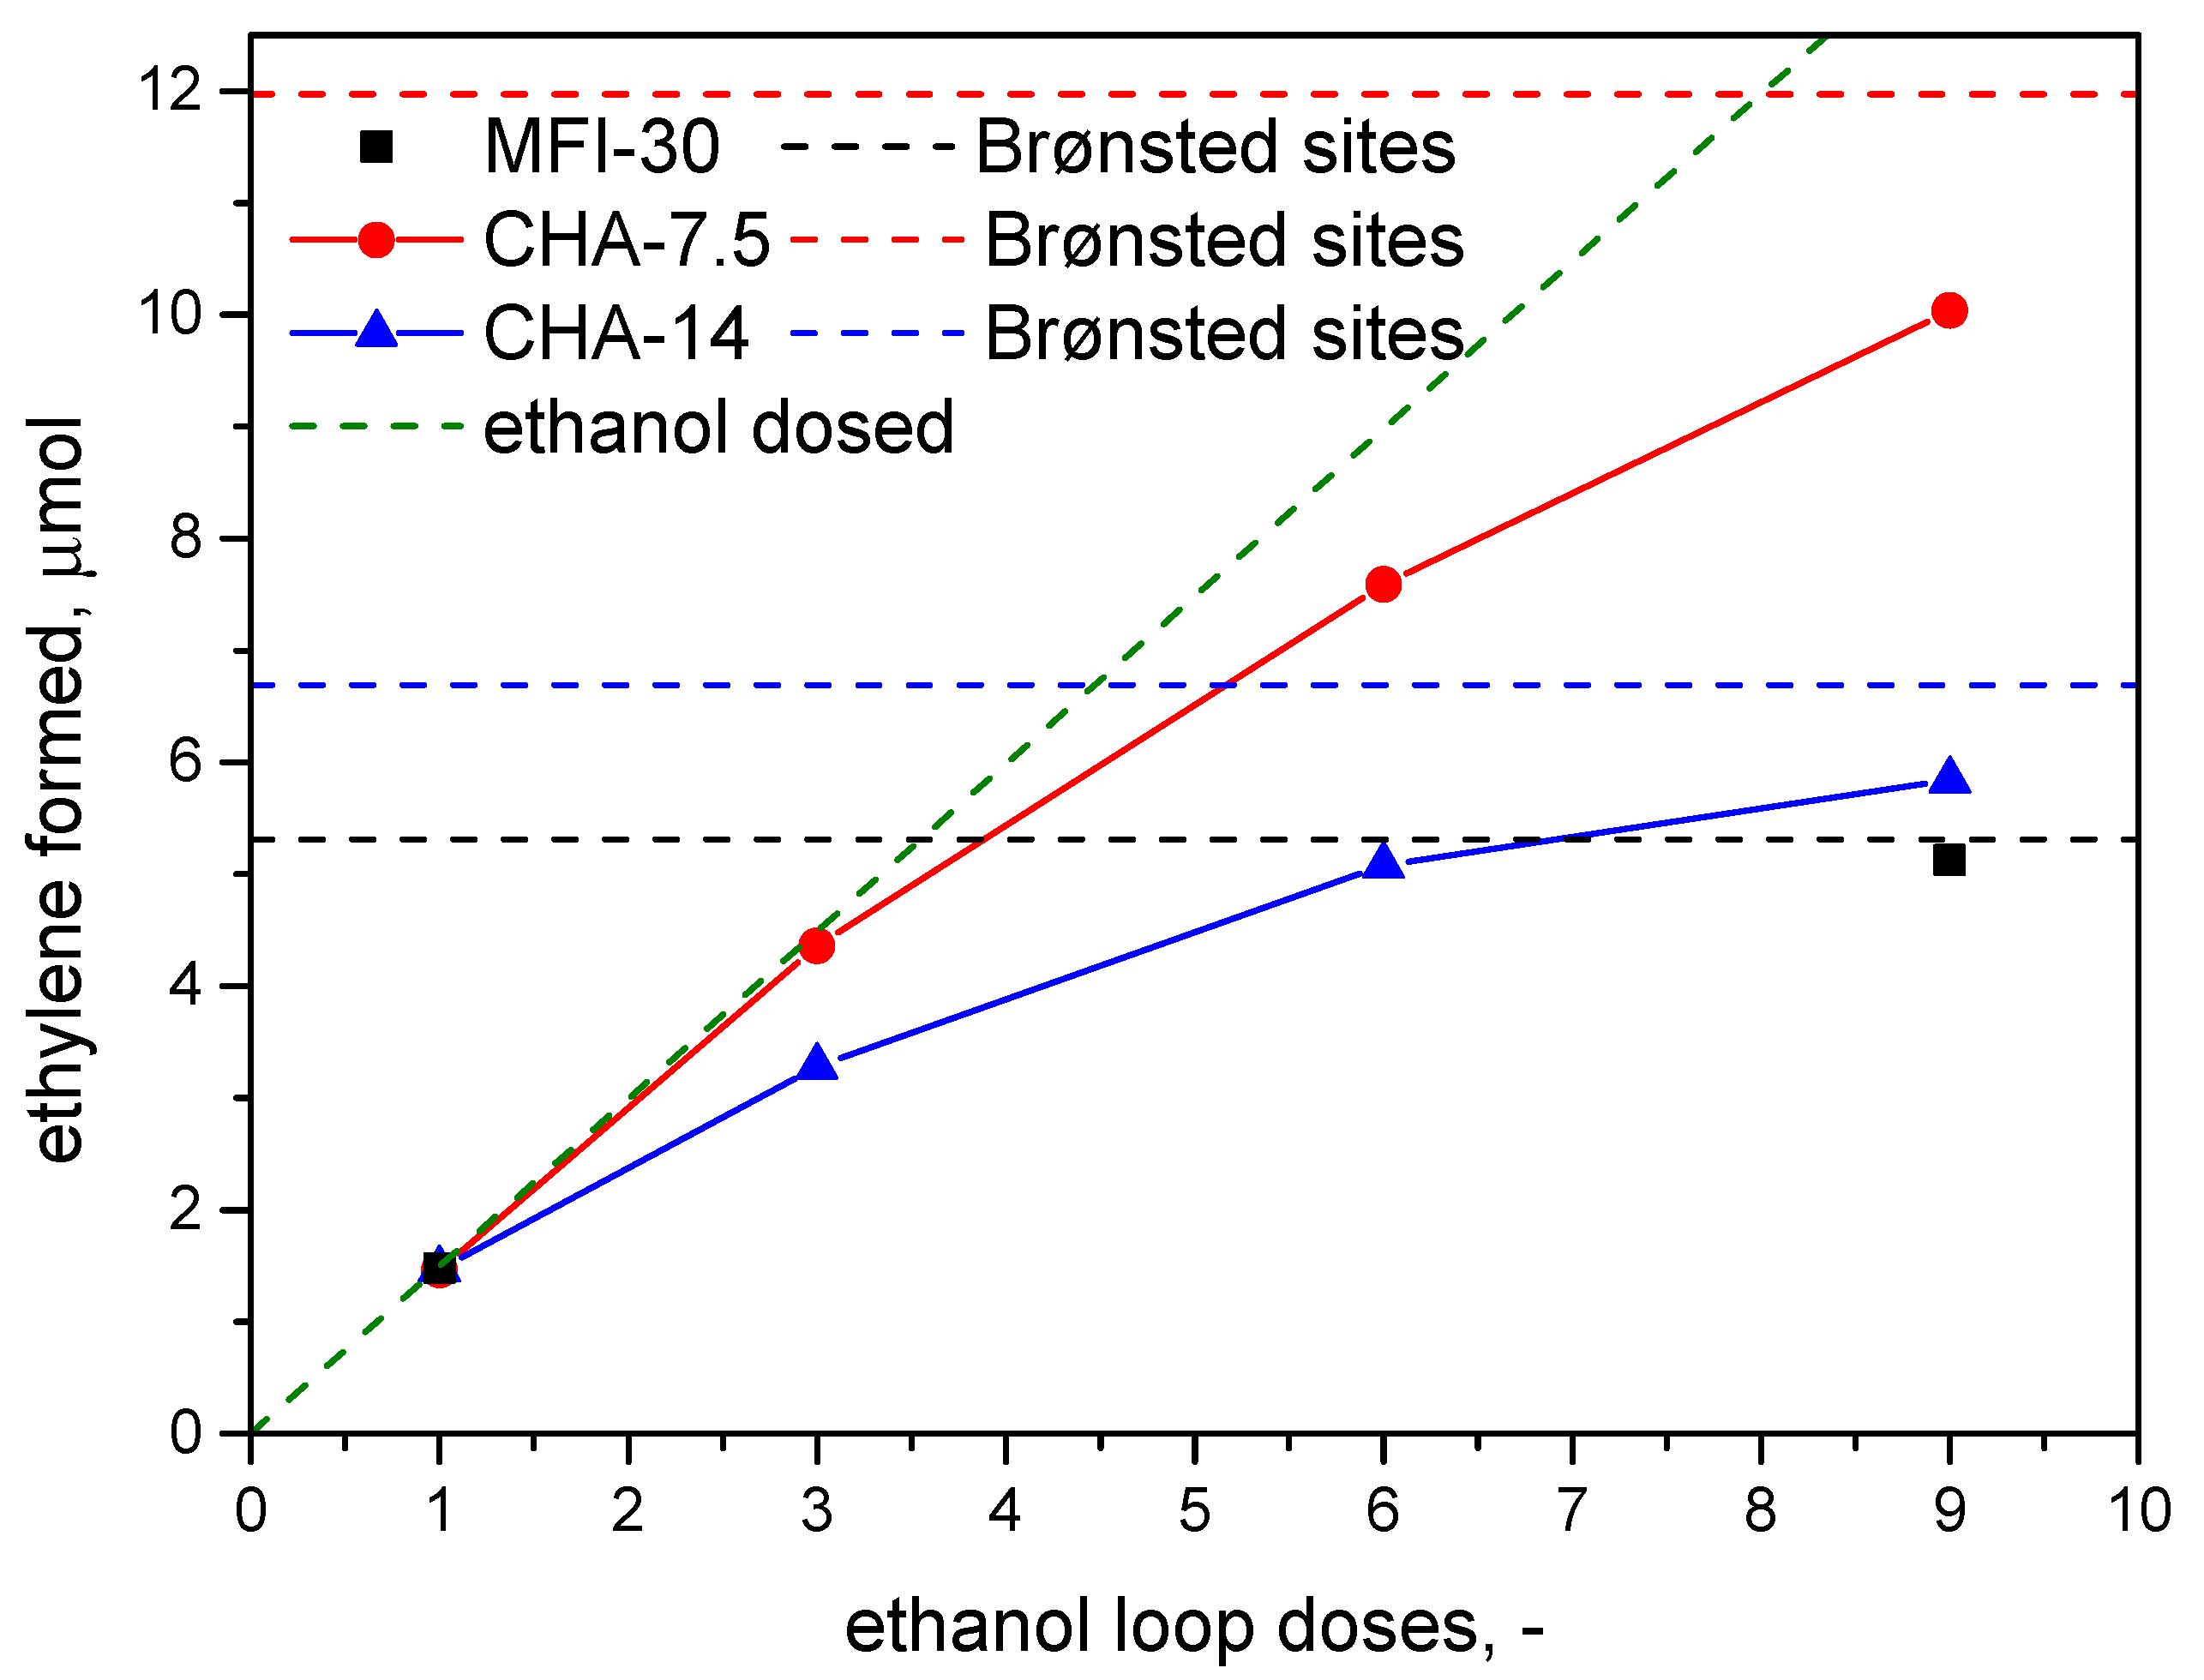
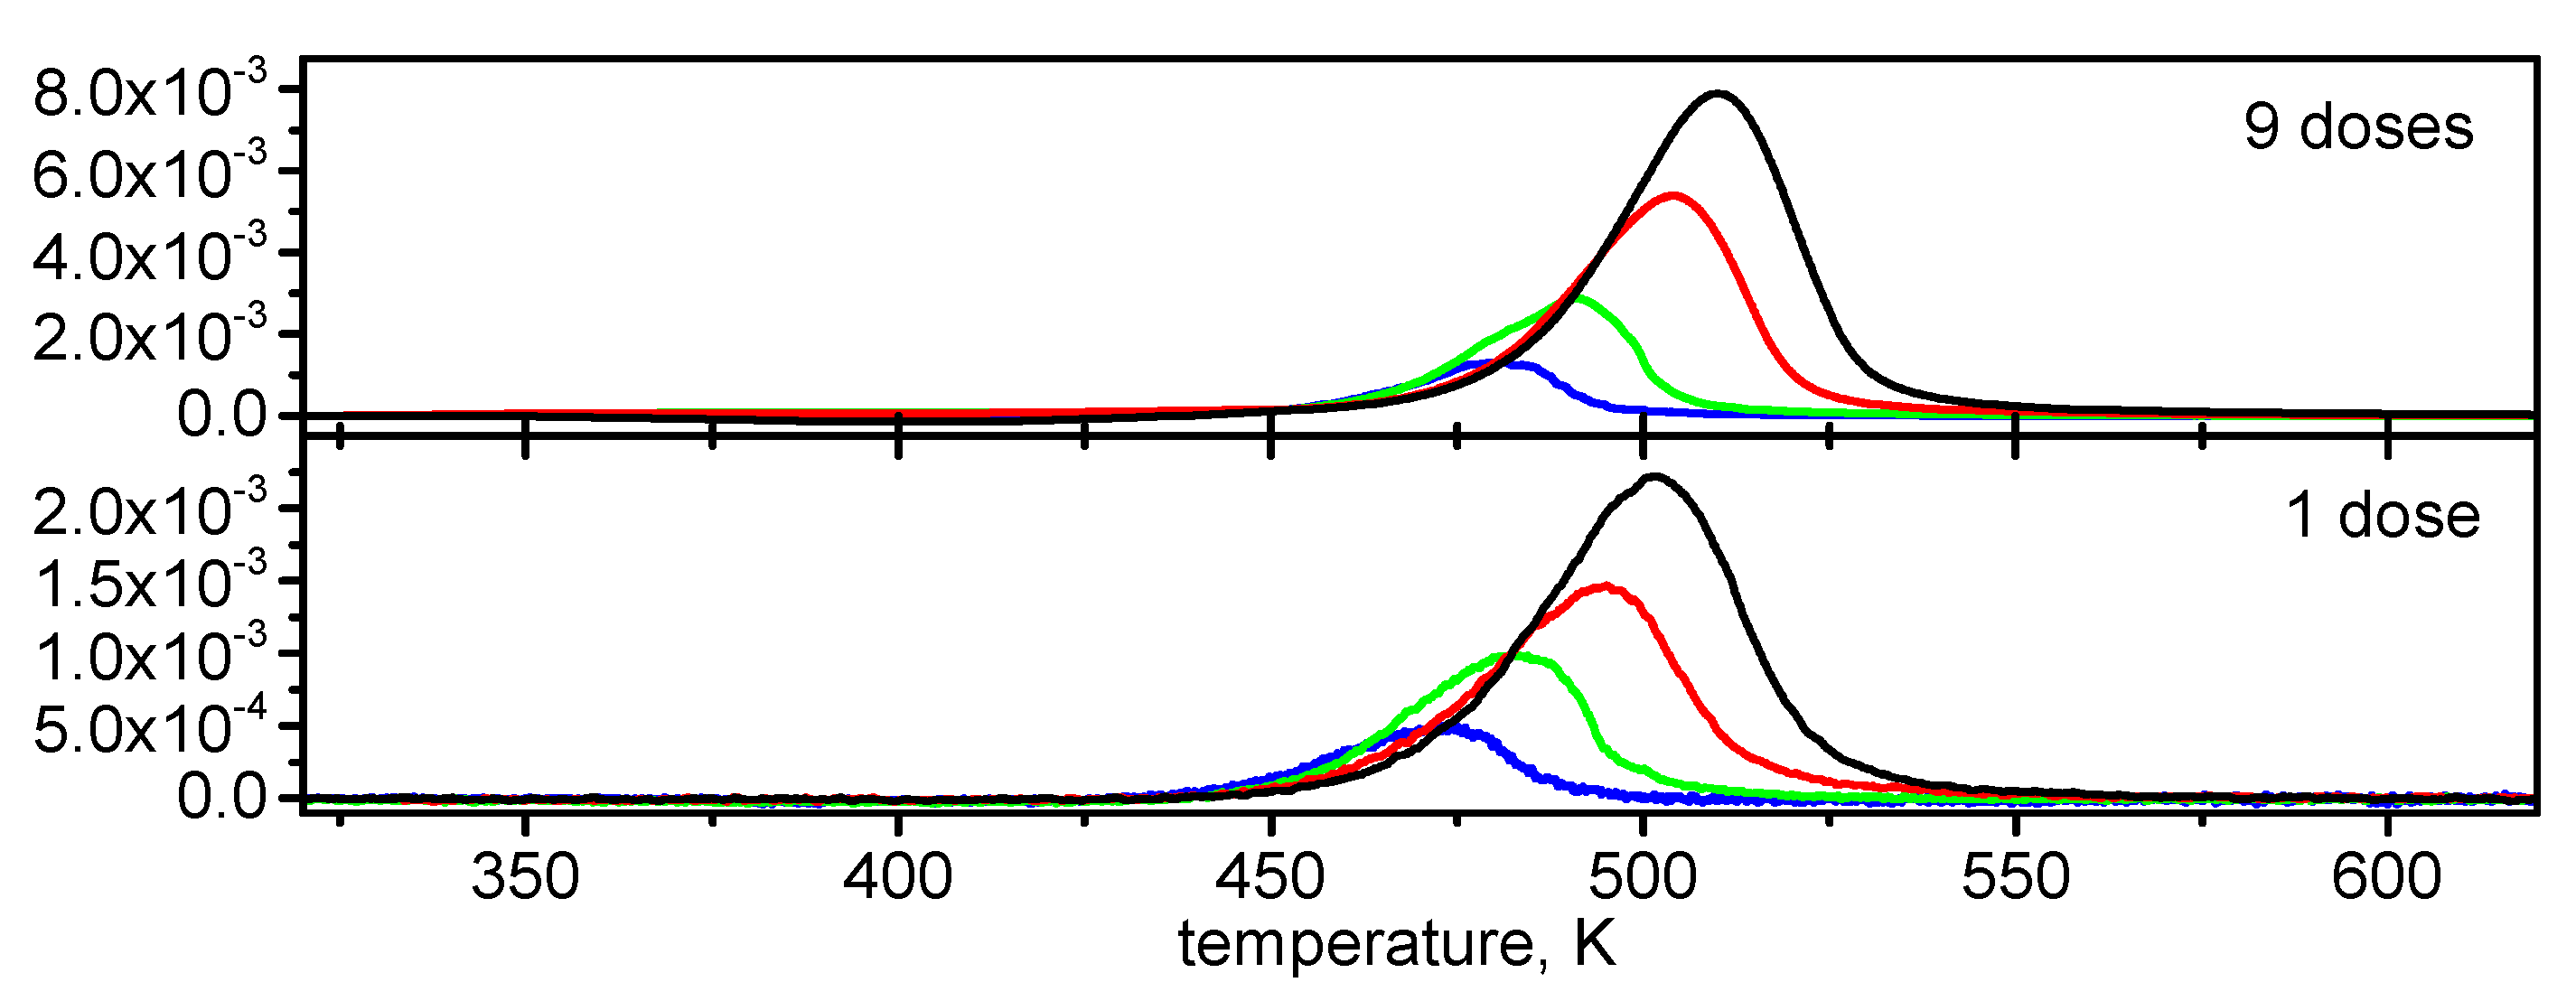
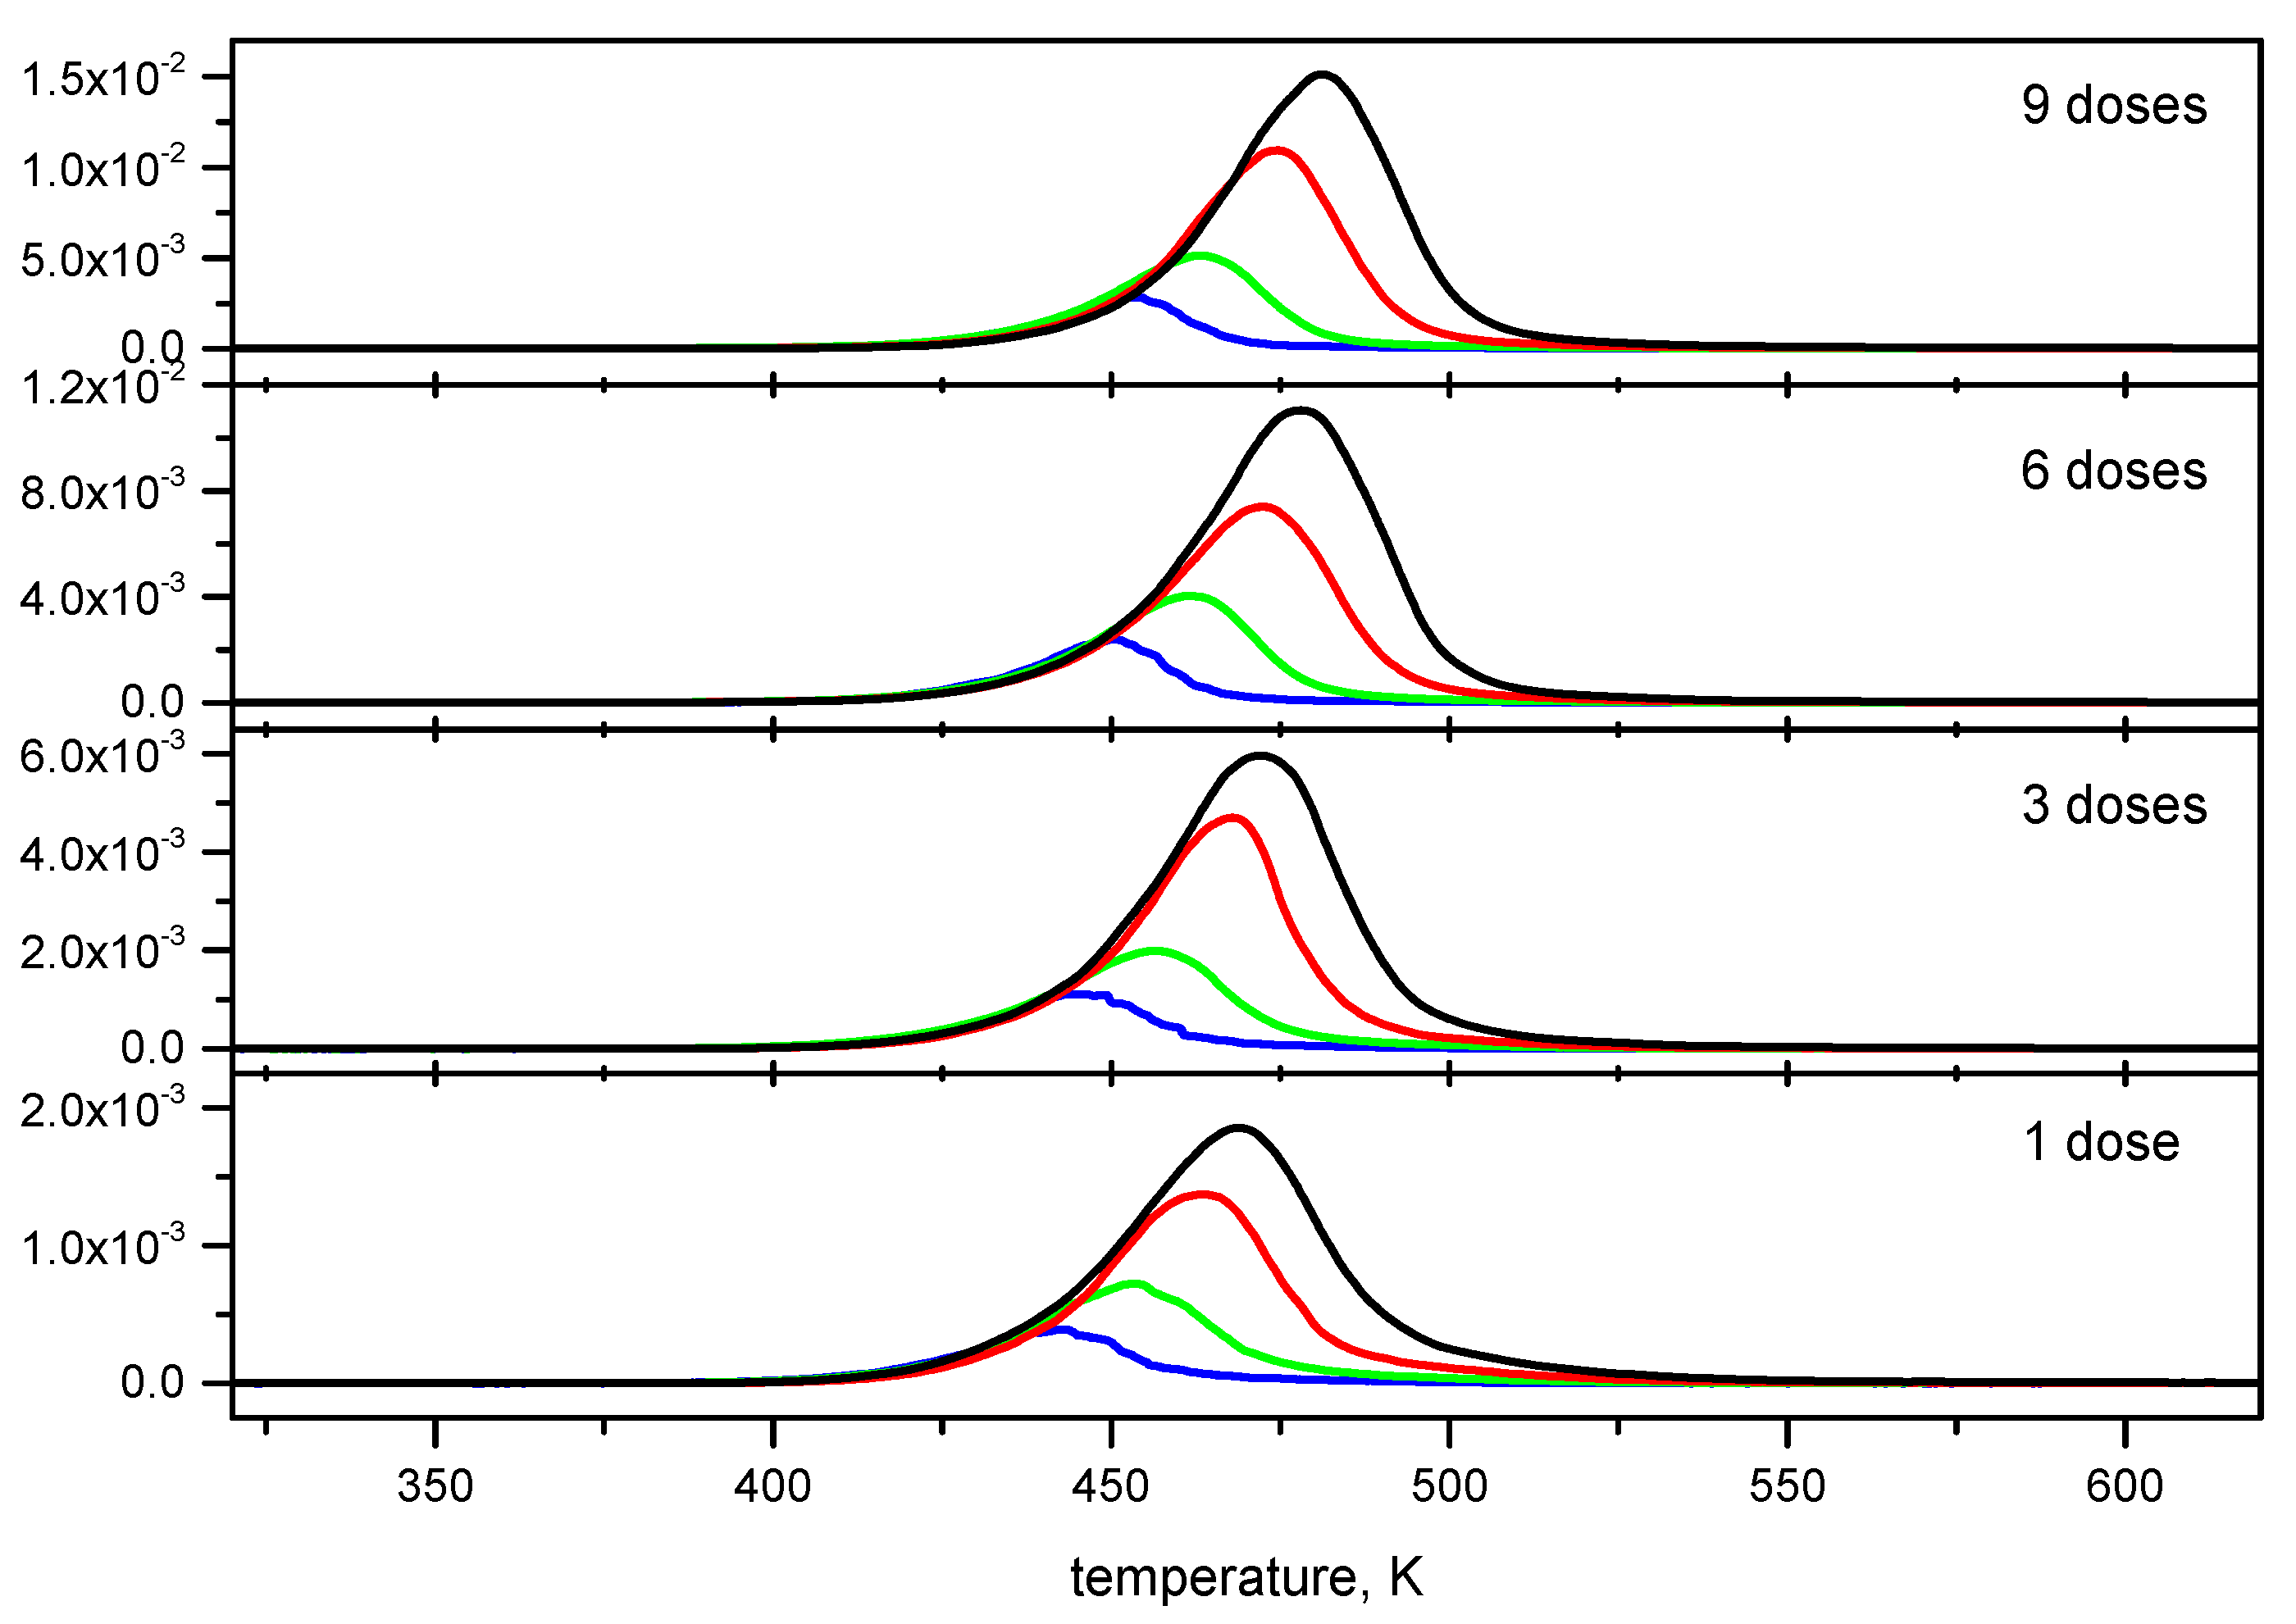
2.4. Temperature Programmed Surface Reaction (TPSR)

Ethylene was main product of ethanol dehydration in the case of TPSR experiments, contrary to results of catalytic tests in a fixed-bed flow arrangement due to a significantly lower concentration of ethanol in the confined space of zeolitic pores, as discussed below. Part of the dosed ethanol was desorbed unchanged at a single broad desorption peak with a temperature maximum around 403–423 K. Diethylether was observed only in experiments with 6 and 9 doses in trace amounts (selectivities below 0.1%). In addition, its formation took place only if ethanol was simultaneously present in the gas phase. Thus, it is likely that diethylether is formed via intermolecular (bimolecular) dehydration corresponding to some variant of the Rideal–Eley mechanism. The absence of diethylether in the TPSR signal in 1 or 3 dose samples means that the adsorbed ethanol molecules themselves cannot form the diethylether, nor the subsequent reaction of ethylene with the adsorbed ethoxy complex cannot lead to diethylether formation.
No signs of COX formation were observed in the temperature-programmed oxidation experiments that followed each TPSR experiment; this means no pore blocking occurs in TPSR experiments contrary to flow-through fixed bed experiments with CHA zeolites.
The dependence of the amount of ethylene released (in Table 3 and Figure 3) shows that after nine ethanol doses the amount of ethylene released corresponds to about 97% of the determined Brønsted centers for the MFI-30 sample indicating complete occupancy of its Brønsted sites prior TPSR experiments. Contrary to MFI, the chabazite samples did not reach full occupancy of all of its Brønsted sites, while the amount of ethanol dosed is sufficient (it corresponds to about 115% of the capacity of sample CHA-7.5 and more than 200% of the capacity of CHA-14 sample). The amount of ethylene formed during the TPSR corresponded to approximately 85% of Brønsted sites for both chabazite samples. This effect can be ascribed to the slower ethanol diffusion through the chabazite channel system and thus insufficiently effective capture/adsorption of ethanol molecules.
The measured TPSR profiles with different heating rates are presented in Figure 4 for MFI-30 samples, in Figure 5 for CHA-7.5 samples and finally in the Figure 6 for CHA-14 samples. All Figure 4, Figure 5 and Figure 6 represent calculated rates of ethylene formation and desorption (μmol·s−1) depending on the temperature from least square calculations using time recorded masses 17, 18, 26, 29, 31, 44, 45, 46, 59 and 74 amu. The ethylene was predominantly desorbed from samples in one peak. Only for the TPSR experiment with the CHA-14 samples, a high temperature small shoulder at a temperature range of 513–553 K was present, which is best perceptible in experiments with one ethanol dose. This shoulder area represents the amount of ethanol that corresponds to approximately 4% Brønsted sites of this sample and its area in experiments with a higher number of doses remains constant. Despite the unclear origin of this shoulder, its influence on the results of TPSR experiments was negligible and therefore it was omitted from subsequent analysis.
The TPSR peak maxima for the MFI-30 sample are shifted toward a higher temperature (~503 K for β = 10 K·min−1) compared to the chabazite samples (~473–483 K for 9 doses and β = 10 K·min−1). This effect indicates a higher activity of chabazite in the dehydration reaction of ethanol, which is consistent with the activities observed in the fixed-bed catalytic tests.
Temperature-programmed experiments measured with multiple values of heating rates β make it possible to determine the values of apparent activation energies of the studied process using the Kissinger Equation (1) by analyzing the temperature shift of the measured peaks–maximal rate of process.
ln T max 2 β = E A R T max + c o n s t
Obtained apparent activation energy values for all samples are presented in Figure 7 and Table 3. For both samples of chabazite, there is a clear decrease in the value of apparent activation energy with the amount of ethanol in the sample to a value of about 102–105 kJ·mol−1. The initial values of activation energy, 121 and 108 kJ·mol−1 for samples CHA-7.5 and CHA-14, correspond quite well to the values 130 and 108 kJ·mol−1 from the H/D exchange given in Table 1. The value of the apparent activation energy of ethanol dehydration for the MFI-30 sample, which results from TPSR experiments, is around 115 kJ·mol−1, and does not depend on the amount of ethanol molecules in the MFI-30 zeolite cage. This value falls within the middle of the range of apparent activation energy values obtained on the CHA samples. The observed shift of the TPSR temperature maximum to higher temperatures for this sample compared to the CHA samples shows that the higher ethanol dehydration activity of the CHA samples cannot be attributed to the energetic effect but rather to the entropic part of the kinetic rate constant. As the published experimental values of the ethylene adsorption energy on the H-MFI zeolite [55,56] are in the range of 31–39 kJ·mol−1, only weak interaction of ethylene with the zeolite framework can be expected, and hence obtained values of the apparent activation energy can be attributed solely to the kinetics of adsorbed ethanol transformation. According to Alexopoulos et al. [57], the value of apparent activation energy 118 kJ·mol−1 for ethanol dehydration over MFI type zeolite can be attributed to the third step of associative type reaction mechanism (A2 in [57]). In this activated step, the primary carbon atom bond of the protonated ethanol breaks down and water is formed. At the same time, it forms a new bond with the basic oxygen atom of the zeolite surface. The primary ethanol carbon atom is located close to the equidistant distance between two oxygen atoms of MFI zeolite, which would create the penta-coordinated state of the trigonal bi-pyramid that is characteristic of SN2 substitution.
Molecular dynamics simulations of alcohols in different zeolites have shown that the zeolite proton moves between the active site and the alcohol molecule, while the alcohol protonation rate increases with decreasing zeolite pore size [57,58], and therefore, high protonation rates of ethanol molecules can be expected for CHA zeolites. Protonating the alcohol molecule weakens the C–O bond, making the protonated monomer more susceptible to elimination and substitution reactions. Increased number of ethanol molecules in CHA zeolite can most likely even pronounce the ethanol protonation effect due to the substrate clustering effect mentioned in the introduction [35,37]. Such effects can explain observed shifts of values of the ethanol dehydration apparent activation energy in CHA samples with the increasing amount of ethanol pre-adsorbed prior of the TPSR experiments. From this point of view, it can be concluded that H/D isotopic exchange reaction conducted in static mode and monitored by FT-TR spectroscopy is more robust and more straightforward (or, in other words, easier to interpret) and more suitable as a probe reaction compared to alcohol dehydration.

3. Materials and Methods

3.1. Materials

The CHA-7.5 (JPMC-297) and CHA-14 (JPMC-230) was bought from Eurecat U.S., Inc., Houston, TX, USA and the MFI-30 sample was obtained from ORLEN UniCRE a.s, Litvínov, Czech Republic. Zeolites were calcined at 743 K for 24 h in an oxygen atmosphere. Calcined samples were then treated with 1.0 M NH4NO3 (p.a., Penta s.r.o., Chrudim, Czech Republic) for 96 h at 313 K using 400 cm3 of solution for 1 g. This procedure ensured 100% NH4+ occupancy of cationic sites.

3.2. Common Materials Characterization Techniques

Experimental procedures for common zeolitic material characterization techniques–SEM microscopy, powder X-ray diffraction, N2-adsorption isotherm measurement and NH3-temperature programmed desorption can be found in the Supplementary Info file, as well as TG-DTA experiments used for determination of the amount of coke in the spent catalysts.

3.3. FTIR Measurement of H/D Ethane Exchange

The study of Brønsted acid sites acidity/reactivity was performed by an isotopic exchange in-situ experiments carried out using the AABspec #2000-A Multimode cell (AABspec Instrument Corp., Dublin, Ireland) in FT-IR spectrometer Nicolet 6700 with MCT/A detector cooled by liquid nitrogen. The measured samples were pressed into thin self-supported wafers with a density of approximately 5–8 mg/cm2 and were pre-treated by evacuation at 723 K for 2 h under approximately 100 mbar of O2 with a slow heating rate of 2 K·min−1. Investigated samples were then cooled slowly down to 423 K and exposed to 20 mbar of D2O for 30 min, followed by an additional 30 min of evacuation by turbomolecular pump. Deuterated sample was slowly heated to the target temperature (ranging from 603 to 783 K) at which D/H isotopic exchange reaction was studied. After stabilization of the required temperature (measured by thermocouple placed in the wafer holder in close proximity to the sample), ethane (50 mbar) was introduced into the IR cell and recording of the time-resolved IR spectra measurement was started. IR spectra were collected continuously until conversion of OD groups into OH groups reached at least 60% with the optical resolution of 4 cm−1 by accumulation of 64 scans. The temperature of the sample was monitored during the whole D/H isotopic exchange experiment and its variance during the IR spectra recording was less than 1 K for all experiments.

3.4. Fixed Bed Ethanol Dehydration Reaction Tests

Ethanol dehydration was carried out in a glass U-reactor with 10 mg zeolite catalyst load on a bed made from quartz wool. The catalyst was pretreated with O2 gas (200 cm3/h) at 673 K for 16 h before catalytic testing. This procedure ensured transformation of the ammonia form of fresh zeolite into the protonic form or regeneration of spent zeolite (burning out the possible coke deposits from the previous catalytic run). During the catalytic reaction 6 dm3/h of total flow was used. The concentration of ethanol was 1 and 10 mol. % in He. Temperature during the catalytic test varied from 393 K to 473 K. Catalytic tests were conducted in a homemade apparatus with connection to gas chromatograph which allows online measurement of inlet or outlet gases. Used GC (Agilent 7890B, Agilent Technologies, Inc., Santa Clara, CA, USA) was equipped with a Carboxen TM (60 m × 0.53 mm × 0.5 μm) column connected to a TCD detector and with a Stabilwax 10,643 (60 m × 0.53 mm × 0.5 μm) column connected to an FID detector. Ethanol was evaporated at constant temperature and fed into a reactor diluted by helium with a purity of 99.996%. Catalyst was used in grains with size 0.25–0.5 mm. The ethanol conversion (XEtOH), product selectivity (Si) and yield (Yi) were calculated by using the following equations:
Y i = n ˙ i ν i n ˙ E t O H , i n
X E t O H = i Y i
S i = Y i X E t O H
where n ˙ E t O H , i n , n ˙ i are the inlet ethanol molar flow and the output molar flow of the i-th product, and ν i is its stoichiometric coefficient for formation from one molecule of ethanol. Turn over frequency (TOF) values were calculated using Equation (5), where n H + i n s a m p l e is number of Brønsted sites in the catalyst sample obtained from NH3-TPD. The apparent ethanol reaction activation energy (EA) and reaction order (α) were estimated from the Arrhenius equation and Equation (6) based on the assumption that conversion degree values at the initial stage of reaction (values lower than 30%) are proportional to the rate of reaction.
T O F = n ˙ E t O H , i n X E t O H n H + i n s a m p l e
α = ln 10 X c 0 = 10 % X c 0 = 1 % ln 10

3.5. Temperature Programmed Surface Reaction (TPSR)

TPSR was measured using an AutoChem II 2920 (Micromeritics Instrument Cor., Norcross, GA, USA) apparatus. The load 10 mg of zeolite (grain size 0.25–0.5 mm) ion exchanged into NH4+ form was introduced into a quartz U-reactor with a bed of quartz wool. The sample was first pre-treated by heating in a helium flow of 25 cm3·min−1 STP up to 753 K at 10 K·min−1, and this temperature was held for 10 min and then cooled to 313 K. The ethanol vapors were striped by helium flow from a thermostated saturator and then dosed to the zeolite sample by 6-way valve (Vici AG International, Schenkon, Switzerland) with a 0.5 cm3 loop. Ethanol was dosed in 1, 3, 6 or 9 doses to obtain different amounts of ethanol in the zeolite sample, and after the dosing sequence 20 min were given for the unadsorbed ethanol to wash out. The TPSR experiments were carried out after the ethanol dosing sequence in a helium flow of 25 cm3·min−1 STP by heating the sample up to 753 K using 2.5, 5, 10 or 15 K·min−1 heating rates held for 10 min at the final temperature. Each TPSR experiment was followed by the temperature programmed oxidation (TPO) experiment carried out in a flow of gas mixture containing 16 vol. % of O2 in He with a total flow rate of 30 cm3·min−1 STP in temperature range 373–1023 K with heating range 10 K·min−1. Desorbed compounds in outlet gas were detected using the mass spectrometer OmniStar GSD 320 (Pfeiffer Vacuum GmbH, Aßlar, Germany). Masses m/e = 4, 17, 18, 26, 28, 29, 31, 32, 44, 45, 46, 59 and 74 were simultaneously monitored. Response factors for ethanol, ethylene and diethylether to these masses were obtained by syringe calibration doses of pure compounds.

4. Conclusions

In this work, we tested the effect of substrate concentration on the kinetic parameters of the ethanol dehydration measured as a probe reaction. While the most important results of our study were already introduced and discussed in paragraphs above, here we wish to summarize most important observations in a few points listed below.
  • It is practically impossible to obtain relevant kinetic data about the ethanol dehydration process from ordinary catalytic measurements for CHA-type zeolites, due to the large influence of internal diffusion and cracking processes during catalytic tests.
  • Even for zeolites with larger pores (such as MFI), where it is possible to suppress the effect of internal diffusion by choosing reaction conditions, kinetics parameters (especially activation barriers), obtained from steady-state catalytic tests, are not in good agreement with acidity descriptors derived from the H/D isotopic exchange probe reaction or theoretical calculations.
  • The TPSR technique gives the opportunity to obtain values of apparent activation energy that are not burdened by internal diffusion and agree with the results of H/D exchange method.
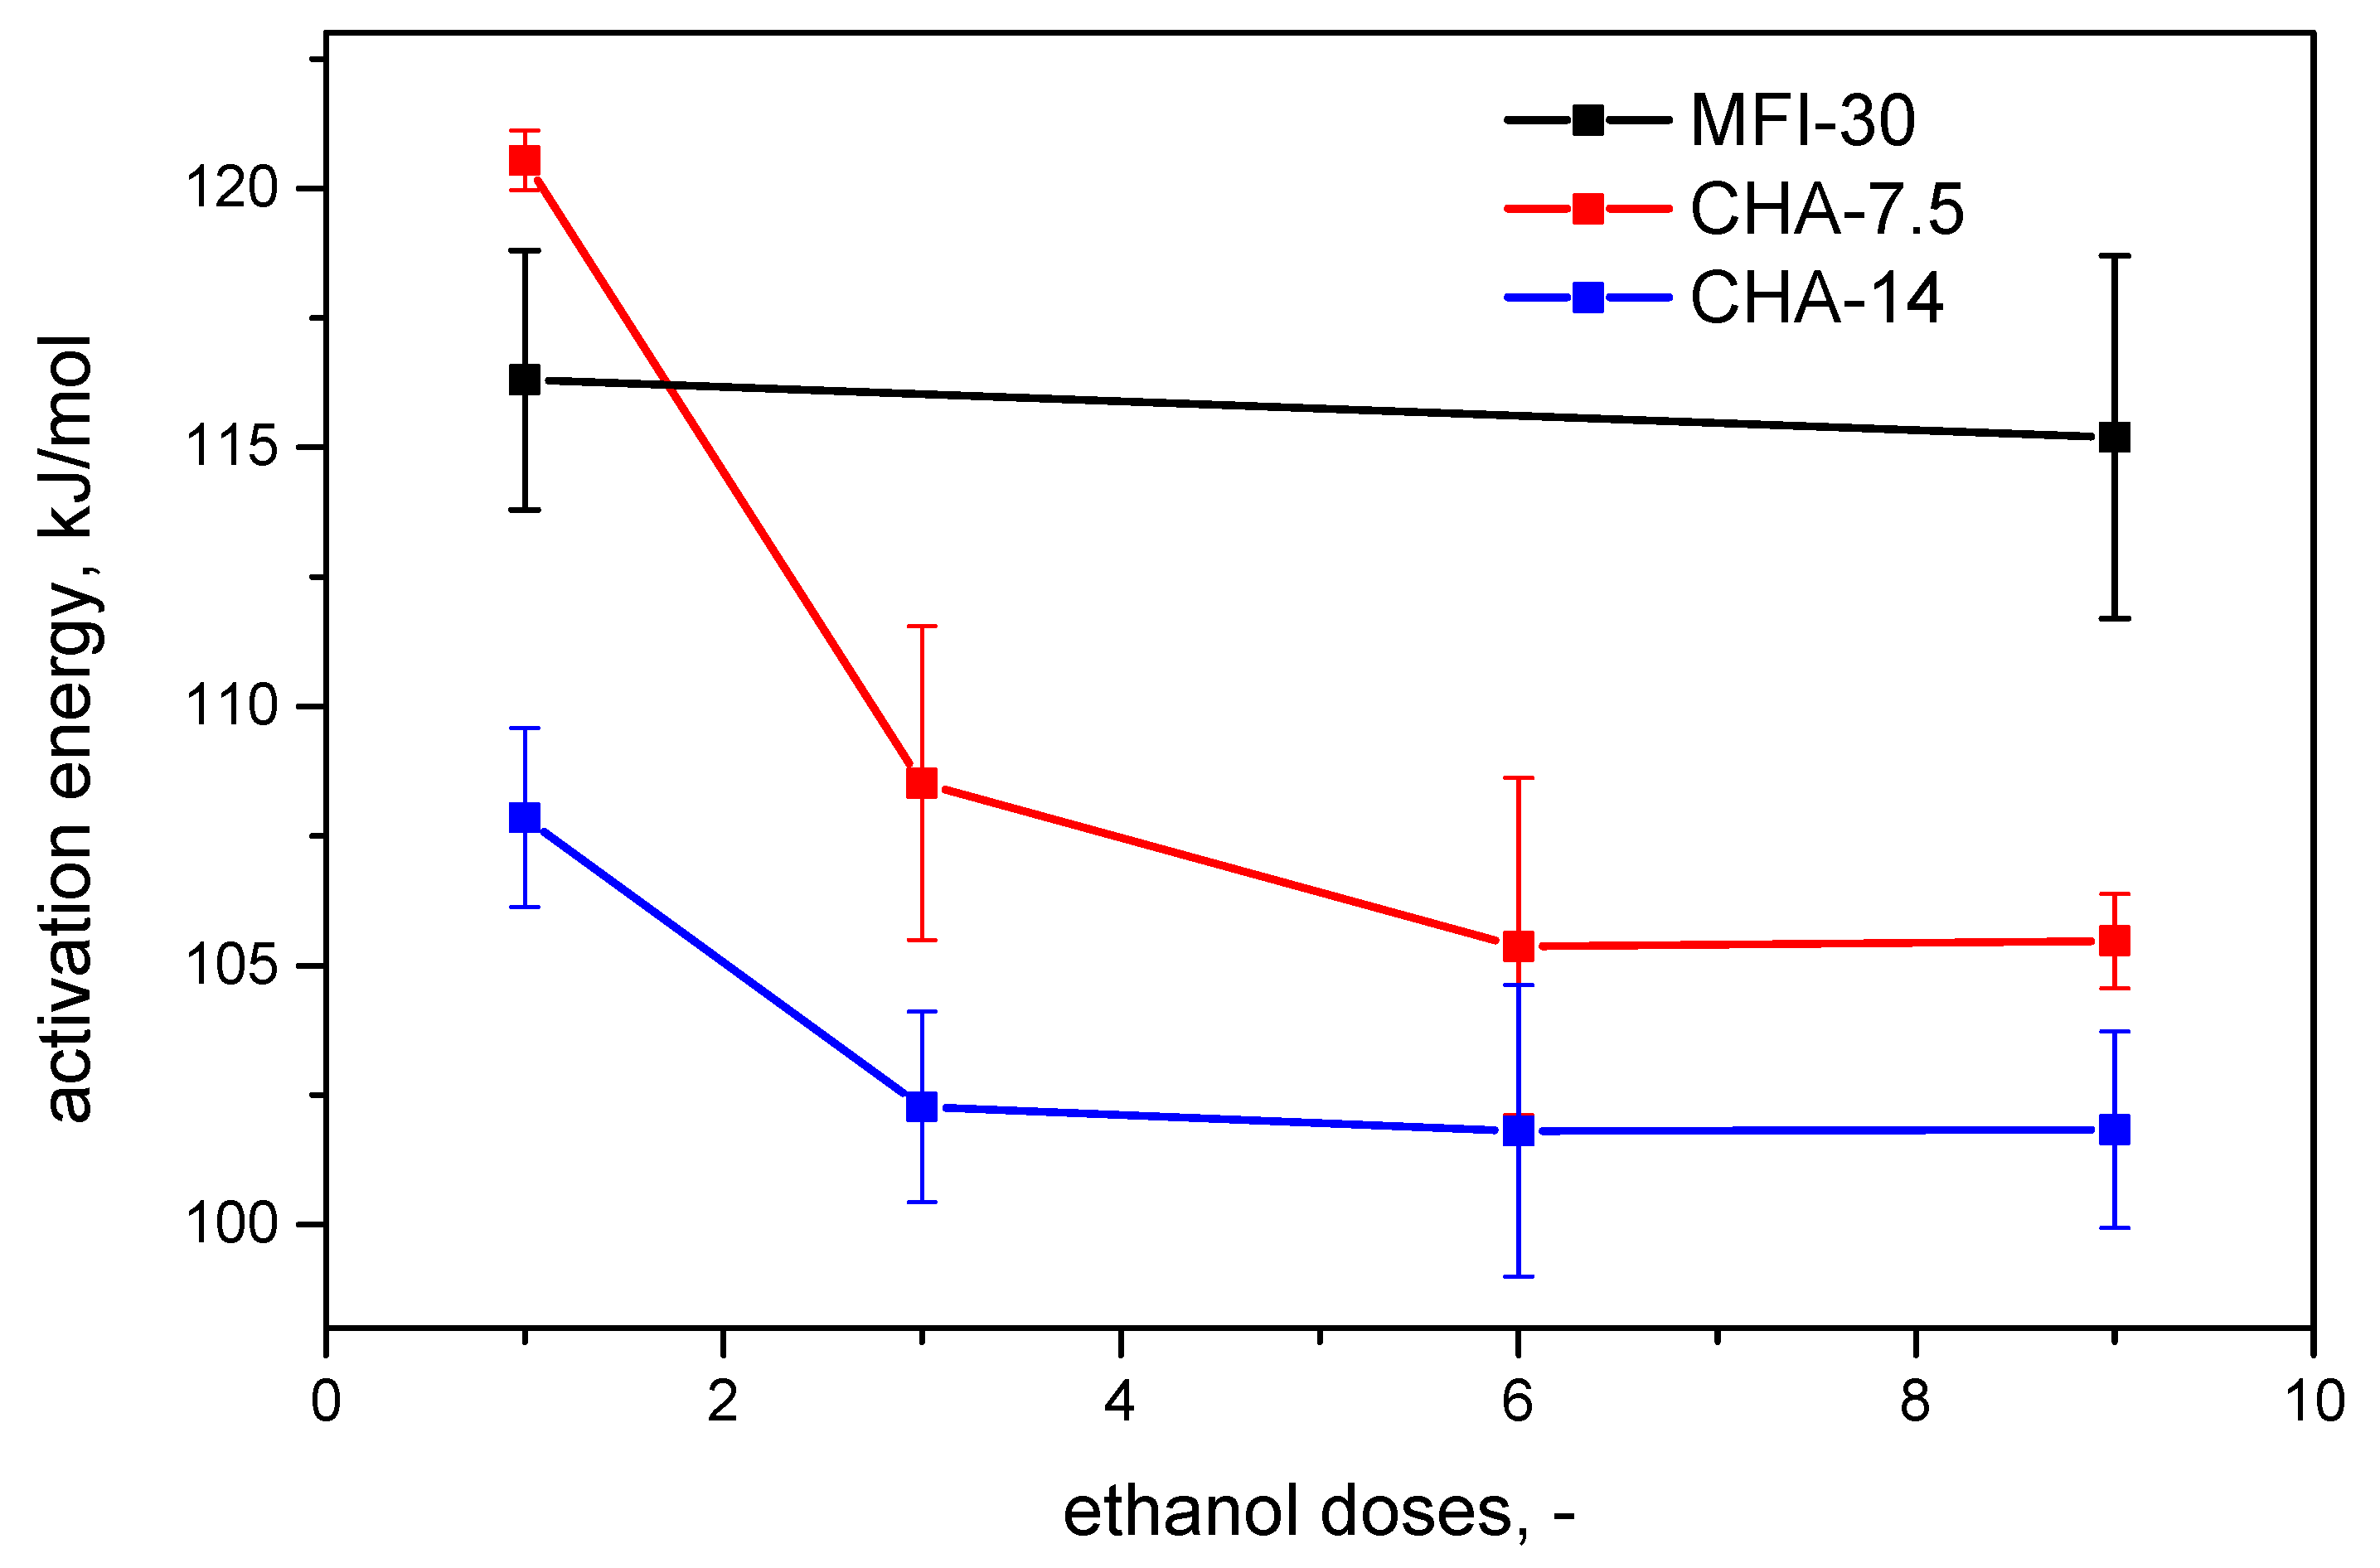
  • For chabazite samples, the TPSR method showed that the value of activation energy depends on the number of ethanol molecules in the unit cell of zeolite and decreases from values similar to those determined from the H/D methodology to values of about 102–105 kJ·mol−1. This effect is most likely due to the formation of the interparticle clusters mentioned in other studies [37,38,39], which promote the deprotonation of chabazite zeolitic acid sites.
  • In contrast to catalytic tests, the dominant product in TPSR experiments is ethylene, which indicates that ethanol molecules in the gas phase play a very significant role in the dehydration mechanism in classical catalytic tests, probably involved in surface “cleaning” in reaction with adsorbed ethoxy complex. In addition, at least under the conditions of TPSR experiments, ethylene ↔ diethyl ether interconversion appears to be insignificant.

Supplementary Materials

The following are available online at https://www.mdpi.com/article/10.3390/catal12010051/s1; Figure S1: SEM images of zeolite samples tested in this work; Figure S2: XRD patterns of zeolite samples tested in this work; Figure S3: N2@77K adsorption isotherms of zeolite samples tested in this work; Figure S4: NH3-TPD curves for zeolite samples tested in this work; Figure S5: TG-DTA of the fixed-bed reaction deactivated sample; Figure S6: FT-IR spectra of original dehydrated zeolites, deuterated zeolite and time resolved spectra measured in-situ during H/D isotopic exchange …; Figure S7: natural logarithm of relative intensity of acidic OD group vibrational band as a function of temperature for CHA-7.5, CHA-14 and MFI-30.

Author Contributions

Conceptualization, P.Č. and R.B.; investigation, P.Č., J.K. and J.V.; writing—original draft preparation, P.Č. and R.B.; writing—review and editing, P.Č. and R.B.; project administration, R.B.; funding acquisition, R.B. All authors have read and agreed to the published version of the manuscript.

Funding

This research was funded by the Czech Science Foundation GA CR, grant number 19-19542S, the University of Pardubice, grant number SGS_2021_006, and the Ministry of Education, Youth and Sports of the Czech Republic, grant number LM2018103.

Acknowledgments

In addition, we would like to thank Veronika Čičmancová and Stanislav Šlang from the Center of Materials and Nanotechnology (CEMNAT) of the University of Pardubice for SEM images and EDX analysis, and Jana Shánělová for TG-DTA measurement.

Conflicts of Interest

The authors declare no conflict of interest.

References

  1. Maesen, T.; Marcus, B. Chapter 1 The Zeolite Scene—An Overview; Elsevier: Amsterdam, The Netherlands, 2001; Volume 137. [Google Scholar]
  2. Čejka, J.; Bekkum, H.v.; Corma, A.; Schueth, F. Introduction to Zeolite Molecular Sieves, 3nd ed.; Elsevier: Amsterdam, The Netherlands, 2007; Volume 168. [Google Scholar]
  3. Xu, Z.Q.; Ma, H.F.; Huang, Y.X.; Qian, W.X.; Zhang, H.T.; Ying, W.Y. Synthesis of Submicron SSZ-13 with Tunable Acidity by the Seed-Assisted Method and Its Performance and Coking Behavior in the MTO Reaction. ACS Omega 2020, 5, 24574–24583. [Google Scholar] [CrossRef] [PubMed]
  4. Zhu, Q.J.; Kondo, J.N.; Tatsumi, T. Co-reaction of methanol and ethylene over MFI and CHA zeolitic catalysts. Microporous Mesoporous Mater. 2018, 255, 174–184. [Google Scholar] [CrossRef]
  5. Borodina, E.; Meirer, F.; Lezcano-Gonzalez, I.; Mokhtar, M.; Asiri, A.M.; Al-Thabaiti, S.A.; Basahel, S.N.; Ruiz-Martinez, J.; Weckhuysen, B.M. Influence of the Reaction Temperature on the Nature of the Active and Deactivating Species during Methanol to Olefins Conversion over H-SSZ-13. ACS Catal. 2015, 5, 992–1003. [Google Scholar] [CrossRef]
  6. Chen, J.Q.; Bozzano, A.; Glover, B.; Fuglerud, T.; Kvisle, S. Recent advancements in ethylene and propylene production using the UOP/Hydro MTO process. Catal. Today 2005, 106, 103–107. [Google Scholar] [CrossRef]
  7. Chen, D.; Moljord, K.; Holmen, A. A methanol to olefins review: Diffusion, coke formation and deactivation SAPO type catalysts. Microporous Mesoporous Mater. 2012, 164, 239–250. [Google Scholar] [CrossRef]
  8. Abdo, S.F.; Wilson, S.T. Zeolites in Industrial Catalysis. In Zeolites in Catalysis: Properties and Applications; The Royal Society of Chemistry: London, UK, 2017; Chapter 9; pp. 310–350. [Google Scholar]
  9. Arvidsson, A.A.; Plessow, P.N.; Studt, F.; Hellman, A. Influence of Acidity on the Methanol-to-DME Reaction in Zeotypes: A First Principles-Based Microkinetic Study. J. Phys. Chem. C 2020, 124, 14658–14663. [Google Scholar] [CrossRef]
  10. Liu, C.; Tranca, I.; van Santen, R.A.; Hensen, E.J.M.; Pidko, E.A. Scaling Relations for Acidity and Reactivity of Zeolites. J. Phys. Chem. C 2017, 121, 23520–23530. [Google Scholar] [CrossRef]
  11. Kester, P.M.; Crum, J.T.; Li, S.C.; Schneider, W.F.; Gounder, R. Effects of Bronsted acid site proximity in chabazite zeolites on OH infrared spectra and protolytic propane cracking kinetics. J. Catal. 2021, 395, 210–226. [Google Scholar] [CrossRef]
  12. Li, S.H.; Zhao, Z.C.; Li, S.K.; Xing, Y.D.; Zhang, W.P. Aluminum Distribution and Bronsted Acidity of Al-Rich SSZ-13 Zeolite: A Combined DFT Calculation and Solid-State NMR Study. Acta Phys.-Chim. Sin. 2020, 36, 1903021. [Google Scholar] [CrossRef]
  13. Wang, S.; He, Y.; Jiao, W.Y.; Wang, J.G.; Fan, W.B. Recent experimental and theoretical studies on Al siting/acid site distribution in zeolite framework. Curr. Opin. Chem. Eng. 2019, 23, 146–154. [Google Scholar] [CrossRef]
  14. Potter, M.E.; Cholerton, M.E.; Kezina, J.; Bounds, R.; Carravetta, M.; Manzoli, M.; Gianotti, E.; Lefenfeld, M.; Raja, R. Role of Isolated Acid Sites and Influence of Pore Diameter in the Low-Temperature Dehydration of Ethanol. ACS Catal. 2014, 4, 4161–4169. [Google Scholar] [CrossRef]
  15. Suzuki, K.; Nishio, T.; Katada, N.; Sastre, G.; Niwa, M. Ammonia IRMS-TPD measurements on Bronsted acidity of proton-formed SAPO-34. PCCP Phys. Chem. Chem. Phys. 2011, 13, 3311–3318. [Google Scholar] [CrossRef]
  16. Katada, N.; Nouno, K.; Lee, J.K.; Shin, J.; Hong, S.B.; Niwa, M. Acidic Properties of Cage-Based, Small-Pore Zeolites with Different Framework Topologies and Their Silicoaluminophosphate Analogues. J. Phys. Chem. C 2011, 115, 22505–22513. [Google Scholar] [CrossRef]
  17. Bordiga, S.; Lamberti, C.; Bonino, F.; Travert, A.; Thibault-Starzyk, F. Probing zeolites by vibrational spectroscopies. Chem. Soc. Rev. 2015, 44, 7262–7341. [Google Scholar] [CrossRef]
  18. Boronat, M.; Corma, A. What Is Measured When Measuring Acidity in Zeolites with Probe Molecules? ACS Catal. 2019, 9, 1539–1548. [Google Scholar] [CrossRef] [PubMed]
  19. Bleken, F.; Bjorgen, M.; Palumbo, L.; Bordiga, S.; Svelle, S.; Lillerud, K.P.; Olsbye, U. The Effect of Acid Strength on the Conversion of Methanol to Olefins over Acidic Microporous Catalysts with the CHA Topology. Top. Catal. 2009, 52, 218–228. [Google Scholar] [CrossRef]
  20. Martins, G.V.A.; Berlier, G.; Bisio, C.; Coluccia, S.; Pastore, H.O.; Marchese, L. Quantification of bronsted acid sites in microporous catalysts by a combined FTIR and NH3-TPD study. J. Phys. Chem. C 2008, 112, 7193–7200. [Google Scholar] [CrossRef]
  21. Regli, L.; Bordiga, S.; Zeechina, A.; Bjorgen, M.; Lillerud, K.P. Acidity properties of CHA-zeolites (SAPO-34 and SSZ-13): An FTIR spectroscopic study. In Oxide Based Materials: New Sources, Novel Phases, New Applications; Gamble, A., Colella, C., Coluccia, S., Eds.; Studies in Surface Science and Catalysis; Elsevier Science BV: Amsterdam, The Netherlands, 2005; Volume 155, pp. 471–479. [Google Scholar]
  22. Kadam, S.A.; Li, H.G.; Wormsbecher, R.F.; Travert, A. Impact of Zeolite Structure on Entropic-Enthalpic Contributions to Alkane Monomolecular Cracking: An IR Operando Study. Chem.-Eur. J. 2018, 24, 5489–5492. [Google Scholar] [CrossRef]
  23. Guan, L.; Huang, C.; Han, D.; Zhu, L.; Mei, Y.; He, D.; Zu, Y. Reaction pathways of n-butane cracking over the MFI, FER and TON zeolites: Influence of regional differences in Brønsted acid sites. Microporous Mesoporous Mater. 2022, 330, 111605. [Google Scholar] [CrossRef]
  24. Masih, D.; Rohani, S.; Kondo, J.N.; Tatsumi, T. Low-temperature methanol dehydration to dimethyl ether over various small-pore zeolites. Appl. Catal. B-Environ. 2017, 217, 247–255. [Google Scholar] [CrossRef]
  25. Zhong, J.W.; Han, J.F.; Wei, Y.X.; Liu, Z.M. Catalysts and shape selective catalysis in the methanol-to-olefin (MTO) reaction. J. Catal. 2021, 396, 23–31. [Google Scholar] [CrossRef]
  26. Kadam, S.A.; Shamzhy, M.V. IR Operando Study of Ethanol Dehydration over MFI Zeolites: Structure-Activity Relationships. J. Phys. Chem. C 2018, 122, 24055–24067. [Google Scholar] [CrossRef]
  27. Wu, Z.Y.; Zhang, J.; Su, Z.R.; Wang, P.Z.; Tan, T.W.; Xiao, F.S. Low-Temperature Dehydration of Ethanol to Ethylene over Cu-Zeolite Catalysts Synthesized from Cu-Tetraethylenepentamine. Ind. Eng. Chem. Res. 2020, 59, 17300–17306. [Google Scholar] [CrossRef]
  28. Batchu, R.; Galvita, V.V.; Alexopoulos, K.; Glazneva, T.S.; Poelman, H.; Reyniers, M.F.; Marin, G.B. Ethanol dehydration pathways in H-ZSM-5: Insights from temporal analysis of products. Catal. Today 2020, 355, 822–831. [Google Scholar] [CrossRef]
  29. Knaeble, W.; Iglesia, E. Kinetic and Theoretical Insights into the Mechanism of Alkanol Dehydration on Solid Bronsted Acid Catalysts. J. Phys. Chem. C 2016, 120, 3371–3389. [Google Scholar] [CrossRef]
  30. Kubota, T.; Osuga, R.; Yokoi, T.; Kondo, J.N. Consideration of Acid Strength of a Single OH Group on Zeolites by Isotope Exchange Reaction with Ethane at High Temperatures. Top. Catal. 2017, 60, 1496–1505. [Google Scholar] [CrossRef]
  31. Wang, C.; Li, S.; Mao, X.Y.; Caratzoulas, S.; Gorte, R.J. H-D Exchange of Simple Aromatics as a Measure of BrOnsted-Acid Site Strengths in Solids. Catal. Lett. 2018, 148, 3548–3556. [Google Scholar] [CrossRef]
  32. Bulanek, R.; Kubu, M.; Vaculik, J.; Cejka, J. H/D reactivity and acidity of Bronsted acid sites of MWW zeolites: Comparison with MFI zeolite. Appl. Catal. A: Gen. 2019, 575, 180–186. [Google Scholar] [CrossRef]
  33. Mildner, T.; Freude, D. Proton transfer between bronsted sites and benzene molecules in zeolites H-Y studies by In Situ MAS NMR. J. Catal. 1998, 178, 309–314. [Google Scholar] [CrossRef] [Green Version]
  34. Thibault-Starzyk, F.; Travert, A.; Saussey, J.; Lavalley, J.C. Correlation between activity and acidity on zeolites: A high temperature infrared study of adsorbed acetonitrile. Top. Catal. 1998, 6, 111–118. [Google Scholar] [CrossRef]
  35. Bordiga, S.; Regli, L.; Lamberti, C.; Zecchina, A.; Bjorgen, M.; Lillerud, K.P. FTIR adsorption studies of H2O and CH3OH in the isostructural H-SSZ-13 and H-SAPO-34: Formation of H-bonded adducts and protonated clusters. J. Phys. Chem. B 2005, 109, 7724–7732. [Google Scholar] [CrossRef]
  36. Di Iorio, J.R.; Hoffman, A.J.; Nimlos, C.T.; Nystrom, S.; Hibbitts, D.; Gounder, R. Mechanistic origins of the high-pressure inhibition of methanol dehydration rates in small-pore acidic zeolites. J. Catal. 2019, 380, 161–177. [Google Scholar] [CrossRef]
  37. Bates, J.S.; Gounder, R. Kinetic effects of molecular clustering and solvation by extended networks in zeolite acid catalysis. Chem. Sci. 2021, 12, 4699–4708. [Google Scholar] [CrossRef] [PubMed]
  38. Bates, J.S.; Gounder, R. Clustering of alkanols confined in chabazite zeolites: Kinetic implications for dehydration of methanol-ethanol mixtures. J. Catal. 2020, 390, 178–183. [Google Scholar] [CrossRef]
  39. Bates, J.S.; Bukowski, B.C.; Greeley, J.; Gounder, R. Structure and solvation of confined water and water-ethanol clusters within microporous Bronsted acids and their effects on ethanol dehydration catalysis. Chem. Sci. 2020, 11, 7102–7122. [Google Scholar] [CrossRef] [PubMed]
  40. Baerlocher, C.; McCusker, L.B. Database of Zeolite Structures. Available online: http://www.iza-structure.org/databases/ (accessed on 1 December 2021).
  41. Rouquerol, J.; Rouquerol, F.; Llewellyn, P.; Maurin, G.; Sing, K. Adsorption by Powders and Porous Solids. Principles, Methodology and Applications, 2nd ed.; Elsevier: Amsterdam, The Netherlands, 2014. [Google Scholar]
  42. Meng, L.; Zhu, X.; Mezari, B.; Pestman, R.; Wannapakdee, W.; Hensen, E.J.M. On the Role of Acidity in Bulk and Nanosheet [T]MFI (T = Al3+, Ga3+, Fe3+, B3+) Zeolites in the Methanol-to-Hydrocarbons Reaction. ChemCatChem 2017, 9, 3942–3954. [Google Scholar] [CrossRef] [Green Version]
  43. Wang, Y.; Shao, Y.; Li, G.; Li, T.; Wang, H.; Wang, J.-G. Synthesis of high-micropore-volume pure-silica zeolites from a polymer near-neutral medium free of fluoride ions for VOCs capture. Microporous Mesoporous Mater. 2019, 286, 149–154. [Google Scholar] [CrossRef]
  44. Rutkowska, M.; Duda, M.; Kowalczyk, A.; Chmielarz, L. Modification of the physicochemical properties of the commercial CHA zeolite and examination of its activity in nitrogen oxide abatement. C. R. Chim. 2017, 20, 850–859. [Google Scholar] [CrossRef]
  45. Florindo, B.R.; Catuzo, G.L.; Martins, L. Porosity of CHA Zeolite Driving the Formation of Polyaromatic Coke Species in the Methanol to Olefiins Reaction. J. Braz. Chem. Soc. 2021, 32, 1051–1059. [Google Scholar] [CrossRef]
  46. Vaculik, J.; Setnicka, M.; Bulanek, R. Study of Bronsted acid site in H-MCM-22 zeolite by temperature-programmed desorption of ammonia. J. Therm. Anal. Calorim. 2016, 125, 1217–1224. [Google Scholar] [CrossRef]
  47. Wang, C.; Xu, J.; Wang, Q.; Zhou, X.; Qi, G.D.; Feng, N.D.; Liu, X.L.; Meng, X.J.; Xiao, F.S.; Deng, F. Host-Guest Interactions and Their Catalytic Consequences in Methanol to Olefins Conversion on Zeolites Studied by C-13-Al-27 Double-Resonance Solid-State NMR Spectroscopy. ACS Catal. 2017, 7, 6094–6103. [Google Scholar] [CrossRef]
  48. Qian, Q.; Ruiz-Martinez, J.; Mokhtar, M.; Asiri, A.M.; Al-Thabaiti, S.A.; Basahel, S.N.; Weckhuysen, B.M. Single-catalyst particle spectroscopy of alcohol-to-olefins conversions: Comparison between SAPO-34 and SSZ-13. Catal. Today 2014, 226, 14–24. [Google Scholar] [CrossRef]
  49. Zhu, Q.J.; Kondo, J.N.; Inagaki, S.; Tatsumi, T. Catalytic Activities of Alcohol Transformations Over 8-Ring Zeolites. Top. Catal. 2009, 52, 1272–1280. [Google Scholar] [CrossRef]
  50. Park, J.W.; Seo, G. IR study on methanol-to-olefin reaction over zeolites with different pore structures and acidities. Appl. Catal. A-Gen. 2009, 356, 180–188. [Google Scholar] [CrossRef]
  51. Seo, G.; Kim, J.H.; Jang, H.G. Methanol-to-Olefin Conversion over Zeolite Catalysts: Active Intermediates and Deactivation. Catal. Surv. Asia 2013, 17, 103–118. [Google Scholar] [CrossRef]
  52. Di Iorio, J.R.; Nimlos, C.T.; Gounder, R. Introducing Catalytic Diversity into Single-Site Chabazite Zeolites of Fixed Composition via Synthetic Control of Active Site Proximity. ACS Catal. 2017, 7, 6663–6674. [Google Scholar] [CrossRef]
  53. Zhang, K.; Lively, R.P.; Dose, M.E.; Li, L.W.; Koros, W.J.; Ruthven, D.M.; McCool, B.A.; Chance, R.R. Diffusion of water and ethanol in silicalite crystals synthesized in fluoride media. Microporous Mesoporous Mater. 2013, 170, 259–265. [Google Scholar] [CrossRef]
  54. Vannice, M.A. Kinetics of Catalytic Reactions; Springer: New York, NY, USA, 2005. [Google Scholar]
  55. Choudhary, V.R.; Mayadevi, S. Adsorption of methane, ethane, ethylene, and carbon-dioxide on high-silica pentasil zeolites and zeolite-like materials using gas-chromatography pulse technique. Sep. Sci. Technol. 1993, 28, 2197–2209. [Google Scholar] [CrossRef]
  56. Yeh, Y.-H.; Rzepa, C.; Rangarajan, S.; Gorte, R.J. Influence of Bronsted-acid and cation-exchange sites on ethene adsorption in ZSM-5. Microporous Mesoporous Mater. 2019, 284, 336–342. [Google Scholar] [CrossRef]
  57. Alexopoulos, K.; John, M.; Van der Borght, K.; Galvita, V.; Reyniers, M.-F.; Marin, G.B. DFT-based microkinetic modeling of ethanol dehydration in H-ZSM-5. J. Catal. 2016, 339, 173–185. [Google Scholar] [CrossRef]
  58. Stich, I.; Gale, J.D.; Terakura, K.; Payne, M.C. Role of the zeolitic environment in catalytic activation of methanol. J. Am. Chem. Soc. 1999, 121, 3292–3302. [Google Scholar] [CrossRef]
Figure 1. Rate constants of the H/D isotopic exchange between ethane (50 mbar) and deuterated zeolite as a function of temperature (A) and Arrhenius plot of the data from panel A (B).
Catalysts 12 00051 g001
Figure 2. Catalytic ethanol dehydration TOS stability over all samples for 10% of ethanol in reaction stream.
Catalysts 12 00051 g002
Figure 3. Amount of ethylene formed during TPSR experiments (from experiments with β = 10 K·min−1).
Catalysts 12 00051 g003
Figure 4. MFI–30 TPSR profiles after 1 and 9 loop doses of ethanol measured at different heating rates (black curves—15 K·min−1; red curves—10 K·min−1; green curves—5 K·min−1; blue curves—2.5 K·min−1). The y-axis is the rate of formation of ethylene in μmol·s−1.
Catalysts 12 00051 g004
Figure 5. CHA–7.5 TPSR profiles measured at different heating rates (black curves—15 K·min−1; red curves—10 K·min−1; green curves—5 K·min−1; blue curves—2.5 K·min−1), y-axis is rate of formation of ethylene in μmol·s−1.
Catalysts 12 00051 g005
Figure 6. CHA–14 TPSR profiles measured at different heating rates (black curves—15 K·min−1; red curves—10 K·min−1; green curves—5 K·min−1; blue curves—2.5 K·min−1), y-axis is rate of formation of ethylene in μmol·s−1.
Catalysts 12 00051 g006
Figure 7. Apparent activation energy values obtained from TPSR experiments in dependence of number of ethanol doses.
Catalysts 12 00051 g007
Table 1. Results of characterization methods.
SampleSBET *, m2·g−1SEXT **, m2·g−1Vμ **, cm3·g−1H+ from NH3-TPD,
μmol per 10 mg
EA of H/D Exchange, kJ·mol−1
MFI-3040824.80.1245.31104 ± 1
CHA-7.54782.90.24411.97130 ± 1
CHA-1451051.50.2346.69109 ± 3
(*) BET values have been calculated from the range p/p° = 0.05–0.3 (for all isotherms, C < 0), the value can be used only for comparison. (**) Values of external surface and micropore volume were determined from t-plot calculated using Harkins & Jura master isotherm.
Table 2. Catalytic data over zeolites samples obtained at time on stream (TOS) = 2 min.
Sample 1% of Ethanol 10% of Ethanol
T
K
SDE,0 *
%
X0 *
%
TOF0 *
min−1
EA
kJ·mol−1
T
K
SDE,0
%
X0
%
TOF0
min−1
EA
kJ·mol−1
MFI-3041399.81.10.096641399.80.10.08104
43399.82.90.2443399.80.40.34
45399.46.10.5145399.71.41.18
47398.012.81.0847399.34.73.95
CHA-7.539398.59.30.357039398.51.10.41
41394.126.30.9841393.63.71.3877
43391.344.2 **1.65/43392.49.63.58
CHA-1439394.55.70.38 39395.10.90.60
41393.612.00.85141394.82.01.3355
43392.423.81.5943393.34.32.87
(*) SDE,0, X0, TOF0—Selectivity for diethylether, conversion degree and turn over frequency values were calculated using Equations (3)–(5) from Section 3.4. (**) Value of conversion degree is too high, hence this value was not used for the calculation of the apparent activation energy.
Table 3. TPSR experimental data and obtained values of activation energy.
SampleEthanol DosesCompound Evolved μmol per 10 mgTemperature of TPSR Peak Maximum-Tmax, K
β Values in K·min−1
EA
kJ·mol−1
-μmol per 10 mgEthanol *Ethyleneβ = 2.5β = 5β = 10β = 15
MFI-3011.500.001.48473.0483.0494.5501.5116 ± 3
913.477.675.13481.0491.0504.0510.0115 ± 4
CHA-7.511.500.001.46443.0452.0461.5467.0121 ± 1
34.490.134.36445.0456.0466.0472.0109 ± 3
68.980.617.59450.0461.0472.5478.0105 ± 3
913.472.1510.04452.5463.0474.5481.0105 ± 1
CHA-1411.500.001.47454.5465.0475.5483.0108 ± 2
34.490.443.28457.0468.0479.5487.0102 ± 2
68.982.485.08459.0469.5482.5489.0102 ± 3
913.475.035.84459.5471.5482.5490.5102 ± 2
(*) ethanol evolved during the temperature program, “missing” ethanol was evolved during dosing procedure.
Publisher’s Note: MDPI stays neutral with regard to jurisdictional claims in published maps and institutional affiliations.

