Article

Design and Microwave-Assisted Synthesis of TiO2-Lanthanides Systems and Evaluation of Photocatalytic Activity under UV-LED Light Irradiation

by
Adam Kubiak
1,2,*,
Anna Grzegórska
3,
Joanna Zembrzuska
1,
Anna Zielińska-Jurek
3,
Katarzyna Siwińska-Ciesielczyk
2,
Marcin Janczarek
2,
Piotr Krawczyk
1 and
Teofil Jesionowski
2,*
1
Institute of Chemistry and Technical Electrochemistry, Faculty of Chemical Technology, Poznan University of Technology, Berdychowo 4, PL-60965 Poznan, Poland
2
Institute of Chemical Technology and Engineering, Faculty of Chemical Technology, Poznan University of Technology, Berdychowo 4, PL-60965 Poznan, Poland
3
Department of Process Engineering and Chemical Technology, Faculty of Chemistry, Gdansk University of Technology, Narutowicza 11/12, PL-80233 Gdansk, Poland
*
Authors to whom correspondence should be addressed.
Catalysts 2022, 12(1), 8; https://doi.org/10.3390/catal12010008
Submission received: 24 November 2021 / Revised: 13 December 2021 / Accepted: 15 December 2021 / Published: 23 December 2021
(This article belongs to the Section Photocatalysis)

Abstract

:
The TiO2-Eu and TiO2-La systems were successfully synthesized using the microwave method. Based on the results of X-ray diffraction analysis, it was found that regardless of the analyzed systems, two crystal structures were noted for the obtained samples: anatase and rutile. The analysis, such as XPS and EDS, proved that the doped lanthanum and europium nano-particles are present only on the TiO2 surface without disturbing the crystal lattice. In the synthesized systems, there were no significant changes in the bandgap energy. Moreover, all the obtained systems were characterized by high thermal stability. One of the key objectives of the work, and a scientific novelty, was the introduction of UV-LED lamps into the metronidazole photo-oxidation pathway. The results of the photo-oxidation study showed that the obtained TiO2 systems doped with selected lanthanides (Eu or La) show high efficiency in the removal of metronidazole, and at the same consuming nearly 10 times less electricity compared to conventional UV lamps (high-pressure mercury lamp). Liquid-chromatography mass-spectrometry (LC-MS) analysis of an intermediate solution showed the presence of fragments of the degraded molecule by m/z 114, 83, and 60, prompting the formulation of a plausible photodegradation pathway for metronidazole.

1. Introduction

Pharmaceuticals, particularly antibiotics, are a major group of emerging contaminants. The high consumption of antibiotics and the fact that about 30–90% of all antibiotics ingested are excreted from the body unchanged or as active metabolites means that their occurrence in the environment cannot be easily controlled and eliminated [1,2]. Furthermore, most of these pharmaceuticals are not effectively removed in conventional wastewater treatment plants resulting in their release into various aquatic environments [3].
Metronidazole (MNZ) is a commonly used antibiotic and antiprotozoal agent [4]. This compound has been widely detected in wastewater, surface water, and groundwater [5]. Gomez et al. [6] reported a high concentration of MNZ in hospital effluents, where it reached 500–9400 ng/dm3. Meanwhile, the concentration of MNZ detected in surface and wastewaters was in the range 1–10 ng/dm3 [7,8]. This medicine has a high solubility in water and low biodegradability; thus, it is prone to accumulation in aquatic systems [9]. The removal of metronidazole and its metabolites remains an important challenge due to their potential adverse effects on ecosystems and human health. As an outcome, they may impose mutagenic, carcinogenic, and toxic effects [9].
One solution proposed for the removal of MNZ is adsorption [10]. Various adsorbents were used, such as activated carbon [11], chitosan [12], polymers [13] and copolymers [10], and metal-organic frameworks [14]. Adsorption is considered a simple and economical solution for wastewater purification [10]. However, the major disadvantage of this method is the separation and transferring of the contaminants without degradation [15]. Therefore, alternative treatment methods should be investigated. The literature describes a great potential for advanced oxidation processes [15,16]. Among them, photocatalysis has been widely used as an effective method for the degradation of non-biodegradable pharmaceuticals [17]. Special attention has been paid to titanium dioxide, which is a non-expensive, non-toxic, highly available, and stable photocatalyst [18]. However, the main limitations of its usage, including activity only under UV light, particles agglomeration, and fast recombination of photogenerated charge carriers, necessitate further modification of this material [19].
On the one hand, recent trends in photocatalysis include the degradation of various groups of environmental pollutants, such as heavy metals, pesticides, herbicides, dyes, phenols, and pharmaceuticals [20]. Many studies concern photocatalytic water splitting and reduction of CO2 [21]. The novel direction proposed by Yao et al. [22] is the application of Au/sheaf-like TiO2 mesocrystals for simultaneous degradation of ibuprofen with H2 evolution. The other way focuses on the modulation of physicochemical properties of the photocatalyst. It may be realized by doping, defect engineering, morphology design, and fabrication of heterojunctions [23,24,25,26]. Singh and Soni [27] proposed the preparation of CuO decorated defect enriched ZnO nanoflakes for the effective degradation of different dye pollutants. Liu et al. [28] applied oxygen-deficient SnO2 quantum dots for the removal of organic oil pollutants. Meanwhile, Goud et al. [20] confirmed the remarkable behavior of MoS2/Bi2O3 heterojunction towards crystal violet dye degradation and hydrogen production. Furthermore, the extensively studied direction in photocatalytic processes is a combination of photocatalysts with carbon materials such as graphene oxide, carbon quantum dots (CQD), or MXenes, to enhance charge carriers separation and promote visible light absorption. Ding et al. [29] utilized the CQD/Bi2O2CO3 for photocatalytic removal of toluene from the air. Grzegórska et al. [30] proposed the application of Fe-TiO2/Ti3C2 composite for the highly efficient degradation of the anti-epileptic drug carbamazepine.
The incorporation of rare-earth metals such as Sm, Er, Eu, La, Gd into TiO2 has been proposed to reduce the bandgap by shifting the working wavelength to the visible region [31]. Doping of lanthanides into TiO2 structure may act as an electron trap and thus reduce the electron-hole recombination as well as promote the chemical adsorption of the organic pollutants on the photocatalyst surfaces. Huo et al. [32] proposed the modification of TiO2 with 1.25 mol% of lanthanum. The interaction between the La-dopants and the TiO2 might facilitate the adsorption of pollutant molecules and UV lights and inhibit the recombination between photoelectrons and holes. Khade et al. [33] concluded that incorporation of europium into TiO2 caused an increase of methyl orange degradation compared with pure TiO2 due to the higher absorption and 4f electron transition of rare-earth ions. Shi et al. [34] described that modification of co-doped TiO2 with La3+ and Eu3+ led to improved photocatalytic activity as a result of better separation of electron-hole pairs.
In this research, Eu- and La-modified TiO2 were, for the first time, applied to photocatalytic degradation of metronidazole, a nitroimidazole antibiotic, non-susceptible to biodegradation. The optimal content of lanthanides dopant (0.25 wt.%–1.5 wt.%) introduced to the system via microwave technique was evaluated. The novelty of this work was the application of UV-LED lamps into the metronidazole photo-oxidation pathway. The transformation products and degradation intermediates of metronidazole were proposed based on the LC-MS analysis. Finally, the electricity consumption of UV Hg high-pressure and UV-LED systems was compared to evaluate the cost-efficiency of the processes applied in this research.

2. Results

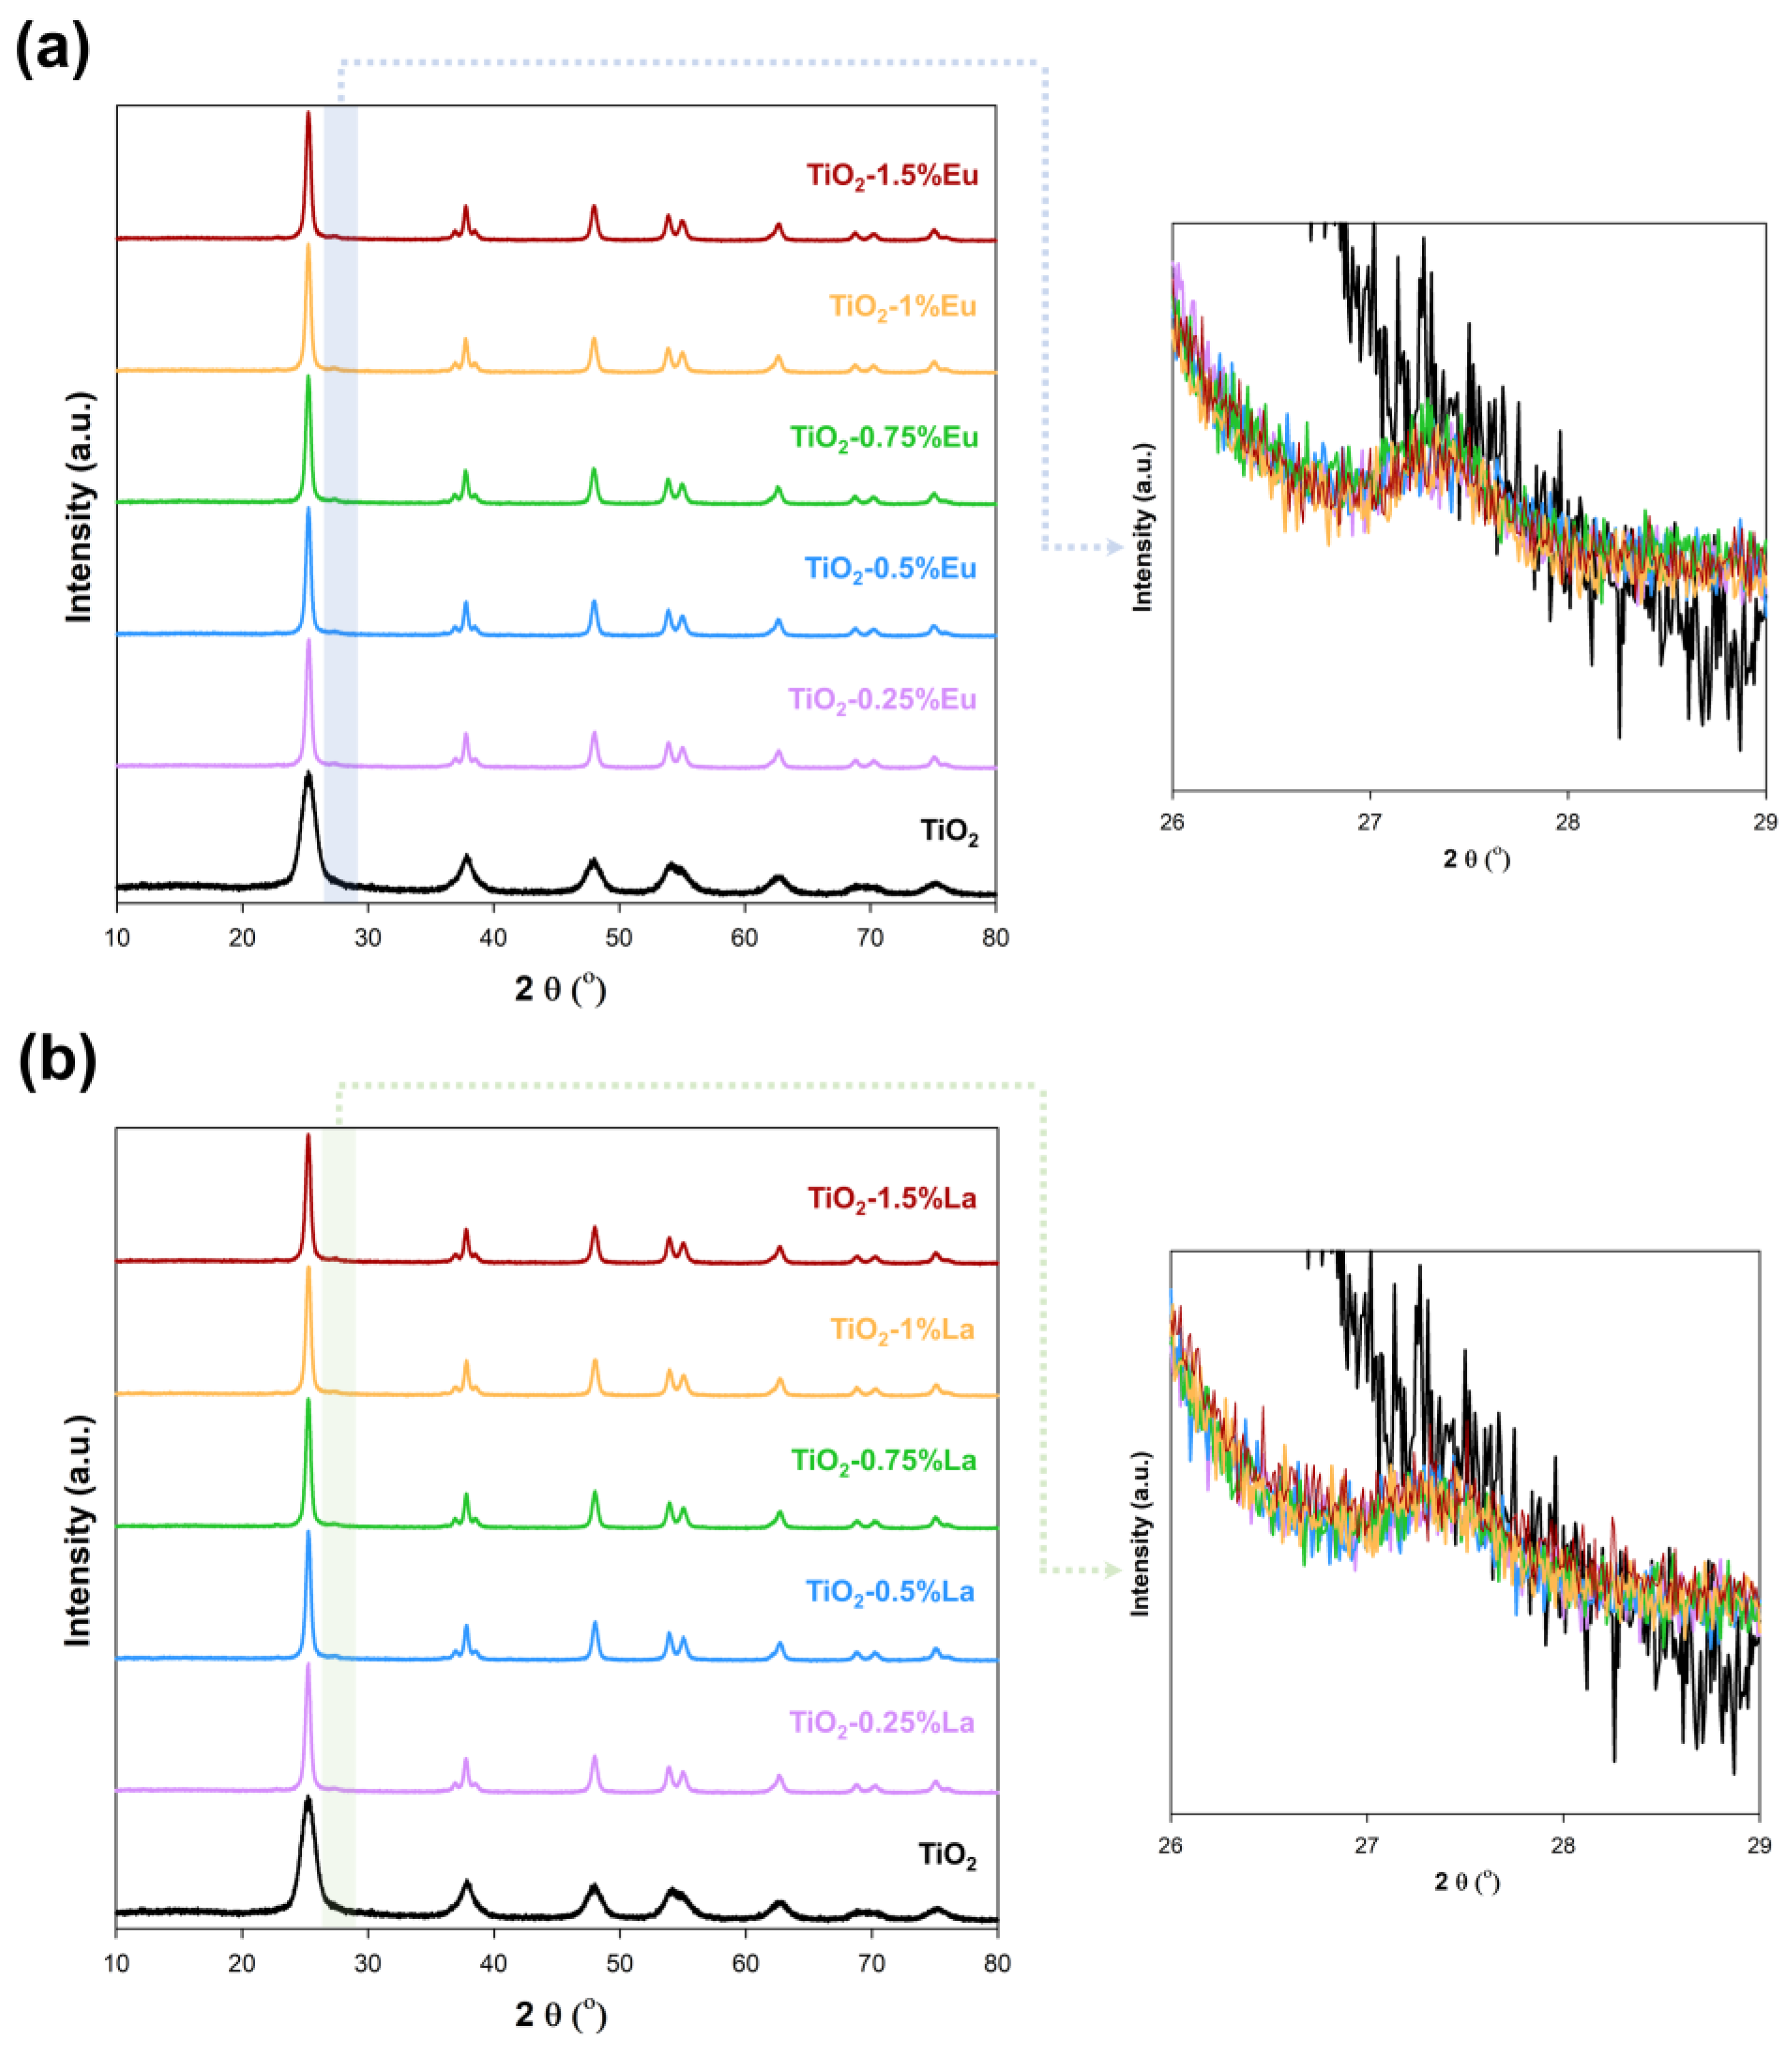
2.1. Crystal Structure

First, a comprehensive physicochemical analysis was carried out for the crystallographic characterization using XRD analysis. Figure 1 presents X-ray diffraction graphs for the TiO2-europium and TiO2-lanthanum systems.
In the beginning, the reference TiO2 sample was subjected to X-ray analysis, which in the next stages was a scaffold for the microwave inclusion of lanthanides into the system. The mentioned material had the anatase (crystallographic database card no. 9009086) crystalline structure (space group I41/amd, no. 141) was observed Additionally, it was noted that in the titania sample occurred the crystalline planes such as (101), (103), (004), (200), (105), (211), (204), (116), (220), and (215).
Regardless of the analyzed system, modification with europium or lanthanum, two crystal structures were noted for the obtained samples, anatase and rutile (space group P42/mnm, no. 136). The absence of characteristic peaks from europium and lanthanum on the XRD patterns may indicate that the dopants particles have high dispersion on the TiO2 surface. This phenomenon was noted and described by Tahir et al. [35], as well as Huang et al. [36]. However, the presence of rutile in the synthesized systems is puzzling, in particular, taking into account previous literature reports [37,38]. Nevertheless, to exclude the influence of microwave radiation on the transformation of anatase to rutile, XRD analysis was performed on a reference TiO2 subjected to multiple microwave treatments (Figure 2).
Based on obtained results, it was shown that, regardless of the subsequent microwave treatments to which the TiO2 sample was subjected, it had an anatase crystal structure. The only changes observed were related to a decrease in FWHM, which indicates an increase in the size of the crystallites, which confirms previous literature reports and excludes the influence of microwave reprocessing as the reason for the presence of rutile in the analyzed materials [38,39]. Therefore, to determine the obtained crystal structures, the average crystalline size, and the lattice parameters for the synthesized TiO2-Eu and TiO2-La, systems were determined (Table 1 and Table 2).
Based on the obtained crystallographic parameters, it was confirmed that subjecting crystalline TiO2 to microwave-assisted incorporation of europium or lanthanum increased the average size of anatase crystallites from 8 nm to about 16–17 nm for reference sample and systems, respectively. However, it should be noted that the increase in the amount of the dopants inhibited the anatase re-crystallization process, which can be observed, for example, in materials containing the highest and the lowest amounts of europium/lanthanum. In both cases, a decrease in the size of the anatase phase crystallites from about 17 nm for TiO2 containing 0.25% dopants to 15.9 nm for TiO2-1.5%Eu and 16.5 nm for TiO2-1.5%La was noted. Further differences between the materials TiO2-Eu and TiO2-La were observed, in particular in the parameters of the rutile phase. First, it has been noted that the amount of rutile phase is related to the amount of dopant in the synthesized system. However, it depends not only on the amount (weight percentage) of the admixture but also on its type, either europium or lanthanum. For the TiO2-Eu samples, a higher percentage of the rutile phase (max. 4.1%) was recorded compared to the TiO2-La systems (max. 2.5%). Additionally, it was observed that a rutile phase with higher crystallinity was formed in TiO2-Eu systems.
Comparing the obtained results with the available scientific literature confirmed that the phenomenon of inhibition of anatase crystallization by lanthanides is widely known. Similar observations were presented by Huang et al., who for the reference material TiO2 obtained a crystallite size of 16.2 nm, while for TiO2-0.4%Eu, 9 nm. However, considering that most of the work on the doping of TiO2 with lanthanum and europium focuses on sol-gel synthesis or other processes using additional high-temperature thermal treatment, it is difficult to compare the obtained crystal structures. The main difficulty is the microwave assistance used in our work, which, unlike conventional heating, affects the nucleation process and the growth of single crystals, and also affects the sequential processes, thus effectively interacting with each of the synthesis intermediates. The use of the novel microwave technique may be one of the reasons for possible interactions of the dopants used (lanthanum/europium) with the crystalline anatase, which could lead to partial phase transformation. Despite a large mismatch in ionic radius between dopants (La3+, Eu3+) as well as titania (Ti4+), it should be noted that among the dopants used, europium was characterized by a lower ionic radius (0.095 nm) compared to lanthanum (0.11 nm); therefore, it could be favored for interaction with the structure of TiO2, which resulted in a higher content of the rutile crystal phase for TiO2-Eu systems. However, it should also be mentioned that the differentiation of ionic rays causes difficulties introducing the Eu3+ and La3+ atoms into the TiO2 unit cell, which is observed in the determined parameters of the crystal lattice, which are similar to the literature data for anatase and rutile. Therefore, it can be inferred that most Eu3+ and La3+ ions are dispersed on the surface of TiO2, which is consistent with the XRD results.

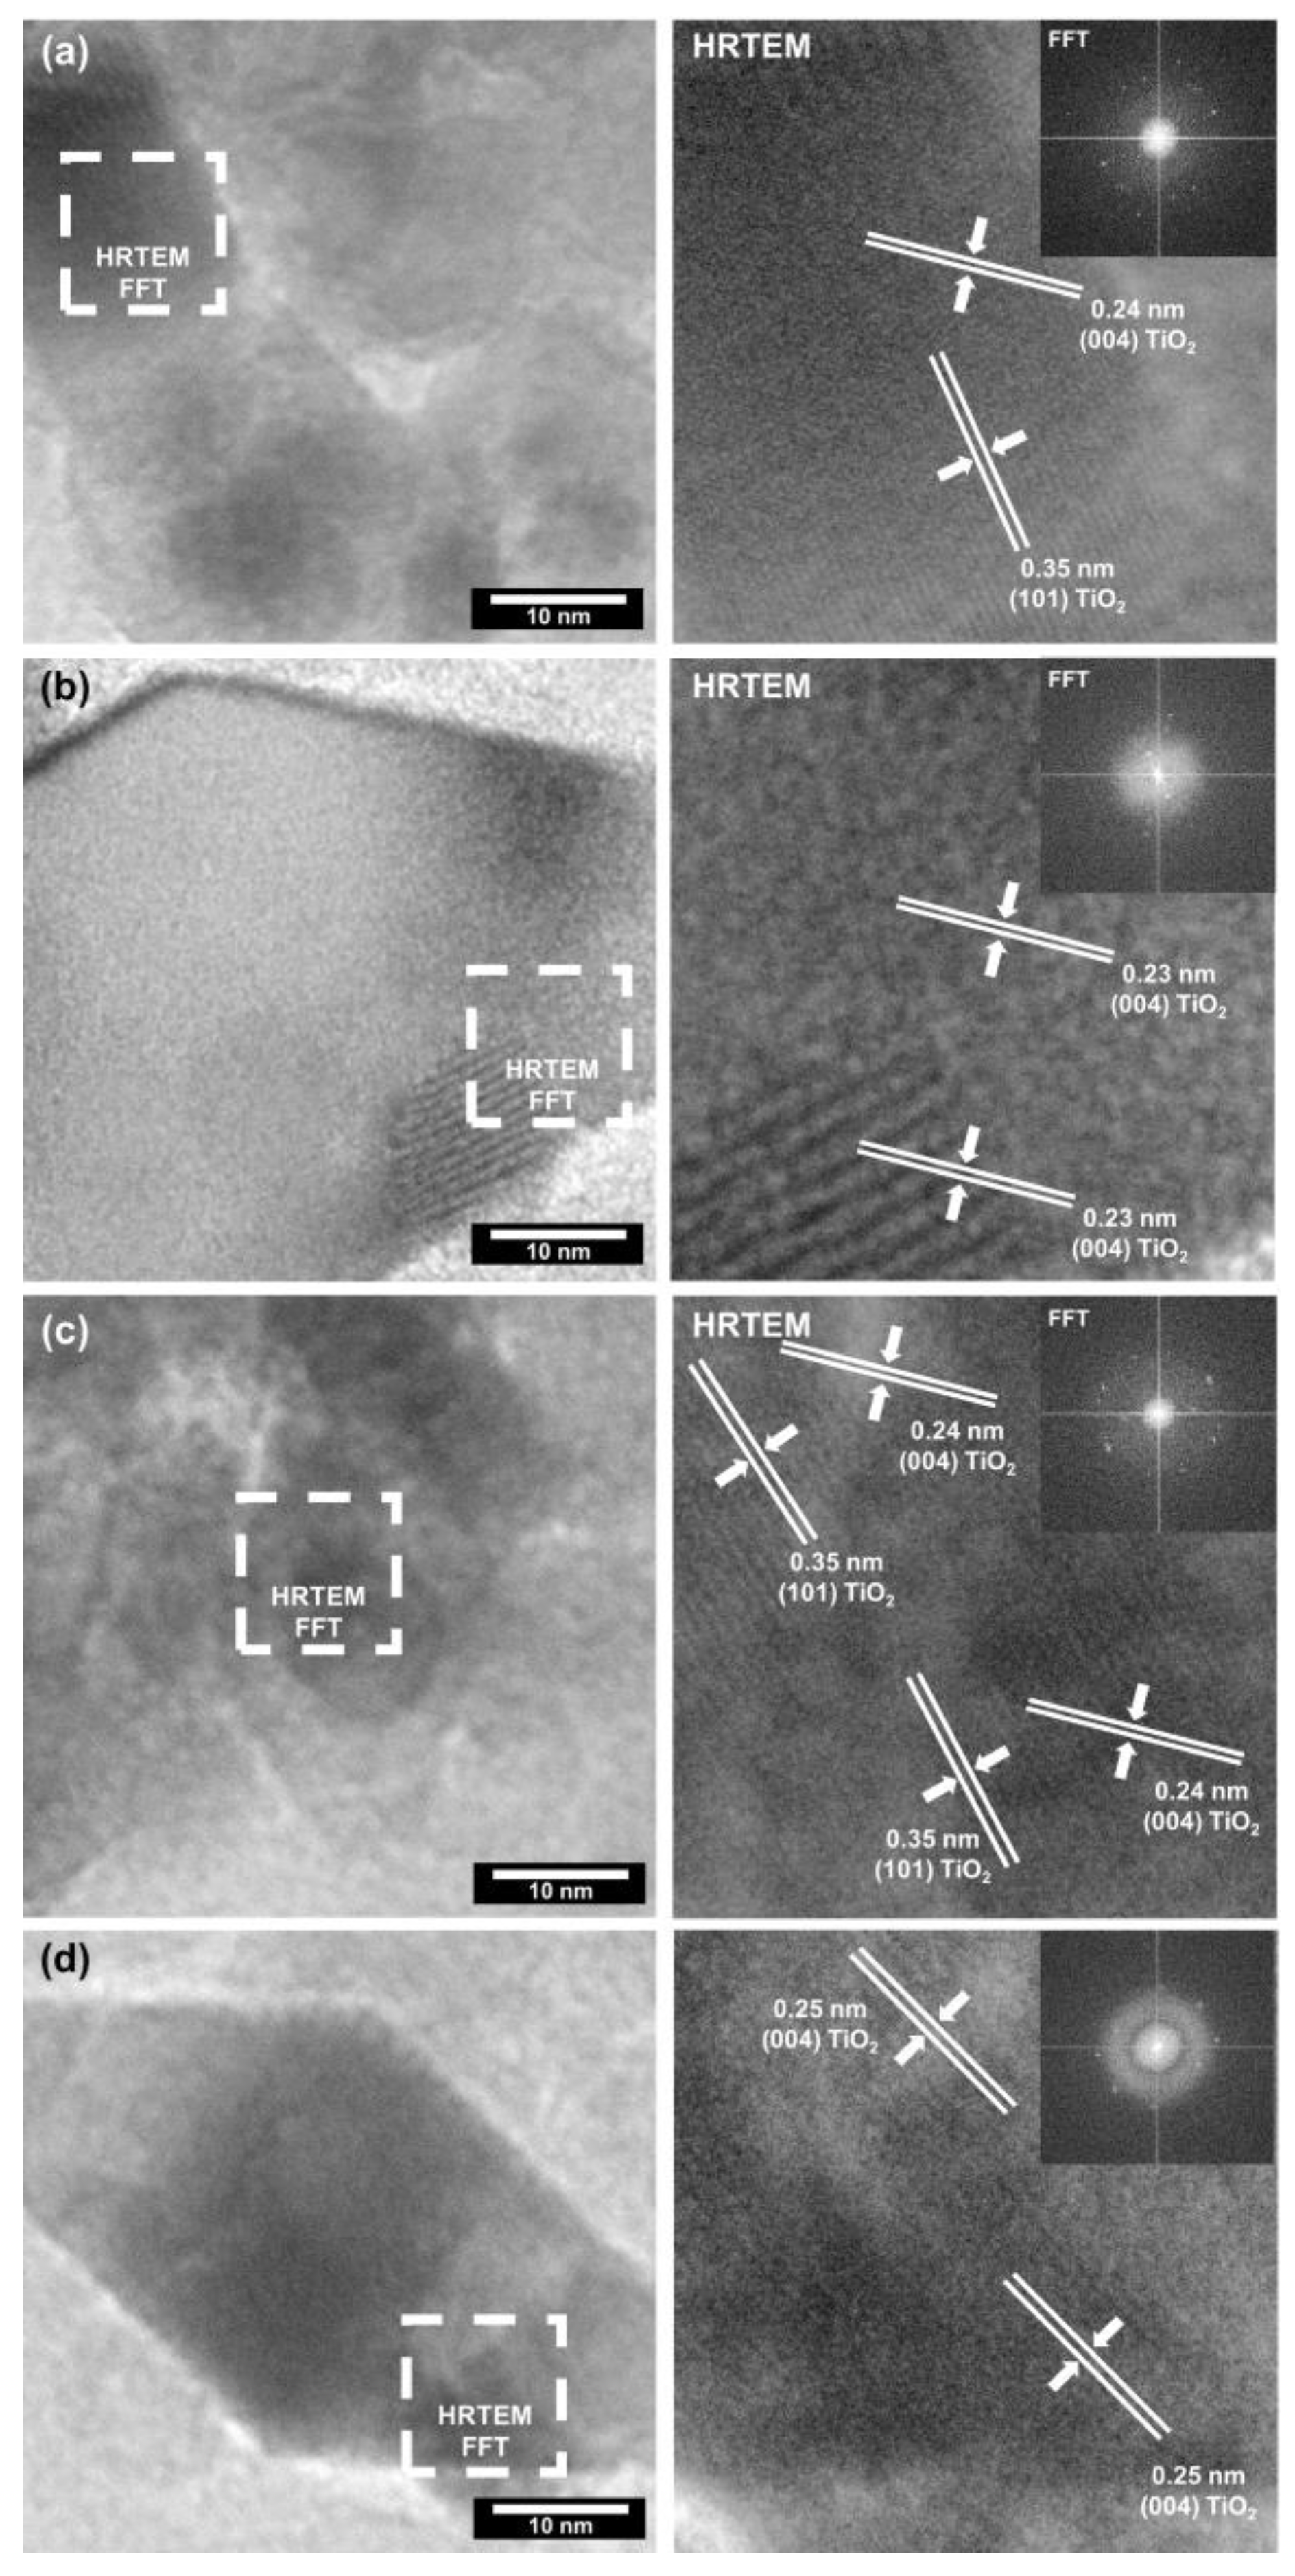
2.2. High-Resolution Transmission Electron Microscopy (HR-TEM)

To confirm the high crystallinity of the obtained TiO2-Eu and TiO2-La materials, the selected materials (containing the lowest and the highest dopant content) were subjected to HRTEM analysis. The images obtained are summarized in Figure 3.
Based on the presented results, the high crystallinity of the analyzed samples was confirmed due to observed crystallographic spacing. Moreover, the selected TiO2-Eu or TiO2-La materials were found to have spacing characteristics for a plane (101) [40,41] and (004) [42] of anatase. In addition, high-resolution images show spherical nano-particles with a diameter of about 5 nm. This size does not correspond to the crystallite size of any of the observed phases (for anatase, the crystallite size was about 17 nm, while for rutile, it was about 18 nm); hence, it can be assumed that these particles are derived from the lanthanides dopants europium or lanthanum. This is confirmed in the available scientific literature, where the crystallographic spacing that could be attributed to Eu or La was not observed, but single nano-particles were shown [43,44].

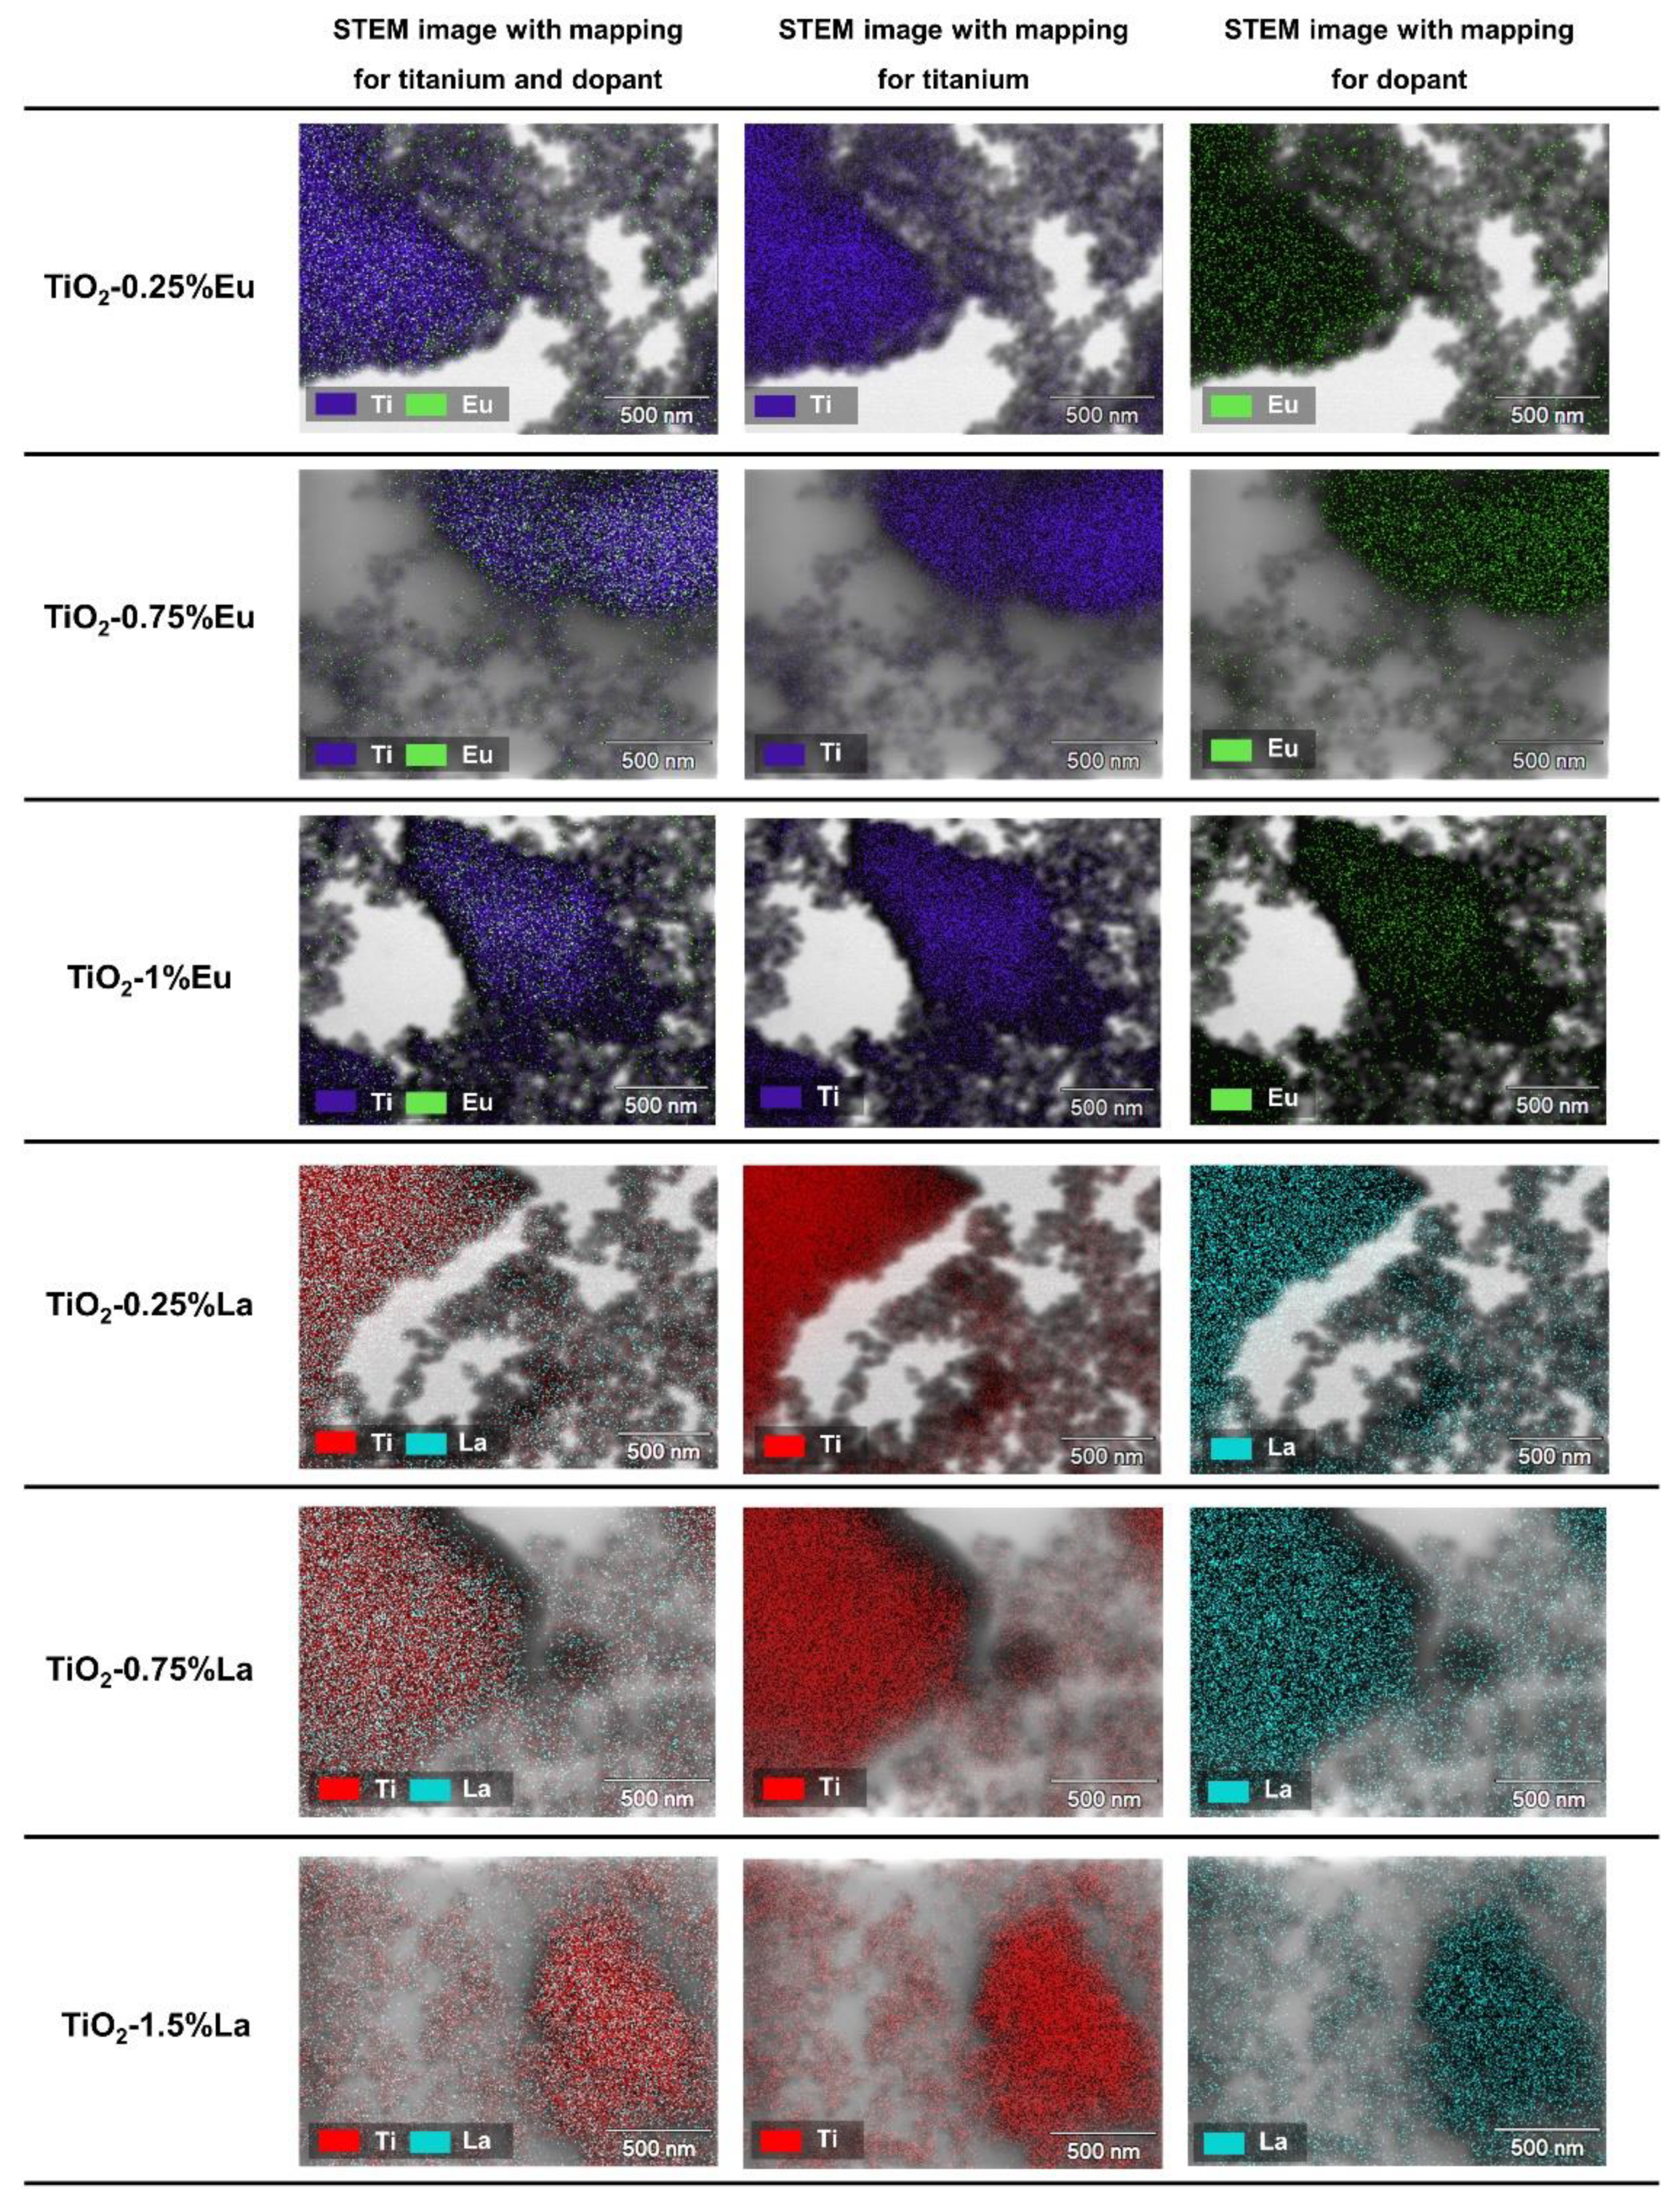
2.3. X-ray Photoelectron Spectroscopy

Considering the results of the XRD analysis and the possible effects of the admixtures used on the structure of TiO2, the XPS analysis was carried out in the next step to determine the chemical states of the selected materials (TiO2, TiO2-0.5%Eu, and TiO2-1.5%Eu). The XPS was performed for samples doped with Eu due to the higher content of the rutile phase in these materials, as well as the smaller ion radius of europium so that it could have easier incorporation into the TiO2 crystal structure. The obtained XPS spectra are presented in Figure 4.
Based on the presented XPS spectra, it was found that the Ti 2p region at the TiO2-Eu systems (see Figure 4a) observed two characteristic peaks associated with Ti 2p3/2 and Ti 2p1/2 of Ti4+ ions in oxide lattice occurred at 459.6 eV and 465.2 eV, respectively [45]. As shown in Figure 4b, the spectrum of O 1s in analyzed samples reveals 2 peaks centered at 530.5 eV and 532.3 eV, which belong to lattice oxygen (O2) and hydroxyl group (–OH) on the surface of the oxide materials, respectively [46]. Figure 4c shows the spectra of Eu 3d for TiO2-0.5%Eu and TiO2-1.5%Eu samples, which contain 4 distinct peaks [36]. The peaks at 1135.7 eV (Eu 3d5/2) and 1165.3 eV (Eu 3d3/2) are associated with the presence of Eu3+ or europium oxide (Eu2O3), whereas the other two peaks at around 1125.8 eV (Eu 3d5/2) and 1154.8 eV (Eu 3d3/2) could be ascribed to Eu2+ oxidation state, which may be related to the photoreduction of Eu3+ to Eu2+ during the XPS measurements [47]. However, the no visible shifts in the XPS spectrum in the Ti 2p region indicate that the dopant (Eu) is not introduced to the titanium dioxide lattice, and the doped processes only take place on the surface. Additional confirmation is the decrease of intensity of the peaks, which is the natural consequence of the presence of additional dopant particles on the TiO2 surface. The positions of the O 1s peaks are shifting from 530.7 eV to 531.3 eV and 532.7 eV to 533.3 eV for lattice O and –OH groups, which may be due to the changes in the electron cloud density and the surrounding chemical environment, resulting in the changes of the electron binding energy [48,49,50]. In addition, a decrease in the intensity of the peak derived from hydroxyl groups is observed, which can be related to the incorporation of lanthanide compounds on the surface.

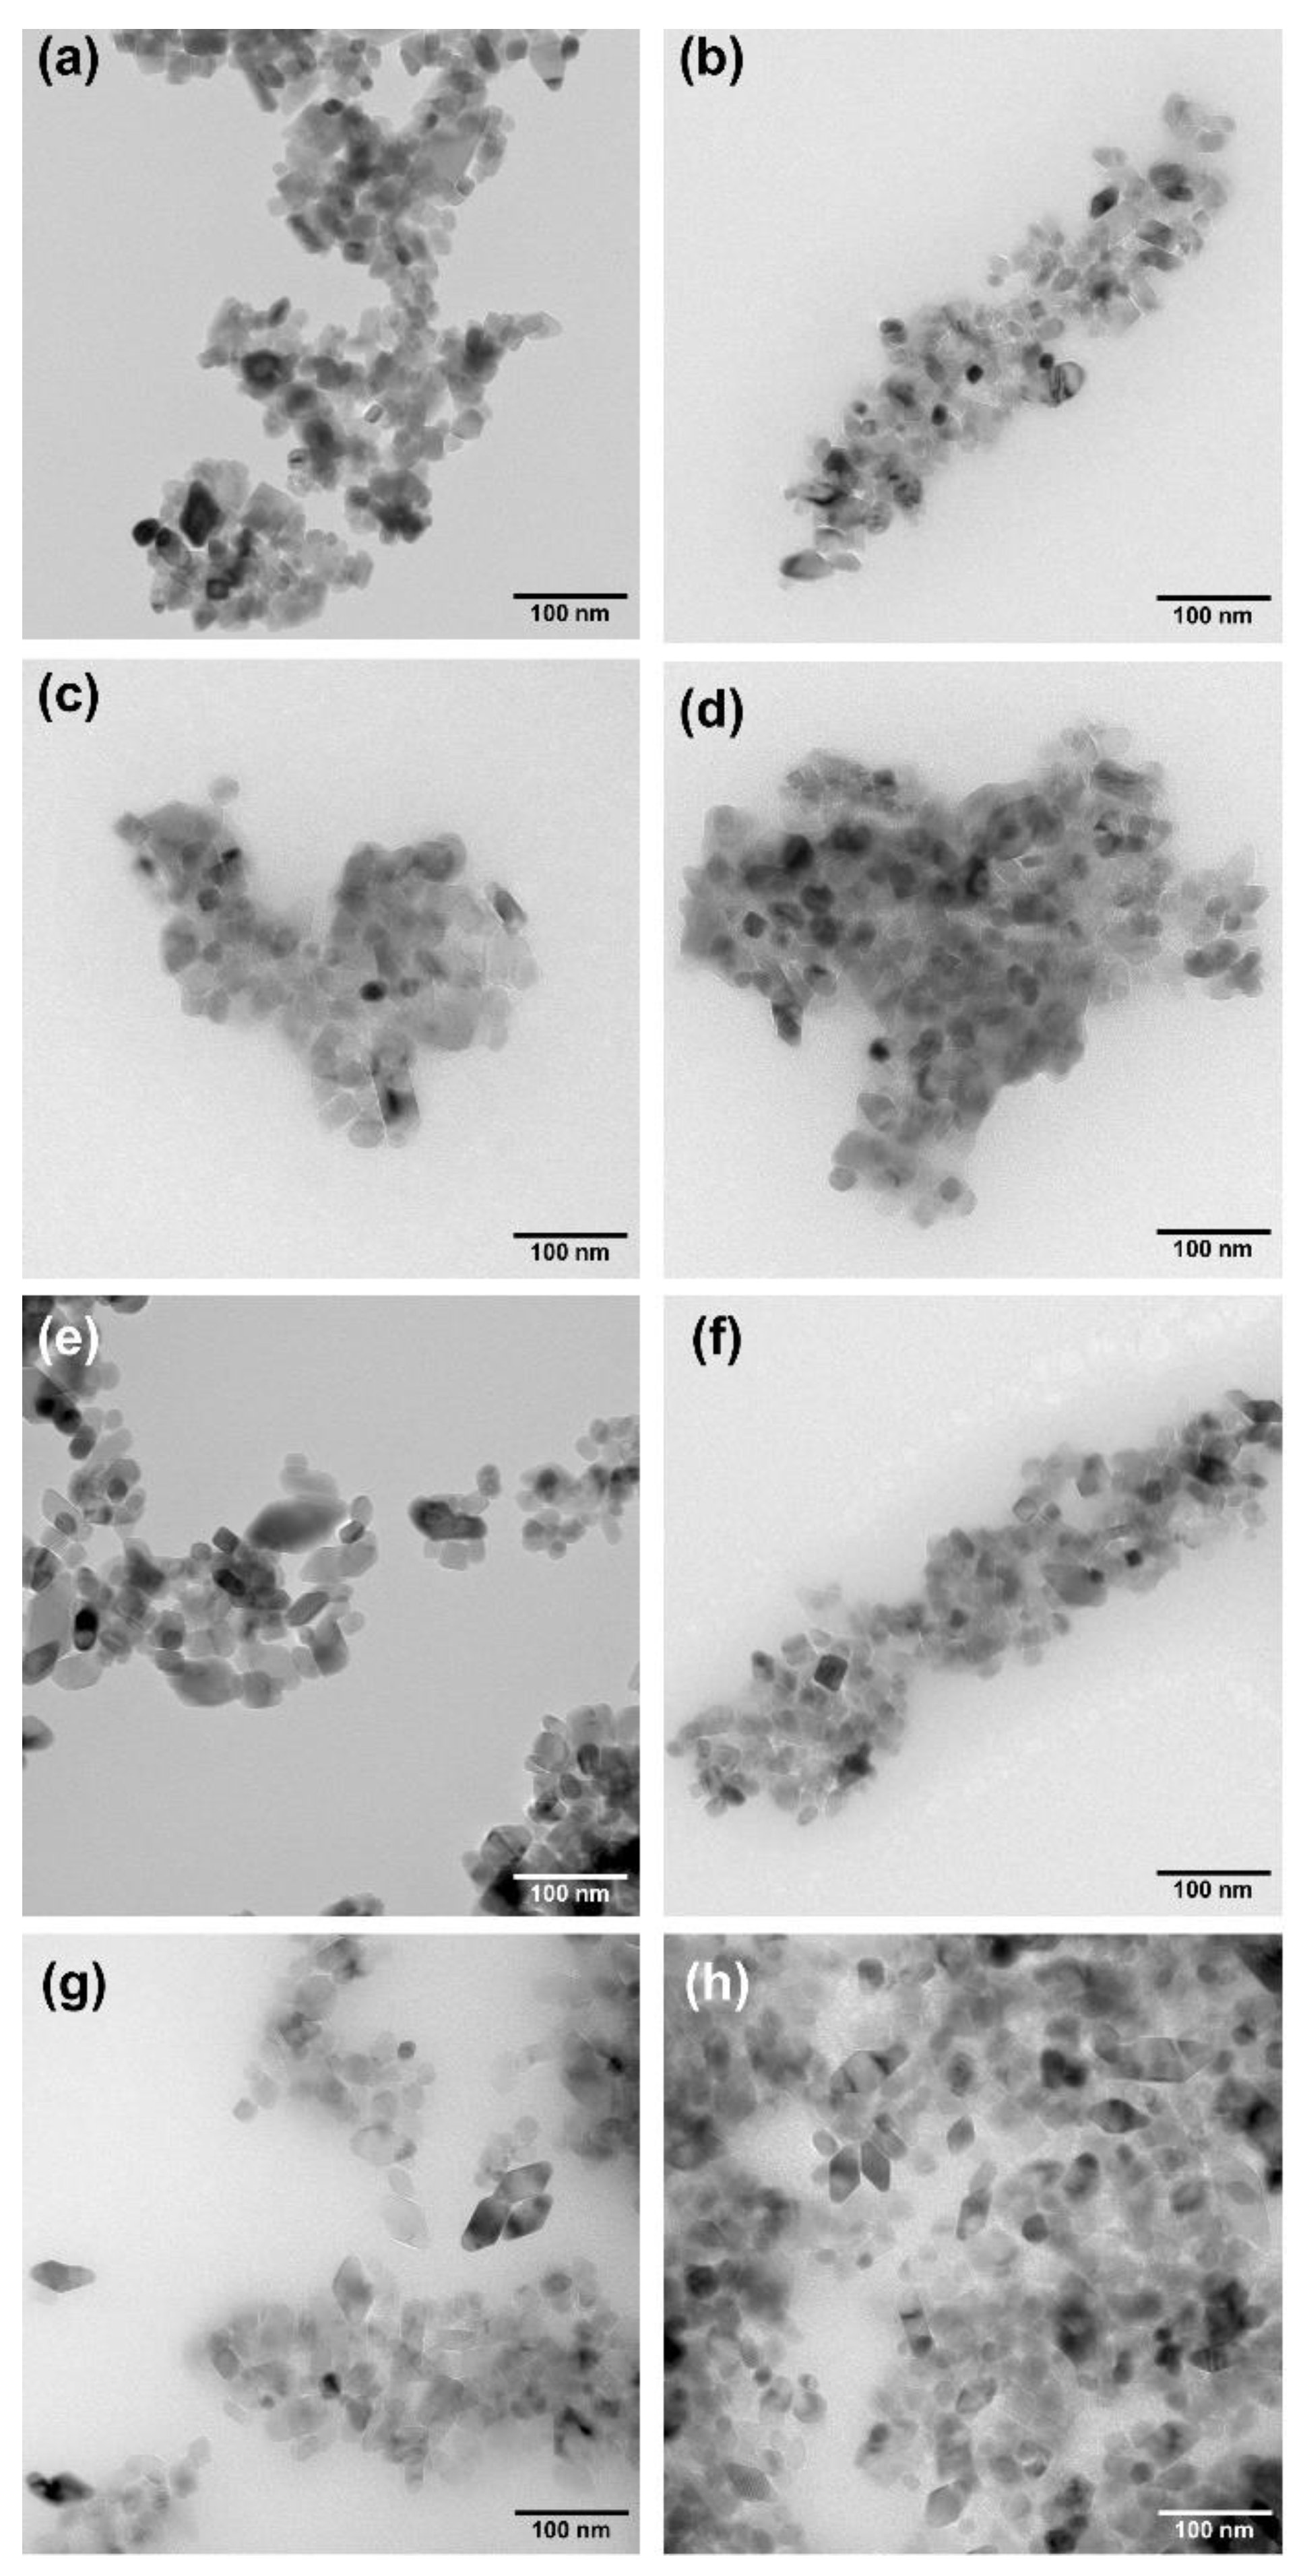
2.4. Morphology and Surface Properties

To determine one of the crucial parameters of the oxide materials, i.e., the morphology and thus the size and distribution of particles for the TiO2-Eu and TiO2-La systems, transmission electron microscopy was carried out. However, to characterize the doped systems in the first stage, the reference material (titanium dioxide) was subjected to SEM and TEM analysis (Figure 5).
Based on the SEM and TEM images, for reference TiO2 sample (Figure 5a,b), shows the presence of nano-particles of various, e.g., spherical (approx. 10 nm), as well as cubic (approx. 10 nm) shapes. The differentiation of TiO2 morphology results largely from the characteristics of the microwave radiation used in the synthesis. The high kinetics of the microwave crystallization process, on the one hand, leads to the formation of nano-sized particles, but on the other hand, it makes it difficult to control obtaining one defined structure. This is in line with the results we presented earlier [39]. However, the additional value of the TiO2 synthesis technique presented by us based on microwave in-situ crystallization is the control of the particle size and the formation of nano-particles with a low size distribution (<100 nm).
For the TiO2-Eu or TiO2-La systems, as for the reference sample, the particles in nano-size were observed. However, for two-component systems, several groups of nano-particles were observed (Figure 6). First, particles that were approximately equal to the crystallite size calculated from Scherrer’s equation were observed. Furthermore, particles that were larger-sized than their crystallite ones were noted and are attributed to the reunion of nano-sized crystallite, as described by Liqiang et al. [51]. In addition, the TEM images show the high distribution of dopants (Eu- or La-doped) in the bright and dark parts of TiO2, confirmed by the presence of electronic black spots [36,52]. Moreover, in the case of doped systems, aggregation into larger structures is mainly observed. In the aforementioned structures, TiO2 nano-particles are covered with a shell that causes the growth of particle agglomeration. The mentioned effect was observed for all materials, regardless of the amount and type of dopants, but it was not noted for the reference material TiO2 [53].
EDS mapping was performed to determine the distribution of lanthanum and europium particles on the surface of the base material (TiO2) for selected materials. The results of the above analysis are presented in Figure 7.
The distribution of lanthanum and europium was analyzed; attention should be paid to the difference between their location. Europium was observed mainly in larger aggregates of titanium dioxide, and its distribution throughout the material was confirmed for lanthanum. The observed differences result mainly from the type of dopants used because, inter alia, Huang et al. [54] noted that europium might be favored for interactions with hierarchical structures, which may explain its aggregation on the surface of TiO2 nano-particles agglomerates, while Siah et al. [55] carried out the doping of TiO2 with lanthanum, obtaining a homogeneous distribution of dopant ions on the surface of the oxide material.
Table 3 summarizes the weight percentage of elements (titanium, oxygen, and europium/lanthanum) in the synthesized TiO2-Eu and TiO2-La systems.
First, due to the EDXRF analysis, the presence of elements such as Ti, O, and Eu or La in the synthesized systems was proved. In addition, the analysis confirmed that the mass percentage of the used dopants was consistent with the assumed theoretical values of lanthanum and europium. This confirmed the correctness of the proposed method for the synthesis of TiO2-Eu and TiO2-La systems using the assumptions of the microwave technique.

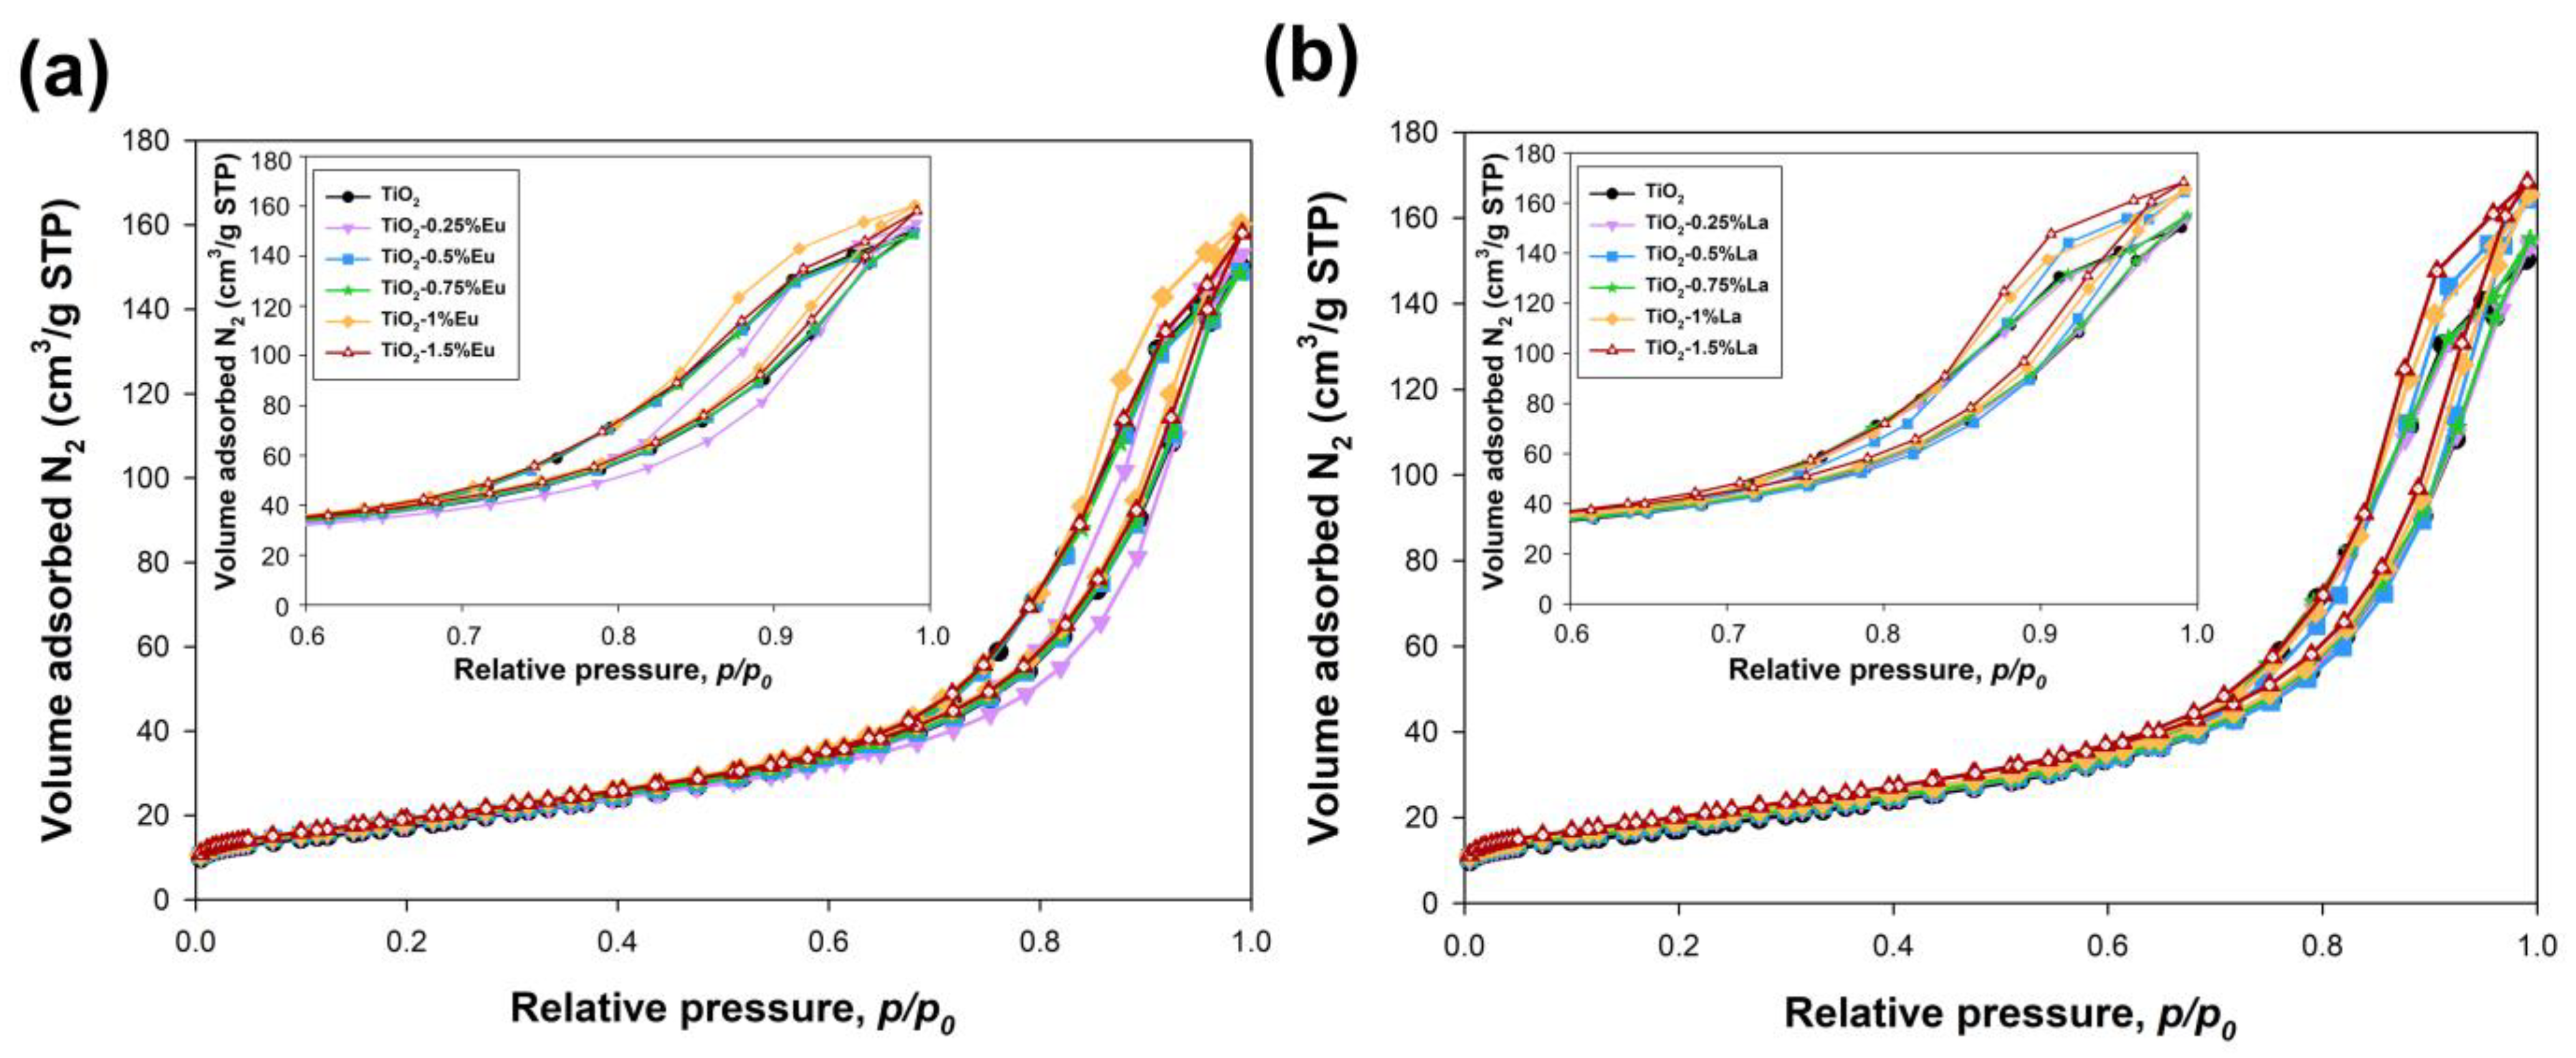
2.5. Parameters of the Porous Structure

One of the extremely important elements of the comprehensive characterization of the new materials is the characterization of their textural properties. For this purpose, low-temperature nitrogen sorption was used. The obtained N2 adsorption-desorption isotherms are presented in Figure 8, while the parameters of the porous structure are presented in Table 4.
Based on the nitrogen sorption isotherms, it was shown that all synthesized oxide materials, together with the reference sample, are characterized by the IV-type isotherm with the H1 hysteresis loop [56]. The H1 hysteresis loop indicates that the analyzed material consists of agglomerates or compacts of approximately uniform shape in a fairly regular array, and hence have narrow distributions of pore size [56]. Moreover, it should be noted that all synthesized materials were characterized by a similar range of the hysteresis loop amounting to p/p0—0.64–0.99, regardless of the type and amount of the dopants used.
When analyzing the obtained parameters of the porous structure for the synthesized materials, one should start by presenting the data for the reference sample. Microwave-formed TiO2 had a BET surface area of 63 m2/g and a volume and pore diameter of 0.24 cm3/g and 13.7 nm, respectively. For the systems doped with europium and lanthanum, a slight increase in the BET surface area (up to a maximum of 70–71 m2/g) and pore volume (0.26 cm3/g) was observed, while regardless of the type and amount of dopant, the formed systems were characterized by a lower pore diameter.
The increase in surface area and pore volume can be explained not only by the presence of an impurity (Eu or La) on the TiO2 surface, which may have changed the textural properties but also by a deterioration of the crystallinity of samples containing higher dopant contents. It is well known that the crystallinity of oxide materials is closely related to their surface area. Hence, the decrease in the size of crystallites observed on XRD patterns could lead to an increase in the BET surface area [57].

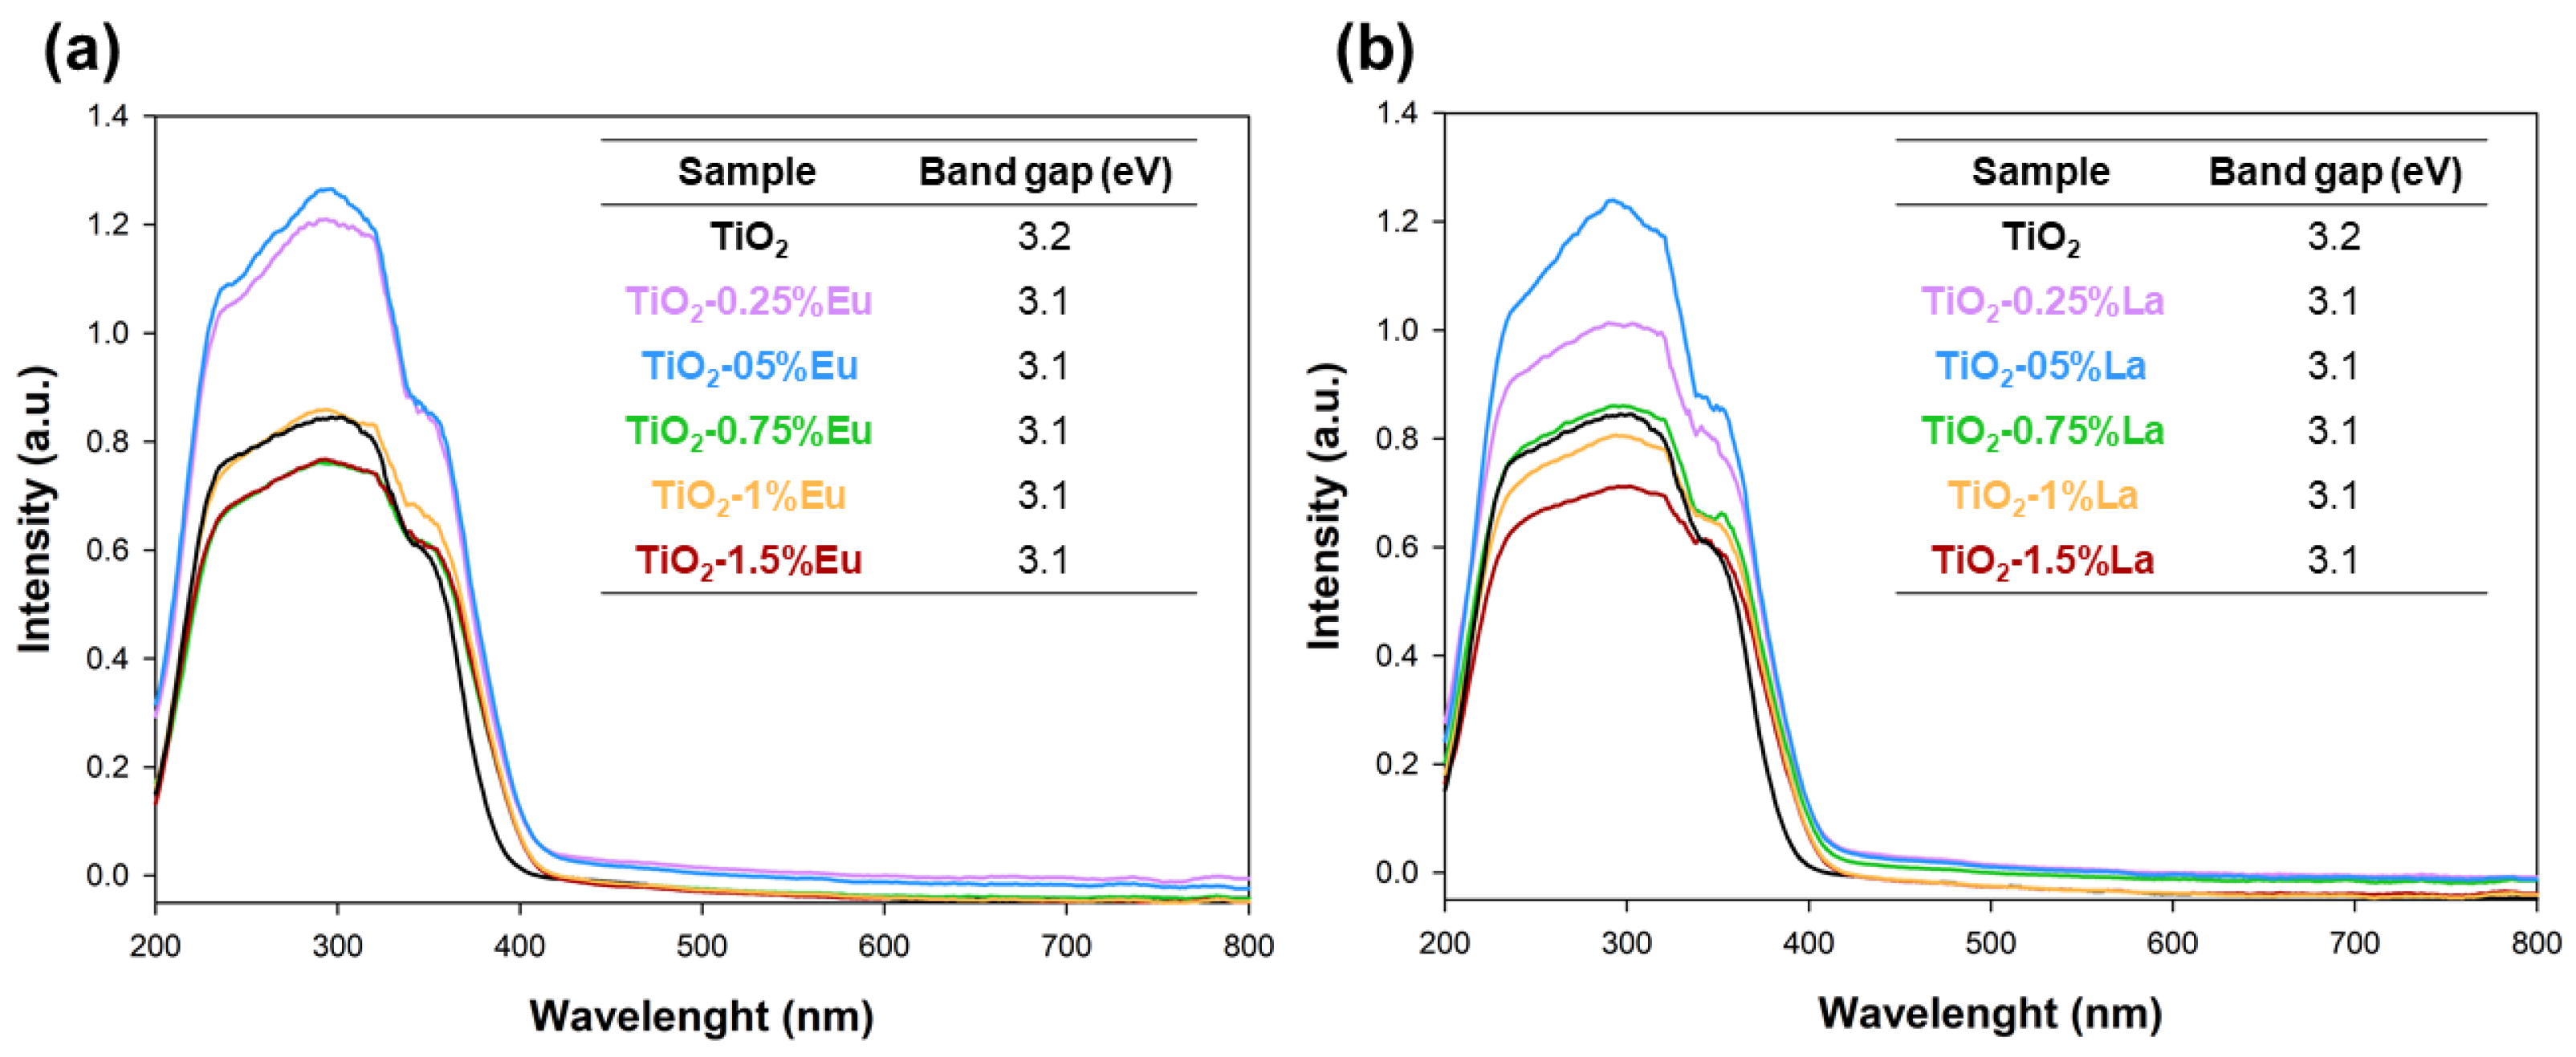
2.6. Optical Properties

The diffuse reflectance spectroscopy was carried out to determine the assessment of optical properties (including, inter alia, determination of the band gap energy). The obtained data was collected and shown in Figure 9.
When analyzing the absorption spectra for the TiO2-Eu and TiO2-La systems, it should be noted that all the mentioned samples had wide absorption band in the range 400–200 nm wavelength, which proves the absorption of ultraviolent radiation. However, attention should be paid to the shift of the absorption band of the doped materials relative to the reference sample. The absorption band for TiO2 flattens out at about 400 nm, while a shift to about 420 nm was observed for doped samples. This shift is mainly due to the presence of the rutile phase in the TiO2-Eu and TiO2-La materials, which was confirmed by the results of the XRD analysis. Additionally, changes in the intensity of the absorption band (200–400 nm) were observed, which was influenced by the amount of the dopants. The energy bandgap of the TiO2-Eu and TiO2-La systems was calculated using the Kubelka–Munk theory. It was found that the bandgap energy for the reference titanium dioxide was 3.2 eV, which is consistent with scientific knowledge [58]. Juan et al. [59] confirmed a slight decrease in the bandgap energy for Eu-doped systems. The authors indicated that this behavior might be associated with Eu impregnation [60] or the anatase phase transformation. Similar observations are presented in the scientific literature for lanthanum-doped materials [61,62].
However, based on the obtained data, the presence of the rutile phase should be indicated as the main reason for the reduction of the bandgap energy for the doped materials. According to the literature, rutile is characterized by the value of the bandgap of 3.0 eV; therefore, the partial anatase-rutile transformation shifted the absorption spectrum towards higher wavelength values, which directly translated into a decrease in the bandgap energy.

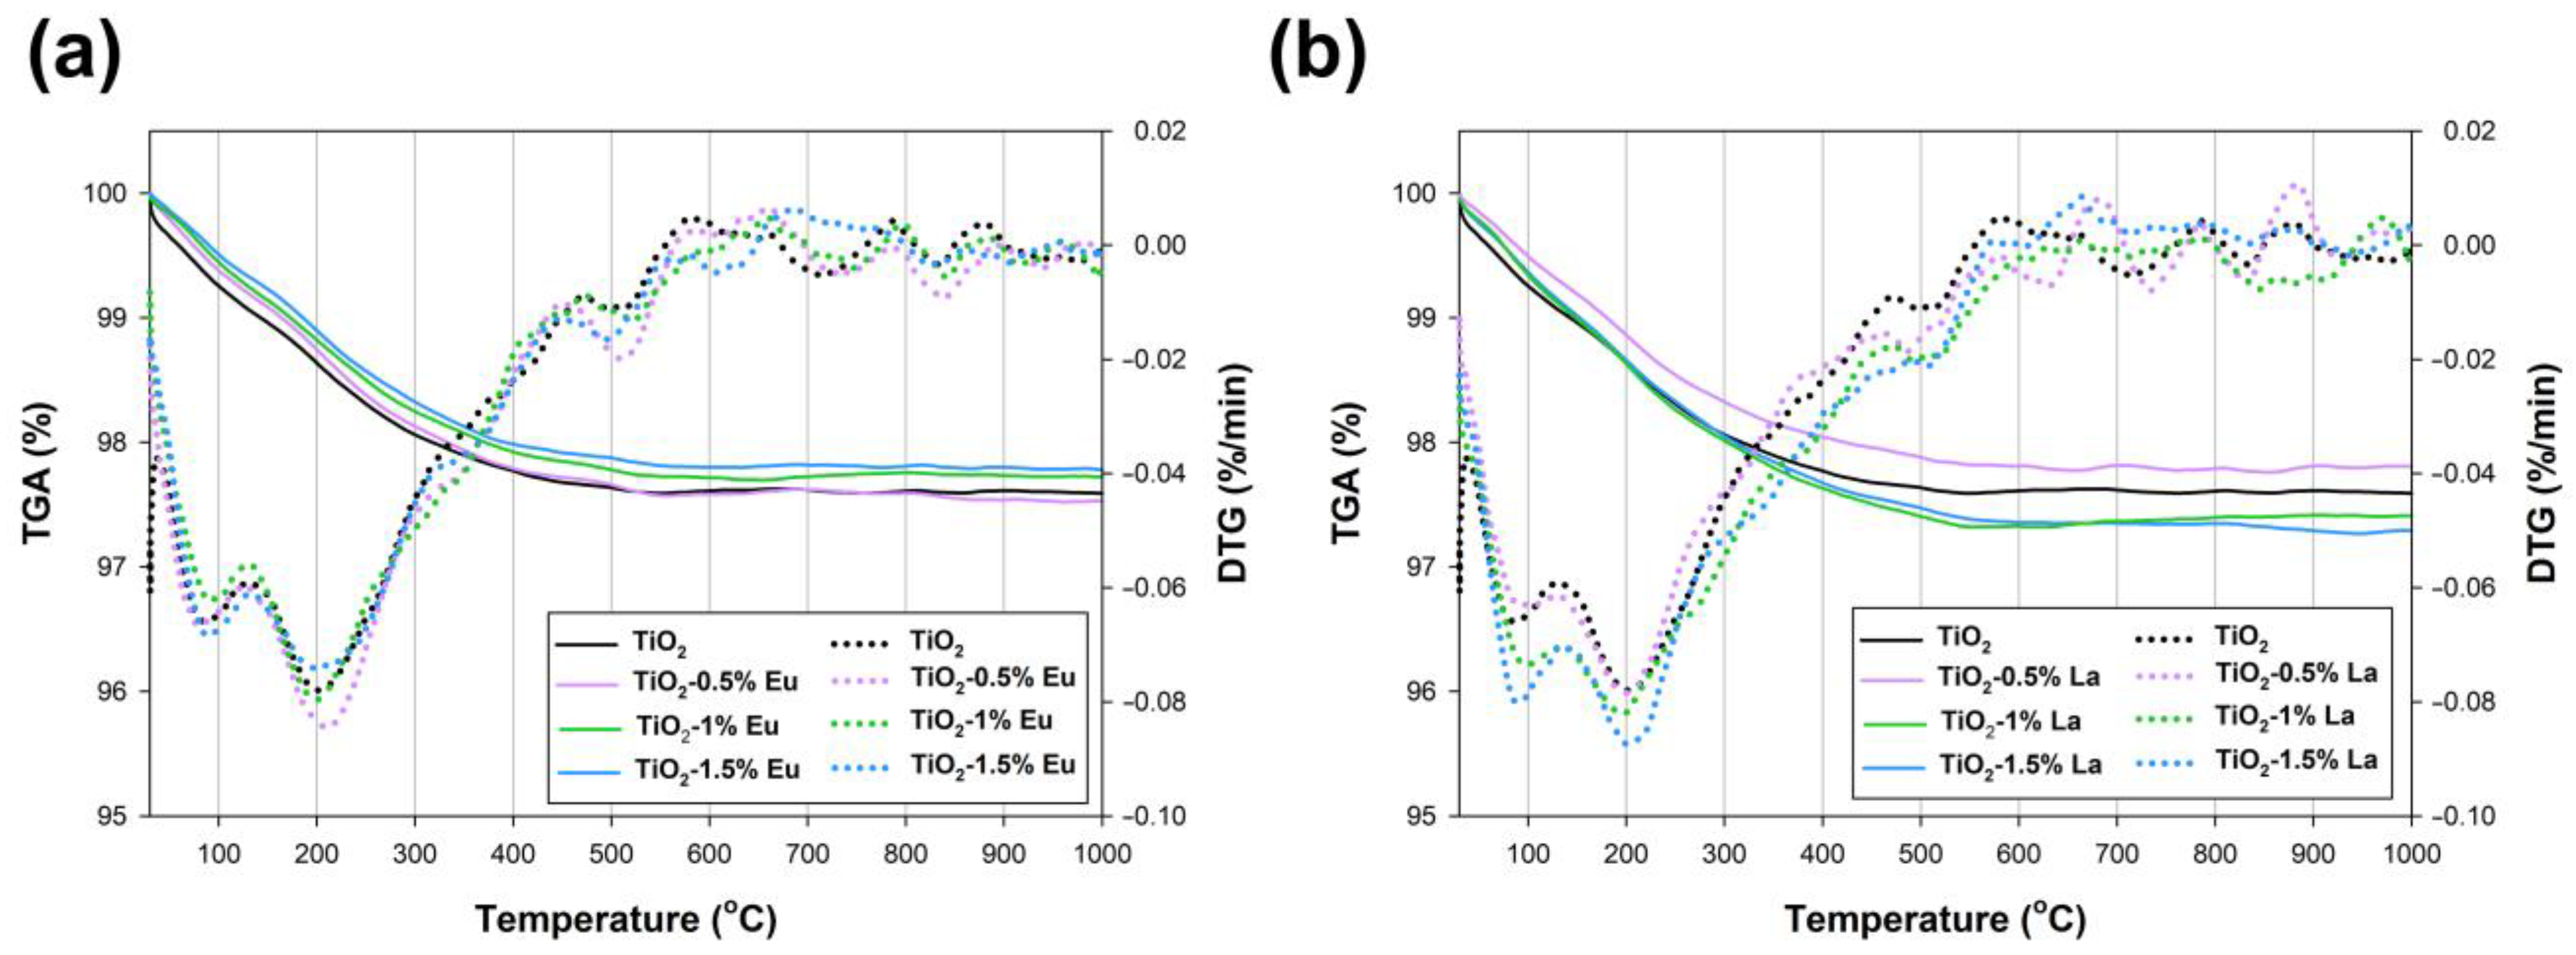
2.7. Thermal Stability

The next step in determining the physicochemical properties of the synthesized TiO2-Eu and TiO2-La systems was the evaluation of their thermal stability. Thermogravimetric analysis was performed for the selected materials. Figure 10 shows the results of the TGA/DTG analysis.
The thermogravimetric curves for selected samples presented in Figure 10 show that all of them are characterized by very good thermal stability in the temperature range of 0–1000 °C. For the samples doped with europium, a similar weight loss (about 4%) was observed, as in the case of the TiO2 reference sample, which shows that the europium doped of max. 1.5 wt.% did not significantly affect the thermal stability of the synthesized materials. In the case of mentioned samples, observed weight loss was related to the evaporation of physically as well as chemically bonded water occurred at 90 °C and 205 °C, respectively. For the materials doped with lanthanum, similar results were observed as for the TiO2-Eu samples, but in this case, the addition of lanthanum over 1 wt.% slightly deteriorated the thermal stability (loss of mass about 4.5%). However, the observed weight loss was related to only the removal of water, both surface (100 °C) and chemical (207 °C). For the TiO2-La samples, the same as for the TiO2-Eu materials, no transformation of anatase into rutile or other weight losses that could cause deterioration of thermal stability was observed. On this basis, it was confirmed that the materials doped with TiO2-Eu and TiO2-La are characterized by high thermal stability. However, the addition of lanthanides does not significantly affect the described properties.
The results presented in this work are consistent with the available scientific knowledge. Among others, Borlaf et al. [63] pointed out that doping with europium does not directly affect thermal stability but only the size of crystallites and particles. While for lanthanum, in the vast majority of studies, it was confirmed that the addition of lanthanum inhibits the conversion of anatase to rutile [64,65], this used larger admixtures (over 3 wt.%) than those described in our study; therefore, the described effect may not have been observed in the presented TGA results.

2.8. Photocatalytic Activity

The key study was to determine the photocatalytic activity of the obtained materials in the degradation of the pharmaceutical metronidazole using the new generation light sources, specifically, a UV-LED lamp. The results obtained during the photo-oxidation processes are presented in Figure 11.
Photo-oxidation tests started with the determination of the activity of the reference materials, TiO2-based material and commercial P25. In both cases, a high degradation efficiency of metronidazole was noted, which was about 94–95% after 180 min of irradiation. Regardless of the dopant used (europium or lanthanum) for the systems, an improvement in photoactivity was noted in comparison with the reference materials. For TiO2-Eu systems (Figure 11a,b), an improvement in photo-oxidation properties was confirmed for samples containing a maximum of 1 wt.% Eu, a further increase in the dopant content resulted in a decrease in the metronidazole removal efficiency. It is worth noting that for materials containing from 0.25 to 1 wt.% Eu, a similar degradation efficiency was noted, amounting to almost 99% after 180 min, while a satisfactory level (approx. 90% of removal) was achieved after less than 120 min. On the other hand, for the TiO2-1.5%Eu sample, the degradation efficiency was similar to that of the reference materials. For the TiO2-La systems, in contrast to Eu-doped systems, the influence of the amount of admixture on the observed efficiency of metronidazole removal was confirmed. The highest photodegradation efficiency (nearly 90% after 90 min) was obtained for materials containing 0.5 and 0.75 wt.% of lanthanum. On the other hand, for the remaining samples, satisfactory results were also obtained in the removal of the tested pharmaceutical; the degradation efficiency was 85%, 88%, and 90% after 120 min of irradiation, respectively, for TiO2-1.5%La, TiO2-1%La, and TiO2-0.25%La. The obtained results proved that the obtained TiO2-Eu and TiO2-La systems showed higher removal of the tested impurities which may result from a different photocatalytic mechanism and improved absorption of UV irradiation, due to the use of LEDs with a narrow emission spectrum.
Based on the available scientific literature, and bearing in mind the surface nature of TiO2 modification with selected lanthanides (Eu or La), the expected mechanism was indicated as a free radical reaction induced by UV light. For reference, titanium dioxide, as a result of excitation, photogenerated electrons (e) are formed in the CV bands, lead to the photo-reduction process, which generates reactive oxygen species, e.g., hydroxyl radicals [66]. On the other hand, holes (h+) in the VC bands lead to the oxidation process by reacting with adsorbed water or –OH gropus, resulting in the formation of *OH radicals [39].
However, for the doped materials, the dispersion of lanthanides nano-particles on the titanium dioxide surface is a crucial factor in the photo-oxidation of metronidazole [36]. According to the above-described mechanism for pure titania, due to photo excitation the catalyst is greater or equal to the bandgap of TiO2, electrons and holes are formed in its valance and conduction bands, respectively [67]. Without dopants (for our work europium and lanthanum), these e-h+ pairs recombine, and only some of them could participate in the photo-oxidation processes. When lanthanides are doped on the titania surface, they could capture e and prevent the recombination of photogenerated e and h+, resulting in improvement of photocatalytic performance [68,69].
Bearing in mind the constant changes in the climate, attention should also be paid to the impact of humans on the aquatic environment. With the development of medicine, more and more active pharmaceutical ingredients (APIs) appear in wastewater. Most medicines use consumed by human beings are metabolized and released into the environment in their metabolic form, there is a group of drugs that are excreted unchanged. Common examples of some widely used drugs are tetracycline, erythromycin, and metronidazole, etc. The presence of metronidazole in wastewater was confirmed by Wagil et al. [70], who determined the concentrations at level 136.2 ng/dm3, 12.0 ng/g, and 15 ng/g in water, sediment, and fish, respectively, in the Goscicina river in northern Poland. Moreover, it is also acknowledged that long-term exposure to this drug may cause cancer and mutagenesis because of the formation of reactive oxygen species inside the cell [71]. The available scientific literature points to several previously developed methods for the elimination of metronidazole such as adsorption [72] and membrane separation [73]; however, most of the scientific community focuses on photo-oxidation processes such as advanced oxidation processes (AOP) [74], photo-Fenton [75], or photocatalysis [76].
Table 5 shows the current state of knowledge in the field of photocatalytic degradation of metronidazole.
When analyzing the available scientific literature, several issues should be noted. First, in all the works cited, the lamps used were not only expensive but also harmful from an environmental point of view. It should be noted that the lighting time of mercury and xenon-containing UV lamps is definitely shorter than that of LED lamps, and there is also a difficult issue of their disposal, bearing in mind the presence of harmful elements. In addition, it is worth considering the energy consumption of the light source itself. During the photodegradation process using UV-LED lamps and for the contrast of a high-pressure mercury lamp, the electricity consumption was measured, shown in Table 6.
Based on the collected data, it was indicated that LED lamps use almost 10 times less energy than mercury lamps, and additionally, do not require active cooling, which is necessary for mercury and xenon lamps [84]. When analyzing the technology of wastewater treatment from pharmaceuticals, including metronidazole, attention should also be paid to the possibility of using visible sunlight, as reported by Ghribi et al. [76]. However, the implementation of sunlight in sewage treatment systems seems limited due to the high cost and large area needed for installation. Therefore, it seems that LED lamps can be a breakthrough in the use of UV light in the degradation of non-metabolized pharmaceuticals, including metronidazole.

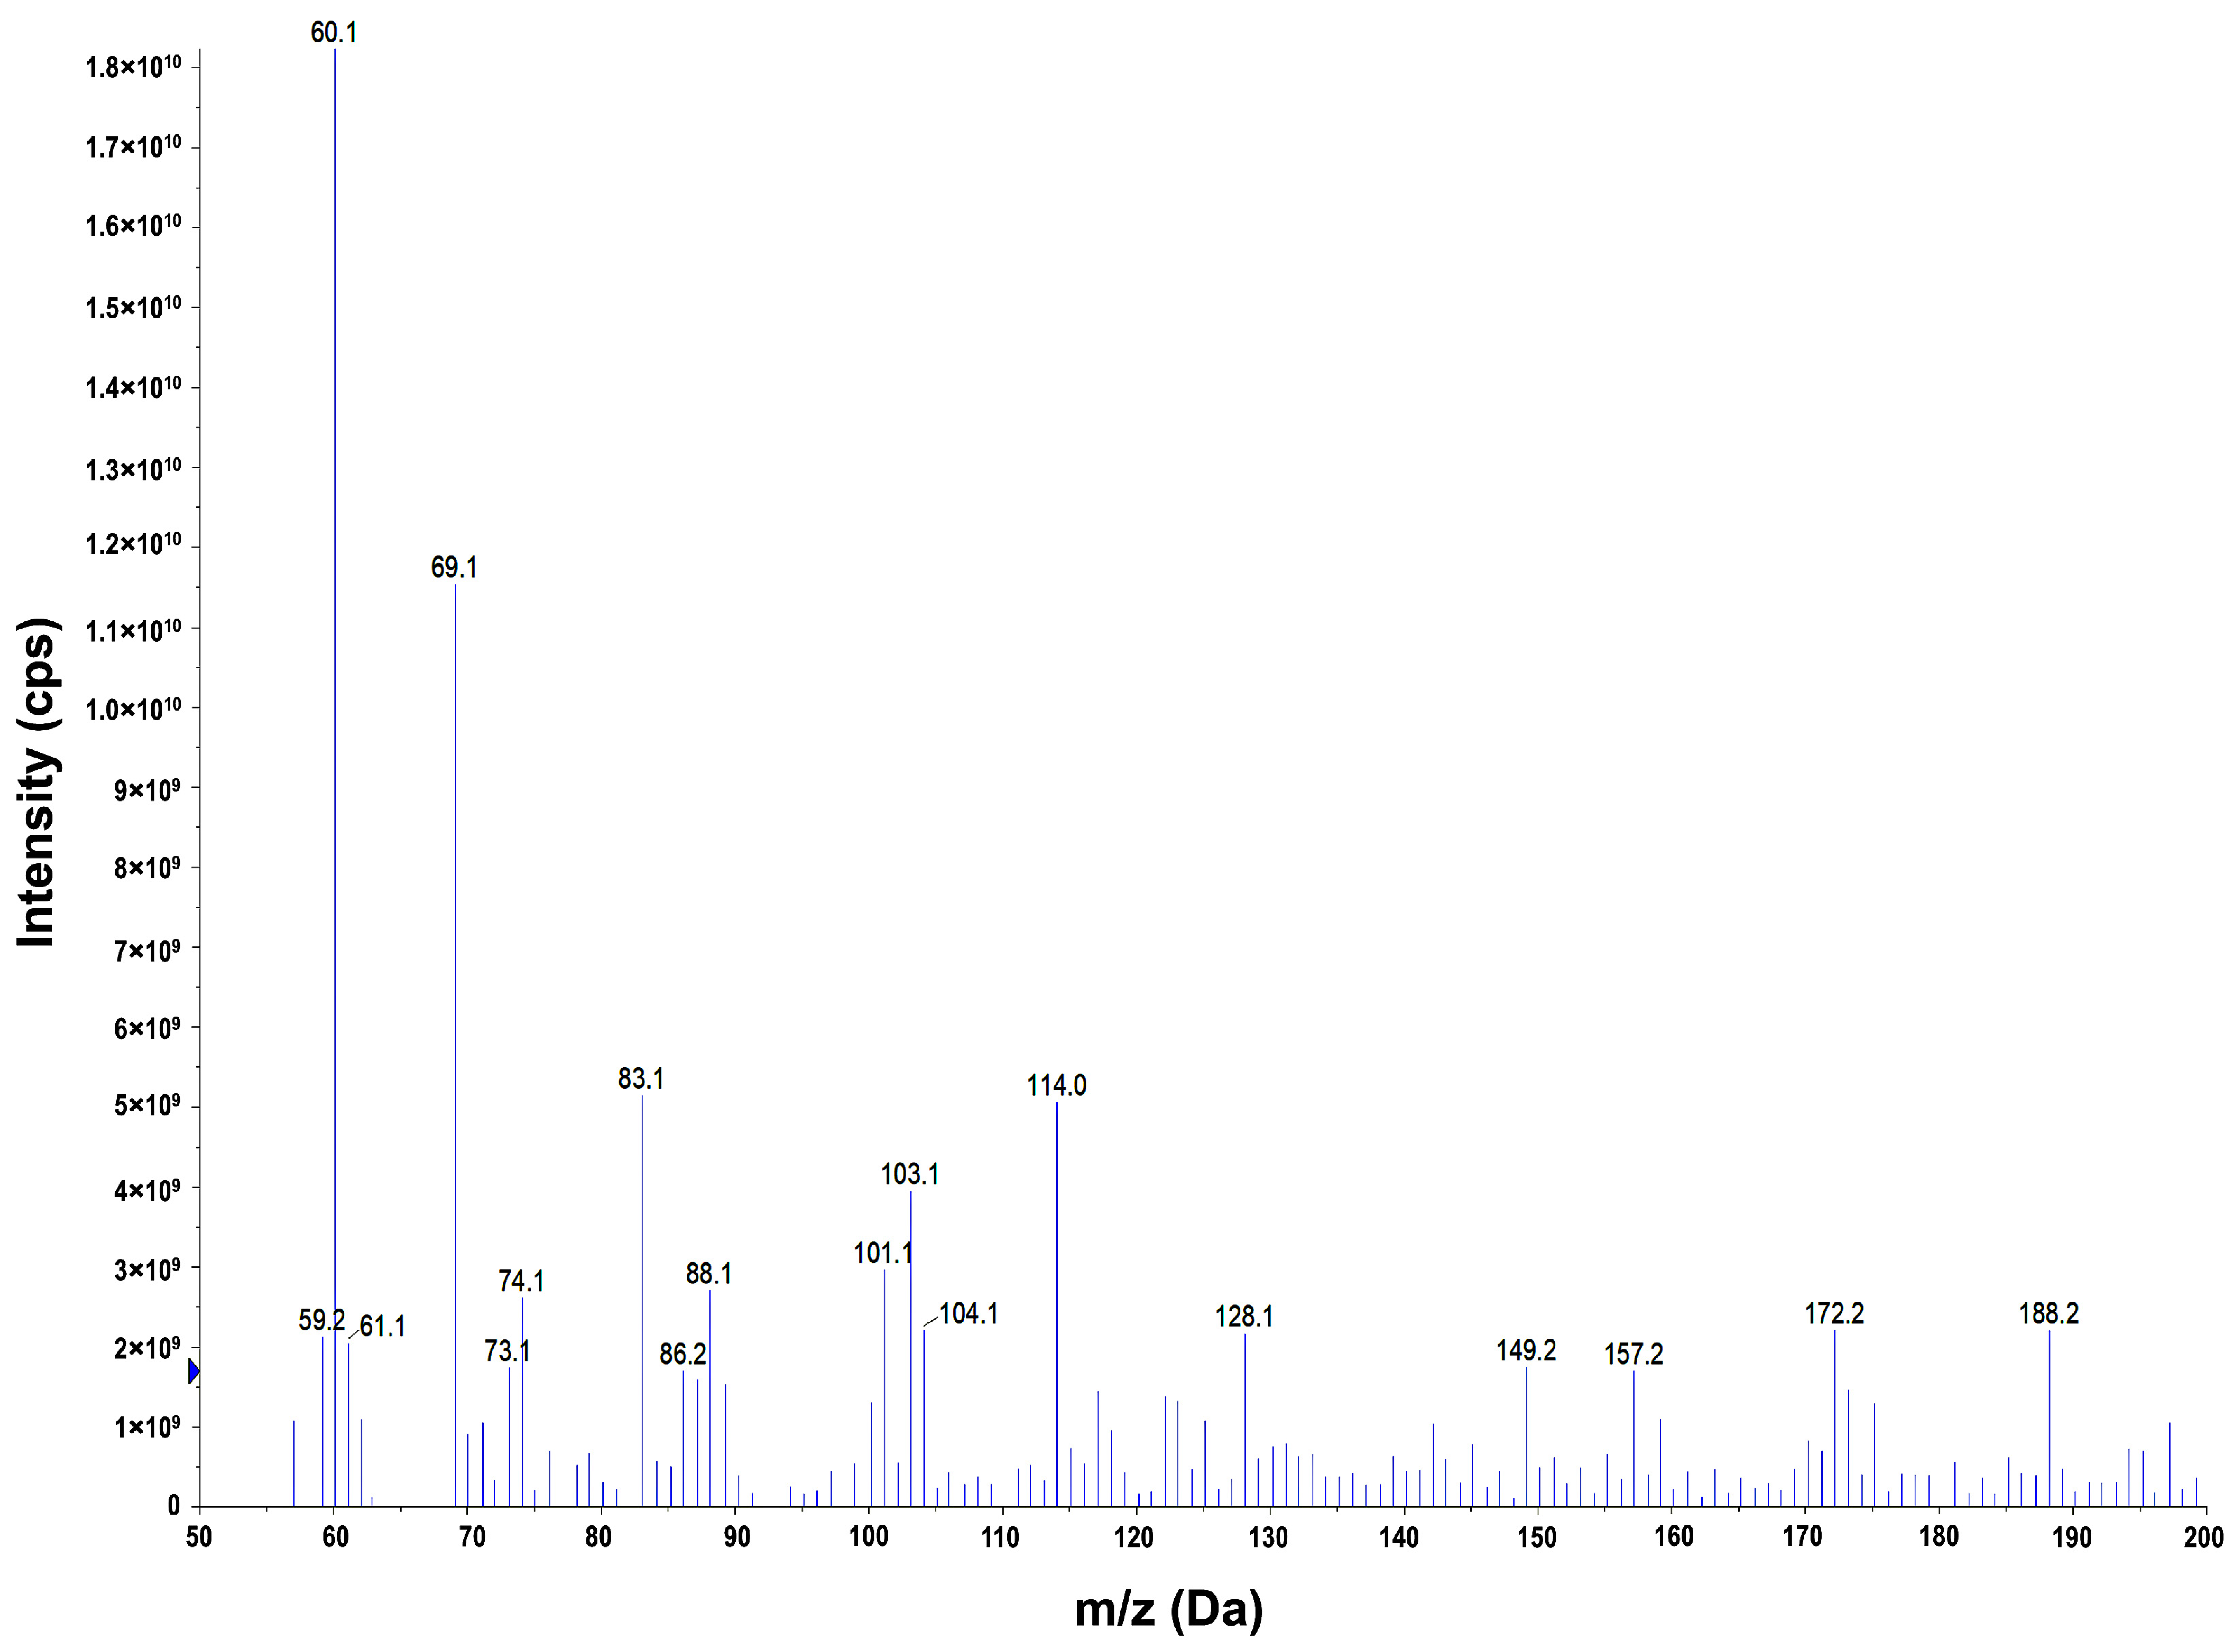
2.9. Identification of Degradation Products

A key element of the present work was the determination of metronidazole photodegradation products using the LC-MS technique (Figure 12).
In the mass spectra recorded on the mass chromatograms, the presence of ions with masses of 60, 83, and 114 were observed. These signals correspond to the intermediate degradation products of metronidazole according to the mechanism proposed by Zia et al. [85]. The ion of m/z 60 is ethene-1,2-diol; m/z 83 is 3,5-dihydro-4H-imidazol-4-one and m/z 114 is 5-hydroxy-1-(hydroxymethylidene)-14-imidazole-1,3-diium.

3. Materials and Methods

3.1. Materials

Titanium tetrachloride (97%), urea (p.a.), lanthanum(III) chloride heptahydrate (99%), europium(III) chloride hexahydrate (99%), poly(ethyleneglycol) PEG 400 (for synthesis), sodium hydroxide (p.a.), and metronidazole were purchased from Sigma-Aldrich (Sigma-Aldrich, St. Louis, MO, USA). All reagents were of analytical grade and used without any further purification. The water used in all experiments was deionized.

3.2. Synthesis of TiO2-Eu and TiO2-La Systems

The preparation of the TiO2-doped materials was realized with a two-step microwave technique. In the presented work, titanium(IV) chloride was used as the precursor for in situ synthesis of TiO2. The preparation of the TiCl4 solution was carried out in distilled water in an ice-water bath according to the procedure previously reported by Zhang et al. [86]. The concentration of titanium(IV) chloride was adjusted to 1%. Next, the 5 g of urea was added to the 100 cm3 TiCl4 solution prepared in the previous step. During microwave heating, urea was decomposed into carbon dioxide and ammonia, which was a hydrolysis promoter and enabled the in situ synthesis of TiO2 nano-particles during microwave processing. After the urea was dissolved, the solution was transferred to a microwave reactor (CEM, Discover 2.0, Matthew, NC, USA) and heated with a maximum power of 300 W until a temperature of 200 °C was reached, then it was held for 1 min. The obtained titanium dioxide was filtered and washed and, finally, dried at 80 °C for 12 h.
Subsequently, the synthesis of TiO2-Eu or TiO2-La materials was carried out. The doped systems were formed using: 0.25 wt.%, 0.5 wt.%, 0.75 wt.%, 1 wt.%, and 1.5 wt.% of dopants. The system TiO2-1.5%Eu is taken as an example to demonstrate the synthesis process. To 100 cm3 of 0.03 g of europium(III) chloride was added and 2 cm3 of PEG 400. The received mixture was adjusted to pH 10 using 1 M of sodium hydroxide solution. Simultaneously, a suspension of the previously obtained titanium dioxide was prepared (1 g in 50 cm3 H2O). For this purpose, an ultrasonic bath was used (SONIC-3, POLSONIC, Poznan, Poland). The resulting titania-Eu mixture was then stirred for 10 min. Finally, the obtained mixture was transferred to a microwave reactor (CEM, Discover 2.0, Matthew, NC, USA) and heated with a maximum power of 300 W until a temperature of 200 °C was reached, then it was held for 1 min. The synthesized systems were filtered and washed and, finally, dried at 60 °C for 6 h.

3.3. Characteristics of Synthesized Systems

The crystallinity and average crystallite size were investigated by X-ray powder diffraction. The analysis was performed using Rigaku Intelligent X-ray diffraction system Miniflex600 (Rigaku Corporation, Tokyo, Japan), equipped with a sealed tube X-ray generator operating with Cu Kα radiation 40 kV and 30 mA. Scans were recorded in the 2θ range from 10° to 80°, with a speed 2° min−1 and a step of 0.01°. The analysis was based on the International Centre for Diffraction Data (ICDD) database.
The X-ray Photoelectron Spectroscopy (XPS) analyzes were recorded on Specs UHV spectrometer (SPECS GmbH, Berlin, Germany) with a charge neutralizer. The reference to rectify the binding energies used was the C 1s peak at 284.8 eV. The obtained XPS data was analyzed using CasaXPS software [87].
The morphology of the obtained samples was determined using a scanning electron microscope (MIRA3, TESCAN, Brno, Czech Republic) and transmission electron microscope working in high contrast and high-resolution mode (Hitachi HT7700, Hitachi, Tokyo, Japan).
The surface composition was determined using the energy dispersive X-ray (EDX) and X-ray fluorescence (EDXRF) analysis. The maps of titanium and dopants (Eu, or La) elements were performed using the Hitachi HT7700 (Hitachi, Tokyo, Japan) operating in the STEM mode with a system to the energy dispersive X-ray microanalysis (Thermo Scientific, Waltham, Massachusetts, USA). The content of appropriate elements was determined using an Epsilon4 EDXRF spectrometer (PANalytical, Malvern, UK).
Parameters of the porous structure such as BET surface area, pore-volume, and pore size were determined using a 3FLEX surface characterization analyzer (Micromeritics Instrument Co., Norcross, GA, USA) by the Brunauer–Emmett–Teller (BET) method based on low-temperature N2 sorption. The surface area was determined by the multipoint BET method using adsorption data in a relative pressure (p/p0) range of 0.05–0.30.
The differential reflectance spectroscopy (DRS) was carried out using a Thermo Scientific Evolution 20 (Thermo Scientific, Waltham, Waltham, MA, USA) spectrophotometer equipped with a PIN-757 integrating sphere. The bandgap energies of the obtained samples were calculated according to the method presented elsewhere [57].
To determine the thermal stability of the obtained doped materials, a TGA analysis was performed. For this purpose, the Jupiter STA 449F3 apparatus (Netzsch, Selb, Germany) was applied.

3.4. Photocatalytic Activity of TiO2-Eu and TiO2-La Systems

3.4.1. The Used Light Source

The synthesized systems’ photo-oxidation activity was evaluated in the degradation process of metronidazole, which was used as a model pharmaceutical. An innovative LED lamp based on the COB (chip-on-board) system was used as a light source. Currently, COB diodes are the most effective source of light in LED lamps. In COB, the integrated circuits (e.g., microprocessors) are wired, bonded directly to a printed circuit board, and covered by a blob of epoxy. Thanks to that, the completed LED can be more compact, lighter, and less costly. In the research, an LED system was used based on a diode with a wavelength of 395–405 nm and a power of 20 W (BRIDGELUX, Fremont, CA, USA). Due to the power used, the diode was equipped with an aluminum passive radiator, which allows the dissipation of the generated heat. Finally, the resulting system was connected to the driver (TOPXIN Electronics Co., Shenzhen, China), and the obtained power was confirmed, which was in line with the assumed value. The resulting UV-LED light source is shown in Figure 13.
Measurement of the power and energy consumption of the UV-LED lamp was carried out using a GB202 wattmeter (GreenBlue, Maclean Energy, Shenzen, China). The calculations of the cost of consumed electricity are based on Eurostat data.

3.4.2. The Photo-Oxidation Measurement

The 100 cm3 of the metronidazole with a certain concentration and 100 mg of the TiO2-Eu or TiO2-La systems were introduced into the reactor. Next, the resulting suspension was mixed in darkness within 30 min to establish adsorption/desorption equilibrium, after that the UV-LED lamp was switched on, and the reaction mixture was irradiated. Every 30 min (up to 180 min, then the irradiation was stopped), 3 cm3 of the suspension was collected and then filtered and analyzed using a UV-Vis spectrophotometer (V-750, Jasco, Tokyo, Japan) in the 200–700 nm wavelength range. The maximum absorbance of metronidazole at wavenumber 319 nm was observed. The photocatalytic activity of the synthesized system was determined by applying a calibration curve method with the formula y = 0.028x − 0.009, where x was the metronidazole concentration, and y was the maximum absorbance value.
The loss of metronidazole content in the solutions after photodegradation was determined by LC-MS/MS technique in MRM (multiple reaction monitoring) modes. The chromatographic separation was performed using the liquid chromatographic system UltiMate 3000 RSLC from Dionex (Sunnyvale, CA, USA). For determination of metronidazole residue after photodegradation, 5 µL samples were injected into a 150 mm × 2.0 mm I.D. analytical column packed with 3 µm Luna C18 (Phenomenex, Torrance, CA, USA). The column was kept at 35 °C. The mobile phase consisted of water (A) and acetonitrile (B) at a flow rate of 0.2 mL min−1. The following gradient was used: 0 min 40% B, 2.7 min 100% B, 3 min 100% B. MS–MS detection was performed in a positive ionization mode with the precursor ion of analyte-to-fragment ion transitions with associated declustering potential (V), and collision energies (V) were: MRM1: 172→128, 56, 21; MRM2:172→82, 56, 37. The first MRM transition was used to quantitate, and the second was used as confirmation. The analyte was detected using the following settings for the ion source and mass spectrometer: curtain gas 10 psi, nebulizer gas 40 psi, auxiliary gas 40 psi, temperature 450 °C, ion spray voltage 5500 V, and collision gas set to medium.
Metronidazole degradation products in solutions after photodegradation were determined by the LC-MS technique. The chromatographic separation was carried out under the same conditions used to determine the loss of metronidazole after the photodegradation process. Total ion chromatograms within an m/z range between 100 and 1200 and mass spectra corresponding to the obtained chromatographic peaks were recorded.

4. Conclusions

The main purpose of the work was to include the microwave technique in the synthesis of TiO2-lanthanides (Eu or La) systems. The obtained XRD results indicated that regardless of the analyzed systems, two crystal structures were noted for the obtained samples, anatase and rutile. The absence of characteristic peaks from europium and lanthanum on the XRD patterns may indicate that the dopants particles have high dispersion on the TiO2 surface, which agrees with the available literature. Moreover, the surface analyzes proved that the dopants nano-particles are present only on the TiO2 surface without disturbing the crystal lattice.
The fundamental aspect of the research was the use of a low-cost UV-LED light source in the degradation process of metronidazole. The obtained results of photo-oxidation tests confirm the high degradation efficiency for the synthesized materials doped with selected lanthanides. The highest removal of the tested pharmaceutical was obtained for the TiO2-0.25%Eu and TiO2-0.25%La systems, for which the degradation efficiency was nearly 100% after 180 min, while satisfactory results (<90% removal) were obtained after 120 min of irradiation. Finally, the electricity consumption of the UV-LED lamp used in our research was compared with a conventional high-pressure mercury lamp. The obtained results indicated 10 times lower power demand, which confirms that UV-LED lamps can be an alternative to the currently used UV lamps.

Author Contributions

A.K., conceptualization, methodology, formal analysis, investigation, writing—original draft, writing—review and editing; A.G., investigation, writing—original draft; J.Z., methodology, formal analysis, writing—review and editing; A.Z.-J., investigation, writing—review and editing; K.S.-C., writing—review and editing; M.J., writing—review and editing; P.K., investigation, writing—review and editing; T.J., supervision, project administration, funding acquisition, writing—review and editing. All authors have read and agreed to the published version of the manuscript.

Funding

This research was funded by the Ministry of Science and Higher Education Poland as a subsidy to Poznan University of Technology (0912/SBAD/2106).

Data Availability Statement

Not applicable.

Acknowledgments

This research was funded by the Ministry of Science and Higher Education Poland as a subsidy to Poznan University of Technology.

Conflicts of Interest

The authors declare no conflict of interest.

References

  1. Lienert, J.; Bürki, T.; Escher, B.I. Reducing micropollutants with source control: Substance flow analysis of 212 pharmaceuticals in faeces and urine. Water Sci. Technol. 2007, 56, 87–96. [Google Scholar] [CrossRef]
  2. Jjemba, P.K. Excretion and ecotoxicity of pharmaceutical and personal care products in the environment. Ecotoxicol. Environ. Saf. 2006, 63, 113–130. [Google Scholar] [CrossRef]
  3. Hanna, N.; Sun, P.; Sun, Q.; Li, X.; Yang, X.; Ji, X.; Zou, H.; Ottoson, J.; Nilsson, L.E.; Berglund, B.; et al. Presence of antibiotic residues in various environmental compartments of Shandong province in eastern China: Its potential for resistance development and ecological and human risk. Environ. Int. 2018, 114, 131–142. [Google Scholar] [CrossRef]
  4. Ighalo, J.O.; Igwegbe, C.A.; Adeniyi, A.G.; Adeyanju, C.A.; Ogunniyi, S. Mitigation of Metronidazole (Flagyl) pollution in aqueous media by adsorption: A review. Environ. Technol. Rev. 2020, 9, 137–148. [Google Scholar] [CrossRef]
  5. Dong, S.; Sun, J.; Li, Y.; Yu, C.; Li, Y.; Sun, J. ZnSnO3 hollow nanospheres/reduced graphene oxide nanocomposites as high-performance photocatalysts for degradation of metronidazole. Appl. Catal. B Environ. 2014, 144, 386–393. [Google Scholar] [CrossRef]
  6. Gómez, M.J.; Malato, O.; Ferrer, I.; Agüera, A.; Fernández-Alba, A.R. Solid-phase extraction followed by liquid chromatography-time-of-flight-mass spectrometry to evaluate pharmaceuticals in effluents. A pilot monitoring study. J. Environ. Monit. 2007, 9, 719–729. [Google Scholar] [CrossRef]
  7. Dantas, R.F.; Rossiter, O.; Teixeira, A.K.R.; Simões, A.S.M.; da Silva, V.L. Direct UV photolysis of propranolol and metronidazole in aqueous solution. Chem. Eng. J. 2010, 158, 143–147. [Google Scholar] [CrossRef]
  8. Vulliet, E.; Cren-Olivé, C. Screening of pharmaceuticals and hormones at the regional scale, in surface and groundwaters intended to human consumption. Environ. Pollut. 2011, 159, 2929–2934. [Google Scholar] [CrossRef] [PubMed]
  9. Johnson, M.B.; Mehrvar, M. Aqueous metronidazole degradation by UV/H2O2 process in single-and multi-lamp tubular photoreactors: Kinetics and reactor design. Ind. Eng. Chem. Res. 2008, 47, 6525–6537. [Google Scholar] [CrossRef]
  10. Aarab, N.; Hsini, A.; Essekri, A.; Laabd, M.; Lakhmiri, R.; Albourine, A. Removal of an emerging pharmaceutical pollutant (metronidazole) using PPY-PANi copolymer: Kinetics, equilibrium and DFT identification of adsorption mechanism. Groundw. Sustain. Dev. 2020, 11, 100416. [Google Scholar] [CrossRef]
  11. Manjunath, S.V.; Kumar, M. Evaluation of single-component and multi-component adsorption of metronidazole, phosphate and nitrate on activated carbon from Prosopıs julıflora. Chem. Eng. J. 2018, 346, 525–534. [Google Scholar] [CrossRef]
  12. Asgari, E.; Sheikhmohammadi, A.; Yeganeh, J. Application of the Fe3O4-chitosan nano-adsorbent for the adsorption of metronidazole from wastewater: Optimization, kinetic, thermodynamic and equilibrium studies. Int. J. Biol. Macromol. 2020, 164, 694–706. [Google Scholar] [CrossRef] [PubMed]
  13. Aarab, N.; Hsini, A.; Laabd, M.; Essekri, A.; Laktif, T.; Haki, M.A.; Lakhmiri, R.; Albourine, A. Theoretical study of the adsorption of sodium salicylate and metronidazole on the PANi. Mater. Today Proc. 2020, 22, 100–103. [Google Scholar] [CrossRef]
  14. Alamgir; Talha, K.; Wang, B.; Liu, J.H.; Ullah, R.; Feng, F.; Yu, J.; Chen, S.; Li, J.R. Effective adsorption of metronidazole antibiotic from water with a stable Zr(IV)-MOFs: Insights from DFT, kinetics and thermodynamics studies. J. Environ. Chem. Eng. 2020, 8, 103642. [Google Scholar] [CrossRef]
  15. Farzadkia, M.; Bazrafshan, E.; Esrafili, A.; Yang, J.K.; Shirzad-Siboni, M. Photocatalytic degradation of Metronidazole with illuminated TiO2 nano-particles. J. Environ. Health Sci. Eng. 2015, 13, 35. [Google Scholar] [CrossRef] [Green Version]
  16. Tran, M.L.; Fu, C.C.; Juang, R.S. Removal of metronidazole by TiO2 and ZnO photocatalysis: A comprehensive comparison of process optimization and transformation products. Environ. Sci. Pollut. Res. 2018, 25, 28285–28295. [Google Scholar] [CrossRef] [PubMed]
  17. Ahammad, S.Z.; Gomes, J.; Sreekrishnan, T.R. Wastewater treatment forproductionof H2S-free biogas. J. Chem. Technol. Biotechnol. 2008, 83, 1163–1169. [Google Scholar] [CrossRef]
  18. Kanakaraju, D.; Glass, B.D.; Oelgemöller, M. Titanium dioxide photocatalysis for pharmaceutical wastewater treatment. Environ. Chem. Lett. 2014, 12, 27–47. [Google Scholar] [CrossRef]
  19. Chen, D.; Cheng, Y.; Zhou, N.; Chen, P.; Wang, Y.; Li, K.; Huo, S.; Cheng, P.; Peng, P.; Zhang, R.; et al. Photocatalytic degradation of organic pollutants using TiO2-based photocatalysts: A review. J. Clean. Prod. 2020, 268, 121725. [Google Scholar] [CrossRef]
  20. Goud, B.S.; Koyyada, G.; Jung, J.H.; Reddy, G.R.; Shim, J.; Nam, N.D.; Vattikuti, S.V.P. Surface oxygen vacancy facilitated Z-scheme MoS2/Bi2O3 heterojunction for enhanced visible-light driven photocatalysis-pollutant degradation and hydrogen production. Int. J. Hydrogen Energy 2020, 45, 18961–18975. [Google Scholar] [CrossRef]
  21. Raizada, P.; Kumar, A.; Hasija, V.; Singh, P.; Thakur, V.K.; Khan, A.A.P. An overview of converting reductive photocatalyst into all solid-state and direct Z-scheme system for water splitting and CO2 reduction. J. Ind. Eng. Chem. 2021, 93, 1–27. [Google Scholar] [CrossRef]
  22. Yao, X.; Hu, X.; Liu, Y.; Wang, X.; Hong, X.; Chen, X.; Pillai, S.C.; Dionysiou, D.D.; Wang, D. Simultaneous photocatalytic degradation of ibuprofen and H2 evolution over Au/sheaf-like TiO2 mesocrystals. Chemosphere 2020, 261, 127759. [Google Scholar] [CrossRef]
  23. Zhang, M.; Lai, C.; Li, B.; Xu, F.; Huang, D.; Liu, S.; Qin, L.; Fu, Y.; Liu, X.; Yi, H.; et al. Unravelling the role of dual quantum dots cocatalyst in 0D/2D heterojunction photocatalyst for promoting photocatalytic organic pollutant degradation. Chem. Eng. J. 2020, 396, 125343. [Google Scholar] [CrossRef]
  24. Raizada, P.; Soni, V.; Kumar, A.; Singh, P.; Khan, A.A.P.; Asiri, A.M.; Thakur, V.K.; Nguyen, V.H. Surface defect engineering of metal oxides photocatalyst for energy application and water treatment. J. Metar. 2021, 7, 388–418. [Google Scholar] [CrossRef]
  25. Zhou, J.; Ding, J.; Wan, H.; Guan, G. Boosting photocatalytic degradation of antibiotic wastewater by synergy effect of heterojunction and phosphorus doping. J. Colloid Interface Sci. 2021, 582, 961–968. [Google Scholar] [CrossRef]
  26. Ismael, M. A review and recent advances in solar-to-hydrogen energy conversion based on photocatalytic water splitting over doped-TiO2 nano-particles. Sol. Energy 2020, 211, 522–546. [Google Scholar] [CrossRef]
  27. Singh, J.; Soni, R.K. Controlled synthesis of CuO decorated defect enriched ZnO nanoflakes for improved sunlight-induced photocatalytic degradation of organic pollutants. Appl. Surf. Sci. 2020, 521, 146420. [Google Scholar] [CrossRef]
  28. Liu, J.; Zhang, Q.; Tian, X.; Hong, Y.; Nie, Y.; Su, N.; Jin, G.; Zhai, Z.; Fu, C. Highly efficient photocatalytic degradation of oil pollutants by oxygen deficient SnO2 quantum dots for water remediation. Chem. Eng. J. 2021, 404, 127146. [Google Scholar] [CrossRef]
  29. Ding, J.; Wang, H.; Luo, Y.; Xu, Y.; Liu, J.; Lin, R.; Gao, Y.; Lin, Y. Carbon quantum dots modified (002) oriented Bi2O2CO3 composites with enhanced photocatalytic removal of toluene in air. Nanomaterials 2020, 10, 1795. [Google Scholar] [CrossRef] [PubMed]
  30. Grzegórska, A.; Głuchowski, P.; Karczewski, J.; Ryl, J.; Wysocka, I.; Siuzdak, K.; Trykowski, G.; Grochowska, K.; Zielińska-Jurek, A. Enhanced photocatalytic activity of accordion-like layered Ti3C2 (MXene) coupled with Fe-modified decahedral anatase particles exposing {101} and {001} facets. Chem. Eng. J. 2021, 426, 130801. [Google Scholar] [CrossRef]
  31. Saqib, N.U.; Adnan, R.; Shah, I. A mini-review on rare earth metal-doped TiO2 for photocatalytic remediation of wastewater. Environ. Sci. Pollut. Res. 2016, 23, 15941–15951. [Google Scholar] [CrossRef]
  32. Huo, Y.; Zhu, J.; Li, J.; Li, G.; Li, H. An active La/TiO2 photocatalyst prepared by ultrasonication-assisted sol-gel method followed by treatment under supercritical conditions. J. Mol. Catal. A Chem. 2007, 278, 237–243. [Google Scholar] [CrossRef]
  33. Khade, G.V.; Gavade, N.L.; Suwarnkar, M.B.; Dhanavade, M.J.; Sonawane, K.D.; Garadkar, K.M. Enhanced photocatalytic activity of europium doped TiO2 under sunlight for the degradation of methyl orange. J. Mater. Sci. Mater. Electron. 2017, 28, 11002–11011. [Google Scholar] [CrossRef]
  34. Shi, H.; Zhang, T.; Wang, H. Preparation and photocatalytic activity of La3+ and Eu3+ co-doped TiO2 nano-particles: Photo-assisted degradation of methylene blue. J. Rare Earths 2011, 29, 746–752. [Google Scholar] [CrossRef]
  35. Tahir, M. La-modified TiO2/carbon nanotubes assembly nanocomposite for efficient photocatalytic hydrogen evolution from glycerol-water mixture. Int. J. Hydrogen Energy 2019, 44, 3711–3725. [Google Scholar] [CrossRef]
  36. Huang, C.Y.; Guo, R.T.; Pan, W.G.; Tang, J.Y.; Zhou, W.G.; Qin, H.; Liu, X.Y.; Jia, P.Y. Eu-doped TiO2 nano-particles with enhanced activity for CO2 phpotcatalytic reduction. J. CO2 Util. 2018, 26, 487–495. [Google Scholar] [CrossRef]
  37. Kubiak, A.; Wojciechowska, W.; Kurc, B.; Pigłowska, M.; Synoradzki, K.; Gabała, E.; Moszyński, D.; Szybowicz, M.; Siwińska-Ciesielczyk, K.; Jesionowski, T. Highly crystalline TiO2-MoO3 composite materials synthesized via a template-assisted microwave method for electrochemical application. Crystals 2020, 10, 493. [Google Scholar] [CrossRef]
  38. Kubiak, A.; Bielan, Z.; Kubacka, M.; Gabała, E.; Zgoła-Grześkowiak, A.; Janczarek, M.; Zalas, M.; Zielińska-Jurek, A.; Siwińska-Ciesielczyk, K.; Jesionowski, T. Microwave-assisted synthesis of a TiO2-CuO heterojunction with enhanced photocatalytic activity against tetracycline. Appl. Surf. Sci. 2020, 520, 146344. [Google Scholar] [CrossRef]
  39. Kubiak, A.; Bielan, Z.; Bartkowiak, A.; Gabała, E.; Piasecki, A.; Zalas, M.; Zielińska-Jurek, A.; Janczarek, M.; Siwińska-Ciesielczyk, K.; Jesionowski, T. Synthesis of titanium dioxide via surfactantassisted microwave method for photocatalytic and dye-sensitized solar cells applications. Catalysts 2020, 10, 586. [Google Scholar] [CrossRef]
  40. Fagan, R.; McCormack, D.E.; Dionysiou, D.D.; Pillai, S.C. A review of solar and visible light active TiO2 photocatalysis for treating bacteria, cyanotoxins and contaminants of emerging concern. Mater. Sci. Semicond. Process. 2016, 42, 2–14. [Google Scholar] [CrossRef] [Green Version]
  41. Nian, J.N.; Teng, H. Hydrothermal synthesis of single-crystalline anatase TiO2 nanorods with nanotubes as the precursor. J. Phys. Chem. B 2006, 110, 4193–4198. [Google Scholar] [CrossRef] [PubMed]
  42. Song, G.; Luo, C.; Fu, Q.; Pan, C. Hydrothermal synthesis of the novel rutile-mixed anatase TiO2 nanosheets with dominant {001} facets for high photocatalytic activity. RSC Adv. 2016, 6, 84035–84041. [Google Scholar] [CrossRef]
  43. Zhou, J.; Lei, R.; Wang, H.; Hua, Y.; Li, D.; Yang, Q.; Deng, D.; Xu, S. A new generation of dual-mode optical thermometry based on ZrO2:Eu3+ nanocrystals. Nanophotonics 2019, 8, 2347–2358. [Google Scholar] [CrossRef]
  44. Zeng, C.H.; Zheng, K.; Lou, K.L.; Meng, X.T.; Yan, Z.Q.; Ye, Z.N.; Su, R.R.; Zhong, S. Synthesis of porous europium oxide particles for photoelectrochemical water splitting. Electrochim. Acta 2015, 165, 396–401. [Google Scholar] [CrossRef]
  45. Kim, M.S.; Chung, S.H.; Yoo, C.J.; Lee, M.S.; Cho, I.H.; Lee, D.W.; Lee, K.Y. Catalytic reduction of nitrate in water over Pd-Cu/TiO2 catalyst: Effect of the strong metal-support interaction (SMSI) on the catalytic activity. Appl. Catal. B Environ. 2013, 142–143, 354–361. [Google Scholar] [CrossRef]
  46. Olowoyo, J.O.; Kumar, M.; Dash, T.; Saran, S.; Bhandari, S.; Kumar, U. Self-organized copper impregnation and doping in TiO2 with enhanced photocatalytic conversion of H2O and CO2 to fuel. Int. J. Hydrogen Energy 2018, 43, 19468–19480. [Google Scholar] [CrossRef]
  47. Singh, D.; Tanwar, V.; Simantilleke, A.P.; Mari, B.; Kadyan, P.S.; Singh, I. Rapid synthesis and enhancement in down conversion emission properties of BaAl2O4:Eu2+,Re3+ (Re3+ = Y, Pr) nanophosphors. J. Mater. Sci. Mater. Electron. 2016, 27, 2260–2266. [Google Scholar] [CrossRef]
  48. Tian, B.; Li, C.; Gu, F.; Jiang, H.; Hu, Y.; Zhang, J. Flame sprayed V-doped TiO2 nano-particles with enhanced photocatalytic activity under visible light irradiation. Chem. Eng. J. 2009, 151, 220–227. [Google Scholar] [CrossRef]
  49. Ola, O.; Maroto-Valer, M.M. Synthesis, characterization and visible light photocatalytic activity of metal based TiO2 monoliths for CO2 reduction. Chem. Eng. J. 2016, 283, 1244–1253. [Google Scholar] [CrossRef] [Green Version]
  50. Zhu, J.; Chen, F.; Zhang, J.; Chen, H.; Anpo, M. Fe3+-TiO2 photocatalysts prepared by combining sol-gel method with hydrothermal treatment and their characterization. J. Photochem. Photobiol. A Chem. 2006, 180, 196–204. [Google Scholar] [CrossRef]
  51. Liqiang, J.; Xiaojun, S.; Baifu, X.; Baiqi, W.; Weimin, C.; Honggang, F. The preparation and characterization of La doped TiO2 nano-particles and their photocatalytic activity. J. Solid State Chem. 2004, 177, 3375–3382. [Google Scholar] [CrossRef]
  52. Kibombo, H.S.; Weber, A.S.; Wu, C.M.; Raghupathi, K.R.; Koodali, R.T. Effectively dispersed europium oxide dopants in TiO2 aerogel supports for enhanced photocatalytic pollutant degradation. J. Photochem. Photobiol. A Chem. 2013, 269, 49–58. [Google Scholar] [CrossRef]
  53. Anandan, S.; Ikuma, Y.; Murugesan, V. Highly active rare-earth-metal La-doped photocatalysts: Fabrication, characterization, and their photocatalytic activity. Int. J. Photoenergy 2012, 2012, 921412. [Google Scholar] [CrossRef]
  54. Huang, J.; Tian, B.; Wang, J.; Wang, Y.; Lu, W.; Li, Q.; Jin, L.; Li, C.; Wang, Z. Controlled synthesis of 3D flower-like MgWO4:Eu3+ hierarchical structures and fluorescence enhancement through introduction of carbon dots. CrystEngComm 2018, 20, 608–614. [Google Scholar] [CrossRef]
  55. Siah, W.R.; Lintang, H.O.; Yuliati, L. Role of lanthanum species in improving the photocatalytic activity of titanium dioxide. Catal. Sci. Technol. 2017, 7, 159–167. [Google Scholar] [CrossRef]
  56. Sing, K.S.W.; Everett, D.H.; Haul, R.A.W.; Moscou, L.; Pierotti, R.S.; Rouquerol, J.; Siemieniewska, T. Reporting physisorption data for gas/solid systems with special reference to the determination of surface area and porosity. Pure Appl. Chem. 1985, 57, 603–619. [Google Scholar] [CrossRef]
  57. Kubiak, A.; Żółtowska, S.; Gabała, E.; Szybowicz, M.; Siwińska-Ciesielczyk, K.; Jesionowski, T. Controlled microwave-assisted and pH-affected growth of ZnO structures and their photocatalytic performance. Powder Technol. 2021, 386, 221–235. [Google Scholar] [CrossRef]
  58. Janczarek, M.; Kowalska, E. On the origin of enhanced photocatalytic activity of copper-modified titania in the oxidative reaction systems. Catalysts 2017, 7, 317. [Google Scholar] [CrossRef] [Green Version]
  59. Juan, J.L.X.; Maldonado, C.S.; Sánchez, R.A.L.; Díaz, O.J.E.; Ronquillo, M.R.R.; Sandoval-Rangel, L.; Aguilar, N.P.; Delgado, N.A.T.; Martínez-Vargas, D.X. TiO2 doped with europium (Eu): Synthesis, characterization and catalytic performance on pesticide degradation under solar irradiation. Catal. Today, 2021; in press. [Google Scholar] [CrossRef]
  60. Wang, R.; Wang, F.; An, S.; Song, J.; Zhang, Y. Y/Eu co-doped TiO2: Synthesis and photocatalytic activities under UV-light. J. Rare Earths 2015, 33, 154–159. [Google Scholar] [CrossRef]
  61. Zhang, Z.; Li, G.; Cui, Z.; Zhang, K.; Feng, Y.; Meng, S. Influence of difference quantity La-doped TiO2 photoanodes on the performance of dye-sensitized solar cells: A strategy for choosing an appropriate doping quantity. J. Solid State Chem. 2016, 237, 242–247. [Google Scholar] [CrossRef]
  62. Zhang, R.; Zhao, J.; Yang, Y.; Lu, Z.; Shi, W. Understanding electronic and optical properties of La and Mn co-doped anatase TiO2. Comput. Condens. Matter 2016, 6, 5–17. [Google Scholar] [CrossRef] [Green Version]
  63. Borlaf, M.; Moreno, R.; Ortiz, A.L.; Colomer, M.T. Synthesis and photocatalytic activity of Eu3+-doped nanoparticulate TiO2 sols and thermal stability of the resulting xerogels. Mater. Chem. Phys. 2014, 144, 8–16. [Google Scholar] [CrossRef]
  64. Armaković, S.J.; Grujić-Brojčin, M.; Šćepanović, M.; Armaković, S.; Golubović, A.; Babić, B.; Abramović, B.F. Efficiency of La-doped TiO2 calcined at different temperatures in photocatalytic degradation of β-blockers. Arab. J. Chem. 2019, 12, 5355–5369. [Google Scholar] [CrossRef]
  65. Šćepanović, M.; Aškrabić, S.; Berec, V.; Golubović, A.; Dohčević-Mitrović, Z.; Kremenović, A.; Popović, Z.V. Characterization of La-doped TiO2 nanopowders by Raman spectroscopy. Acta Phys. Pol. A 2009, 115, 771–774. [Google Scholar] [CrossRef]
  66. Kubiak, A.; Siwińska-Ciesielczyk, K.; Bielan, Z.; Zielińska-Jurek, A.; Jesionowski, T. Synthesis of highly crystalline photocatalysts based on TiO2 and ZnO for the degradation of organic impurities under visible-light irradiation. Adsorption 2019, 25, 309–325. [Google Scholar] [CrossRef] [Green Version]
  67. Xie, Y.; Yuan, C. Characterization and photocatalysis of Eu3+-TiO2 sol in the hydrosol reaction system. Mater. Res. Bull. 2004, 39, 533–543. [Google Scholar] [CrossRef]
  68. Weidner, E.; Siwińska-Ciesielczyk, K.; Moszyński, D.; Jesionowski, T.; Ciesielczyk, F. A comprehensive method for tetracycline removal using a lanthanum-enriched titania–zirconia oxide system with tailored physicochemical properties. Environ. Technol. Innov. 2021, 24, 102016. [Google Scholar] [CrossRef]
  69. Xiaohong, W.; Wei, Q.; Xianbo, D.; Yang, W.; Huiling, L.; Zhaohua, J. Photocatalytic activity of Eu-doped TiO2 ceramic films prepared by microplasma oxidation method. J. Phys. Chem. Solids 2007, 68, 2387–2393. [Google Scholar] [CrossRef]
  70. Wagil, M.; Maszkowska, J.; Białk-Bielińska, A.; Caban, M.; Stepnowski, P.; Kumirska, J. Determination of metronidazole residues in water, sediment and fish tissue samples. Chemosphere 2015, 119, S28–S34. [Google Scholar] [CrossRef]
  71. Freeman, C.D.; Klutman, N.E.; Lamp, K.C. Metronidazole. A therapeutic review and update. Drugs 1997, 54, 679–708. [Google Scholar] [CrossRef]
  72. Sánchez-Polo, M.; Rivera-Utrilla, J.; Prados-Joya, G.; Ferro-García, M.A.; Bautista-Toledo, I. Removal of pharmaceutical compounds, nitroimidazoles, from waters by using the ozone/carbon system. Water Res. 2008, 42, 4163–4171. [Google Scholar] [CrossRef] [PubMed]
  73. Chen, J.; Qian, Y.; Liu, H.; Huang, T. Oxidative degradation of diclofenac by thermally activated persulfate: Implication for ISCO. Environ. Sci. Pollut. Res. 2016, 23, 3824–3833. [Google Scholar] [CrossRef] [PubMed]
  74. Zarezadeh, S.; Habibi-Yangjeh, A.; Mousavi, M. BiOBr and AgBr co-modified ZnO photocatalyst: A novel nanocomposite with p-n-n heterojunctions for highly effective photocatalytic removal of organic contaminants. J. Photochem. Photobiol. A Chem. 2019, 379, 11–23. [Google Scholar] [CrossRef]
  75. Cheng, W.; Yang, M.; Xie, Y.; Liang, B.; Fang, Z.; Tsang, E.P. Enhancement of mineralization of metronidazole by the electro-Fenton process with a Ce/SnO2-Sb coated titanium anode. Chem. Eng. J. 2013, 220, 214–220. [Google Scholar] [CrossRef]
  76. Ghribi, F.; Sehailia, M.; Aoudjit, L.; Touahra, F.; Zioui, D.; Boumechhour, A.; Halliche, D.; Bachari, K.; Benmaamar, Z. Solar-light promoted photodegradation of metronidazole over ZnO-ZnAl2O4 heterojunction derived from 2D-layered double hydroxide structure. J. Photochem. Photobiol. A Chem. 2020, 397, 112510. [Google Scholar] [CrossRef]
  77. Li, J.; Zhao, W.; Guo, Y.; Wei, Z.; Han, M.; He, H.; Yang, S.; Sun, C. Facile synthesis and high activity of novel BiVO4/FeVO4 heterojunction photocatalyst for degradation of metronidazole. Appl. Surf. Sci. 2015, 351, 270–279. [Google Scholar] [CrossRef]
  78. Boxi, S.S.; Paria, S. Effect of silver doping on TiO2, CdS, and ZnS nano-particles for the photocatalytic degradation of metronidazole under visible light. RSC Adv. 2014, 4, 37752–37760. [Google Scholar] [CrossRef]
  79. Farzadkia, M.; Esrafili, A.; Baghapour, M.A.; Shahamat, Y.D.; Okhovat, N. Degradation of metronidazole in aqueous solution by nano-ZnO/UV photocatalytic process. Desalination Water Treat. 2014, 52, 4947–4952. [Google Scholar] [CrossRef]
  80. Malakootian, M.; Olama, N.; Malakootian, M.; Nasiri, A. Photocatalytic degradation of metronidazole from aquatic solution by TiO2-doped Fe3+ nano-photocatalyst. Int. J. Environ. Sci. Technol. 2019, 16, 4275–4284. [Google Scholar] [CrossRef]
  81. Salimi, M.; Esrafili, A.; Sobhi, H.R.; Behbahani, M.; Gholami, M.; Farzadkia, M.; Jafari, A.J.; Kalantary, R.R. Photocatalytic degradation of metronidazole using D-g-C3N4-Bi5O7I composites under visible light irradiation: Degradation product, and mechanisms. ChemistrySelect 2019, 4, 10288–10295. [Google Scholar] [CrossRef]
  82. Tran, M.L.; Fu, C.C.; Juang, R.S. Effects of water matrix components on degradation efficiency and pathways of antibiotic metronidazole by UV/TiO2 photocatalysis. J. Mol. Liq. 2019, 276, 32–38. [Google Scholar] [CrossRef]
  83. Ding, C.; Fu, K.; Pan, Y.; Liu, J.; Deng, H.; Shi, J. Comparison of Ag and Agi-modified zno as heterogeneous photocatalysts for simulated sunlight driven photodegradation of metronidazole. Catalysts 2020, 10, 1097. [Google Scholar] [CrossRef]
  84. Kubiak, A.; Żółtowska, S.; Bartkowiak, A.; Gabała, E.; Sacharczuk, N.; Zalas, M.; Siwińska-Ciesielczyk, K.; Jesionowski, T. The TiO2-ZnO systems with multifunctional applications in photoactive processes—efficient photocatalyst under UV-LED light and electrode materials in DSSCs. Materials 2021, 14, 6063. [Google Scholar] [CrossRef] [PubMed]
  85. Zia, J.; Farhat, S.M.; Aazam, E.S.; Riaz, U. Highly efficient degradation of metronidazole drug using CaFe2O4/PNA nanohybrids as metal-organic catalysts under microwave irradiation. Environ. Sci. Pollut. Res. 2021, 28, 4125–4135. [Google Scholar] [CrossRef] [PubMed]
  86. Zhang, Q.H.; Gao, L.; Guo, J.K. Preparation and characterization of nanosized TiO2 powders from aqueous TiCl4 solution. Nanostruct. Mater. 1999, 11, 1293–1300. [Google Scholar] [CrossRef]
  87. Fairley, N.; Fernandez, V.; Richard-Plouet, M.; Guillot-Deudon, C.; Walton, J.; Smith, E.; Flahaut, D.; Greiner, M.; Biesinger, M.; Tougaard, S.; et al. Systematic and collaborative approach to problem solving using X-ray photoelectron spectroscopy. Appl. Surf. Sci. Adv. 2021, 5, 100112. [Google Scholar] [CrossRef]
Figure 1. The XRD patterns for (a) TiO2-Eu and (b) TiO2-La systems.
Catalysts 12 00008 g001
Figure 2. The XRD patterns for titania sample subjected to single, double, and triple microwave treatment.
Catalysts 12 00008 g002
Figure 3. The HRTEM images for (a) TiO2-0.25%Eu, (b) TiO2-1.5%Eu, (c) TiO2-0.25%La and (d) TiO2-1.5%La systems.
Catalysts 12 00008 g003
Figure 4. XPS spectra of specific regions: (a) Ti 2p, (b) O 1s, and (c) Eu 3d for TiO2-Eu systems.
Catalysts 12 00008 g004
Figure 5. The results of SEM (a) and TEM (b) analysis for titanium dioxide.
Catalysts 12 00008 g005
Figure 6. The results of TEM analysis for: TiO2-0.5%Eu (a), TiO2-0.75%Eu (b), TiO2-1%Eu (c), TiO2-1.5%Eu (d), TiO2-0.5%La (e), TiO2-0.75%La (f), TiO2-1%La (g), and TiO2-1.5%La (h).
Catalysts 12 00008 g006
Figure 7. STEM images with mapping for titanium and europium/lanthanum for TiO2-Eu and TiO2-La systems.
Catalysts 12 00008 g007
Figure 8. Nitrogen adsorption-desorption isotherms for the synthesized (a) TiO2-Eu and (b) TiO2-La systems.
Catalysts 12 00008 g008
Figure 9. The absorption spectra of TiO2-Eu (a) and TiO2-La (b) samples.
Catalysts 12 00008 g009
Figure 10. TGA/DTG results for TiO2-Eu (a) and TiO2-La (b) samples.
Catalysts 12 00008 g010
Figure 11. The results of degradation of metronidazole for TiO2-Eu (a,b) and TiO2-La (c,d) systems. The photodegradation curves (a,c) were made based on the UV-Vis data, while the loss after successive hours of irradiation (b,d) was determined by the HPLC technique.
Catalysts 12 00008 g011
Figure 12. Mass spectrum of metronidazole products photodegradation.
Catalysts 12 00008 g012
Figure 13. The photo of lamp off/on, single diode off/on, and spectrum of the used COB LED.
Catalysts 12 00008 g013
Table 1. The average crystallite size, phase composition, and lattice parameters of the obtained TiO2-Eu systems.
SampleCrystallite Size (nm)Phase Composition (%)Lattice Parameters
AnataseRutileAnataseRutileAnataseRutile
a (Å)c (Å)a (Å)c (Å)
TiO28.1-100-3.780209.48188--
TiO2-0.25%Eu17.013.799.50.53.791079.522644.580452.94155
TiO2-0.5%Eu16.714.999.01.03.790819.520524.603942.97229
TiO2-0.75%Eu16.315.797.92.13.789169.519844.617822.97654
TiO2-1%Eu16.019.596.63.43.787769.517014.620142.97741
TiO2-1.5%Eu15.922.095.94.13.786159.488874.625262.97845
Table 2. The average crystallite size, phase composition, and lattice parameters of the obtained TiO2-La systems.
SampleCrystallite Size (nm)Phase Composition (%)Lattice Parameters
AnataseRutileAnataseRutileAnataseRutile
a (Å)c (Å)a (Å)c (Å)
TiO28.1-100-3.780209.48188--
TiO2-0.25%La17.110.699.30.73.791019.522524.619812.95819
TiO2-0.5%La16.911.199.10.93.788839.517084.626102.96073
TiO2-0.75%La16.912.198.02.03.787299.514844.622742.96199
TiO2-1%La16.516.397.92.13.787869.514812.960732.96241
TiO2-1.5%La16.517.297.52.53.787419.511264.623292.96435
Table 3. The results of EDXRF analysis for TiO2-La and TiO2-Eu systems.
SampleTiO2 (wt.%)Eu-Doped (wt.%)La-Doped (wt.%)
TiO2-0.25%Eu99.710.29-
TiO2-0.5%Eu99.440.56-
TiO2-0.75%Eu99.280.72-
TiO2-1%Eu98.921.08-
TiO2-1.5%Eu98.421.58-
TiO2-0.25%La99.79-0.21
TiO2-0.5%La99.40-0.60
TiO2-0.75%La99.15-0.85
TiO2-1%La98.95-1.05
TiO2-1.5%La98.55-1.45
Table 4. The parameters of the porous structure for TiO2-Eu and TiO2-La systems.
SampleABET (m2/g)Vp (cm3/g)Sp (nm)
TiO2630.2413.7
TiO2-0.25%Eu650.2412.5
TiO2-0.5%Eu670.2312.6
TiO2-0.75%Eu680.2312.3
TiO2-1%Eu690.2412.3
TiO2-1.5%Eu710.2312.2
TiO2-0.25%La670.2412.9
TiO2-0.5%La670.2413.1
TiO2-0.75%La680.2513.3
TiO2-1%La700.2613.5
TiO2-1.5%La730.2613.0
Table 5. Summary of literature data on the degradation of metronidazole.
SampleMetronidazole
Concentration
(mg/dm3)
Amount of
Photocatalyst
(mg/100 cm3)
Degradation
Efficiency (%)
Irradiation
Time
(min)
Type and Power of the Light SourceLiterature
TiO2-0.25%Eu
TiO2-0.25%La
2010099180UV-LED (20 W)this work
BiVO4-FeVO4102009190Xe-lamp
(500 W)
[77]
Ag-CdS1510095120Hg-lamp
(125 W)
[78]
ZnO80150097180Hg-lamp
(125 W)
[79]
TiO2-Fe3+8050097120Hg-lamp
(125 W)
[80]
D-g-C3N4-Bi5O7I158080360Xe-lamp
(300 W)
[81]
TiO2-Fe3+20150050-Hg-lamp
(100 W)
[82]
TiO28030095180Hg-lamp
(125 W)
[15]
Ag/ZnO101008030Xe-lamp
(300 W)
[83]
Table 6. Electricity consumption and electricity costs for UV-LED lamps and a high-pressure mercury lamp.
Type of LampPower of Lamp
(W)
Power
Consumption Per Hour (kWh)
Power
Consumption
Per Year
(kWh)
Cost of Electricity Consumed Assuming Continuous Operation for 365 Days (EUR) *
UV-LED200.02118440
Hg high-pressure1500.1951708374
* Calculations of the cost of consumed electricity based on Eurostat data (1 kWh = 0.219 EUR).
Publisher’s Note: MDPI stays neutral with regard to jurisdictional claims in published maps and institutional affiliations.

