Article

Coke Deposition and Structural Changes of Pellet V2O5/NaY-SiO2 in Air Regeneration: The Effects of Temperature on Regeneration

1
Department of Safety, Health and Environmental Engineering, National Yunlin University Science and Technology, Yunlin 640301, Taiwan
2
Department of Chemical Engineering, National Chung Cheng University, Chia-Yi 621301, Taiwan
3
National Synchrotron Radiation Research Center, Hsinchu 30076, Taiwan
*
Authors to whom correspondence should be addressed.
Catalysts 2022, 12(1), 95; https://doi.org/10.3390/catal12010095
Submission received: 14 December 2021 / Revised: 4 January 2022 / Accepted: 10 January 2022 / Published: 14 January 2022

Abstract

:
V2O5/NaY-SiO2 adsorbents were prepared by soaking up vanadium oxalate precursors into pellet NaY-SiO2. The NaY-SiO2 supports were prepared from NaY-SiO2 dough followed by extrusion and calcination at 450 °C. Ethanol was used as a model adsorbate to test the performance of the adsorbents. The regeneration efficacy, defined as the ratio of the adsorption capacity of a regenerated adsorbent to that of the fresh adsorbent, was investigated through the dynamics of fixed-bed adsorption (breakthrough curve). TPO, DSC, and FT-IR were used to characterize carbonaceous species on the adsorbents; meanwhile, synchrotron XRPD, XAS, and the N2 isotherm were used to characterize the zeolite, vanadia structure, and surface area, respectively. The results indicated that in low temperature (300 °C) regeneration, adsorption sites covered by alkylated aromatic coke formed during regeneration, causing adsorbent deactivation. In contrast, during regeneration at a high temperature (450 °C), the deactivation was caused by the destruction of the NaY framework concomitant with channel blockage, as suggested by the BET surface area combined with Rietvelt XRPD refinement results. In addition, the appearance of V-O-V contribution in the EXAFS spectra indicated the aggregation of isolated VO4, which led to a decrease in the combustion rate of the carbonaceous species deposited on the adsorbents. For regeneration at 350 and 400 °C, only trace coke formation and minor structural destruction were observed. Long-term life tests indicated that regeneration at 400 °C presents a higher maintenance of stability.

1. Introduction

The waste gas streams from chemical processes, electro-optical industries, and semiconductor manufacturing plants often involve volatile organic compounds (VOCs) [1,2]. For VOC abatement, either the capture or the destruction of the pollutants can be used. When these compounds need to be recovered, condensation, absorption, or adsorption/desorption should be chosen [3,4]. Otherwise, concentrator/incinerator systems with either thermal or catalytic oxidation are commonly used [4,5,6,7].
Since a certain amount of energy is required to overcome the oxidation activation energy when treating low VOC concentration streams using a concentrator/incinerator, the system involves three steps to reduce the required energy [8]. In the first step, VOC-containing air is passed through a cooler, where the VOCs are removed by adsorption at a low temperature. The VOC-laden adsorbents are then regenerated by passing a small amount of hot air to generate a VOC concentrated stream. Finally, the VOCs are converted to innocuous CO2 in an additional catalytic oxidation bed. The heat generated during oxidation is used to preheat the incoming gas stream for the desorption of VOCs, thereby reducing the auxiliary fuel and thus the fuel cost.
The three-step process can be simplified into an adsorption/catalytic oxidation process using catalytic adsorbents [9,10,11]. Two fixed-bed reactors, one for adsorption and the other for regeneration, are employed in this process, where VOCs are continuously removed from the effluents and the adsorbed VOCs are converted to benign carbon dioxide and water [9,10]. Compared to the conventional three-step process, the integrated process is low in construction, operation, and maintenance costs; however, air-combustion regeneration of VOC-laden adsorbents is necessary. Hence, the adsorbent used in the process should have a dual function, allowing rapid adsorption and complete oxidization of the adsorbed compounds at modest temperatures. In addition, the thermal stability of the catalytic adsorbents should be high enough to allow repeated adsorption and regeneration cycles [10].
Zeolite adsorbent is commonly used in the three-step process. During the adsorption of organic compounds on zeolite, the concentrator is operated at room temperature and desorption occurs at a temperature between 150 to 300 °C [12,13]. When zeolite adsorbent is used in the integrated system, desorption of the compounds adsorbed from the adsorbents below 300 °C does not cause any significant destruction of the zeolite. However, coke precursors can be formed from the adsorbed compounds that cannot be desorbed and oxidized readily at that temperature [14]. These coke precursors accumulate in the zeolite pores and convert to less reactive hard coke, decreasing the adsorption capacity. A rather high temperature is needed to burn this hard coke, which causes zeolite destruction [15,16]. Adding active sites, such as noble metal or transition-metal oxides, to zeolite significantly decreases the activation barrier of oxidation reaction and thus minimizes coke formation [17,18,19,20]. This kind of catalytic adsorbent can be used in the integrated process. However, it is crucial to ensure that these catalytic adsorbents maintain their oxidation activity and adsorption capacity after long-term adsorption regeneration cycles.
In air regeneration of VOC-laden adsorbents, the flow rate must be sufficient to supply enough oxygen to convert the adsorbed compounds to CO2, remove heat generated in the reaction, and decrease the mass transfer resistance [15]. The regeneration temperature must be high enough to overcome the activation energy barrier for combustion [15,17,19]; however, it cannot be high enough to cause zeolite destruction and active site sintering [21]. Noble metals, such as Pt and Pd, that have high oxidation activity [17,22] are suitable for preparing catalytic adsorbents. Previous experimental results indicated that there were no significant carbonaceous species left after the regeneration of NaY-supported Pt adsorbent at 300 °C [15]. However, the high cost of Pt and its high sensitivity to Cl2, HCl, sulfur-containing compound, and CO [15,23] motivated us to prepare the catalytic adsorbents using cheap transition-metal oxides.
First-row transition metal oxides are active for VOC catalytic oxidation; however, their activity is lower than that of the noble metals [23,24,25,26]. Due to the lower activity, the catalytic adsorbent should be prepared with high loading and high dispersion. Notwithstanding, vanadia, which has only moderate activity among these transition metal oxides, was chosen because the preparation of highly dispersed catalysts has been previously reported [27]. With proper operating temperatures in regeneration and adequate temperature control, the performance of vanadia adsorbents may be comparable to that of noble metal adsorbents.
In addition to its role in the primary emission of ethanol-fueled vehicles and the fermentation process, ethanol was chosen as a model adsorbate because the carbonaceous species (coke and its precursors) formed in its regeneration [15] allowed us to study the effects of coke formation on adsorbent regeneration. The carbonaceous species are formed from the dehydration of ethanol and the cracking of ethanol derivatives, followed by polymerization and aromatization reactions [15,28]. The addition of vanadia to NaY-SiO2 could promote ethanol oxidation, thereby decreasing coke formation. However, the effectiveness of the vanadia addition and how high of a temperature the vanadia adsorbents (V2O5/NaY-SiO2) can stand are still unclear; at a too high a regeneration temperature, the exothermic heat may destroy the zeolite framework and induce V2O5 aggregation [16,29,30]. Long-term cycle aging test results, combined with a study of the relation between regeneration temperature, adsorbent structure, and regeneration efficacy, helped us to reach our research goal of exploring the optimal regeneration temperature.
Breakthrough curves were used to characterize the adsorption properties of the vanadia adsorbents. Cycled aging tests were used to evaluate the regeneration efficacy of the ethanol-laden adsorbents. The carbonaceous species on the vanadia adsorbents were characterized by DRIFT (diffuse-reflectance infrared Fourier transform) spectroscopy. The changes in vanadia morphology during regeneration was characterized by EXAFS (extended X-ray absorption fine structure) spectroscopy. The destruction of zeolite crystals due to Al3+ cation dislodgement and the surface area was characterized by synchrotron XRPD (X-ray powder diffraction) and the N2 isotherm. The cycled aging tests and the structure characterization results allowed us to rationalize the effects of air regeneration on the vanadia and zeolite morphology change and optimize the regeneration conditions.

2. Results and Discussion

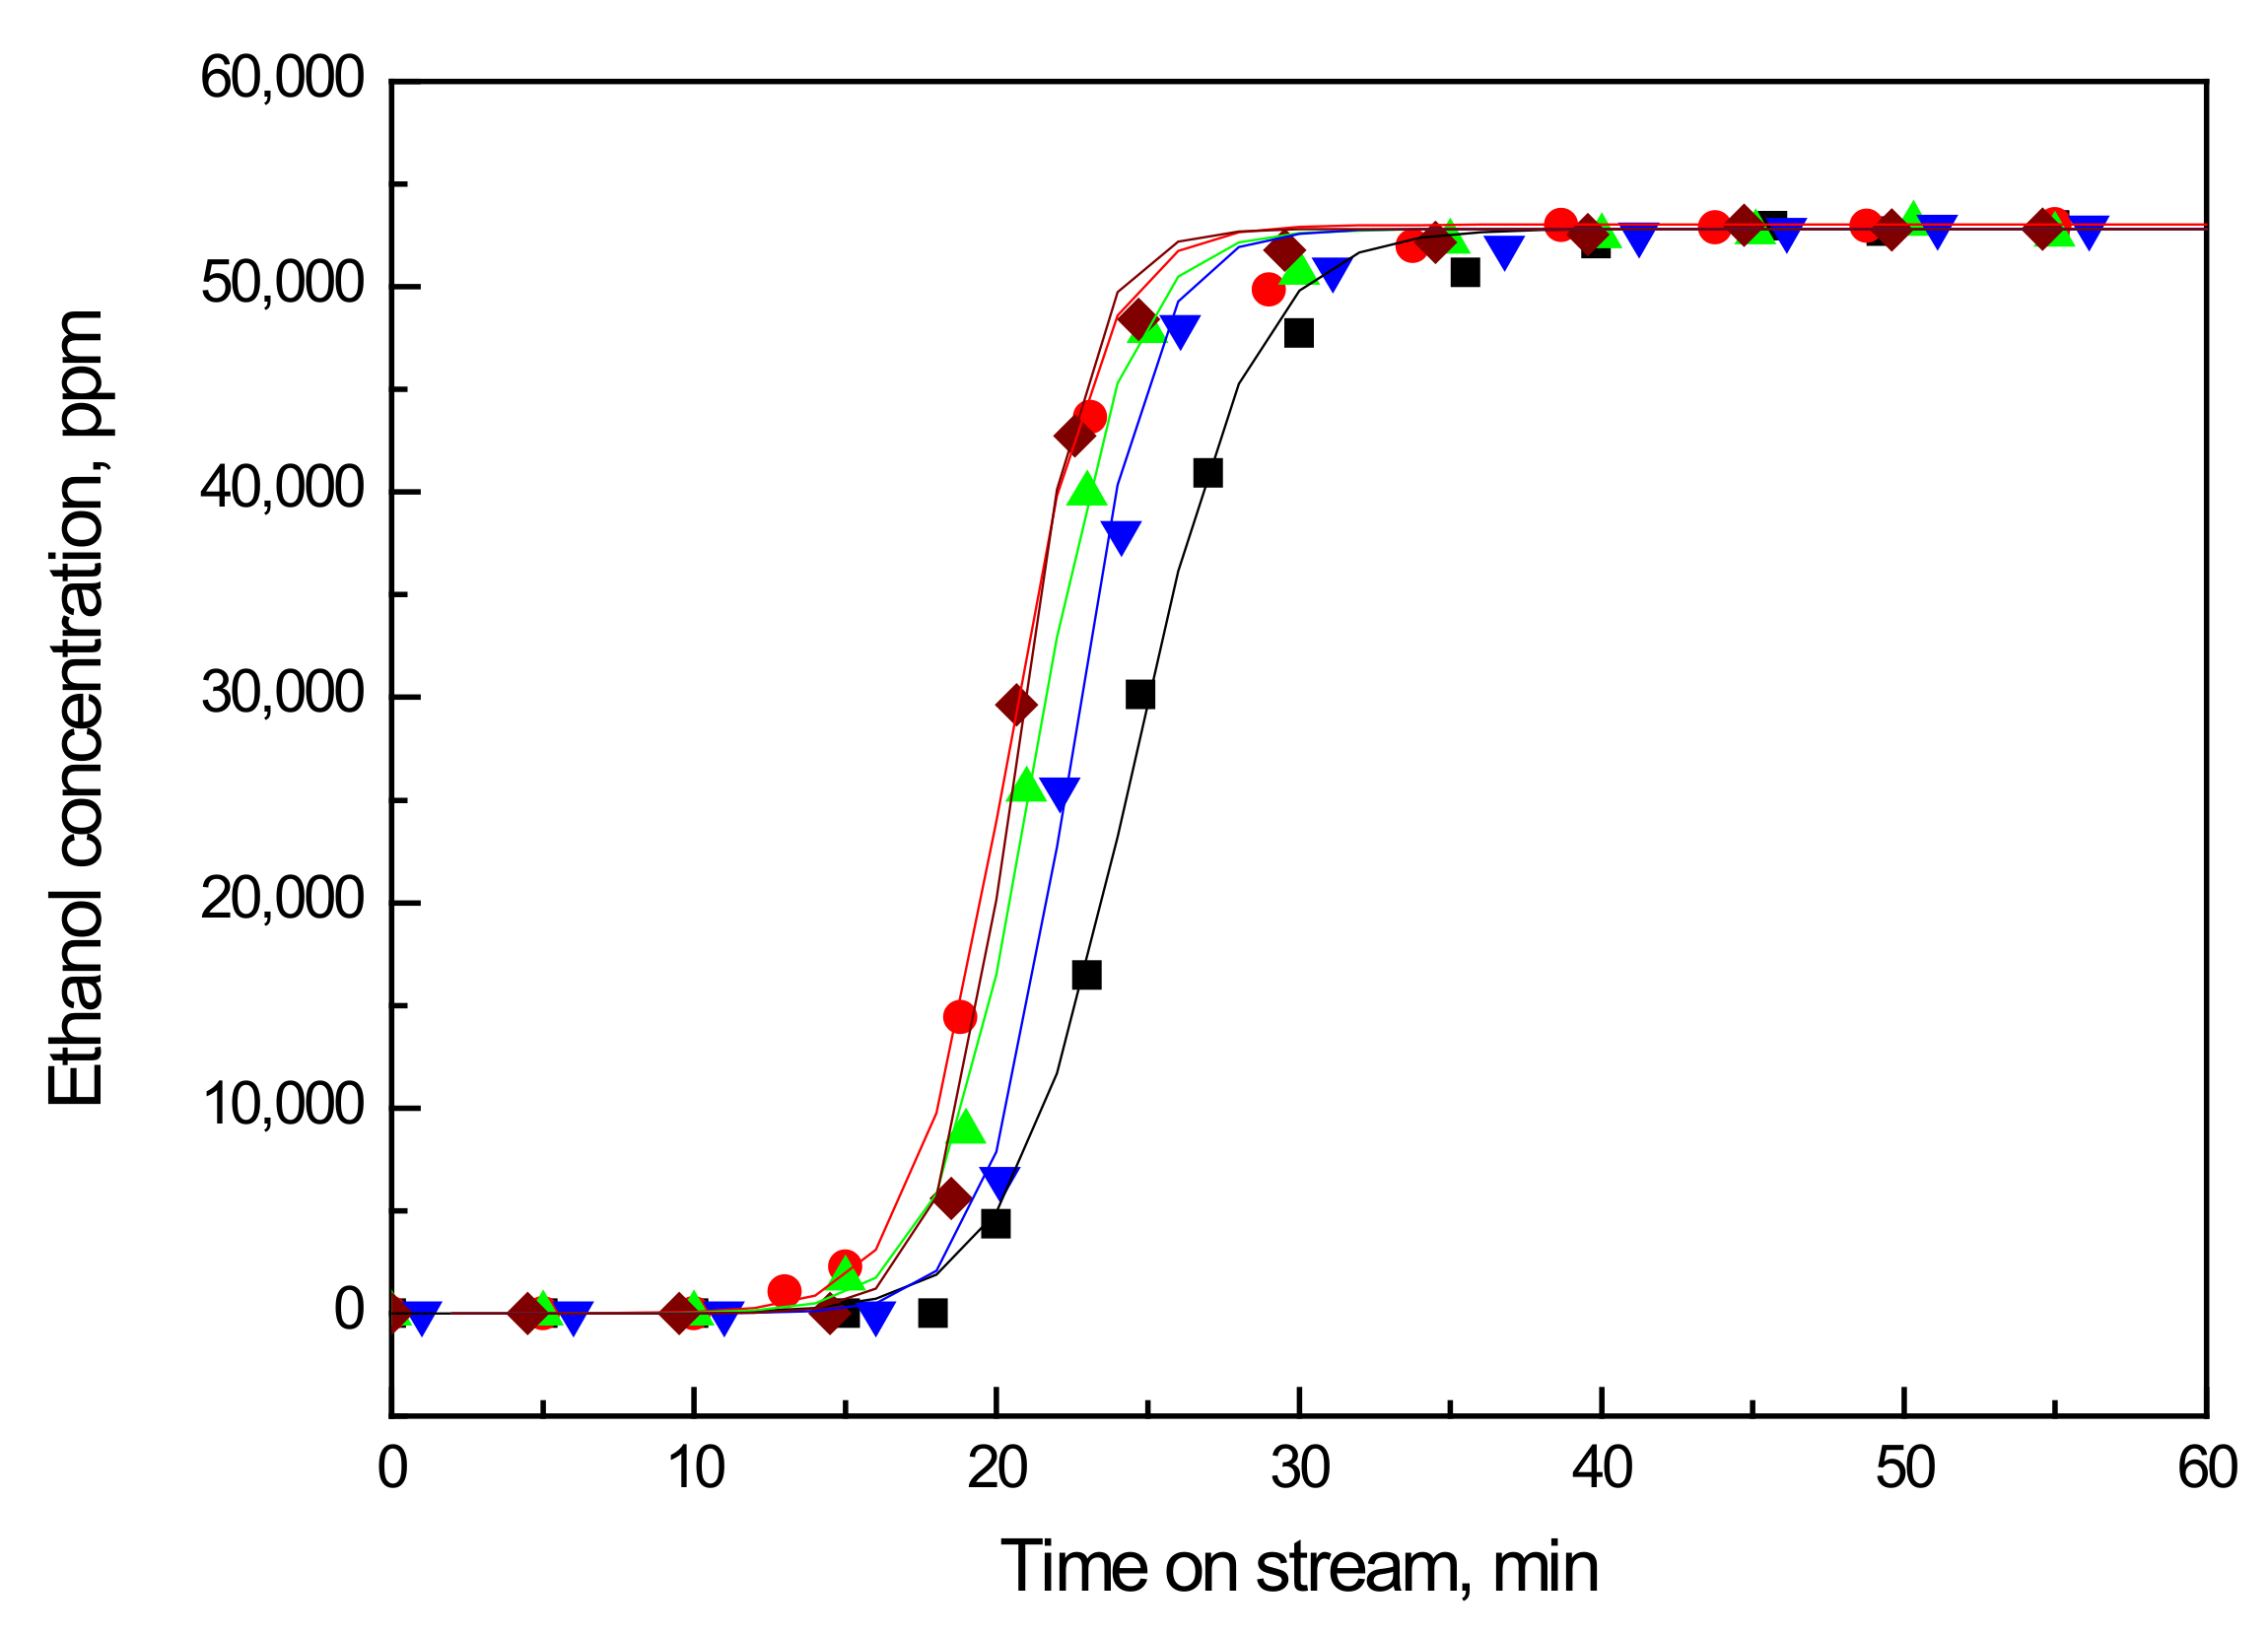
2.1. Breakthrough Curve of the Fresh and Air Regenerated Vanadia Adsorbents

A plot depicting the effluent concentration as a function of time on stream is called a breakthrough curve. During the dynamics of fixed-bed adsorption, an active adsorption zone is formed and moves along the adsorption bed. The adsorption zone length is related to the mass transfer rate of adsorbates from the gas stream to the adsorbent. For adsorption with a lower mass transfer resistance, the adsorption zone becomes narrow, and a steep breakthrough slope will be observed. In contrast, the adsorption zone is broad for a strong mass transfer-controlled adsorption, and the breakthrough curve is gradual incline [5].
The adsorption capacity and the mass transfer rate of a breakthrough curve can be roughly estimated by integrating the area above the breakthrough curve and observing the slope of the breakthrough curve, respectively. The breakthrough curves for the fresh vanadia adsorbent (Vf) and the air regenerated ethanol-laden adsorbents (Vreg) are shown in Figure 1. The adsorption capacity decreased in the order of Vf > Vr400 > Vr350 > Vr450 > Vr300, while the steepness decreased in the order of Vr450 > Vr400 ≥ Vr350 ≥ Vr300 > Vf.
For the semi-quantitative estimation of the adsorption capacity and mass transfer effects, a model for the breakthrough curves was formulated as [31,32]:
C L , t C 0     exp τ t exp ξ + e x p τ t ,     ξ = η k a q 0 L b   u s   ,     τ = η k a C 0
In Equation (1), us (cm/s) is the interstitial velocity, t (min) is the time on stream, ka (1/min) is the adsorption constant, C (ppm) is the adsorbate concentration in bulk flow, C0 (53,000 ppm, 63 mg/L) is the inlet adsorbate concentration, ρb is the bulk density of the catalyst bed (0.75 g/cm3), L (cm) is the length of adsorption bed, and q0 (mg adsorbate/g adsorbent) is the adsorption capacity.
A nonlinear least-square method was used to estimate the parameters ξ and τ in Equation (1), and the results are summarized in Table 1. The relative effectiveness factor (η/ηvf) and q0 were used to assess the diffusion resistance and total adsorption sites, respectively. The trend of q0 for the five samples was consistent with that estimated by the integration method. Since the desorption and air oxidation rate of the adsorbed ethanol was expected to increase with the regeneration temperature, the regeneration efficacy (adsorption capacity, q0) of the regenerated samples (Vrs) was increased with temperature up to 400 °C. The rapid decrease in q0 for Vr450 could be due to the destruction of the zeolite structure.
In the pellet vanadia adsorbents, mesopores with a radius of 20 Å to 500 Å are interconnected to micro-pores inside zeolite crystals [31]. The mesoporous structure is composed of the interstices between NaY zeolite particles that are bound by the silica binder [31]. During the dynamic adsorption tests, besides the adsorption inside the zeolite cages, adsorption equilibrium also occurs outside, including at the external surface of zeolite crystals, the interconnected pores, and the amorphous silica-alumina formed from the reaction of NaY zeolite debris with the silica gel [31,33]. The diffusion resistance for inside crystal adsorption is much higher than for outside. The abrupt increase in the effective diffusivity for Vr450 indicates more adsorption sites were deactivated inside crystal than outside. The results suggest that high-temperature regeneration results in the destruction of the zeolite structure. Still, the semi-empirical model for breakthrough curves is simplified, as other factors may also affect the profiles [34]. Therefore, XRPD measurements were used to confirm the destruction of the NaY framework of Vr450.

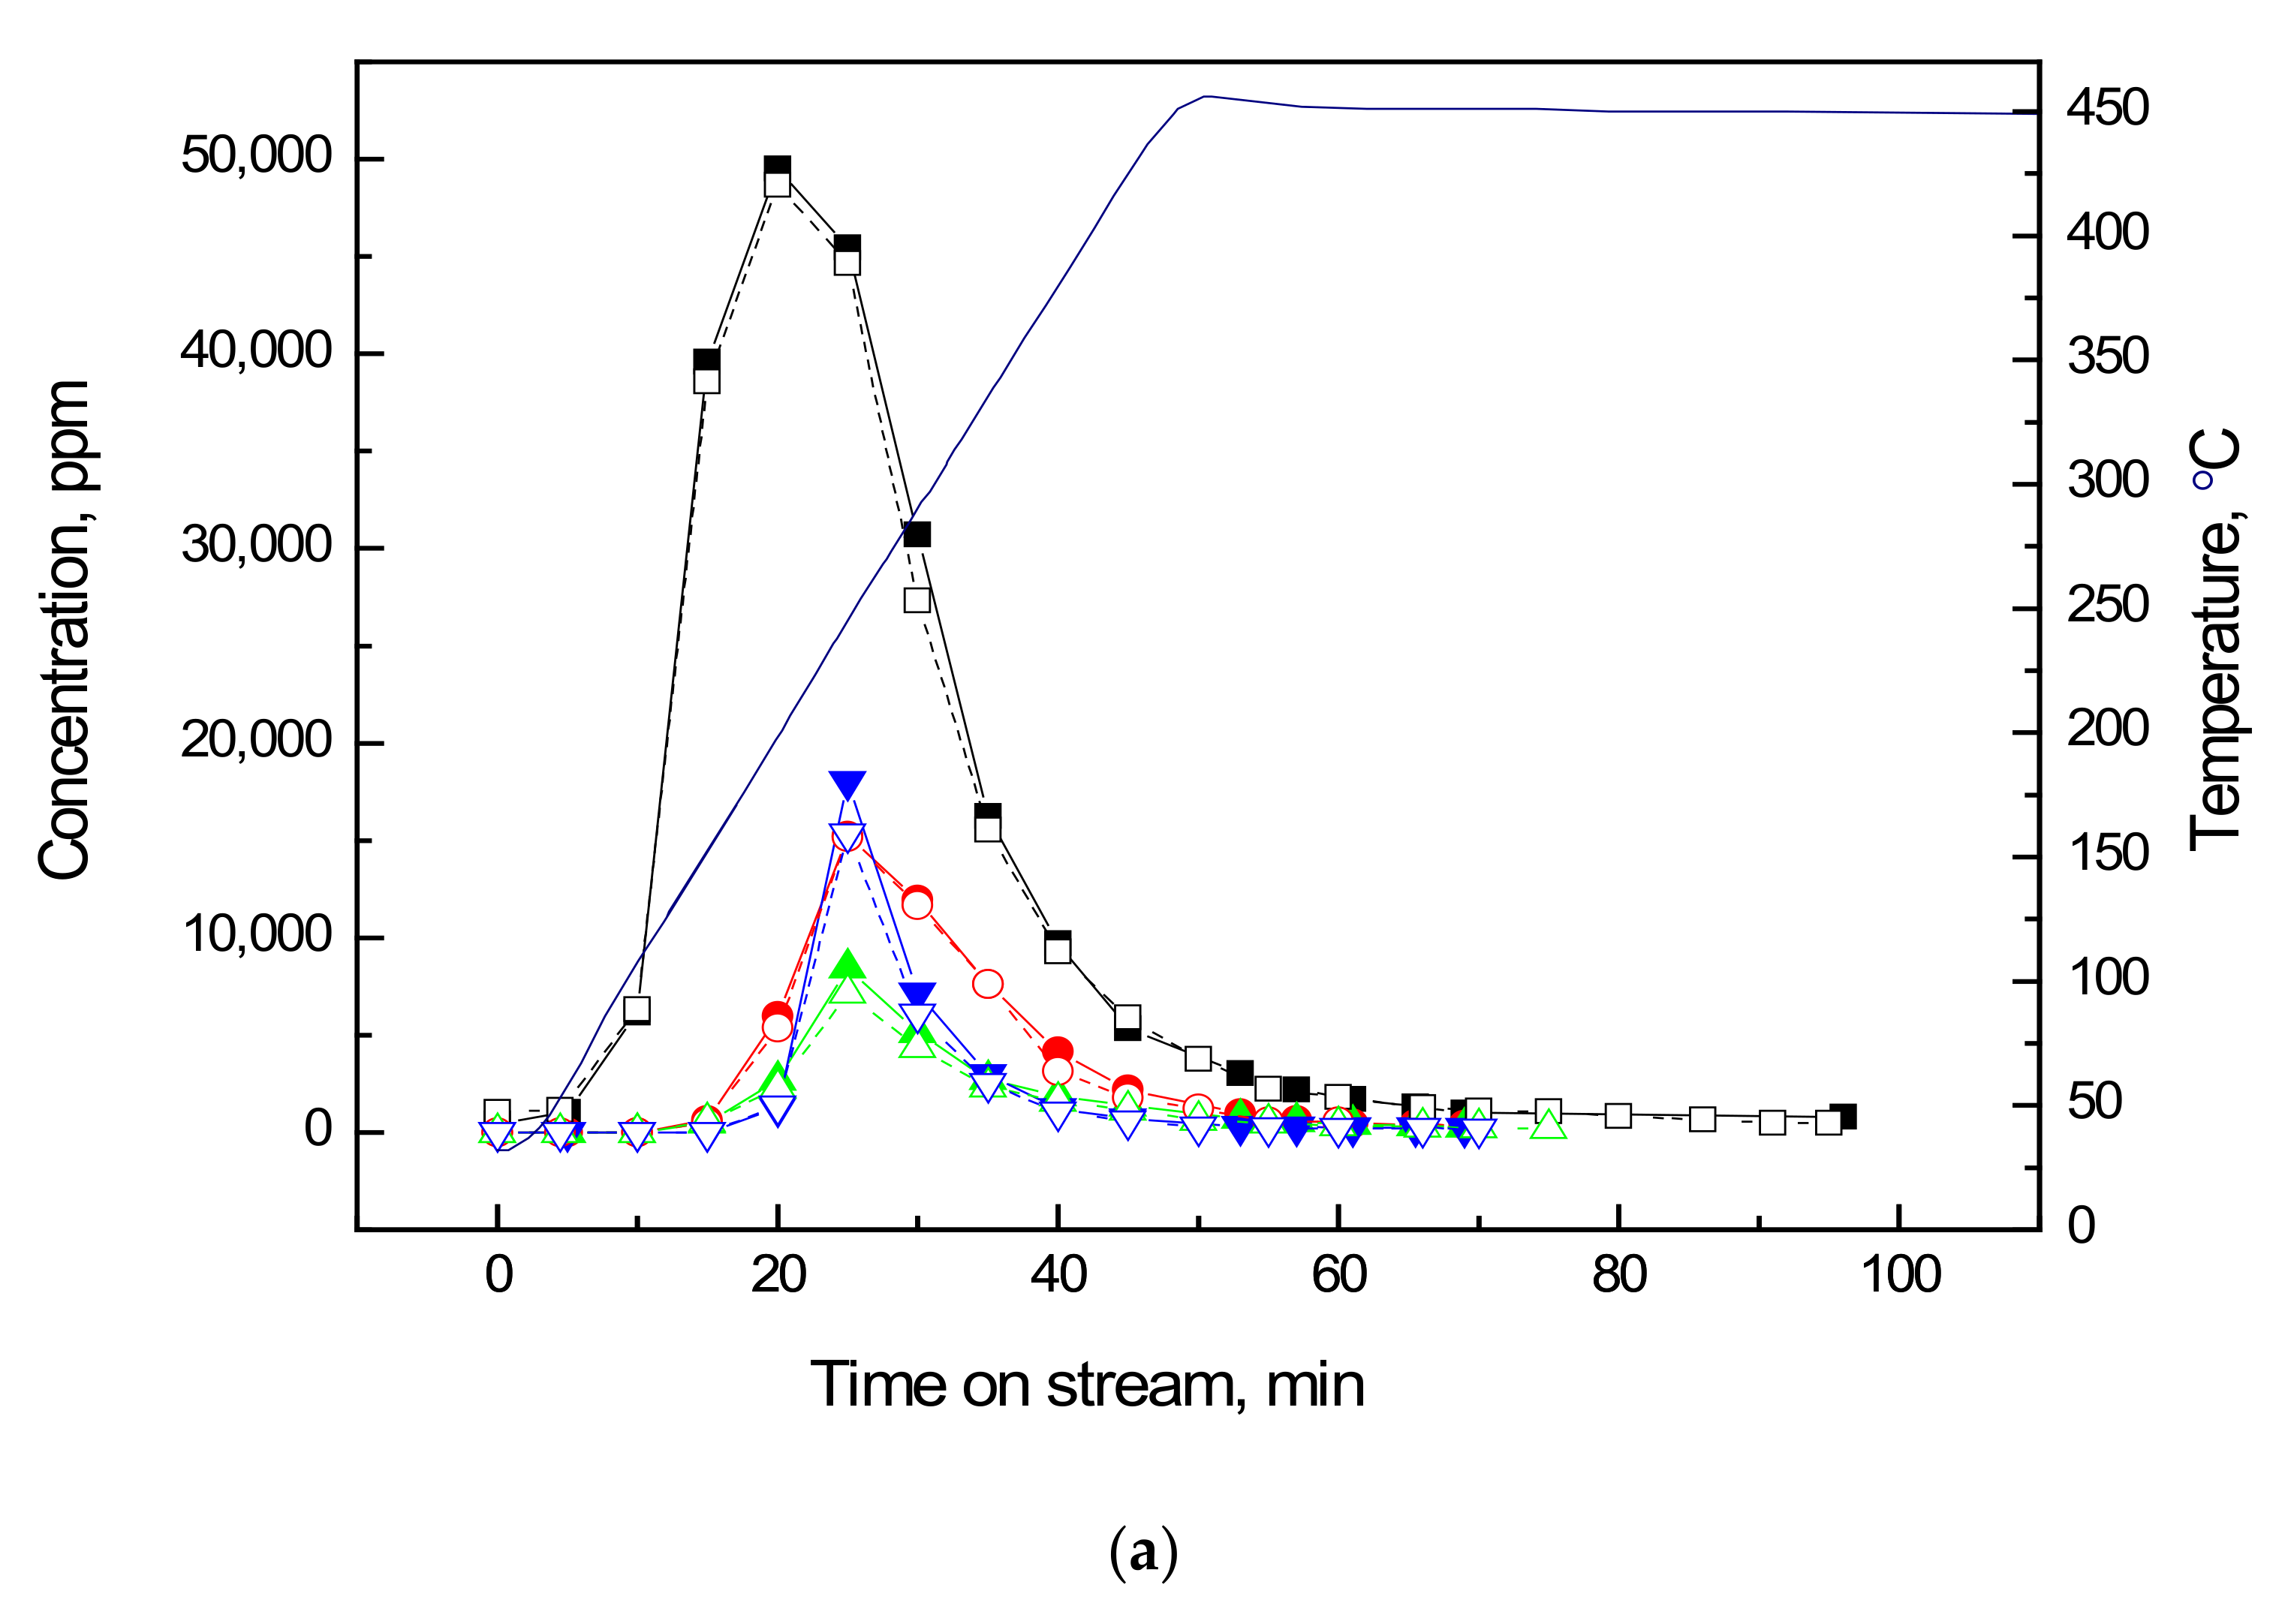
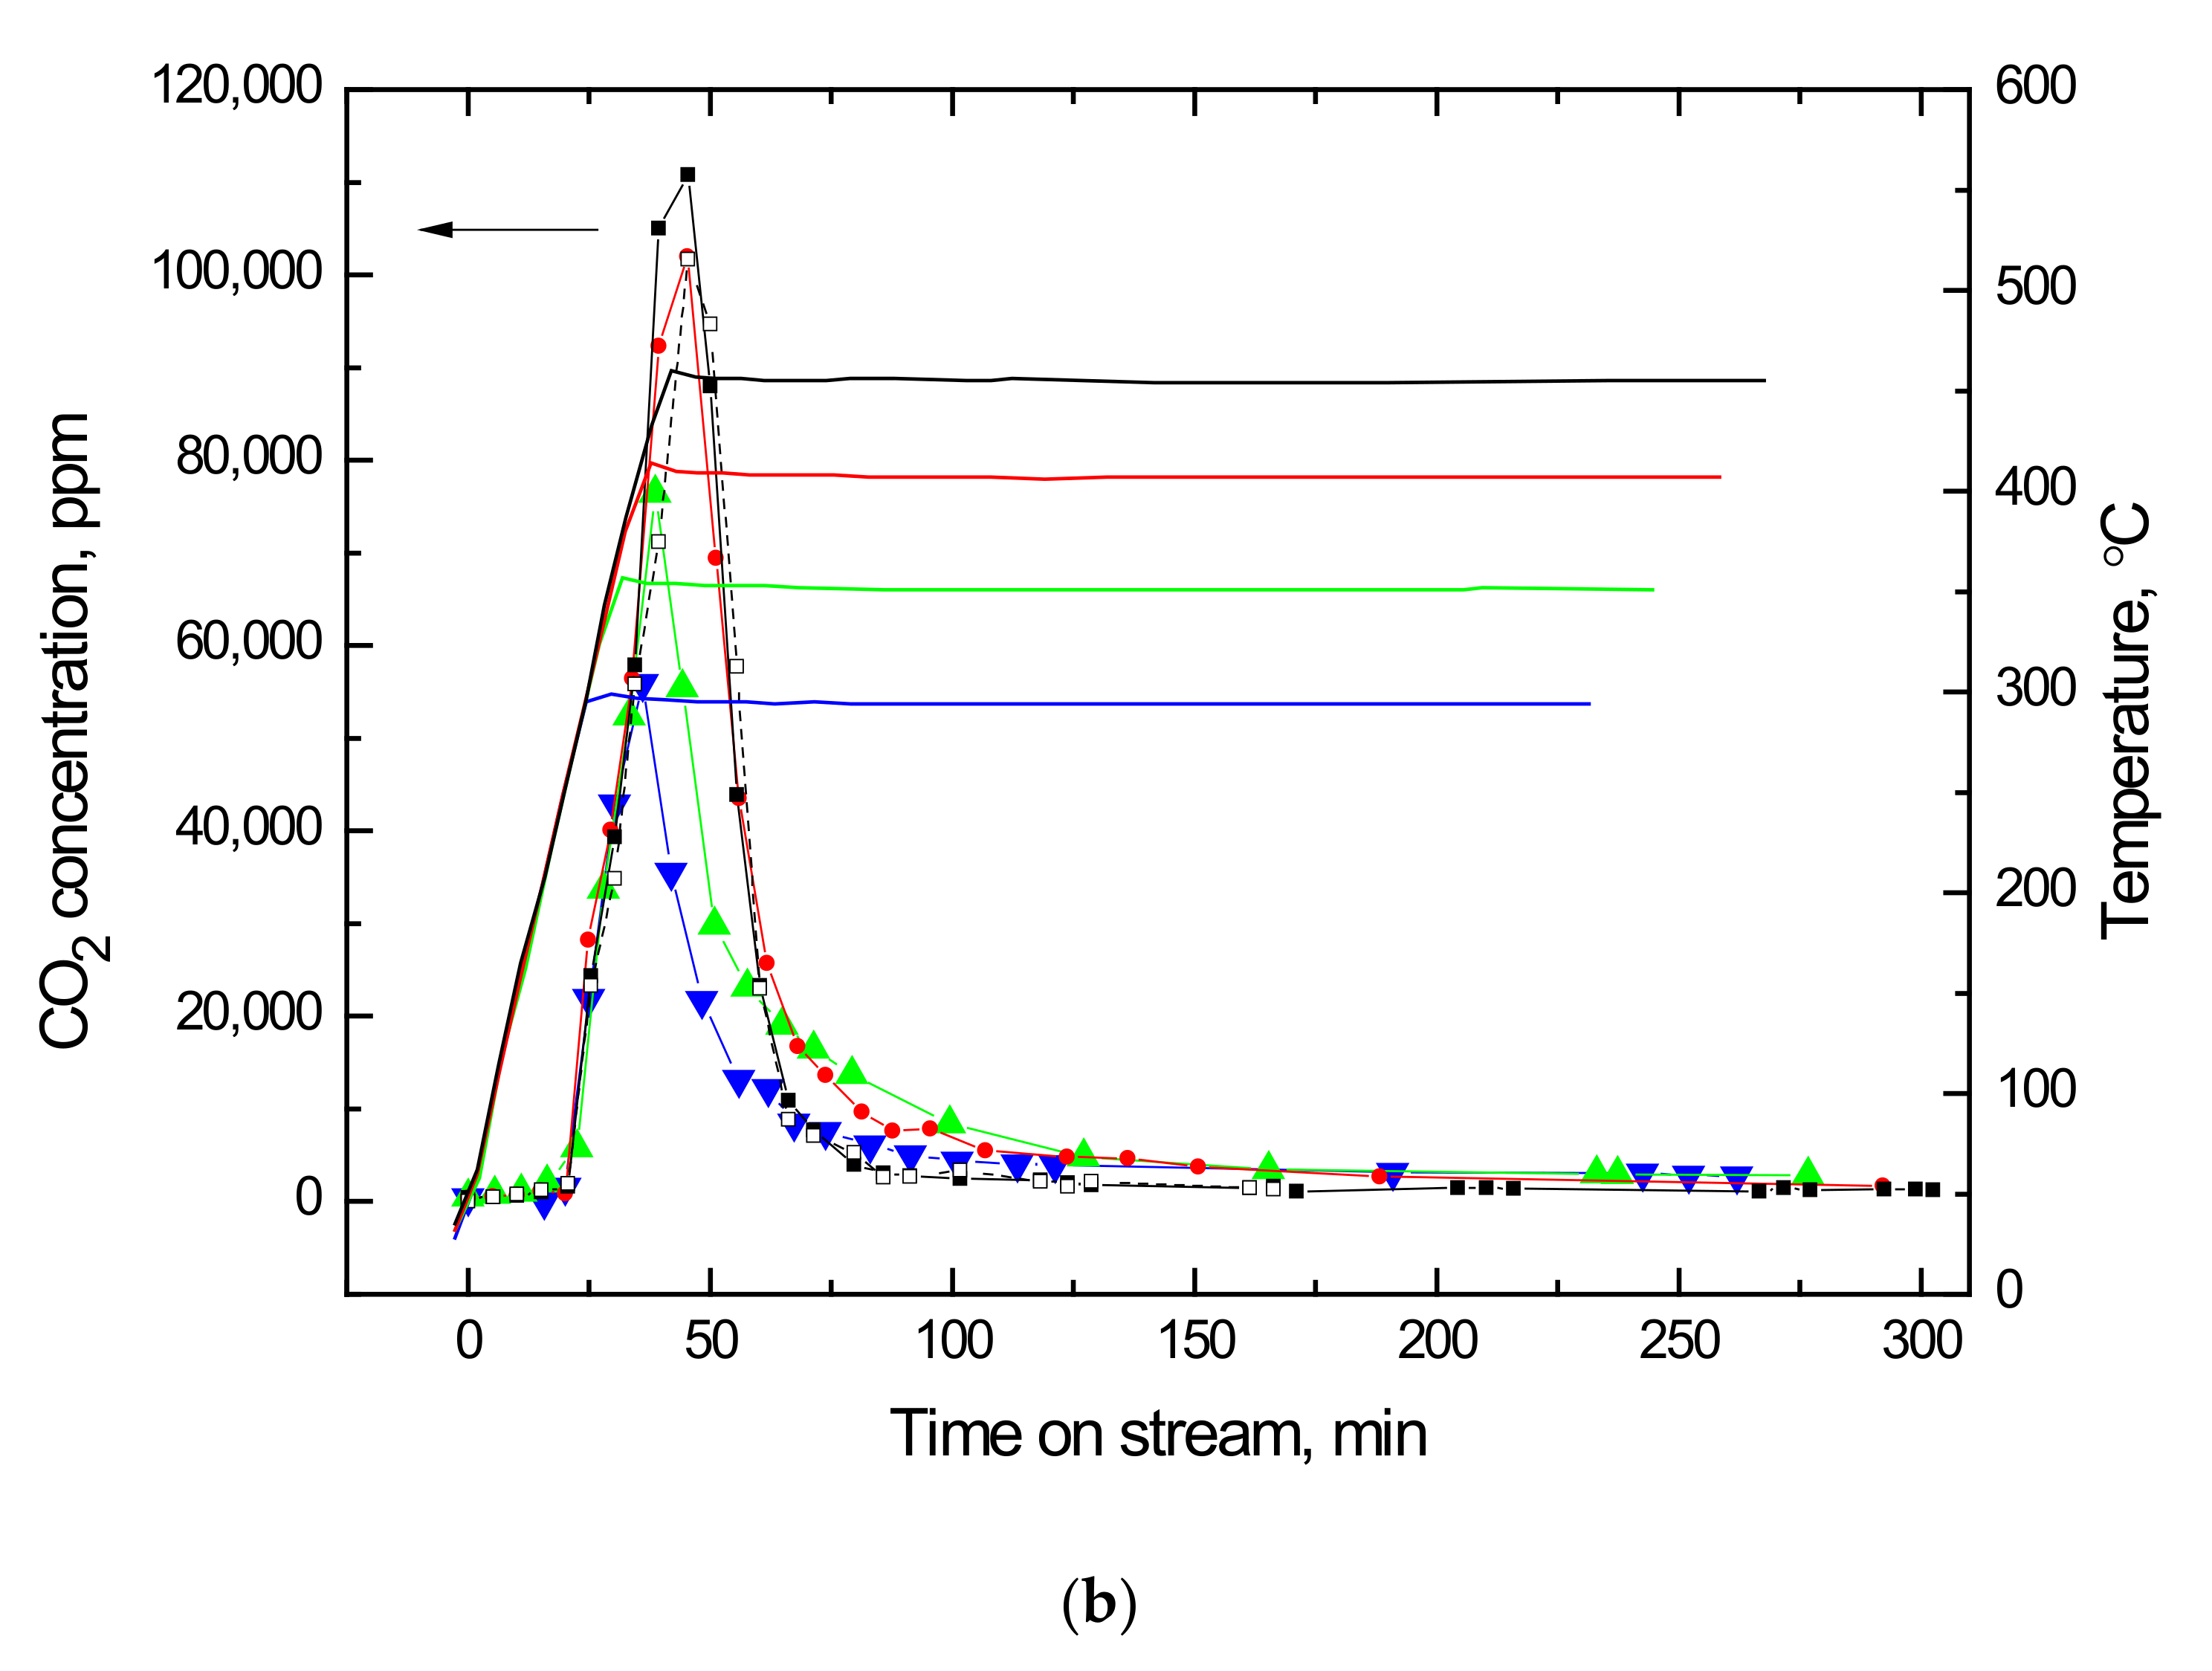
2.2. Temperature Programmed Oxidation (TPO) of Ethanol-laden Vanadia Adsorbents

In air regeneration of ethanol-laden vanadia adsorbents, total oxidation, partial oxidation, dehydration, and desorption of the adsorbed ethanol are competitive reactions. The dehydration of ethanol is the primary reaction that occurs over NaY-SiO2 [35,36]. During adsorption, an ethanol intermediate (C2H5OH2δ+) is formed by the adsorption of ethanol on the acid site [35]. The intermediate can be decomposed during the regeneration, concomitant with acid site recovery, to form ethylene and water besides desorption. The intermediates can also react with oncoming ethanol to form diethylether (DEE) [35,36].
Ethylene is a coke precursor, and the adsorption sites blocked by coke decrease adsorption capacity. The increasing effective diffusivity after regeneration (Table 1) for Vreg suggests that the oligomers and coke formed in regeneration may be trapped in the zeolite cages. This ship-in-a-bottle process involves several sequential steps: the diffusion of ethanol into the zeolite pore, dehydration of ethanol to form ethylene, oligomerization of ethylene, and cyclization followed by aromatization to form hard coke via hydrogen transfer [37,38].
As shown in Figure 2a, the ethanol desorbed at about 200 °C, while the dehydration products, diethylether (DEE) and ethylene, evolved at about 250 °C. The acetaldehyde that evolved at about 285 °C could be formed from the catalytic oxidative de-hydrogenation of ethanol. For non-oxidative dehydrogenation, a higher temperature (400 °C) is needed [39].
The CO2 evolved profile for ethanol-laden V2O5/NaY-SiO2 regenerated at a temperature up to 450 °C (Vr450) is shown in Figure 2b. The shoulder that appeared at low temperature (about 380 °C) could be attributed to the combustion of oligomers derived from ethylene, DEE, and acetaldehyde, while the peak at 430 °C could be assigned as the coke combustion peak. CO could be formed in the temperature-programmed oxidation of the ethanol-laden V2O5/NaY-SiO2; however, its concentration was too low (<20 ppm) to be detected by FT-IR. A very small amount (<100 ppm) of acetals (1,1-diethoxyethane), which formed by the reaction of ethanol with acetaldehyde, were also detected. The species formed in the TPO measurement are tabulated and shown in Table 2.
For Vr300 and Vr350, no characteristic peak for coke burning was observed because the regeneration temperature was too low to burn off the coke. DSC and FTIR were further used to characterize the carbonaceous species formed in these samples to confirm the TPO peak assignments.

2.3. Causes of Activity Loss during Low-Temperature Regeneration

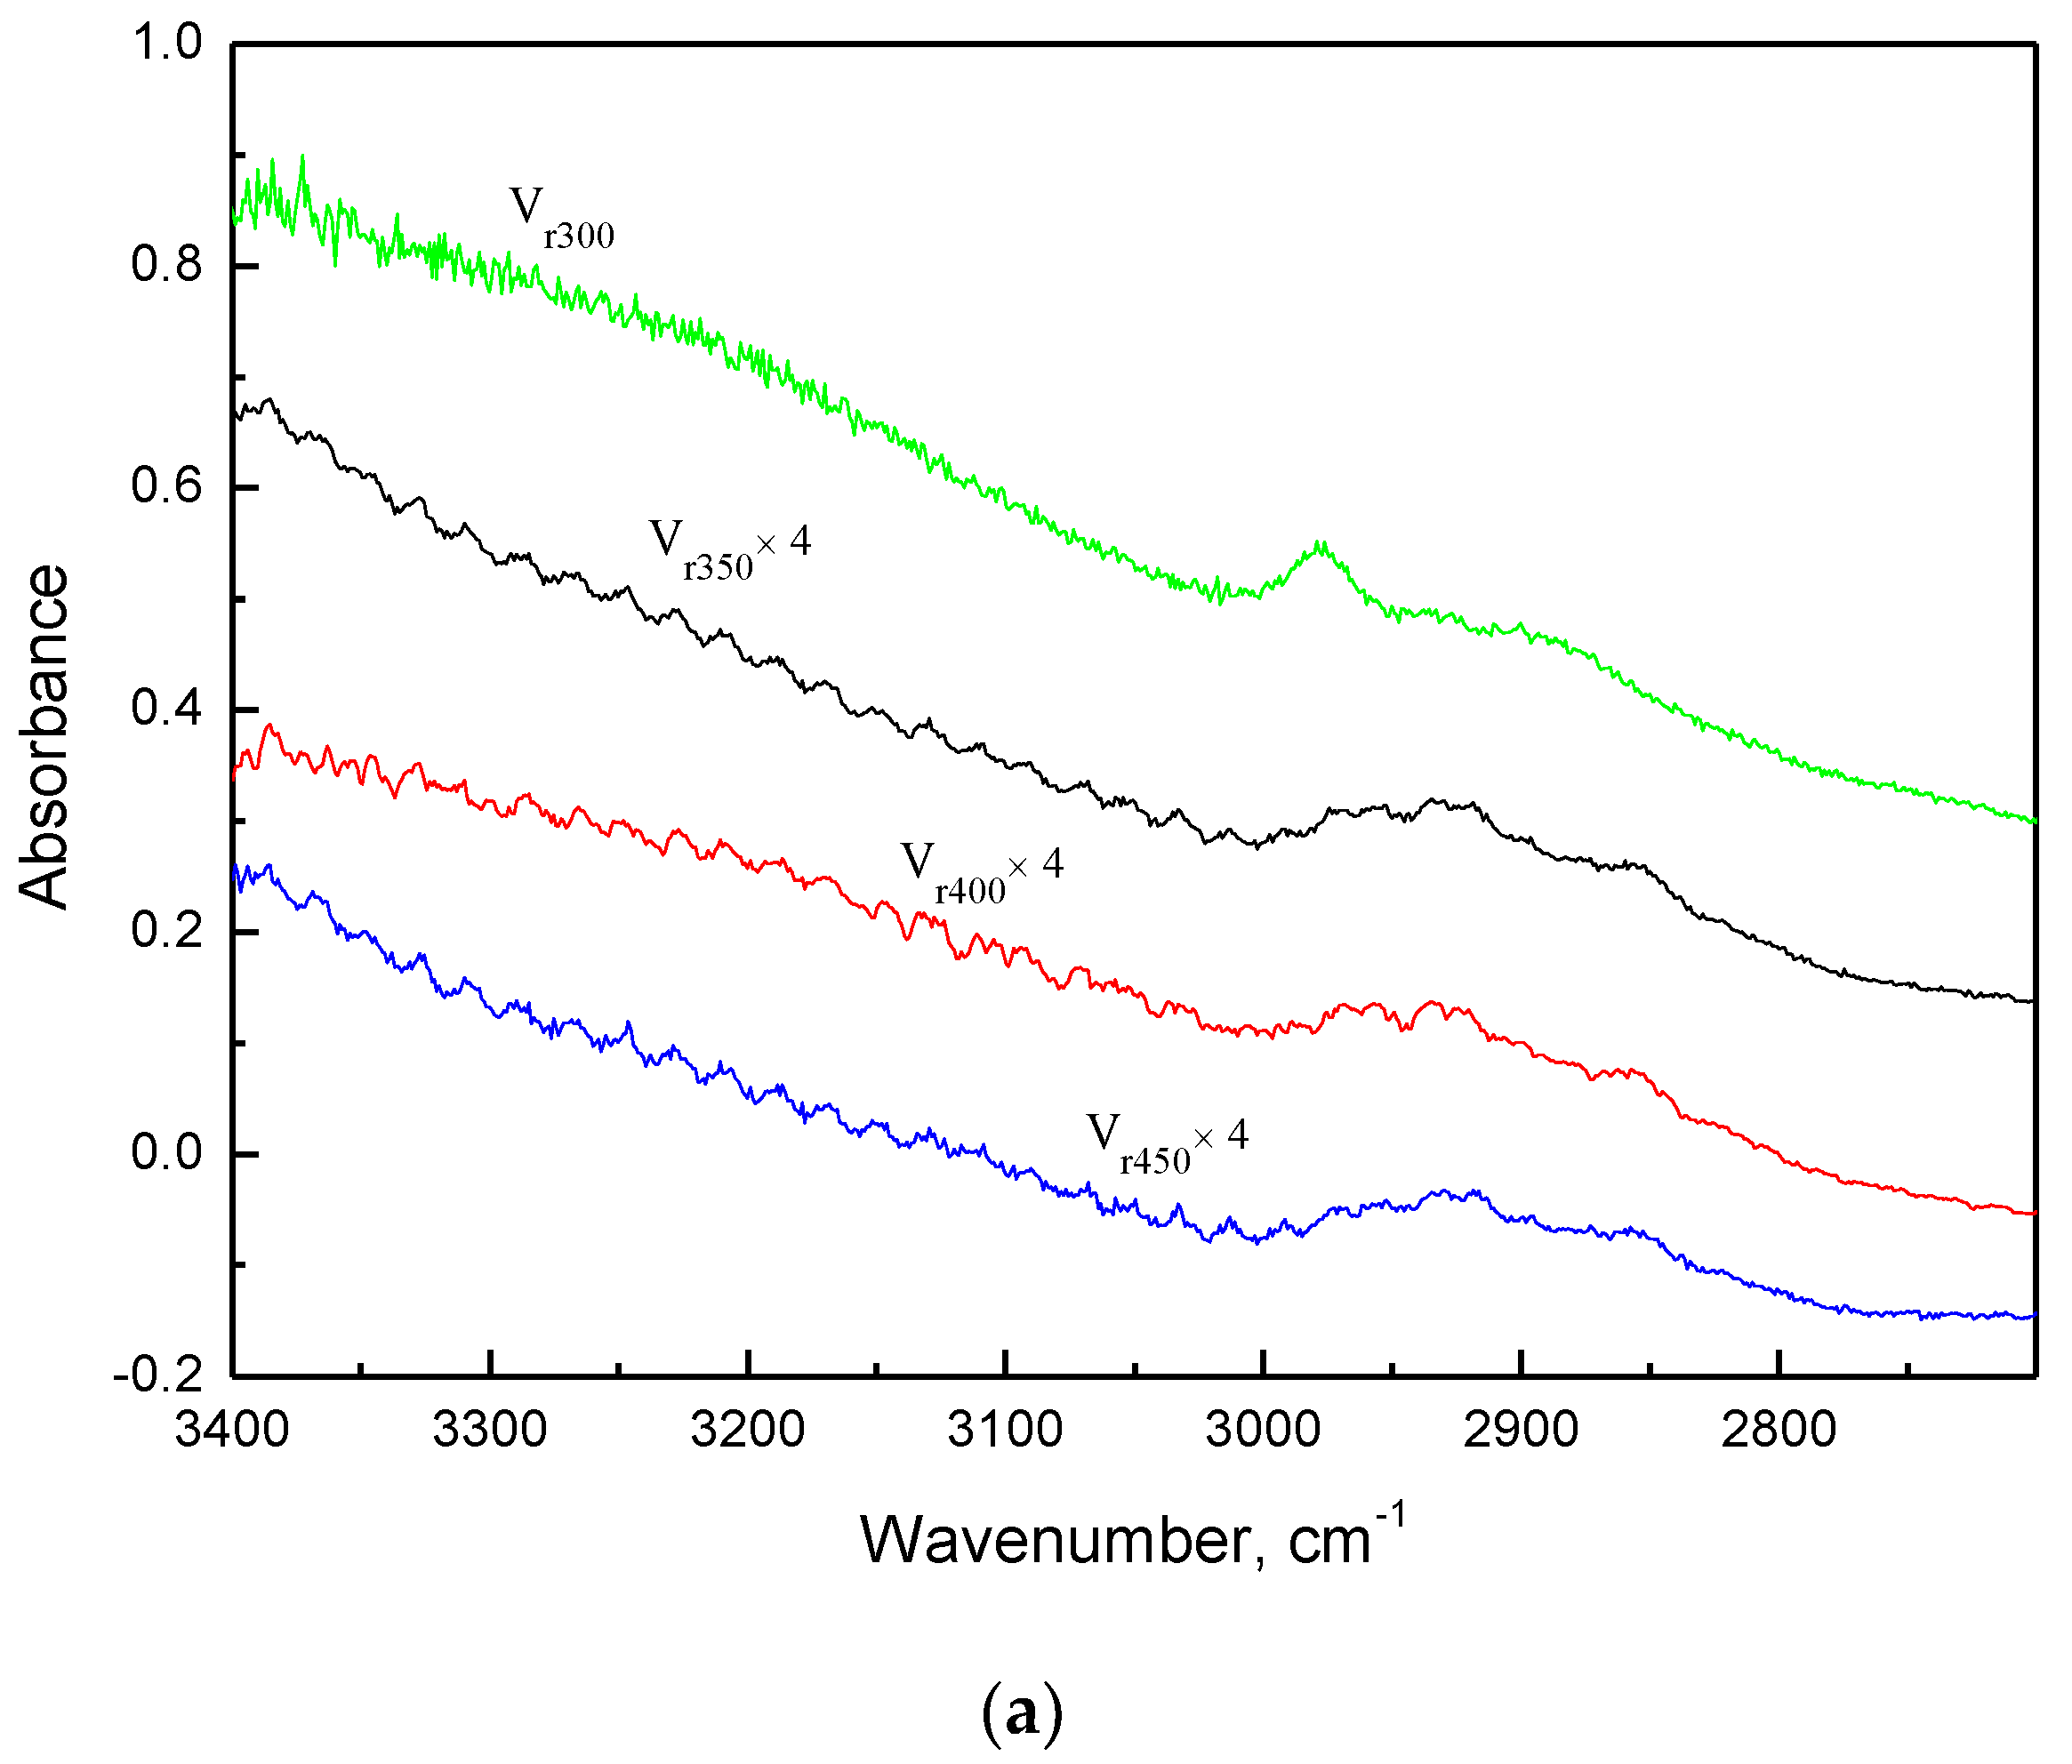
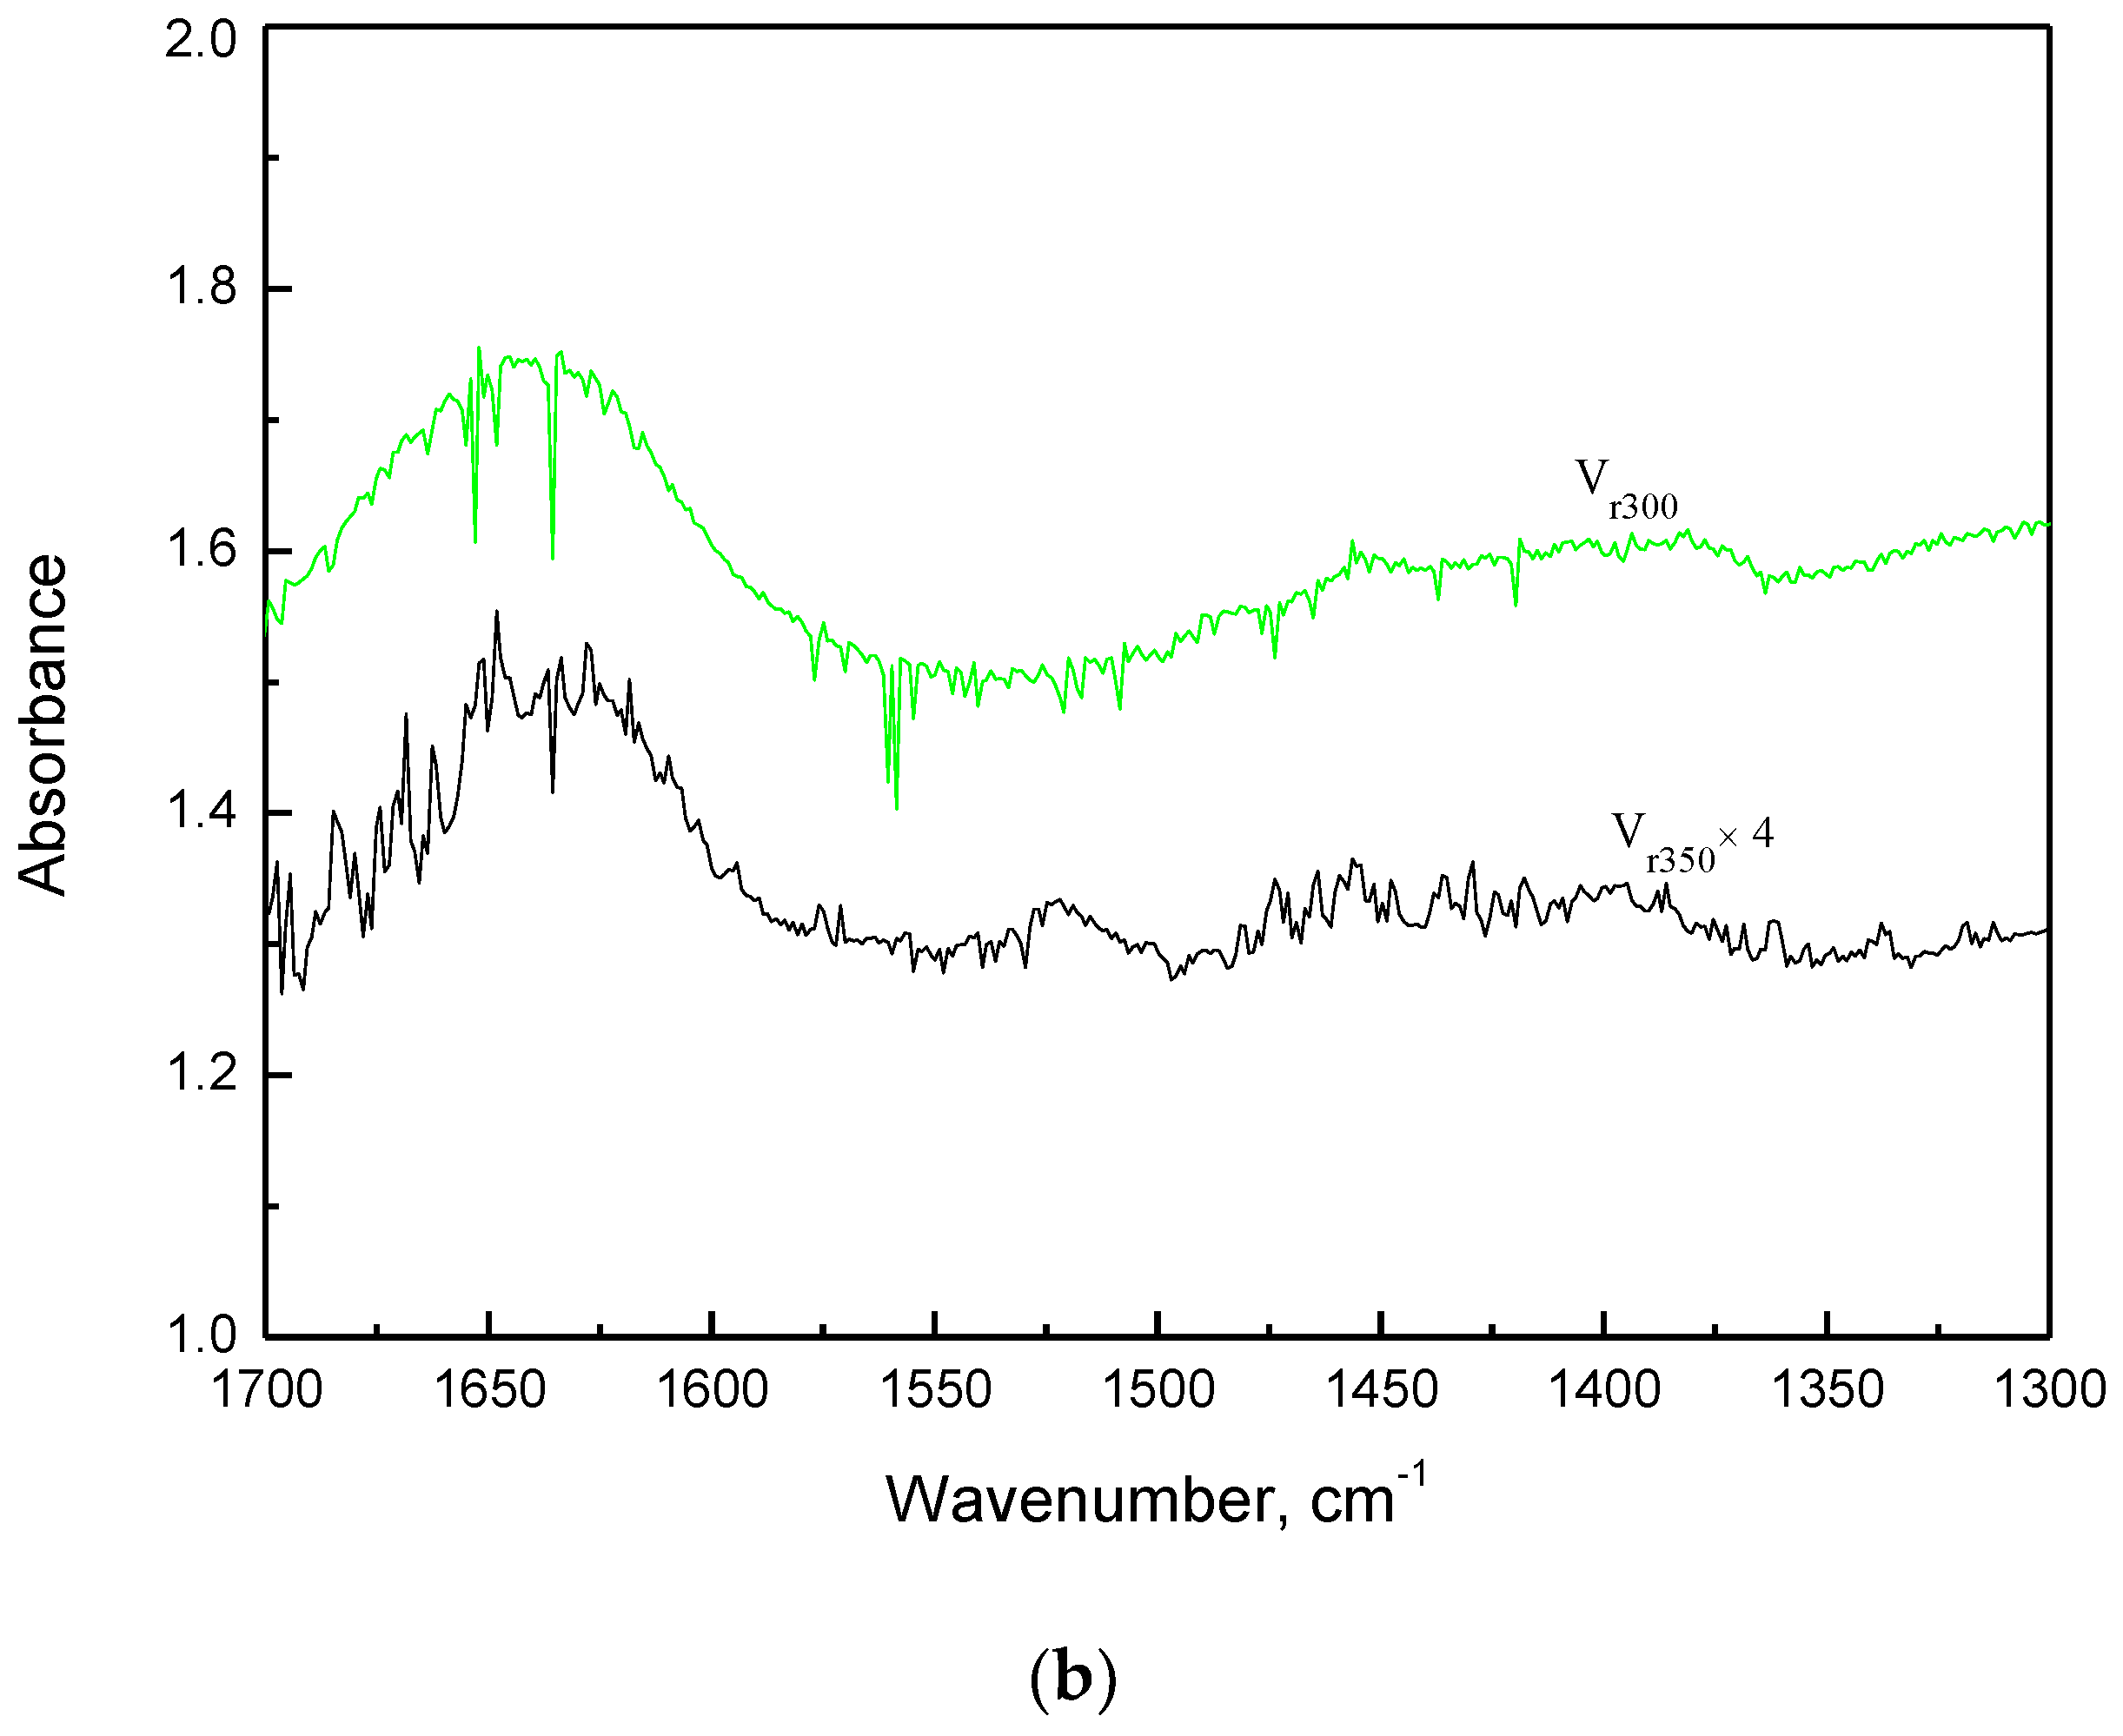
2.3.1. FT-IR Characterization of Air Regenerated Ethanol-laden V2O5/NaY-SiO2

The IR spectra characterizing Vreg are shown in Figure 3. The absorption bands in the CH stretching region (2800–3000 cm−1) indicated the deposition of carbonaceous species (coke precursors or coke) on Vreg [35]. The peaks at 2960–2970 cm−1 and 2915–2940 cm−1 for Vreg were attributed to the asymmetric stretching vibration (νasym) of CH3 and CH2, respectively, while the shoulder at 2870–2890 cm−1 and peak at 2850–2860 cm−1 could be assigned to symmetric stretching (νsym) [36,37]. The biggest peak, appearing at 2975 cm−1, for Vr300 could be characteristic of νasym of the CH3 groups of the ethanol derivatives, such as an ethoxyl group and DEE, or oligomers bonded to NaY [36,38]. The peaks at 1350–1500 cm−1 (Figure 3b) were attributed to CH3 and CH2 bending vibration, respectively [40]. The peak at 1650 cm−1 was attributed to the bending vibration of water adsorbed on NaY [40].
As the regeneration temperature increased from 300 to 450 °C, the decrease in peak intensity indicates a decrease in carbonaceous species formed on the adsorbents. The decrease in ICH3/ICH2 suggests oligomer formation, and its chain length increased with temperature. Compared with the CH3 and CH2 bending vibration frequency (1370–1450 cm−1) for Vr300, the shift to a higher frequency (1390–1480 cm−1) for Vr350 is consistent with the decrease in ICH3/ICH2. The peak at 1520 and shoulders at 1480 and 1610 cm−1 for Vr350 suggest the formation of some alkylated aromatic coke from oligomers [36,38,40]. No significant peaks were observed at 3000−3200 and 1540–1560 cm−1 regions, indicating that there was no significant polycyclic aromatic coke formed via hydrogen transfer reaction in air regeneration [37,41,42].

2.3.2. DSC Characterization of Air Regenerated Ethanol-laden V2O5/NaY-SiO2

The DSC curves characterizing the species deposited on Vreg are shown in Figure 4. The endothermic peak appearing at about 130 °C is a characteristic peak of water desorption. Combining the TPO results, the peak found at around 440 °C may have resulted from the exothermic combustion heat of the alkylated aromatic coke. The combustion temperature of this coke is close to that of the “soft coke” reported by Kosinov et al. [41]. Hence, although the coke precursors are different, the peak at 440 °C can also be regarded as the characteristic peak of soft coke; via a hydrogen transfer reaction at a higher temperature, poly-aromatic (hard) coke can also be formed from this coke [28,41,42].
The shoulder appearing at about 350 °C for Vr300 could be a result of oligomer combustion. The formation of alkylated aromatic (soft) coke and the combustion of oligomers are competitive reactions. During the DSC measurement, the non-combusted oligomers were converted to soft coke and were burned off at 440 °C. For Vr400 and Vr450, no significant peak at 440 °C was observed, suggesting that the oligomer was almost completely combusted. Thus, the FT-IR and DSC results suggest that the regeneration temperature for ethanol-laden V2O5/NaY-SiO2 should be higher than 350 °C to minimize the adsorbent deactivation caused by oligomer and coke deposition.

2.4. Causes of Activity Loss at High-temperature Regeneration

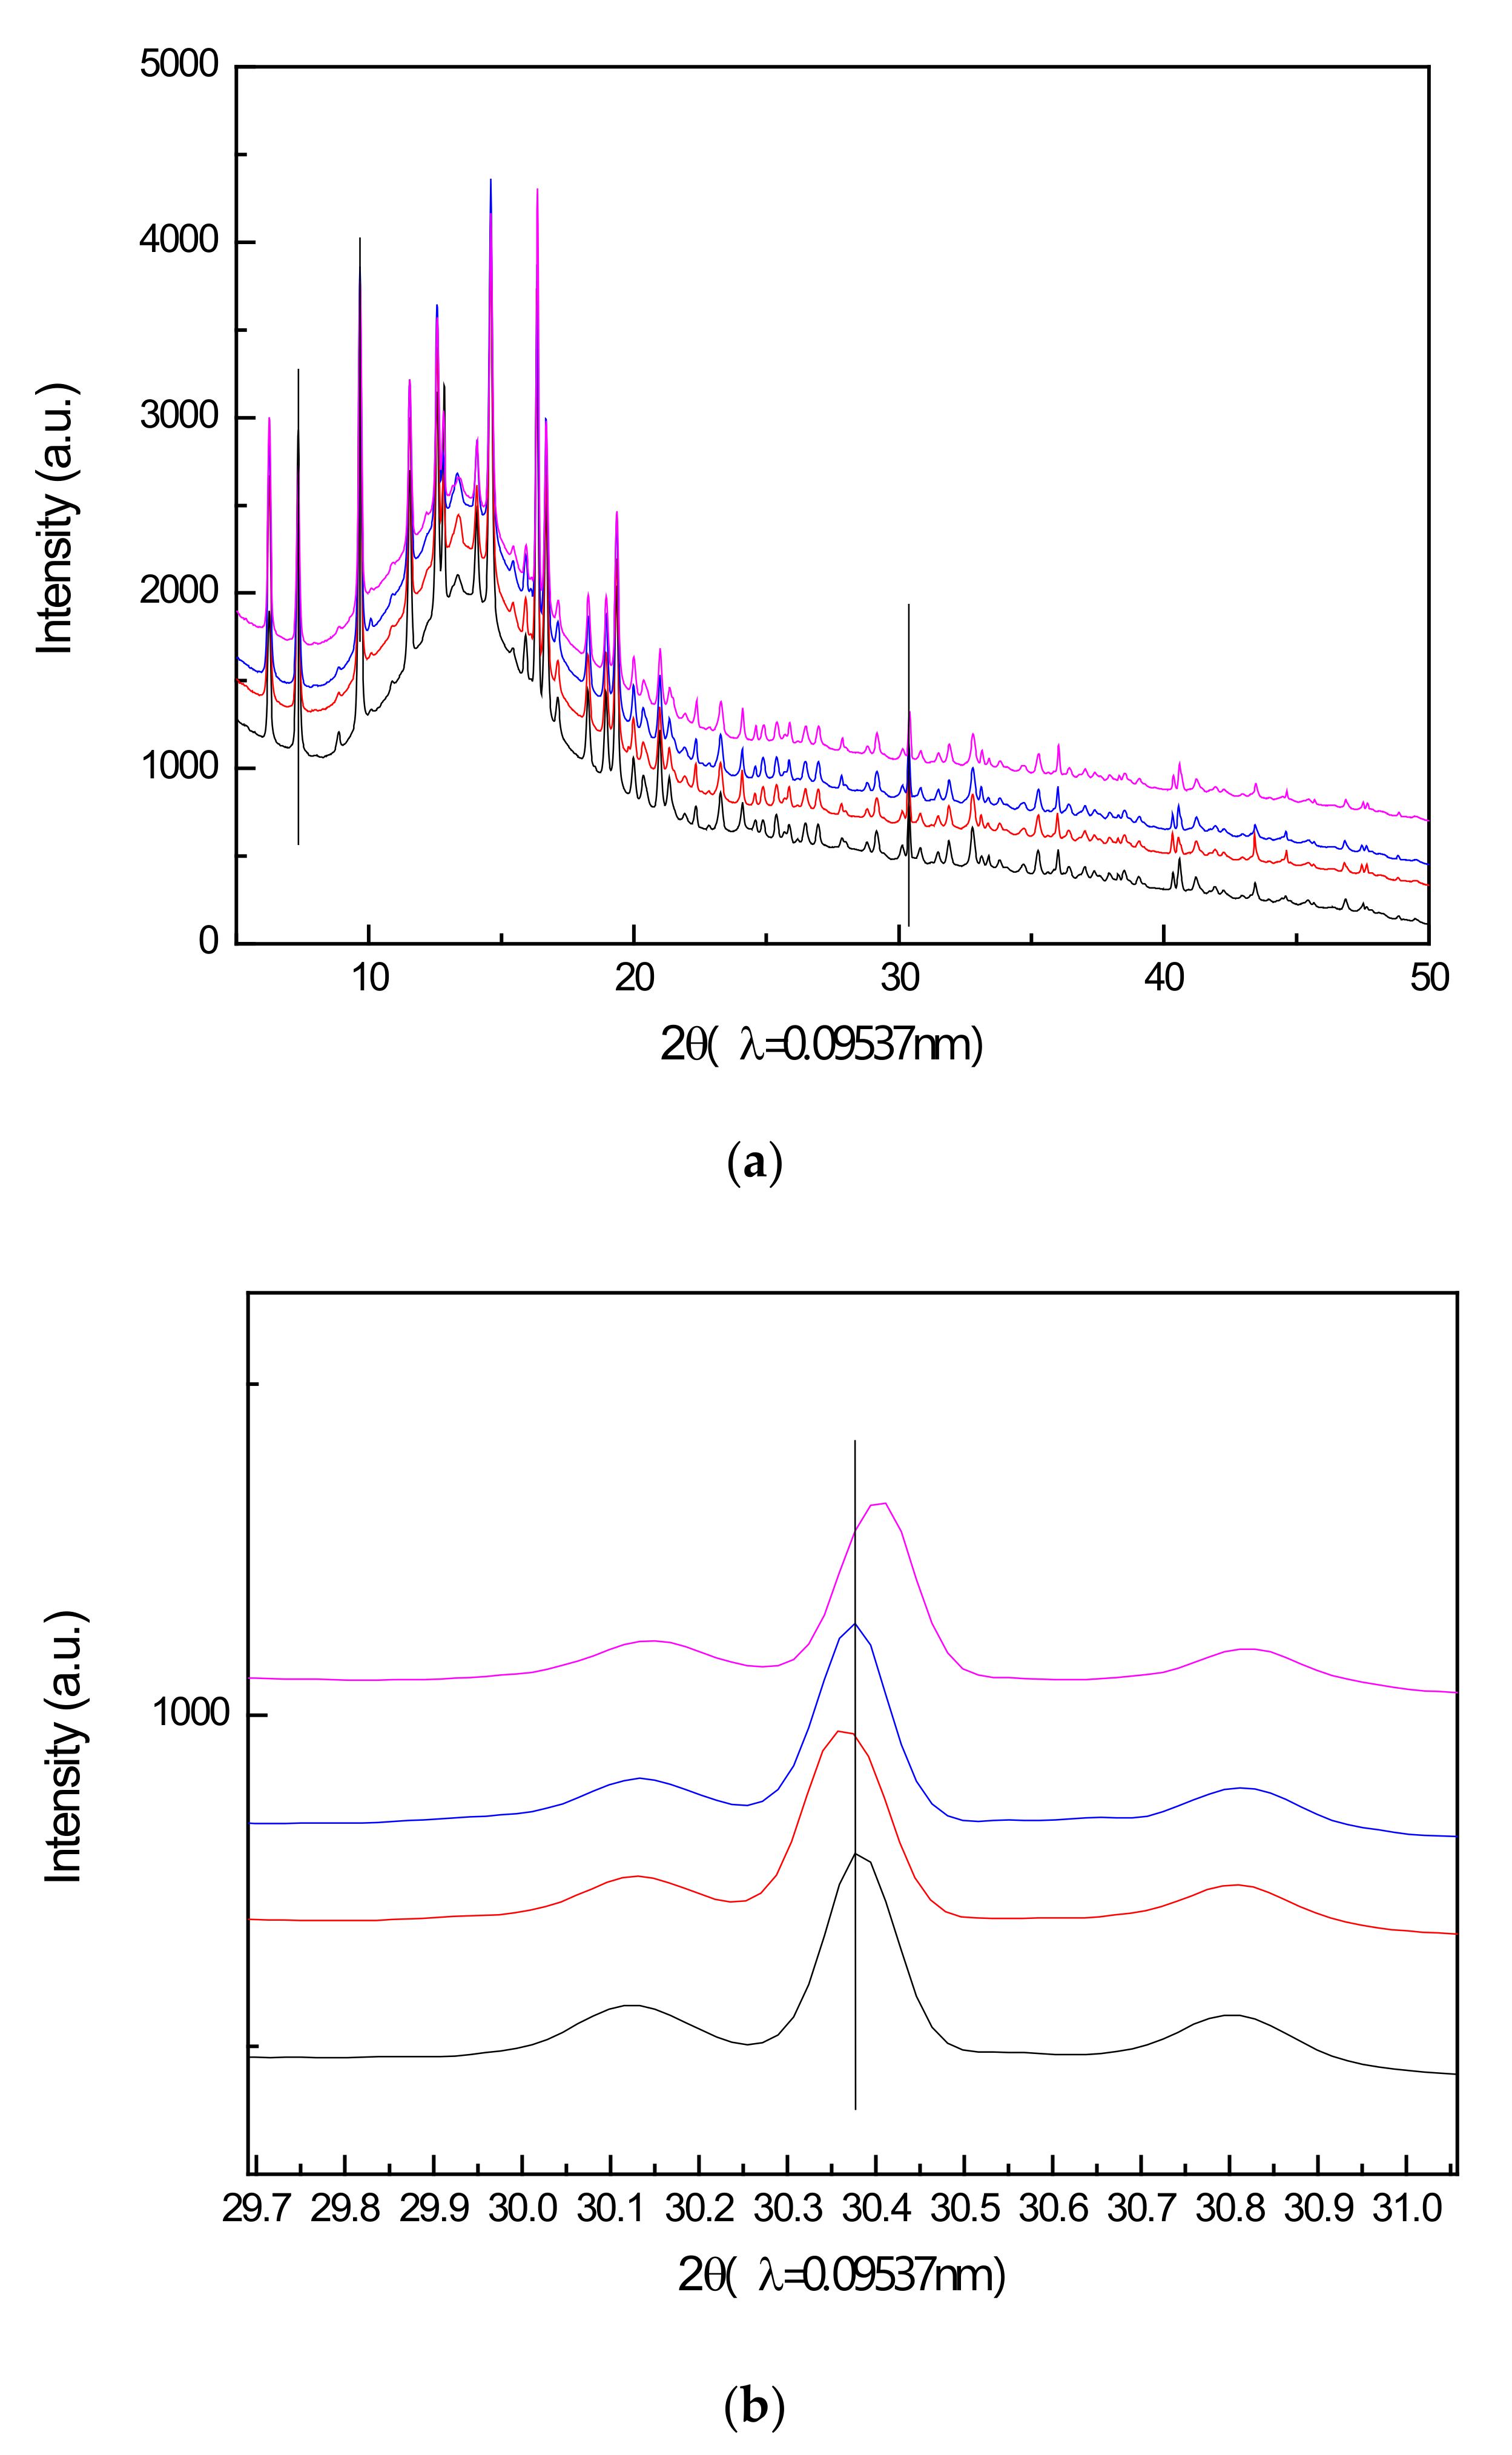
2.4.1. Synchrotron XRPD Characterization of Air Regenerated Ethanol-laden V2O5/NaY-SiO2

The XRPD patterns of Vf and Vreg are shown in Figure 5. All FAU-type zeolite characteristic peaks were observed in the patterns, indicating that air regeneration up to 450 °C does not change the unit cell symmetry of NaY. In addition, no characteristic peaks of vanadia were observed in these spectra, suggesting that the vanadia species formed on NaY-SiO2 were too small (less than 5 nm) to be detected by synchrotron XRPD. The structure was therefore characterized by EXAFS.
Both sharp crystal Bragg peaks for NaY and quartz and broad background contributions from amorphous SiO2-Al2O3 matter and SiO2 binder were present in these spectra. The percent of Bragg intensity, %ABragg = 100 × ABragg/(ABragg + ABk), was calculated to roughly estimate the loss of NaY crystallinity in air regeneration. The calculated %ABragg values were 40.8, 38.2, 37.5, and 33.2 for Vf, Vr350, Vr400, and Vr450, respectively. The decrease in %ABragg could be due to coke deposition and the loss of NaY crystallinity. The FT-IR and DSC results suggested that for Vr400 and Vr450, crystallinity loss due to framework destruction was the main cause of adsorbent deactivation, since only trace amounts of coke were observed on these two samples. In air regeneration, the exothermal reaction of the carbonaceous species’ combustion could form hot spots inside the pores of NaY. These hot spots may break the aluminosilicate framework and create crystal defects caused by Al removal [43,44]. Compared with the Vr400 pattern, a more significant shift to the higher Bragg angle for Vr450, with respect to Vf, suggests that the unit cell reduction caused by hot-spot-induced dealumination was more pronounced for Vr450 as opposed to Vr400 [31].
The crystallinity, unit cell parameters, and the location of the removed Al species were further quantified using Rietveld refinement. A GSAS-EXPGUI program was employed for the Rietveld refinements [45,46]. The crystalline grain sizes were estimated based on the Scherrer equation t = kλ/(Bcosθ), where t is the crystal grain size, k is the shape correction constant for a t of 0.95, and B is the FWHM of the related Bragg peaks [47]. The final Rietveld refinement results are shown in Figure 6, and the refined crystal parameters are summarized in Table 3. The Rietveld refinement results show that the unit cell dimension for Vf, Vr400, and Vr450 is 24.5084, 24.5048, and 24.4652 Å, respectively. Since shrinking a unit cell is associated with removing aluminum atoms from NaY frameworks, the results suggest dealumination occurs in regeneration at 450 °C.

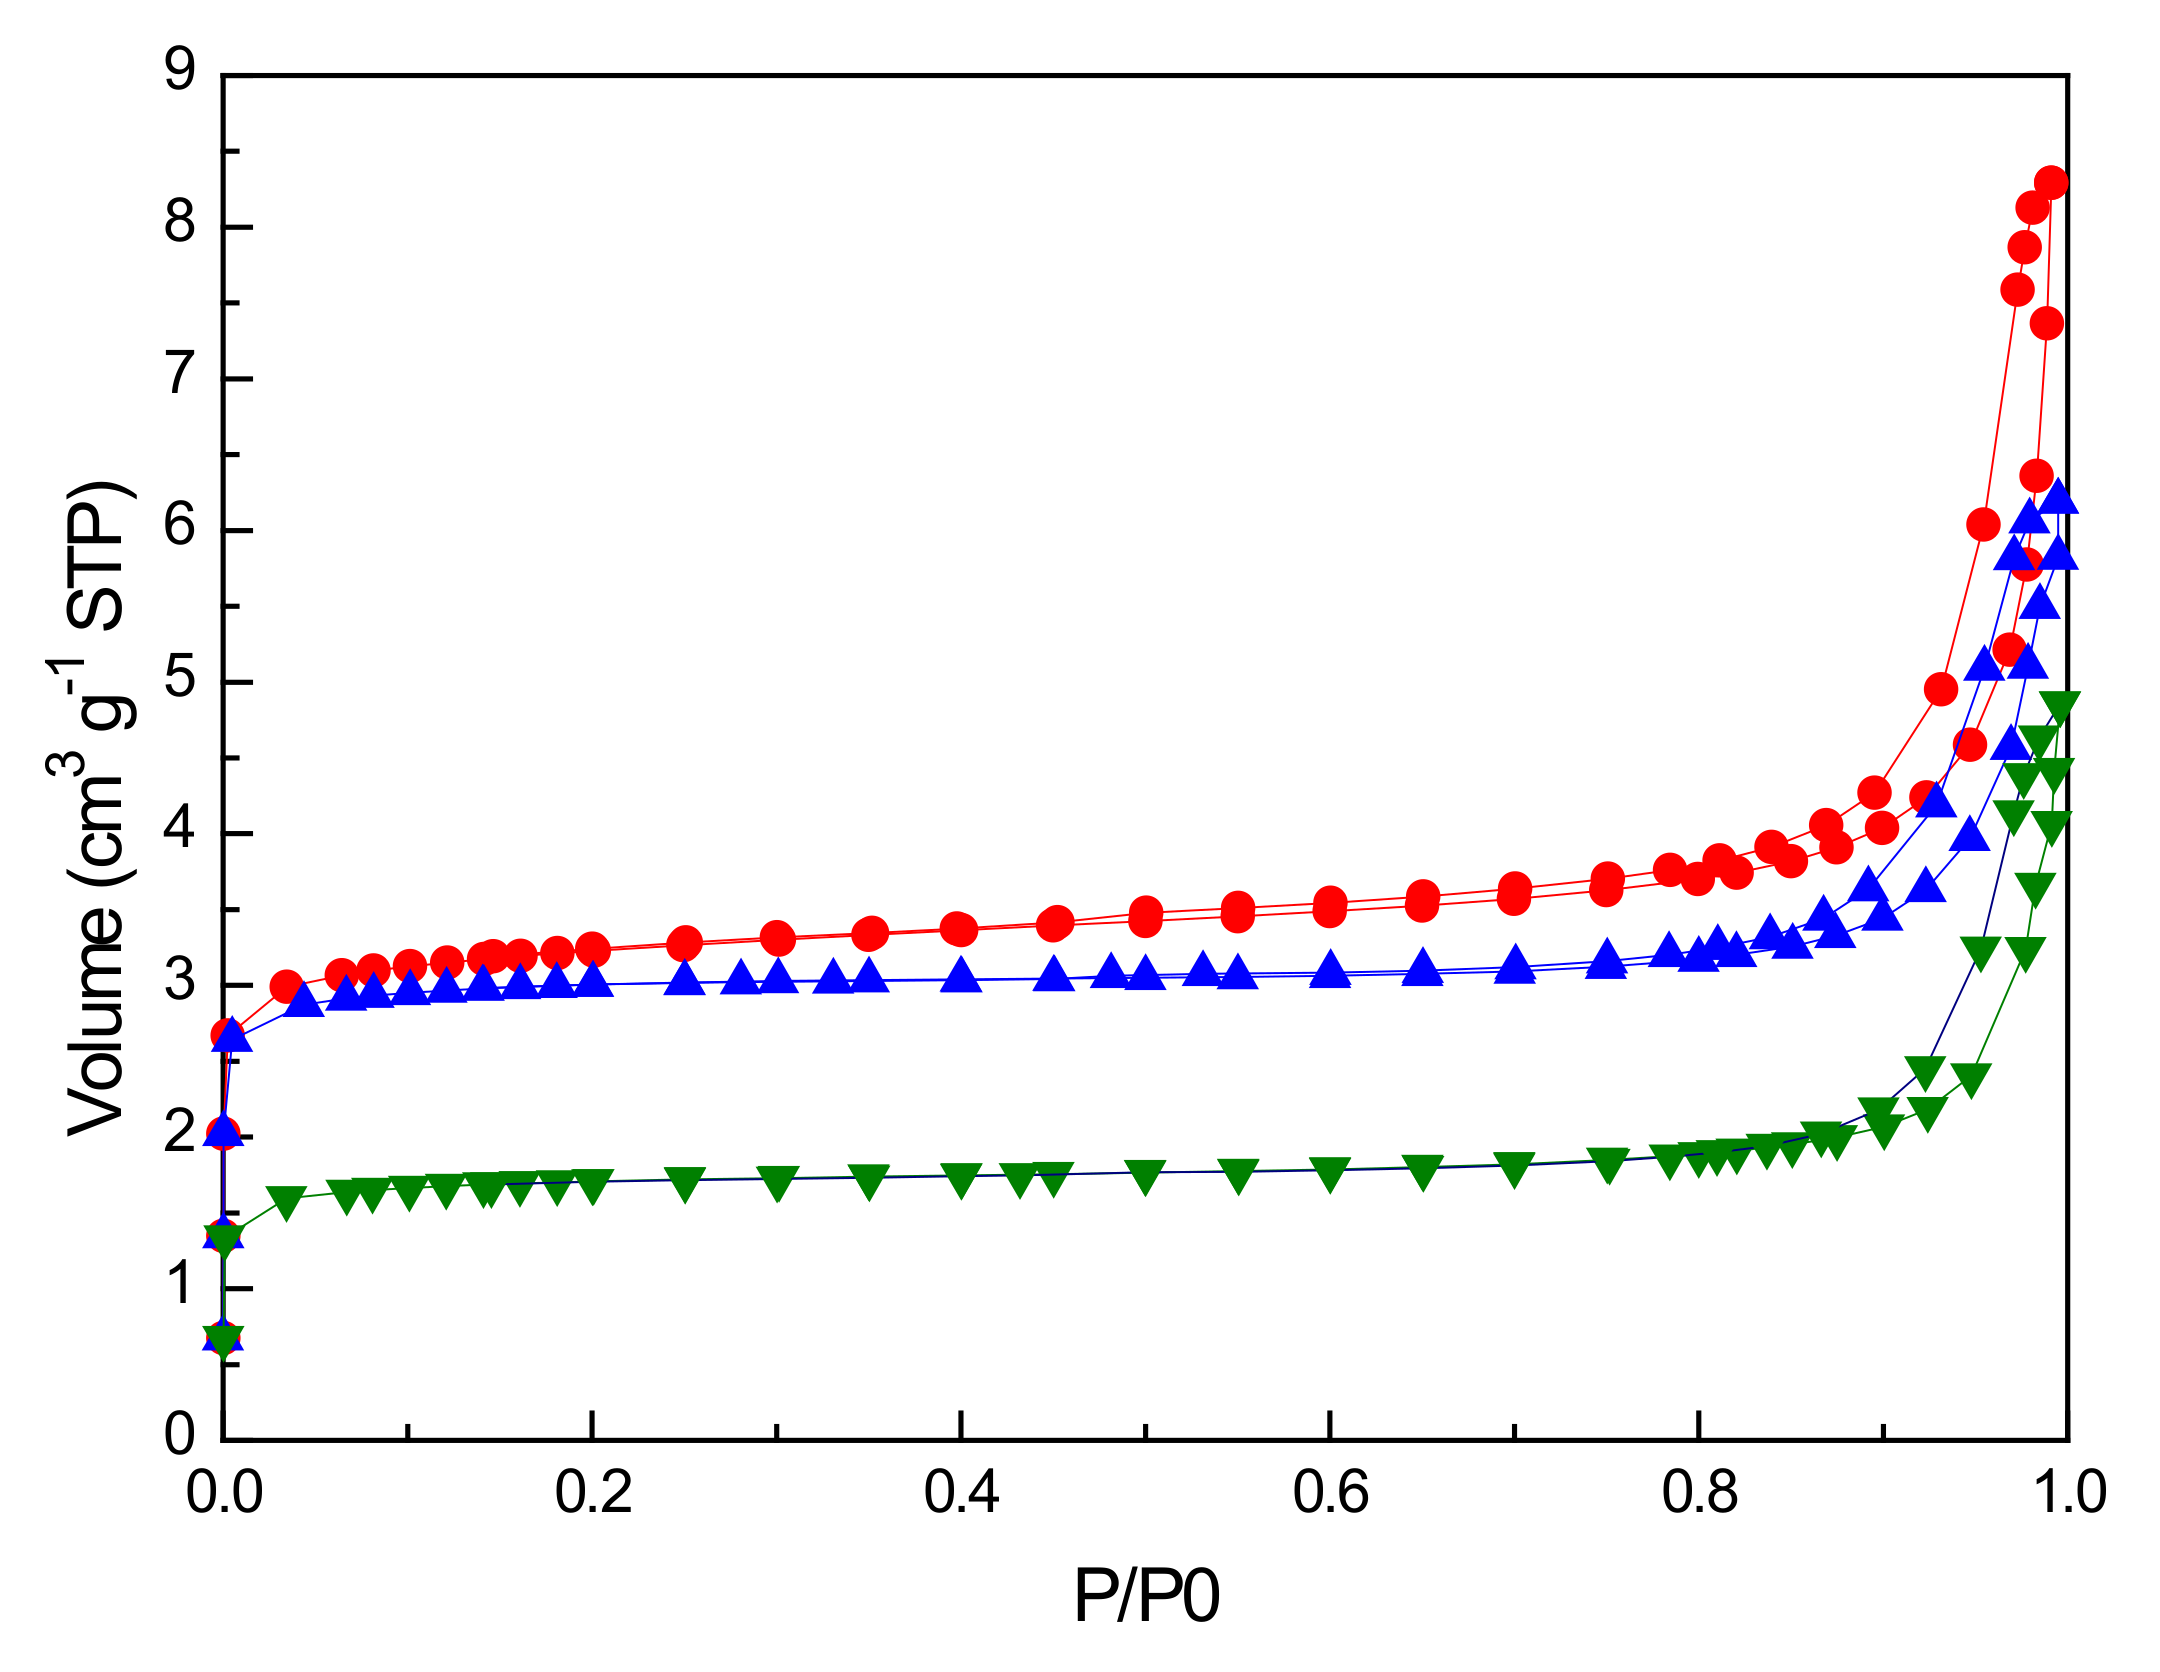
2.4.2. BET Analysis of Air Regenerated Ethanol-laden V2O5/NaY-SiO2

Compared to the BET surface area of the fresh V2O5/NaY-SiO2 (Vf = 221 m2/g), that of the ethanol-laden samples regenerated at a temperature lower than 400 °C was decreased by about 9–13% (Vr400 = 202, Vr350 = 199, and Vr300 = 192 m2/g). For Vr400, the surface decrease was quantitatively consistent with the loss of NaY crystallinity (8%). However, for the Vr450 surface area of 116 m2/g, the BET surface area decreased by about 47%, higher than that expected from crystallinity loss (19%). Another factor, such as zeolite channel plugging, may cause the additional loss of BET surface area. The other 28% of surface area loss could be caused by dealumination in air regeneration, where the deposition of the aluminum removed from the frameworks blocks the zeolite channels.
According to the empirical classification of hysteresis loops by IUPAC [48], the hysteresis loop of the N 2 adsorption isotherm for Vf, Vr400, and Vr450 (Figure 7) was assigned as an IV type isotherm with type H1. The upward curvature of the loop at a P/P0 of 0.7 to 0.98 indicates a cylindrical pore type with a width of about 40 nm. For such a large pore, ethanol transporting resistance inside the V2O5/NaY-SiO2 pellet is negligible. Hence, the primary resistance should be the diffusion of ethanol inside NaY crystals. The Rietveld refinement results indicate that the extra-framework aluminum, Ale, may be lodged inside the sodalite cages [49,50]. This channel-blocking causes an extra decrease in the adsorption capacity. In addition, the channel-blocking causes the ratio of adsorption outside the NaY crystal to inside (Adsout/Adsin) to increase after regeneration at 450 °C, leading to increased effective diffusivity (Table 1).

2.4.3. EXAFS Characterization of Air Regenerated Ethanol-laden V2O5/NaY-SiO2

The k3 weighted V-O phase-corrected Fourier transform of the EXAFS spectra characterizing Vf, Vr350, Vr400, and Vr450 are shown in Figure 8. No significant peaks appeared between 2.1 to 3.1 Å for Vf, suggesting isolated vanadia species were formed on NaY-SiO2. Keller et al. proposed an umbrella VO4 geometry for isolated vanadia on γ-Al2O3 [27]. In the model, the isolated VO4 is anchored to the oxygen of γ-Al2O3. The proposed model was adopted to analyze the EXAFS spectrum of Vf. A multi-shell analysis suggested that the model appropriately fit the Vf EXAFS data.
When comparing the spectra of Vr400 with that of Vf, the increase in V-O peak intensity at 1.7 Å with an additional peak appearing at about 2.4 Å (Figure 8) indicates an air regeneration-induced morphology change of the vanadia species. Single shell analysis of the peak at 2.4 Å found that that the shell could be fitted well with the backscattering atom of Al. Detailed EXAFS data analysis showed that the peak resulted from the contribution of the V-Al shell of a V-O-Al bond (Table 4). The results suggest that the vanadia with umbrella VO4 geometry is thermodynamically unstable. After high-temperature regeneration, some of the tetrahedral vanadia was converted to a relatively stable distorted-square-pyramidal V2O5 geometry. Further increasing regeneration temperature to 450 °C resulted in an aggregation of vanadia species, as was shown in the increase in V-V contributions of the V-O-V bond peaking at about 3.0 Å of the Fourier transformed EXAFS functions (Figure 8, Table 4). The detailed EXAFS fitting results are summarized in Table 4. Based on the EXAFS results, after regeneration at 450 °C, the vanadia grain size increased from 5 to 8 Å. The vanadia aggregation decreased the total oxidation activity, as was shown in the TPO results (Figure 2), resulting in a decrease in regeneration efficacy (Table 1).

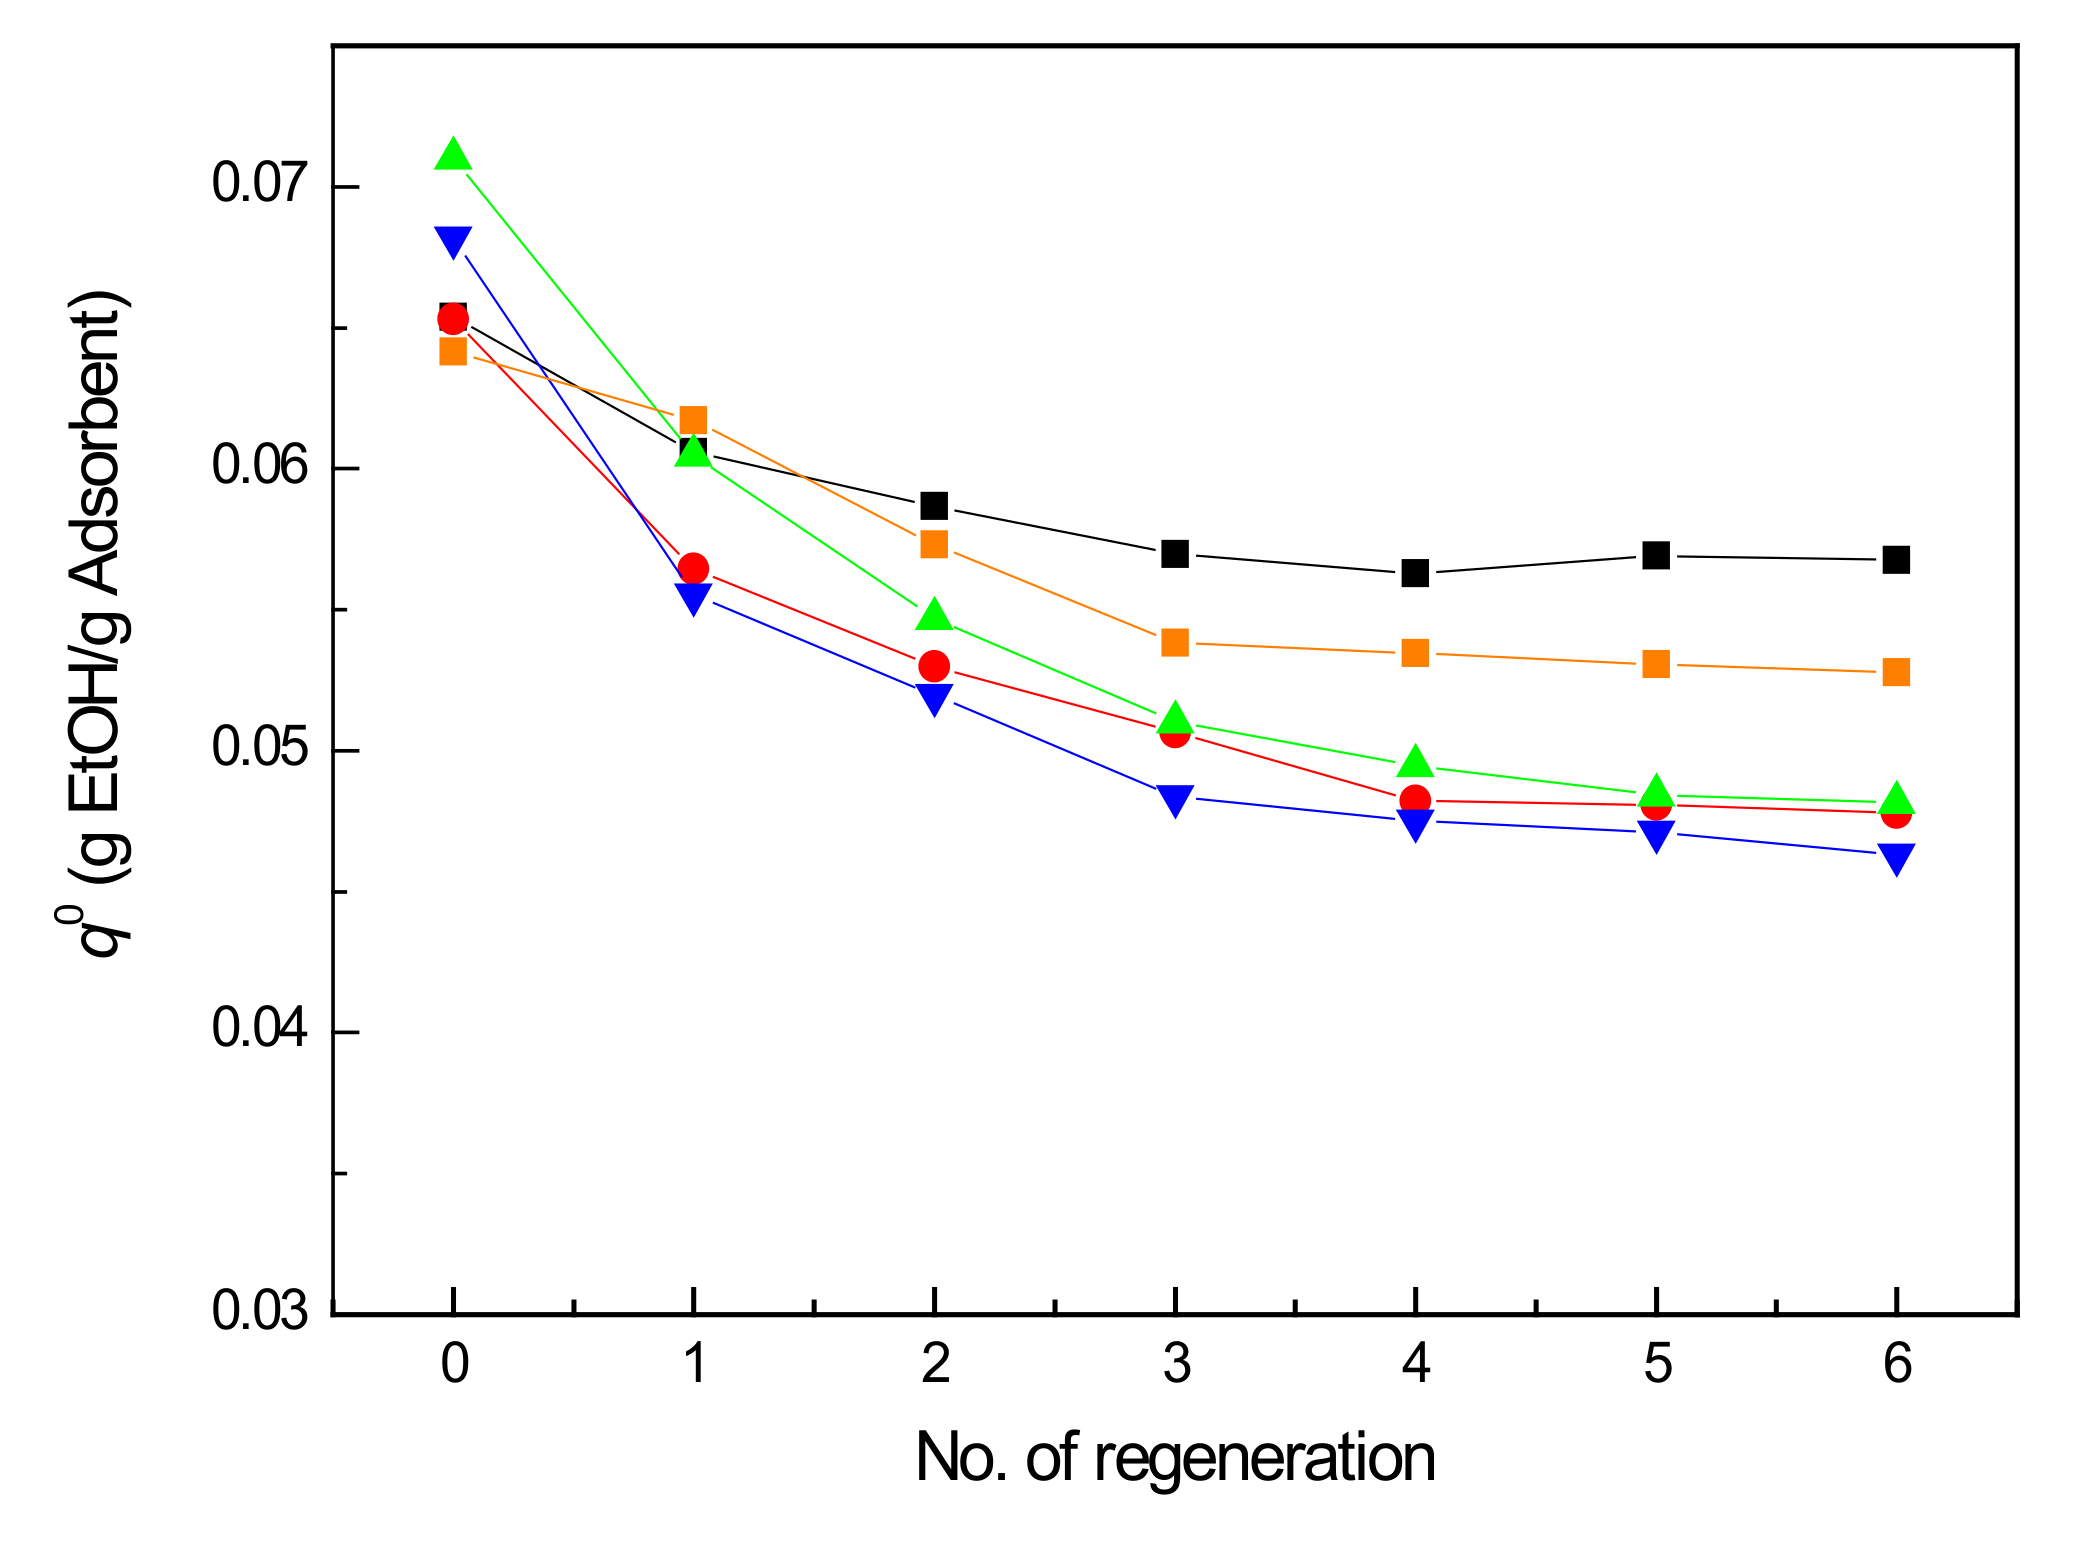
2.5. Cycled Accelerated Aging Tests

The deactivation of V2O5/NaY-SiO2 in air regeneration is caused by the adsorption sites being covered by carbonaceous species (oligomer and soft coke) and the destruction of NaY frameworks associated with dealumination. For regeneration at 300°C, the deactivation was mainly caused by site coverage, in contrast to 450°C where it was caused by framework destruction. In comparison to Vr350, the adsorption capacity for Vr400 was higher because less residual coke was left after regeneration. However, after several regeneration–adsorption cycles, the NaY framework destruction became significant for the regeneration at 400 °C. To clarify this issue, cycled long-term tests at regeneration temperatures of 350 and 400 °C were performed for comparison.
As shown in Figure 9, after the fourth regeneration cycle at 400 °C (Vr4004th), the adsorption capacity became almost invariant, suggesting that coke formation was close to equilibrium, and the structural changes in V2O5/NaY-SiO2 were also insignificant. Compared with Vr400, the deactivation rate (dq0/dt) for Vr350 was higher. Moreover, the adsorption capacity was still slightly decreasing after the sixth cycle of regeneration. The long-term life tests suggest that 400 °C is the optimal regeneration temperature. With the regeneration temperature at 350 °C, the decrease in adsorption capacity caused by coke formation seemed more pronounced than the structure changes in V2O5/NaY-SiO2.
The thermal swing honeycomb zeolite concentrator is a popular system used in Taiwan for VOC abatement in semiconductor manufacturing plants. In this system, VOCs are usually adsorbed below 40 °C in the system, and the VOC-laden zeolite is regenerated around 200 °C [13]. To compare the adsorption performance between normal zeolite and catalytic adsorbents, cycled aging tests were performed for Vr400 and NaY-SiO2 regenerated at 200 °C (NaYr200).
As shown in Figure 9, the initial V2O5/NaY-SiO2 adsorption capacity was lower than that of NaY-SiO2 due to some adsorption sites of NaY being covered by vanadia. However, this may also be because the temperature was too low to burn off the coke precursors, ethylene and DEE, formed in regeneration; the deactivation rate (dq0/dt) for NaYr200 was higher than that for Vr400.
In the regeneration of ethanol-laden V2O5/NaY-SiO2, coke is formed from ethylene, DEE, and acetaldehyde derived from ethanol. In the case where some monomer coke precursors are contained in the waste gas stream, such as methyl methacrylate (MMA) in the waste gas of electro-optical industries, the deactivation will be even more pronounced. As shown in Figure 9, for MMA-containing waste gas, the initial ethanol adsorption capacities for both NaY-SiO2 and V2O5/NaY-SiO2 were decreased, suggesting the strong adsorption of MMA on both adsorbents. For Vr400, no significant deactivation was observed after the fourth cycle of regeneration. In contrast, for NaY-SiO2, the adsorption capacity was still decreasing after the seventh cycle of regeneration.

3. Materials and Methods

3.1. Preparation of V2O5/NaY-SO2 Pellet

The silica gel used as a palletizer binder was prepared by mixing 30 g silica powder (T600, PPG Industries, Kaohsiung, Taiwan) with a 3 N nitric acid solution. Sixty grams of NaY powder (sodium silicoaluminate, GRACE Davison, Baltimore, USA) were placed in the bowl of a small kneader. An elastic dough of silica gel-bound NaY was prepared by kneading. After curing overnight, the dough was extruded to make a cylinder extrudate of 2 mm diameter and cut to 2 mm in length. The pellets were dried at 120 °C for 8 h and then air calcined at 450 °C for 4 h. The calcined pellet sample was noted as NaY-SiO2 [31].
NaY-SiO2 supported vanadia (V2O5/NaY-SiO2, noted as Vf) was prepared via wet impregnation and followed with air calcination at 450 °C for 4 h. The NaY-SiO2 pellets of 80 g were placed in a 3-neck glass flask and heated to 200 °C under vacuum. After cooling to room temperature, the incipient wet impregnation method was used to incorporate vanadium oxalate solution (1.96 g of vanadium (V) oxides (Lancaster, city, State Abbr. (if has), country) and 4.84 g of oxalic acid (J.T. Baker) in 60 g of water into NaY-SiO2.

3.2. Breakthrough Curves and Accelerated Cycle Aging Tests

As mentioned earlier, the prepared catalytic adsorbent should be regenerable and stable to allow several adsorption and regeneration cycles. Thus, this study used accelerated cycle aging tests to evaluate adsorbent stability. The tests were carried out in a stainless steel fixed bed adsorption-regeneration column of 2.2 cm inside diameter and 45 cm length. The column was packed with 5.0 g of V2O5/NaY-SiO2 diluted with inert ceramic in a ratio of 1:10 by volume. The diluent (2.0–5.0 mm diameter) was used to minimize channeling effects. A PID temperature controller controlled the regeneration temperature with two K-type thermal couples, one at the outer wall of the column and the other inside the column used as indicator. Due to the highly exothermic reaction of air regeneration, the catalyst bed was packed in a gradient increase in catalysts. As a result of this, the catalyst bed had a nearly uniform temperature.
Before the adsorption tests, the catalytic adsorbent bed was heated in flowing dry N2 (50 mL/min, volumetric flow rate) at 200°C for 2 h to remove water adsorbed. After cooling down to room temperature (about 30 °C), the performance test was carried out by flowing water-containing ethanol (EtOH) in the air (63 mg ethanol of 99.8 purity in L of air) at 200 mL/min. In the long-term aging tests, besides EtOH containing gas, methyl methacrylate (MMA) was also added (75.1 mg ethanol of 99.8 purity and 3.9 mg MMA in L of air, noted as MMA-WG) to study the effects of monomer adsorption on V2O5/NaY-SiO2 stability. Mass flow controllers (AeraFC-7700C, Hitachi, Tokyo, Japan) were used for flow control. Effluents from the adsorption column were collected and analyzed periodically using GC. The ethanol concentration as a function of the elapsed time of adsorption (breakthrough curve) was then plotted.
The effects of temperature on regeneration efficiency were studied by air regeneration at temperatures of 300, 350, 400, and 450 °C. After reaching the set temperature with a ramping rate of 10 °C/min, the heating temperature was maintained for 4 h by inflowing air. These regenerated samples were noted as VR300, VR350, VR400, and VR450. The BET (Brunauer–Emmett–Teller) surface area of the fresh and regenerated samples was determined using Micromeritics ASAP 2010 (Georgia, USA).
After the first cycle of regeneration, the adsorbent bed was cooled down to 200 °C, and the flow stream was switched to N2 gas to inhibit any water being adsorbed on the dry adsorbents. The second adsorption cycle was started when the adsorbent was cooled to room temperature. The same procedure was repeated 6 times for 350 and 400 °C regenerated samples. For the samples regenerated at 300 and 450 °C, the procedure was repeated two times.
GC (Shimadzu Model GC-14B, Kyoto, Japan) was used to analyze the species formed in air regeneration. A capillary column (HP-INNOWAX, Restek Corp., CA, USA) with a length of 60 m, ID of 0.32 mm, and an FID detector was used to analyze ethanol and its secondary products (coke precursor). The column was operated at 40 to 200 °C with a ramping rate of 10 °C/min and a He flow rate of 50 mL/min. For CO2 analysis, a unibead-packed column of 3 m × 3 mm i.d. with a TCD detector was used. FT-IR (Shimadzu Prestige-21 with an MCT detector, Kyoto, Japan) was used to check for the presence of CO in regeneration and to characterize carbonaceous species on the adsorbents.

3.3. Synchrotron XRPD

The XRPD data were collected at the BL01C2 beamline of Taiwan Light Source (TLS) of the National Synchrotron Radiation Research Center (NSRRC). The TLS was run with a ring energy of 1.5 GeV and a typical current of 360 mA in top-up injection mode. The X-ray source of BL01C2 is a 5.0 T superconducting wavelength shift magnet, which provided 8 to 33 keV X-rays. A wavelength λ of 0.9535 Å (13.0 keV) was chosen for the XRPD measurements, and a double monochromator (Si(111)) was used to select monochromator beams. The samples (85 Wt% adsorbents and 15 Wt% quartz standard) were sealed in a glass capillary and quick spun during the data collection to increase random orientations. A Mar345 imaging plate was used to record the two-dimensional powder diffraction patterns. The patterns were then converted to a one-dimensional profile using the Fit2D program [51].

3.4. X-ray Absorption Spectroscopy

XAS (X-ray absorption spectra) of Vf, VR400, and VR450 at V K edge (5465 to 6465 eV) were collected on the beamline 17C, NSRRC. The energy for XAS measurements was selected by a double-crystal Si (111) monochromator. Rh-coated mirrors rejected high harmonic radiation, and gas-filled ionization chambers were used to monitor the incident intensities
The fresh and regenerated samples were pulverized into powder and pressed into wafers for the XAS measurements. XDAP code was used to perform data reduction, processing, and multi-shell analysis [52,53]. The normalized EXAFS functions were obtained by subtracting the background from the XAS spectra and dividing by the absorption height at 50 eV above the edge. The phase shift and backscattering amplitude functions of V-V, V-O, and V-Al for data analysis were calculated from FEFF8 [54]. Difference file techniques combined with multi-shell analysis were used to estimate the structural parameters [52].

4. Conclusions

A practical dual function catalytic adsorbent should adsorb VOCs rapidly and oxidize the adsorbed VOCs catalytically without damaging the adsorbent structure. Hence, besides adsorption kinetics, the air regeneration-induced structure change of the catalytic adsorbents and the corresponding regeneration efficacy should also be investigated. The operation conditions that affect regeneration efficacy include the regeneration temperature, airflow rate, and oxygen concentration. In this work, we studied the effects of temperature. These studies may be helpful for better utilization of catalytic adsorbent in VOC abatement. Ethanol was used as a model adsorbate for testing the deactivation of V2O5/NaY-SiO2 in air regeneration. As shown in Figure 10, catalyzed by NaY-SiO2, the coke precursors ethylene and DEE are formed from ethanol during regeneration. These species convert to oligomers, and finally, alkylated aromatic soft coke. At low temperatures (<350 °C), the formation rate of oligomers and coke is higher than those burned off in regeneration. Hence, the deactivation is mainly caused by the deposition of these carbonaceous species. Increasing the regeneration temperature enhanced the combustion of coke precursors and thus decreased adsorbent deactivation. However, regeneration at too high a temperature (>400 °C) caused a dealumination that induced damage in the NaY framework and the aggregation of vanadia. The structure characterization of the fresh and regenerated V2O5/NaY-SiO2 combined with the long-term cycled aging test results suggest optimal regeneration occurs at 400 °C. At this temperature, the regeneration efficacy for V2O5/NaY-SiO2 was higher than that for NaY-SiO2 regenerated at 200 °C. Moreover, the long-term aging test results demonstrated that the stability maintenance for V2O5/NaY-SiO2 was better than that for NaY-SiO2, specifically in treating waste gas streams containing species prone to forming coke. These results suggest that the integrated process using V2O5/NaY-SiO2, in contrast to thermal-swing concentrators, is more suitable for VOC abatement for processes containing monomer precursors and monomers, e.g., painting, coating, and solid-state polymerization.

Author Contributions

C.-C.H. and C.-C.H. created and organized this research project. J.-S.T. prepared the catalyst samples, performed the breakthrough tests, and obtained the XAS measurements; H.-S.S. performed the XRPD experiments and the Rietveld refinement of XRPD data; J.-R.C. analyzed the EXAFS data, organized experimental data, and wrote the manuscript. All authors have read and agreed to the published version of the manuscript.

Funding

The supports of the Ministry of Science and Technology, ROC (Contract No. MOST-107-2221-E-194-018 and MOST 107-2622-E-224-012-CC1).

Data Availability Statement

Not applicable.

Acknowledgments

The EXAFS data were analyzed using FEFF and XDAP. The XDAP program was developed by M. Vaarkam, J.C. Linders, and D.C. Koningsberger. Meng-Ju Chung prepared some sorbent samples and performed XAS spectroscopy measurement. The supports of the Ministry of Science and Technology, ROC (Contract No. MOST-107-2221-E-194-018 and MOST 107-2622-E-224-012-CC1), the National Synchrotron Radiation Research Center (NSRRC), and the Refining & Manufacturing Research Institute, CPC Corporation, Taiwan are acknowledged.

Conflicts of Interest

The authors declare no conflict of interest.

References

  1. Chein, H.M.; Chen, T.M. Emission Characteristics of Volatile Organic Compounds from Semiconductor Manufacturing. J. Air Waste Manag. Assoc. 2003, 53, 1029–1036. [Google Scholar] [CrossRef] [PubMed] [Green Version]
  2. Wang, H.L.; Nie, L.J.; Wang, Y.F.; Wang, G.; Wang, J.H.; Hao, Z.P. Characterization and assessment of volatile organic compounds (VOCs) emissions from typical industries. Chin. Sci. Bull. 2013, 58, 724–730. [Google Scholar] [CrossRef] [Green Version]
  3. Khan, F.I.; Ghoshal, A.K. Removal of volatile organic compounds from polluted air. J. Loss Prev. Proc. Ind. 2000, 13, 527–545. [Google Scholar] [CrossRef]
  4. Cooper, C.D.; Alley, F.C. Air Pollution Control: A Design Approach; Waveland Press Inc.: Long Grove, IL, USA, 1990; Volume 305–409, pp. 353–355. [Google Scholar]
  5. Heck, R.M.; Farrauto, R.J.; Gulati, S.T. Catalytic Air Pollution Control, Commercial Technology, 2nd ed.; Wiley & Sons: New York, NY, USA, 2002; pp. 281–305. [Google Scholar]
  6. Campesi, M.A.; Luzi, C.D.; Barreto, G.F.; Martínez, O.M. Evaluation of an adsorption system to concentrate VOC in air streams prior to catalytic incineration. J. Environ. Mang. 2015, 154, 216–224. [Google Scholar] [CrossRef] [PubMed]
  7. Zhou, L.; Ma, C.; Horlyck, J.; Liu, R.; Yun, J. Development of Pharmaceutical VOCs Elimination by Catalytic Processes in China. Catalysts 2020, 10, 668. [Google Scholar] [CrossRef]
  8. Ueda, K.; Takata, Y.; Shibahara, T.; Yoshida, Y. Method for Treating Gas and Regenerating Catalyst Portion by Portion. U.S. Patent 5,254,512, 19 October 1993. [Google Scholar]
  9. Teller, A.J. Integrated Catalytic/Adsorption Process for Destroying Volatile Organic Compounds. U.S. Patent 6,051,199, 18 April 2000. [Google Scholar]
  10. Yan, T.Y.; Chang, J.-R. Process for Removing Volatile Organic Compounds. U.S. Patent 7,060,236 B2, 13 June 2006. [Google Scholar]
  11. Zhang, W. Regenerative Air Purification System and Method. U.S. Patent 9,597,627, 21 March 2017. [Google Scholar]
  12. Meininghaus, C.K.W.; Prins, R. Sorption of volatile organic compounds on hydrophobic zeolites. Microporous Mesoporous Mater. 2000, 35–36, 349–365. [Google Scholar] [CrossRef]
  13. Chang, F.-T.; Lin, Y.-C.; Bai, H.; Pel, B.-S. Adsorption and Desorption Characteristics of Semiconductor Volatile Organic Compounds on the Thermal Swing Honeycomb Zeolite Concentrator. J. Air Waste Manag. Assoc. 2003, 53, 1384–1390. [Google Scholar] [CrossRef] [Green Version]
  14. Chen, N.Y.; Liu, M.C.; Yang, S.C.; Chang, J.-R. Structure and surface properties of NaY-SiO2 pellets investigated by synchrotron radiation XRPD and FT-IR: Impact of silica binder. Ind. Eng. Chem. Res. 2015, 54, 8456–8468. [Google Scholar] [CrossRef]
  15. Yeh, C.-Y.; Chen, Y.-T.; Chen, N.-Y.; Chang, J.-R. Air Regeneration of Ethanol-Laden Pellet NaY-SiO2 and Pt/NaY-SiO2: Effects of Air Flow Rate on Pt Morphology and Regeneration Efficiency. Catalysts 2018, 8, 288. [Google Scholar] [CrossRef] [Green Version]
  16. Chantal Kassargy, C.; Awad, S.; Burnens, G.; Upreti, G.; Kahine, K.; Tazerout, M. Study of the effects of regeneration of USY zeolite on the catalytic cracking of polyethylene. Appl. Catal. B Environ. 2019, 244, 704–708. [Google Scholar] [CrossRef]
  17. Liotta, L.F. Catalytic oxidation of volatile organic compounds on supported noble metals. Appl. Catal. B-Environ. 2010, 100, 403–412. [Google Scholar] [CrossRef]
  18. Ribeiro, F.; Silva, J.M.; Silva, E.; Fátima Vaz, M.F.; Oliveira, F.A.C. Catalytic combustion of toluene on Pt zeolite coated cordierite foams. Catal. Today 2011, 176, 93–96. [Google Scholar] [CrossRef]
  19. Avgouropoulos, G.; Oikonmopoulos, E.; Kanistras, D.; Ioannides, T. Complete oxidation of ethanol over alkali-promoted Pt/Al2O3 catalysts. Appl. Catal. B-Environ. 2006, 65, 62–69. [Google Scholar] [CrossRef]
  20. Song, S.; Zhang, S.; Zhang, X.; Verma, P.; Meicheng Wen, M. Advances in Catalytic Oxidation of Volatile Organic Compounds over Pd-supported Catalysts: Recent Trends and Challenges. Front Mater. 2020, 7, 595667. [Google Scholar] [CrossRef]
  21. Zhou, J.; Zhao, J.; Zhang, J.; Zhang, T.; Ye, M.; Liu, Z. Regeneration of catalysts deactivated by coke deposition: A review. Chin. J. Catal. 2020, 41, 1048–1061. [Google Scholar] [CrossRef]
  22. Navascués, N.; Escuin, M.; Rodas, Y.; Irusta, S.; Mallada, R.; Santamaría, J. Combustion of volatile organic compounds at trace concentration levels in zeolite-coated microreactors. Ind. Eng. Chem. Res. 2010, 49, 6941–6947. [Google Scholar] [CrossRef]
  23. Kosusko, M.; Nunez, C.M. Destruction of Volatile Organic Compounds Using Catalytic Oxidation. Waste Manag. Assoc. 1990, 40, 254–259. [Google Scholar] [CrossRef]
  24. Özçelik, T.G. VOC Treatment by Catalytic Incineration. J. Multidiscip. Eng. Sci. Tech. 2014, 1, 114–117. [Google Scholar]
  25. Tomatis, M.; Xu, H.-H.; He, J.; Zhang, X.-D. Recent Development of Catalysts for Removal of Volatile Organic Compounds in Flue Gas by Combustion: A Review. J. Chem. 2016, 2016, 1–15. [Google Scholar] [CrossRef] [Green Version]
  26. Spivey, J.J. Complete Catalytic Oxidation of Volatile Organics. Ind. Eng. Chem. Res. 1987, 26, 2165–2180. [Google Scholar] [CrossRef]
  27. Keller, D.E.; de Groot, F.M.F.; Koningsberger, D.C.; Weckhuysen, B.M. ΛO4 Upside Down: A New Molecular Structure for Supported VO4 Catalysts. J. Phys. Chem. B 2005, 109, 10223–10233. [Google Scholar] [CrossRef]
  28. Pinard, L.; Hamieh, S.; Canaff, C.; Ferreira Madeira, F.; Batonneau-Gener, I.; Maury, S.; Delpoux, O.; Ben Tayeb, K.; Pouilloux, Y.; Vezin, H. Growth mechanism of coke on HBEA zeolite during ethanol transformation. J. Catal. 2013, 299, 284–297. [Google Scholar] [CrossRef]
  29. Melzer, M.; Urban, J.; Sack-Kongehl, H.; Weiss, K.; Freund, H.-J.; Schlögl, R. Preparation of Vanadium and Vanadium Oxide Clusters by Means of Inert Gas Aggregation. Catalysis Letters Chin. 2002, 81, 219–221. [Google Scholar] [CrossRef]
  30. Mahamulkar, S.S.; Yin, K.; Agrawal, P.K.; Davis, R.J.; Jones, C.W.; Malek, A.; Shibata, H. Formation and Oxidation/gasification of Carbonaceous Deposits: A Review. Ind. Eng. Chem. Res. 2016, 55, 9760–9818. [Google Scholar] [CrossRef]
  31. Liu, M.-C.; Hsieh, C.-C.; Lee, J.-F.; Chang, J.-R. Impact of Pt and V2O5 on Ethanol Removal from Moist Air Using Pellet Silica-Bound NaY. Ind. Eng. Chem. Res. 2015, 54, 8678–8689. [Google Scholar] [CrossRef]
  32. Bohart, G.S.; Adams, E.Q. Some aspects of the behavior of charcoal with respect to chlorine. J. Am. Chem. Soc. 1920, 42, 523–544. [Google Scholar] [CrossRef] [Green Version]
  33. Kawazoe, K.; Takeuchi, Y. Mass transfer in adsorption on bidisperse porous material-macro and micro-pore series diffusion model. J. Chem. Eng. Jpn. 1975, 7, 431–437. [Google Scholar] [CrossRef] [Green Version]
  34. Knox, J.C.; Armin, D.; Ebner, A.D.; LeVan, M.D.; Coker, R.F.; Ritter, J.A. Limitations of Breakthrough Curve Analysis in Fixed-Bed Adsorption. Ind. Eng. Chem. Res. 2016, 55, 4734–4748. [Google Scholar] [CrossRef] [Green Version]
  35. Kadama, S.A.; Shamzhy, M.V. IR Operando study of ethanol dehydration over M.F.I. zeolite. Catal. Today 2018, 304, 51–57. [Google Scholar] [CrossRef]
  36. Madeira, F.F.; Gnep, N.S.; Magnoux, P.; Maury, S.; Cadran, N. Ethanol transformation over HFAU, HBEA and HMFI zeolites presenting similar Bronsted acidity. Appl. Catal. A Gen. 2009, 367, 39–46. [Google Scholar] [CrossRef]
  37. Guisnet, M.; Magnoux, P. Organic chemistry of coke formation. Applied Catalysis A: General. 2001, 212, 83. [Google Scholar] [CrossRef]
  38. Uslamin, E.A.; Saito, H.; Kosinov, N.; Pidko, E.; Sekine, Y.; Hensen, E.J.M. Aromatization of ethylene over zeolite-based catalysts. Catal. Sci. Technol. 2020, 10, 2774. [Google Scholar] [CrossRef] [Green Version]
  39. Autthanit, C.; Praserthdam, P.; Jongsomjit, B. Oxidative and non-oxidative dehydrogenation of ethanol to acetaldehyde over different VOx/SBA-15 catalysts. J. Environ. Chem. Eng. 2018, 6, 6516–6529. [Google Scholar] [CrossRef]
  40. Foo, G.S.; Rogers, A.K.; Yung, M.M.; Sievers, C. Steric Effect and Evolution of Surface Species in the Hydrodeoxygenation of Bio-Oil Model Compounds over Pt/HBEA. ACS Catal. 2016, 6, 1292–1307. [Google Scholar] [CrossRef]
  41. Kosinov, N.; Uslamin, E.A.; Ferdy, J.; Coumans, F.J.A.G.; Wijpkema, A.S.G.; Rohling, R.Y.; Hensen, E.J.M. Structure and Evolution of Confined Carbon Species during Methane Dehydroaromatization over Mo/ZSM-5. ACS Catal. 2018, 8, 8459–8467. [Google Scholar] [CrossRef] [Green Version]
  42. Zhang, H.; Shao, S.; Xiao, R.; Shen, D.; Zeng, J. Characterization of Coke Deposition in the Catalytic Fast Pyrolysis of Biomass Derivates. Energy Fuels 2014, 28, 52–57. [Google Scholar] [CrossRef]
  43. Salman, N.; Rüscher, C.H.; Buhl, J.-C.; Lutz, W.; Toufar, H.; Stöcker, M. Effect of temperature and time in the hydrothermal treatment of HY zeolite. Microporous Mesoporous Mater. 2006, 90, 339–346. [Google Scholar] [CrossRef]
  44. Jia, L.Y.; Farouha, A.; Pinardb, L.; Hedanb, S.; Comparot, J.-D.; Dufour, A.; Tayeb, K.B.; Vezinc, H.; Batiot-Dupeyrat, C. New routes for complete regeneration of coked zeolite. Appl. Catal. B Environ. 2017, 219, 82–91. [Google Scholar] [CrossRef]
  45. Rietveld, H.M. A profile refinement method for nuclear and magnetic structures. J. Appl. Crystallogr. 1969, 2, 65–71. [Google Scholar] [CrossRef]
  46. Toby, B.H. EXPGUI, a graphical user interface for GSAS. J. Appl. Crystallogr. 2001, 34, 210–213. [Google Scholar] [CrossRef] [Green Version]
  47. Cullity, B.D. Elements of X-ray Diffraction, 2nd ed.; Addison-Wesley Publishing Company: Reading, MA, USA, 1978; pp. 99–106. [Google Scholar]
  48. Condon, J.B. Surface Area and Porposity Determinations by Physisorption: Measurements and Theory; Elservier: Amsterdam, The Netherlands, 2006; pp. 1–28. [Google Scholar]
  49. Lo, B.T.W.; Ye, L.; Tsang, S.E.D. The Contribution of Synchrotron X-Ray Powder Diffraction to Modern Zeolite Applications: A Mini-review and Prospects. Chem 2018, 4, 1778–1808. [Google Scholar] [CrossRef]
  50. Agostini, G.; Lamberti, C.; Palin, L.; Milanesio, M.; Danilina, N.; Xu, B.; Janousch, M.; Bokhoven, J.A. In situ XAS and XRPD parametric Rietveld refinement to understand dealumination of Y zeolite catalyst. J. Am. Chem. Soc. 2009, 132, 667–678. [Google Scholar] [CrossRef]
  51. Hammersley, A.P. FIT2D: A multi-purpose data reduction, analysis and visualization program. J. Appl. Cryst. 2016, 49, 646–652. [Google Scholar] [CrossRef]
  52. Vaarkamp, M.; Linders, J.C.; Koningsberger, D.C. A new method for parameterization of phase shift and backscattering amplitude. Phys. B 1995, 208–209, 159–160. [Google Scholar] [CrossRef] [Green Version]
  53. Koningsberger, D.C.; Prins, R. X-ray Absorption: Principles, Applications, Techniques of EXAFS, EXAFS, and XANES; John Wiley and Son: New York, NY, USA, 1988. [Google Scholar]
  54. Zabinsky, S.I.; Rehr, J.J.; Ankudinov, A.; Albers, R.C.; Eller, M.J. Multiple-scattering calculations of x-ray-absorption spectra. Phys. Rev. B 1995, 52, 2995–3009. [Google Scholar] [CrossRef]
Figure 1. Breakthrough curves for Vf (black), Vr300 (red), Vr350 (green), Vr400 (blue), and Vr450 (wine); solid line represents the calculated data with parameters shown in Table 1.
Catalysts 12 00095 g001
Figure 2. (a) Ethanol desorbed and species formed in the first (solid line) and second cycle of regeneration (dashed line) at 450 °C of EtOH-laden V2O5/NaY-SiO2: ethanol desorption (black ■), acetaldehyde formation (red ●), DEE formation (green ▲), ethylene formation (blue ▼); solid blue line in the figure is the temperature profile. (b) CO2 formed in air regeneration of EtOH-laden V2O5/NaY-SiO2 at an elevated temperature of 450 °C (black ■; first cycle, solid line; second cycle, dashed line), 400 °C (red ●), 350 °C (green ▲), and 300 °C (blue ▼).
Catalysts 12 00095 g002aCatalysts 12 00095 g002b
Figure 3. (a) FT-IR spectra in the region of 2700–3400 cm−1 for Vr300 (green), Vr350 (black), Vr400 (red), and Vr450 (blue). (b) FT-IR spectra in the region of 1300–1700 cm−1 for Vr300 (green) and Vr350 (black).
Catalysts 12 00095 g003aCatalysts 12 00095 g003b
Figure 4. DSC endothermic and exothermic profiles of Vr300 (black), Vr350 (red), Vr400 (green), and Vr450 (blue).
Catalysts 12 00095 g004
Figure 5. (a) Powder X-ray spectra of Vf (black), Vr350 (orange), Vr400 (blue), and Vr450 (pink). (b) Magnified powder X-ray spectra (29.7 < θ < 31.1) of Vf (black), Vr350 (orange), Vr400 (blue), and Vr450 (pink).
Catalysts 12 00095 g005
Figure 6. The Rietveld refinement of Vf (a), Vr400 (b), and Vr450 (c). (+) denotes experimental data, solid red line denotes simulation curve, blue line denotes baseline, green line denotes residue, magenta bar denotes diffraction position of NaY, and purple bar denotes diffraction peak position of quartz.
Catalysts 12 00095 g006
Figure 7. Nitrogen adsorption isotherm at 77 K for Vf (red ●), Vr400 (blue ), and Vr450 (green ).
Catalysts 12 00095 g007
Figure 8. Fourier transform (3.5 < k3 < 10.0, V-O phase corrected) of EXAFS spectra for Vf (black), Vr400 (blue), and Vr450 (red); magnitude (solid line), imaginary (dashed line).
Catalysts 12 00095 g008
Figure 9. Efficacy of air regeneration for Vr400 (black ■), Vr350 (red ●), NaYr200 (green ▲), Vr400 MMA-WG (orange ■), and NaYr200 MMA-WG (blue ▼).
Catalysts 12 00095 g009
Figure 10. Schematic diagram for (a) the formation of coke on V2O5/NaY-SiO2 and (b) dealumination concomitant with the aggregation of isolated VO4.
Catalysts 12 00095 g010
Table 1. Parameters of Equation (1) and relative effectiveness factor obtained from breakthrough curves *.
Adsorbentτ, 1/minξq0, mg/gRegeneration Efficacy(η × ka), L/min.mgη/ηvf
Vf0.5112.4461.39-8.101.00
Vr3000.5711.7051.480.849.091.12
Vr3500.6613.9853.290.8710.491.29
Vr4000.6815.3056.710.9210.791.33
Vr4500.8216.8351.670.8413.031.61
Note: *, adsorbent samples were tested at 30 °C with a total GHSV of 1800 h−1 inflowing 63 mg/L (C0) of ethanol with 260 ppm water moisture in the air; , regeneration efficacy = q0vr/q0vf.
Table 2. Species formed in temperature-programmed oxidation measurement.
Temperature °CSpecies ppm
EthanolAcetaldehydeDiethyl EtherEthyleneCO2Acetal
30027,40011,1004600630036,30030
35014,30068002400240045,70060
400800034001700120087,20080
450370014001000500110,80040
Table 3. Results of crystal parameters by Rietveld refinement.
Sample NameVr450Vr400Vf
Crystal systemCubicCubicCubic
Space groupF d -3 mF d -3 mF d -3 m
Lattice parameter, a (Å)24.4652(6)24.5048(6)24.5084(5)
Vol (Å3)146431471414721
Lattice parameters of SiO2 (Å)a = 4.9016(2)
c = 5.3916(4)
a = 4.9114(3)
c = 5.4030(6)
a = 4.9096(3)
c = 5.4038(6)
wRp0.0310.0450.041
Rp0.0220.0300.028
X20.6641.3481.094
Grain size calculated by Scherrer equation (nm)47.5746.546.2
Table 4. Summary of EXAFS analysis results for Vf, Vr400, and Vr450.
ShellNR1000 × Δσ2ΔE0EXAFS
(Å)2)(eV)Reference
Vf
V-OS1.01.60 ± 0.01−2 ± 2−1.6 ± 0.4V-O
V-Ol3.01.73 ± 0.022 ± 113.4 ± 0.2V-O
V-Alsup0.62 ± 0.042.66 ± 0.0114 ± 2−4.92V-Al
Vr400
V-OS 1.01.59 ± 0.01−4 ± 2−13 ± 1V-O
V-Ol4.01.70 ± 0.010.2 ± 0.112 ± 1V-O
V-Alsup0.4 ± 0.12.48 ± 0.023 ± 1−13 ± 3V-Al
V-V0.3 ± 0.12.91 ± 0.030 ± 1−2 ± 4V-V
Vr450
V-Os1.01.59 ± 0.01−4 ± 2−14 ± 1V-O
V-Ol4.01.70 ± 0.010 ± 111 ± 1V-O
V-Alsup0.2 ± 0.12.46 ± 0.053 ± 1−12 ± 1V-Al
V-V0.5 ± 0.12.92 ± 0.030 ± 3−2 ± 3V-V
Note: N, coordination number; R, the average distance between the absorber and backscatter atom; Δσ2, Debye–Waller factor difference between standard and sample; ΔE0, correction of inner potential.
Publisher’s Note: MDPI stays neutral with regard to jurisdictional claims in published maps and institutional affiliations.

