Abstract
The synthesis of carbon quantum dots (CQDs) from agricultural waste is a promising approach for waste valorization. In the present work, CQDs were synthesized using sugarcane bagasse as a carbon precursor. The nanocomposite of CQDs with trimetallic strontium–titanium ferrite was synthesized with an ultrasonication approach. The structural, magnetic and optical features of the synthesized nanocomposite and pristine NPs were studied using different analytical techniques. The TEM micrograph of the nanocomposite reveals the distribution of CQDs (8–10 nm) along with the agglomerated ferrite NPs. To validate the results, the photocatalytic efficiency of the nanocomposite, NPs and CQDs was comparatively studied for the photodegradation of nitroaromatic pollutants viz. p-nitrophenol, martius yellow and pendimethalin under visible-light irradiation. A nanocomposite having a 2:1 w:w ratio of CQDs and Sr0.4Ti0.6Fe2O4.6 displays an excellent photocatalytic performance, with the degradation efficiency ranging from 91.2 to 97.4%, as compared with 65.0–88.3% for pristine NPs and CQDs. These results were supported by band gap and photoluminescence analyses. The promising photocatalytic potential of the nanocomposite over the pristine CQDs and ferrite NPs could be ascribed to the increased specific-surface area (101.3 m2/g), lowering in band gap coupled with fluorescence-quenching which facilitated the transfer of photoinduced charge carriers. The impact of parameters affecting the photocatalytic process viz. pH, catalyst dose and contact time was also investigated. On the basis of quenching and gas chromatography-mass spectrometry (GC-MS) studies, plausible degradation pathways were proposed. The results highlight the broad potential of designing substituted ferrite-CQDs-based nanocomposites as reusable and visible-light-driven photocatalysts.
1. Introduction
The conversion of waste materials into valuable products is an important domain of research for future sustainability. Recent years have witnessed an exponential growth in the synthesis of nanomaterials using agricultural solid wastes as natural precursors [1,2,3]. They are rich sources of carbon, and various reports have been published on the synthesis and characterization of carbon quantum dots (CQDs) via the carbonization of lemon, coir, orange peel, foxtail millet, sugarcane bagasse, pineapple, banana leaf, etc. [4,5,6,7,8,9]. CQDs are a new class of “zero-dimensional” nanomaterial, possessing sp3-bonded carbon atoms with oxygeneous moieties viz. hydroxyl, epoxy, carbonyl and carboxylic groups [6,7]. Quantum dots are nanometric particles, having diameters less than 10 nm and being capable of absorbing and emitting light at specific wavelengths because of their amorphous carbon frameworks and graphitic cores [10,11]. They exhibit unique physicochemical characteristics viz. photostability, biocompatibility, chemical inertness, high specific surface areas and excellent optical properties [12,13]. The use of sugarcane bagasse as a carbon source is a novel strategy for the synthesis of CQDs from both sustainable and economic aspects due to its large abundance, biodegradability and low cost [8,9]. It is an important step towards waste valorization, since the dumping of sugarcane bagasse causes a huge obstacle for producing millions of tons of sugarcane molasses every year. Pandiyan et al. [8] and Thambiraj et al. [9] synthesized highly fluorescent CQDs using sugarcane bagasse waste as the precursor material.
CQDs have drawn exquisite interest as photocatalysts because of their strong blue photoluminescence and optical absorption in UV and near-visible regions [12,13,14,15,16,17,18,19,20]. Hu et al. [17] reported the fabrication of CQDs by heating various carbon sources. It was observed that carbonyl functional moieties on the surface can induce high upward band bending, which helped in reducing the recombination of charge carriers. Li et al. [18] synthesized CQDs (1–4 nm) using an electrochemical approach, for photocatalytic oxidation of benzyl alcohol to benzaldehyde under near-infrared light exposure. However, the regeneration of CQDs from an aqueous medium after the photocatalytic reaction demands a great deal of energy (solid/liquid separations using membrane filtration or centrifugation) [21]. Nanocomposites with metal oxide NPs afford easy magnetic separation [22,23,24].
Ferrites are mixed metal oxides having iron oxide as their major component. Doped ferrite NPs have the additional advantages of higher surface areas and enhanced photocatalytic activities [25,26,27,28]. Few reports are available on the synthesis of the nanocomposites of CQDs with CoFe2O4, ZnFe2O4 and Co0.9Ni0.1Fe2O4 NPs for photocatalytic applications [29,30,31]. The use of CoFe2O4-CQDs nanocomposites have been reported for the enhanced photodegradation of azo dyes as compared with pristine CQDs and CoFe2O4 NPs [29]. Elkodous et al. [30] synthesized the Co0.9Ni0.1Fe2O4/SiO2/TiO2-CQDs nanocomposite, which presented the 80% degradation of chloramine T in 90 min under ultraviolent irradiation. ZnFe2O4-CQDs (15 vol%) nanocomposites have been reported with excellent photoactivity for NO removal [31]. However, the synergistic effect of the doping of ferrite NPs and making of their nanocomposite with CQDs has not been reported till now. It can be an effective strategy in improving the photocatalytic potential of CQD’s-ferrite-based nanocomposites. In the present work, the nanocomposite of titanium-substituted strontium ferrite NPs with CQDs was synthesized and studied for the enhancing of the photocatalytic potential. Photocatalysts with vacancies display extended optical absorption and facilitate charge separation, which results in improved photocatalytic activity [32]. Strontium ferrite NPs have the potential for the occurrence of oxygen vacancies due to the large size of Sr2+ ions [33,34,35]. The substitution of tetravalent titanium (Ti4+) ions in strontium ferrite NPs resulted in a non-stoichiometric metal/oxygen ratio and caused the generation of greater vacancies and oxygen hyper stoichiometry, thus favoring the improvement in photocatalytic activity.
The photocatalytic ability of the synthesized nanocomposite was compared with the pristine CQDs and titanium-substituted strontium ferrite NPs for the photodegradation of three nitroaromatic model pollutants, namely p-nitrophenol, pendimethalin and martius yellow, which are persistent bioaccumulative toxins. The different experimental conditions (solution pH, 1.0–9.0; contact time, 2–720 min and catalyst dose, 0.1–1.0 g/L) were optimized. The Langmuir–Hinshelwood kinetic model was employed for the evaluation of the apparent rate constant. Quenching experiments, band gap studies and GC-MS analysis were conducted to predict the plausible degradation mechanism. The results confirm that the heterojunction photocatalyst system has the potential for the photocatalytic degradation of hazardous nitroaromatic pollutants. The present study affords a facile strategy for enhancing the photocatalytic potential of CQD-ferrite-based nanocomposites.
2. Results and Discussion
2.1. Characterization
2.1.1. Structural Analysis
The crystalline structure and phase purity of synthesized NPs and nanocomposites were examined using powdered X-ray diffraction (p-XRD) measurements as presented in Figure 1a, and the calculated XRD parameters are listed in Table 1. The p-XRD spectrum of CQDs reveals a single broad diffraction peak centered at 21.0° indexed to (002) plane, having highly disordered carbon with a low crystalline structure (JCPDS CARD No. 08-0415). The p-XRD profile of Sr0.7Ti0.3Fe2O4.6 reveals the diffraction peaks centered at 2θ = 30.3°, 32.6°, 35.7°, 37.3°, 43.4°, 57.4° and 63.0° ascribed to (220), (230), (311), (222), (400), (333) and (440) Miller planes, respectively. All of the observed peaks matched with the standard and JCPDS card of SrFe2O4 (No. 08–0234), with the slight shift of major peak (2θ = 35.7°) as compared with pristine SrFe2O4 phase, indicating the successful incorporation of Ti4+ ions in the spinel phase, with the additional peak at 2θ = 32.6° corresponding to the TiFe2O5 phase. The p-XRD pattern of nanocomposite displayed the diffraction peaks of Sr0.7Ti0.3Fe2O4.6 NPs with the absence of the CQDs peak. However, the presence of CQDs is confirmed from the FT-IR studies. The disappearance of the CQD’s peak might be due to the high dispersal and low crystalline nature of CQDs, and is consistent to the results reported by Huang et al. [36] for the CQDs-MnFe2O4 nanocomposite.
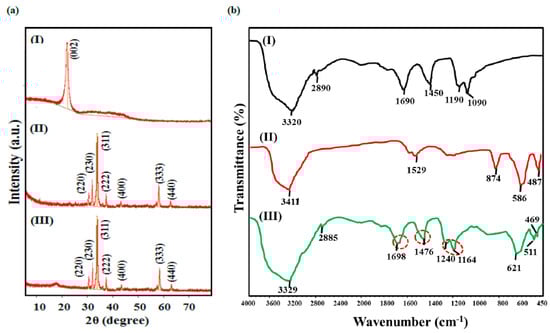
Figure 1.
(a) XRD patterns and (b) FT-IR spectra of (I) CQDs, (II) Sr0.4Ti0.6Fe2O4.6 NPs and (III) CQDs− Sr0.4Ti0.6Fe2O4.6 nanocomposite.

Table 1.
XRD parameters of Sr0.4Ti0.6Fe2O4.6, CQDs and CQDs−Sr0.4Ti0.6Fe2O4.6.
The FT-IR spectrum of the CQDs demonstrated that the prominent peaks at 3320 cm−1, 2890 cm−1, 1690 cm−1, 1450 cm−1, 1190 cm−1 and 1090 cm−1 correspond to the O-H, C-H, C=O, C=C, C-O (ether) and C-OH bands present on the surface of CQDs synthesized from sugarcane bagasse (Figure 1b (I)). The FT-IR spectrum of Sr0.4Ti0.6Fe2O4.6 NPs depicted the broad band at 3411 cm−1 (O-H stretching vibrations) and absorption bands corresponding to Fe3+−O2− Ti4+−O2− and Sr2+−O2− stretching vibrations at 874 cm−1, 586 cm−1 and 427 cm−1 (Figure 1b (II)). The FT-IR spectrum of the nanocomposite contained all of the diffraction bands corresponding to CQDs, but they were located at higher wave numbers, indicating the change in the coordination environment of functional moieties in the nanocomposite. The shift of the band from 1690 cm−1 to 1698 cm−1 corresponding to C=O vibration shows the conversion of carboxylic groups to carboxylate group in the nanocomposite, and thus signifies the successful combination of CQDs and Sr0.4Ti0.6Fe2O4.6 NPs. This shift is well in agreement with the results reported by Nagashabandi et al. [37] for the nanocomposites of CoFe2O4 and NiFe2O4 NPs with GQDs.
X-ray photoelectron spectroscopy (XPS) analysis was performed to analyze the surface elements and the binding states of the synthesized photocatalysts. The full range XPS survey spectra of CQDs, Sr0.4Ti0.6Fe2O4.6 and the nanocomposite depicted the characteristic peaks of the elements present, as shown in Figure 2a. High-resolution spectra of O‘1s’ peaks in CQDs were observed at 530.35 eV and 533.56 eV, assigned to hydroxyl (OH) and carboxylic oxygen groups (COOH) (Figure 2b) [38]. However, in the nanocomposite, the deconvolution of the O‘1s’ peak shows three distinct peaks at 529.65 eV, 530.45 eV and 531.85 eV which corresponded to metal–oxygen bonding (Sr-O/ Ti-O/ Fe-O), OH and COOH groups (Figure 2b). The deconvolution of C‘1s’ peaks in CQDs demonstrates that the four distinct peaks at 283.05 eV, 283.85 eV, 284.05 eV and 285.35 eV are attributed to the C=C/C-C, C-O, C-OH, and O=C-O, respectively (Figure 2c). High resolution XPS spectra of Ti‘2p’ (Figure 2e) at binding energies of 464.5 eV and 458.8 eV (Sr0.4Ti0.6Fe2O4.6); 465.7 eV and 459.9 eV (Sr0.4Ti0.6Fe2O4.6-CQDs) has shown the characteristic peaks of Ti‘2p1/2′ and Ti‘2p3/2’, respectively, attributed to Ti4+ ions. The deconvoluted Sr‘3d’ peaks at 133.2 eV and 133.6 eV were observed in Sr0.4Ti0.6Fe2O4.6 and Sr0.4Ti0.6Fe2O4.6-CQDs (Figure 2f), respectively. The satellite peaks centered at 711.7 eV and 725.9 eV (Sr0.4Ti0.6Fe2O4.6) and 711.1 eV and 724.7 eV (nanocomposite) authenticate the presence of Fe3+ ions assigned to Fe‘2p3/2′ and Fe‘2p1/2’ (Figure 2g), respectively. The red shift in the C ‘1s’ and Fe ‘2p’ peaks might be due to binding between Sr0.4Ti0.6Fe2O4.6 NPs and CQDs as a result of π-π interactions.
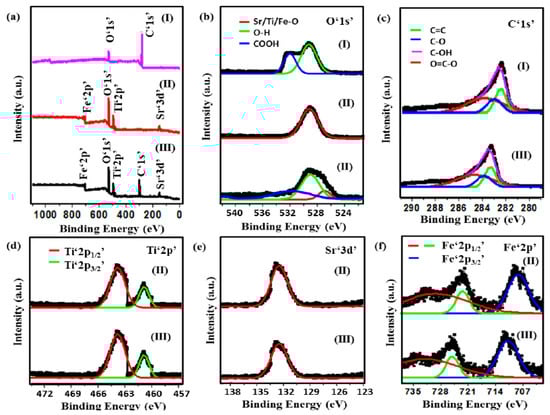
Figure 2.
(a) XPS survey spectra, XPS high-resolution spectra of (b) O‘1s’, (c) C‘1s’, (d) Ti‘2p’, (e) Sr‘3d’ and (f) Fe‘2p’ of (I) CQDs, (II) Sr0.4Ti0.6Fe2O4.6 NPs and (III) CQDs−Sr0.4Ti0.6Fe2O4.6 nanocomposite.
2.1.2. Morphology, Surface Area and Magnetic Studies
The particle morphology, topography and surface composition of synthesized nanomaterials was examined by employing TEM and SEM-EDX analysis. The TEM micrograph of the CQDs depicted spherical-shaped NPs (Figure 3a) with an average diameter of approximately 8–10 nm. The chain and cluster-like morphology of CQDs might be due to the weak Vander Waal’s forces and hydrogen bonding between the different particles due to the presence of abundant oxy-functional groups. Sr0.4Ti0.6Fe2O4.6 NPs (Figure 3b) exhibited a granular structure with most of the particles aggregated together and held in a broad particle size distribution ranging from 30–35 nm, which was assigned to the excellent magnetic properties and Vander Waal’s forces. The less agglomerated Sr0.4Ti0.6Fe2O4.6 NPs were noticeable in CQDs-Sr0.4Ti0.6Fe2O4.6 nanocomposite, indicating the effective prevention of aggregation in the presence of CQDs (Figure 3c). Furthermore, the distribution of small-sized CQDs along with the Sr0.4Ti0.6Fe2O4.6 NPs can be clearly depicted in the TEM micrograph. Comparable results were observed by Li et al. [39] while fabricating the CQD-doped magnetic nanofibers for the adsorptive removal of Hg (II) ions.
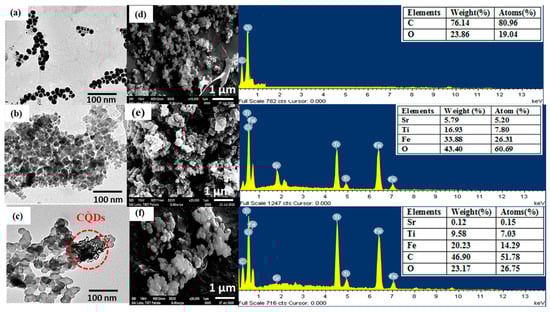
Figure 3.
TEM and SEM-EDS images along with table of elemental composition in the inset of EDS pattern (a,d) CQDs, (b,e) Sr0.4Ti0.6Fe2O4.6 and (c,f) CQDs-Sr0.4Ti0.6Fe2O4.6 nanocomposite.
The SEM micrograph of CQDs clearly depicted the segregated smaller NPs and the EDS spectrum contained the peaks corresponding to C (80.96%) and O (19.04%) elements, revealing the presence of abundant oxy-functionalities on the surface (Figure 3d). The absence of any other peak signified the purity of the CQDs. The crystallized agglomerated grains of Sr0.4Ti0.6Fe2O4.6 NPs (Figure 3e) were clearly displayed from the SEM micrograph. The SEM image of the nanocomposite demonstrated the agglomerates of Sr0.4Ti0.6Fe2O4.6 NPs with isolated CQDs and EDS mapping authenticated the presence of C, O, Sr, Ti and Fe on the surface. These results are the strong evidences for the combination of CQDs and Sr0.4Ti0.6Fe2O4.6 NPs in the nanocomposite (Figure 3f).
N2 adsorption–desorption isotherm measurements were conducted to examine the surface properties of the synthesized NPs and nanocomposites. The Brunauer–Emmett–Teller (BET) isotherms followed the type IV, with H3-type hysteresis loop for CQDs (Figure 4a), Sr0.4Ti0.6Fe2O4.6 NPs (Figure S2a) and the nanocomposite (Figure 4b), as per the IUPAC classification indicative of typical mesoporous nature. The Barret–Joyner–Halenda (BJH) pore size investigation displayed unimodal pore size distribution (Figure 4a,b (inset)). The higher BET surface areas of the CQDs (91.27 m2g−1) as compared with pristine Sr0.4Ti0.6Fe2O4.6 NPs (77.62 m2g−1) was ascribed to their amorphous carbon structure. The BET surface area of the nanocomposite increased to 101.27 m2g−1 with the addition of CQDs and Sr0.4Ti0.6Fe2O4.6 NPs. This enhanced specific surface area signified the presence of Sr0.4Ti0.6Fe2O4.6 NPs and CQDs producing a synergistic effect to improve the surface texture, thus facilitating the improvement in photocatalytic efficiency. The range of pore diameters (Table 2) further confirmed the mesoporous structure, and is consistent to the results obtained from the N2 adsorption–desorption isotherms.
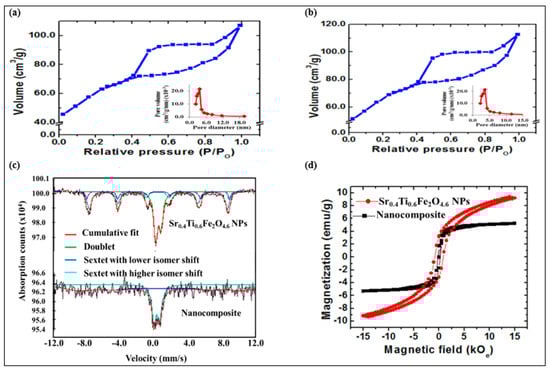
Figure 4.
BET isotherm curves and pore size distribution (inset) of (a) CQDs, (b) CQDs−Sr0.4Ti0.6Fe2O4.6 nanocomposite, (c) Mӧssbauer spectra and (d) hysteresis curves of Sr0.4Ti0.6Fe2O4.6 and (d) CQDs−Sr0.4Ti0.6Fe2O4.6 nanocomposite.
Table 2.
BET and VSM parameters of Sr0.4Ti0.6Fe2O4.6, CQDs and CQDs−Sr0.4Ti0.6Fe2O4.6.
The Mӧssbauer spectrum of the Sr0.4Ti0.6Fe2O4.6 NPs displaying the two sextets with the different isomer shift (IS1 = 0.4, IS2 = 0.3 mm/s) indicated the presence of iron ions in an Fe3+ state (Figure 4c and Table 3). The appearance of a quadruple doublet with an IS and QS of 0.3 and 0.6 mm/s corresponded to superparamagnetic fraction of Sr0.4Ti0.6Fe2O4.6 NPs with the incorporation of Ti4+ ions in the lattice. The Mössbauer spectrum is largely dependent on the size distribution of NPs [40]. As a result of different particle size distributions, the Mӧssbauer spectrum of nanocomposites is fitted with two sub-spectra, a doublet (IS/QS = 0.3/0.7 mm/s) and a broad sextet (IS/QS = 0.8/–0.0 mm/s) corresponding to the fast- and slow-relaxing magnetic moments (Figure 4c and Table 3). The relaxation rate of the magnetization vector for the small NPs becomes faster than the Larmor frequency of nuclear spin precession, and the outcome of such a phenomenon is a zero mean value of magnetic hyperfine interactions responsible for the quadruple doublet. On the contrary, the Larmor precession frequency for larger NPs is of same order as that of the relaxation time, due to which a broad sextet appeared in the spectrum. The disappearance of the second sextet might be assigned to the weakening of super-exchange interactions due to the existence of CQDs in the sample.
Table 3.
Mӧssbauer parameters of Sr0.4Ti0.6Fe2O4.6, CQDs and CQDs−Sr0.4Ti0.6Fe2O4.6.
The magnetic properties were characterized using VSM analysis with the applied field varying from −15 kOe to + 15 kOe, and the evaluated magnetic parameters are listed in Table 2. The Sr0.4Ti0.6Fe2O4.6 NPs and the nanocomposite depicted the s-shaped narrow hysteresis loop illustrate the ferrimagnetic behavior (Figure 4d). The Ms value of the nanocomposite (4.25 emu/g) was lower than pristine Sr0.4Ti0.6Fe2O4.6 NPs (9.35 emu/g), which could be assigned to the incorporation of non-magnetic CQDs which consequently reduced the magnetic permeability and quenched the magnetic moment. The high coercivity value of pristine Sr0.4Ti0.6Fe2O4.6 NPs might be due to the larger crystalline size resulting in higher magnetocrystalline anisotropy energy. The difference observed in Hc was attributed to the introduction of non-magnetic CQDs thus restricting the surface moments without affecting the magnetic properties of Sr0.4Ti0.6Fe2O4.6 NPs.
2.2. Optical Studies
The optical properties of CQDs, Sr0.4Ti0.6Fe2O4.6 NPs and their nanocomposites were studied by evaluating the band gap values from the Tauc’s plot, as illustrated in Figure 5a using the following equation:
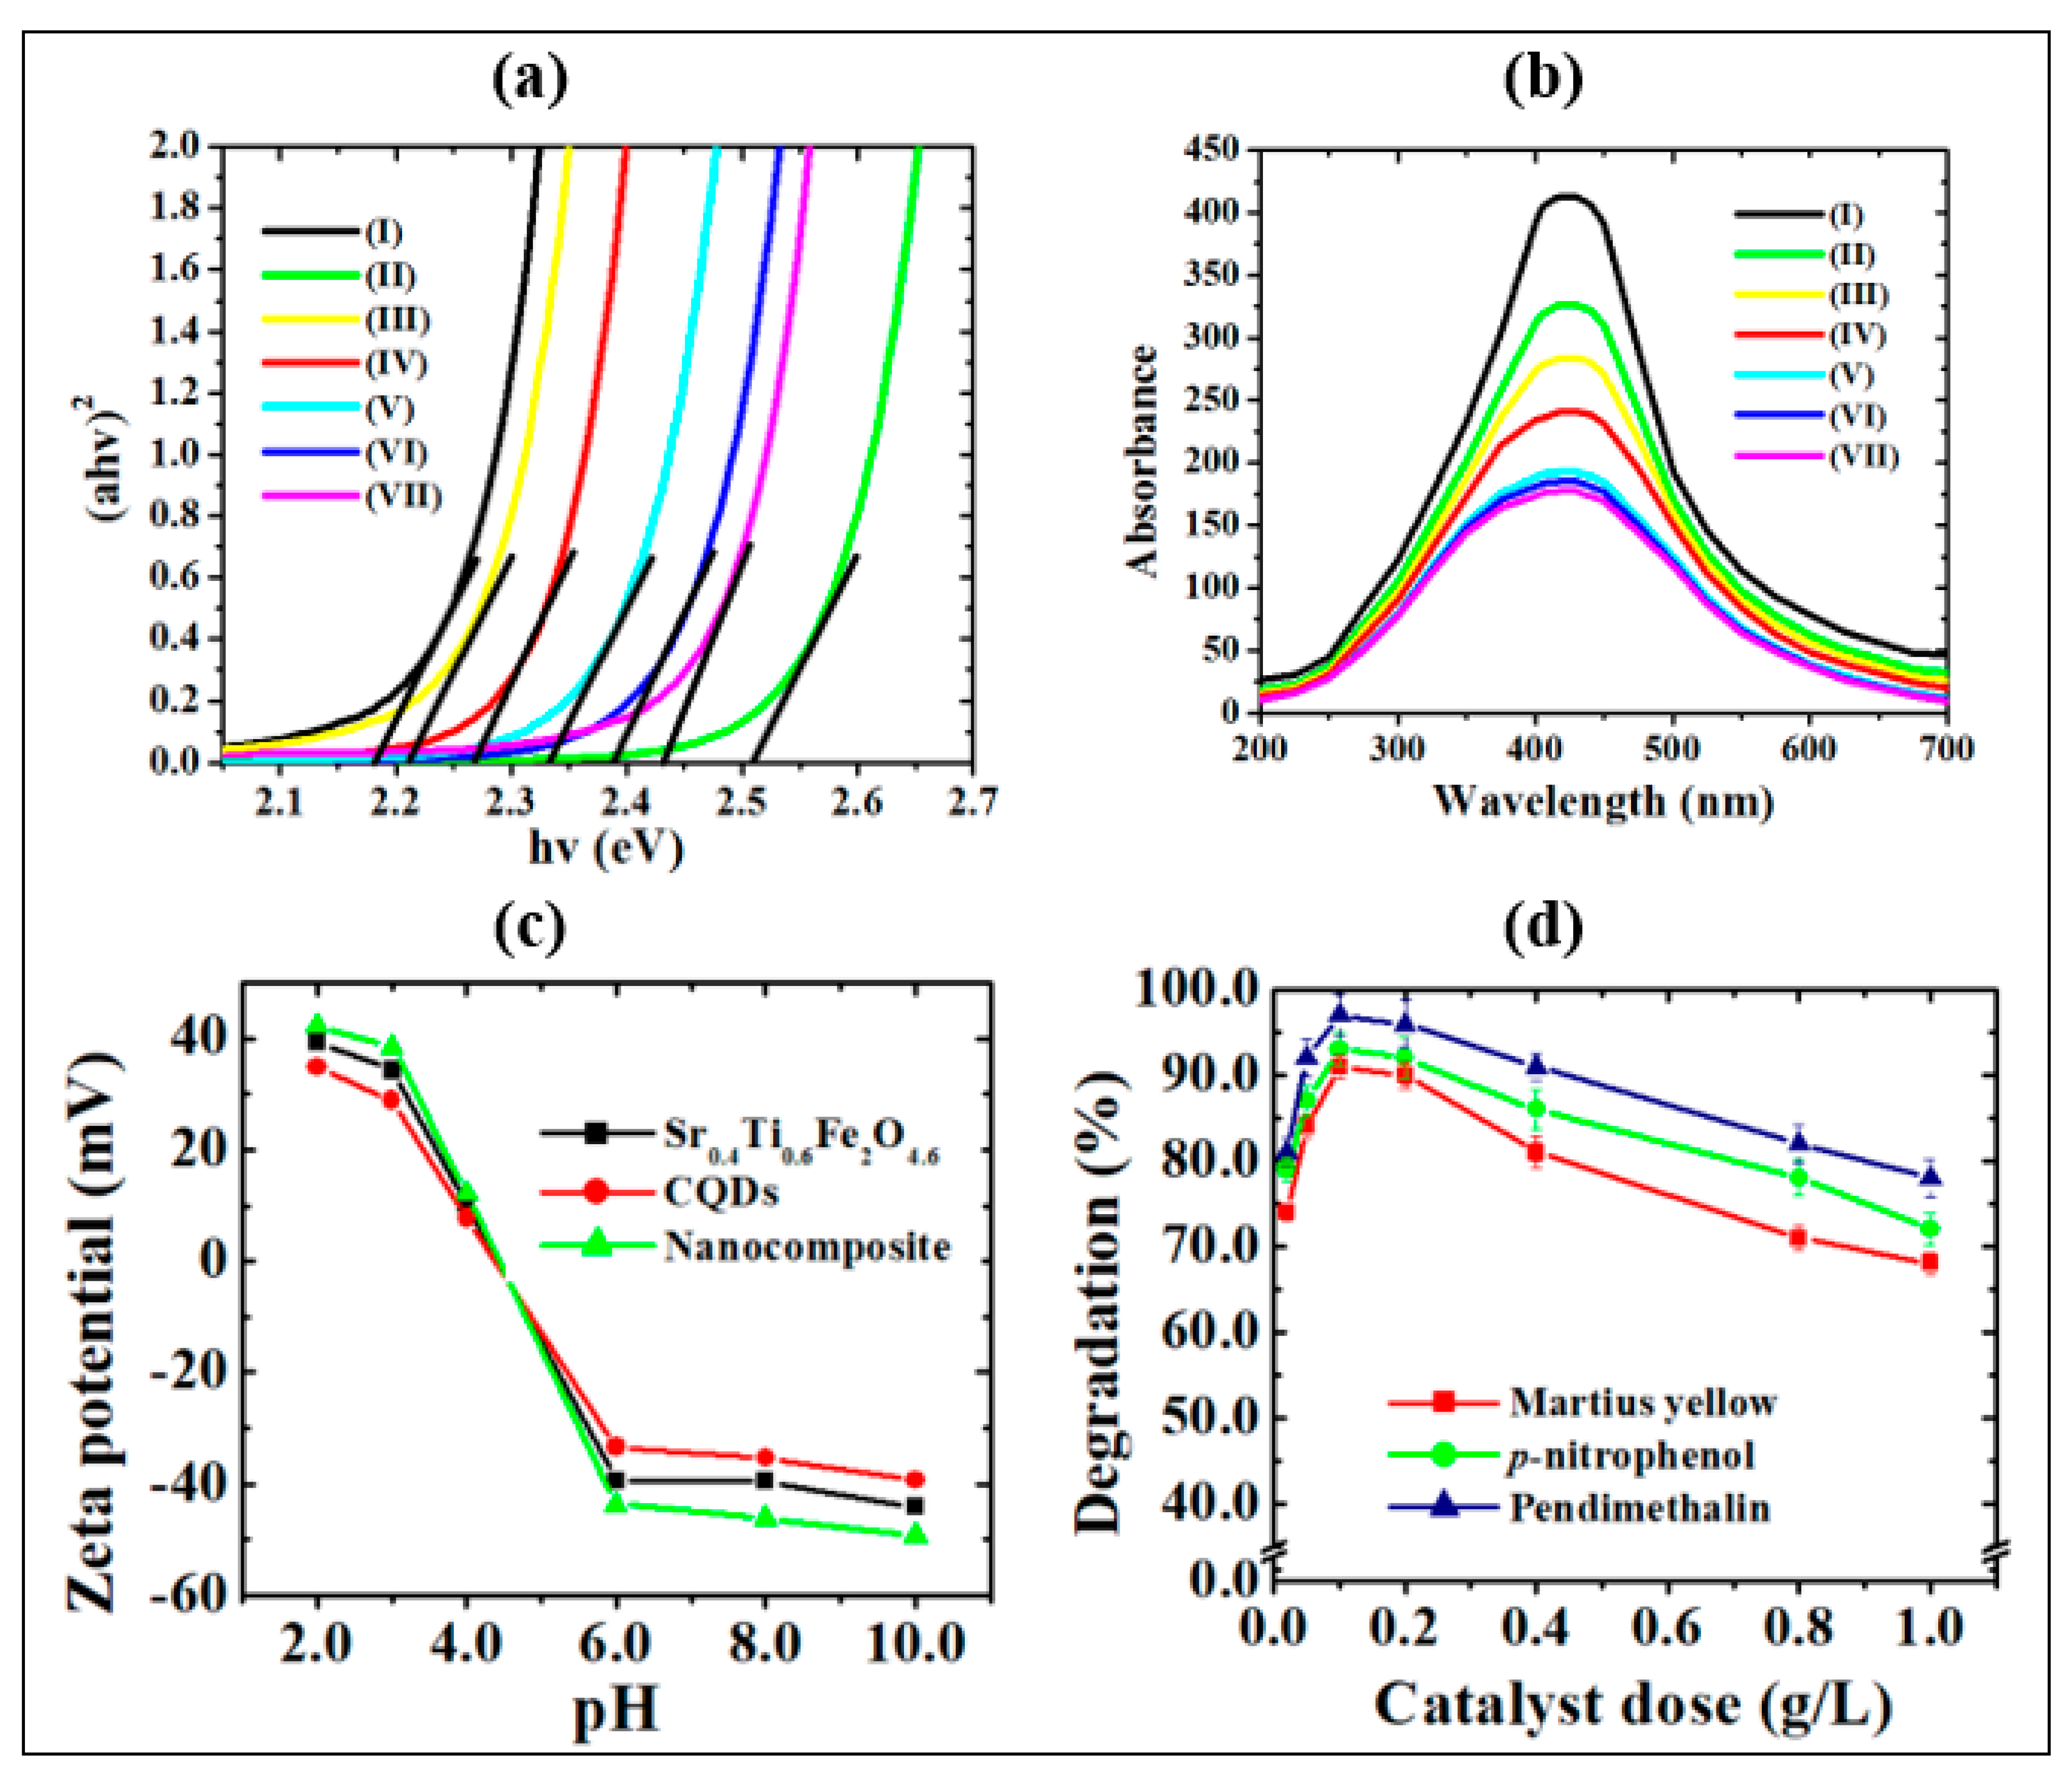
where α, A, hν and Eg are the absorption constant, proportionality constant, photon energy and the band gap energy, respectively. The extrapolation of the linear part of the curve between the (αhν)2 vs. hν curves provides the band gap energies. As depicted in Figure 5a, the Eg values of the CQDs-Sr0.4Ti0.6Fe2O4.6 nanocomposite decreased down to a 2:1 w:w ratio due to the presence of photon-harvesting CQDs. The increase in the Eg values on further increasing the CQDs content might be ascribed to the shielding of Sr0.4Ti0.6Fe2O4.6 NPs from absorbing visible light. The optical absorption in the nanocomposites exhibited an excellent light response in the visible light range. The blue shift of the Eg values with respect to pristine Sr0.4Ti0.6Fe2O4.6 NPs corresponded to the quantum confinement effect of the CQDs in the nanocomposites. The CQDs in the nanocomposites decreased the particle size by reducing the aggregation of Sr0.4Ti0.6Fe2O4.6 NPs and caused the widening of the bandgap. The similar blue shift of band gap energies was consistent to the results reported by Kabel et al. [41] for molybdenum disulfide quantum dots due to the quantum confinement effect. However, the band gap of nanocomposites has remarkably reduced as compared with pristine CQDs, which might be due to creation of hybridized energy levels at the interface between the Sr0.4Ti0.6Fe2O4.6 NPs and CQDs leading to more promising potential for the transport of photogenerated-charge carriers. The study of the radiative recombination transitions occurring within the synthesized photocatalysts is important. Hence, the fluorescence spectroscopy analysis was carried out at room temperature and is presented in Figure 5b.
αhν = A (hν − Eg)2
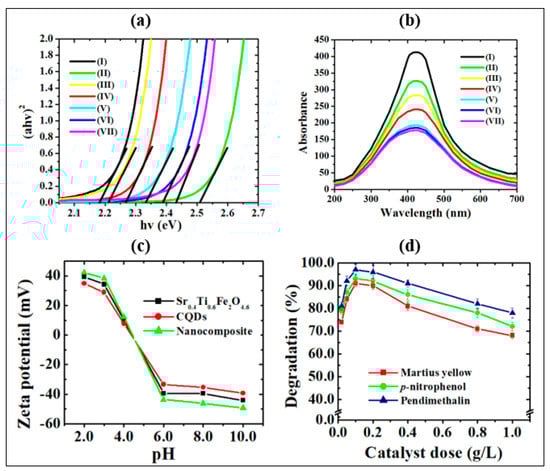
Figure 5.
(a) Tauc plot and (b) photoluminescence spectra of (I) Sr0.4Ti0.6Fe2O4.6, (II) CQDs, (III) CQDs−Sr0.4Ti0.6Fe2O4.6 (0.5:1.0), (IV) CQDs−Sr0.4Ti0.6Fe2O4.6 (1.0:1.0), (V) CQDs−Sr0.4Ti0.6Fe2O4.6 (2.0:1.0), (VI) CQDs−Sr0.4Ti0.6Fe2O4.6 (4.0:1.0) and (VII) CQDs−Sr0.4Ti0.6Fe2O4.6 (8.0:1.0) nanocomposites, (c) Zeta potential curve, (d) effect of catalyst dose (experimental conditions: pH, 3.0; irradiation time, 2 h and concentration 2.0 mg/L (p-nitrophenol and pendimethalin and 0.2 mg/L (martius yellow))).
The radiative fluorescence spectral analysis was examined by recording the photoluminescence (PL) emission spectra in the wavelength range of 200–700 nm. The narrow PL emission area with the emission band centered at 410 nm validates the narrow size distribution of CQDs because of similar quantum effects [42] and emission traps on the surface, which matches well with the results of TEM. This band might be due to the presence of radiative, structural and surface defects assigned to n* transitions of CQDs [43] and d-d transitions in Fe3+ ions [44] for CQDs and Sr0.4Ti0.6Fe2O4.6 NPs, respectively. The decreased luminous intensity of CQDs−Sr0.4Ti0.6Fe2O4.6 nanocomposites and increased broadening of the band in the nanocomposite with increasing CQDs content might be attributed to the quantum confinement effect with the introduction of small-sized CQDs. This phenomenon is consistent to the fluorescence of ZnO using quantum size effects [45]. In the present study, the PL emissions decrease in the following order: CQDs−Sr0.4Ti0.6Fe2O4.6 CQDs Sr0.4Ti0.6Fe2O4.6. The transference of electrons from the conduction band of Sr0.4Ti0.6Fe2O4.6 to the CQDs was energetically favorable, thus resulting in efficient charge separation and prohibiting the electron-hole pair recombination. The diminished peak intensities correlate well with the band gap studies. The quenching of the PL intensity confirms the inhibition of the charge carriers’ recombination, and supports the higher photocatalytic activity of the nanocomposite as compared with CQDs and Sr0.4Ti0.6Fe2O4.6 NPs. The quantum yield of the synthesized CQDs obtained from the carbonization of sugarcane bagasse was determined to be 78.4%, which is higher than previously reported CQDs [8,9]. The comparison of the quantum yield values using agricultural waste products is presented in Table S1. The enhanced quantum efficiency is based on the crystal size distribution of the CQDs.
2.3. Photodegradation Studies
The photodegradation (%) of p-nitrophenol, pendimethalin and martius yellow at different pH values (1.0–9.0) using CQDs, Sr0.4Ti0.6Fe2O4.6, NPs and their nanocomposites CQDs−Sr0.4Ti0.6Fe2O4.6 with different w/w ratio (0.2 g/L dose) was conducted according to Figures S2a and S3. The comparative evaluation of the photodegradation studies of undoped and titanium-doped strontium ferrite NPs is illustrated in Figure S1d–f and discussed in Supplementary Materials Text S1. The CQDs-Sr0.4Ti0.6Fe2O4.6 with a 2:1 w/w ratio exhibited the highest (%) photodegradation efficiency of 94.0%, 97.3% and 91.2% for p-nitrophenol, pendimethalin and martius yellow under visible light irradiation, and hence was used for conducting the further studies. The pH solution plays a vital role in photodegradation, as it can influence the adsorption–desorption equilibrium and surface charge on the photocatalyst and ionization of organic pollutants. The pH solution also has impact on the generation of reactive oxygen species. The excellent photodegradation performance at an optimized pH of 3.0 was attributed to the generation of more reactive oxygen species. H+ ions in an aqueous phase react with superoxide (O2−•) radicals and become converted to more reactive organic peroxyl radicals. These highly reactive •OOH radicals would undergo decomposition via hydrolysis and radical-radical reactions, causing the high concentration of reactive oxygen species, viz. •OOH, O2−• and •OH radicals in the reaction solution, which are responsible for the efficient photodegradation potential. Moreover, the acidic conditions favor the approach of nitroaromatic compounds on the photocatalyst’s surface due to electrostatic attractions between the positively charged photocatalyst surface and the free electrons of the oxygen/nitrogen functional moieties of nitroaromatic compounds [46,47,48]. A control experiment was performed to rule out the case of self-degradation of the nitroaromatic pollutants due to photolysis, where a trivial change was accompanied under UV and visible light irradiation (Figure 6a and Figure S2a–f). The synthesized photocatalysts demonstrated the higher photocatalytic efficiency at an acidic pH with the irradiation of visible light (Figure 6a and Figure S2b,c) as compared with ultraviolet light (Figure S2e,f).
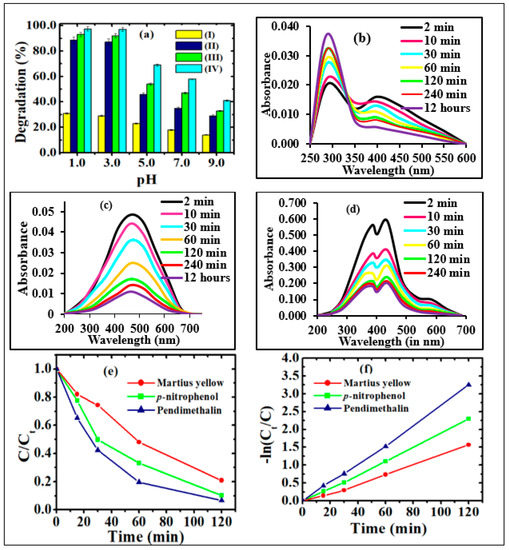
Figure 6.
(a) Photocatalytic degradation of pendimethalin under (a) visible light irradiation in the presence of (I) without photocatalyst, (II) Sr0.4Ti0.6Fe2O4.6, (III) CQDs and (IV) CQDs−Sr0.4Ti0.6Fe2O4.6 nanocomposite (2.0: 1.0 w/w ratio) (Experimental conditions: catalyst dose, 0.2 g/L; irradiation time, 2 h and concentration 2.0 mg/L (p−nitrophenol and pendimethalin and 0.2 mg/L (martius yellow))); Temporal graph for the photocatalytic degradation of (b) p−nitrophenol, (c) pendimethalin and (d) martius yellow pendimethalin, (e) effect of contact time and (f) corresponding kinetic plots on photodegradation of nitroaromatics using CQDs−Sr0.4Ti0.6Fe2O4.6 nanocomposite (2.0: 1.0 w/w ratio).
The higher photocatalytic efficiency of the CQDs−Sr0.4Ti0.6Fe2O4.6 (2:1 w/w ratio) nanocomposite with the increased CQDs content might be ascribed to the introduction of CQDs which are effective photon-harvesting agents and show strong optical absorption due to π-π* and n-π* transitions of C=C and C=O bonds, respectively [49]. A further increment of CQDs content resulted in a decline in photocatalytic activity. Increasing the amount of CQDs improved the charge separation, but too high a content of CQDs can shield the Sr0.4Ti0.6Fe2O4.6 NPs from absorbing visible light. As a result of the reduced light harvesting, the generation of electron-hole pairs decreases, resulting in decreased photocatalytic activity. The observed results are supported by the lowering of the band gap and decrease in photoluminescent intensity. The improved photocatalytic performance of the nanocomposite could also be attributed to the increase in the heterogeneous surface area of 101.3 m2/g as compared with pristine CQDs (91.2 m2/g) and Sr0.4Ti0.6Fe2O4.6 (77.6 m2/g) NPs. The high positive ξ- potential value of +35.4 mV at the optimized pH for the nanocomposite further supports the higher photocatalytic efficiency of anionic nitroaromatic pollutants (Figure 5d). Thus, the CQDs-Sr0.4Ti0.6Fe2O4.6 with a 2:1 w/w ratio are best photocatalyst at the optimum pH 3.0 for the studied nitroaromatic compounds.
Supplementary Text S2 explains the effect of the photocatalyst dosage in detail. The photodegradation efficiency of nitroaromatic pollutants increased as the photocatalyst dose was increased from 0.02 to 0.2 g/L, owing to the availability of a large surface area and a greater number of active photocatalytic sites (Figure 5d). However, as the catalyst dose increased beyond 0.2 g/L, the photocatalytic rate reduced due to increasing aggregation, i.e., particle–particle interaction increased while the surface area available for light absorption decreased.
2.3.1. Influence of Contact Time
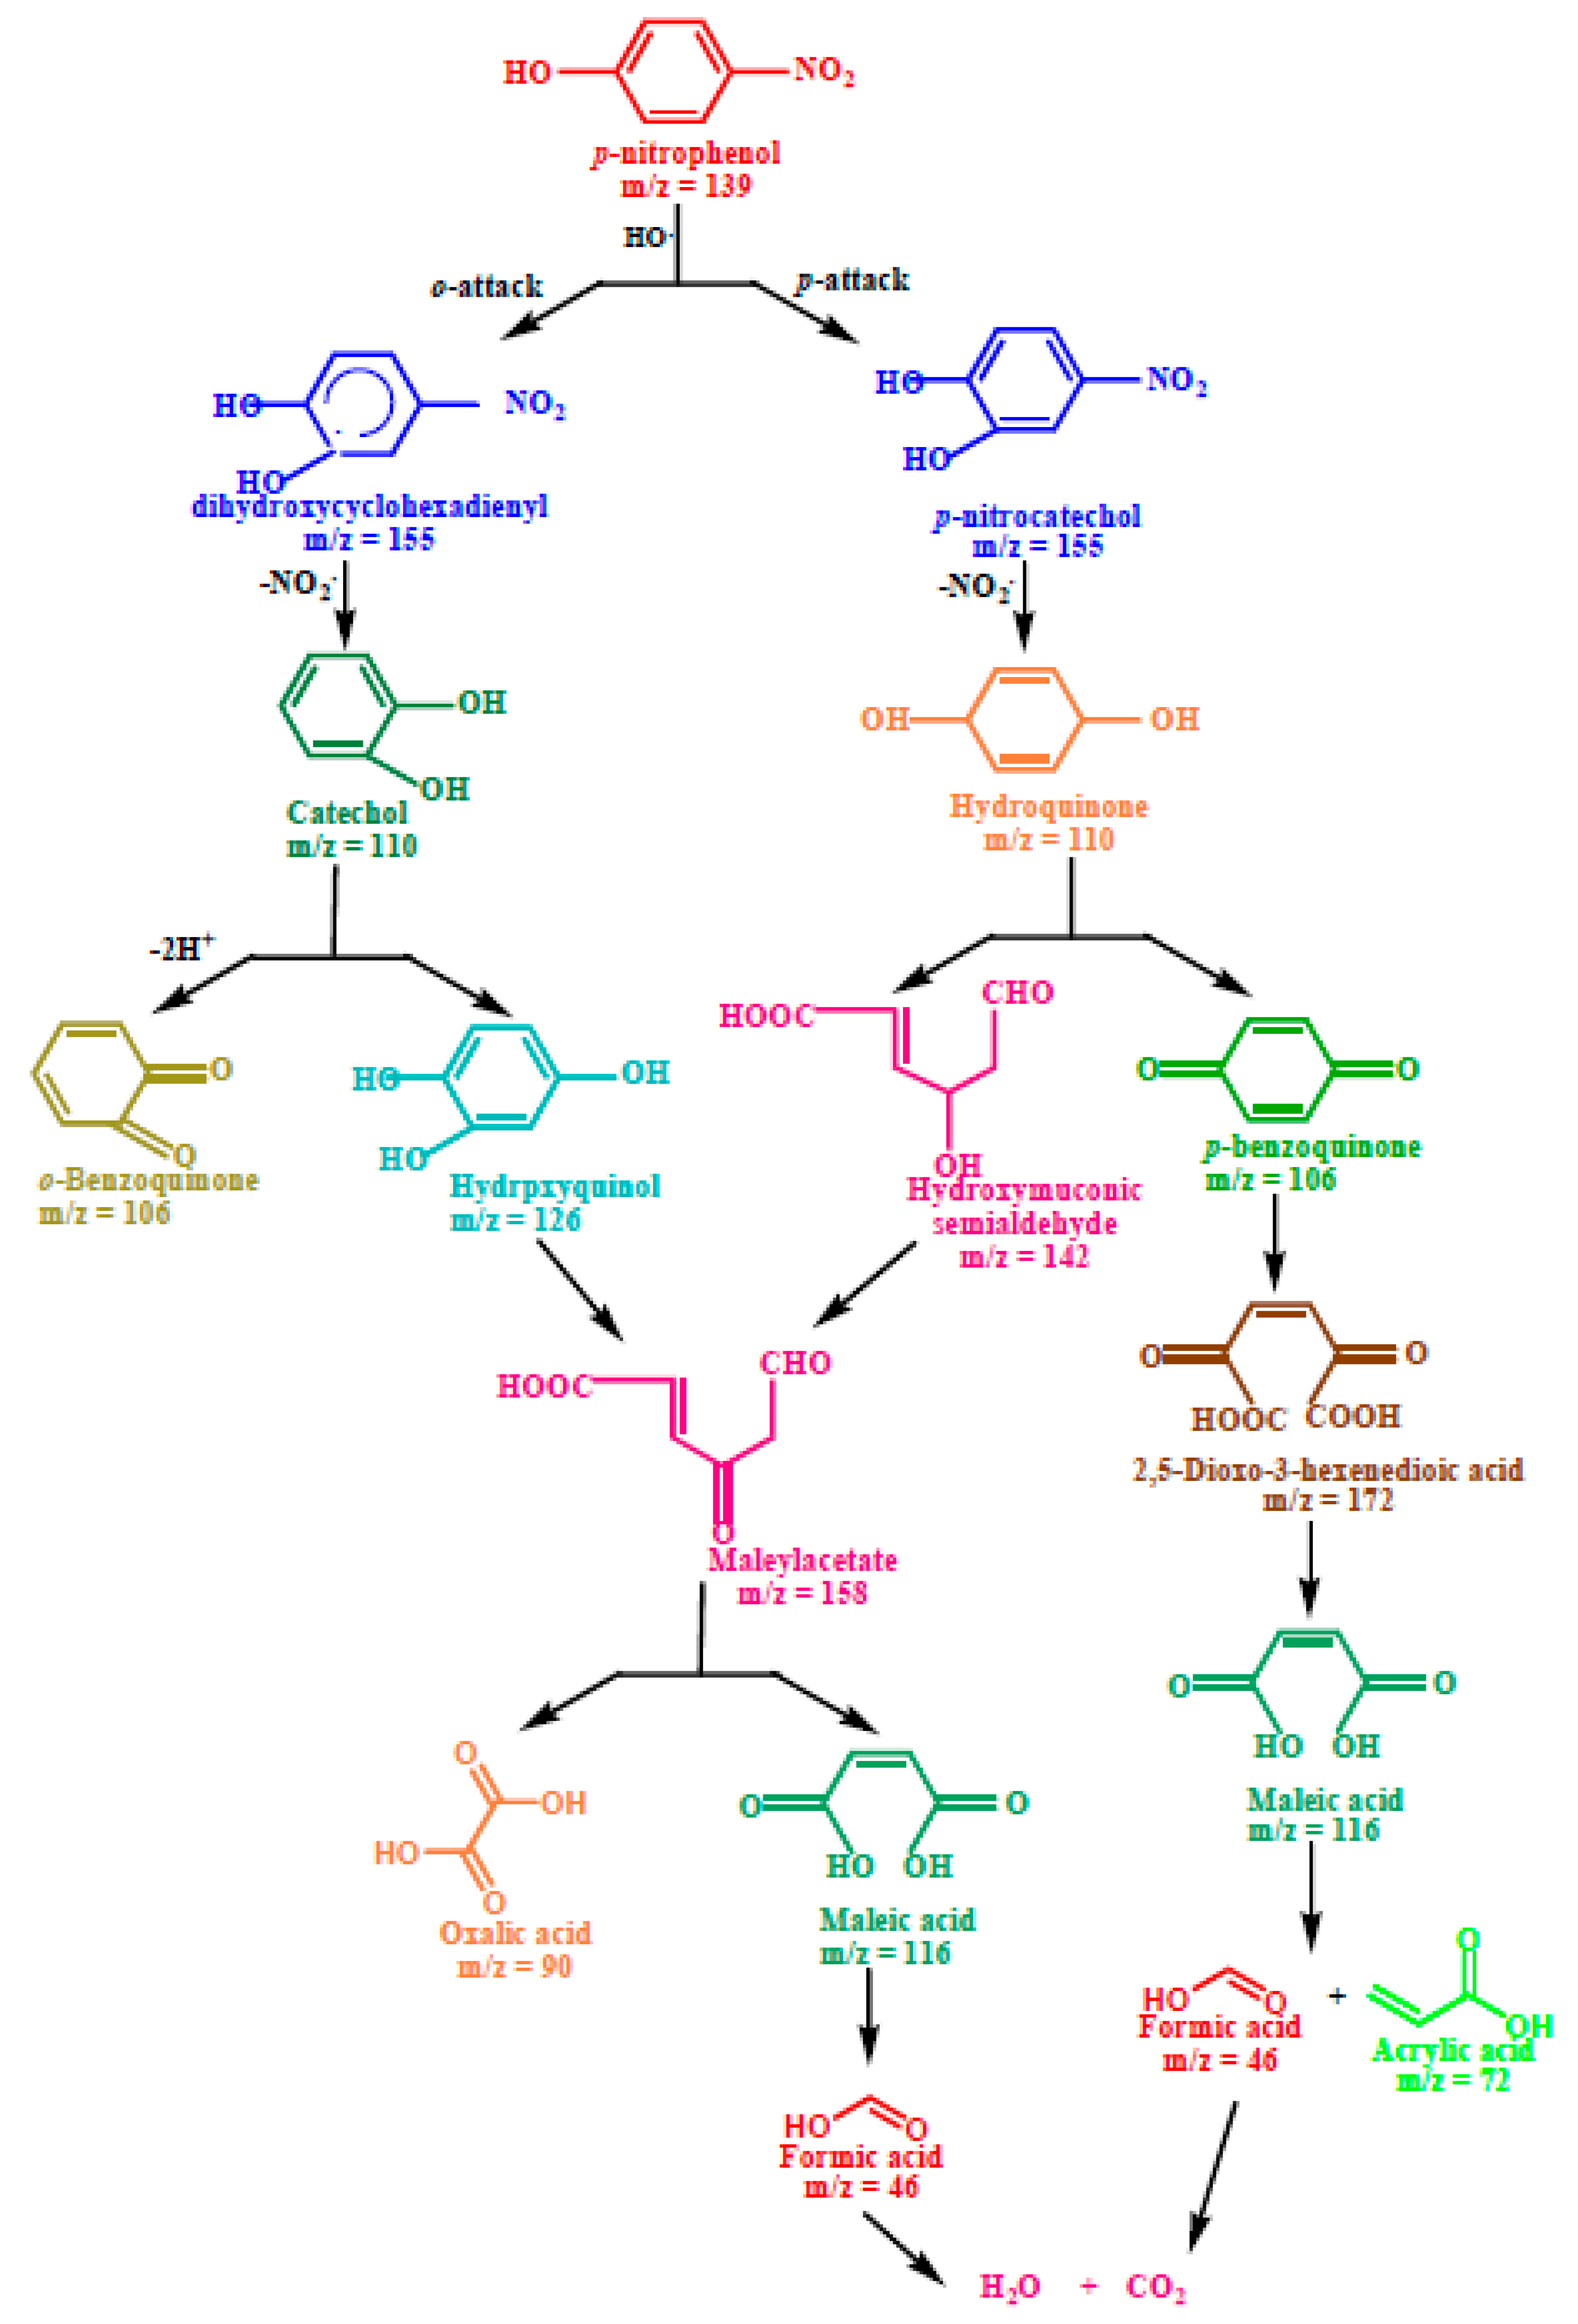
The photocatalytic activity of the nanocomposite was examined against three nitroaromatic compounds under visible light irradiation. The characteristic peaks of p-nitrophenol (398 nm), pendimethalin (465 nm) and martius yellow (445 nm) were followed up on to assess the degradation-performance of the composite. The decreased heights of the absorption peaks in temporal UV-visible spectra suggested the successful degradation with increasing irradiation time (Figure 6b–d). As the reaction progressed, the yellow-colored solutions of nitroaromatic compounds turned colorless. This evidenced the change in their molecular configurations due to the removal of the nitro group from the chromophoric ring. In p-nitrophenol, the appearance of a new absorption peak at 290 nm supported its photodegradation due to the formation of hydroquinone, as indicated in the proposed degradation pathways illustrated in Scheme 1. The kinetic studies followed the Langmuir–Hinshelwood model, as indicated from their linear relationship (98%). The determination of the apparent rate constant (k) was carried out for the quantitative measurement (Figure 6f). The results demonstrate the highest value of ‘k’ for pendimethalin (2.72 × 10⁻² 1min−1), followed by p-nitrophenol (2.07 × 10⁻² 1/min) and martius yellow (1.37 × 10⁻² 1/min), respectively. The minimum value of ‘k’ for martius yellow might be ascribed to its more stabilized structure as a result of resonance stabilization in two aromatic rings. Among p-nitrophenol and pendimethalin, the slower degradation of the former could be attributed to the resonance stabilization of the p-nitrophenolate ion.
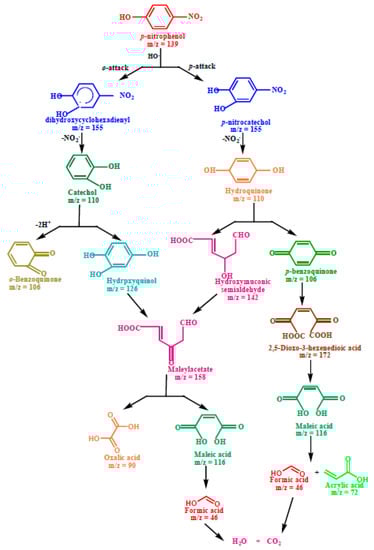
Scheme 1.
Plausible degradation pathway for the photodegradation of p−nitrophenol.
2.3.2. Identification of Reactive Oxygen Species and Photocatalysis Mechanism
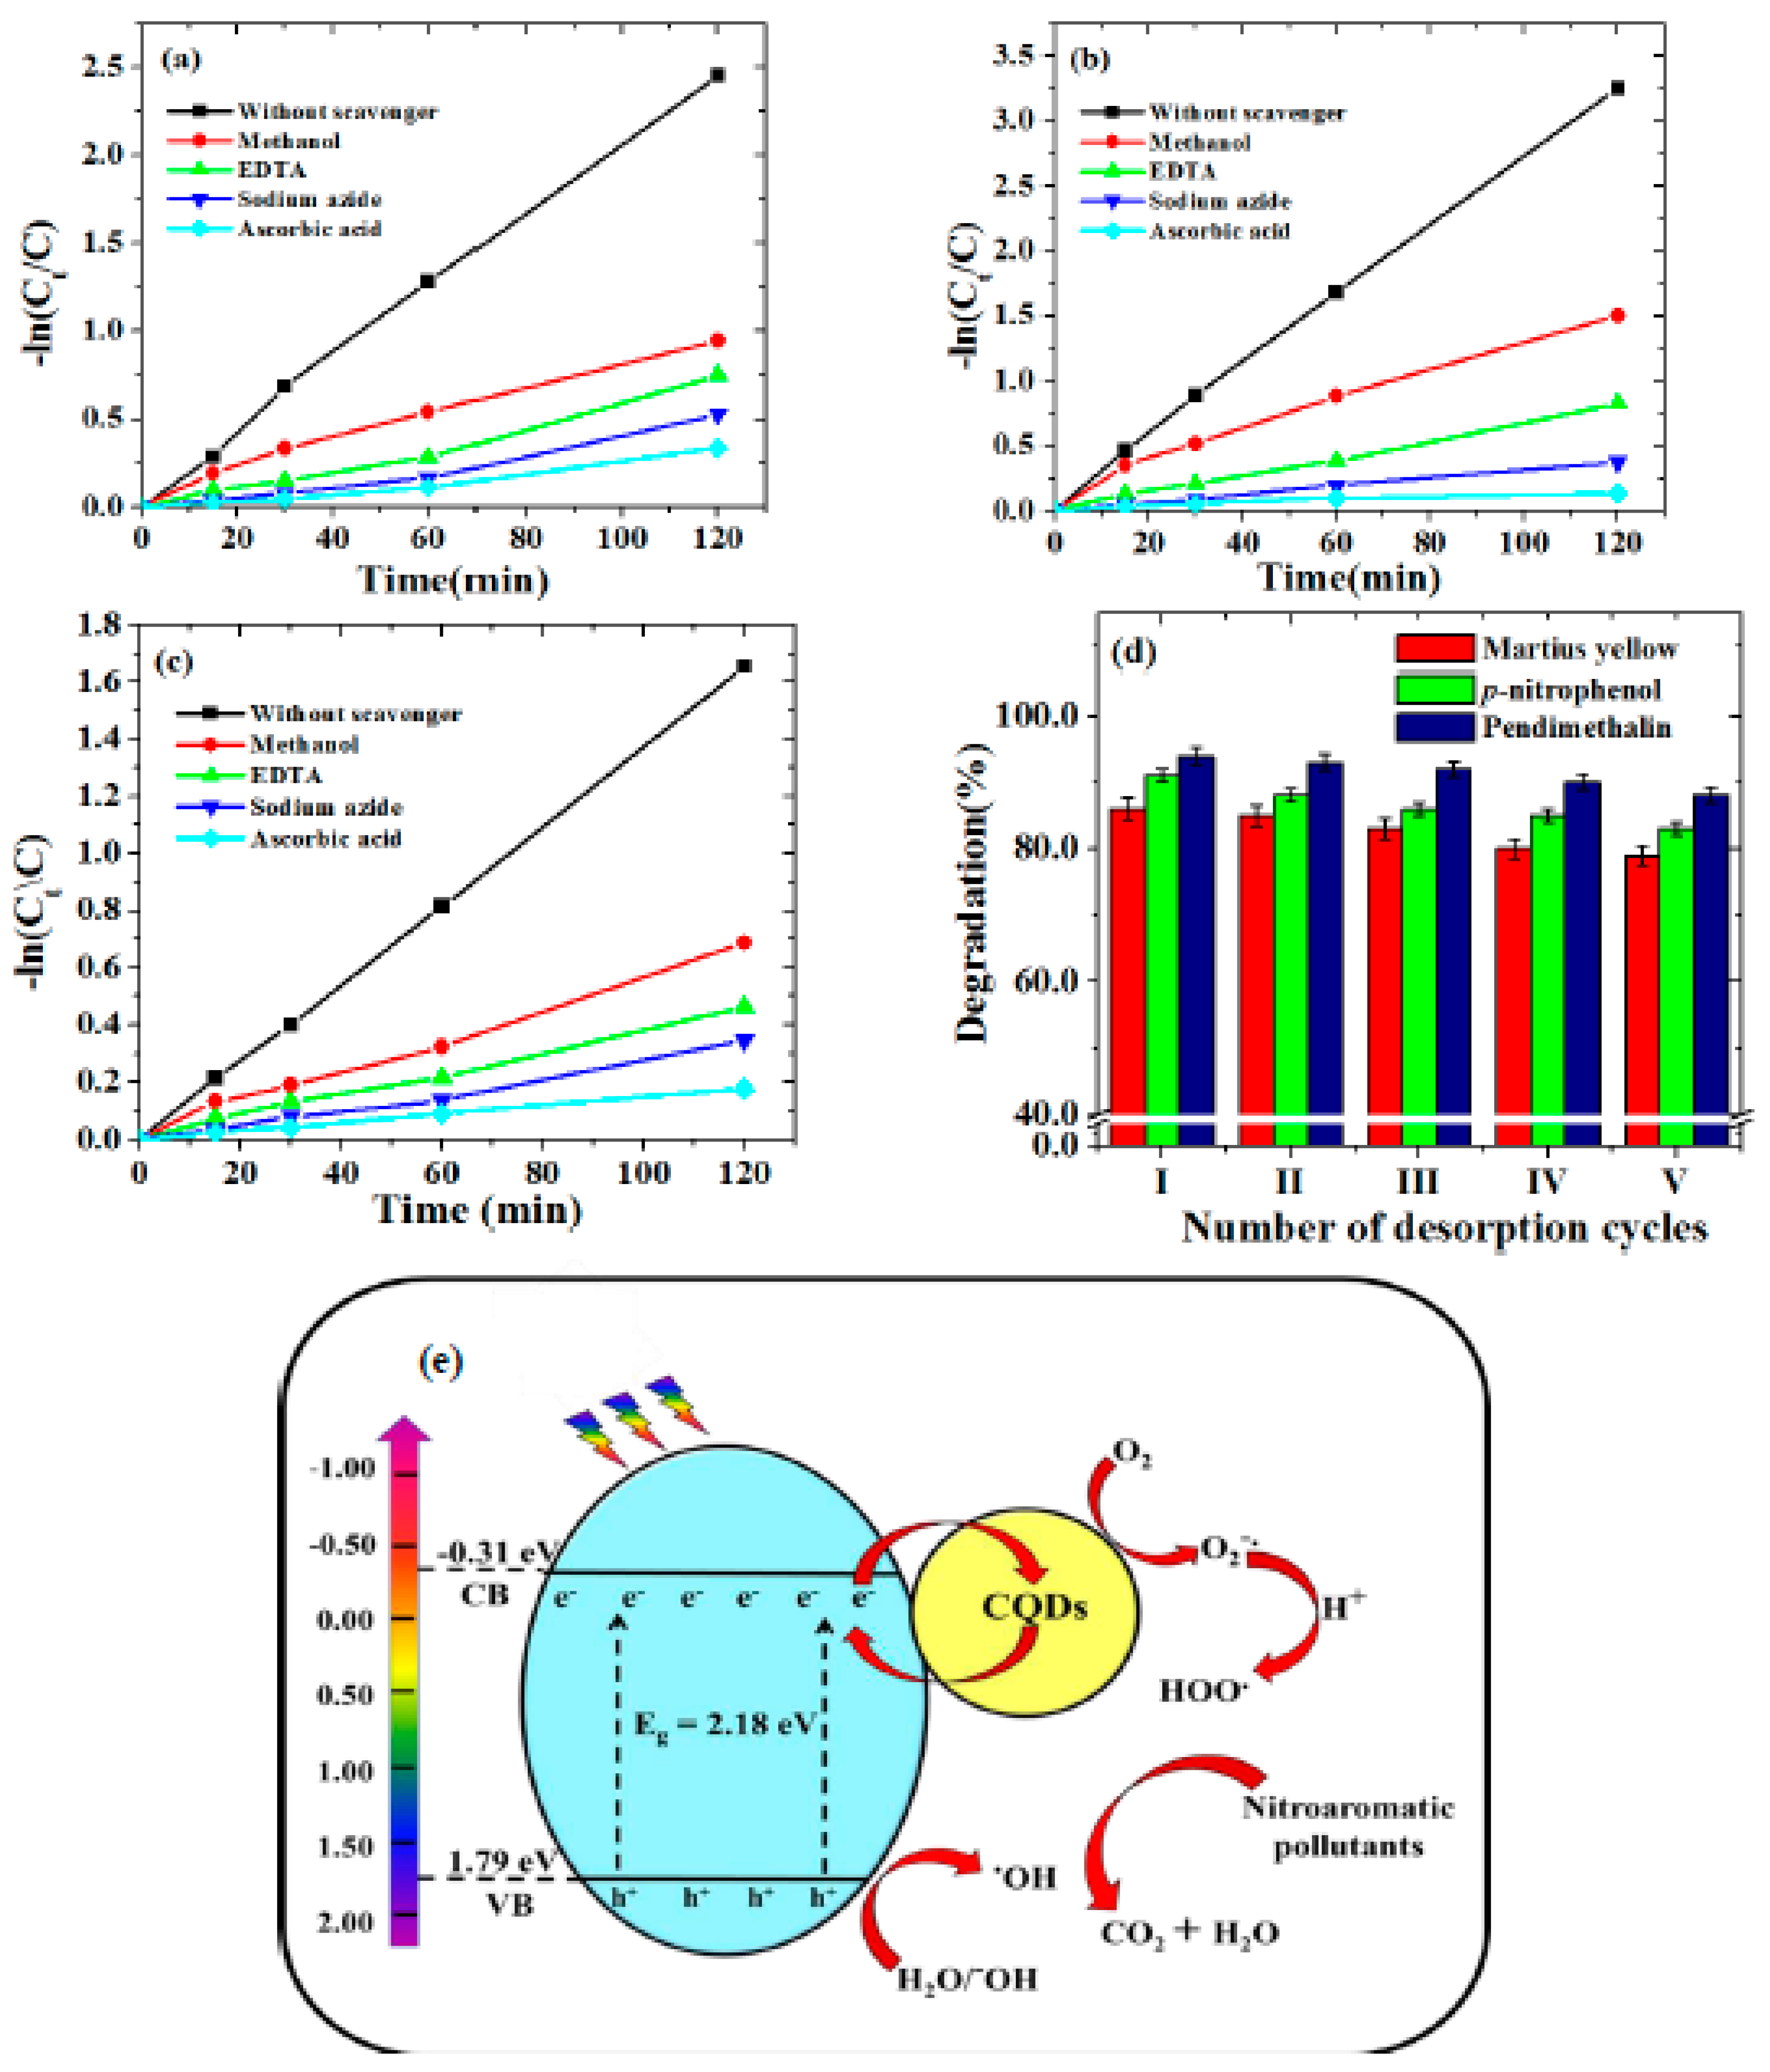
In order to examine the reactive oxygen species that cause the degradation of nitroaromatic contaminants, a free radical trapping experiment was performed under the optimized experimental conditions. In this respect, kinetic studies in the presence of different scavengers, such as ascorbic acid, sodium azide, EDTA and methanol, were conducted to scavenge the superoxide radicals, singlet oxygen, holes and hydroxyl radicals, respectively. The experimental results of the trapping species, as shown in Figure 7a–c, indicate that superoxide radical anions and singlet oxygen species were the primary species involved in the photodegradation process of nitroaromatic pollutants. The photodegradation process was kinetically inhibited in the following order:
superoxide radical anions > singlet oxygen species > holes > hydroxyl radicals.
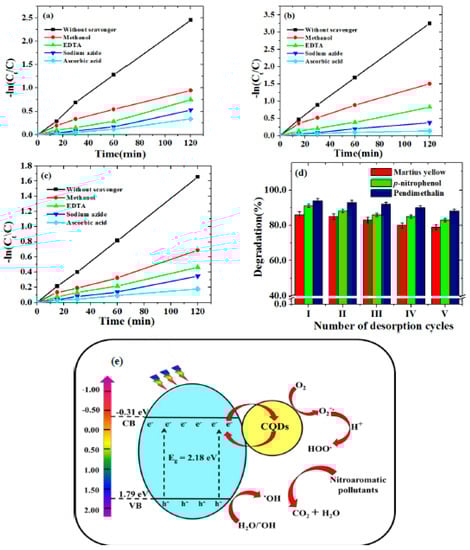
Figure 7.
Kinetic studies of the inhibition of degradation of (a) p−nitrophenol, (b) pendimethalin and (c) martius yellow (experimental conditions: pH, 3.0; catalyst dose, 0.2 g/L and concentration 2.0 mg/L (p−nitrophenol and pendimethalin) and 0.2 mg/L (martius yellow)), (d) Desorption studies of p-nitrophenol, pendimethalin and martius yellow (experimental conditions: pH, 3.0; temperature, 25.0 ± 1 °C; irradiation time, 2.0 h; catalyst dose, 0.2 g/L) and (e) plausible photodegradation mechanism for the photodegradation of nitroaromatic pollutants.
The heterojunction formed between CQDs and Sr0.4Ti0.6Fe2O4.6 NPs is likely a type of Schottky junction system. Figure 7e reveals this when the CQDs-Sr0.4Ti0.6Fe2O4.6 nanocomposite is in the presence of visible-light-generating e—h+ pairs in a conduction band (CB) and valance band (VB) of Sr0.4Ti0.6Fe2O4.6 NPs. To understand the mechanism involved for the separation of electrons and holes, the potential of Sr0.4Ti0.6Fe2O4.6 associated with VB and CB was determined using the equations [50]:
where X = the electronegativity of semiconductor, ECB and EVB represent the edge potential of CB and VB, respectively, Eef = the energy of the free electrons (4.5 eV) and Eg = the band gap energy of the semiconductor. The electronegativity value for Sr0.4Ti0.6Fe2O4.6 was observed to be 5.23 eV. The determined edge potentials of the VB and CB for Sr0.4Ti0.6Fe2O4.6 are given in Figure 7e. The photoinduced electron movement from the VB of Sr0.4Ti0.6Fe2O4.6 to its CB is captured by the CQDs which facilitated the e-hole pair separation. Additionally, semiconductors (CQDs and Sr0.4Ti0.6Fe2O4.6 NPs) have different Fermi levels, which might result into a Schottky barrier at the interface. This barrier may effectively prevent electrons or holes from transferring back to the Sr0.4Ti0.6Fe2O4.6 from CQDs, therefore creating a unidirectional flow channel from the Sr0.4Ti0.6Fe2O4.6 to the CQDs. O2 reduces to generate a superoxide radical anion (O2−•) as photoinduced electrons migrate from the valance band to the conduction band. These O2−•, upon reacting with H+ ions, formed peroxyl radicals (•OOH). The hole in the valence band produced hydroxyl radicals (•OH) by oxidizing hydroxyl ions or water molecules. When holes and O2−• anions react, O21 species may result. The highly reactive •OOH radicals decomposed to generate the •OH and O2−• radicals. As a result, these photo-active species could attack the molecules of nitroaromatic pollutants and degrade them into degradation products, i.e., CO2 and H2O.
ECB = X − Eef − 0.5 Eg
EVB = ECB + Eg
The enhancement in the degradation rate for the nanocomposite was mainly due to the following combined effects:
(1) Enhanced defect levels due to the insertion of Ti4+ ions in the SrFe2O4 lattice aided the trapping the e−-h+ pair; (2) CQDs in the nanocomposite acted as the electron reservoir for trapping the electrons efficiently, thereby suppressing the recombination of charge carriers; (3) CQDs also exhibited the unique up-conversion in photoluminescence behavior for the absorption of visible light with a longer wavelength and the emission of shorter-wavelength light, which consequently excited the electrons and generated the holes in Sr0.4Ti0.6Fe2O4.6 NPs; (4) the π–π interactions between the aromatic rings of nitroaromatic compounds and the CQDs also contributed to the enhancement of the removal rate; (5) The effective separation of photoinduced e−-h+ pairs and their reduced recombination rate due to electronic interactions pairs and their declined recombination rate were because of the electronic interactions between Sr0.4Ti0.6Fe2O4.6 and CQDs being a crucial component that contributed to the enhanced photocatalytic effectiveness of the Sr0.4Ti0.6Fe2O4.6-CQDs nanocomposites; (6) a larger surface area provides more binding sites for nitroaromatic pollutants adsorption, facilitating the photocatalytic process. The CQDs and Sr0.4Ti0.6Fe2O4.6 NPs produced a synergistic effect to increase the surface area to 101.3 m2/g, contributing to the increased photocatalytic efficiency. The reduction of the band gap of the nanocomposite as compared with pristine CQDs might be due to the creation of hybridized energy levels at the interface between the Sr0.4Ti0.6Fe2O4.6 NPs and CQDs, which led to it being promising for the transport of photogenerated charge carriers.
2.3.3. Photodegradation Pathways of Nitroaromatic Pollutants
Photodegradation Pathway of p−Nitrophenol
The first step in the photodegradation of p-nitrophenol, as illustrated in Scheme 1, involved the o- and p-attack of the hydroxyl radical and led to the formation of hydroxylated adducts, viz. dihydroxycyclohexadienyl radical (DHCHD) (m/z = 155) and p-nitrocatechol (m/z = 155). The −NO2 group might be released from DHCHD and p-nitrocatechol and yielded by the hydroquinone (m/z 110) and catechol (m/z 110), respectively. The hydroxylation of catechol (m/z 110) generates the hydroxyquinol (m/z = 126). The C-C bond with the adjacent hydroxyl groups in hydroxyquinol (m/z = 126) is destabilized due to the electrophilic nature of hydroxyl groups, causing ring rupturing with the formation of maleyl acetate (m/z = 158). Furthermore, the complex intermediate formed by the ring cleavage of hydroquinone (m/z = 110) is hydroxymuoconic semialdehyde (m/z = 142), which can then be oxidized to maleylacetate (m/z = 158). The products of the oxidative ring opening of p-benzoquinone (m/z = 106) and the mineralization of maleylacetate (m/z = 158) are low-molecular carboxylic acids such as 2,5-dioxo-3-hexene dioic acid (m/z = 172), maleic acid (m/z = 114), oxalic acid (m/z = 90), acrylic acid (m/z = 72), acetic acid (m/z = 60) and formic acid (m/z = 46), and these acids can be mineralized to CO2 (m/z = 44) and H2O (m/z = 18).
Photodegradation Pathway of Pendimethalin
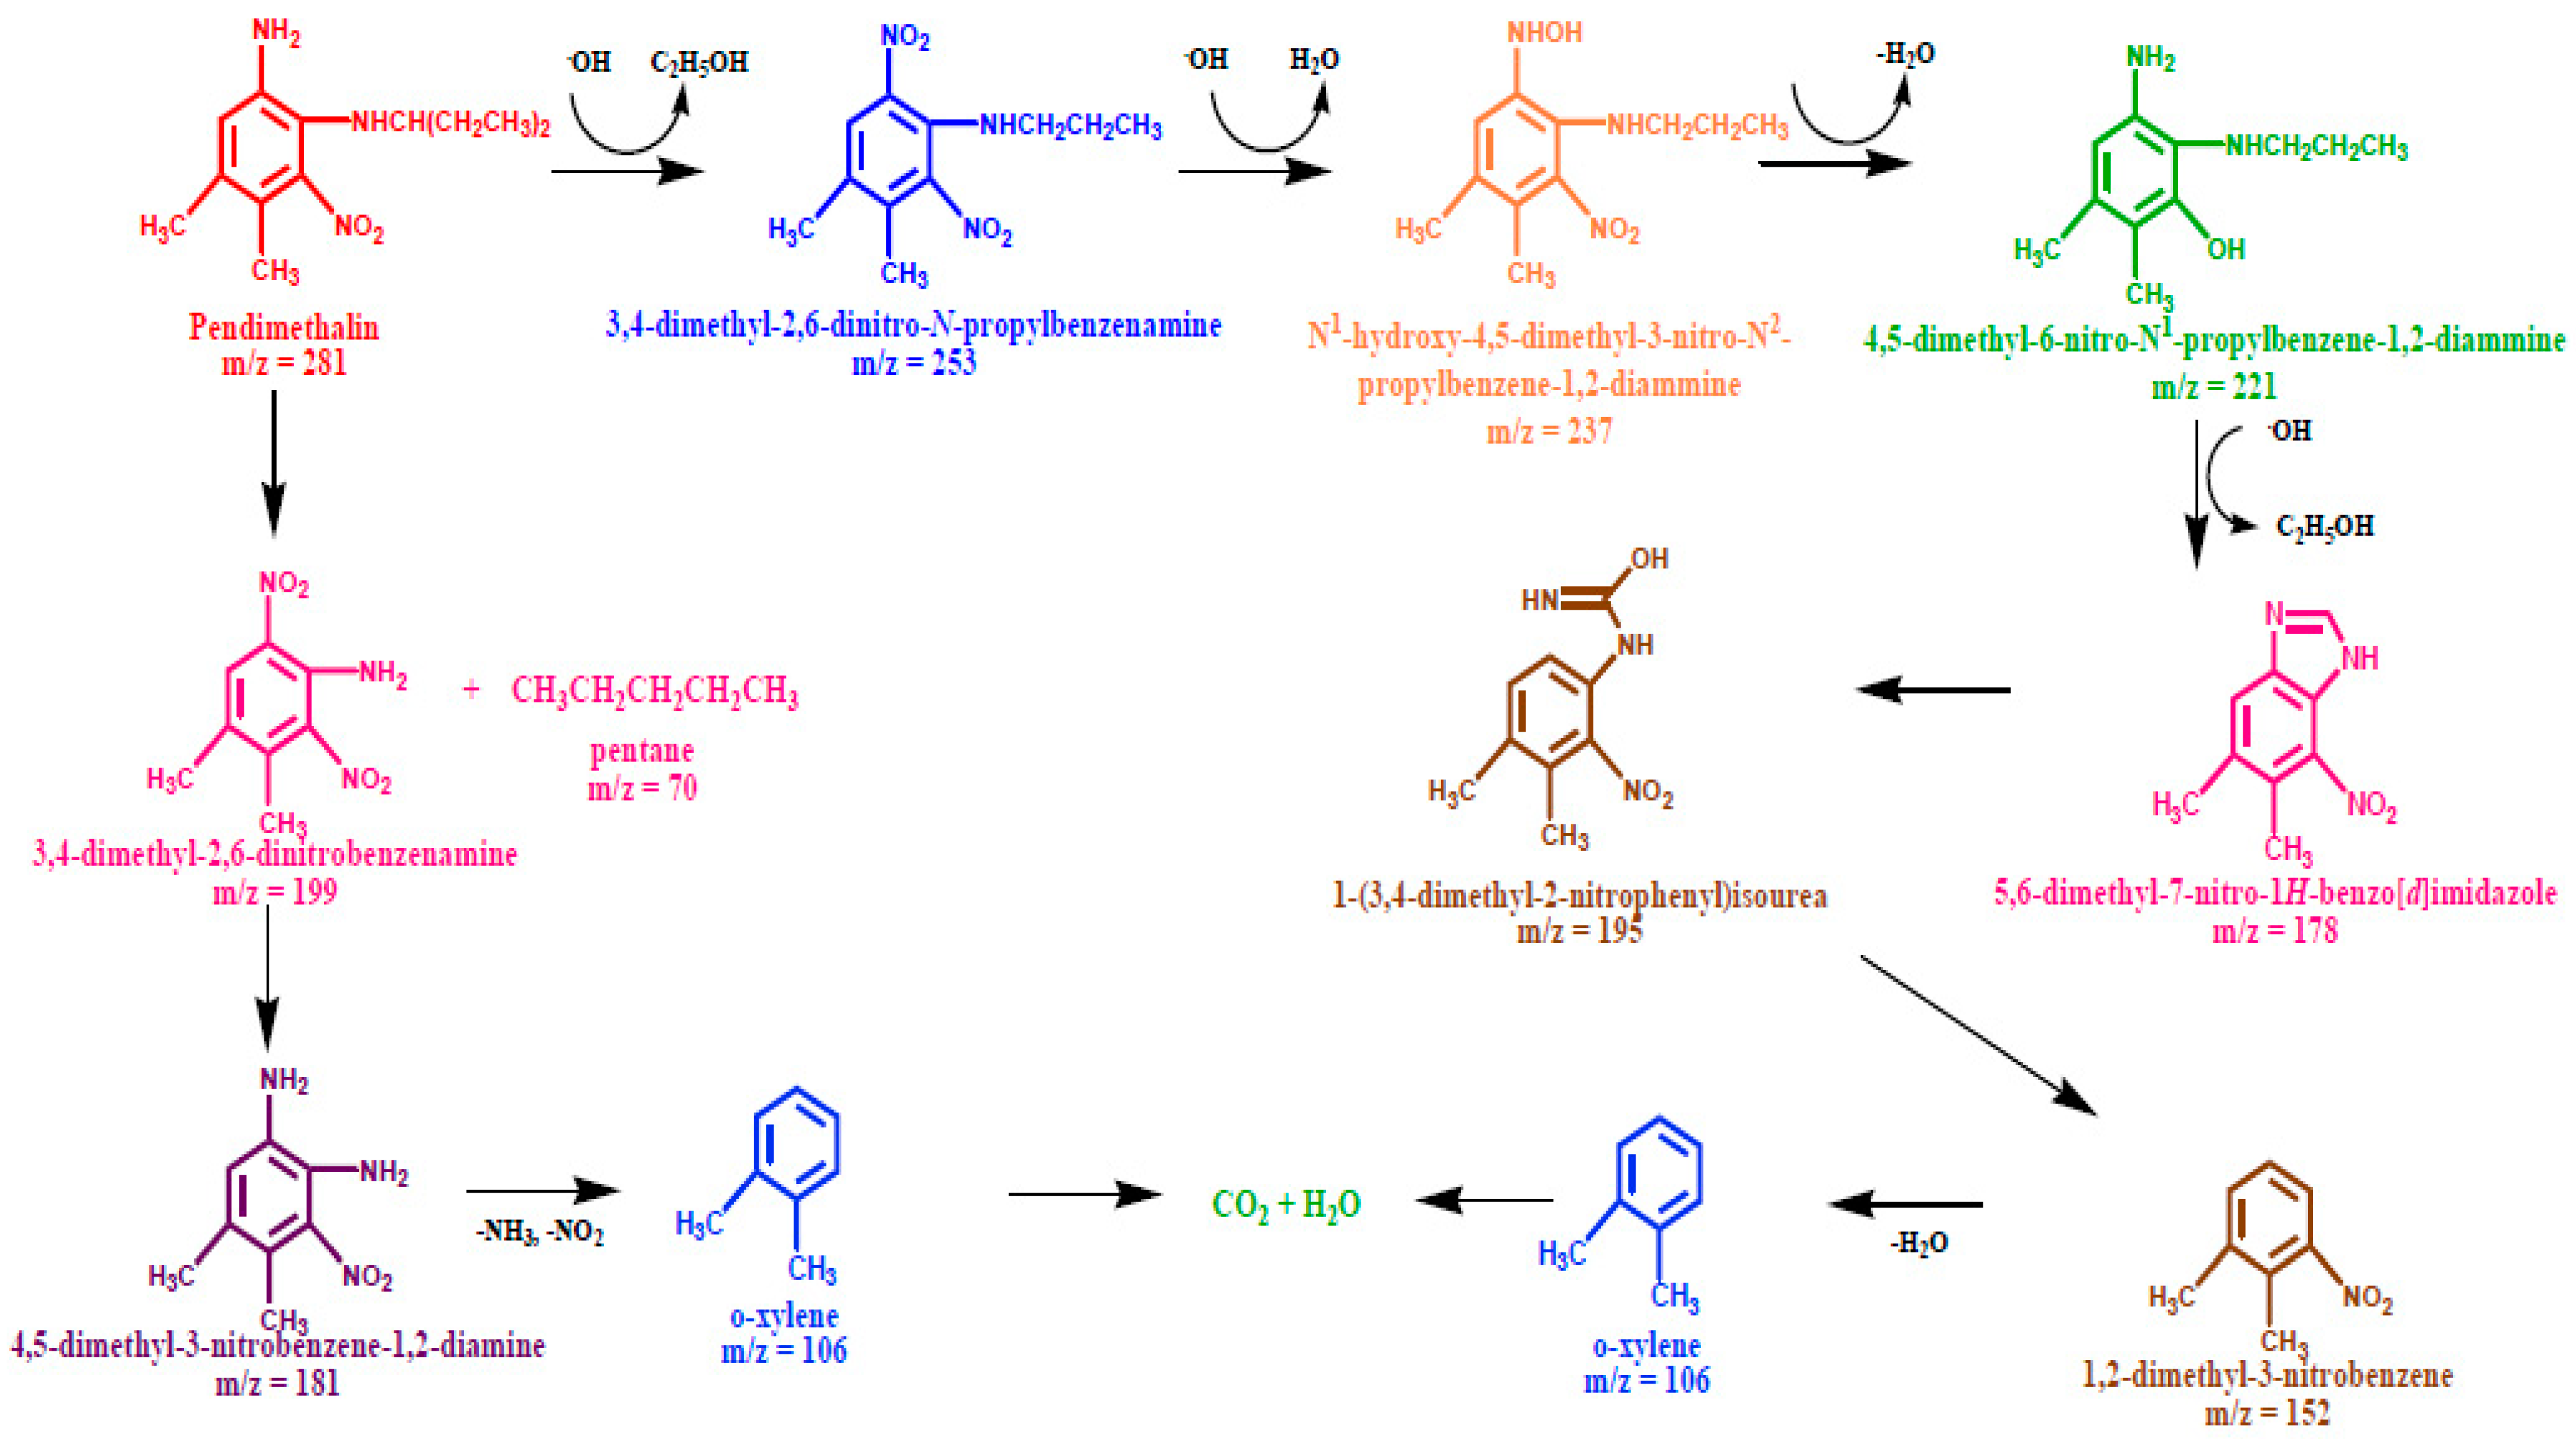
The photodegradation of pendimethalin, as shown in Scheme 2 could be fragmented through two pathways: (a) the hydroxylation of aromatic ring due to formation of 3,4-dimethyl-2,6-dinitro-N-propylbenzenamine (m/z = 253) after the elimination of the ethanol molecule. The further attack of OH radical resulted in a dehydrated adduct, with the ion peak attributed to N1-hydroxy-4,5-dimethyl-3-nitro-N2-propylbenzene-1,2-diammine (m/z = 237). The GC-MS spectrum displayed the molecular ion peaks indicating the formation of 4,5-dimethyl-6-nitro-N2-propylbenzene-1,2-diammine (m/z = 221) and 5,6-dimethyl-7-nitro-1H-benzoimidazole (m/z = 221) via the elimination of water and ethanol, respectively. Subsequently, the fragment peak at the m/z value of 195 appeared from the ring opening of 5,6-dimethyl-7-nitro-1H-benzoimidazole corresponding to 1-(3,4-dimethyl-2-nitrophenyl) isourea, followed by the C-N bond cleavage of the side chain to produce 1,2-dimethyl-3-nitrobenzene (m/z = 152). (b) The C-N bond cleavage on the dealkylation of side chain yielded the 3,4-dimethyl-2,6-dinitrobenzenamine product (m/z = 199), followed by the reduction of one of nitro group present on the aromatic ring to generate 4,5-dimethyl-1,3-dinitrobenzene-1,2-diamine (m/z = 181). The appearance of o-xylene (m/z = 106) might occur either with the elimination of the nitrogen dioxide and ammonia molecules from 4,5-dimethyl-1,3-dinitrobenzene-1,2-diamine (m/z = 181) or with the denitration of 1,2-dimethyl-3-nitrobenzene which finally mineralizes to CO2 (m/z = 44) and H2O (m/z = 18).
Scheme 2.
Plausible degradation pathway for the photodegradation of pendimethalin.
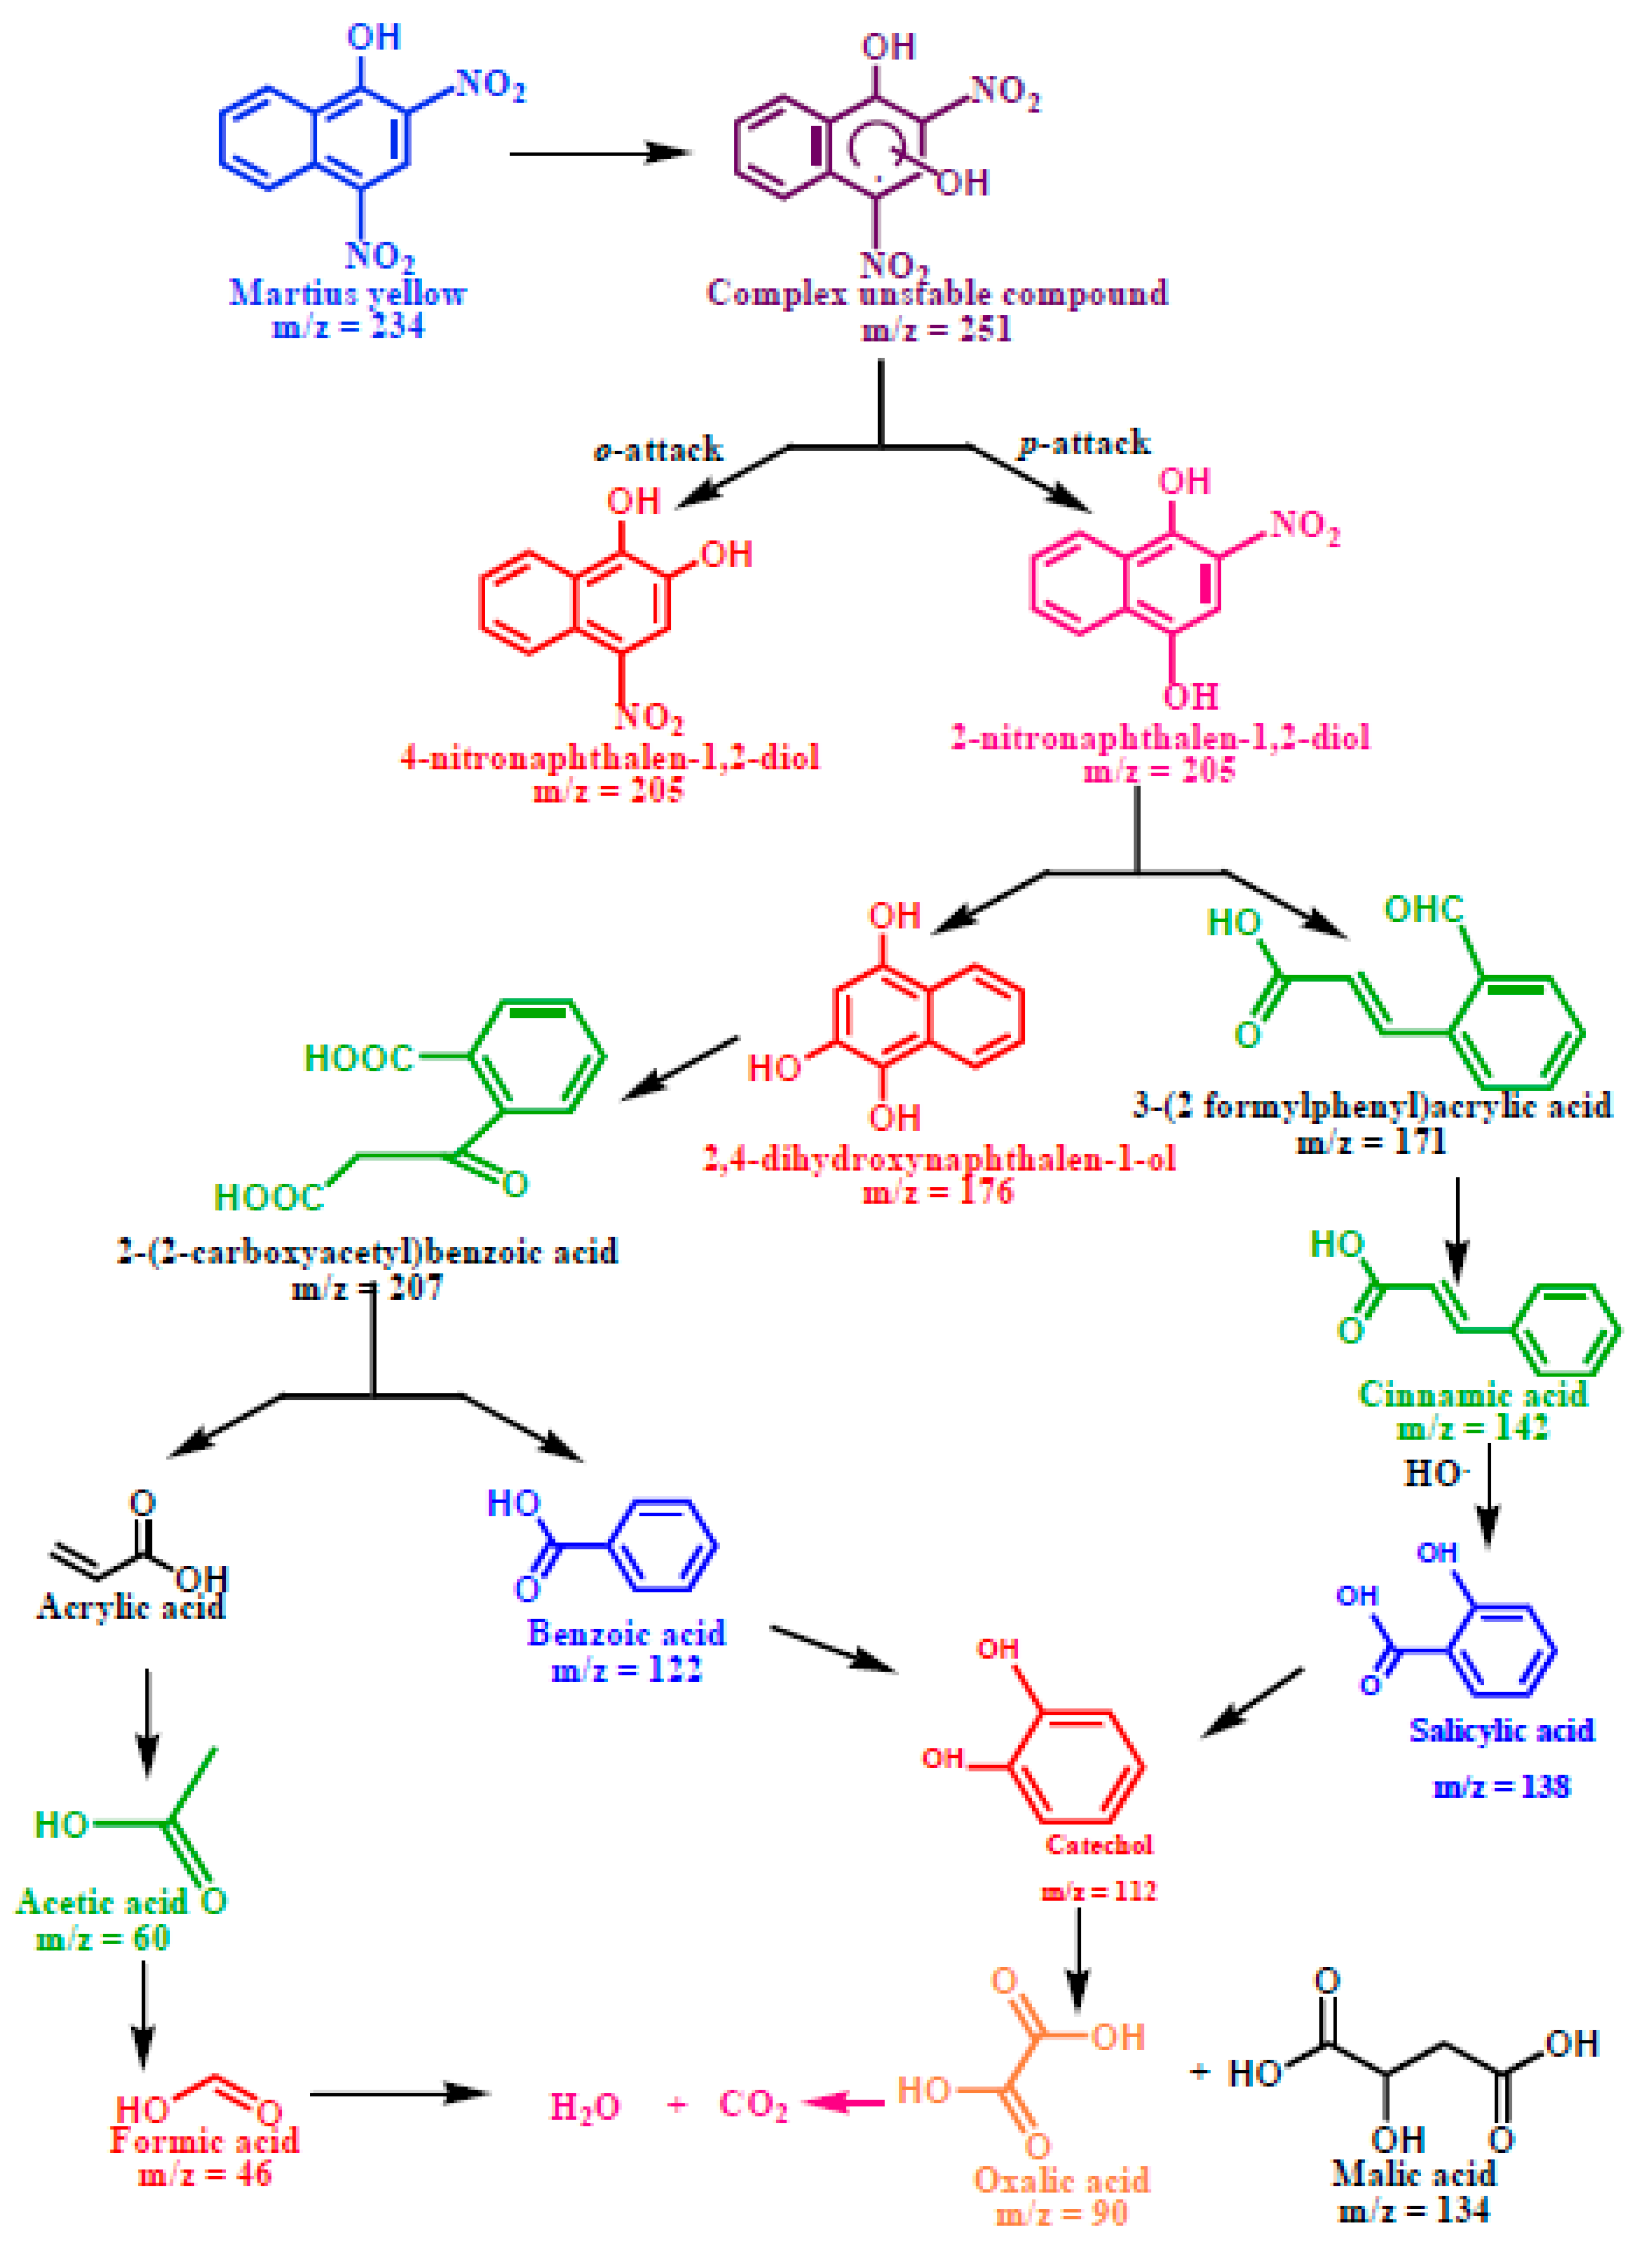
Photodegradation Pathway of Martius Yellow
The photocatalytic degradation of martius yellow (Scheme 3) initiated through the oxidative ortho- and para-attack of the OH radical across the double bond present on the chromophoric ring formed the hydroxylated adduct of martius yellow (m/z = 251). The unstable nature of the hydroxylated adduct caused the elimination of the NO2 group with the generation of 4-nitronapthalen-1, 2-diol (m/z = 205) and 2-nitronapthalen-1,4-diol (m/z = 205). The appearance of an ion peak at m/z value of 176 might be ascribed to the formation of 2,4-dihydroxynapthalen-1-ol due to the •OH attack on 4-nitronapthalen-1, 2-diol (m/z = 205). The destabilization of the C=C bond with adjacent OH groups caused the ring to rupture and yielded acrylic acid (m/z = 72) and benzoic acid (m/z = 122). The catechol peak (m/z = 110) appeared, possibly due to the attack of the OH radicals on the aryl ring of benzoic acid. The C-C bond cleavage could also occur in the 2-nitronapthalen-1,4-diol (m/z = 205) with the denitration and decarboxylation, resulting in the appearance of cinnamic (m/z = 148) and formic acid (m/z = 46). The further C-C cleavage of cinnamic acid yielded the salicylic acid (m/z = 138), followed by the formation of catechol at the m/z value of 110. The intermediate catechol (m/z = 110) was unstable under atmospheric conditions, and subsequently decomposed to produce malic acid (m/z = 134) after decarboxylation. The stepwise decarboxylation of malic acid (m/z = 134) and acrylic acid (m/z = 72) could subsequently be mineralized to CO2 and H2O.

Scheme 3.
Plausible degradation pathway for the photodegradation of martius yellow.
2.4. Regeneration Studies
The recycling test was conducted for the five consecutive photocatalytic runs to examine the reusability of the photocatalyst. The photocatalyst used after each photocatalytic run was collected and washed by deionized water, and the fresh solutions of the studied nitroaromatic pollutants were taken before the successive photocatalytic run. Figure 7c revealed that the photocatalytic efficiency of all the three nitroaromatic compounds was slightly reduced (6–10%), even after the fifth photocatalytic run. This ensured the good reproducibility, reusability and regeneration of the nanocomposite, supporting their potential for the photocatalytic degradation of nitroaromatic pollutants.
3. Materials and Methods
3.1. Materials
All of the chemicals of AR grade were used directly. Strontium nitrate (Sr(NO3)3·6H2O), butyl titanate (CH3(CH2)3O)4Ti), citric acid (C6H8O7·H2O), ammonium hydroxide (NH4OH), ferric nitrate (Fe(NO3)3·6H2O), absolute ethanol (C2H5OH), graphite flakes, hydrochloric acid (HCl), toluene (C7H8) and sodium hydroxide (NaOH) were acquired from Molychem, India. The solutions having different concentrations were prepared in deionized water. The details of the characterization instruments are given in the Supplementary Text S3.
3.2. Fabrication of CQDs and CQDs—Sr0.4Ti0.6Fe2O4.6 Composite Photocatalyst
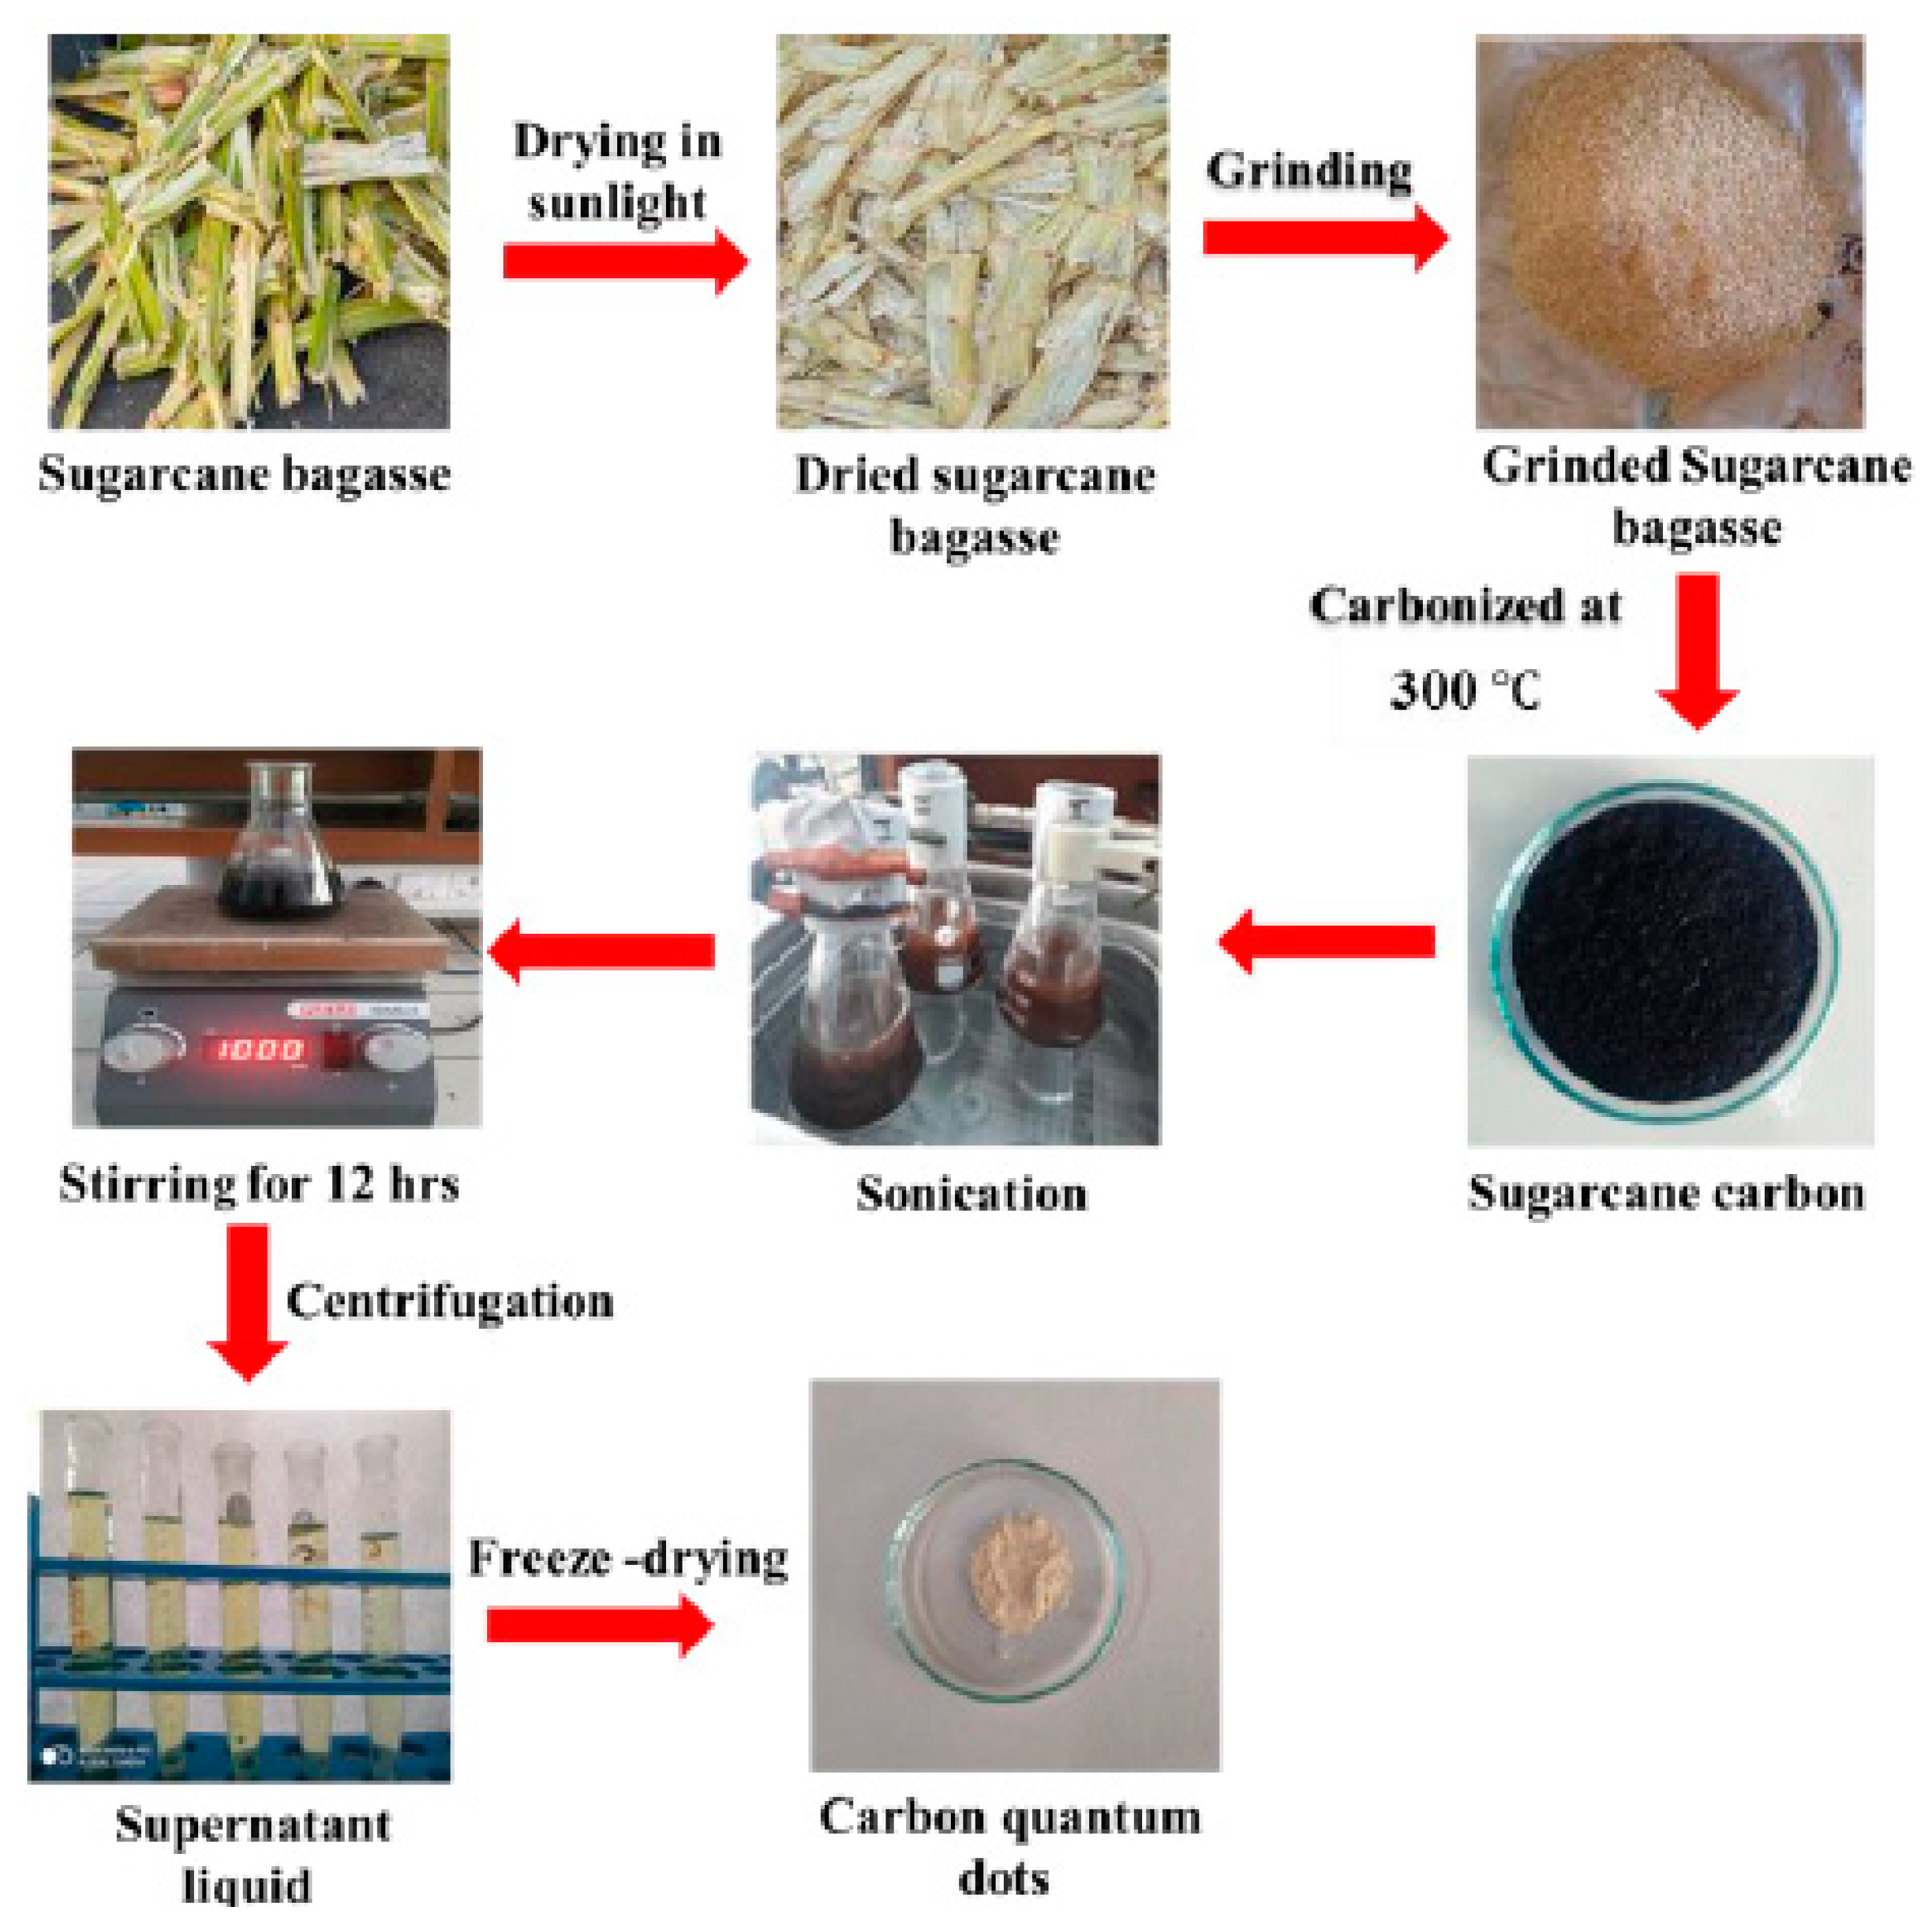
The pulp of sugarcane bagasse was diced into small pieces and placed in sunlight for drying, followed by calcination at 300 °C to yield carbon residues. 1.0 g of the residue was transferred to 200 mL of toluene and sonicated (frequency of 90 kHz, power of 40 W) for 60 min, followed by continuous stirring (16 h) at 25 °C for complete dispersion. The supernatant liquid was collected after centrifugation at 12,000 rpm for 30 min at room temperature. The CQDs as a solid product were obtained by freeze-drying the supernatant liquid. (Scheme 4). The Sr0.4Ti0.6Fe2O4.6 NPs were synthesized using the sol-gel method as reported in previous, and details are given in the Supplementary Text S4. CQDs-Sr0.4Ti0.6Fe2O4.6 nanocomposites were synthesized with varied ratios of CQDs and Sr0.4Ti0.6Fe2O4.6, i.e., 0.5:1, 1:1, 2:1, 4:1 and 8:1. The aqueous dispersions of CQDs and Sr0.4Ti0.6Fe2O4.6 NPs were mixed together and sonicated at a frequency of 90 kHz and power of 40 W for 60 min to obtain complete dispersion. The reaction mixture was magnetically stirred at room temperature for 8 h. The resultant nanocomposites (CQDs-Sr0.4Ti0.6Fe2O4.6) were centrifuged and washed with deionized water, followed by ethanol and oven drying at 50 °C.

Scheme 4.
Schematic representation for the synthesis of CQDs from sugarcane bagasse.
3.3. Adsorption and Photocatalytic Potential Measurements
Standard stock solutions of p-nitrophenol and martius yellow were prepared in the deionized water, whereas for pendimethalin a mixture of methanol:water was used (2:3, v/v). All of the experiments were conducted thrice, and the mean values are reported. The photocatalytic activity of the synthesized photocatalysts CQDs, Sr0.4Ti0.6Fe2O4.6, NPs and their nanocomposites CQDs-Sr0.4Ti0.6Fe2O4.6 (with 0.5:1, 1:1, 2:1, 4:1 and 8:1 w/w ratio) were studied for the photodegradation of three nitroaromatic compounds under visible light (light-emitting diode, 60 W power) and ultraviolet light (mercury lamp, 125 W power) illumination. The first experiment was conducted to ascertain the best photocatalyst, with 0.1 g/L of the nanocatalyst dose dispersed in 100mL of the solution of p-nitrophenol (2.0 mg/L), pendimethalin (2.0 mg/L) and martius yellow (0.2 mg/L). CQDs-Sr0.4Ti0.6Fe2O4.6 with a 2:1 w/w ratio screened out to be best photocatalyst from the preliminary studies, and was then used for the detailed analysis. The adsorption experiments were conducted to compare the adsorption efficiency of CQDs, Sr0.4Ti0.6Fe2O4.6, NPs and their nanocomposite CQDs-Sr0.4Ti0.6Fe2O4.6 (with 2:1 w/w ratio). The details of the adsorption experiments are given in Supplementary Text S5. The impact of pH was evaluated by adjusting the pH of the solution using HCl (0.l M) and NaOH (0.l M). The catalyst dose was varied from 0.01 g/L to 1.0 g/L at the optimum Ph. The suspensions were kept in an incubator shaker at 120rpm for 30 min with the addition of H2O2 (0.5 mL), before the irradiation of light in order to maintain the adsorption–desorption equilibrium. The necessary aliquots of the dispersion were taken out at regular intervals, centrifuged, and the supernatant solutions were examined for changes in p-nitrophenol, pendimethalin and martius yellow concentrations at an λmax of 398 nm, 465 nm and 445 nm, respectively. The percentage degradation of nitroaromatic pollutants was estimated using Equation (12), and the kinetic studies were conducted according to the Langmuir–Hinshelwood kinetics (Equation (13)).
where C and Ct refer to the concentrations of nitroaromatic contaminant after the establishment of the adsorption–desorption equilibrium and the concentration left after a fixed time period of illumination.
The effects of quenching agents on the photodegradation of p-nitrophenol, pendimethalin and martius yellow were also studied. A total of 1.0 mL of 10.0 mM disodium ethylene diamine tetraacetate (h+ scavenger), methanol (•OH scavenger), ascorbic acid (O2-• scavenger) and sodium azide (O21 scavenger) were added separately to flasks containing p-nitrophenol, pendimethalin and martius yellow. Solutions without additional quenching agents were used as controls. After being exposed to visible light for 120 min to facilitate photocatalysis, these solutions were examined using a UV-visible spectrophotometer.
The reusability of the synthesized photocatalysts was evaluated by conducting the five successive cycles of the photodegradation. A total of 0.1 g of the photocatalyst was added to 10 Ml solution of p-nitrophenol (2.0 mg/L), pendimethalin (2.0 mg/L) and martius yellow (0.2 mg/L), respectively. After 2 h of shaking at 130 rpm to achieve adsorption–desorption equilibrium, the solutions were exposed to visible light irradiation. The samples were centrifuged after two hours, and the centrifugates were examined for any remaining nitroaromatic contamination concentrations. The photocatalyst was repeatedly washed with deionized water after each cycle. The photocatalysts were then centrifuged and oven dried at 65 °C for the next cycle of photocatalysis.
3.4. Quantum Yield Measurement
The quantum yield (QY) of the synthesized CQDs was measured [8] using the following Equation (14):
where ‘φ’ refers to fluorescence QY, ‘η’ stands for the refractive index of the solvent, ‘A’ defines the absorption at the excited wavelength and ‘I’ represents the integrated fluorescence emission intensity under the fluorescence spectrum at 330 nm excitation and 410 nm emission wavelength. Quinine sulfate dissolved in 0.1 M H2SO4 (0.1 M) was employed as a standard reference, having a QY of 0.54. The solution was taken into a quartz cuvette (1 mm) to measure the UV-Vis and fluorescence spectra.
4. Conclusions
The present work reports the facile synthesis of magnetic nanocomposites of CQDs derived from sugarcane bagasse with Sr0.4Ti0.6Fe2O4.6 NPs by a facile ultrasonication method. This approach successfully yielded CQDs with a high quantum yield and good fluorescence features. The enhanced photocatalytic behavior was ascribed to the synergistic effect between the photon-harvesting CQDs and magnetic Sr0.4Ti0.6Fe2O4.6 NPs. The charge transfer was favored at the interface of the CQDs and Sr0.4Ti0.6Fe2O4.6 NPs, which inhibited the recombination of the photoexcited electron-hole pairs. Quenching studies confirmed that the superoxide radicals and singlet oxygen triggered the degradation of nitroaromatic pollutants efficiently. The nanocomposite demonstrated the promising photocatalytic efficiency with 95.1, 97.5 and 92.0% for p-nitrophenol, pendimethalin and martius yellow, respectively, in visible light illumination, compared with pristine NPs. The synthesized nanocomposite can act as a promising candidate for the photodegradation of organic pollutants.
Supplementary Materials
The supporting information can be downloaded at: https://www.mdpi.com/article/10.3390/catal12101126/s1, Figure S1: Photocatalytic degradation of (a) p-nitrophenol, (b) pendimethalin and (c) martius yellow under visible light irradiation using SrFe2O4, TiFe2O5, Sr0.7Ti0.3Fe2O4.3 and Sr0.4Ti0.6Fe2O4.6 NPs Experimental conditions: catalyst dose, 0.2 g/L; irradiation time, 2 h and concentration 2.0 mg/L (p-nitrophenol and pendimethalin) and 0.2 mg/L (martius yellow); Figure S2: (a) Photocatalytic degradation of p-nitrophenol, pendimethalin and martius yellow using (I) CQDs, (II) Sr0.4Ti0.6Fe2O4.6, (III) CQDs-Sr0.4Ti0.6Fe2O4.6 nanocomposite (0.5: 1.0 w/w ratio), (IV) CQDs-Sr0.4Ti0.6Fe2O4.6 nanocomposite (1.0: 1.0 w/w ratio), (V) CQDs-Sr0.4Ti0.6Fe2O4.6 nanocomposite (1.0: 2.0 w/w ratio), (VI) CQDs-Sr0.4Ti0.6Fe2O4.6 nanocomposite (4.0: 1.0 w/w ratio), (VII) CQDs-Sr0.4Ti0.6Fe2O4.6 nanocomposite (8.0: 1.0 w/w ratio); Photocatalytic degradation of (b) p-nitrophenol, (c) martius yellow under visible light irradiation, (d) pendimethalin, (e) p-nitrophenol and (f) martius yellow under ultraviolet irradiation (I) without photocatalyst, (II) Sr0.4Ti0.6Fe2O4.6, (III) CQDs, (IV) CQDs-Sr0.4Ti0.6Fe2O4.6 nanocomposite (2.0: 1.0 w/w ratio) Experimental conditions: catalyst dose, 0.2 g/L; irradiation time, 2 h and concentration 2.0 mg/L (p-nitrophenol and pendimethalin) and 0.2 mg/L (martius yellow); Figure S3: Removal efficiency of (a) p-nitrophenol, (b) pendimethalin and (c) martius yellow using CQDs, Sr0.4Ti0.6Fe2O4.6 and CQDs-Sr0.4Ti0.6Fe2O4.6 nanocomposite (2.0: 1.0 w/w ratio), Experimental conditions: adsorbent dose, 0.1 g/L; contact time, 2 h and concentration 2.0 mg/L (p-nitrophenol and pendimethalin) and 0.2 mg/L (martius yellow). Table S1: Comparison of the quantum yield values using different agricultural waste. References [8,46,51,52,53,54,55,56] are cited in the supplementary materials.
Author Contributions
J.K.G.: data curation, methodology, writing—original draft, writing—review and editing. M.K.: supervision, writing—original draft, writing—review and editing. K.M.: validation, formal analysis and editing. V.K.S.: supervision, writing—review and editing. All authors have read and agreed to the published version of the manuscript.
Funding
This research received no external funding.
Data Availability Statement
Not applicable.
Acknowledgments
We are grateful to Aderbal C. Oliveira and Vijayendra Kumar Garg, Institute of Physics, University of Brasilia, Brazil for the Mӧssbauer studies.
Conflicts of Interest
The authors declare no conflict of interest.
References
- Jabeen, A.; Kamran, U.; Noreen, S.; Park, S.J.; Bhatti, H.N. Mango seed-derived hybrid composites and sodium alginate beads for the efficient uptake of 2,4,6-trichlorophenol from simulated wastewater. Catalysts 2022, 12, 972. [Google Scholar] [CrossRef]
- Najjar, A.A.; Hassan, E.A.; Zabermavi, N.M.; Almasaudi, S.B.; Moulay, M.; Harakeh, S.; El-Aal, M.A. Efficacy of the Immobilized Kocuria flava Lipase on Fe3O4/Cellulose Nanocomposite for Biodiesel Production from Cooking Oil Wastes. Catalysts 2022, 12, 977. [Google Scholar] [CrossRef]
- He, C.; Shuang, E.; Yan, H.; Li, X. Structural engineering design of carbon dots for lubrication. Chin. Chem. Lett. 2021, 32, 2693–2714. [Google Scholar] [CrossRef]
- Toma, E.E.; Stoian, G.; Cojoearu, B.; Parvulescu, V.I.; Coman, S.M. ZnO/CQDs nanocomposites for visible light photodegradation of organic pollutants. Catalysts 2022, 12, 952. [Google Scholar] [CrossRef]
- Moosavi, S.; Manta, O.; El-Badry, Y.A.; Hussein, E.E.; El-Bahy, Z.M.; Fawzi, N.F.B.M.; Urbonavicius, J.; Moosavi, S.M.H. A study on machine learning methods’ application for dye adsorption prediction onto agricultural waste activated carbon. Nanomaterials 2021, 11, 2734. [Google Scholar] [CrossRef]
- Baragau, I.A.; Power, N.P.; Morgan, D.J.; Lobo, R.A.; Roberts, C.S.; Titirici, M.M.; Middelkoop, V.; Diaz, A.; Dunn, S.; Kellichi, S. Efficient continuous hydrothermal flow synthesis of carbon quantum dots from a targeted biomass precursor for on–off metal ions nanosensing. ACS Sustain. Chem. Eng. 2021, 9, 2559–2569. [Google Scholar] [CrossRef]
- Kurian, M.; Paul, A. Recent trends in the use of green sources for carbon dot synthesis–A short review. Carbon Trends 2021, 3, 100032. [Google Scholar] [CrossRef]
- Pandiyan, S.; Arumugam, L.; Srirengan, S.P.; Pitchan, R.; Sevugan, P.; Kannan, K.; Pitchan, G.; Hegde, T.A.; Gandhirajan, V. Biocompatible carbon quantum dots derived from sugarcane industrial wastes for effective nonlinear optical behavior and antimicrobial activity applications. ACS Omega 2020, 5, 30363–30372. [Google Scholar] [CrossRef]
- Thambiraj, S.; Shankaran, D.R. Green synthesis of highly fluorescent carbon quantum dots from sugarcane bagasse pulp. Appl. Surf. Sci. 2016, 390, 435–443. [Google Scholar] [CrossRef]
- Kaur, M.; Ubhi, M.K.; Grewal, J.K.; Sharma, V.K. Boron- and phosphorus-doped graphene nanosheets and quantum dots as sensors and catalysts in environmental applications: A review. Environ. Chem. Lett. 2021, 19, 4375–4392. [Google Scholar] [CrossRef]
- Kaur, M.; Kaur, M.; Sharma, V.K. Nitrogen-doped graphene and graphene quantum dots: A review on synthesis and applications in energy, sensors and environment. Adv. Colloid Interface Sci. 2018, 259, 44–64. [Google Scholar] [CrossRef]
- Sharma, S.; Dutta, V.; Singh, P.; Raizada, P.; Rahmani-Sani, A.; Hosseini-Bandegharaei, A.; Thakur, V.K. Carbon quantum dot supported semiconductor photocatalysts for efficient degradation of organic pollutants in water: A review. J. Clean. Prod. 2019, 228, 755–769. [Google Scholar] [CrossRef]
- Liu, Y.; Liu, C.; Shi, C.; Sun, W.; Lin, X.; Shi, W.; Hong, Y. Carbon-based quantum dots (QDs) modified ms/tz-BiVO4 heterojunction with enhanced photocatalytic performance for water purification. J. Alloys Compd. 2021, 881, 160437. [Google Scholar] [CrossRef]
- Mehta, A.; Mishra, A.; Basu, S.; Shetti, N.P.; Reddy, K.R.; Saleh, T.A.; Aminabhavi Tejraj, M. Band gap tuning and surface modification of carbon dots for sustainable environmental remediation and photocatalytic hydrogen production—A review. J. Environ. Manag. 2019, 250, 109486. [Google Scholar] [CrossRef] [PubMed]
- Rao, V.N.; Reddy, N.L.; Kumari, M.M.; Cheralathan, K.K.; Ravi, P.; Sathish, M.; Neppolian, B.; Reddy, K.R.; Shetti, N.P.; Prathap, P.; et al. Sustainable hydrogen production for the greener environment by quantum dots-based efficient photocatalysts: A review. J. Environ. Manag. 2019, 248, 109246. [Google Scholar] [CrossRef]
- Yao, Y.; Zhang, H.; Hu, K.; Nie, G.; Yang, Y.; Wang, Y.; Duan, X.; Wang, S. Carbon dots based photocatalysis for environmental applications. J. Environ. Chem. Eng. 2022, 10, 107336. [Google Scholar] [CrossRef]
- Hu, S.; Tian, R.; Wu, L.; Zhao, Q.; Yang, J.; Liu, J.; Cao, S. Chemical Regulation of Carbon Quantum Dots from Synthesis to Photocatalytic Activity. Chem. Asian J. 2013, 8, 1035–1041. [Google Scholar] [CrossRef]
- Li, H.; Liu, R.; Lian, S.; Liu, Y.; Huang, H.; Kang, Z. Near-infrared light controlled photocatalytic activity of carbon quantum dots for highly selective oxidation reaction. Nanoscale 2013, 5, 3289. [Google Scholar] [CrossRef]
- Xu, L.; Zhang, S.Z.; Li, W.; Zhang, Z.H. Visible-light-mediated oxidative amidation of aldehydes by using magnetic CdS quantum dots as a photocatalyst. Chem. Eur. J. 2021, 27, 5483–5491. [Google Scholar] [CrossRef]
- Li, H.; Qing, Q.; Zheng, L.; Xie, L.; Gan, Z.; Huang, L.; Liu, S.; Wang, Z.; Lu, Y.; Chen, J. Carbon dots and carbon nitride composite for photocatalytic removal of uranium under air atmosphere. Chin. Chem. Lett. 2022, 33, 3573–3576. [Google Scholar] [CrossRef]
- Kaur, M.; Kaur, M.; Singh, D.; Oliveira, A.C.; Garg, V.K.; Sharma, V.K. Synthesis of CaFe2O4-NGO nanocomposite for effective removal of heavy metal ion and photocatalytic degradation of organic pollutants. Nanomaterials 2021, 11, 1471. [Google Scholar] [CrossRef] [PubMed]
- Belousov, A.S.; Suleimanov, E.V.; Parkhacheva, A.A. Visible light-induced degradation of organic dyes by niobium tellurium oxides ANbTeO6 (A = Rb, Cs) with β-pyrochlore structure. Mater. Lett. 2022, 327, 133081. [Google Scholar] [CrossRef]
- Weiss, M.; Hoerner, G.; Weber, B.; Marschall, R. The elemental multifariousness of the defect-pyrochlore crystal structure and application in photocatalytic hydrogen generation. Energy Technol. 2021, 10, 2100302. [Google Scholar] [CrossRef]
- Kaur, M.; Kaur, M.; Singh, D.; Feng, M.; Sharma, V.K. Magnesium ferrite-nitrogen-doped graphene oxide nanocomposite: Effective adsorptive removal of lead(II) and arsenic (III). Environ. Sci. Pollut. Res. 2022, 29, 48260–48275. [Google Scholar] [CrossRef]
- Ravi, R.; Iqbal, S.; Ghosal, A.; Ahmed, S. Novel mesoporous trimetallic strontium magnesium ferrite (Sr03Mg0.7Fe2O4) nanocubes: A selective and recoverable magnetic nanoadsorbent for Congo red. J. Alloys Compd. 2019, 791, 336–347. [Google Scholar] [CrossRef]
- Wang, A.; Zhou, K.; Liu, X.; Liu, F.; Chen, Q. Development of Mg–Al–La tri-metal mixed oxide entrapped in alginate for removal of fluoride from wastewater. RSC Adv. 2017, 7, 31221–31229. [Google Scholar] [CrossRef]
- Casbeer, E.; Sharma, V.K.; Li, X.Z. Synthesis and photocatalytic activity of ferrites under visible light: A review. Sep. Purif. Technol. 2012, 87, 1–14. [Google Scholar] [CrossRef]
- Su, M.; He, C.; Sharma, V.K.; Abou, A.M.; Xia, D.; Li, X.Z.; Deng, H.; Xiong, Y. Mesoporous zinc ferrite: Synthesis, characterization and photocatalytic activity with H2O2/ visible light. J. Hazard. Mater. 2011, 211–212, 95–103. [Google Scholar] [CrossRef]
- Fini, S.A.F.; Niasari, M.S.; Hojaghan, H.S. Hydrothermal green synthesis and photocatalytic activity of magnetic CoFe2O4–carbon quantum dots nanocomposite by turmeric precursor. J. Mater. Sci. Mater. Electron. 2017, 28, 16205–16214. [Google Scholar] [CrossRef]
- Elkodous, A.; El-Sayyad, M.; Youssry, G.S.; Nada, S.M.; Gobara, H.G.; Elsayed, M.A.; Matsuda, A. Carbon-dot-loaded CoxNi1−xFe2O4; x = 0.9/SiO2/TiO2 nanocomposite with enhanced photocatalytic and antimicrobial potential: An engineered nanocomposite for wastewater treatment. Sci. Rep. 2020, 10, 11534. [Google Scholar] [CrossRef]
- Huang, Y.; Liang, Y.; Rao, Y.; Zhu, D.; Cao, J.; Shen, Z.; Ho, W.; Lee, S.C. Environment-Friendly Carbon Quantum Dots/ZnFe2O4 Photocatalysts: Characterization, Biocompatibility, and Mechanisms for NO Removal. Environ. Sci. Technol. 2017, 51, 2924–2933. [Google Scholar] [CrossRef] [PubMed]
- Long, M.; Zheng, L. Engineering vacancies for solar photocatalytic applications. Chin. J. Catal. 2017, 38, 617–624. [Google Scholar] [CrossRef]
- Bo, L.; Hu, Y.; Zhang, Z.; Tong, J. Efficient photocatalytic degradation of rhodamine B catalyzed by SrFe2O4/g-C3N4 composite under visible light. Polyhedron 2019, 168, 94–100. [Google Scholar] [CrossRef]
- Pardeshi, S.K.; Pawar, R.Y. SrFe2O4 complex oxide an effective and environmentally benign catalyst for selective oxidation of styrene. J. Mol. Catal. A Chem. 2011, 334, 35–43. [Google Scholar] [CrossRef]
- Zafar, M.N.; Amjad, M.; Tabassum, M.; Ahmad, I.; Zubair, M. SrFe2O4 nanoferrites and SrFe2O4/ground eggshell nanocomposites: Fast and efficient adsorbents for dyes removal. J. Clean Prod. 2018, 199, 983–994. [Google Scholar] [CrossRef]
- Huang, S.; Jiang, S.; Pang, H.; Wen, T.; Asiri, A.M.; Alamry, K.A.; Alsaedi, A.; Wang, X.; Wang, S. Dual functional nanocomposites of magnetic MnFe2O4 and fluorescent carbon dots for efficient U(VI) removal. Chem. Eng. J. 2019, 368, 941–950. [Google Scholar] [CrossRef]
- Naghshbandi, Z.; Arsalani, N.; Sadegh, M.; Geckeler, K.E. A novel synthesis of magnetic and photoluminescent graphene quantum dots/MFe2O4 (M = Ni, Co) nanocomposites for catalytic application. Appl. Surf. Sci. 2018, 443, 484–491. [Google Scholar] [CrossRef]
- Majumdar, B.; Sarma, D.; Jain, S.; Sarma, T.K. One-pot magnetic iron oxide−carbon nanodot composite-catalyzed cyclooxidative aqueous tandem synthesis of quinazolinones in the presence of tert-butyl hydroperoxide. ACS Omega 2018, 3, 13711–13719. [Google Scholar] [CrossRef]
- Li, L.; Wang, F.; Lv, Y.; Liu, J.; Bian, H.; Wang, W.; Li, Y.; Shao, Z. CQDs-doped magnetic electrospun nanofibers: Fluorescence self-display and adsorption removal of mercury(II). ACS Omega 2018, 3, 4220–4230. [Google Scholar] [CrossRef]
- Jaleh, B.; Khalilipour, S.; Habibi, S.; Niyaifar, M.; Nasrollahzadeh, M. Synthesis, characterization, magnetic and catalytic properties of graphene oxide/Fe3O4. J. Mater. Sci. Mater. Electron. 2017, 28, 4974. [Google Scholar] [CrossRef]
- Kabel, J.; Sharma, S.; Acharya, A.; Zhang, D.; Yap, Y.K. Molybdenum disulfide quantum dots: Properties, synthesis, and applications. J. Carbon Res. 2021, 7, 45. [Google Scholar] [CrossRef]
- Jing, S.; Zhao, Y.; Sun, R.-C.; Zhong, L.; Peng, X. Facile and high-yield synthesis of carbon quantum dots from biomass-derived carbons at mild condition. ACS Sustain. Chem. Eng. 2019, 7, 7833–7843. [Google Scholar] [CrossRef]
- Mai, X.-D.; Phan, Y.T.H.; Nguyen, V.Q. Excitation-independent emission of carbon quantum dot solids. Adv. Mater. Sci. Eng. 2020, 2020, 9643168. [Google Scholar] [CrossRef]
- Tanaka, K.; Nakashima, S.; Fujita, K.; Hirao, K. High magnetization and the faraday effect for ferrimagnetism zinc ferrite thin film. J. Phys. Condens. Matter 2003, 15, L469–L474. [Google Scholar] [CrossRef]
- Pan, J.; Chen, J.; Khan, Q.; Huang, Q. Size Tunable ZnO Nanoparticles to enhance electron injection in solution processed QLEDs. ACS Photon. 2016, 3, 215–222. [Google Scholar] [CrossRef]
- Khusboo Kaur, M.; Kiranjeet. Mechanistic insight into adsorption and photocatalytic potential of magnesium ferrite-bentonite nanocomposite. J. Photochem. Photobiol. A Chem. 2022, 425, 113717. [Google Scholar] [CrossRef]
- Ubhi, M.K.; Kaur, M.; Singh, D.; Oliveira, A.C.; Garg, V.K.; Sharma, V.K. Hierarchical nanoflowers of MgFe2O4, bentonite and B-,P- co-doped graphene oxide as adsorbent and photocatalyst: Optimization of parameters by box–behnken methodology. Int. J. Mol. Sci. 2022, 23, 9678. [Google Scholar] [CrossRef]
- Ubhi, M.K.; Kaur, M.; Grewal, J.K.; Oliveira, A.C.; Garg, V.K.; Sharma, V.K. Insight into photocatalytic behavior of magnesium ferrite–bentonite nanocomposite for the degradation of organic contaminants. J. Mater. Res. 2022. [Google Scholar] [CrossRef]
- Cong, S.; Zhao, Z. Carbon Quantum Dots: A component of efficient visible light photocatalysts. In Visible-Light Photocatalysis of Carbon-Based Materials; Yao, Y., Ed.; Intech Open: Singapore, 2017. [Google Scholar] [CrossRef]
- Shahid, M. Fabrication of magnesium substituted cadmium ferrite nanoparticles decorated Graphene-Sheets with improved photocatalytic activity under visible light irradiation. Ceram. Int. 2020, 46, 10861–10870. [Google Scholar] [CrossRef]
- Jiao, X.Y.; Li, L.S.; Qin, S.; Zhang, Y.; Huang, K.; Xu, L. The synthesis of fluorescent carbon dots from mango peel and their multiple applications. Colloids Surf. A Physicochem. Eng. Asp. 2019, 577, 306–314. [Google Scholar] [CrossRef]
- Surendran, P.; Lakshmanan, A.; Vinitha, G.; Ramalingam, G.; Rameshkumar, P. Facile preparation of high fluorescent carbon quantum dots from orange waste peels for nonlinear optical applications. Luminescence 2019, 35, 196–202. [Google Scholar] [CrossRef] [PubMed]
- Wael, A.A.; Ahmed, F.R.; Mona, E.A.; Nagy, L.T.; Ahmed, S.A.; Mohamad, M.A. Green synthesis of carbon quantum dots from purslane leaves for the detection of formaldehyde using quartz crystal microbalance. Carbon 2021, 179, 159–171. [Google Scholar]
- Bandi, R.; Gangapuram, B.R.; Dadigala, R.; Eslavath, R.; Singh, S.S.; Guttena, V. Facile and green synthesis of fluorescent carbon dots from onion waste and their potential applications as sensor and multicolour imaging agents. RSC Adv. 2016, 6, 28633–28639. [Google Scholar] [CrossRef]
- Boruah, A.; Saikia, M.; Das, T.; Goswamee, R.L.; Saikia, B.K. Blue-emitting fluorescent carbon quantum dots from waste biomass sources and their application in fluoride ion detection in water. J. Photochem. Photobiol. B Biol. 2020, 209, 111940. [Google Scholar] [CrossRef]
- Bano, D.; Kumar, V.; Singh, V.K.; Hasan, S.H. Green synthesis of fluorescent carbon quantum dots for the detection of mercury (II) and glutathione. New J. Chem. 2018, 42, 5814–5821. [Google Scholar] [CrossRef]


Publisher’s Note: MDPI stays neutral with regard to jurisdictional claims in published maps and institutional affiliations. |
© 2022 by the authors. Licensee MDPI, Basel, Switzerland. This article is an open access article distributed under the terms and conditions of the Creative Commons Attribution (CC BY) license (https://creativecommons.org/licenses/by/4.0/).