

A New Series of Tungstophosphoric Acid-Polymeric Matrix Catalysts: Application in the Green Synthesis of 2-Benzazepines and Analogous Rings

 ,
, 
Abstract
1. Introduction
2. Results and Discussion
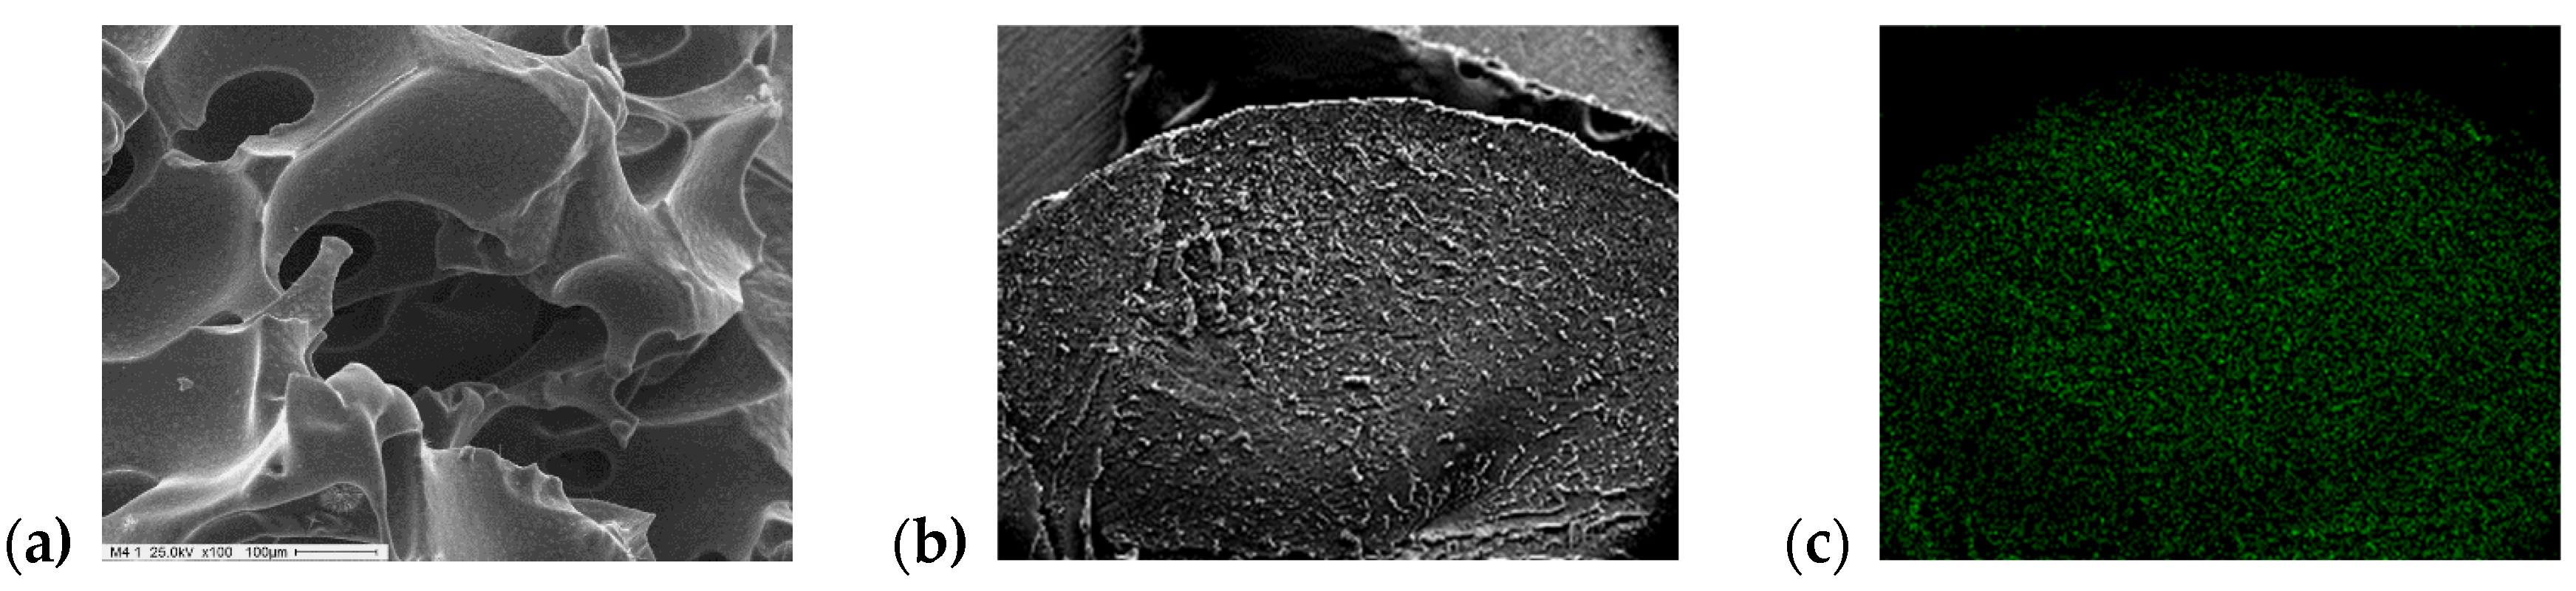
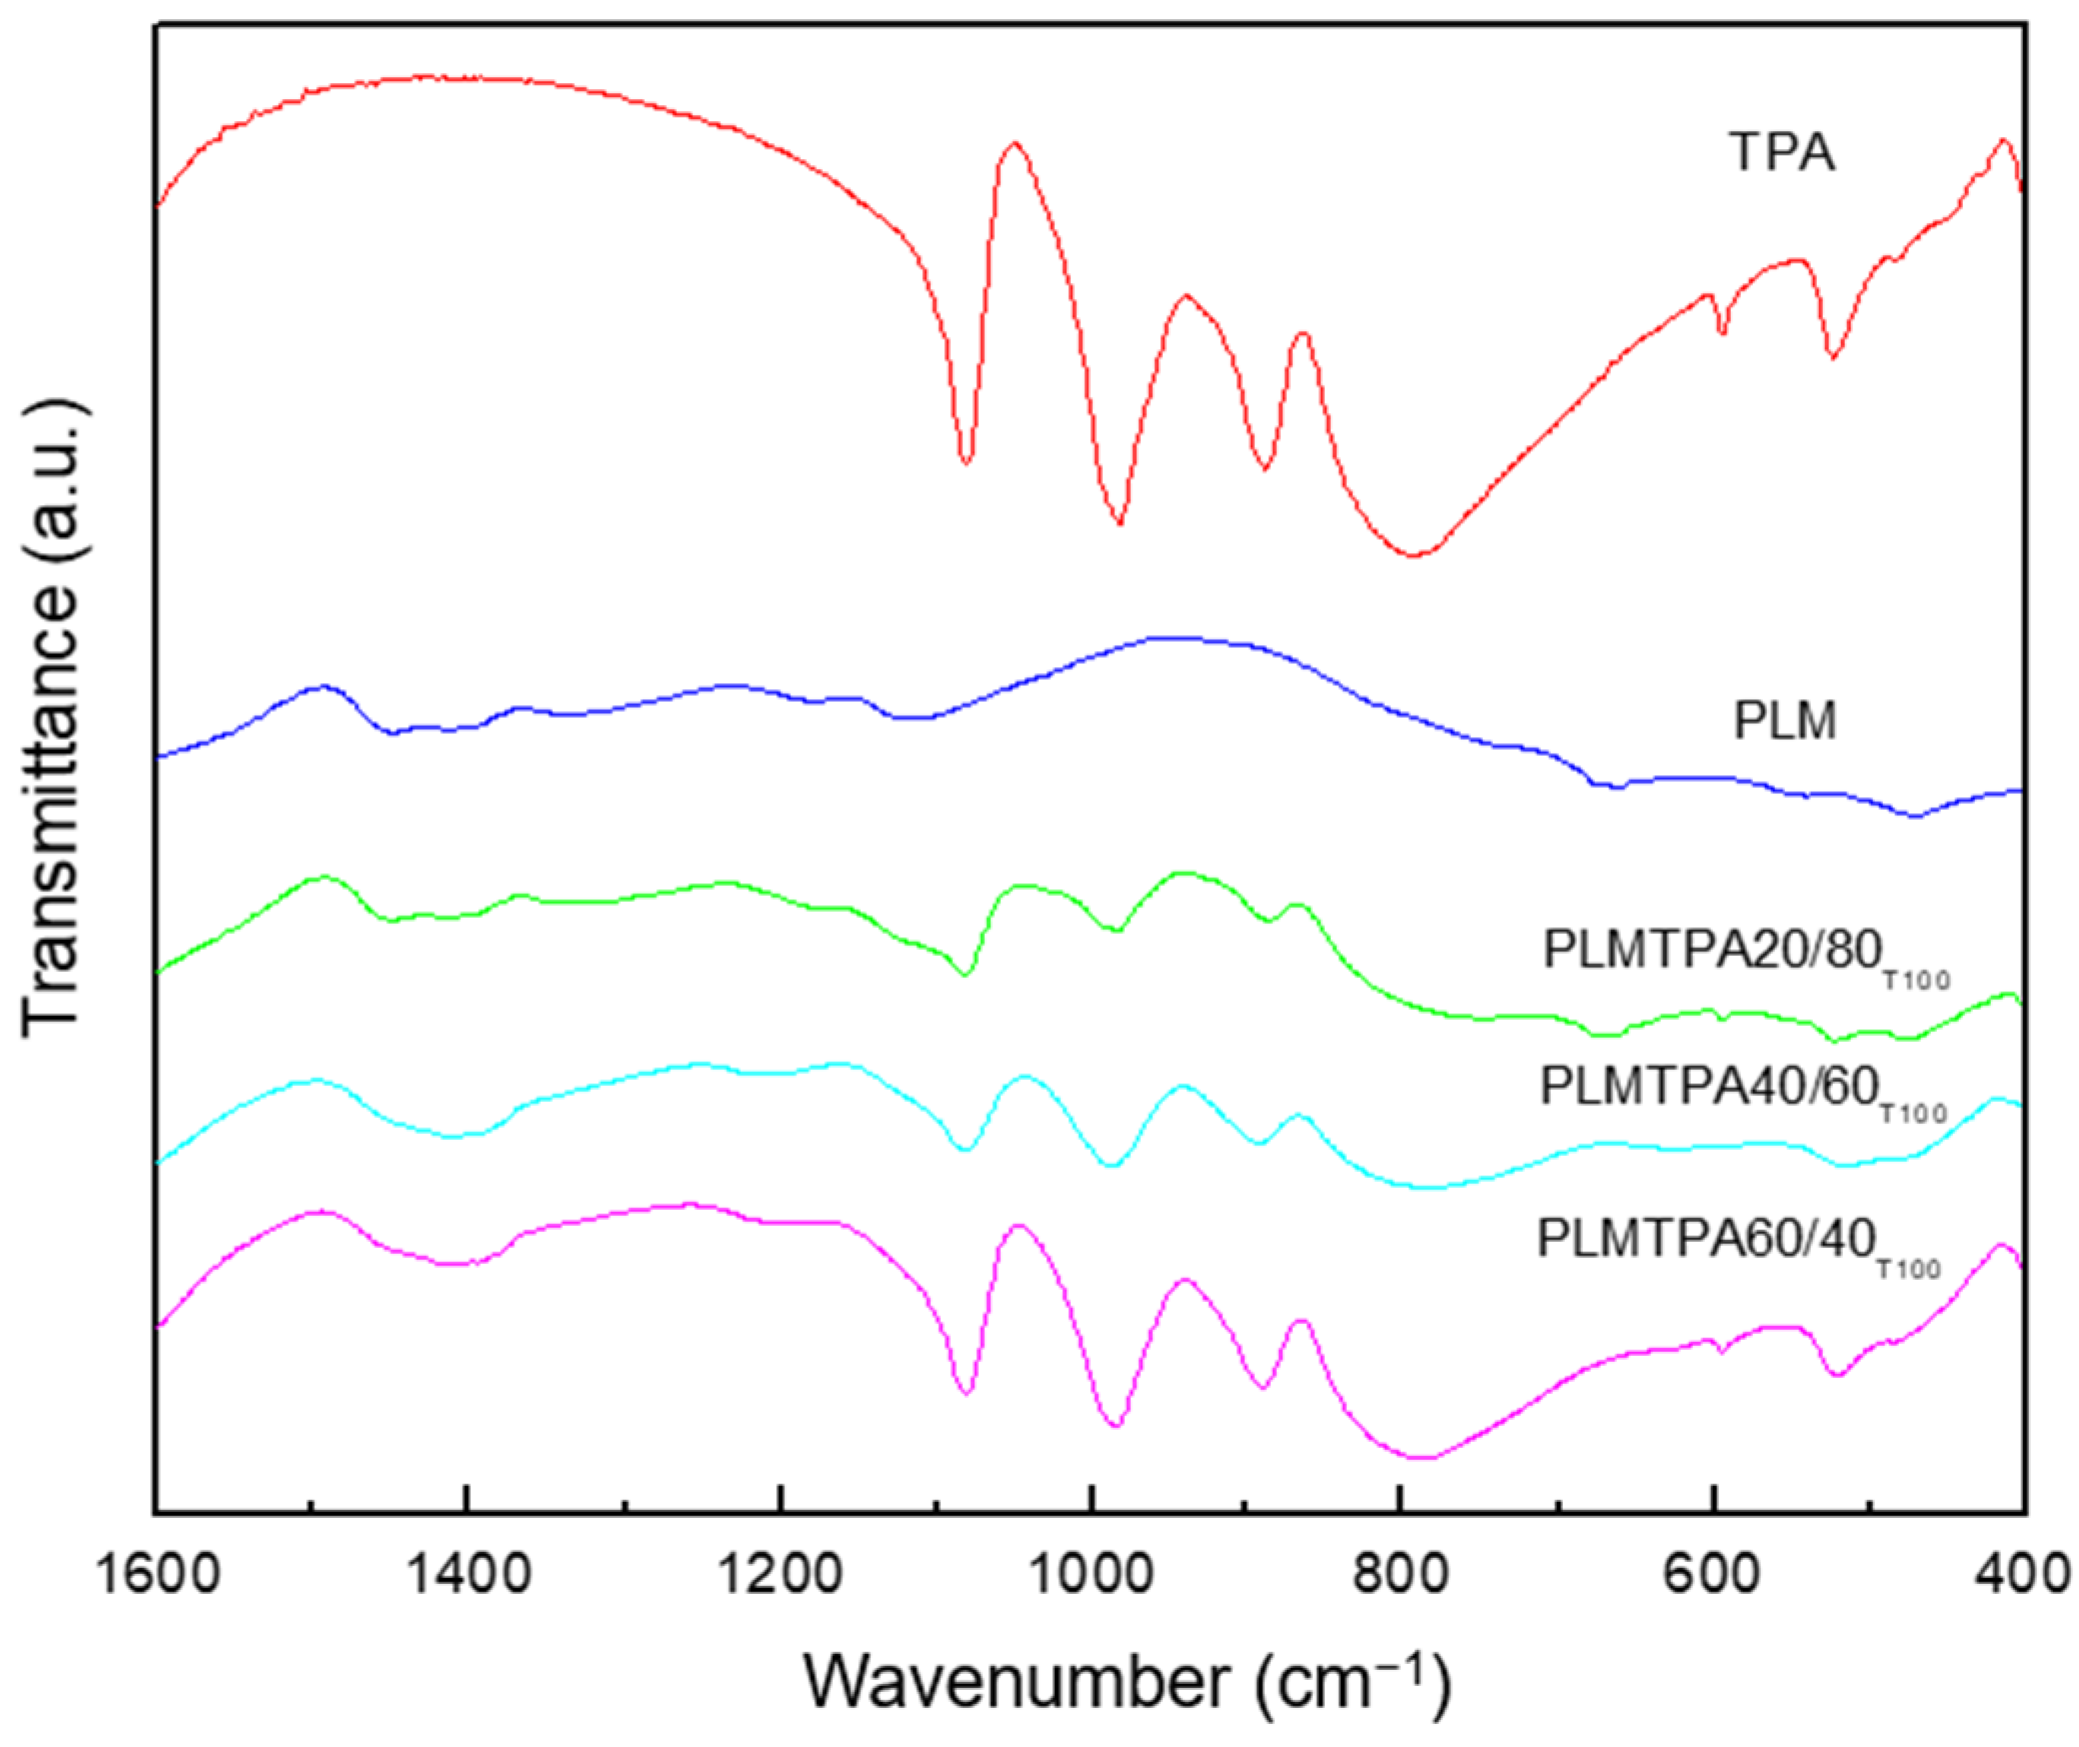
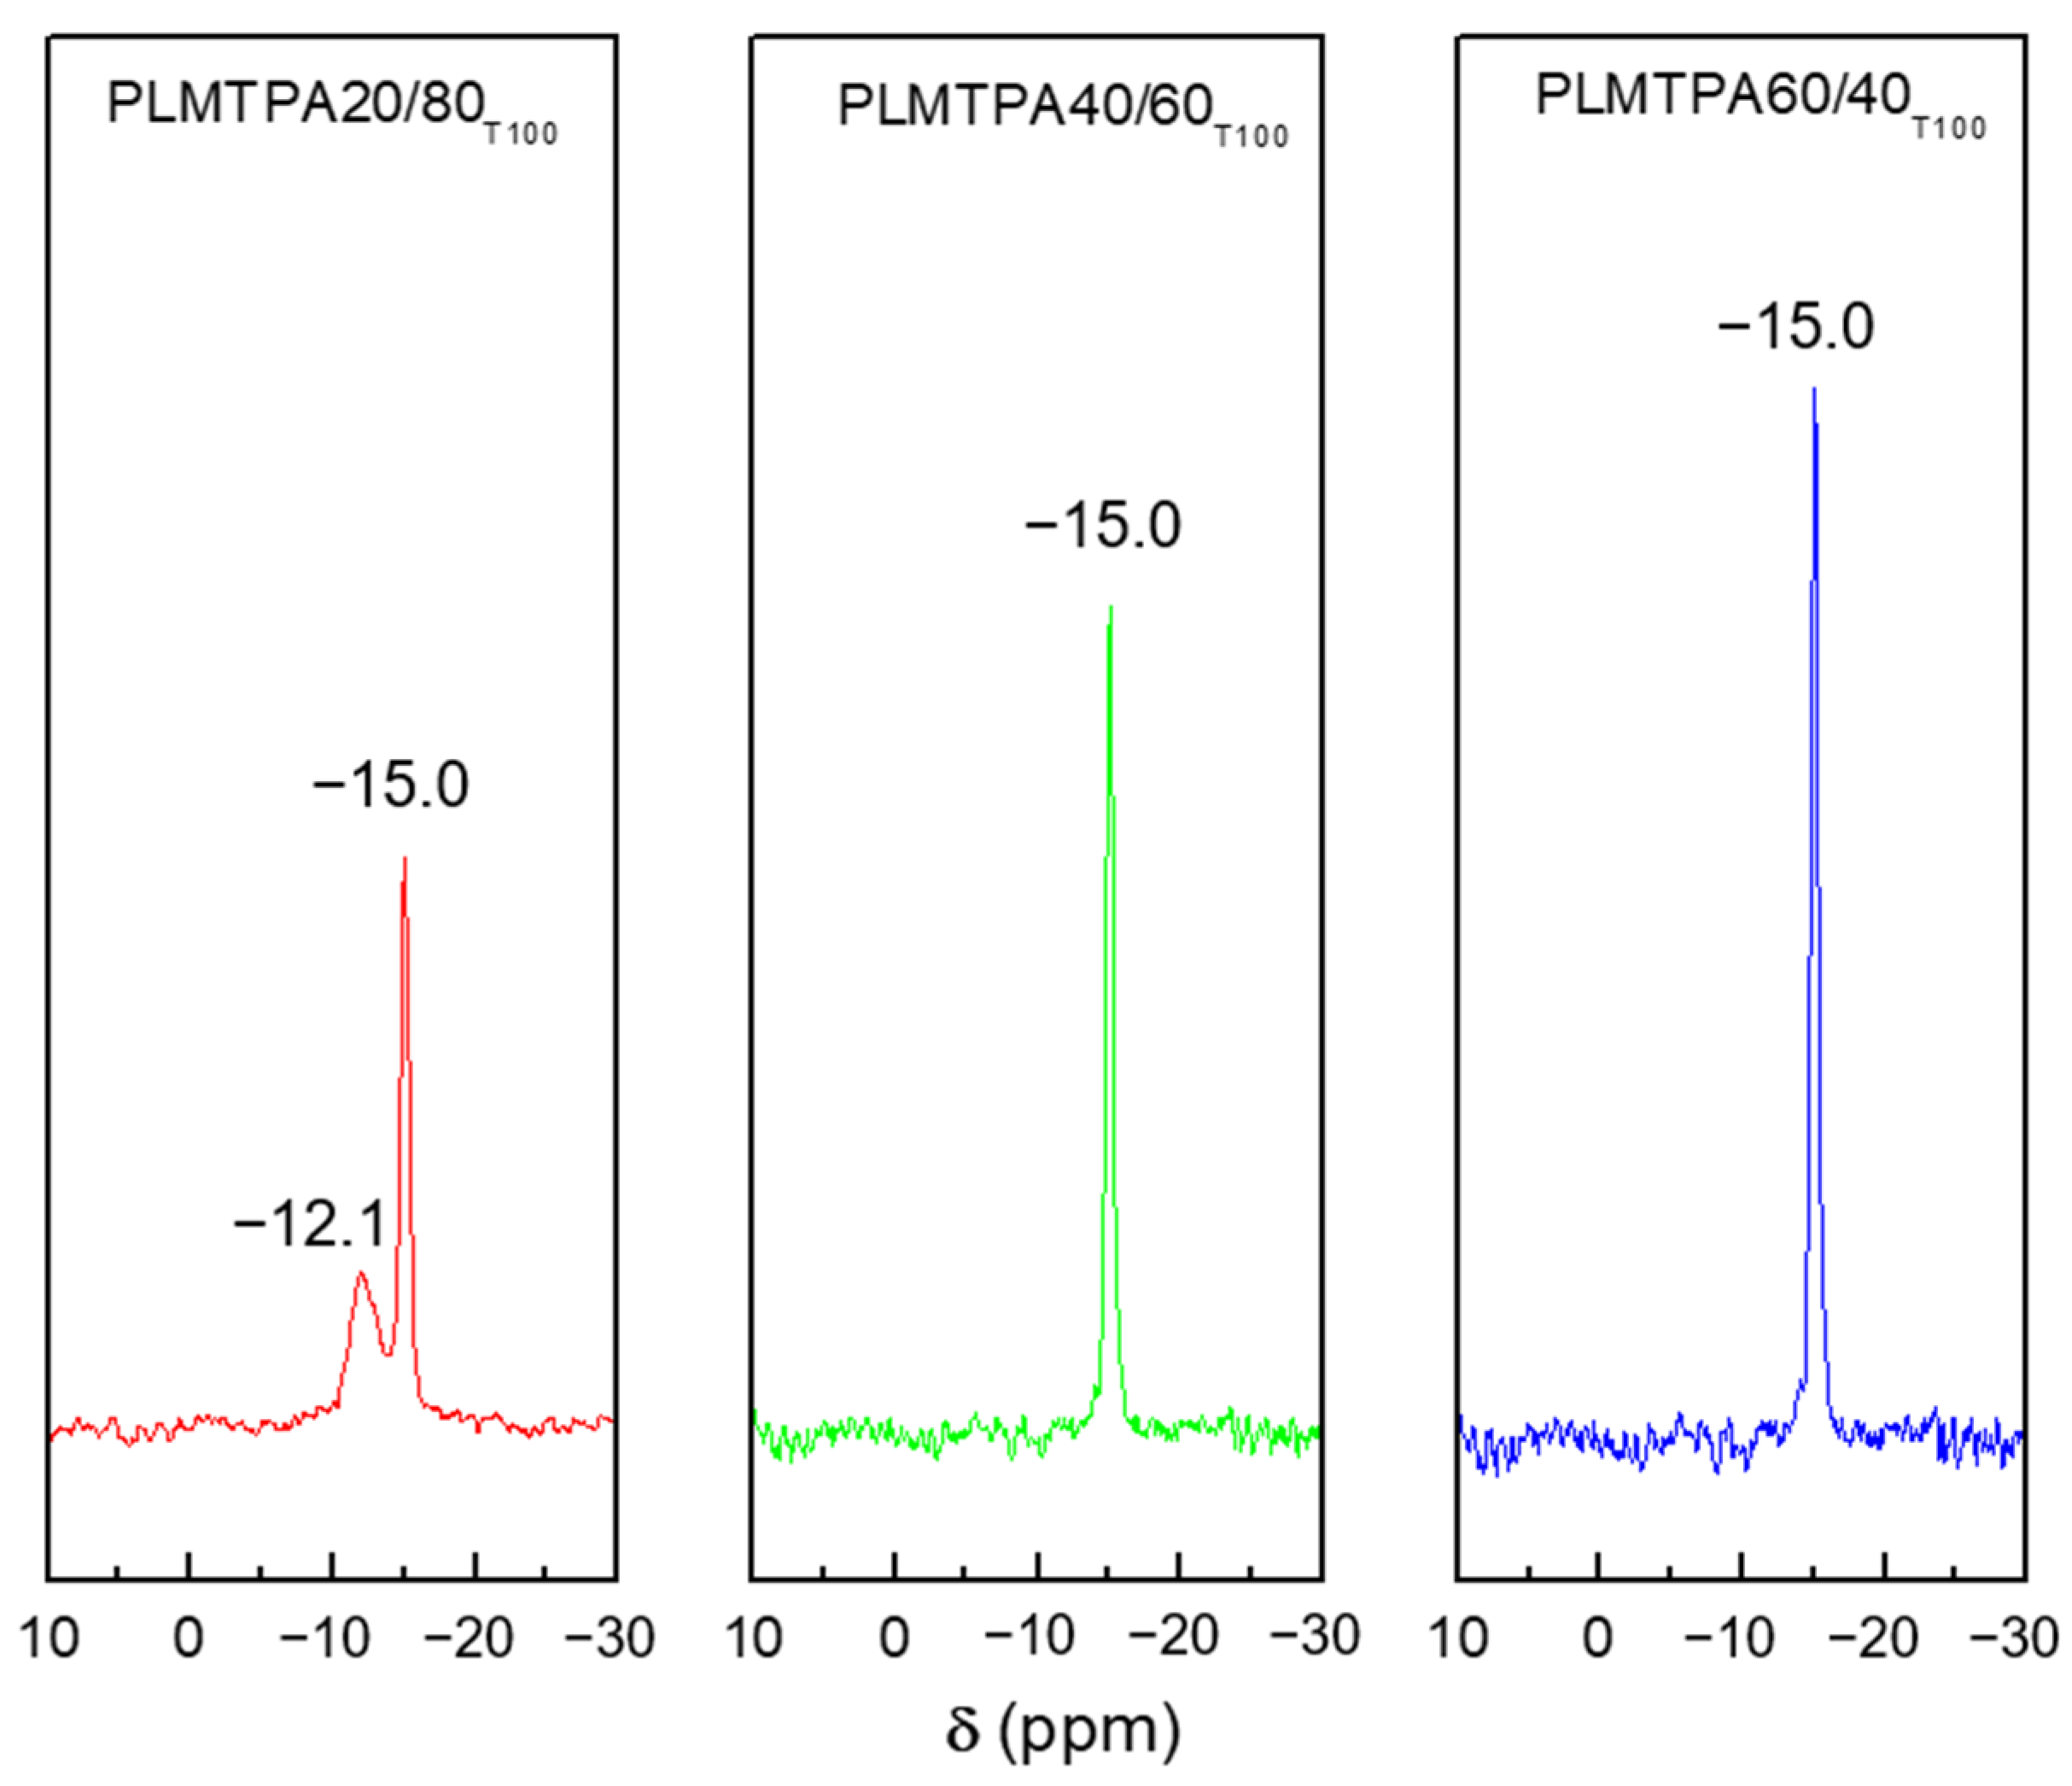
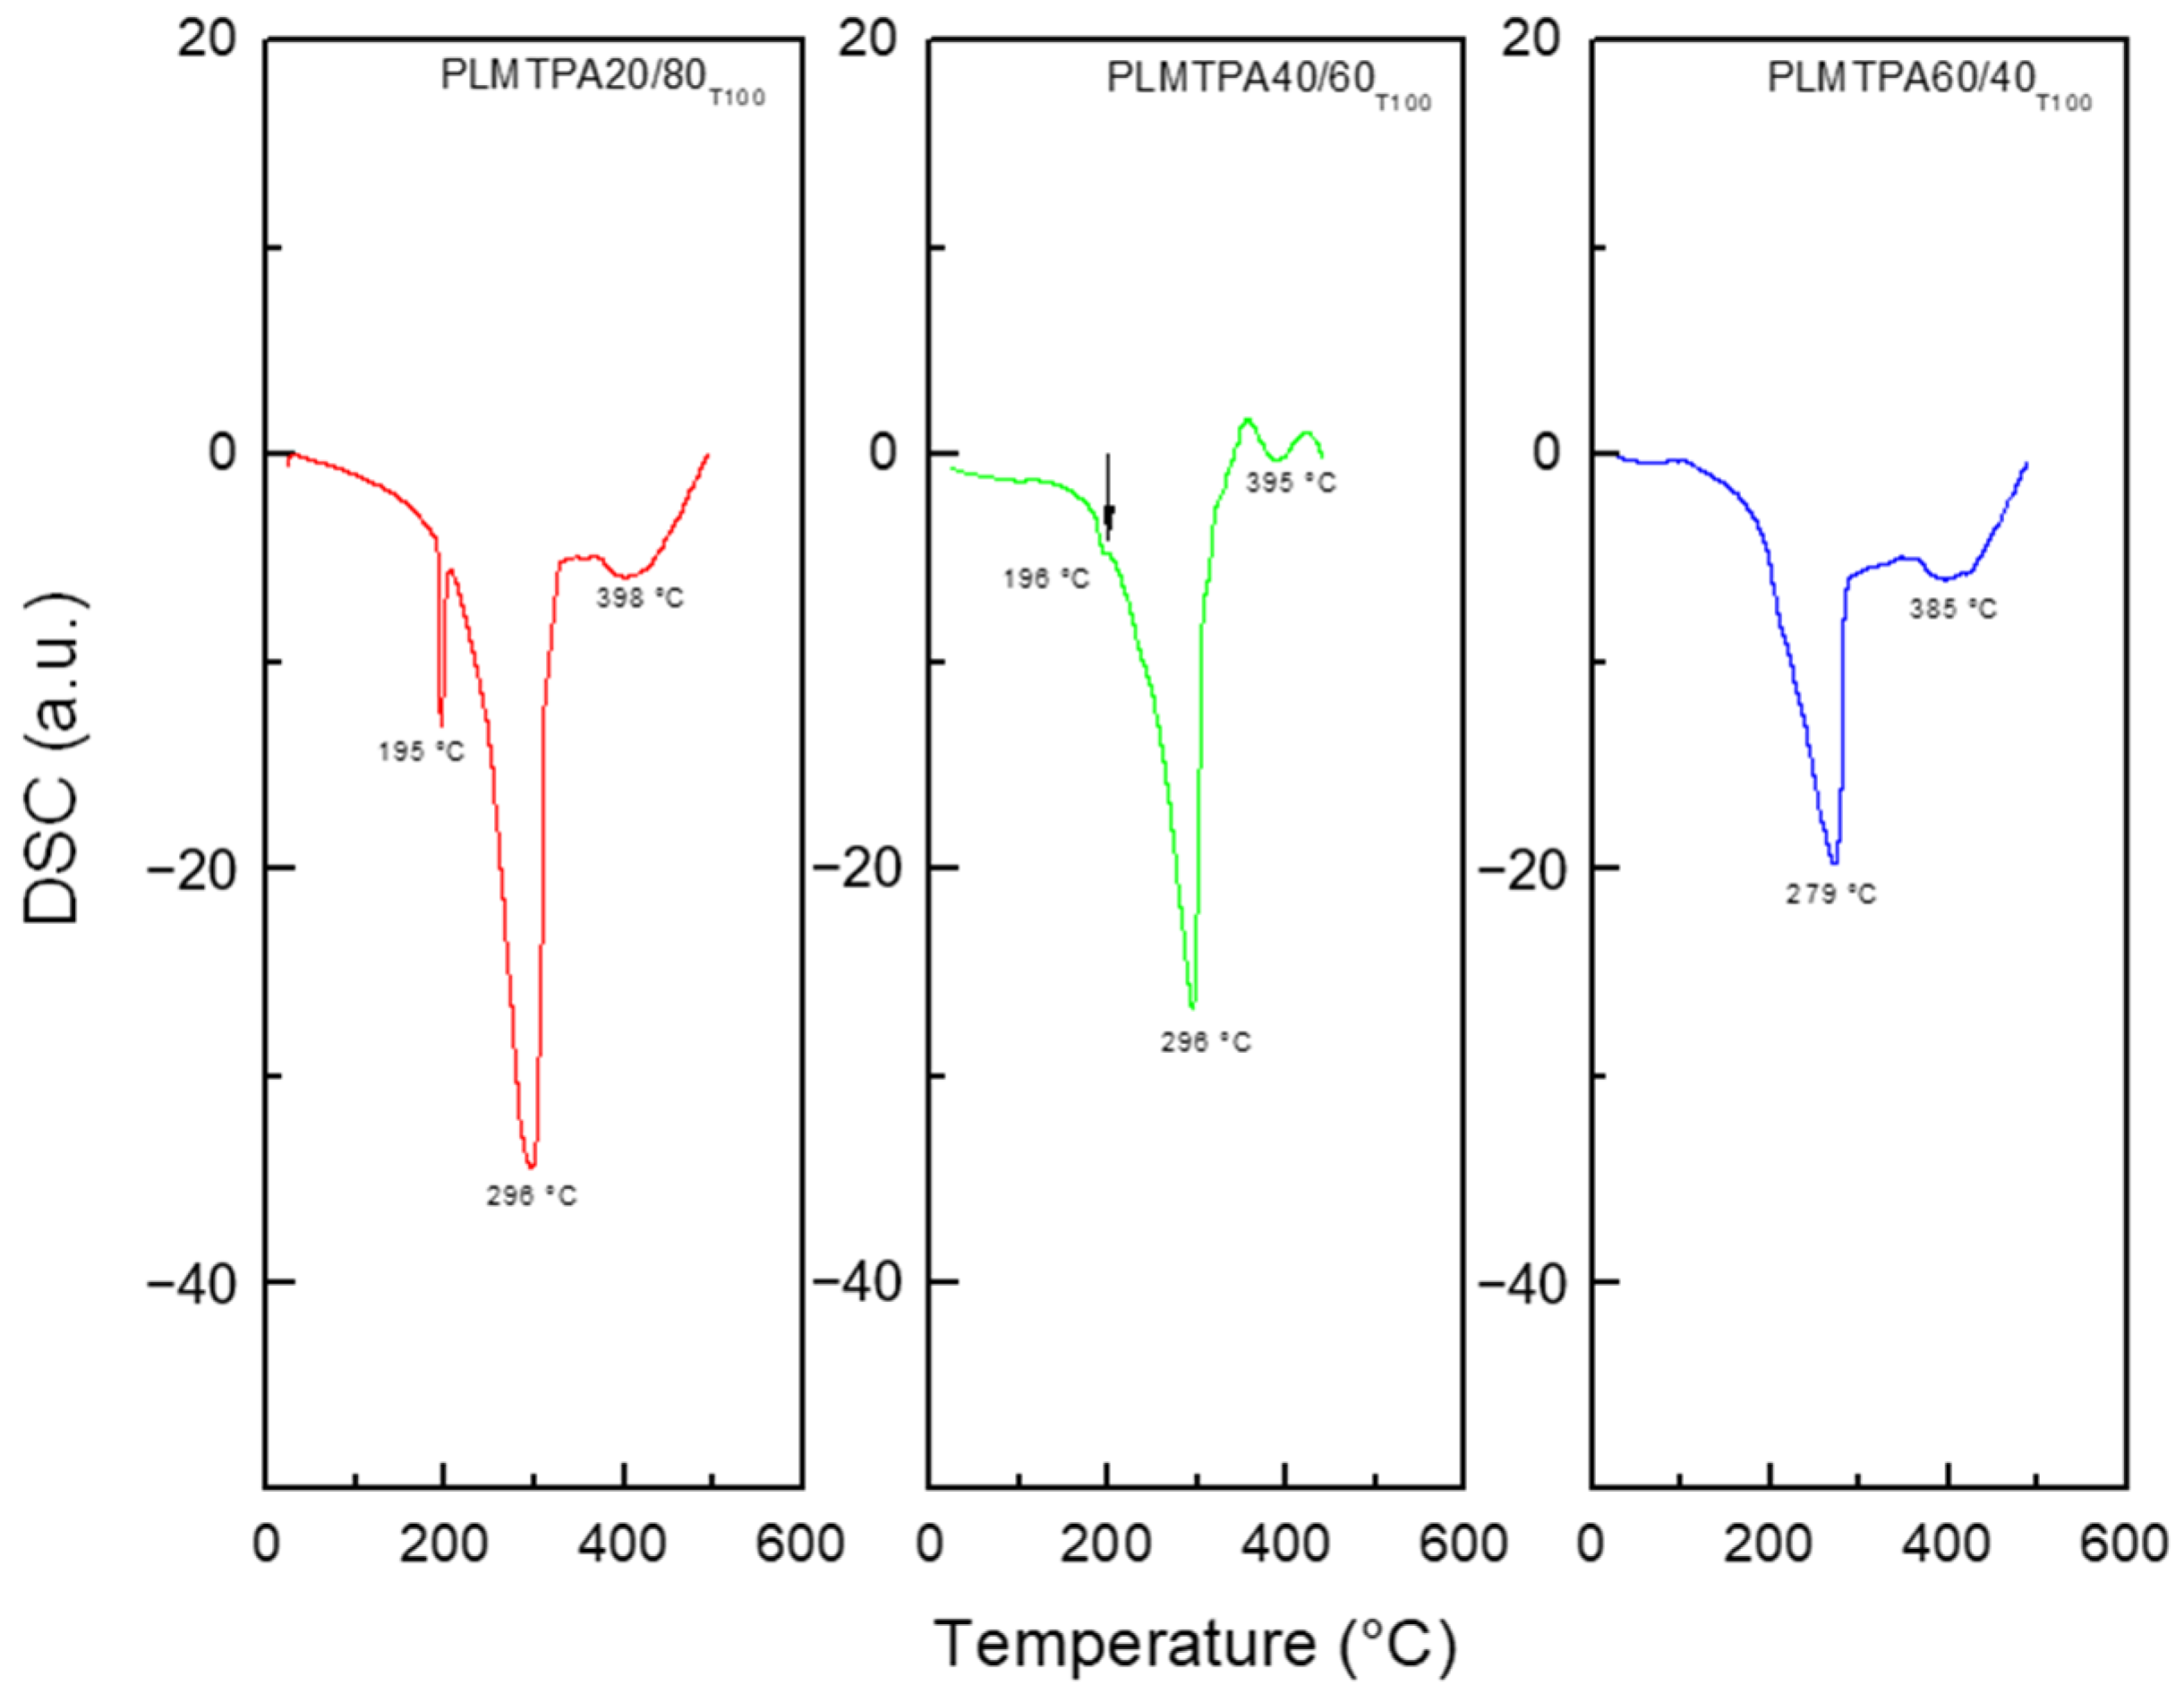
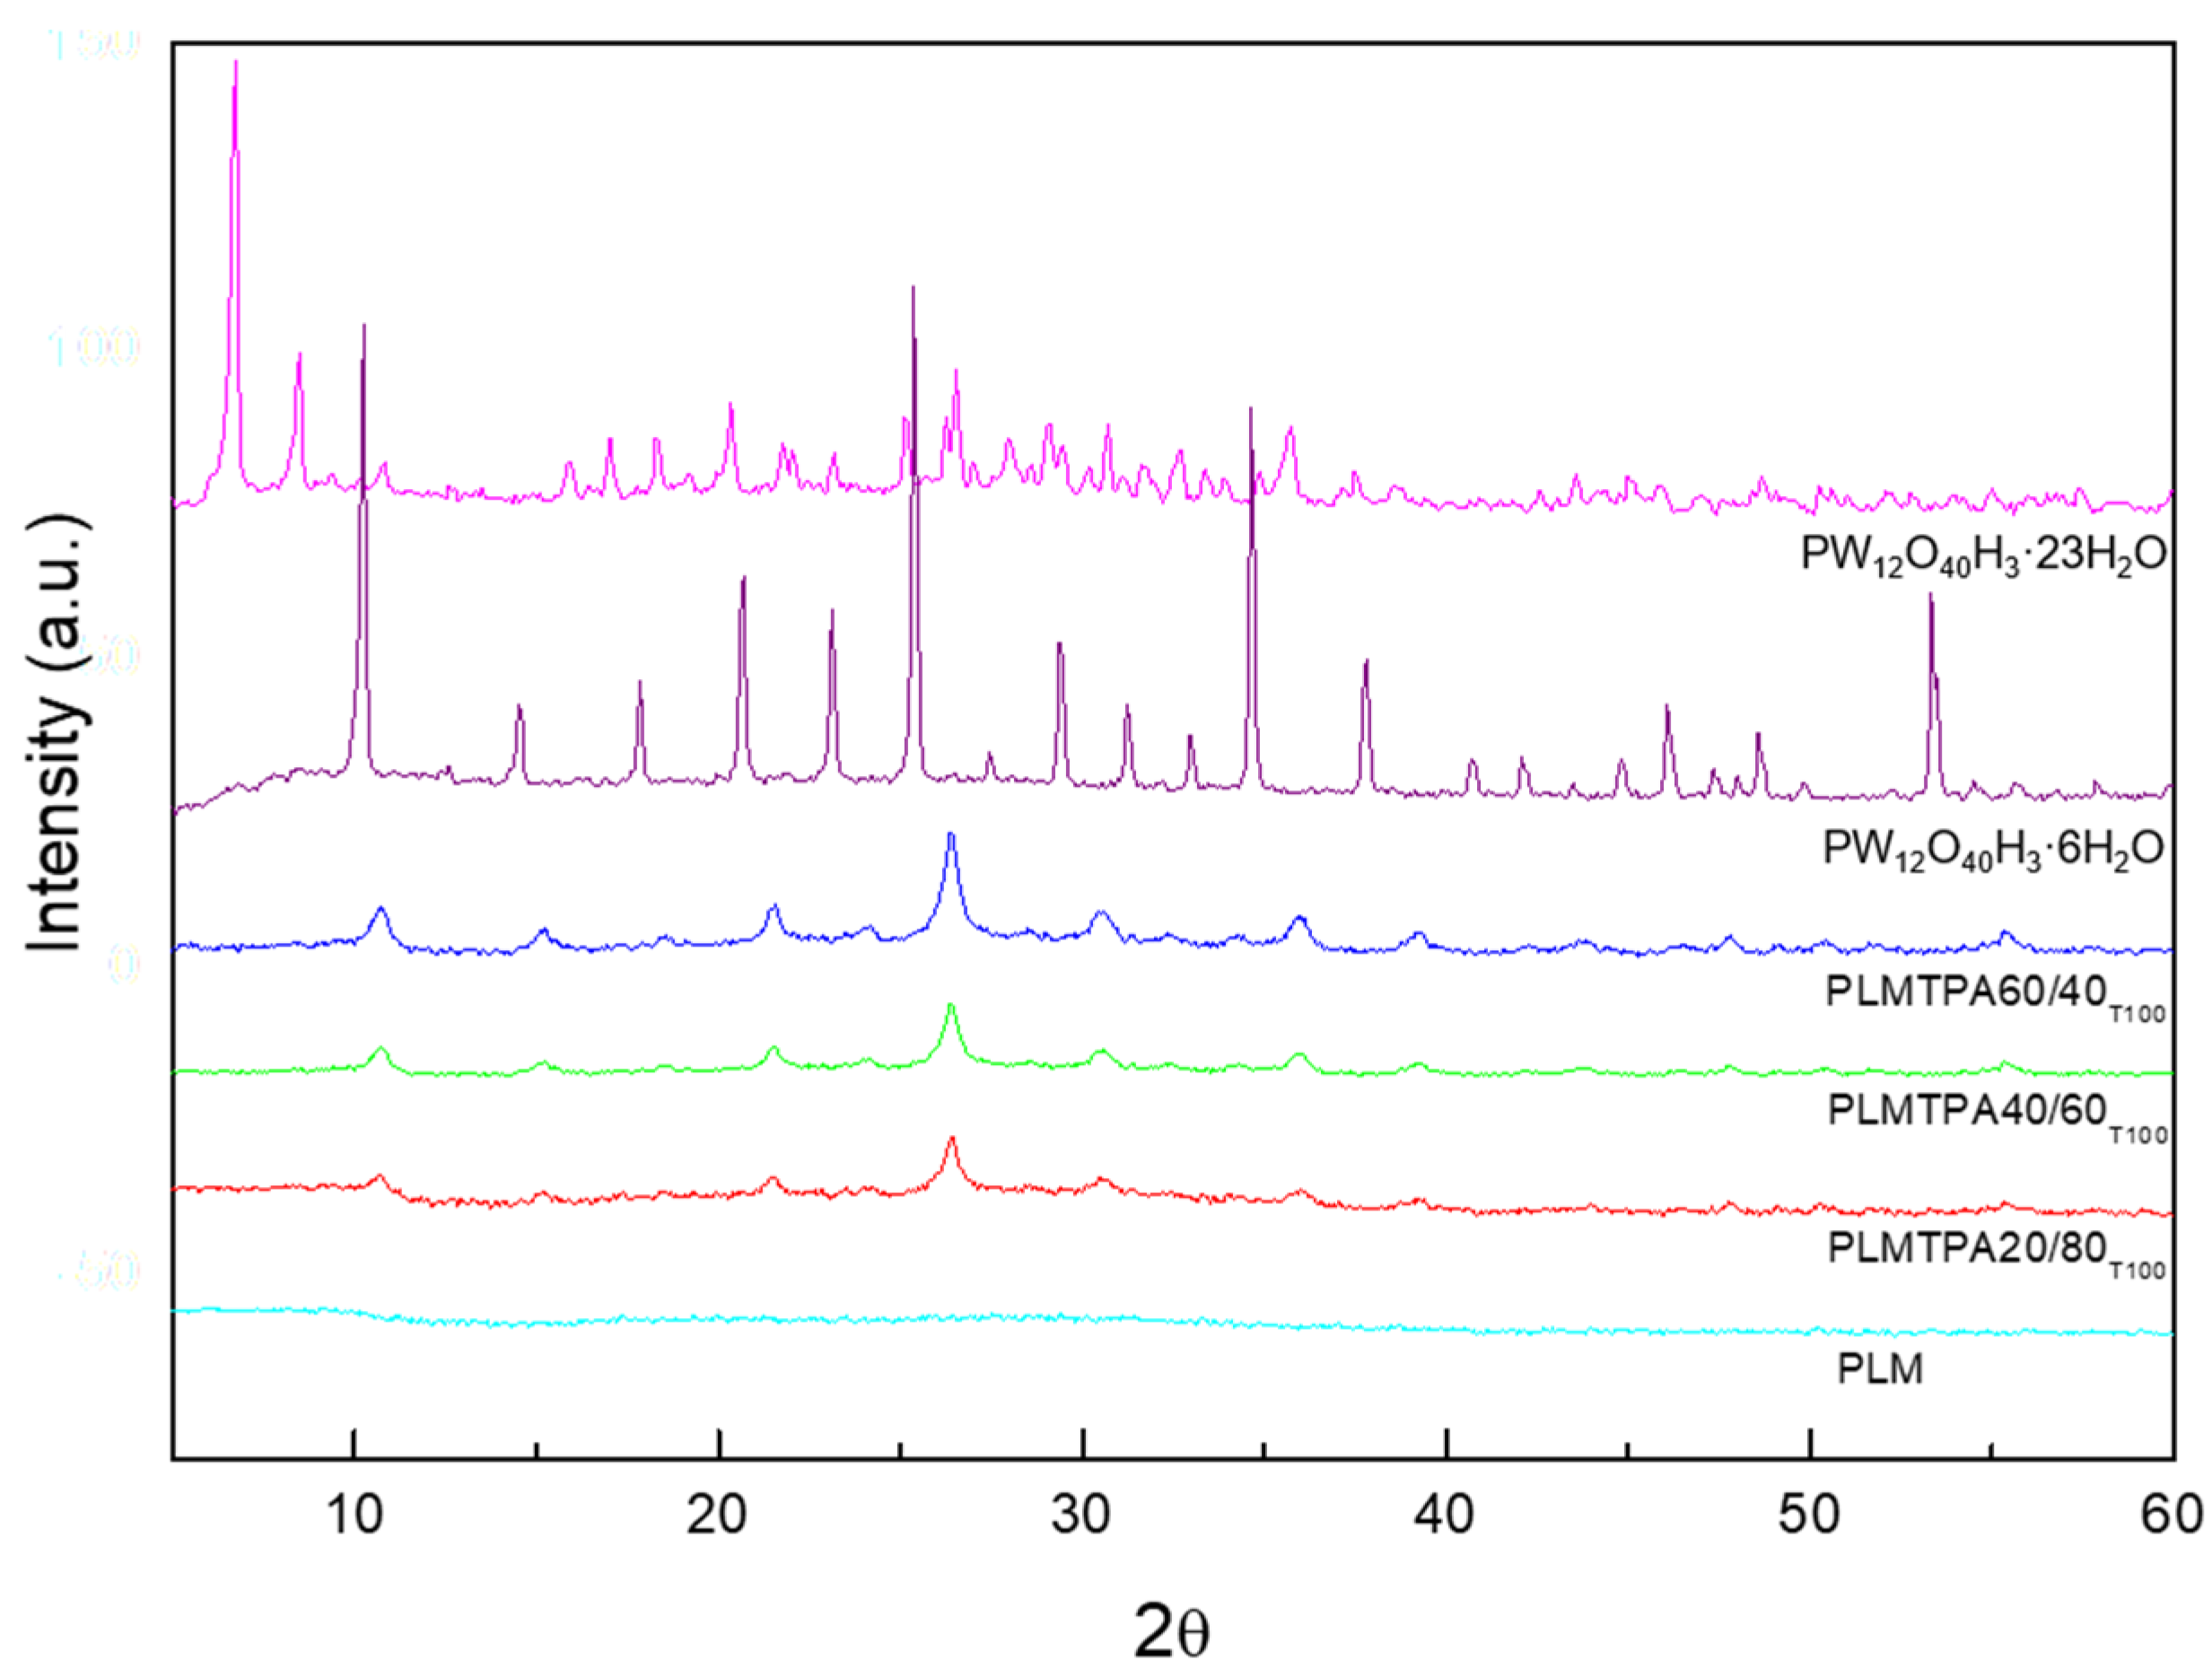
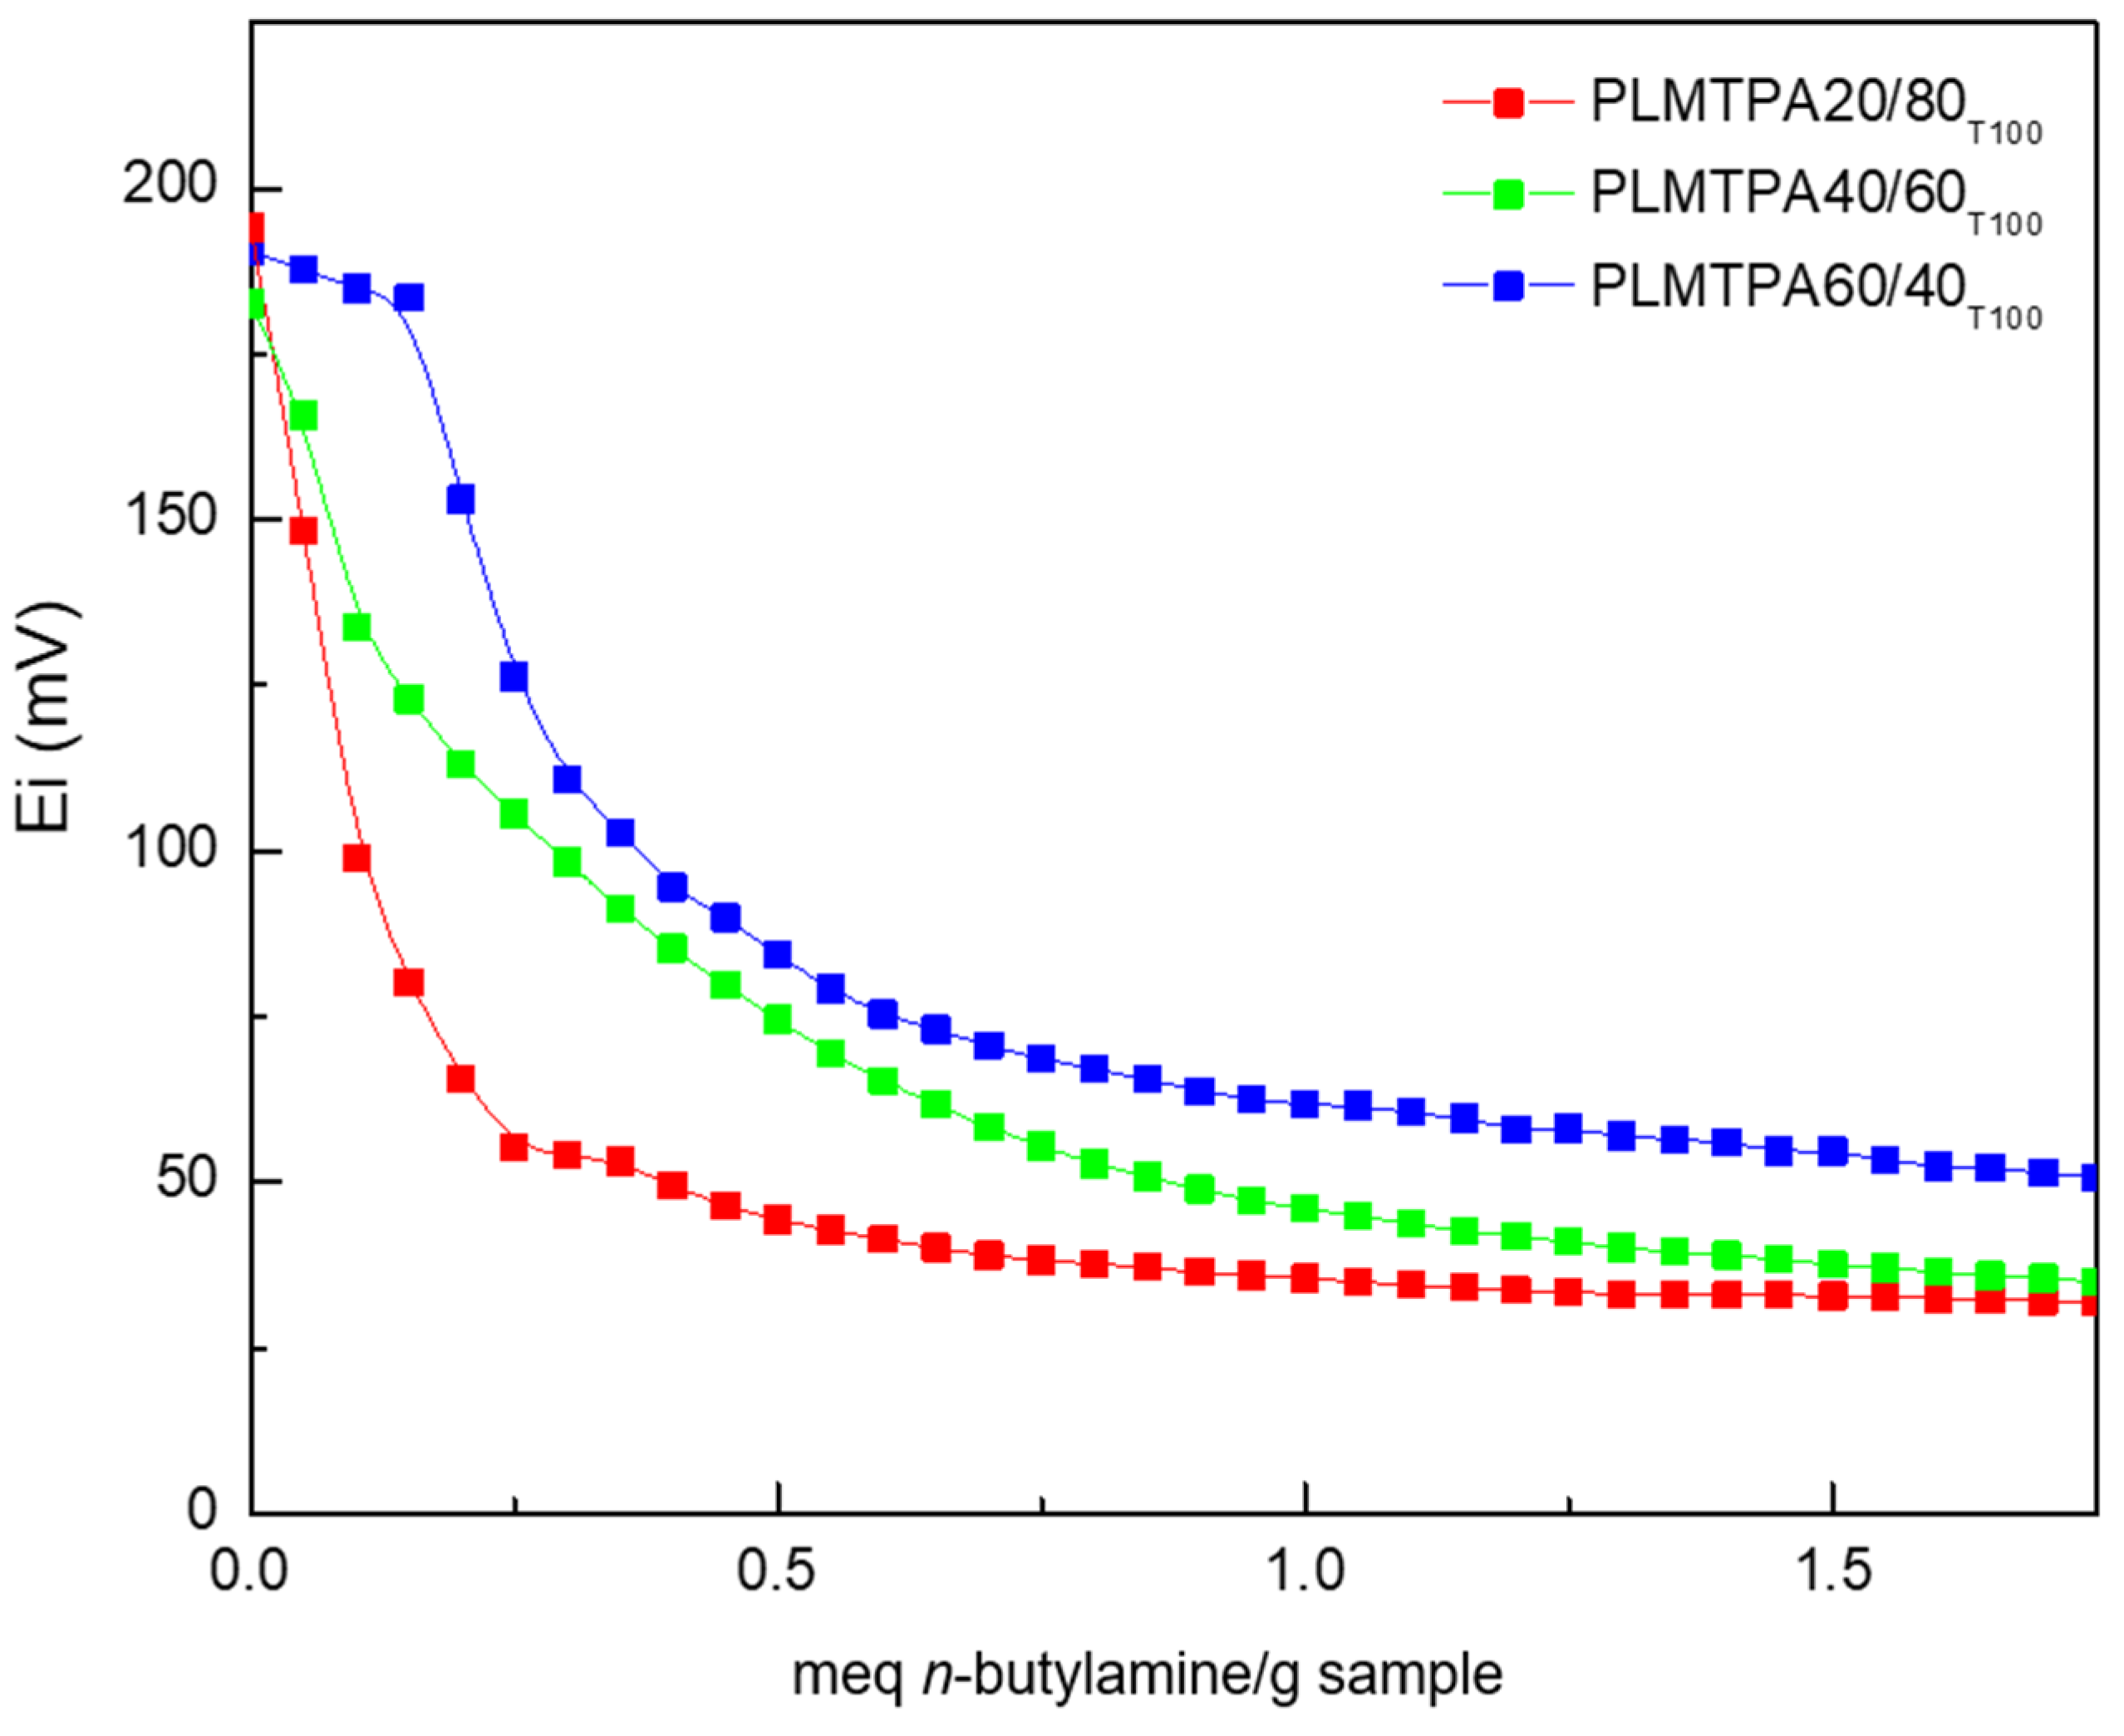
2.1. Catalyst Characterization
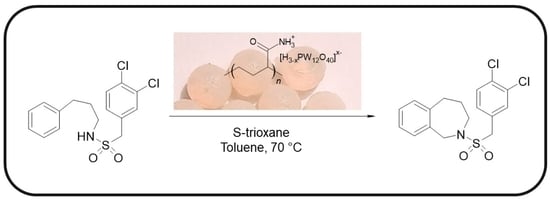
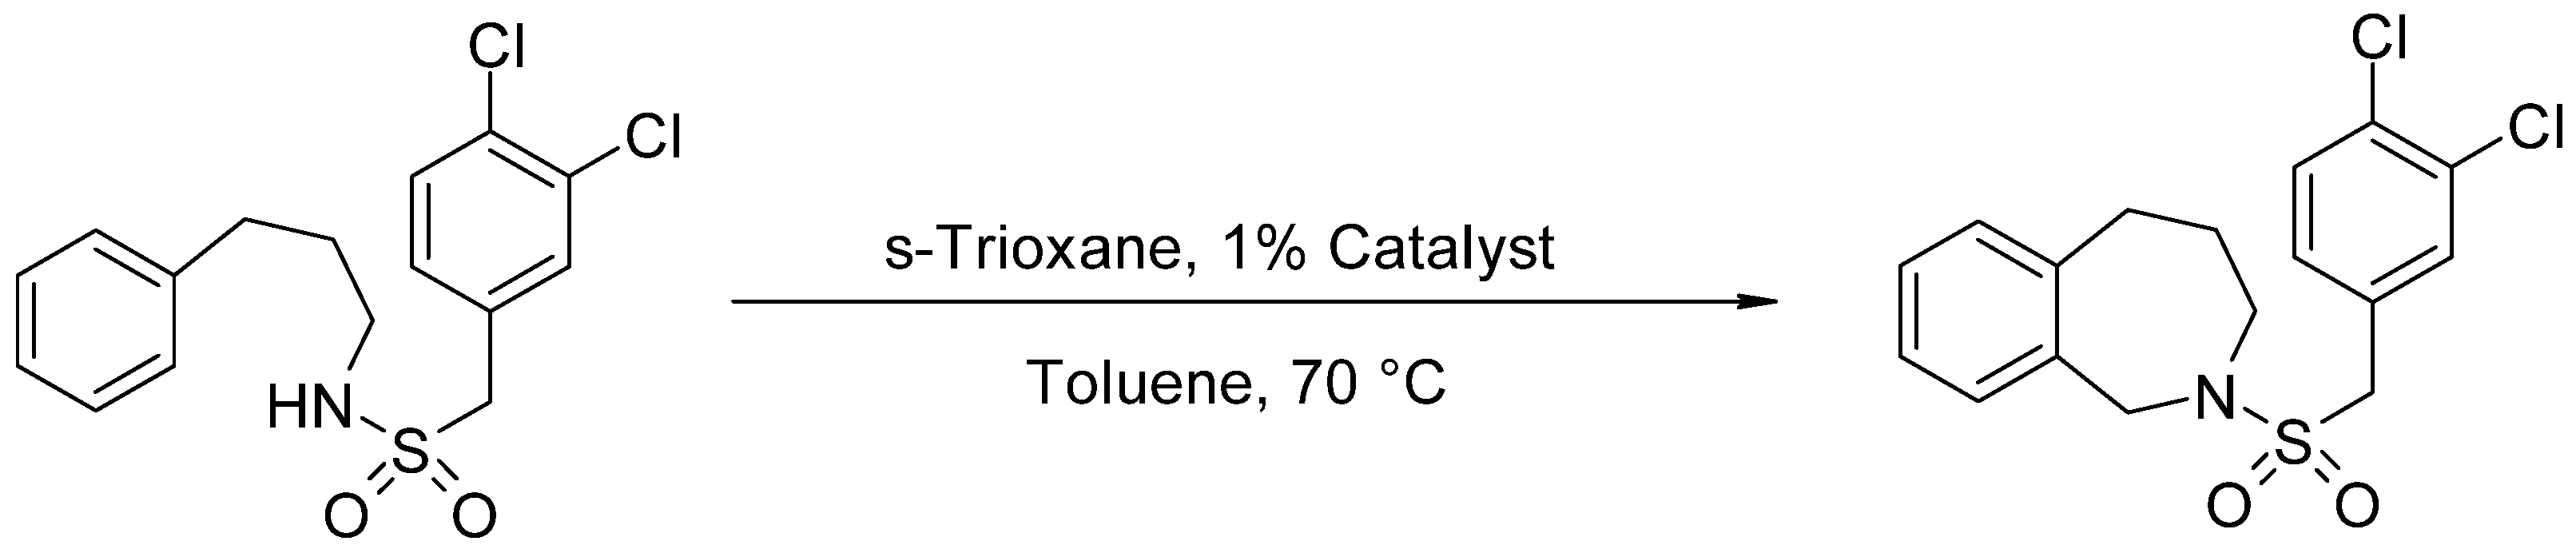
2.2. Catalytic Test for N-(3,4-Dichlorobenzylsulfonyl)-2,3,4,5-Tetrahydro-1H-Benzo[c]azepine Synthesis
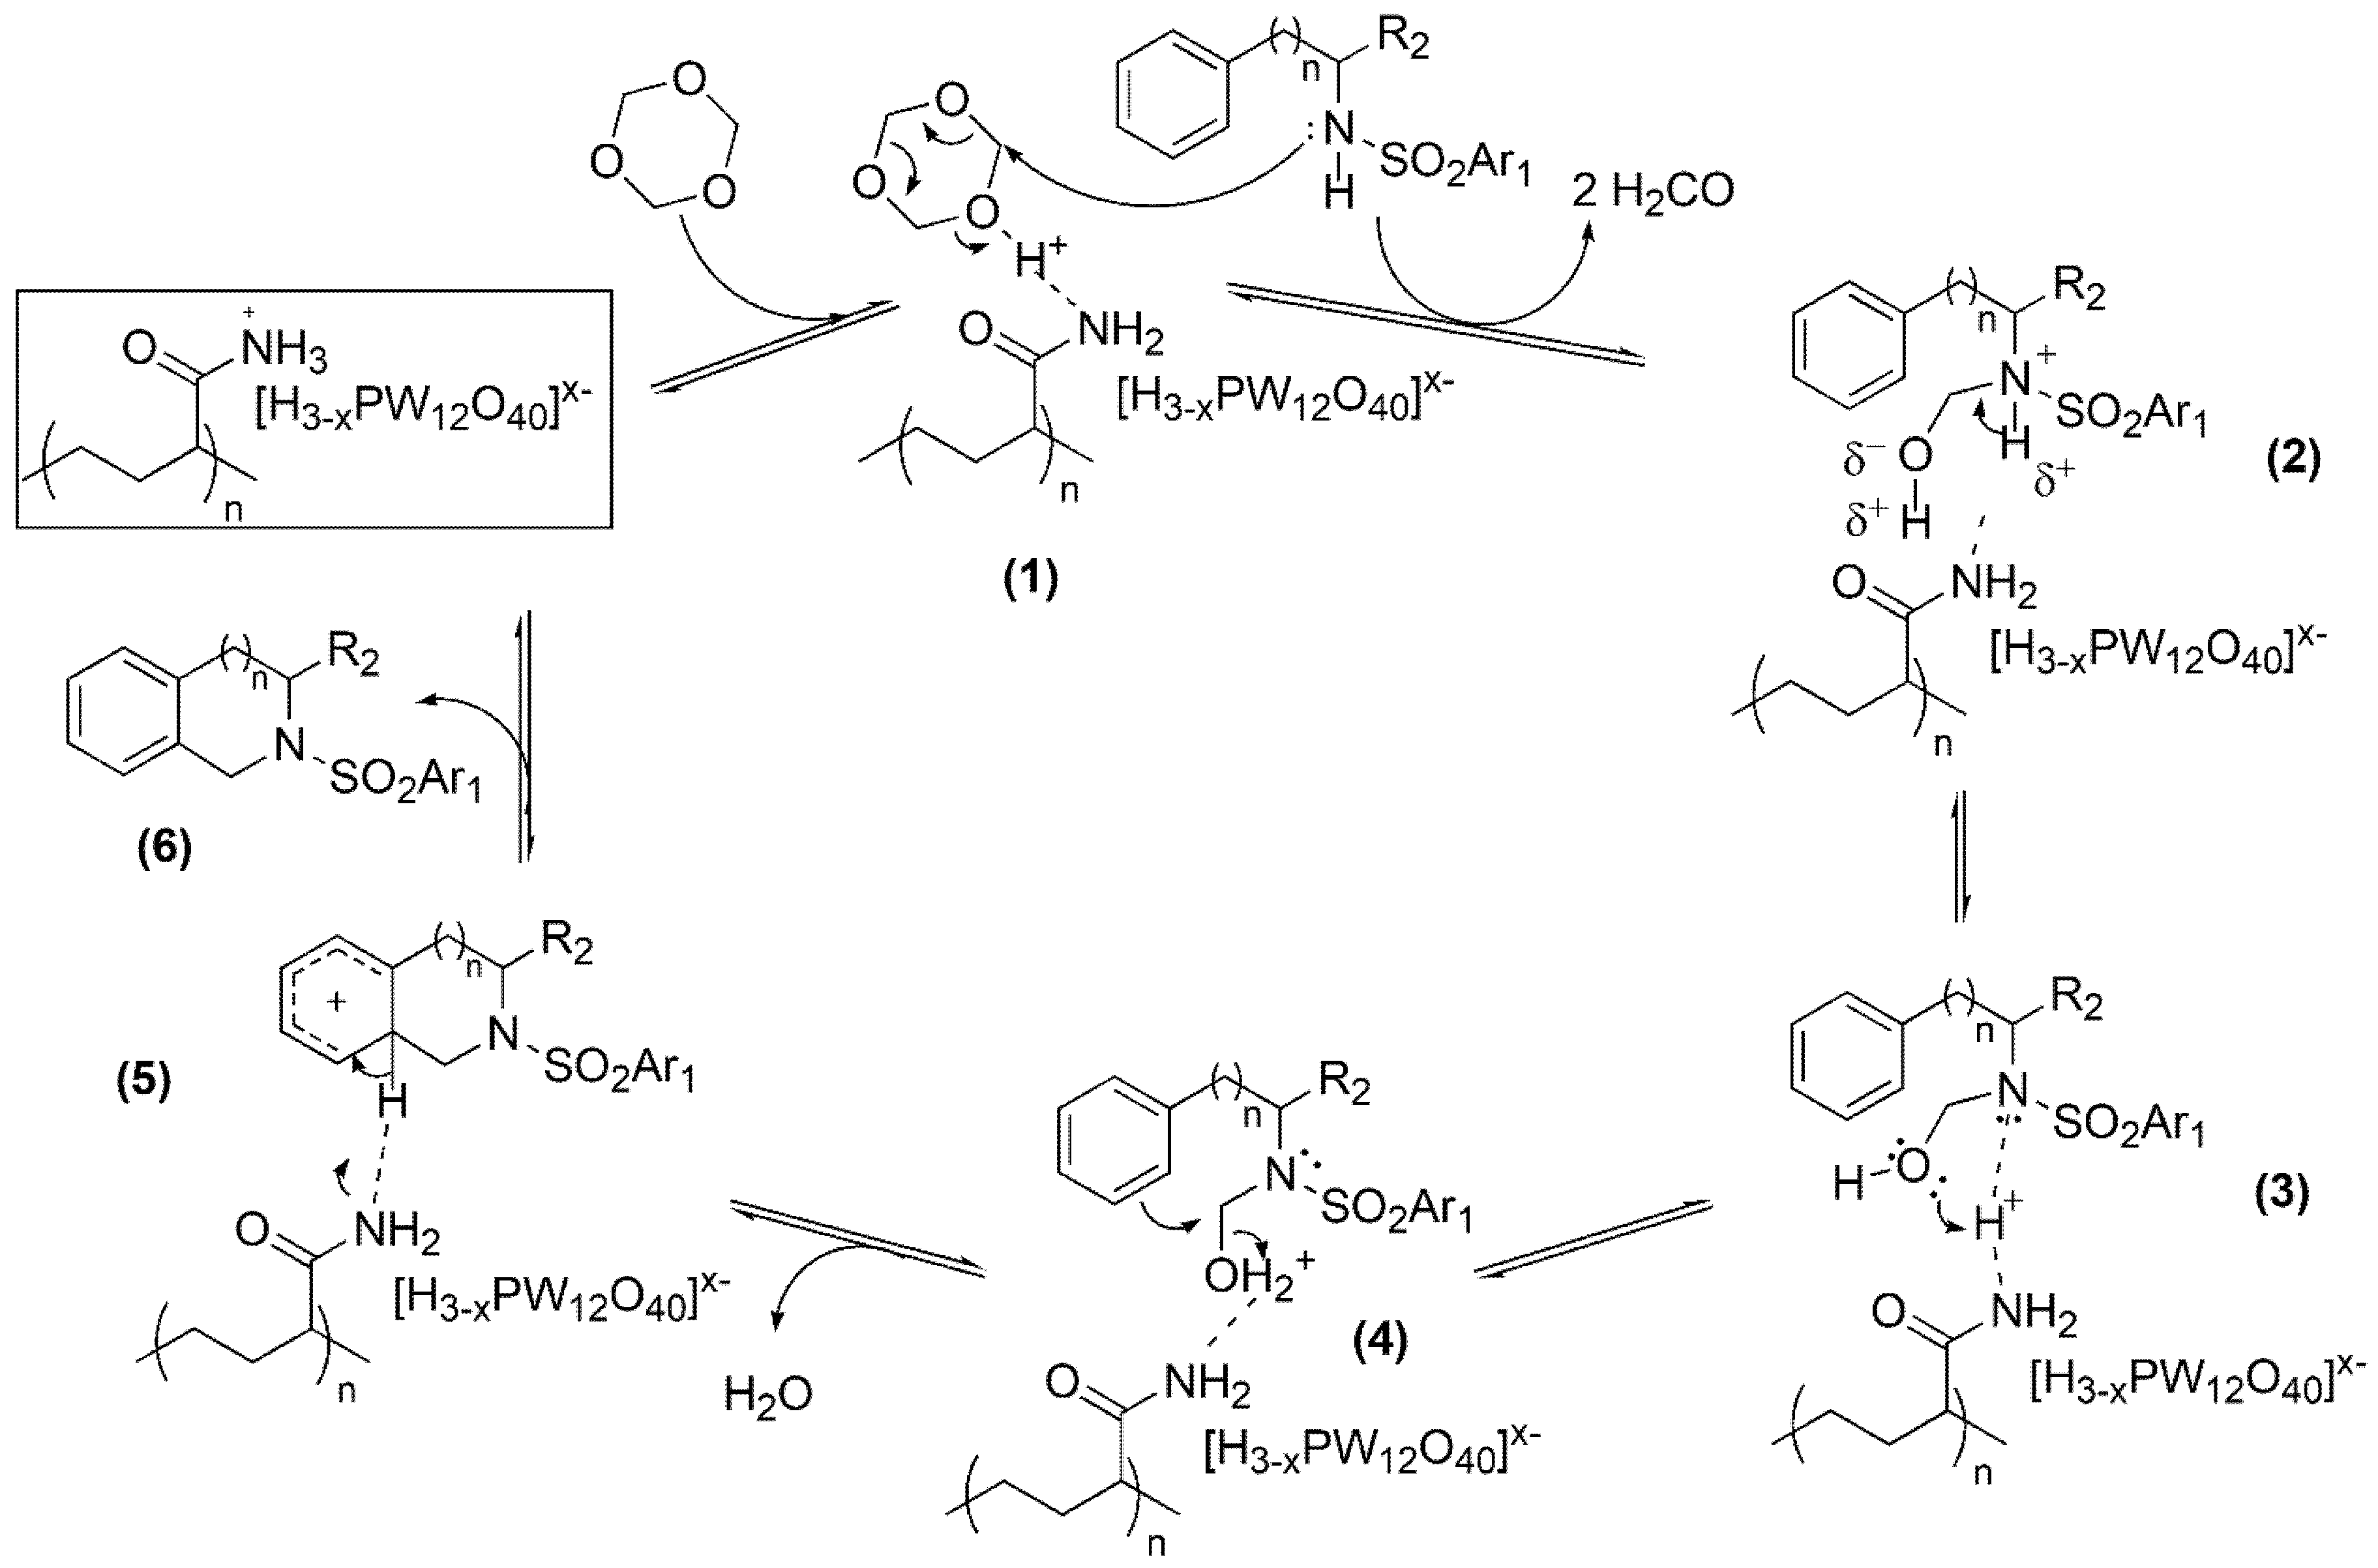
2.3. Mechanism of 2,3,4,5-Tetrahydro-1H-benzo[c]azepine and Analogous Ring Synthesis
3. Materials and Methods
3.1. Catalyst Preparation
3.2. Sample Characterization
3.3. Catalytic Test for N-(3,4-Dichlorobenzylsulfonyl)-2,3,4,5-Tetrahydro-1H-Benzo[c]azepine Synthesis
3.4. Catalyst Reuse
4. Conclusions
Supplementary Materials
Author Contributions
Funding
Data Availability Statement
Acknowledgments
Conflicts of Interest
References
- Anastas, P.T.; Heine, L.G.; Williamson, T.C. Chapters 1–6. In Green Chemical Syntheses and Processes; Anastas, P.T., Heine, L.G., Williamson, T.C., Eds.; American Chemical Society: Washington, DC, USA, 2000. [Google Scholar]
- Hazarika, P.; Gogoi, P.; Hatibaruah, S.; Konwar, D. A green synthesis of 3,4-dihydropyrimidin-2-ones and 1,5-benzodiazepines catalyzed by Sn(HPO4)2·H2O nanodisks under solvent-free condition at room temperature. Green Chem. Lett. Rev. 2011, 4, 327–339. [Google Scholar] [CrossRef]
- Suprita; Singh, R.; Suman; Susheel. Green methods for synthesis of various Heterocycles: Sustainable approach. Int. J. Chem. Stud. 2017, 5, 479–485. [Google Scholar]
- Sharma, S.; Gangal, S.; Rauf, A. Green chemistry approach to the sustainable advancement to the synthesis of heterocyclic chemistry. Rasayan J. Chem. 2008, 1, 693–717. [Google Scholar]
- Arico, F.; Reiser, O. Green synthesis of heterocycles. In Frontiers; Frontiers Media: SA, USA, 2020. [Google Scholar] [CrossRef]
- Morales, D.M.; Frenzel, R.A.; Romanelli, G.P.; Pizzio, L.R. Synthesis and characterization of nanoparticulate silica with organized multimodal porous structure impregnated with 12-phosphotungstic acid for its use in heterogeneous catalysis. Mol. Catal. 2020, 481, 110210. [Google Scholar] [CrossRef]
- Trombettoni, V.; Franco, A.; Sathicq, A.G.; Len, C.; Romanelli, G.P.; Vaccaro, L.; Luque, R. Efficient liquid-assisted grinding selective aqueous oxidation of sulfides using supported heteropolyacid catalysts. ChemCatChem 2019, 11, 1–10. [Google Scholar] [CrossRef]
- Escobar, A.; Blanco, M.; Martínez, J.; Cubillos, J.; Romanelli, G.; Pizzio, L. Biomass derivative valorization using nano core-shell magnetic materials based on Keggin-heteropolyacids: Levulinic acid esterification kinetic study with n-butanol. J. Nanomater. 2019, 2019, 5710708. [Google Scholar] [CrossRef]
- Patel, A. Environmentally Benign Catalysts for Clean Organic Reactions; Springer: Berlin/Heidelberg, Germany, 2013. [Google Scholar]
- Monopoli, V.D.; Pizzio, L.R.; Blanco, M.N. Polyvinyl alcohol–polyethylenglycol blends with tungstophosphoric acid addition: Synthesis and characterization. Mater. Chem. Phys. 2008, 108, 331–336. [Google Scholar] [CrossRef]
- Fuchs, V.M.; Pizzio, L.R.; Blanco, M.N. Synthesis and characterization of aluminum or copper tungstophosphate and tungstosilicate immobilized in a polymeric blend. Eur. Polym. J. 2008, 44, 801–807. [Google Scholar] [CrossRef]
- Frenzel, R.; Morales, D.; Romanelli, G.; Sathicq, G.; Blanco, M.; Pizzio, L. Synthesis, characterization and catalytic evaluation of H3PW12O40 included in acrylic acid/acrylamide polymer for the selective oxidation of sulfides. J. Mol. Catal. A Chem. 2016, 420, 124–133. [Google Scholar] [CrossRef]
- Fuchs, V.M.; Pizzio, L.R.; Blanco, M.N. Hybrid materials based on aluminum tungstophosphate or tungstosilicate as catalysts in anisole acylation. Catal. Today 2008, 133–135, 181–186. [Google Scholar] [CrossRef]
- Frenzel, R.A.; Romanelli, G.P.; Pizzio, L.R. Novel catalyst based on mono- and di-vanadium substituted Keggin polyoxometalate incorporated in poly(acrylic acid-co-acrylamide) polymer for the oxidation of sulfides. Mol. Catal. 2018, 457, 8–16. [Google Scholar] [CrossRef]
- Frenzel, R.A.; Palermo, V.; Sathicq, A.G.; Elsharif, A.M.; Luque, R.; Pizzio, L.R.; Romanelli, G.P. A green and reusable catalytic system based on silicopolyoxotungstovanadates incorporated in a polymeric material for the selective oxidation of sulfides to sulfones. Micropor. Mesopor. Mater. 2021, 310, 110584. [Google Scholar] [CrossRef]
- Shah, J.H.; Hindupur, R.M.; Pati, H.N. Pharmacological and biological activities of benzazepines: An overview. Curr. Bioact. Compd. 2015, 11, 170–189. [Google Scholar] [CrossRef]
- Trybulski, E.J.; Benjamin, L.-E.; Earley, J.V.; Fryer, R.I.; Gilman, N.W.; Reeder, E.; Walser, A.; Davidson, A.B.; Horst, W.D.; Sepinwall, J.; et al. 2-Benzazepines. 5. Synthesis of pyrimido[5,4-d][2]benzazepines and their evaluation as anxiolytic agents. J. Med. Chem. 1983, 26, 1589–1596. [Google Scholar] [CrossRef]
- Gini, A.; Bamberger, J.; Luis-Barrera, J.; Zurro, M.; Mas-Ballesté, R.; Alemán, J.; García Mancheño, O. Synthesis of 3-benzazepines by metal-free oxidative C–H bond functionalization–ring expansion tandem reaction. Adv. Synth. Catal. 2016, 358, 4049–4056. [Google Scholar] [CrossRef]
- Damsen, H.; Niggemann, M. Calcium-catalyzed synthesis of 1,2-disubstituted 3-benzazepines. Eur. J. Org. Chem. 2015, 36, 7880–7883. [Google Scholar] [CrossRef]
- Dorgan, R.J.; Elliot, R.L. Benzazepines, and Their Use as Anthelminthics. U.S. Patent 4,661,489, 28 April 1987. [Google Scholar]
- Abe, K.; Saitoh, T.; Horiguchi, Y.; Utsunomiya, I.; Taguchi, K. Synthesis and neurotoxicity of tetrahydroisoquinoline derivatives for studying Parkinson’s disease. Biol. Pharm. Bull. 2005, 28, 1355–1362. [Google Scholar] [CrossRef]
- Chuk, M.K.; Balis, F.M.; Fox, E. Trabectedin. Oncologist 2009, 14, 794–799. [Google Scholar] [CrossRef]
- Iwasa, K.; Moriyasu, M.; Tachibana, Y.; Kim, H.S.; Wataya, Y.; Wiegrebe, W.; Bastow, K.F.; Cosentino, L.M.; Kozuka, M.; Lee, H.K. Simple isoquinoline and benzylisoquinoline alkaloids as potential antimicrobial, antimalarial, cytotoxic, and anti-HIV agents. Bioorg. Med. Chem. 2001, 9, 2871–2884. [Google Scholar] [CrossRef]
- Nandakumar, A.; Muralidharan, D.; Perumal, P.T. Synthesis of functionalized tetrahydroisoquinolines via palladium-catalyzed 6-exo-dig carbocyclization of 2-bromo-N-propargylbenzylamines. Tetrahedron Lett. 2011, 52, 1644–1648. [Google Scholar] [CrossRef]
- So, M.; Kotake, T.; Matsuura, K.; Inui, M.; Kamimura, A. Concise synthesis of 2-benzazepine derivatives and their biological activity. J. Org. Chem. 2012, 77, 4017–4028. [Google Scholar] [CrossRef] [PubMed]
- Elangovan, S.; Afanasenko, A.; Haupenthal, J.; Sun, Z.; Liu, Y.; Hirsch, A.K.H.; Barta, K. From wood to tetrahydro-2-benzazepines in three waste-free steps: Modular synthesis of biologically active lignin-derived scaffolds. ACS Cent. Sci. 2019, 5, 1707–1716. [Google Scholar] [CrossRef] [PubMed]
- Szatmári, I.; Fülöp, F. Solvent-free synthesis of 1-(hydroxyquinolyl)- and 1-(hydroxyisoquinolyl)-1,2,3,4-tetrahydroisoquinolines by modified Mannich reaction. Synthesis 2011, 5, 745–748. [Google Scholar] [CrossRef]
- Ruchirawat, S.; Tontoolarug, S.; Sahakitpichan, P. Synthesis of 4-aryltetrahydroiso-quinolines: Application to the synthesis of cherulline. Heterocycles 2001, 55, 635–640. [Google Scholar] [CrossRef]
- Venugopal, S.; Ramanatham, J.; Devanna, N.; Sanjeev Kumar, A.; Ghosh, S.; Soundararajan, R.; Kale, B.; Mehta, G.N. New strategy for the synthesis of (±) cherylline dimethyl ether. Asian J. Chem. 2010, 22, 1835–1840. [Google Scholar]
- Orazi, O.O.; Corral, R.A.; Giaccio, H. Synthesis of fused heterocycles: 1,2,3,4-tetrahydroisoquinolines and ring homologues via sulphonamidomethylation. J. Chem. Soc. Perkin Trans. I 1986, 1977–1982. [Google Scholar] [CrossRef]
- Pasquale, G.; Ruiz, D.; Autino, J.; Baronetti, G.; Thomas, H.; Romanelli, G. Efficient and suitable preparation of N-sulfonyl-1,2,3,4-tetrahydroisoquinolines and ring analogues using recyclable H6P2W18O62·24H2O/SiO2 catalyst. C. R. Chim. 2012, 15, 758–763. [Google Scholar] [CrossRef]
- Romanelli, G.P.; Ruiz, D.M.; Autino, J.C.; Giaccio, H.E. A suitable preparation of N-sulfonyl-1,2,3,4-tetrahydroisoquinolines and their ring homologs with a reusable Preyssler heteropolyacid as catalyst. Mol. Divers. 2010, 14, 803–807. [Google Scholar] [CrossRef] [PubMed]
- Pizzio, L.R.; Vázquez, P.; Kikot, A.; Basaldella, E.; Cáceres, C.; Blanco, M.N. Functionalized SiMCM-41 as support for heteropolyacid based catalysts. Stud. Surf. Sci. Catal. 2002, 143, 739–746. [Google Scholar]
- Hasik, M.; Turek, W.; Stochmal, E.; Lapkowski, L.; Pron, A. Conjugated polymer-supported catalysts-polyaniline protonated with 12-tungstophosphoric acid. J. Catal. 1994, 147, 544–551. [Google Scholar] [CrossRef]
- Morales, M.D.; Infantes-Molina, A.; Lázaro-Martínez, J.M.; Romanelli, G.P.; Pizzio, L.R.; Rodríguez-Castellón, E. Heterogeneous acid catalysts prepared by immobilization of H3PW12O40 on silica through impregnation and inclusion, applied to the synthesis of 3H-1,5-benzodiazepines. Mol. Catal. 2020, 485, 110842. [Google Scholar] [CrossRef]
- Okuhara, T.; Nishimura, T.; Watanabe, H.; Na, K.; Misono, M. Acid-Base Catalysis II; Kodansha: Tokyo, Japan; Elsevier: Amsterdam, The Netherlands, 1994. [Google Scholar]
- Massart, R.; Contant, R.; Fruchart, J.; Ciabrini, J.; Fournier, M. 31P NMR studies on molybdic and tungstic heteropolyanions. Correlation between structure and chemical shift. Inorg. Chem. 1977, 16, 2916–2921. [Google Scholar] [CrossRef]
- Pizzio, L.R.; Cáceres, C.V.; Blanco, M.N. Acid catalysts prepared by impregnation of tungstophosphoric acid solutions on different supports. Appl. Catal. A Gen. 1998, 167, 283–294. [Google Scholar] [CrossRef]
- Fuchs, V.M.; Soto, E.L.; Blanco, M.N.; Pizzio, L.R. Direct modification with tungstophosphoric acid of mesoporous titania synthesized by urea-templated sol–gel reactions. J. Colloid Interface Sci. 2008, 327, 403–411. [Google Scholar] [CrossRef] [PubMed]
- Silva, M.E.S.R.e.; Dutra, E.R.; Mano, V.; Machado, J.C. Preparation and thermal study of polymers derived from acrylamide. Polym. Degrad. Stab. 2000, 67, 491–495. [Google Scholar] [CrossRef]
- Grassie, N.; McNeill, I.C.; Samson, J.N.R. The thermal degradation of polymethacrylamide and copolymers of methacrylamide and methyl methacrylate. Eur. Polym. J. 1978, 14, 931–937. [Google Scholar] [CrossRef]
- Gorsd, M.; Pizzio, L.; Blanco, M. Trifluoromethanesulfonic acid immobilized on zirconium oxide obtained by the sol-gel method as catalyst in paraben synthesis. Appl. Catal. A Gen. 2011, 400, 91–98. [Google Scholar] [CrossRef]
- Pizzio, L.R.; Cáceres, C.V.; Blanco, M.N. Tungstophosphoric acid immobilized in polyvinyl alcohol hydrogel beads as heterogeneous catalyst. Stud. Surf. Sci. Catal. 2002, 143, 731–738. [Google Scholar]
- Pizzio, L.R.; Blanco, M.N. Isoamyl acetate production catalyzed by H3PW12O40 on their partially substituted Cs or K salts. Appl. Catal. A Gen. 2003, 255, 265–277. [Google Scholar] [CrossRef]
- Trost, B. The Atom Economy−A Search for Synthetic Efficiency. Science 1991, 254, 1471–1477. [Google Scholar] [CrossRef]
- Anastas, P.T.; Warner, J.C. Green Chemistry: Theory and Practice; Oxford University Press: New York, NY, USA, 1998. [Google Scholar]
- Andraos, J. Unification of reaction metrics for Green Chemistry: Applications to reaction analysis. Org. Process. Res. Dev. 2005, 9, 149–163. [Google Scholar] [CrossRef]
- Andraos, J. Useful tools for the next quarter century of Green Chemistry practice: A dictionary of terms and a data set of parameters for high value industrial commodity chemicals. ACS Sustain. Chem. Eng. 2018, 6, 3206–3214. [Google Scholar] [CrossRef]
- Andraos, J. The Algebra of Organic Synthesis; CRC Press: Boca Raton, FL, USA, 2019. [Google Scholar]
- Kano, S.; Yuasa, Y.; Shibuya, S. Formation of alcohols from alkenes by reaction with SnCl4–NaBH4. J. Chem. Soc. Chem. Commun. 1979, 18, 796–797. [Google Scholar] [CrossRef]


| Entry | Catalyst | Ei (mV) | Ns a | Yields (%) b |
|---|---|---|---|---|
| 1 | None | - | - | - |
| 2 | PLM | 44 | - | - |
| 3 | PLMTPA20/80100 | 194 | 84 | 48 |
| 4 | PLMTPA40/60100 | 182 | 146 | 62 |
| 5 | PLMTPA60/40100 | 191 | 201 | 83 |
| 6 | PLMTPA60/40200 | 180 | 158 | 62 |
| 7 | PLMTPA60/40300 | 90 | 77 | 9 |
| Entry | Solvent | Yields (%) a |
|---|---|---|
| 1 | Toluene | 83 |
| 2 | Benzene | 80 |
| 3 | Chloroform | 68 |
| 4 | Dichlorometane b | 52 |
| 5 | Hexane b | 35 c |
| Entry | Temperature (°C) | Yields (%) a |
|---|---|---|
| 1 | 25 | - |
| 2 | 50 | 39 |
| 3 | 70 | 83 |
| 4 | 90 | 69 |
| 5 | 110 | 51 |
| Entry | Time (h) | Yields (%) a |
|---|---|---|
| 1 | 0.5 | 17 |
| 2 | 1 | 38 |
| 3 | 2 | 77 |
| 4 | 3 | 83 |
| 5 | 4 | 82 |
| 6 | 6 | 80 |
| Entry | Catalyst Amount (%) | Yields (%) a |
|---|---|---|
| 1 | 0.5 | 69 |
| 2 | 1 | 83 |
| 3 | 1.5 | 83 |
| 4 | 2 | 82 |
| Entry | Cycle | Yields (%) a |
|---|---|---|
| 1 | 1 | 83 |
| 2 | 2 | 81 |
| 3 | 3 | 83 |
| 4 | 4 | 82 |
| 5 | 5 | 77 |
| 6 | 6 | 79 |
| Entry | Substrate | Cycle Size | Product | Yields (%) a |
|---|---|---|---|---|
| 1 |  | 6 |  | 88 |
| 2 |  | 7 |  | 83 |
| 3 |  | 6 |  | 20 |
| 4 |  | 7 |  | - |
| 5 |  | 7 |  | 80 |
| 6 |  | 6 |  | 55 |
| 7 |  | 6 |  | 88 |
| Entry | Catalyst | Yields (%) | Reference |
|---|---|---|---|
| 1 | Methanesulphonic acid/ trifluoroacetic acid | 68 | [30] |
| 2 | Methanesulphonic acid/ acetic anhydride | 70 | [30] |
| 3 | H6P2W18O62/SiO2 | 84 | [31] |
| 4 | H14[NaP5W30O110]/SiO2 | 81 | [32] |
| 5 | PLMTPA60/40100 | 83 | This work |
Publisher’s Note: MDPI stays neutral with regard to jurisdictional claims in published maps and institutional affiliations. |
© 2022 by the authors. Licensee MDPI, Basel, Switzerland. This article is an open access article distributed under the terms and conditions of the Creative Commons Attribution (CC BY) license (https://creativecommons.org/licenses/by/4.0/).
Share and Cite
Aguilera Palacios, E.X.; Palermo, V.; Sathicq, A.G.; Pizzio, L.R.; Romanelli, G.P. A New Series of Tungstophosphoric Acid-Polymeric Matrix Catalysts: Application in the Green Synthesis of 2-Benzazepines and Analogous Rings. Catalysts 2022, 12, 1155. https://doi.org/10.3390/catal12101155
Aguilera Palacios EX, Palermo V, Sathicq AG, Pizzio LR, Romanelli GP. A New Series of Tungstophosphoric Acid-Polymeric Matrix Catalysts: Application in the Green Synthesis of 2-Benzazepines and Analogous Rings. Catalysts. 2022; 12(10):1155. https://doi.org/10.3390/catal12101155
Chicago/Turabian StyleAguilera Palacios, Edna X., Valeria Palermo, Angel G. Sathicq, Luis R. Pizzio, and Gustavo P. Romanelli. 2022. "A New Series of Tungstophosphoric Acid-Polymeric Matrix Catalysts: Application in the Green Synthesis of 2-Benzazepines and Analogous Rings" Catalysts 12, no. 10: 1155. https://doi.org/10.3390/catal12101155
APA StyleAguilera Palacios, E. X., Palermo, V., Sathicq, A. G., Pizzio, L. R., & Romanelli, G. P. (2022). A New Series of Tungstophosphoric Acid-Polymeric Matrix Catalysts: Application in the Green Synthesis of 2-Benzazepines and Analogous Rings. Catalysts, 12(10), 1155. https://doi.org/10.3390/catal12101155