1. Introduction
In recent decades, semiconductor-assisted photocatalysis has received significant attention because of its many advantages, such as its lack of pollution, environmental friendliness, cost-effectiveness, ease of operation, etc. [
1,
2]. In previous decades, TiO
2 and ZnO semiconductor oxides have been mostly used for the degradation of organic compounds. However, the main drawback of these semiconductor materials is their restricted photocatalytic activity under visible light illumination, even as they exhibit good photocatalytic activity under ultraviolet light illumination [
3,
4]. In this regard, the development of novel, catalytically active, highly visible-light responsive photocatalytic materials is essential.
Barium tungstate (BaWO
4) comes from the group of alkaline earth tungstates. It has good properties such as good electrical conductivity and photoluminescence properties. It is used in different mechanical applications such as light-emitting diodes, solid-state lasers, photocatalysts, etc. [
5]. Due to its strong catalytic activity under ultraviolet illumination it can be used as a photocatalyst for the degradation of organic compounds. However, it has some major issues, these include its fast recombination of photogenerated charge carriers and its ability to be activated only under ultraviolet light illumination [
6]. Therefore, in order to utilize the whole solar spectrum, it is combined with visible-light activated photocatalyst materials. Different strategies have been used to improve its photocatalytic performance, such as making composites, doping, sensitization, adding cocatalysts, etc. Of these different strategies, making a composite of two different semiconductor materials has a different bandgap energy [
7]. Transition metal dichalcogenides (TMDs) are given more consideration because of their good properties such as good carrier mobility, photoelectrochemical stability, ultrafast nonlinear response, etc. [
8]. Therefore, TMDs can be used in numerous applications such as water splitting, photocatalysis, gas sensor, supercapacitor, etc. [
9]. Among the TMDs MoS
2 is widely used in many catalytic applications. It is highly activated under visible light illumination and hence has been used for making composites in order to enhance the light absorption capacity and improve the catalytic performance of the composite. Also, it can be used as a co-catalyst material and consists of a layered structure of S-Mo-S [
10]. Nivetha et al. prepared BaWO
4/MoS
2 nanocomposites by the co-precipitation method and studied the photodegradation of RhB dye and antibacterial activity [
6]. Sahmi et al. synthesized BaWO
4 by a co-precipitation method and performed electro-photocatalysis degradation of ibuprofen solution (20 ppm) under UV light illumination [
11]. Khan et al. prepared BaWO
4 by hydrothermal method and studied photocatalytic degradation of crystal violet dye and electrochemical detection of ascorbic acid & glucose [
12]. To the best of our knowledge, no reports are available on the photocatalytic degradation of Eriochrome black-T using BaWO
4/MoS
2 composite.
In this work, BaWO
4/MoS
2 composite was prepared by the co-precipitation method. Prepared BaWO
4 and BaWO
4/MoS
2 composite photocatalysts were used to study the photocatalytic degradation of Eriochrome black-T (EBT) dye. The formation of the BaWO
4/MoS
2 composite was confirmed by XRD, XPS, and Raman spectroscopy techniques. EBT falls under the category of the azo group i.e., nitrogen-nitrogen double bond [
13]. It is also used in the textile, paper printing, leather, paint and cosmetics, and carpet manufacturing industries. Major exposure to EBT causes major health issues in workers who work in the carpet and textile industry [
14]. Therefore, it is essential to remove the EBT. Furthermore, the mineralization of EBT was studied using the chemical oxygen demand (COD) study.
2. Results and Discussion
Crystal structure and phase confirmation of the prepared BaWO
4 and BaWO
4/MoS
2 composite photocatalysts were investigated with the help of the X-ray diffraction technique.
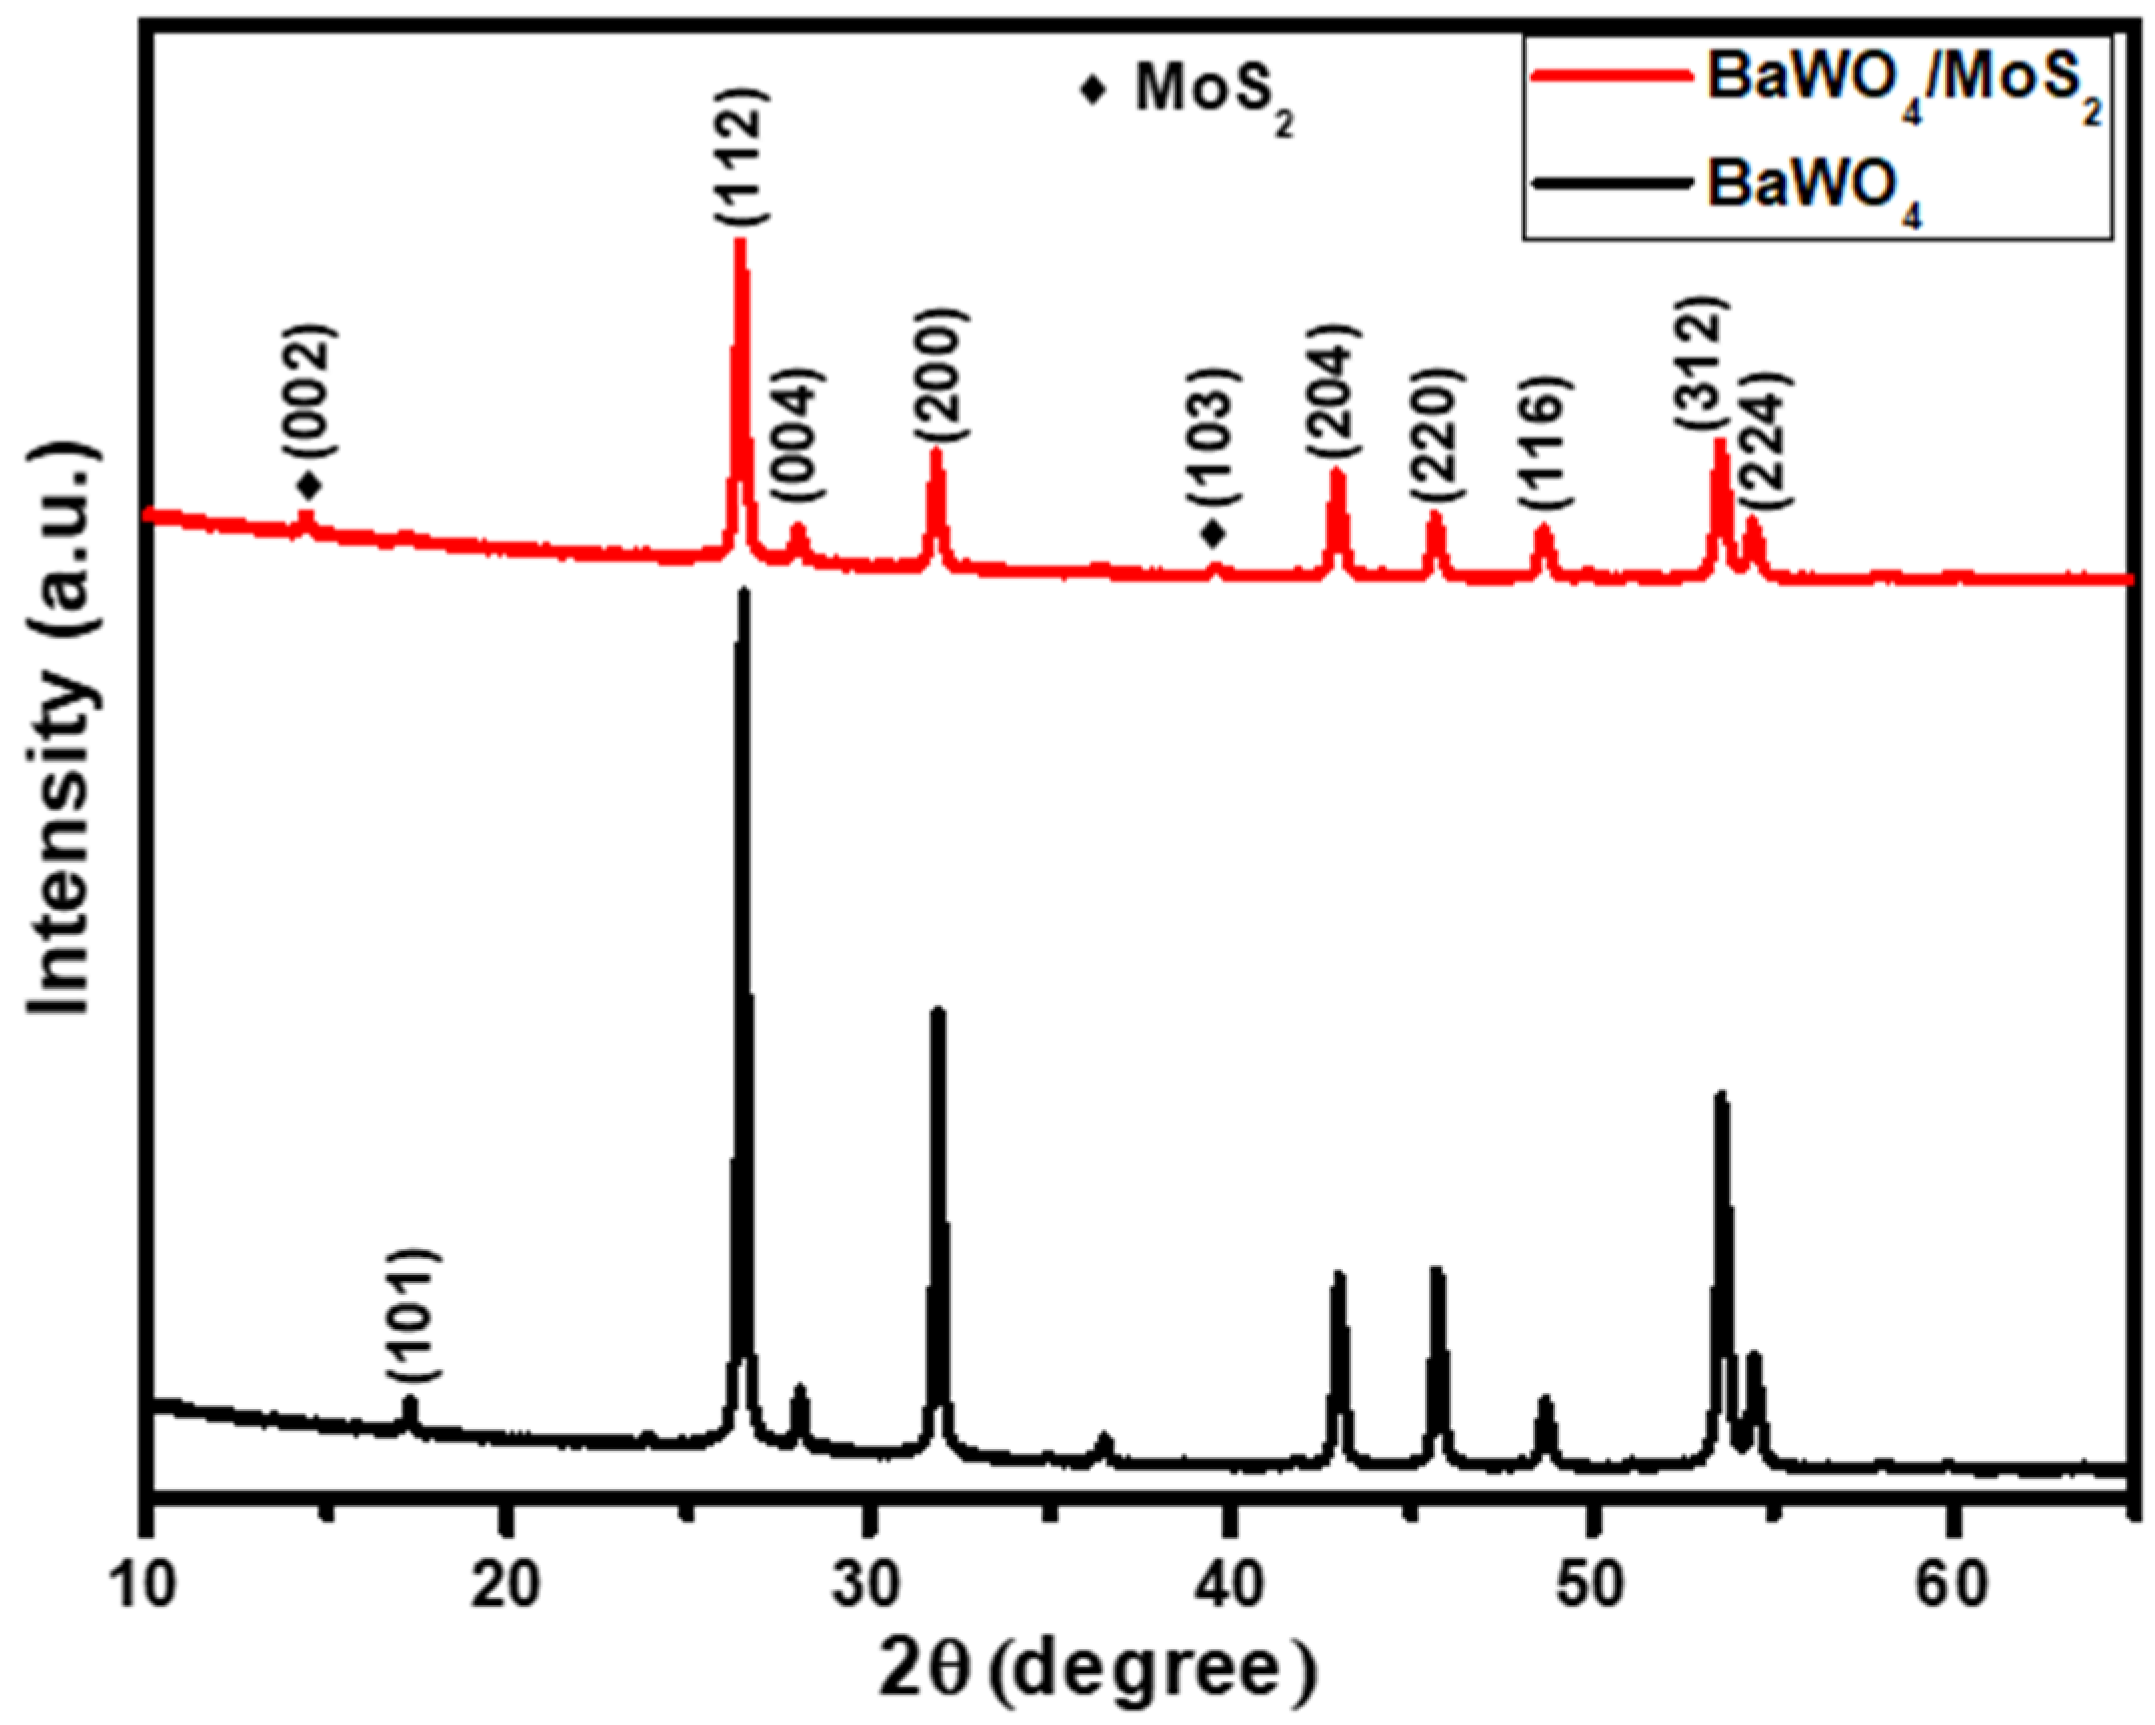
Figure 1 displays the XRD patterns of the prepared catalyst materials. The main diffraction peaks of BaWO
4 situated at 2θ = 17.31, 26.49, 28.16, and 31.95° correspond to diffraction planes (101), (112), (204), and (004), respectively. The matching of observed and standard d values using the PDF card number 85-0588 confirms the tetragonal structure of BaWO
4 [
6,
12]. While in the case of the BaWO
4/MoS
2 composite, the peak positions of BaWO
4 remain in the same position while peaks are found at 2θ = 14.40 and 39.57° which are associated with the (002) and (103) planes of MoS
2, respectively. MoS
2 peaks are denoted by the symbol “♦”. The matching of standard and observed d using the powder diffraction file number 77–1716 confirms the hexagonal crystal structure of MoS
2 [
1,
15]. No other impurity peaks were found in the BaWO
4/MoS
2 composite. Overall XRD analysis suggests the formation of BaWO
4/MoS
2 composite.
Raman analyses were performed to understand the types of bonding, symmetry, and modes of vibrations in the BaWO
4/MoS
2 composite [
16].
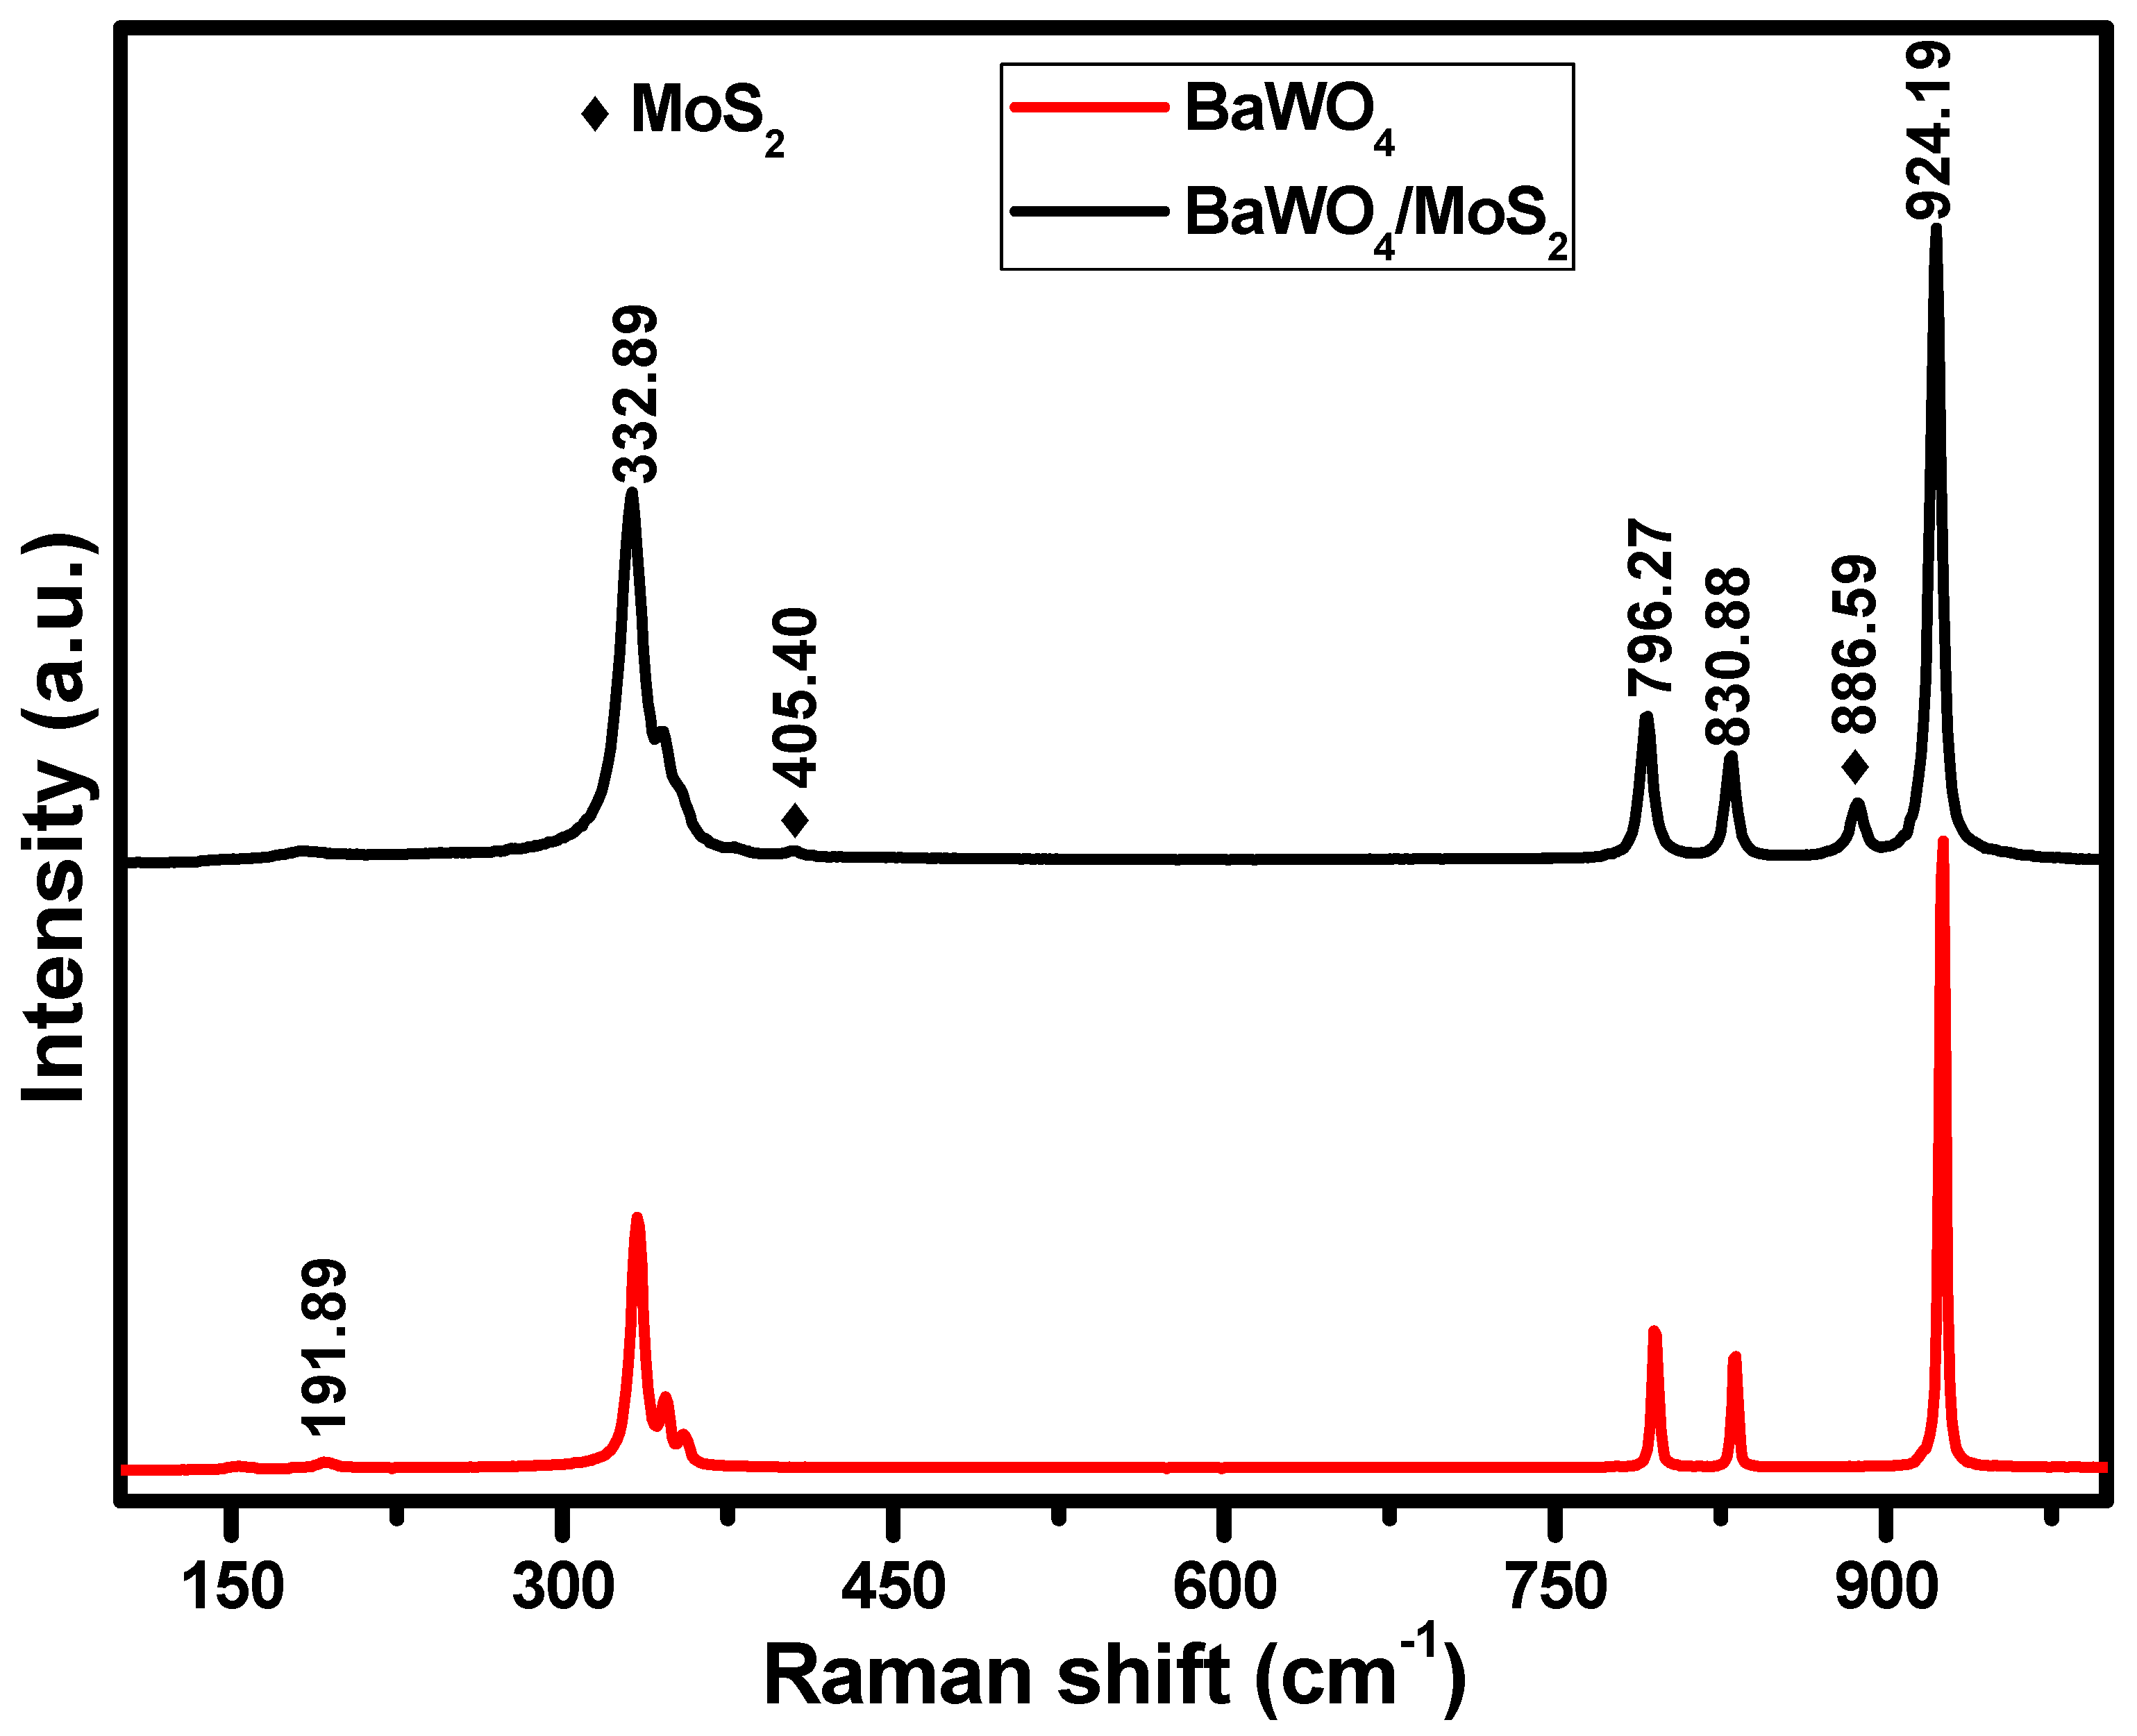
Figure 2 displays Raman spectra of BaWO
4, and BaWO
4/MoS
2 composites. Raman spectra were recorded in the range of 100–1000 cm
−1. BaWO
4 shows major peaks at 191.89, 332.39, 347.89, 795.65, 832.88 and 926.26 cm
−1. A peak at 191.89 cm
−1 (Eg) corresponds to the rotational modes of the Ba-O bond. The peak at 926.26 cm
−1 (Ag) is associated with the symmetric stretching vibration of the W-O bond [
17]. In the case of the composite, some extra peaks are observed at 405.40 and 886.59 cm
−1. The peak at 405.40 cm
−1 corresponds to A1g of pure MoS
2, which is associated with the out-of-plane vibration of the S atoms in opposite directions with respect to the Mo atom [
18]. The peak observed at 886.59 cm
−1, which arises due to the oxidation of MoS
2 by laser irradiation, leads to the formation of MoO
3 which presents the vibrational energy of MoO
3 [
19].
XPS study is important to understand the oxidation states and chemical compositions of the prepared materials [
20].
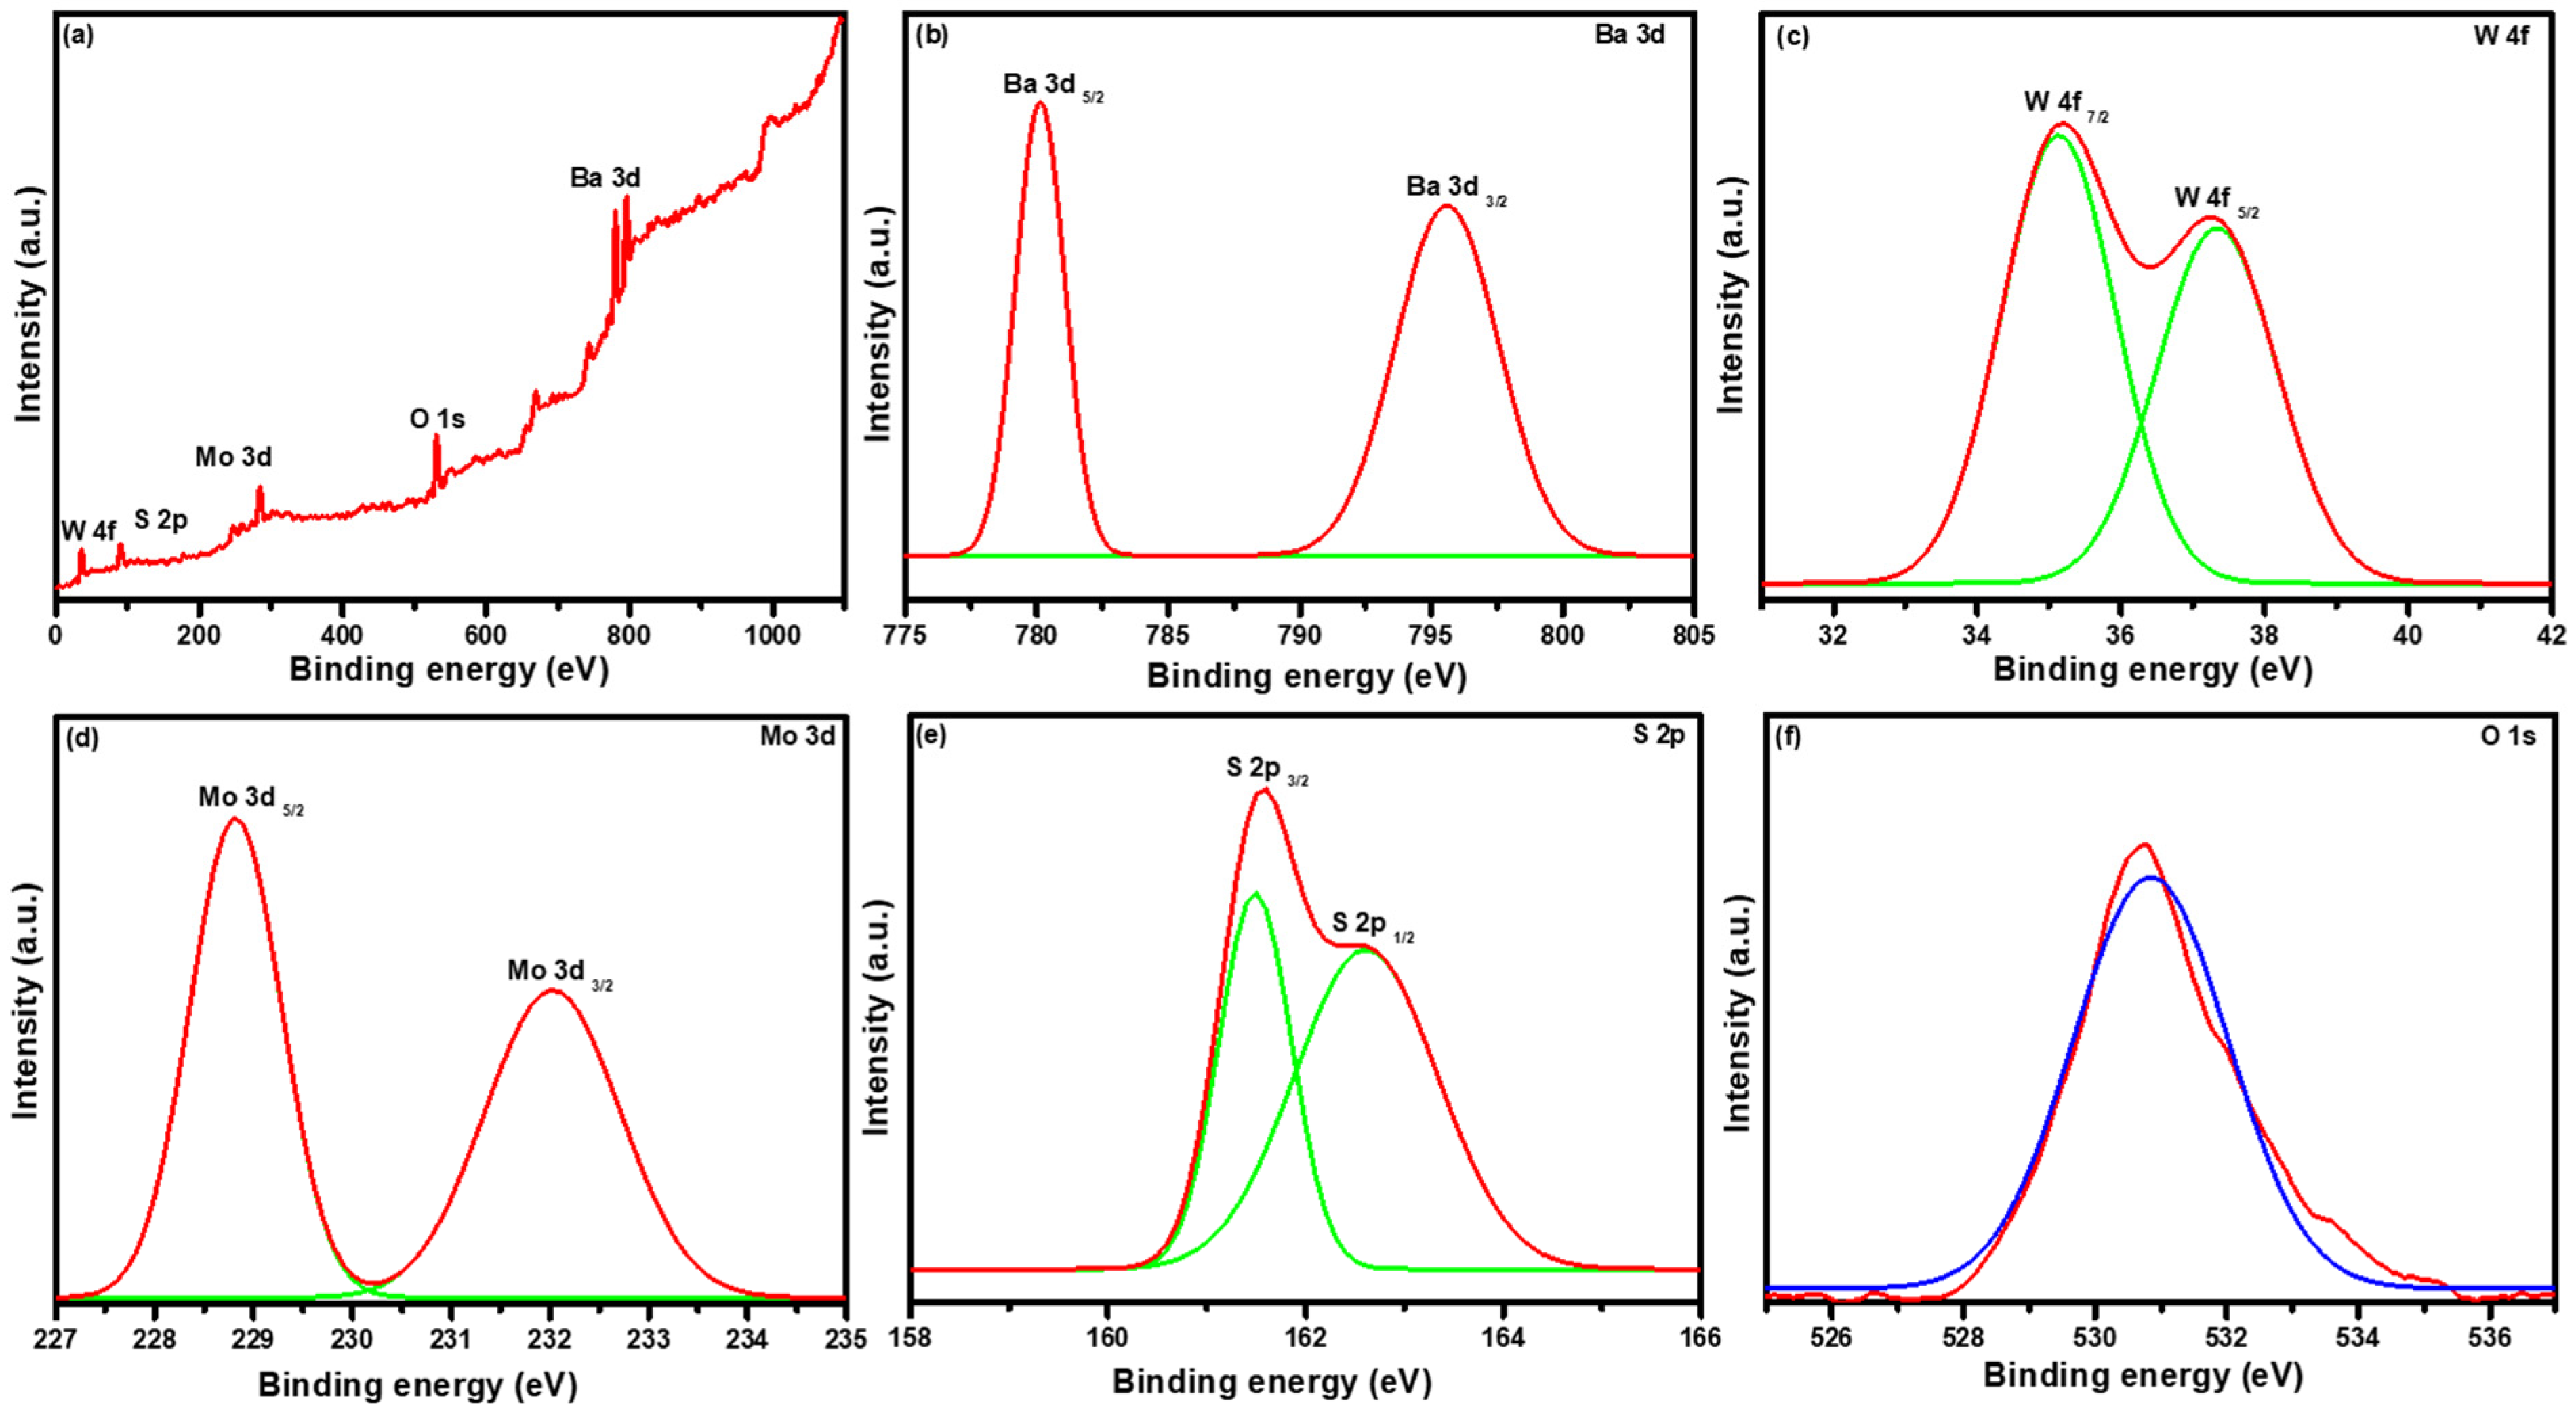
Figure 3a presents the survey scan spectrum of the BaWO
4/MoS
2 composite. It shows the presence of Ba, W, Mo, S, and O element peaks without any impurity.
Figure 3b presents the Ba 3d spectrum which divides into two major peaks, Ba 3d5/2 and Ba 3d3/2, with corresponding binding energy 780.09 and 795.55 eV respectively. The binding energy difference between these two major peaks is 15.46 eV; a binding energy difference that well matched with the work of AlShehri et al. [
21].
Figure 3c shows the W 4f spectrum. The W 4f spectrum, due to spin-orbit coupling, split into two main peaks, which had binding energies of 35.18 and 37.35 eV, corresponding to W 4f7/2 and W 4f5/2 respectively. This suggests that W exists in the +6 oxidation state [
22]. The high-resolution Mo 3d spectrum, which splits into Mo 3d5/2 and Mo 3d3/2, corresponds to binding energy 228.25 and 232.09 eV, respectively, and is shown in
Figure 3d. Sulfur is found in the S 2p state, which has two major peaks which have binding energies of 161.58 eV (S 2p3/2) and 162.63 eV (S 2p1/2) presented in
Figure 3e [
23]. In the case of the O 1s spectrum, one major peak was found at 530.70 eV which corresponds to the bonding between the metal and oxygen (
Figure 3f) [
24]. After the confirmation of the prepared materials, the morphological study was conducted.
Figure S1a–d presents the SEM micrographs of the BaWO
4/MoS
2 composite. From the SEM images, it is observed that BaWO
4 particles are covered with MoS
2 flakes. Furthermore, irregularly shaped BaWO
4 particles are clearly seen.
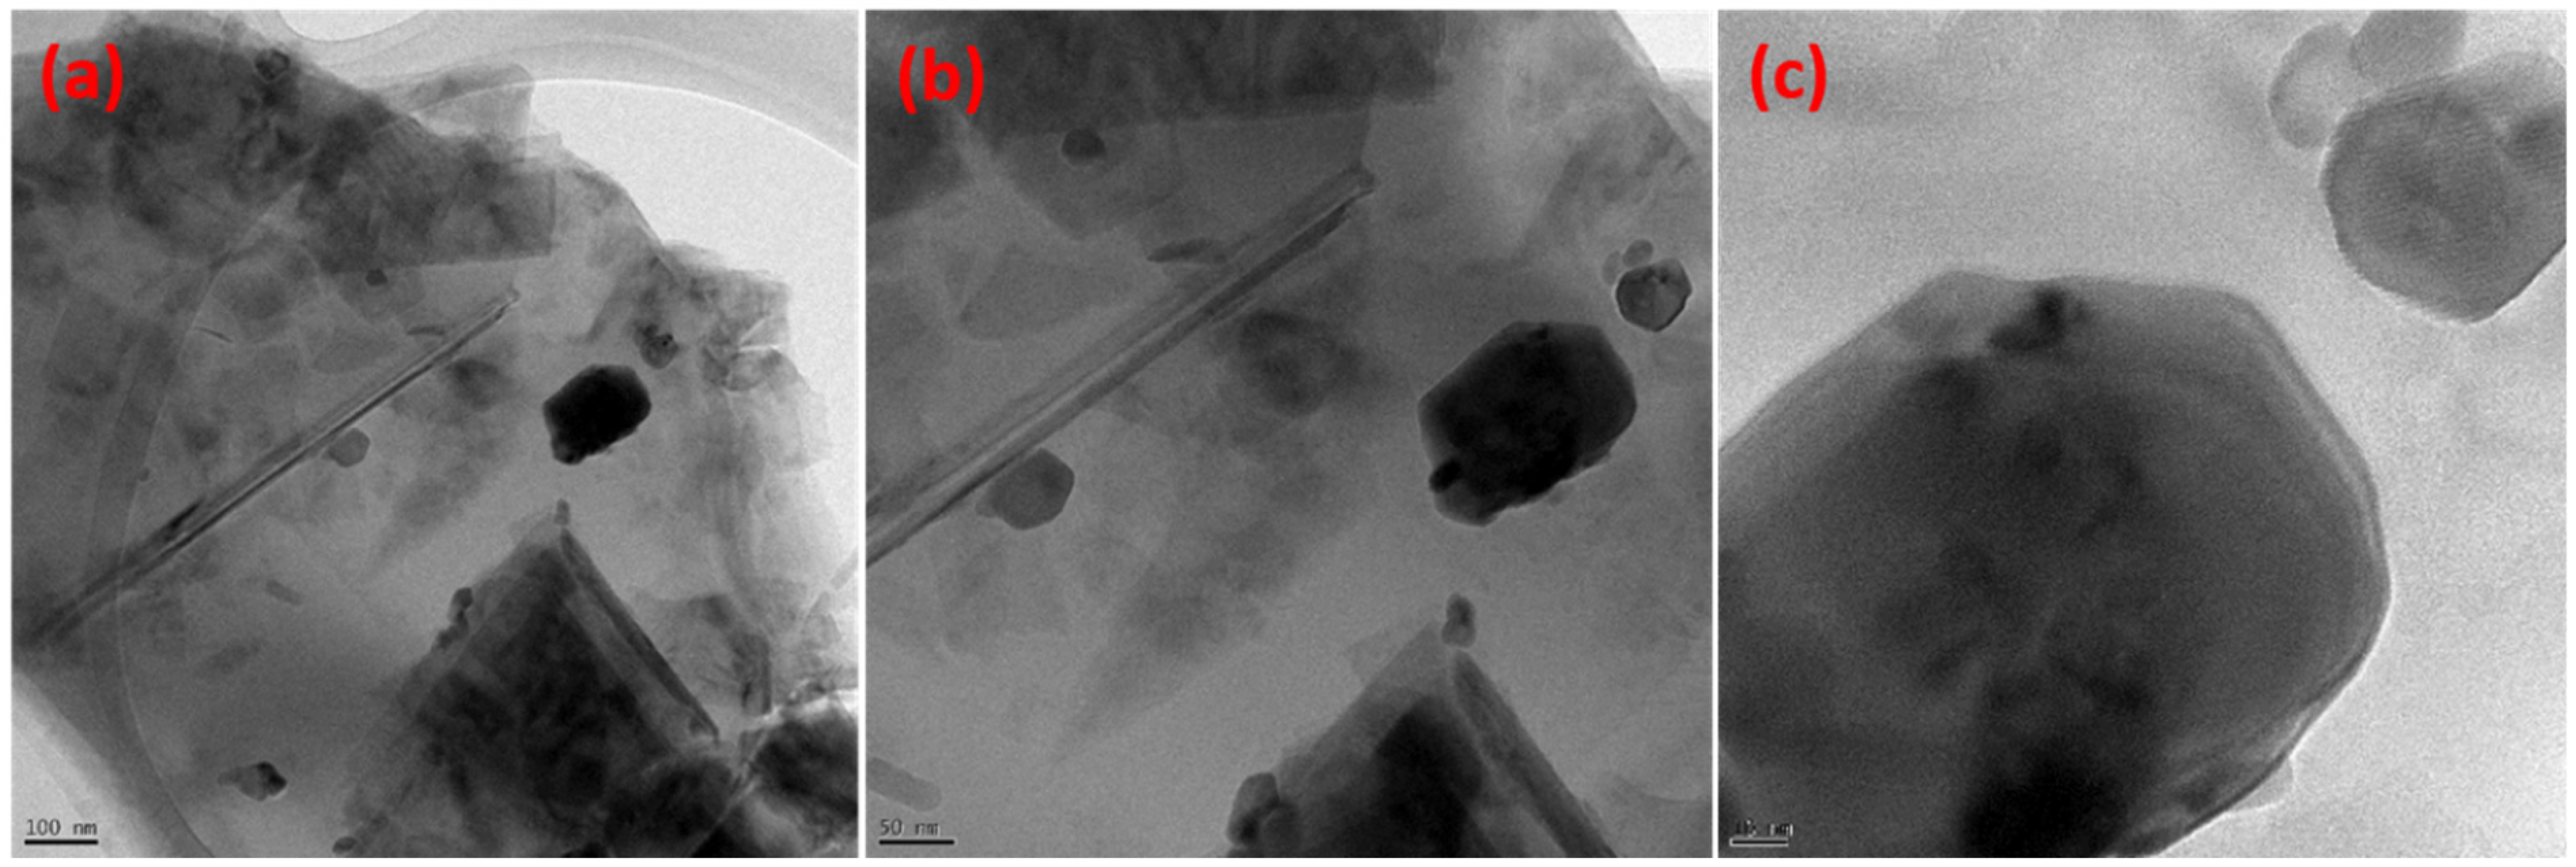
Figure 4a–c shows the TEM images of BaWO
4/MoS
2 composite at different magnifications. TEM results also confirm the flakes shaped MoS
2 and BaWO
4 particles of different sizes and shapes.
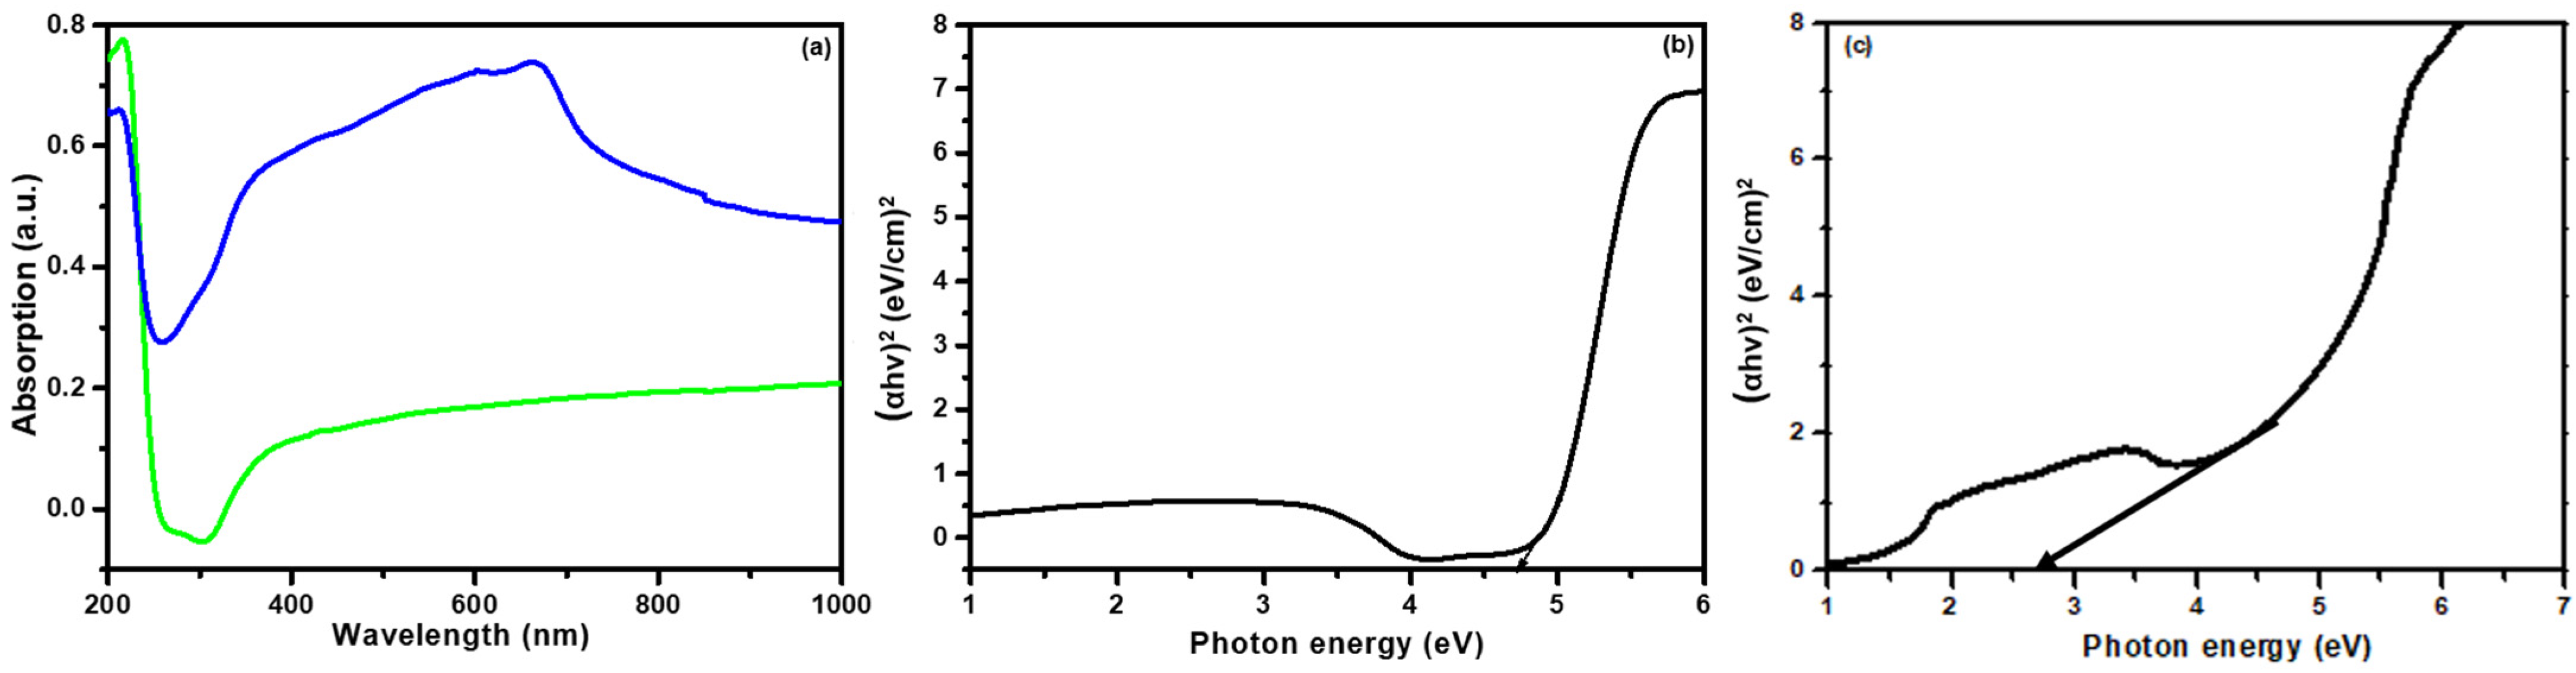
To understand the optical properties of the prepared photocatalyst material, a UV-Vis spectroscopy study was conducted, and the results are shown in
Figure 5.
Figure 5a presents the UV-Vis absorption spectra of BaWO
4 and BaWO
4/MoS
2 composite. BaWO
4 has a strong absorption edge in the ultraviolet light region [
25]. It has an absorption edge at 300 nm. The BaWO
4/MoS
2 composite has good absorption in the visible and ultraviolet regions. The BaWO
4/MoS
2 composite has an absorption edge at 850 nm. The enhanced absorption edge of BaWO
4 in the visible region is due to the electronic interactions between the BaWO
4 and MoS
2 grains through the physical contact involved in making the composite [
26]. From the absorption measurements, bandgap energy was determined by plotting the graph of (αhν)
2 versus hν by extrapolating a straight line from the onset of photon energy to α = 0 for different samples [
27].
Figure 5b,c shows the bandgap plots of the BaWO
4 and BaWO
4/MoS
2 composite. From the bandgap plot, we see a value of 4.65 eV for the BaWO
4 photocatalyst, while for the BaWO
4/MoS
2 composite the bandgap value was found to be 2.7 eV. Reduction in the bandgap energy of the BaWO
4/MoS
2 composite is attributed to the increased carrier concentrations in the valence band (VB) and conduction band (CB) and to the electron traps formed in the conduction band.
The specific surface area of BaWO
4 and BaWO
4/MoS
2 composite photocatalyst was calculated using the Brunauer-Emmett-Teller (BET) technique. Nitrogen adsorption and desorption isotherms of BaWO
4 and BaWO
4/MoS
2 composite photocatalysts are presented in
Figure S2. N
2 adsorption and desorption isotherms of prepared material exhibited type IV according to the IUPAC classification. The specific surface area of BaWO
4 and BaWO
4/MoS
2 composite photocatalyst was found to be 42.12 and 112.98 m
2/g. Such a large surface area of BaWO
4/MoS
2 composite photocatalyst provides more surface-active sites for redox reactions, which is helpful for enhancing photocatalytic degradation efficiency [
1].
3. Photocatalytic Degradation of EBT
Prepared photocatalyst materials (BaWO
4 and BaWO
4/MoS
2 composite) were used to study the photocatalytic degradation of the Eriochrome black-T. The photocatalytic performance of BaWO
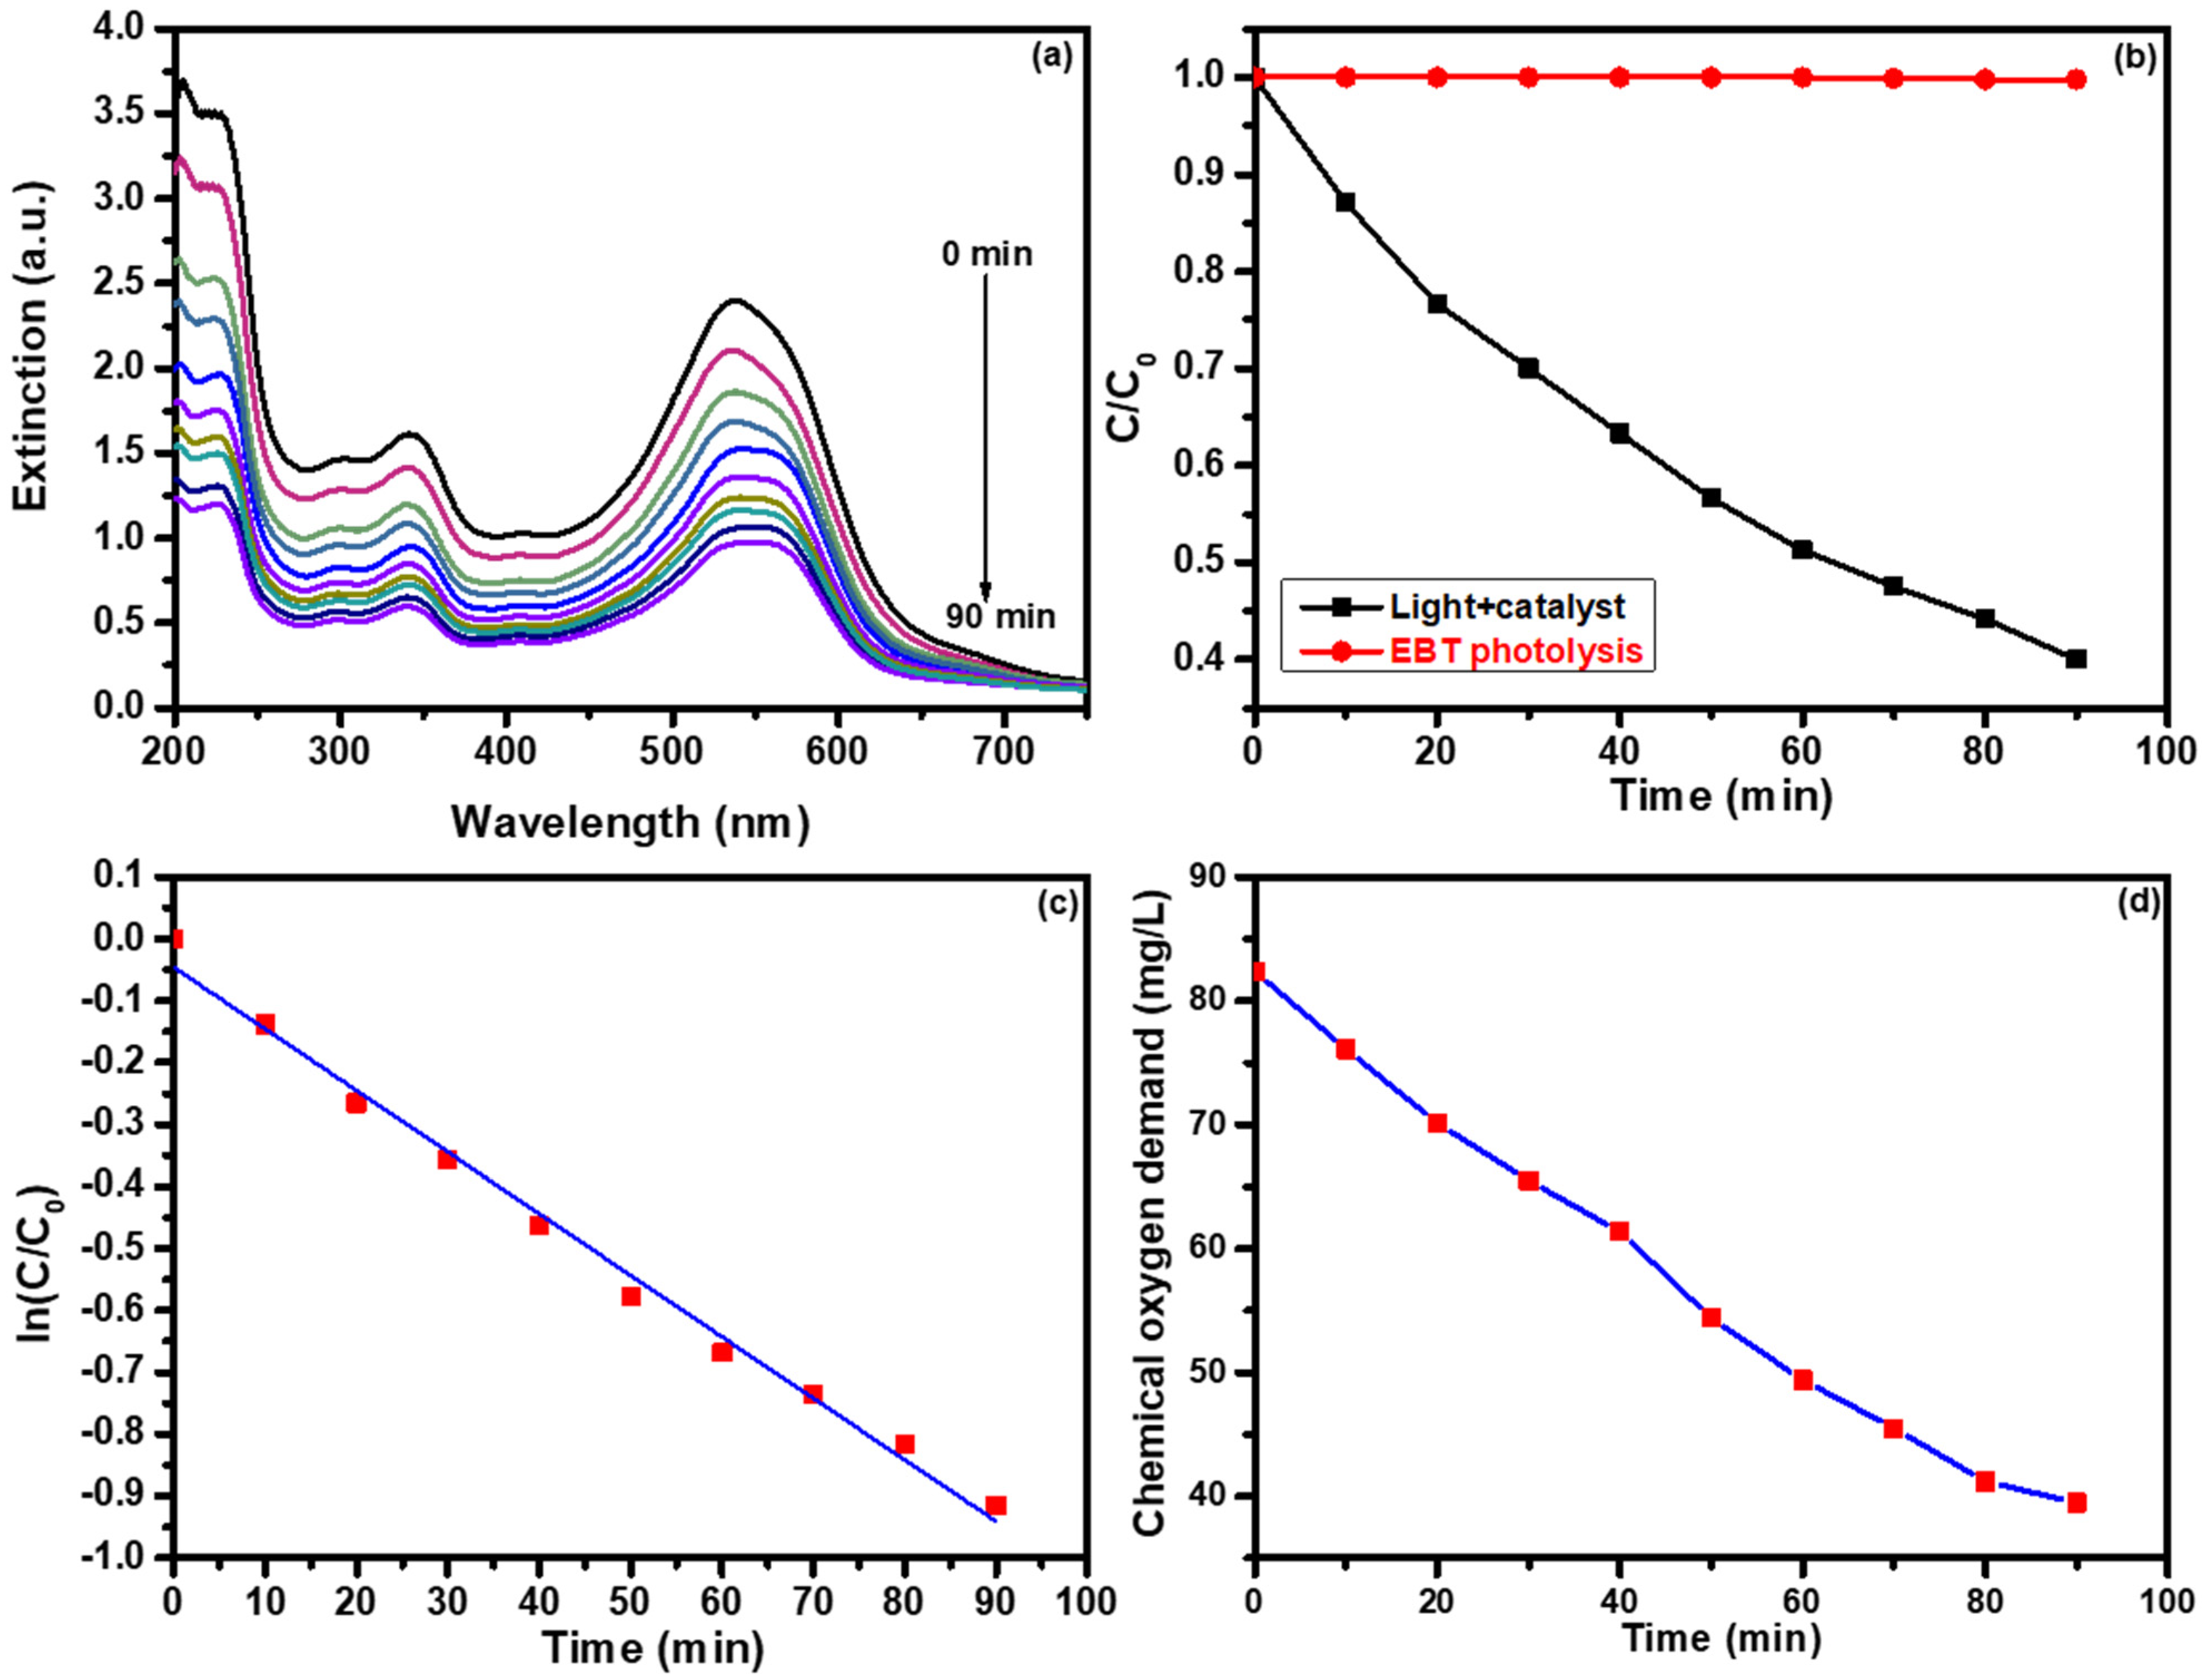
4 photocatalyst was tested under UV illumination for EBT degradation and the results are presented in
Figure 6.
Figure 6a shows the extinction spectra of EBT recorded in the wavelength range of 200 to 750 nm with a time duration up to 90 min. From the graph, it is observed that EBT has a main extinction peak at 536 nm, which slightly shifted to 548 nm, and that its intensity decreased with reaction time due to redox reactions taking place on the surface of the catalyst [
28,
29]. From these extinction spectra we were able to calculate the degradation percentage, which was found to be 59.88%. Using these extinction spectra, plots of C/C
0 vs. time were drawn and are presented in
Figure 6b. The plot of C/C
0 vs. time suggests that the concentration of EBT decreased with time. The photolysis (red line) did not show EBT degradation during illumination without a catalyst. We graphed a plot of ln C/C
0 vs. time and the results are presented in
Figure 6c. Using linear fit of plot ln(C/C
0) vs. time and reaction rate, the constant was calculated and we observed a value 0.00994 min
−1. We observed the change in chemical oxygen demand (COD) values with respect to time using the BaWO
4 photocatalyst and the results are presented in
Figure 6d. The COD study provides information about the concentration of oxidizable matter left in the electrolyte solution, not the concentration of the parent molecule [
30]. It is found that COD values decrease with reaction time. COD values decreased from 82.4 to 39.5 mg/L. The variation in COD values with time indicates that the degradation rate was initially high but after some time it slowed down. The slow reaction rate corresponds to the generation of long-lived intermediate products such as aldehydes and aliphatic acids [
31,
32].
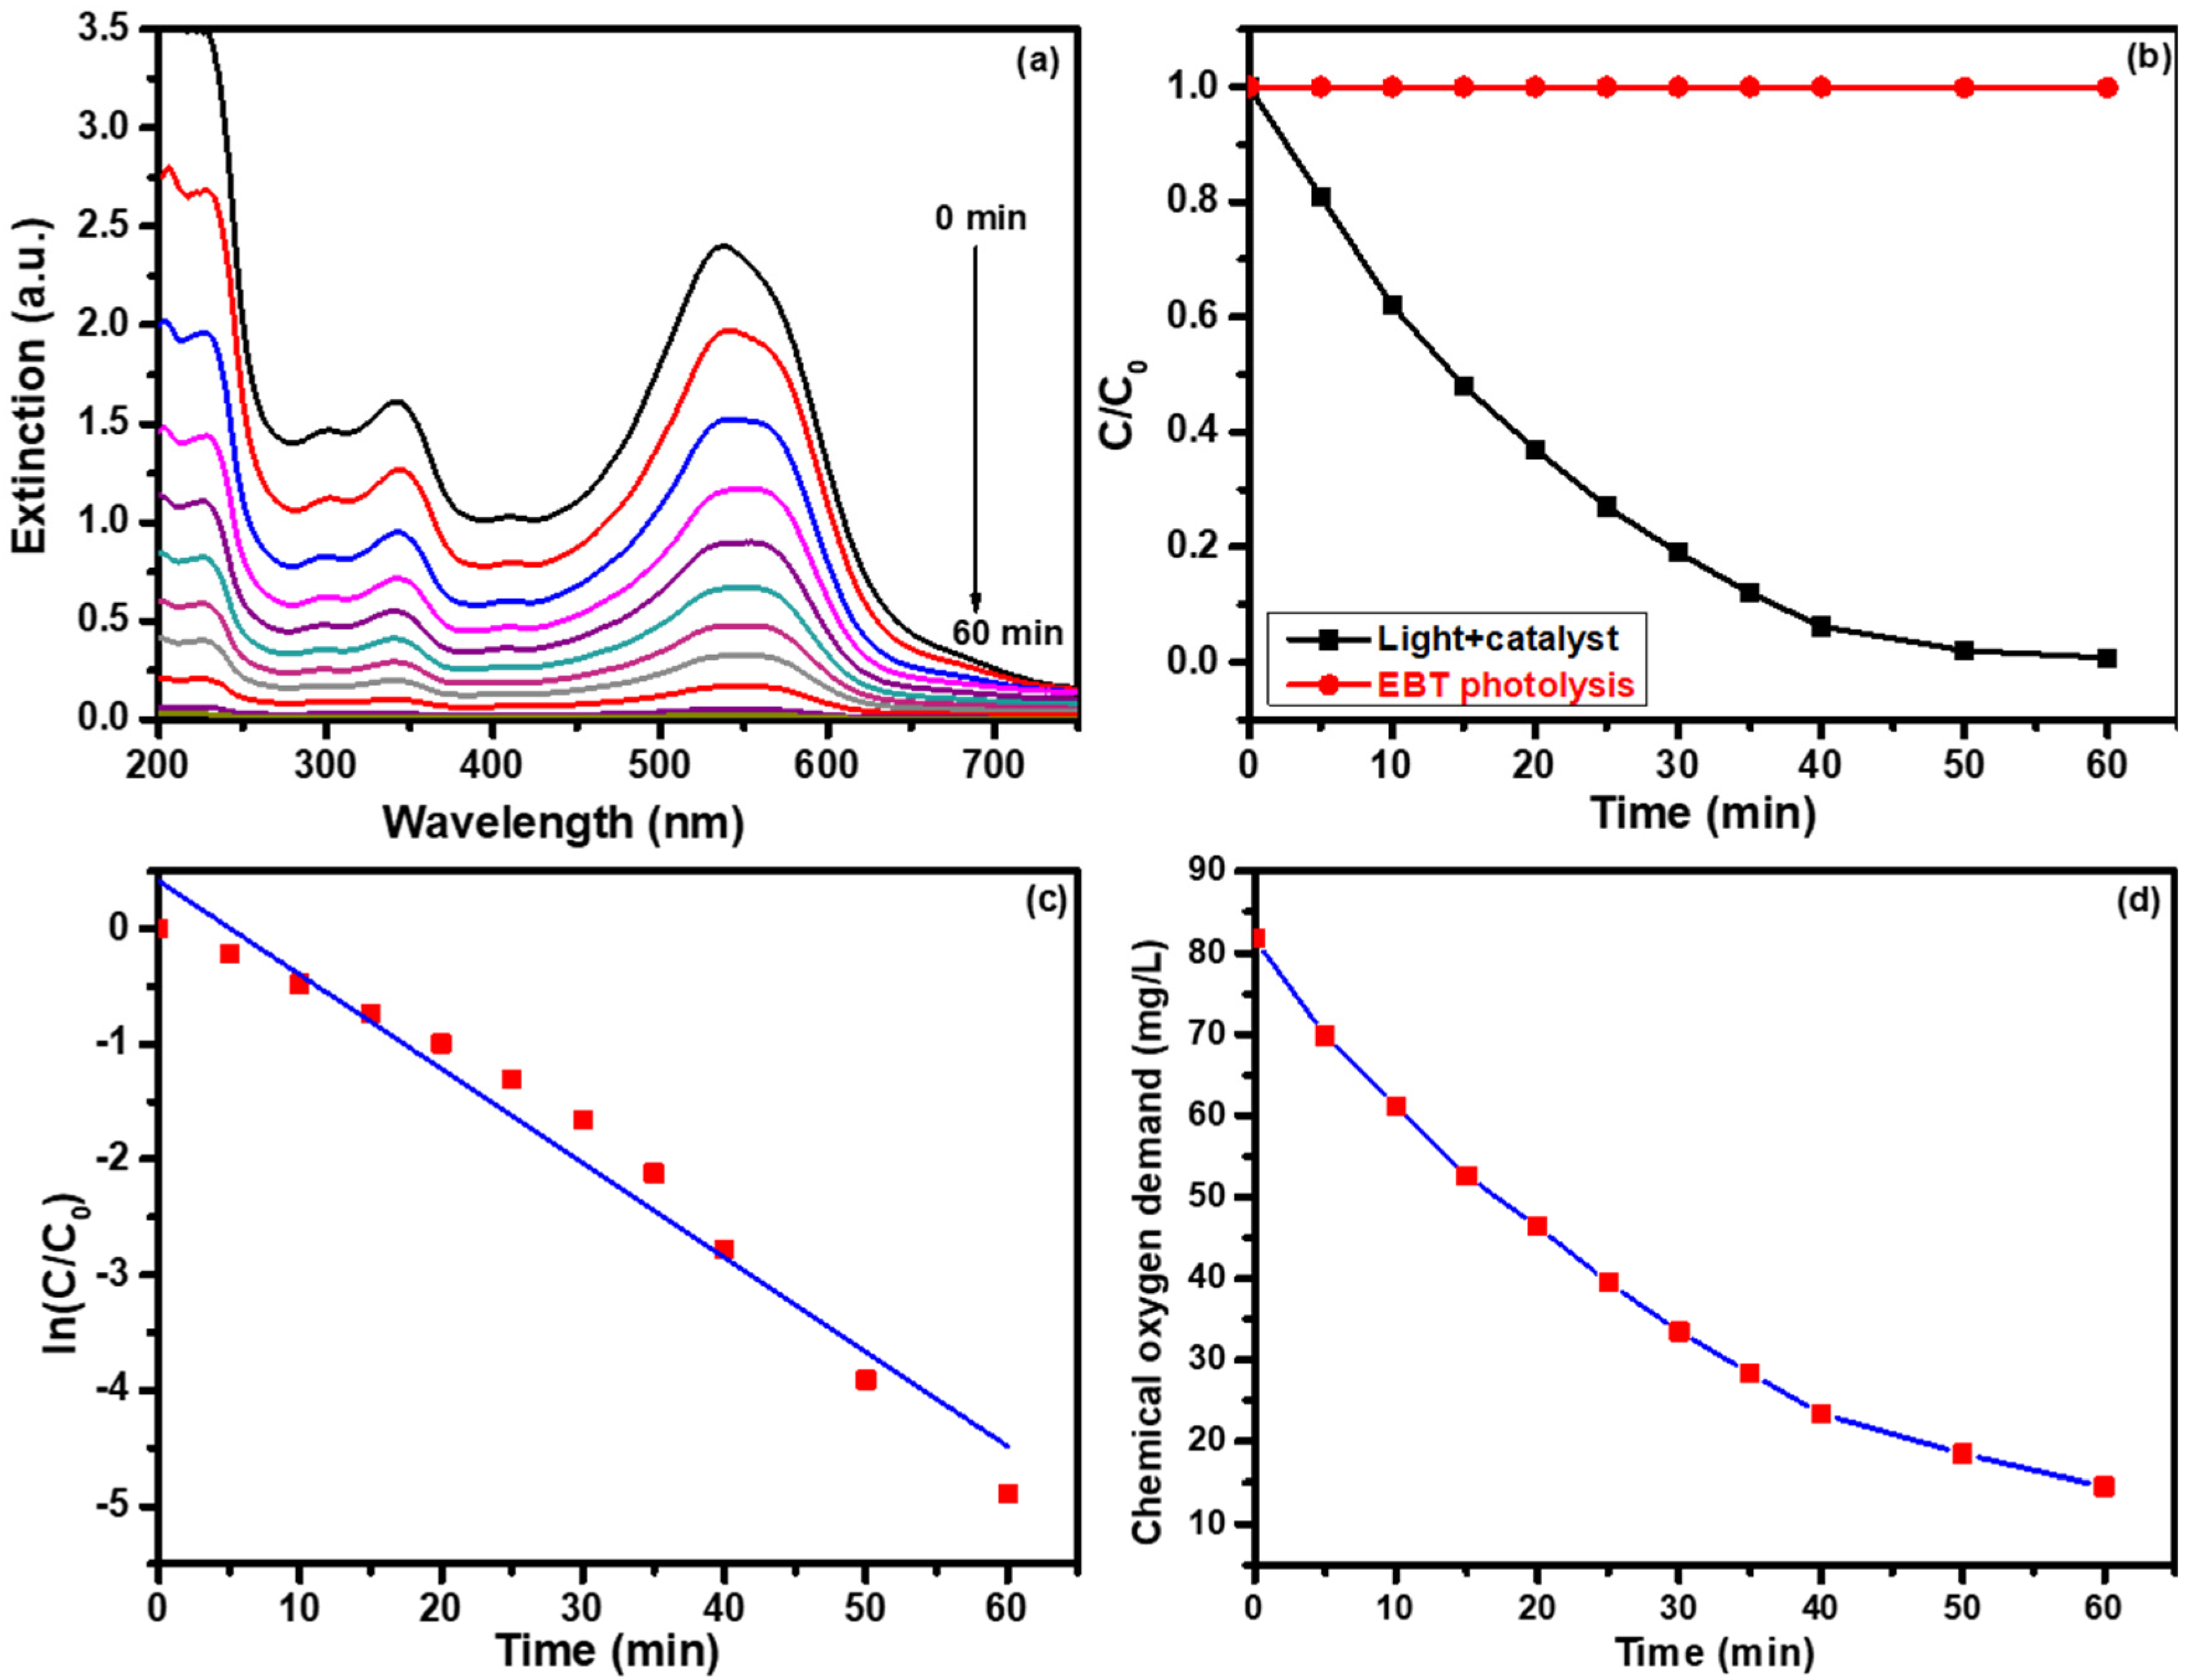
Similar experimental conditions were used but with a change to just the photocatalyst (now BaWO
4/MoS
2 composite). In these experiments we studied the photocatalytic degradation of EBT. Photocatalytic degradation of EBT using BaWO
4/MoS
2 composite photocatalyst results are shown in
Figure 7. A similar trend to that of BaWO
4 was observed for the degradation of EBT using BaWO
4/MoS
2 composite. As compared with BaWO
4 photocatalyst, BaWO
4/MoS
2 composite shows superior photocatalytic performance for EBT degradation.
Figure 7a shows the extinction spectra of EBT using the BaWO
4/MoS
2 composite photocatalyst. From the extinction spectrum, a nearly 99.20% degradation percentage was observed. The good photocatalytic activity of BaWO
4/MoS
2 composite was attributed to the effective charge transfer and minimum recombination of photogenerated charge carriers. Along with this, a large number of active sites are available for redox reactions. These are responsible for the generation of highly reactive hydroxyl and superoxide radicals that react with organic impurities and mineralize them into CO
2 and H
2O [
33,
34]. As compared with BaWO
4, complete degradation of EBT was observed in only 60 minutes using the BaWO
4/MoS
2 composite. The photolysis (red line) did not show EBT degradation during illumination without adding a catalyst, suggesting that EBT dye has high structural stability. These results confirm that the effective degradation of the EBT catalyst is required. Using these extinction spectra, the plot of C/C
0 vs. time (
Figure 7b) and ln (C/C
0) vs. time (
Figure 7c) was plotted. Using the slope of the graph ln (C/C
0) vs. time, a reaction rate constant was measured and found to be 0.08174 min
−1.
Figure 7d presents the graph of COD values vs. time. In the case of BaWO
4/MoS
2 composite photocatalyst, COD values decreased from 81.8 to 14.5 mg/L.
The photostability study of the BaWO
4/MoS
2 composite photocatalyst is presented in
Figure S3. To assess the stability of BaWO
4/MoS
2 composite photocatalyst, a photocatalytic experiment was conducted five times using the same photocatalyst and similar experimental conditions. From the stability study, it is observed that not much change was detected in the degradation efficiency of EBT after five successive cycles.
Figure S3a presents the plot of degradation percentage vs. cycle number and from the graph, it is found that there is a minor change in the degradation efficiency of EBT. The degradation percentage decreased from 99.20 to 97.81%. This slight decrease in the degradation percentage corresponds to the formation of a hydroxide layer on the surface of the BaWO
4/MoS
2 composite or loss of the catalyst during the recovery and washing process, and the blockage of the active site covering the surface with EBT and its degradation intermediates [
1,
2]. The post-photocatalytic characterization of the BaWO
4/MoS
2 composite catalyst was carried out before and after the experiment using an XRD technique. The results of this are shown in
Figure S3b and they indicate that the crystal structure of the BaWO
4/MoS
2 composite remains the same without any change after the fifth cycle, with only slight change in the XRD peak intensity detected.
Possible pathways for photocatalytic degradation of EBT dye using the BaWO
4/MoS
2 composite photocatalyst and the formation of intermediate products are shown in
Figure S4. Hydroxyl radicals formed through the attacks on the azo group present in EBT dye during the photocatalytic process, resulted in the formation of unstable intermediates identified as 2-Nitronapthalene (
m/
z = 173). Nitro group and azo groups are strong electron acceptors and donors, respectively. Hydroxyl radicals have a stronger tendency to react with an azo group than the nitro group does. The attack of hydroxyl radicals on the azo group is useful to satisfy their unpaired electronic configuration by directly adding themselves [
35]. This is due to the way the reaction leads to the formation of benzene-1,2,3-triol (
m/
z = 128) as a by-product due to the oxidation process. Further oxidation and ring opening leads to the formation of (1E,3Z)-hexa-1,3,5-trien-1-ol (
m/
z = 98) [
36]. The second possible pathway consists of following intermediate products such as 7-nitronaphthalene-1,3-diol (
m/
z = 207) or 3-hydroxy-7-nitro-1-naphthoic acid (
m/
z = 270). Further redox reactions continue to degrade EBT into small intermediate products and these smaller intermediates finally photodegraded to CO
2 and H
2O [
37].
Mechanism for the Photodegradation
BaWO
4/MoS
2 composite system, when illuminated under solar simulated light irradiation, excite electrons in the valence band of BaWO
4 and MoS
2 to the conduction band while simultaneously generating holes in the valence band. The conduction band potential of BaWO
4 is more negative than that of MoS
2. Therefore, photogenerated electrons are transferred from the conduction band of BaWO
4 to the conduction band of MoS
2 [
6]. The recombination of the photogenerated charge carrier is therefore avoided. At the interface of BaWO
4/MoS
2 composites, the separation of photogenerated holes and electrons is achieved. The conduction band electrons react with the surface-adsorbed oxygen and produce superoxide radicals, while valence band holes react with water molecules to form hydroxyl radicals [
1,
2]. Photocatalytic activity of the BaWO
4/MoS
2 composite is therefore improved with the generation of large numbers of active radicals. These radicals react with organic impurities such as EBT, and nearly complete degradation of EBT is achieved.
4. Experimental Details
4.1. Reagents
Barium chloride (BaCl2·2H2O), sodium tungstate (Na2WO4·2H2O), MoS2 powder, and Eriochrome black-T were procured from Sigma-Aldrich Company (St. Louis, MO, USA) and used without further purification. Double distilled (DD) water was used for preparing aqueous solutions.
4.2. Synthesis of BaWO4
The co-precipitation method was adopted for the synthesis of BaWO4 particles using barium chloride and sodium tungstate as precursors. A certain amount of barium chloride (2000 mg) and sodium tungstate (500 mg) aqueous solutions (each 20 mL) were made, mixed well and stirred well for about 30 min. The precipitate was formed and then centrifuged, filtered, washed thoroughly with distilled water, and dried in an oven at 60 °C overnight. After drying it was calcined at 400 °C for 4 h in a furnace.
4.3. Preparation of BaWO4/MoS2 Composite
BaWO4/MoS2 composite was prepared by the co-precipitation method. For the preparation of the composite 2000 mg of BaWO4 and 1000 mg of MoS2 was dissolved in 50 mL of water-ethanol (20:30) mixture. The above-prepared mixture was sonicated for one hour, and magnetically stirred for 1 h. Then, the formed precipitate was filtered, washed with double distilled water many times and dried at 60 °C in an air oven followed by calcination at 300 °C.
4.4. Characterizations
Crystal structures of the prepared materials were analyzed using X-ray diffraction (XRD; CuKα radiation (λ = 1.5406 Å) from a Bruker D2 Phaser, Karlsruhe, Germany). Raman spectra were recorded in the range 100–875 cm−1 using the NRS-5100 instrument of the Japan Spectroscopic Company (JASCO, Tokyo, Japan) with an excitation wavelength of 532 nm. Elemental composition was analyzed by X-ray photoelectron spectroscopy (XPS, Thermo Scientific, Waltham, MA, USA). Transmission electron microscopy (TEM) image was viewed on Zeiss Libra 120 Plus (Stuttgart, Germany) operating at 120 kV. The morphology of the prepared material was observed using the SEM instrument JSM7600F of the Japan Electron Optics Laboratory (JEOL, Tokyo, Japan). Optical properties were studied using UV–Vis absorption spectroscopy (Shimadzu: UV-1800, Kyoto, Japan). The measurement of the BET-specific surface area of the photocatalysts was carried out using a nitrogen adsorption instrument at 77 K (Micrometrics, Norcross, GA, USA, ASAP2020).
4.5. Photocatalytic Degradation of EBT
Photocatalytic degradation of EBT was performed using the BaWO
4 and BaWO
4/MoS
2 composite photocatalysts under a solar simulator. A concentration of 0.05 mM EBT (100 mL) and 25 mg catalyst amount was used during each experiment for every catalyst. Before illumination, (under dark conditions) the reaction mixture EBT (100 mL) and 25 mg catalyst were stirred for 20 min using a magnetic stirrer to attain equilibrium (adsorption-desorption). After the equilibrium, the reaction solution was put under the solar simulator to start the catalytic reactions. After a specific interval of time, 2 mL reaction solution was taken off and centrifuged to remove traces of catalyst. A change in concentration of EBT was measured using a UV-Vis spectrophotometer. A COD study was performed to confirm the mineralization of EBT. The detailed procedure of COD measurement is given in our previously published work [
38].


