Abstract
Doping ZnO with appropriate foreign metal and/or non-metal ions is one of the most promising ways to improve both the extension of ZnO photosensitization to the visible region and the separation of charge carriers. Herein, Mn-doped ZnO nanoparticles were synthesized using a precipitation method. The effect of the Mn amount on the physico-chemical properties of these nanomaterials was investigated using X-ray diffraction, Fourier-transform infrared spectroscopy, UV–visible diffuse reflectance spectroscopy, photoluminescence spectroscopy and scanning electron microscopy coupled with energy dispersive X-ray spectroscopy. The photocatalytic properties of the synthesized nanomaterials were assessed through methyl orange (MO) under visible light. The obtained results showed that the structural and optical properties of the synthesized Mn-ZnO nanomaterials depended greatly on the Mn amount. It was found that the substitution of Zn2+ by Mn2+/Mn3+ within the lattice of ZnO occurred. The photocatalytic experiments revealed that the sample containing 10 wt% exhibited the best MO conversion. For this sample, the discoloration reached 96%, while the chemical oxygen demand reached 1% after 820 min of visible illumination. The enhanced photocatalytic activity was attributed to the efficient separation of charge carriers. The active species quenching experiments showed that the holes are the main active species in MO degradation under visible light in the presence of 10%Mn-ZnO.
1. Introduction
Recycling wastewater from textile industries is considered one of the most promising ways to meet the demand for clean water sources. Various kinds of conventional wastewater treatment (such as coagulation/flocculation [1,2] and coagulation/carbon adsorption [3]) are already used to dispose of water pollutants. Nevertheless, their inadequacy has been demonstrated through, among other reasons, the generation of a large quantity of polluted sludge, the operation complexity, and the overpriced equipment. It has been proven that heterogeneous photocatalysis is an effective process regarding the degradation of various recalcitrant organic pollutants of water such as dyes [4,5,6,7], derivative phenolics [8,9,10], and pharmaceutical compounds [11,12,13,14,15]. This process requires the use of a photocatalyst and a source of light (UV and/or visible) [16,17,18,19,20,21,22].
Currently, various metal oxide semiconductors (e.g., ZnO [4,6,23] TiO2 [15,24,25,26,27,28,29,30,31,32], WO3 [33,34]) and metal sulfides (e.g., ZnS [35,36]) are used as photocatalysts in various reactions, such as hydrogen production from water splitting and environmental pollution mitigation due to their important properties [4,15,16,28,29,37,38,39]. However, ZnO-based nanomaterials have attracted particular attention due to their environmentally friendly nature, very low toxicity, thermal and chemical stability, and wide band gap, among other properties [40,41]. On the other hand, regarding water detoxification, ZnO is interesting because it generates H2O2 molecules more efficiently [42]; these play an important role in photocatalytic degradation reactions [43]. However, like a lot of metal oxides, ZnO develops a wide band gap energy (Eg = 3.30–3.32 eV [44]). This limits its photocatalytic effectiveness under UV radiation, since only an excitation wavelength that falls in the UV region would be efficient enough to generate the charge carriers (e−/h+). It is well known that the photocatalytic efficiency of a photocatalyst is closely dependent on the recombination rate of the photogenerated (e−/h+) pairs [16]. Therefore, the challenge is to both extend the photosensitization of ZnO to the visible region and to improve the separation of the charge carrier. Various strategies were explored in order to expand the photo-response of ZnO into the visible spectrum and/or to inhibit the charge carriers’ recombination. Doping ZnO with suitable foreign metal and/or non-metal ions remains the most promising method to achieve this. The incorporation of these ions into the crystal lattice of ZnO can create impurity energy levels (IEL) and reduce the band gap energy. In this topic, a lot of studies dealing with the doping ZnO with metal and/or nonmetal ions have been produced [23,45,46,47,48,49]. However, the real effect of the doping elements on the photo-response of the modified ZnO, the charge carriers’ separation, and the photocatalytic processes is still not well understood. It is well known that doping ZnO with transition metal ions provides more absorbed photons and can act as an inhibitor of the recombination of the photogenerated charge carriers [50]. On the other hand, the incorporation of a suitable transition metal into the crystal lattice of ZnO could create new energy levels just below the conduction band, thus reducing the ZnO band gap [45]. The incorporated foreign elements modify the electronic structure of ZnO, and thus improve its photocatalytic efficiency due to the modification of the coordination environment of Zn in the ZnO structure. This behavior has been highlighted in a recent published work for Cobalt-doped titania [16]. It is noteworthy that the dn electronic configuration in transition metals plays an important role when used as foreign doping elements due to s–d and p–d interactions [47,51]. On the other hand, the amount of the doping element used affects the structural, optical, and photocatalytic properties of the doped oxide, as it has been highlighted in a lot of studies [47,52]. Therefore, the present investigation focused on making some new insights regarding the effects of doping ZnO with Mn, which is a transition metal with half-filled 3d orbitals ([Ar]3d54s2), on the properties of ZnO nanoparticles, including whether they are structural, morphological, optical, or photocatalytic under visible light. Herein, three kinds of ZnO-based nanomaterials containing 1, 5, and 10 wt% of manganese were synthesized in addition to ZnO nanoparticles. It has been reported that doping ZnO with an optimum amount of Mn leads to a decrease in the band gap [53]. Mn can also act as a trapper of charge carriers by generating isolated impurity energy levels in the band gap [54]. If the IEL are below the conduction band minimum (CBM), electrons can be more easily trapped, but the holes are more difficult to trap. Vice versa, the holes can be easily trapped and electron trapping is more difficult when the IEL are just above the valance band maximum (VBM) [54]. On the other hand, ZnO-based materials have been synthesized using different methods such as sol–gel [55,56], solid-phase synthesis technique [57], hydrothermal [58,59], microwave-assisted hydrothermal [60], spray pyrolysis [61], chemical vapor deposition [62], thermal deposition [63], and chemical precipitation [4,5,16,56,63,64]. Among these methods, precipitation is the most widely used due to its simplicity and reproducibility. Furthermore, it is a low-cost process to manufacture high-purity nanoparticles with good control over the shape and size of particles, even at low temperatures.
In this work, ZnO and Mn-doped ZnO nanoparticles were synthesized using precipitation and co-precipitation methods. The structural properties of the prepared samples were analyzed by X-ray diffraction (XRD) and Fourier-transform infrared (FTIR) spectroscopy. The optical properties were investigated using UV–visible diffuse reflectance spectroscopy (DRS) and photoluminescence spectroscopy (PL). The morphology and elemental composition of the samples were examined using scanning electron microscopy (SEM) coupled with energy dispersive X-ray spectroscopy (EDS). The photocatalytic properties of the synthesized nanomaterials were assessed using methyl orange (MO) as a molecule-typical target pollutant in an aqueous solution under visible light. In order to verify the effectiveness of the synthesized photocatalysts to completely mineralize the pollutant, monitoring of the chemical oxygen demand reduction (COD) was also carried out for the photocatalyst exhibiting the best MO removal. Indeed, the COD indicates the amount of oxygen needed to oxidize the organic matter present in water. It is a test that is used to determine the amount of oxidation that will occur and the amount of organic matter in a water sample. Therefore, it provides a good estimate of the degradation rate of organic compounds.
2. Results and Discussion
2.1. Characterization
2.1.1. XRD Results
Figure 1 shows the XRD patterns of the pure and Mn-doped ZnO nanoparticles. It shows that all of the diffraction peaks recorded for all samples are indexed as the hexagonal würtzite ZnO (JCPDS file NO.: 01-075-0576). However, a noticeable diminution in the intensity of the XRD peaks of Mn-ZnO samples was observed, and even more so as the amount of Mn increases in the samples. This indicates that a transformation in the structure of ZnO occurred, caused by the incorporation of foreign elements. The same behavior was observed for Co- and Fe-doped TiO2 nanoparticles [15,16]. Additionally, compared with the undoped ZnO, the positions of the peaks d100, d002 and d101 recorded for x%Mn-ZnO showed noticeable shifts towards the lower 2θ, even more so as the amount of Mn increased in the samples (inset of Figure 1). This shift indicates that a lattice distortion of the ZnO structure occurred, caused by the introduction of Mn2+ into its matrix [57]. Analogous results were reported by Basnet et al. [57], who attributed this phenomenon to a substitution of Zn2+ by Mn2+ ions despite the difference between the ionic radii of Zn2+ (0.74 Å) and Mn2+ (0.83 Å) [57].
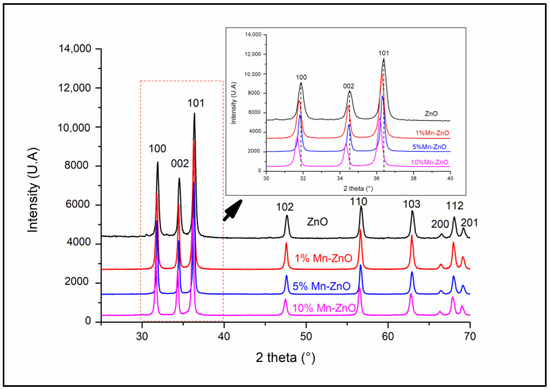
Figure 1.
XRD patterns of x%Mn-ZnO nanomaterials.
2.1.2. FTIR Results
The FTIR spectra of the pure and doped ZnO nanoparticles (Figure 2) show large absorption bands between 425 and 540 cm−1 attributed to the infrared active modes of the würtzite ZnO [5] and/or (Zn,Mn)-O stretching modes [65,66]. The bands at around 1440 and 1540 cm−1 are due to the residual acetate groups from the zinc acetate precursor [5]. The broad absorption band at around 3440 cm−1 and the band at 1640 cm−1 in all the spectra are due to the stretching and bending vibrations, respectively, of the O-H in the H2O adsorbed on the surface of the solids. It is noteworthy that no significant change was observed in the spectra of x%Mn-ZnO, depending on the increase in Mn doping.
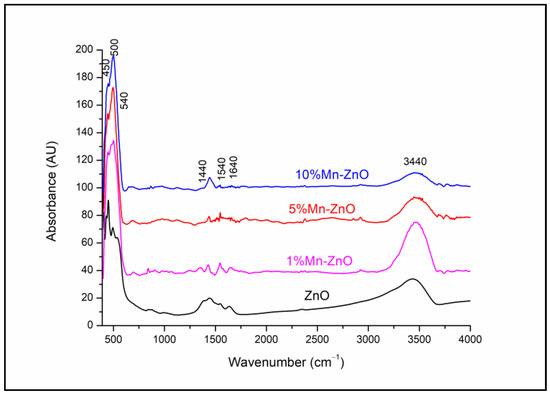
Figure 2.
FTIR spectra of x%Mn-ZnO nanoparticles.
2.1.3. DRS Results
The optical properties of the synthesized pure and Mn-doped ZnO nanoparticles were investigated using UV–vis spectroscopy. The obtained diffuse reflectance absorption spectra are shown in Figure 3. As shown in this figure, the Mn-doped ZnO nanomaterials exhibit optical properties, different from those of pure ZnO, particularly for wavelengths above the absorption edge (about 370 nm). In fact, for wavelengths above 400 nm, the spectra of the x%Mn-ZnO samples exhibit absorption tails in the visible light region, compared with ZnO, which becomes practically transparent. This was observed clearly, especially as the amount of Mn increased in the samples. This behavior indicates that ZnO nanoparticles cannot absorb wavelengths above 400 nm and the absorption behavior clearly changes depending on the amount of Mn. However, between 400 and 550 nm, the spectra suggest a possible improvement in the photocatalytic properties of these materials under visible light irradiation. Based on the absorption spectra, the band gap energy of the samples was estimated by plotting (αhν)2 versus hν, assuming a direct band gap transition [5]. The linear section of the obtained plots, by extrapolating to zero, corresponds to the direct band gap (Eg) value, as presented in Figure 3 (inset). It can be found that the Eg decreased gradually (ZnO: 3.09 eV, 1%Mn-ZnO: 3.09 eV, 5%Mn-ZnO: 2.30 eV and 10%Mn-ZnO: 2.23 eV), particularly as the weight percent of the incorporated Mn increased. These results are not similar to those reported by Yan et al. [55], who reported that the Eg value increased for Mn-ZnO compared to bare ZnO. In contrast, they are similar to those obtained Basnet et al. [57] for Mn-doped ZnO, who reported that the obtained Eg is weaker than that of ZnO. Similar results were reported by El Mragui et al. [16] for Co-doped TiO2. The decrease in the band gap energy was attributed to the defect states in the sample, as reported by Basnet et al. [57]. It is quite possible that the incorporation of Mn2+ into the ZnO lattice generates impurity energy levels around the conduction or valence bands arising from various defect sites, thus leading to a reduction in the band gap [46,67].
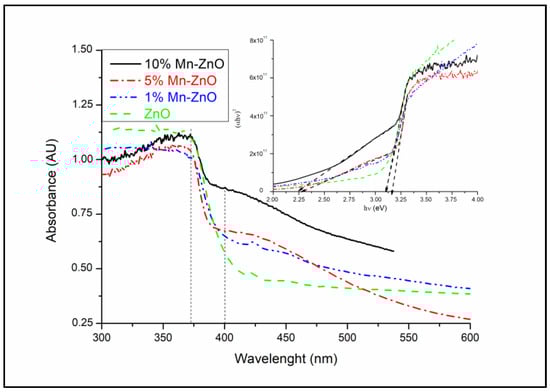
Figure 3.
UV-vis diffuse reflectance spectra and Tauc’s plots (figure inset) of x%Mn-ZnO nanomaterials.
2.1.4. XPS Results
The full scan spectra obtained for the synthesized Mn-doped and undoped ZnO nanomaterials (Figure 4a) show the presence of Mn, Zn and O. No other elements were detected, confirming the high chemical purity of the samples, in agreement with the XRD results. The binding energies at about 1021 and 1044 eV observed in the spectra of Figure S1 are attributed to the spin orbit energies of Zn2p3/2 and Zn2p1/2, respectively [68]. These results confirm the existence of the Zn2+ state in pure and Mn-doped ZnO nanomaterials. However, compared to pure ZnO, a slight shift toward the high binding energy values of Zn2p3/2 and Zn2p1/2 was observed for x%Mn-ZnO, particularly as the amount of Mn increased (Figure S1). Analogous results were reported by Basnet et al. [57], who attributed this behavior to the substitution of Zn2+ by Mn2+. The O1s XPS peak observed for ZnO shows two asymmetrical peaks (Figure S2). Their deconvolution revealed the presence of three peaks at about 529.8, 531.0 and 531.8 eV. The first one, at about 529.8 eV, was due to the lattice oxygen of ZnO [69]. The second one, at 531.0 eV, was due to the presence of oxygen vacancies (V0) in the oxygen-deficient regions within the ZnO matrix, highlighting the presence of oxygen vacancies in the sample. The last one, with the highest binding energy, at about 539.8 eV, is usually associated with the chemisorbed of the surface hydroxyl, adsorbed H2O and/or adsorbed O2 [70]. It is noteworthy that doping ZnO with an increasing amount of Mn strongly influenced the O1s XPS spectrum. Indeed, Figure S2 clearly shows that the area of the peak characteristic of oxygen vacancies (V0) increased from 8.5% for the ZnO to 34% for the 1%Mn-ZnO, and then to 50% for 5%Mn-ZnO, and then finally to 56% for the 10%Mn-ZnO. This highlights that the number of oxygen vacancies increased when the weight percentage of the Mn in the sample increased. These results corroborate those of the PL study, which highlighted the presence of oxygen vacancies in x%Mn-ZnO nanomaterials. Figure 4b–d shows broad peaks at about 642 and 654 eV, corresponding to Mn2p3/2 and Mn2p1/2, respectively. The intensity of these peaks increased all more as the percentage of Mn in the material increased. In this study, the valence band of Mn was investigated by monitoring the Mn2p3/2 peak located at about 642 eV, as reported by Yan et al. [55]. The deconvolution of this peak revealed the presence of two overlapped peaks at 641.2 and 643.4 attributed to Mn2+ and Mn3+ valence states, respectively. The area of the peak characteristic of Mn3+ increased as the amount of Mn in the sample increased (Figure 4b–d). These results confirm the presence of two oxidation states of Mn (Mn2+ and Mn3+) in the samples of x%Mn-ZnO, and the concentration of Mn3+ increasedas the weight percent of the Mn increased up to 10. Analogous results were reported by Yan et al. [55] for Mn-ZnO and by El Mragui et al. [16] for Co-TiO2 photocatalysts.
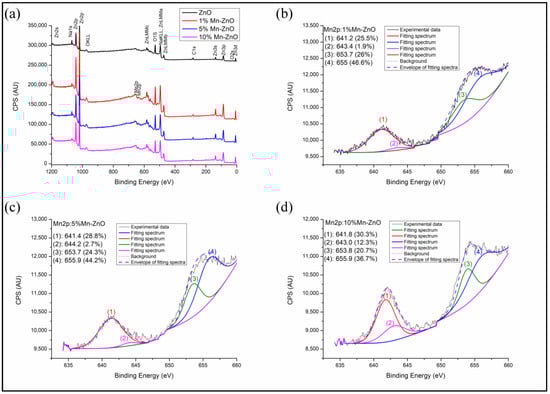
Figure 4.
Full scan (a) and High-resolution XPS spectra of Mn2p in the synthesized 1%Mn-ZnO (b), 5%Mn-ZnO (c) and 10%Mn-ZnO (d) nanomaterials.
2.1.5. PL Results
The PL emission spectra of pure and Mn-doped ZnO, recorded using 320 nm as an excitation wavelength, are presented in Figure 5. The comparison of the PL spectra of the pure and Mn-doped ZnO showed a progressive decrease in intensity as the amount of Mn increased. This indicates that the Mn doping successfully inhibited the (e−/h+) pair recombination [71]. It is noteworthy that doping ZnO with Mn involves a substantial change in optical properties, as highlighted by the DRS study. The broad and very intense emission band between 370 and 560 nm in the spectrum of the pure ZnO (Figure 5) showed a peak in the UV region (395 nm), as well as the others which can be seen in the visible region (at 437 and 465 nm). These peaks were also present in the spectra of Mn-doped ZnO. The UV emission peak at about 395 nm is attributed to the near-band-edge of ZnO, stemming from the excitonic transitions between the electrons in the conduction band and the holes in the valence band [72]. The peaks at about 437 and 465 nm can usually be attributed to the oxygen vacancies or other defects [73]. The PL spectra of the 1%Mn-ZnO, 5%Mn-ZnO and 10%Mn-ZnO, which are similar, exhibit the same emission peaks that ZnO (395, 437 and 465) along with another at 524 nm. The latter PL peak is attributed to the single ionized oxygen vacancies () [74,75]. Furthermore, Basnet et al. [57] reported that the PL emission at 524 nm could come from deep level emissions which, due to the recombination of electrons from the deep level, isolated singly ionized oxygen vacancy () centers with photogenerated holes. Thus, the lifetime of the charge carriers is increased. On the other hand, Basnet et al. [57] reported that the PL peak at 465 nm could also arise from the presence of Mn ion in the ZnO matrix, indicating that the Zn2+ ions were effectively substituted by Mn2+/Mn3+ ions. Amongst all modified ZnO nanoparticles, the lowest intensity was observed for the 10%Mn-ZnO sample, suggesting that the recombination of the photogenerated carriers was much more hindered for this material. Indeed, the intensity of the emitting bands can be used to reflect the fate of the electron–hole, pairs since the PL originates from the recombination of the electron–hole pairs when a photocatalyst is irradiated. Therefore, the strong emitting bands correspond to the high recombination rate of the photogenerated electron–hole pairs. Herein, the luminescence of the ZnO is quenched by increasing the dopant ions concentration, which could be attributed to the quenching ability of the Mn ions in the ZnO lattice, as reported by Krishnaswamy et al. [76]. XPS analysis revealed the existence of both Mn2+and Mn3+ ions in the Mn-ZnO samples. It also revealed that the area of the Mn3+ characteristic peak increased as the amount of Mn in the sample increased. The Mn3+ ions are good electron acceptors, and ZnO is a good electron donor [77]. Therefore, Mn3+ accepted the photogenerated electron, promoting electron transfer and thus weakening the emitting peaks. The emitting peaks becoming weaker as the amount of Mn increased indicates that the Mn-ZnO photocatalysts effectively retard the recombination rate of the photogenerated electron–hole pairs, particularly as the amount of Mnincreased in the Mn-ZnO sample. As has been explained previously for Co-TiO2 nanomaterials [16], and based on the XRD, PL and XPS results, it is very plausible that the existence of two oxidation states of Mn could create an acceptor level in the band gap of ZnO (Scheme 1) by generating isolated impurity energy levels (IEL) just below the conduction band minimum (CBM) [16,58]. When the Mn-doped ZnO nanoparticles were excited by irradiation light, electrons were promoted from the valence band to these IEL by absorbing energy (Equation (1), Scheme 1) and could be trapped by Mn3+ ions, then reducing them to Mn2+ species (Equation (2)). The electrons can be trapped by oxygen molecules adsorbed in the surface of ZnO. Then, Mn2+ ions can be oxidized to Mn3+ (Equation (3), Scheme 1). The holes remain in the ZnO species, leading to a charge carrier separation.
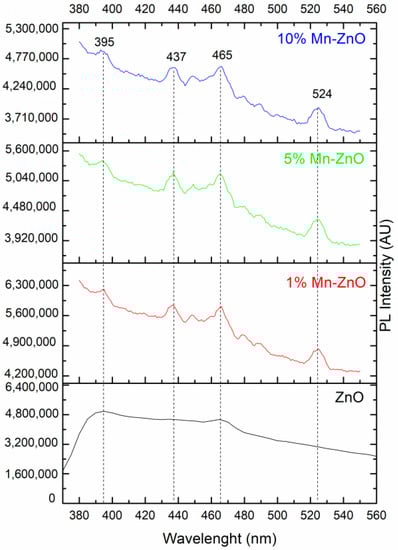
Figure 5.
PL spectra of pure and Mn-doped ZnO nanomaterials.
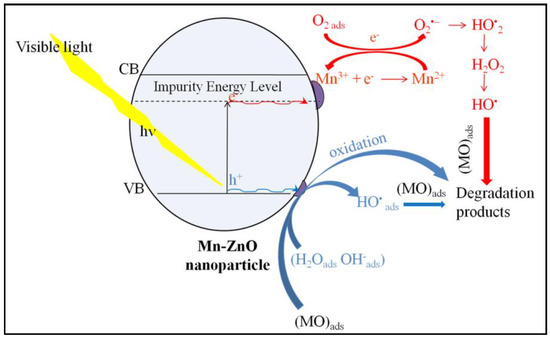
Scheme 1.
Schematic presentation of the proposed photocatalytic mechanism of 10%Mn-ZnO nanoparticles.
2.1.6. SEM-EDS Results
The surface morphology, its modification and the elemental composition were studied using scanning electron microscopy coupled with energy dispersive spectroscopy (SEM-EDS). Figure 6a shows that the prepared ZnO nanoparticles have a non-uniform, rounded shape with an average size that can reach 100 nm. The EDS analysis (Figure S3) indicates the presence of Zn, O and C coming from the precursor, used to synthesize ZnO. However, the irregular rounded shapes seemed to become less important and the form of the nanoparticles tended towards a hexagonal shape, and the average size decreased by doping ZnO with Mn, as the amount of Mn increased in the sample (Figure 6b,c). Compared to ZnO nanoparticles, the average particle size, estimated using a granolumetric method, increased to about 200 nm by doping the ZnO with 5 and 10 wt% of Mn (Figure 6b,c). The EDS analyses (Figure S3) reveal the presence of Zn, O and Mn, confirming the absence of external impurities in the prepared solid. On the other hand, the Mn elemental chemical composition obtained by EDS analysis in each sample (0.91 wt.% for 1%Mn-ZnO, 5.09 wt.% for 5%Mn-ZnO and 10.01 wt.% for 10%Mn-ZnO) was found to be close to the theoretical estimated values.

Figure 6.
SEM images of ZnO (a), 5%Mn-ZnO (b) and 10%Mn-ZnO (c) nanomaterials.
2.2. Photocatalytic Studies
2.2.1. Evaluation of the Photocatalytic Activity
The photocatalytic performance of the prepared nanomaterials was assessed under visible light irradiation using methyl orange (MO) as a molecule probe. The obtained results are shown in Figure 7. The preliminary studies showed that the MO percentage removal via the photolysis process under visible light found in this work was about 3% after 360 min of illumination (results not presented here), as reported in previous reports [16]. These results indicate that the dye is resistant to photolysis degradation under visible light, and that the simultaneous presence of the photocatalyst and light irradiation is necessary for the photocatalytic reaction. Figure 7 shows the MO removal curves as a function of irradiation time under visible light. Table 1 shows the final MO conversions obtained after a minimum of 320 min of irradiation time. The pure ZnO nanoparticles exhibited the lowest photocatalytic activity (MO conversion = 9.3%). This behavior was expected, as the DRS results showed that ZnO nanoparticles do not absorb for wavelengths above 400 nm (Eg = 3.09 eV). The incorporation of Mn2+/Mn3+ into the crystal lattice of ZnO noticeably improved the photocatalytic performance of ZnO (Table 1). Indeed, comparing the MO conversion values obtained for free and Mn-loaded ZnO materials, it was clearly seen that doping ZnO with an increasing amount of Mn up to 10 wt% considerably improved the photocatalytic performance of the ZnO, as shown in Table 1. These results are in agreement with the DRS results, since they showed both an improvement in the absorbance above 400 nm (Figure 3) and a substantial decrease in Eg for the x%Mn-ZnO photocatalysts, especially as the weight percentage of the Mn added to the ZnO increased in comparison with ZnO nanoparticles. It should be noted that the doping of ZnO by 10 wt.% of Mn considerably improved the MO conversion by approximately 10 times, leading to an almost complete elimination of MO (Table 1). These results are comparable to those reported by several authors [57,64], who reported that Mn-doped ZnO exhibited a better photocatalytic performance compared to bare ZnO particles. Indeed, Basnet et al. [57] reported that about 72% of Rhodamine B (RB) and 85% of Methylene Blue (MB) were degraded in the presence of ZnO, while about 97% of RB and 99% of MB were degraded by Mn-ZnO, respectively. On the other hand, Nithya et al. [64] reported that, in the presence of Mn-doped ZnO, 89.56% of Brilliant green was degraded, while only 72.60% was removed with ZnO. These authors explained the enhancement in the degradation efficiency of ZnO with Mn incorporation by the increased defect states in Mn-doped ZnO samples. On the other hand, it is also very important to compare the apparent rate constants obtained for the synthesized Mn-doped ZnO. As it is well known, the photocatalytic degradation of MO in an aqueous solution accords with a pseudo-first-order kinetic [5,6,78,79]. The apparent rate constants kap calculated from the slopes of the linear plots of Ln(C0/C) versus irradiation time (Inset of Figure 7) and the coefficient of the determinations are given in Table 1. The results indicate that the photocatalytic degradation reactions of the MO with the prepared ZnO and x%Mn-ZnO nanomaterials are all pseudo-first-order reactions in agreement with a generally observed Langmuir–Hinshelwood mechanism [6,80]. The obtained results show that the obtained kap for 10%Mn-ZnO was about 8 times higher than that of undoped ZnO. In this study, based on the XRD, XPS and PL results, the photocatalytic tests obtained for the synthesized x%Mn-ZnO could be linked to the number of oxygen vacancies, which increased in the sample as the amount of Mn increased, suggesting that the recombination of the photogenerated carriers is much more hindered for the 10%Mn-ZnO material. So, as explained previously for Co-TiO2 nanomaterials [16], and based on the XRD, PL and XPS results, we assume that the existence of two oxidation states of Mn could make an acceptor level in the band gap of ZnO (Scheme 1) by generating isolated impurity energy levels (IEL) just below the conduction band minimum (CBM) [16]. When the Mn-doped ZnO nanoparticles were excited by visible light, electrons were excited from the valence band to these IEL by absorbing energy (Equation (1), Scheme 1) and were trapped by Mn3+ ions to form Mn2+ species (Equation (3)). The electrons can be trapped by oxygen molecules adsorbed on the surface of ZnO. Then, Mn2+ ions can be oxidized to Mn3+ (Equation (4), Scheme 1). The holes remain in the ZnO species, leading to a charge carrier separation.
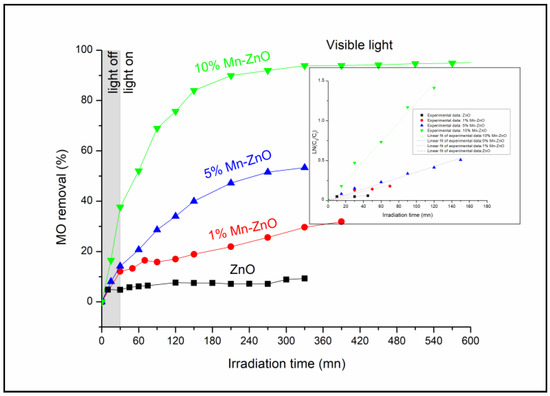
Figure 7.
MO conversion as a function of irradiation time under visible light for ZnO and x%Mn-ZnO nanomaterials. C0(MO) = 10−5 M, mphotocatalyst = 0.5 g L−1, pH = 4.

Table 1.
Band gap energies and MO conversion under visible light irradiation in the presence of ZnO and x%Mn-ZnO nanomaterials.
On the other hand, it is well known that the discoloration of a dye, generally monitored by a UV-vis spectrophotometer, does not indicate its total mineralization. In order to ensure that the methyl orange was effectively mineralized, the monitoring of the dye’s removal in the presence of the photocatalyst showing the best efficiency (10%Mn-ZnO) was also carried out by monitoring its chemical oxygen demand reduction (COD), which is an effective index of water quality allowing the estimation of the degradation rate of the organic compounds. The obtained results are shown in Figure 8a, which shows that the percentage of MO removal increases continually as soon as the light is turned on and reaches about 96% after 420 min of illumination. At the same time, the COD continuously decreases to achieve a COD reduction of about 60%. However, we can observe from the obtained results that the COD reduction continued to decrease to reach 1% after 820 min of illumination, despite the MO removal not changing. These results are very important since they indicate that the methyl orange was effectively degraded to small molecular weight products, and that elimination should not be conducted on the basis of discoloration alone, as the photocatalytic process continues even after the discoloration.
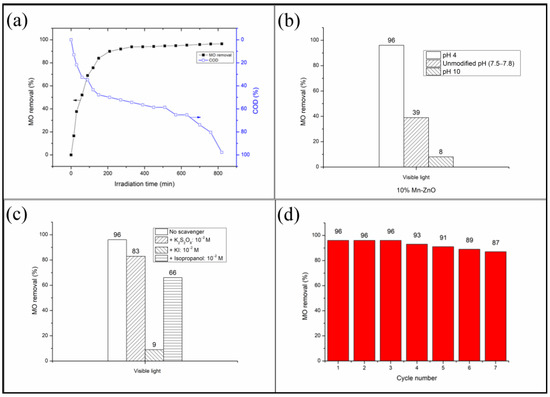
Figure 8.
(a): COD and MO removal as a function of irradiation time. (b): pH effect on the MO removal. (c): Effect of adding of various active species scavengers on the MO removal. (d): Reusability of the nanoparticles under visible light. Photocatalyst: 10%Mn-ZnO, C0(MO) = 10−5 M, mphotocatalyst = 0.5 g L−1, pH = 4.
2.2.2. Effect of pH
It has been reported that the pH of the solution strongly affects the photocatalytic degradation of dyes in multiple ways because it influences both the dye reaction rates and adsorption [5,81]. Generally, at a lower pH, the positive holes act as major oxidation species, and at a higher or neutral pH range, hydroxyl radicals are largely responsible for the oxidation process [82]. Figure 8b shows the evolution of MO conversion at various initial pHs obtained in the presence of the 10%Mn-ZnO nanoparticles under visible light irradiation. These results clearly show that the increase in solution pH has a negative effect on the MO conversion. The point of zero charge (pHpzc) determined in this study for the 10%Mn-ZnO nanoparticles was about 9.1. Therefore, at pH 10 (higher than pHpzc), the surface of the solid become negatively charged, hence leading to a decrease in the adsorption of MO ions because of the electrostatic repulsion. As a result, the photodegradation of the MO was inhibited. An opposite behavior was observed at pH 4.0 (lower than pHpzc), since the surface of the solid was positively charged, thus improving the adsorption of the MO anions, and subsequently promoting the degradation reaction.
2.2.3. Identification of the Active Species
The identification of the relative role played by the different active species in the degradation mechanisms has not yet been sufficiently elucidated. A lot of studies report results which are controversial but not erroneous due to the complexity of the photodegradation process, and also because the operating conditions used by each of the authors are not necessarily identical. Figure 8c shows the influence of adding the scavengers of active species on the final MO conversion. The results of Figure 8c indicate that the addition of the electron’s trapper slightly decreased the MO conversion (about −13.5%), while the radical hydroxyl quenching reduced MO conversion by about −31.3%. At the same time, the addition of the holes’ scavenger caused a large decrease in MO conversion (about −90.6%). It was clearly seen that the addition of all species’ trappers had a negative effect on the final MO conversion, suggesting that the three oxidative species were involved in the MO degradation. Nevertheless, these results highlight that the holes play the major role, as the removal efficiency was substantially reduced (−90.6%) after adding their scavenger. The fact that quenching electrons and holes had a negative impact on the MO degradation suggests that the charge carriers’ separation was performed successfully and their lifetime was improved by the addition of Mn, as highlighted by XRD, DRS, XPS and PL analyses. The observed scavenging impact on the MO degradation efficiency could be compared with those recently reported by El Mragui et al. [16] in the presence of 1%Co-TiO2, or Aadnan et al. [4] in the presence of ZnO-Chitosane biocomposite. Based on the above results, the MO photocatalytic degradation mechanism under visible light in the presence of 10%Mn-ZnO could be described by the following equations:
Therefore, the electrons at the valence band were excited to the IEL generated by the substitution of Zn2+ by Mn2+/Mn3+ (Equation (1), Scheme 1). These electrons were trapped by Mn3+ ions, reducing them to the Mn2+ species (Equation (3)). The Mn2+ ions reacted with to form and Mn3+ following Equation (4) (Scheme 1). Thus, the photogenerated charges were efficiently trapped and separated. The electrons can react with the adsorbed O2 to generate peroxide radicals (Equation (5)), which are able to oxidize organic pollutants into small molecular weight products and/or react with protons to form OH• following Equations (6)–(8). The holes, which are the major active species, can react with adsorbed water (Equation (9)) or hydroxyl molecules (Equation (10)) to form OH•. The holes can also react with MO molecules to form small molecular weight products (Equation (12)).
2.2.4. Reusability
The reusability and lifetime of a photocatalyst is an important parameter in practical applications. In this study, experiments regarding their recovery and recycling were carried out for the 10%Mn-ZnO. Figure 8d shows the MO conversion obtained after seven successive recycling processes. As shown in Figure 8d, after seven cycles, the photocatalytic efficiency decreased slightly by about −9.4%, indicating that the photocatalyst exhibits a good stability.
3. Materials and Methods
3.1. Materials
All the reagents were used in this work as received without further purifications. They included Zn(CH3COO)2·2H2O (Scharlau Chemie, Barcelona, Spain, purity = 99%), MnCl2·4H2O (Sigma Aldrich Chemicals, Burlington, MA, United States, purity > 99%), (Fisher Scientific International Company, Pittsburgh, PA, USA, purity 98%) and methyl orange (Fisher Scientific International Company, purity 99%). Distilled water was used in all experiments.
3.2. Methods
3.2.1. Synthesis of the Photocatalysts
In this study, pure and Mn-doped ZnO nanoparticles were synthesized using a precipitation method following the procedures reported inprevious studies [4,5,30]. Briefly, to prepare ZnO nanoparticles, Zinc acetate (26.9 g) was dissolved in distilled water (100 mL) under constant stirring. A molar solution of NaOH (20 mL) was then added dropwise to the mixture at 70 °C. After that, the solution was continuously stirred for 90 min. The obtained precipitate was filtered, washed three times using distilled water, and dried overnight in an oven at 100 °C. Concerning the Mn-doped ZnO, the required amounts of the doping element precursors in order to obtain 1, 5 and 10 wt.% of Mn were dissolved separately in distilled water under constant stirring, to which an aqueous solution of NaOH (1 M) was added dropwise at 70 °C. The aqueous solutions were continuously stirred for 90 min. The obtained solutions were added dropwise to a solution of ZnO prepared simultaneously, while respecting the desired weight percent (1, 5 and 10) of the doping element. The resulting suspensions containing x%Mn-ZnO (where x indicates the weight percent of Mn) were kept under constant agitation for 2 h, then filtered and washed with distilled water and dried overnight in an oven at 100 °C. All prepared materials were calcined at 500 °C for 3 h before use.
3.2.2. Characterization of the Photocatalysts
The structures of the synthesized samples were characterized by X-ray diffraction (XRD) using an X’PERT MPD_PRO diffractometer with Cu Kα radiation at 45 kV and 40 mA (λ = 1.5406 Å) (Malvern Panalytical Ltd., Malvern, United Kingdom). Fourier-transform infrared (FTIR) spectra of the synthesized samples were recorded from 400–4000 cm−1 using an FTIR spectrometer type JASCO 4100 (Jasco International, Tokyo, Japan) and the KBr pellet method. The scanning speed was 2 mm/s and 40 scans were made with 4 cm−1 as the resolution. The UV-vis diffuse reflectance spectroscopy (DRS) measurements were made on a JASCO V-570 spectrophotometer (Jasco International, Tokyo, Japan) equipped with a Labsphere DRA-CA-30I integration sphere, using BaSO4 as the reference. The obtained DRS data were converted to estimate the band gap energies (Eg) by applying the Tauc’s formula (αhν)n = A(hν−Eg) [5], where A is a constant of proportionality, α is the linear absorption constant, h is the Planck’s constant, and n = 2, assuming an indirect band gap transition for ZnO materials [5]. The chemical states of the elements were determined by the X-ray photoelectron spectroscopy (XPS) analysis using a Kratos AXIS Ultra HAS equipment (Kyoto, Japan). The analysis was performed with a monochromatic Al Kα X-ray source (1486.7 eV). The effect of the electric charge was corrected by the reference of the carbon peak C1s (285 eV). The room temperature photoluminescence (PL) spectra were obtained with a Horiba Jobin Yvon Fluoromax spectrofluorometer (Edison, NJ, USA). The morphology and chemical composition of the materials were obtained by scanning electron microscopy (Quanta 200 from FEI Company, Hillsboro, OR, USA), coupled with energy dispersive spectroscopy (SEM-EDS).
3.2.3. Photocatalytic Tests
The photocatalytic experiments were carried out at room temperature (26 ± 2 °C) in a Pyrex cylindrical beaker (250 mL) containing 250 mL of an aqueous solution of methyl orange (MO) (10−5 mol L−1) and 0.5 g L−1 of photocatalyst. Before each photocatalytic reaction run, the aqueous suspension containing the pollutant and the photocatalyst was stirred in the dark during the required time (30 min) to reach the adsorption/desorption equilibrium between the contaminant molecules and photocatalyst nanoparticles. After that, the suspension was positioned at about 10 cm below the light source (visible light irradiations). The visible light irradiations were provided by a commercial Feit White Compact Fluorescent lamp (23 W, cool daylight, 6500 K, 1311 Lumens, Main house Electronic Co., Ltd., Xiamen, China). The UV light portion (λ < 400 nm) was filtered by a 0.73 M NaNO2 solution [4]. Test samples were withdrawn from the suspension at given times of reaction, filtered through a 0.45 µm Millipore filter and then analyzed using a UV-vis spectrophotometer (Shimadzu 2100 spectrophotometer) at the wavelength of maximum absorbance for MO (λmax = 464 nm). The MO removal and the apparent pseudo-first-order rate constant (kap) from the Langmuir–Hinshelwood kinetic model were calculated using Equations (13) and (14) [6], respectively:
where C0 and Ct are the MO concentrations at the initial and t time of reaction, respectively.
MO removal (%) = 100 × (C0 − Ct)/C0
Ln(C0/Ct) = kap × t
The COD removal rate was determined using a Multiparameter Bench Photometer (Reference: HI 83224, HANNA Instruments, Tanneries CEDEX, Lingolsheim, France). The COD reagent vials, code bare and containing pre-measured reagents (reference: HI 94754A), were used in this work. These vials comply with the EPA (United States Environmental Protection Agency) method 410.4. In this method, a heated digestion under acidic conditions is required to allow the oxidizable organic compounds present in the sample to reduce hexavalent chromium to trivalent chromium. Digestion was performed on the samples and a reagent blank at 150 °C in a thermoreactor (Reference: HI 839800, HANNA Instruments). The reagent blank was constituted of deionized water that was treated the same as the actual samples. The intensity of color was determined by the aforementioned photometer and the COD concentration is displayed in mg/L of O2.
The COD removal rate was calculated using the Equation (15):
where COD0 and CODt are the measured COD at time t = 0 (sample containing 10−5 M of a MO aqueous solution) and at reaction time t, respectively.
COD Removal (%) = 100 × (COD0 − CODt)/COD0
pH Effect
The influence of the initial pH of the solution on the MO conversion was carried out under visible light in the presence of 10%Mn-ZnO. The pH of the solution was adjusted to the required value using diluted solutions of NaOH or HCl.
Identification of the Active Species
To identify the role played by the different active species in the degradation mechanisms, radical-trapping experiments were carried out under visible light in the presence of the 10%Mn-ZnO. Potassium peroxydisulfate (K2S2O8), KI and isopropyl alcohol at 10−2 M were used as electrons (e−), holes (h+) and hydroxyl radical scavengers [4,5], respectively.
Procedure of the Photocatalyst Recovery and Recycling
The photocatalyst recovery and recycling study was performed for seven successive recycling processes. The recuperation of the solid was carried out after 360 min of irradiation time using a 0.45 μm Millipore filter. After each cycle, the recovered nanoparticles were weighed and then washed using distilled water under constant agitation for 3 h. Then, the aqueous suspension was filtered and the solid was washed three times. After that, the recovered solid was dried overnight in an oven at 100 °C, weighed and reused as photocatalyst for the next cycle.
4. Conclusions
In this work, Mn-doped ZnO nanoparticles were successfully synthesized using a wet chemical method. The XRD, DRS, XPS and PL investigations highlighted that the Mn-doped ZnO exhibited structural and optical properties different from those of bare ZnO, particularly for the 10%Mn-ZnO. These results were attributed to the substitution of Zn2+ and Mn2+/Mn3+ within the lattice of ZnO. The existence of Mn2+ and Mn3+ in the sample, highlighted by XPS analysis, could make acceptor levels in the band gap of ZnO, highlighted by PL analysis, by generating isolated impurity energy levels just below the conduction band minimum. The MO removal under visible light in the presence of the Mn-ZnO nanomaterials highlighted a strong dependence with the Mn amount. The best MO removal (96%) was obtained for the sample 10%Mn-ZnO. The enhancement of the photocatalytic activity compared to bare ZnO was attributed to the efficient enhancement of the lifetime of the charge carriers. Furthermore, the COD in the presence of 10%Mn-ZnO continuously decreased to reach 1% after 820 min of illumination. These results indicated that the methyl orange was effectively degraded to small molecular weight products, and not only eliminated by discoloration. The active species quenching experiments showed that the holes are the main active species which are involved in MO photocatalytic degradation under visible light in the presence of 10%Mn-ZnO.
Supplementary Materials
The following are available online at https://www.mdpi.com/article/10.3390/catal12111382/s1, Figure S1: XPS spectra of Zn2p in the synthesized pure and Mn-doped ZnO nanomaterials, Figure S2: High-resolution XPS spectra of O1s in the synthesized pure and Mn-doped ZnO nanomaterials, Figure S3: EDS spectra of ZnO and x%Mn-ZnO nanomaterials.
Author Contributions
Conceptualization, O.Z.; investigation, I.A., I.D., H.M. and A.E.M.; methodology, I.A.; validation, O.Z.; visualization, O.Z.; writing—original draft, O.Z.; writing—review and editing, O.Z. and J.C.G.E.d.S. All authors have read and agreed to the published version of the manuscript.
Funding
This research received no external funding.
Acknowledgments
The authors thank the CCA (Faculty of Sciences, Moulay Ismail University of Meknes, Morocco), the CITT (Moulay Ismail University of Meknes, Morocco), the UATRS (CNRST, Rabat, Morocco), and the CEMUP (University of Porto, Portugal) for their technical supports. The Portuguese “Fundação para a Ciência e Tecnologia” (FCT, Lisbon) is acknowledged for funding the R&D Units CIQUP (UIDB/000081/2020) and the Associated Laboratory IMS (LA/P/0056/2020).
Conflicts of Interest
The authors declare no conflict of interest.
References
- Golob, V.; Vinder, A.; Simonič, M. Efficiency of the Coagulation/Flocculation Method for the Treatment of Dye bath Effluents. Dye. Pigment. 2005, 67, 93–97. [Google Scholar] [CrossRef]
- Allegre, C.; Maisseu, M.; Charbit, F.; Moulin, P. Coagulation–Flocculation–Decantation of Dye House Effluents: Concentrated Effluents. J. Hazard. Mater. 2004, 116, 57–64. [Google Scholar] [CrossRef] [PubMed]
- Papić, S.; Koprivanac, N.; LončarićBožić, A.; Meteš, A. Removal of Some Reactive Dyes from Synthetic Wastewater by Combined Al(III) Coagulation/Carbon Adsorption Process. Dye. Pigment. 2004, 62, 291–298. [Google Scholar] [CrossRef]
- Aadnan, I.; Zegaoui, O.; Daou, I.; Esteves da Silva, J.C.G. Synthesis and Physicochemical Characterization of a ZnO-Chitosan Hybrid-Biocomposite Used as an Environmentally Friendly Photocatalyst under UV-A and Visible Light Irradiations. J. Environ. Chem. Eng. 2020, 8, 104260. [Google Scholar] [CrossRef]
- El Mragui, A.; Daou, I.; Zegaoui, O. Influence of the Preparation Method and ZnO/(ZnO + TiO2) Weight Ratio on the Physicochemical and Photocatalytic Properties of ZnO-TiO2 Nanomaterials. Catal. Today 2019, 321–322, 41–51. [Google Scholar] [CrossRef]
- Daou, I.; Zegaoui, O.; Elghazouani, A. Physicochemical and Photocatalytic Properties of the ZnO Particles Synthesized by Two Different Methods Using Three Different Precursors. Comptes Rendus Chim. 2017, 20, 47–54. [Google Scholar] [CrossRef]
- Pathak, T.K.; Coetsee-Hugo, E.; Swart, H.C.; Swart, C.W.; Kroon, R.E. Preparation and Characterization of Ce Doped ZnO Nanomaterial for Photocatalytic and Biological Applications. Mater. Sci. Eng. B 2020, 261, 114780. [Google Scholar] [CrossRef]
- Atta-Eyison, A.A.; Anukwah, G.D.; Zugle, R. Photocatalysis Using Zinc Oxide-Zinc Phthalocyanine Composite for Effective Mineralization of Organic Pollutants. Catal. Commun. 2021, 160, 106357. [Google Scholar] [CrossRef]
- Kusiak-Nejman, E.; Wojnarowicz, J.; Morawski, A.W.; Narkiewicz, U.; Sobczak, K.; Gierlotka, S.; Lojkowski, W. Size-Dependent Effects of ZnO Nanoparticles on the Photocatalytic Degradation of Phenol in a Water Solution. Appl. Surf. Sci. 2021, 541, 148416. [Google Scholar] [CrossRef]
- Benhebal, H.; Chaib, M.; Salmon, T.; Geens, J.; Leonard, A.; Lambert, S.D.; Crine, M.; Heinrichs, B. Photocatalytic Degradation of Phenol and Benzoic Acid Using Zinc Oxide Powders Prepared by the Sol–Gel Process. Alex. Eng. J. 2013, 52, 517–523. [Google Scholar] [CrossRef]
- Teo, H.L.; Wong, L.; Liu, Q.; Teo, T.L.; Lee, T.K.; Lee, H.K. Simple and Accurate Measurement of Carbamazepine in Surface Water by Use of Porous Membrane-Protected Micro-Solid-Phase Extraction Coupled with Isotope Dilution Mass Spectrometry. Anal. Chim. Acta 2016, 912, 49–57. [Google Scholar] [CrossRef] [PubMed]
- Miao, X.S.; Metcalfe, C.D. Determination of Carbamazepine and Its Metabolites in Aqueous Samples Using Liquid Chromatography−Electrospray Tandem Mass Spectrometry. Anal. Chem. 2003, 75, 3731–3738. [Google Scholar] [CrossRef]
- Mohapatra, D.P.; Brar, S.K.; Daghrir, R.; Tyagi, R.D.; Picard, P.; Surampalli, R.Y.; Drogui, P. Photocatalytic Degradation of Carbamazepine in Wastewater by Using a New Class of Whey-Stabilized Nanocrystalline TiO2 and ZnO. Sci. Total Environ. 2014, 485–486, 263–269. [Google Scholar] [CrossRef] [PubMed]
- Leucht, S.; Helfer, B.; Dold, M.; Kissling, W.; Mcgrath, J. Carbamazepine for Schizophrenia. Cochrane Database Syst. Rev. 2014, 2014. [Google Scholar] [CrossRef]
- El Mragui, A.; Logvina, Y.; Pinto da Silva, L.; Zegaoui, O.; Esteves da Silva, J.C.G. Synthesis of Fe- and Co-Doped TiO2 with Improved Photocatalytic Activity Under Visible Irradiation Toward Carbamazepine Degradation. Materials 2019, 12, 3874. [Google Scholar] [CrossRef] [PubMed]
- El Mragui, A.; Zegaoui, O.; Esteves da Silva, J.C.G. Elucidation of the Photocatalytic Degradation Mechanism of an Azo Dye under Visible Light in the Presence of Cobalt Doped TiO2 Nanomaterials. Chemosphere 2021, 266, 128931. [Google Scholar] [CrossRef]
- Ye, S.; Yan, M.; Tan, X.; Liang, J.; Zeng, G.; Wu, H.; Song, B.; Zhou, C.; Yang, Y.; Wang, H. Facile Assembled Biochar-Based Nanocomposite with Improved Graphitization for Efficient Photocatalytic Activity Driven by Visible Light. Appl. Catal. B 2019, 250, 78–88. [Google Scholar] [CrossRef]
- Jiménez-Tototzintle, M.; Ferreira, I.J.; da Silva Duque, S.; GuimarãesBarrocas, P.R.; Saggioro, E.M. Removal of Contaminants of Emerging Concern (CECs) and Antibiotic Resistant Bacteria in Urban Wastewater Using UVA/TiO2/H2O2 Photocatalysis. Chemosphere 2018, 210, 449–457. [Google Scholar] [CrossRef]
- Jiang, L.; Yuan, X.; Zeng, G.; Liang, J.; Chen, X.; Yu, H.; Wang, H.; Wu, Z.; Zhang, J.; Xiong, T. In-Situ Synthesis of Direct Solid-State Dual Z-Scheme WO3/g-C3N4/Bi2O3 Photocatalyst for the Degradation of Refractory Pollutant. Appl. Catal. B 2018, 227, 376–385. [Google Scholar] [CrossRef]
- Guo, J.; Liang, J.; Yuan, X.; Jiang, L.; Zeng, G.; Yu, H.; Zhang, J. Efficient Visible-Light Driven Photocatalyst, Silver (Meta) Vanadate: Synthesis, Morphology and Modification. Chem. Eng. J. 2018, 352, 782–802. [Google Scholar] [CrossRef]
- Vaiano, V.; Sacco, O.; Sannino, D.; Ciambelli, P. Photocatalytic Removal of Spiramycin from Wastewater under Visible Light with N-Doped TiO2 Photocatalysts. Chem. Eng. J. 2015, 261, 3–8. [Google Scholar] [CrossRef]
- Li, W.; Li, D.; Xian, J.; Chen, W.; Hu, Y.; Shao, Y.; Fu, X. Specific Analyses of the Active Species on Zn0.28Cd0.72S and TiO2 Photocatalysts in the Degradation of Methyl Orange. J. Phys. Chem. C 2010, 114, 21482–21492. [Google Scholar] [CrossRef]
- Yu, W.; Zhang, J.; Peng, T. New Insight into the Enhanced Photocatalytic Activity of N-, C- and S-Doped ZnO Photocatalysts. Appl. Catal. B 2016, 181, 220–227. [Google Scholar] [CrossRef]
- Yu, J.; Low, J.; Xiao, W.; Zhou, P.; Jaroniec, M. Enhanced Photocatalytic CO2-Reduction Activity of Anatase TiO2 by Coexposed {001} and {101} Facets. J. Am. Chem. Soc. 2014, 136, 8839–8842. [Google Scholar] [CrossRef]
- Xu, Q.; Yu, J.; Zhang, J.; Zhang, J.; Liu, G. Cubic Anatase TiO2 Nanocrystals with Enhanced Photocatalytic CO2 Reduction Activity. Chem. Commun. 2015, 51, 7950–7953. [Google Scholar] [CrossRef]
- Liu, G.; Yin, L.C.; Wang, J.; Niu, P.; Zhen, C.; Xie, Y.; Cheng, H.M. A Red Anatase TiO2 Photocatalyst for Solar Energy Conversion. Energy Environ. Sci. 2012, 5, 9603–9610. [Google Scholar] [CrossRef]
- Chen, X.; Liu, L.; Yu, P.Y.; Mao, S.S. Increasing Solar Absorption for Photocatalysis with Black Hydrogenated Titanium Dioxide Nanocrystals. Science 2011, 331, 746–750. [Google Scholar] [CrossRef]
- El Mragui, A.; Zegaoui, O.; Daou, I. Synthesis, Characterization and Photocatalytic Properties under Visible Light of Doped and Co-Doped TiO2-Based Nanoparticles. Mater. Today Proc. 2019, 13, 857–865. [Google Scholar] [CrossRef]
- El Mragui, A.; Zegaoui, O.; Daou, I.; Esteves da Silva, J.C.G. Preparation, Characterization, and Photocatalytic Activity under UV and Visible Light of Co, Mn, and Ni Mono-Doped and (P,Mo) and (P,W) Co-Doped TiO2 Nanoparticles: A Comparative Study. Environ. Sci. Pollut. Res. 2021, 28, 25130–25145. [Google Scholar] [CrossRef]
- Chen, Y.; Li, W.; Wang, J.; Gan, Y.; Liu, L.; Ju, M. Microwave-assisted ionic liquid synthesis of Ti3+ self-doped TiO2 hollow nanocrystals with enhanced visible-light photoactivity, photoactivity. Appl. Catal. B Environ. 2016, 191, 94–105. [Google Scholar] [CrossRef]
- Chen, Y.; Wang, Y.; Li, W.; Yang, Q.; Hou, Q.; Wei, L.; Liu, L.; Huang, F.; Ju, M. Enhancement of photocatalytic performance with the use of noble-metal-decorated TiO2 nanocrystals as highly active catalysts for aerobic oxidation under visible-light irradiation. Appl. Catal. B Environ. 2017, 210, 352–367. [Google Scholar] [CrossRef]
- Wang, Y.; Chen, Y.; Hou, Q.; Ju, M.; Li, W. Coupling Plasmonic and Co catalyst Nanoparticles on N-TiO2 for Visible-Light-Driven Catalytic Organic Synthesis. Nanomaterials 2019, 9, 391. [Google Scholar] [CrossRef] [PubMed]
- Mi, Q.; Ping, Y.; Li, Y.; Cao, B.; Brunschwig, B.S.; Khalifah, P.G.; Galli, G.A.; Gray, H.B.; Lewis, N.S. Thermally Stable N2-Intercalated WO3 Photoanodes for Water Oxidation. J. Am. Chem. Soc. 2012, 134, 18318–18324. [Google Scholar] [CrossRef]
- Kim, J.; Lee, C.W.; Choi, W. Platinized WO3 as an Environmental Photocatalyst That Generates OH Radicals under Visible Light. Environ. Sci. Technol. 2010, 44, 6849–6854. [Google Scholar] [CrossRef]
- Chen, D.; Huang, F.; Ren, G.; Li, D.; Zheng, M.; Wang, Y.; Lin, Z. ZnS Nano-Architectures: Photocatalysis, Deactivation and Regeneration. Nanoscale 2010, 2, 2062–2064. [Google Scholar] [CrossRef] [PubMed]
- Zhang, Y.; Zhang, N.; Tang, Z.R.; Xu, Y.J. Graphene Transforms Wide Band Gap ZnS to a Visible Light Photocatalyst. The New Role of Graphene as a Macromolecular Photosensitizer. ACS Nano 2012, 6, 9777–9789. [Google Scholar] [CrossRef]
- Wang, H.; Wu, Z.; Liu, Y.; Sheng, Z. The Characterization of ZnO-Anatase-Rutile Three-Component Semiconductor and Enhanced Photocatalytic Activity of Nitrogen Oxides. J. Mol. Catal. A Chem. 2008, 287, 176–181. [Google Scholar] [CrossRef]
- Pirhashemi, M.; Habibi-Yangjeh, A.; Rahim Pouran, S. Review on the Criteria Anticipated for the Fabrication of Highly Efficient ZnO-Based Visible-Light-Driven Photocatalysts. J. Ind. Eng. Chem. 2018, 62, 1–25. [Google Scholar] [CrossRef]
- Shayegan, Z.; Lee, C.S.; Haghighat, F. TiO2 Photocatalyst for Removal of Volatile Organic Compounds in Gas Phase-A Review. Chem. Eng. J. 2018, 334, 2408–2439. [Google Scholar] [CrossRef]
- Esplugas, S.; Giménez, J.; Contreras, S.; Pascual, E.; Rodríguez, M. Comparison of Different Advanced Oxidation Processes for Phenol Degradation. Water Res. 2002, 36, 1034–1042. [Google Scholar] [CrossRef]
- Kumar, R.; Kumar, G.; Umar, A. ZnO Nano-Mushrooms for Photocatalytic Degradation of Methyl Orange. Mater. Lett. 2013, 97, 100–103. [Google Scholar] [CrossRef]
- Carraway, E.R.; Hoffman, A.J.; Hoffmann, M.R. Photocatalytic Oxidation of Organic Acids on Quantum-Sized Semiconductor Colloids. Environ. Sci. Technol. 1994, 28, 786–793. [Google Scholar] [CrossRef] [PubMed]
- Poulios, I.; Makri, D.; Prohaska, X. Photocatalytic Treatment of Olive Milling Waste Water: Oxidation of Protocatechuic Acid. Glob. Nest Int. J. 1999, 1, 55–62. [Google Scholar] [CrossRef]
- Kamal, T.; Ul-Islam, M.; Khan, S.B.; Asiri, A.M. Adsorption and Photocatalyst Assisted Dye Removal and Bactericidal Performance of ZnO/Chitosan Coating Layer. Int. J. Biol. Macromol. 2015, 81, 584–590. [Google Scholar] [CrossRef]
- Qi, K.; Xing, X.; Zada, A.; Li, M.; Wang, Q.; Liu, Y.S.; Lin, H.; Wang, G. Transition Metal Doped ZnO Nanoparticles with Enhanced Photocatalytic and Antibacterial Performances: Experimental and DFT Studies. Ceram. Int. 2020, 46, 1494–1502. [Google Scholar] [CrossRef]
- Ullah, R.; Dutta, J. Photocatalytic Degradation of Organic Dyes with Manganese-Doped ZnO Nanoparticles. J. Hazard. Mater. 2008, 156, 194–200. [Google Scholar] [CrossRef] [PubMed]
- Baylan, E.; Altintas Yildirim, O. Highly Efficient Photocatalytic Activity of Stable Manganese-Doped Zinc Oxide (Mn:ZnO) Nanofibers via Electrospinning Method. Mater. Sci. Semicond. Process. 2019, 103, 104621. [Google Scholar] [CrossRef]
- Benavente, E.; Durán, F.; Sotomayor-Torres, C.; González, G. Heterostructured Layered Hybrid ZnO/MoS2 Nanosheets with Enhanced Visible Light Photocatalytic Activity. J. Phys. Chem. Solids 2018, 113, 119–124. [Google Scholar] [CrossRef]
- Kaphle, A.; Reed, T.; Apblett, A.; Hari, P. Doping Efficiency in Cobalt-Doped ZnO Nanostructured Materials. J. Nanomater. 2019, 2019, 7034620. [Google Scholar] [CrossRef]
- Altintas Yildirim, O.; Arslan, H.; Sönmezoğlu, S. Facile Synthesis of Cobalt-Doped Zinc Oxide Thin Films for Highly Efficient Visible Light Photocatalysts. Appl. Surf. Sci. 2016, 390, 111–121. [Google Scholar] [CrossRef]
- Lee, Y.R.; Ramdas, A.K.; Aggarwal, R.L. Energy Gap, Excitonic, and ‘Internal Mn2+ Optical Transition in Mn-Based II-VI Diluted Magnetic Semiconductors. Phys. Rev. B 1988, 38, 10600–10610. [Google Scholar] [CrossRef] [PubMed]
- Wang, Y.; Cheng, J.; Yu, S.; Alcocer, E.J.; Shahid, M.; Wang, Z.; Pan, W. Synergistic Effect of N-Decorated and Mn2+ Doped ZnO Nanofibers with Enhanced Photocatalytic Activity. Sci. Rep. 2016, 6, 32711. [Google Scholar] [CrossRef] [PubMed]
- Senthilkumaar, S.; Rajendran, K.; Banerjee, S.; Chini, T.K.; Sengodan, V. Influence of Mn Doping on the Microstructure and Optical Property of ZnO. Mater. Sci. Semicond. Process. 2008, 11, 6–12. [Google Scholar] [CrossRef]
- Yang, J.H.; Shi, L.; Wang, L.W.; Wei, S.H. Non-Radiative Carrier Recombination Enhanced by Two-Level Process: A First-Principles Study. Sci. Rep. 2016, 6, 21712. [Google Scholar] [CrossRef] [PubMed]
- Yan, X.; Hu, D.; Li, H.; Li, L.; Chong, X.; Wang, Y. Nanostructure and Optical Properties of M Doped ZnO (M = Ni, Mn) Thin Films Prepared by Sol–Gel Process. Phys. B Condens. Matter. 2011, 406, 3956–3962. [Google Scholar] [CrossRef]
- Saravanan, R.; Gupta, V.K.; Narayanan, V.; Stephen, A. Comparative study on photocatalytic activity of ZnO prepared by different methods. J. Mol. Liq. 2013, 181, 133–141. [Google Scholar] [CrossRef]
- Basnet, P.; Samanta, D.; Chanu, T.I.; Chatterjee, S. Visible Light Facilitated Degradation of Alternate Dye Solutions by Highly Reusable Mn-ZnO Nano-Photocatalyst. J. Alloys Compd. 2021, 867, 158870. [Google Scholar] [CrossRef]
- Li, W.; Wang, G.; Chen, C.; Liao, J.; Li, Z. Enhanced Visible Light Photocatalytic Activity of ZnO Nanowires Doped with Mn2+ and Co2+ Ions. Nanomaterials 2017, 7, 20. [Google Scholar] [CrossRef]
- Yogamalar, R.N.; Bose, A.C. Tuning the aspect ratio of hydrothermally grown ZnO by choice of precursor. J. Solid State Chem. 2011, 184, 12–20. [Google Scholar] [CrossRef]
- Zhu, Z.; Yang, D.; Liu, H. Microwave-assisted hydrothermal synthesis of ZnO rod-assembled microspheres and their photocatalytic performances. Adv. Powder Technol. 2011, 22, 493–497. [Google Scholar] [CrossRef]
- Benny, J.; Gopchandran, K.G.; Manoj, P.K.; Koshy, P.; Vaidyan, V.K. Optical and electrical properties of zinc oxide films prepared by spray pyrolysis. Bull. Mater. Sci. 1999, 22, 921–926. [Google Scholar]
- Kim, S.W.; Kotani, T.; Ueda, M.; Fujita, S.; Fujita, S. Selective formation of ZnO nanodots on nanopatterned substrates by metalorganic chemical vapor deposition. Appl. Phys. Lett. 2003, 83, 3593. [Google Scholar] [CrossRef]
- Kaur, J.; Bansal, S.; Singhal, S. Photocatalytic degradation of methyl orange using ZnOnanopowders synthesized via thermal decomposition of oxalate precursor method. Phys. B 2013, 416, 33–38. [Google Scholar] [CrossRef]
- Nithya, R.; Ragupathy, S.; Sakthi, D.; Arun, V.; Kannadasan, N. A Study on Mn Doped ZnO Loaded on CSAC for the Photocatalytic Degradation of Brilliant Green Dye. Chem. Phys. Lett. 2020, 755, 137769. [Google Scholar] [CrossRef]
- Soni, B.H.; Deshpande, M.P.; Bhatt, S.V.; Garg, N.; Pandya, N.N.; Chaki, S.H. Influence of Mn Doping on Optical Properties of ZnO Nanoparticles Synthesized by Microwave Irradiation. J. Opt. 2013, 42, 328–334. [Google Scholar] [CrossRef]
- Kumar, P.; Pandey, P.C. Investigations on Absorption, Photoluminescence and Magnetic Properties of ZnO: Co Nanoparticles. J. Sol.-Gel. Sci. Technol. 2016, 80, 342–352. [Google Scholar] [CrossRef]
- Banu Bahşi, Z.; Oral, A.Y. Effects of Mn and Cu Doping on the Microstructures and Optical Properties of Sol–Gel Derived ZnO Thin Films. Opt. Mater. 2007, 29, 672–678. [Google Scholar] [CrossRef]
- Shatnawi, M.; Alsmadi, A.M.; Bsoul, I.; Salameh, B.; Mathai, M.; Alnawashi, G.; Alzoubi, G.M.; Al-Dweri, F.; Bawa’aneh, M.S. Influence of Mn Doping on the Magnetic and Optical Properties of ZnO Nanocrystalline Particles. Results Phys. 2016, 6, 1064–1071. [Google Scholar] [CrossRef]
- Lu, Z.L.; Yan, G.Q.; Wang, S.; Zou, W.Q.; Mo, Z.R.; Lv, L.Y.; Zhang, F.M.; Du, Y.W.; Xu, M.X.; Xia, Z.H. Influence of the Oxidative Annealing Temperature on the Magnetism of (Mn, N)-CodopedZnO Thin Films. J. Appl. Phys. 2008, 104, 033919. [Google Scholar] [CrossRef]
- Gao, Q.; Dai, Y.; Li, C.; Yang, L.; Li, X.; Cui, C. Correlation between Oxygen Vacancies and Dopant Concentration in Mn-Doped ZnO Nanoparticles Synthesized by Co-Precipitation Technique. J. Alloys Compd. 2016, 684, 669–676. [Google Scholar] [CrossRef]
- Hu, C.; Tang, Y.; Jiang, Z.; Hao, Z.; Tang, H.; Wong, P.K. Characterization and Photocatalytic Activity of Noble-Metal-Supported Surface TiO2/SiO2. Appl. Catal. A Gen. 2003, 253, 389–396. [Google Scholar] [CrossRef]
- Zhao, Y.; Liu, L.; Cui, T.; Tong, G.; Wu, W. Enhanced Photocatalytic Properties of ZnO/Reduced Graphene Oxide Sheets (RGO) Composites with Controllable Morphology and Composition. Appl. Surf. Sci. 2017, 412, 58–68. [Google Scholar] [CrossRef]
- Kannadasan, N.; Shanmugam, N.; Cholan, S.; Sathishkumar, K.; Viruthagiri, G.; Poonguzhali, R. Optical and Electrochemical Characteristics of Pb Ions Doped ZnO Nanocrystals. Curr. Appl. Phys. 2014, 14, 1760–1766. [Google Scholar] [CrossRef]
- Xiao, L.; Youji, L.; Feitai, C.; Peng, X.; Ming, L. Facile Synthesis of Mesoporous Titanium Dioxide Doped by Ag-Coated Graphene with Enhanced Visible-Light Photocatalytic Performance for Methylene Blue Degradation. RSC Adv. 2017, 7, 25314–25324. [Google Scholar] [CrossRef]
- Bandopadhyay, K.; Mitra, J. Zn Interstitials and O Vacancies Responsible for N-Type ZnO: What Do the Emission Spectra Reveal? RSC Adv. 2015, 5, 23540–23547. [Google Scholar] [CrossRef]
- Krishnaswamy, S.; Ragupathi, V.; Panigrahi, P.; Nagarajan, G. Photoluminescence quenching of green synthesized manganese doped zinc oxide by sodium iodide doped Polypyrrole polymer. Thin Solid Films 2019, 689, 137510. [Google Scholar] [CrossRef]
- Subramanian, V.; Wolf, E.E.; Kamat, P.V. Catalysis with TiO2/gold nanocomposites: Effect of metal particle size on the fermi level equilibration. J. Am. Chem. Soc. 2004, 126, 4943–4950. [Google Scholar] [CrossRef]
- Tian, J.; Chen, L.; Yin, Y.; Wang, X.; Dai, J.; Zhu, Z.; Liu, X.; Wu, P. Photocatalyst of TiO2/ZnO Nano Composite Film: Preparation, Characterization, and Photodegradation Activity of Methyl Orange. Surf. Coat. Technol. 2009, 204, 205–214. [Google Scholar] [CrossRef]
- Liao, D.L.; Badour, C.A.; Liao, B.Q. Preparation of Nanosized TiO2/ZnO Composite Catalyst and Its Photocatalytic Activity for Degradation of Methyl Orange. J. Photochem. Photobiol. A Chem. 2008, 194, 11–19. [Google Scholar] [CrossRef]
- Dung, N.T.; van Khoa, N.; Herrmann, J.M. Photocatalytic Degradation of Reactive Dye RED-3BA in Aqueous TiO2 Suspension under UV-Visible Light. Int. J. Photoenergy 2005, 7, 11–15. [Google Scholar] [CrossRef]
- Ajmal, A.; Majeed, I.; Malik, R.N.; Idriss, H.; Nadeem, M.A. Principles and Mechanisms of Photocatalytic Dye Degradation on TiO2 Based Photocatalysts: A Comparative Overview. RSC Adv. 2014, 4, 37003–37026. [Google Scholar] [CrossRef]
- Tunesi, S.; Anderson, M. Influence of Chemisorption on the Photodecomposition of Salicylic Acid and Related Compounds Using Suspended TiO2 Ceramic Membranes. J. Phys. Chem. 1991, 95, 3399–3405. [Google Scholar] [CrossRef]


Publisher’s Note: MDPI stays neutral with regard to jurisdictional claims in published maps and institutional affiliations. |
© 2022 by the authors. Licensee MDPI, Basel, Switzerland. This article is an open access article distributed under the terms and conditions of the Creative Commons Attribution (CC BY) license (https://creativecommons.org/licenses/by/4.0/).