Article

A Novel Shift in the Absorbance Maxima of Methyl Orange with Calcination Temperature of Green Tin Dioxide Nanoparticle-Induced Photocatalytic Activity

1
Department of Chemistry, University of Azad Jammu and Kashmir, Muzaffarabad 13100, Pakistan
2
Departments of Nanomedicine, Public Health, and Environmental Engineering, Fluorotronics, Inc. and California Innovations Corp., San Diego, CA 92037, USA
3
US-Pakistan Centre for Advanced Studies in Energy, National University of Science and Technology (NUST), Islamabad 44000, Pakistan
4
Nanosciences and Technology Department (NS and TD), National Center for Physics (NCP), Islamabad 44000, Pakistan
5
Department of Chemistry, Hazara University, Mansehra 21300, Pakistan
6
Department of Chemistry, COMSATS University Islamabad (CUI), Islamabad 44000, Pakistan
7
Department of Chemistry, College of Science and Arts, Kind Abdulaziz University, Rabigh 25711, Saudi Arabia
8
Department of Chemistry, Faculty of Science, University of Tabuk, Tabuk 71491, Saudi Arabia
*
Authors to whom correspondence should be addressed.
These authors contributed equally to this work.
Catalysts 2022, 12(11), 1397; https://doi.org/10.3390/catal12111397
Submission received: 11 September 2022 / Revised: 17 October 2022 / Accepted: 20 October 2022 / Published: 9 November 2022
(This article belongs to the Section Photocatalysis)

Abstract

:
Background: The photocatalytic degradation of toxic organic compounds has received great attention for the past several years. Dyes, such as methyl orange (MO), are one of the major pollutants which create environmental hazards in the hydrosphere, living organisms and human beings. During photocatalytic degradation, NPs are activated in the presence of UV–Vis radiation which in turn creates a redox environment in the system and behaves as a sensitizer for light-induced redox mechanisms. Tin oxide (SnO2) is one of the prominent, but less investigated, nanomaterials compared to titanium oxide (TiO2) and Zinc oxide (ZnO) nanoparticles (NPs). Methods: Herein, Buxus wallichiana (B. wallichiana) leaf extract was utilized as a reducing and capping agent for the biosynthesis of SnO2 NPs. The effects of the calcination temperature on their photocatalytic, structure and surface properties were then examined. The degree of crystallinity and the crystallite size were determined through X-ray diffraction (XRD) analysis. The pore size and surface area were calculated by Burnett–Emmitt–Teller (BET) and Barrett–Joyner–Halenda (BJH) methods based on nitrogen desorption data. Morphological changes were assessed by scanning electron microscopy (SEM). The optical behavior was analyzed through UV–Vis diffuse reflectance spectroscopy (DRS) data and the band gap subsequently calculated. The photocatalytic efficiency of SnO2 NPs was evaluated by double beam UV–Vis spectrophotometry under the influence of initial MO concentration, catalyst dose and pH of MO solution. The surface functional moieties were identified using Fourier transform infrared (FTIR) spectroscopy. All the calcined SnO2 NPs were used as photocatalysts for the mineralization of MO in aqueous media. Results: The degree of crystallinity and the crystallite size increased with the calcination temperature. The transmittance edge obtained for all the calcined SnO2 NPs shows a maximum absorbance in the visible range (λ-max = 464 nm). Moving toward higher wavelengths, a sudden intense red shift (from 464 nm to 500 nm), attributed to the incorporation of a hydroxyl radical at the ortho-position in the benzene ring associated with the dimethylamine group of MO, was observed in the absorbance of the samples calcined up to 300 °C. The percentage degradation of MO was found to decrease with increasing calcination temperatures. The optimal photocatalytic activity toward MO (15 ppm) in a solution of pH = 6 was obtained with 15 mg SnO2 NPs calcined at 100 °C. Conclusions: UV–Vis absorption spectroscopy demonstrates that the absorption spectra of MO are strongly modified by the calcination temperature. This work opens new avenues for the use of SnO2 NPs as photocatalysts against the degradation of industrial effluents enriched with different dyes.

1. Introduction

Due to the expeditious industrialization and urbanization, water pollution has become the hot potato issue these days [1]. Of all the other sources responsible for this hazardous upshot, the industrial effluents are receiving much attention [2]. Enormous production and the extensive use of synthetic dyes are considered as the major causes of adulterating irreplaceable water sources. Almost all the industrial effluents contain dyes in different concentrations and, according to an estimate, almost 7 × 10⁵ tons of the dyestuff is used worldwide by the leather, plastic and textile industries for coloring their products [3]. In parallel, these are also causing deplorable problems such as the prevention of light penetration, thus affecting the life-driving photosynthesis process, as well as the increase in chemical oxygen demand and visibility. The reason that lies behind these severe problems is the toxicity, carcinogenicity, and the stability of these organic compounds. Therefore, these materials need to be effectively treated before they are discharged into the aqueous environment to reduce such perils. Previously, adsorption techniques have been used for the removal of such materials using activated carbon as an adsorbent because of its great efficiency in the removal of both biodegradable and non-biodegradable materials. As it is costly and has a high regeneration cost, the researchers are trying to find some economical and more effective alternatives [4].
Methyl orange (MO) (C14H14N3NaO3S) is an anionic dye which is regularly used in textile, paper, cosmetics, and pharmaceutical industries; it remains in the environment for a prolonged time because of its high stability and low biodegradability [5,6]. It has mutagenic effects on the human body because of its toxic and carcinogenic nature [7]. MO penetrates into the human body via the skin and causes fast heart rate, vomiting and the death of lung tissues, so it is mandatory to adopt some methods to remove such hazardous substances [8]. Several methods such as adsorption, incineration, membrane filtration, coagulation and absorption have been used earlier for dye removal, but they have not proven to be so efficient due to the generation of disposal problems, high cost and large consumption of time. Among all other alternatives, semiconductor-based photocatalytic degradation has proved to be an efficient, economical and environmentally friendly process [9].
Different types of metal and metal oxide nanoparticles are synthesized for various applications, such as catalysis, energy storage devices, dye-based solar cells, and biomedicines [1,2,5,10,11,12,13,14,15,16,17,18,19,20,21,22,23,24,25]. Due to their strong oxidizing power, different morphologies, non-toxic nature and high photochemical stability, SnO2 NPs are one of the best nanomaterials with applications in photocatalysis [17,18]. Additionally, the paucity of reports on photodegradation of dyes with SnO2 NPs compared to TiO2 and ZnO NPs [5,14,15,18,19,20] justifies the pertinence of the present study. Several methodologies have been employed for the fabrication of SnO2 NPs, such as spray pyrolysis, microwave, sol–gel synthesis, homogeneous precipitation, micro-emulsion, polyol, hydrothermal, sonochemical, solvothermal and non-aqueous routes [21]. However, the majority of these methods, if not all, impart noxious effects on the environment due to the inclusion of hazardous/harmful chemicals and substances, have a longer reaction time and involve sophisticated instrumentation [22].
Green nanotechnology appears to be a significant alternative to counteract the deleterious effects induced by chemical and physical methods while creating new renewable, biodegradable functional materials by utilizing non-toxic, cost-effective chemicals and eco-friendly solvents [5,14,15,19,23,24,25]. The reaction medium, capping agents and reducing agents are the three main decisive factors in the synthesis and stabilization of nanomaterials [13].
Consequently, it is crucial to establish new synthesis strategies where green chemistry rules are strictly implemented. In the context of the rapid increase in environmental pollution by dyes/industrial effluents, our main objective was to synthesize SnO2 NPs using an ecofriendly technique for the remediation of methyl orange, an organic pollutant. In the present work, SnO2 NPs were prepared with B. Wallichiana leaf extract. B. wallichiana, generally called as Himalayan boxwood, is the member of family Buxaceae. It is an evergreen monoecious tree commonly found in shady places, high mountains, and cold climates [26]. Phytochemical analysis reported the presence of alkaloids and steroids including buxatine, buxiramin D, buxandrine F, buxidine F, buxamine F, buxaltine H, and semperviraminol [26]. B. wallichiana also has some medicinal effects and it is used as an analgesic, purgative, anti-rheumatic, diuretic, antileprotic and as a bitter tonic [26]. The roots and leaves of the plant have been widely used for the treatment of most diseases, but its use in the synthesis of NPs, including for the degradation of MO, has not been reported yet. Thus, we (i) sought to establish whether B. wallichiana leaf extract could be used as a capping and reducing agent in the biosynthesis of original SnO2 NPs, and (ii) decided to examine their potential to degrade MO under irradiation with simulated solar light. To the best of our knowledge, this work is the first of its kind.

2. Results and Discussion

2.1. XRD Analysis

The X-ray diffractograms of SnO2 NPs calcined at 100, 300, 600 and 900 °C are presented in Figure 1.
The diffractogram for SnO2 NPs calcined at 100 °C has definite peaks at 2θ 26.75(110), 34.07(101), and 51.62(211), which fits to the reference card No. 00-001-0625. It confirms the cassiterite crystal phase of SnO2 NPs having tetragonal geometry. The peaks at 44.54(210) and 64.80(112), which correspond to JCPDS card No. 01-077-0452 are due to an unknown SnO2 crystal system.
The diffractogram for SnO2 NPs calcined at 300 °C exhibit diffraction bands along with corresponding hkl values at 2θ position are 26.57(110), 34.11(101) and 51.07(211), which match with JCPDS card No. 01-077-1499 assigned to the tetragonal geometry of SnO2 crystallites.
The XRD patterns of SnO2 NPs calcined at 600 and 900 °C display diffraction bands with hkl values (±0.04 shift) at 26.62(110), 33.84(101), 37.89(200), 51.80(211), 54.70(220), 61.87(310), 64.69(112), 66.05(301), 71.38(202) and 78.70(321), which match with diffraction peaks as listed in JCPDS card 01-071-652. These peaks attributed to the cassiterite crystal phase possessing tetragonal geometry.
The average crystallite sizes of all the calcined SnO2 Miscalculated by considering the peak position and FWHM values using Debye–Scherer’s equation, are 13.94, 17.23, 21.96 and 39.64 nm for the SnO2 NPs calcined at 100, 300, 600, and 900 °C, respectively. The enlargement of crystallite size at elevated calcination temperature could be ascribed to thermally promoted crystallite growth [27]. The lattice strains, determined for the SnO2 nanocrystals calcined at 100, 300, 600 and 900 °C, are 1.062, 1.079, 0.574 and 0.214%, respectively. The lattice strains seem to increase with the initial rise in calcination temperature up to 300 °C, whereas a significant decrease was observed with further elevation in the calcination temperature. Based on the initial increase in calcination temperature ranging from 100 to 300 °C, SnO2 NPs seem to be in a transition state, as the peaks at 44.54 (210) and 64.80 (112) for the unknown crystal phase disappeared. This assumes that the sample with a maximum crystal lattice of 1.079% possess high structural defects due to the existence of some amorphous content together with the transition of the crystalline phase. However, further escalation in the calcination temperature from 300 to 600 °C shows that the SnO2 NPs are homogenized, the appearance of new peaks related to the cassiterite crystals phase suggests the conversion of amorphous content into the crystalline phase. The increased sharpness and decline in broadness of diffraction peaks upon a further rise in calcination temperature to 900 °C confirm the high degree of crystallinity and increased crystallite size.

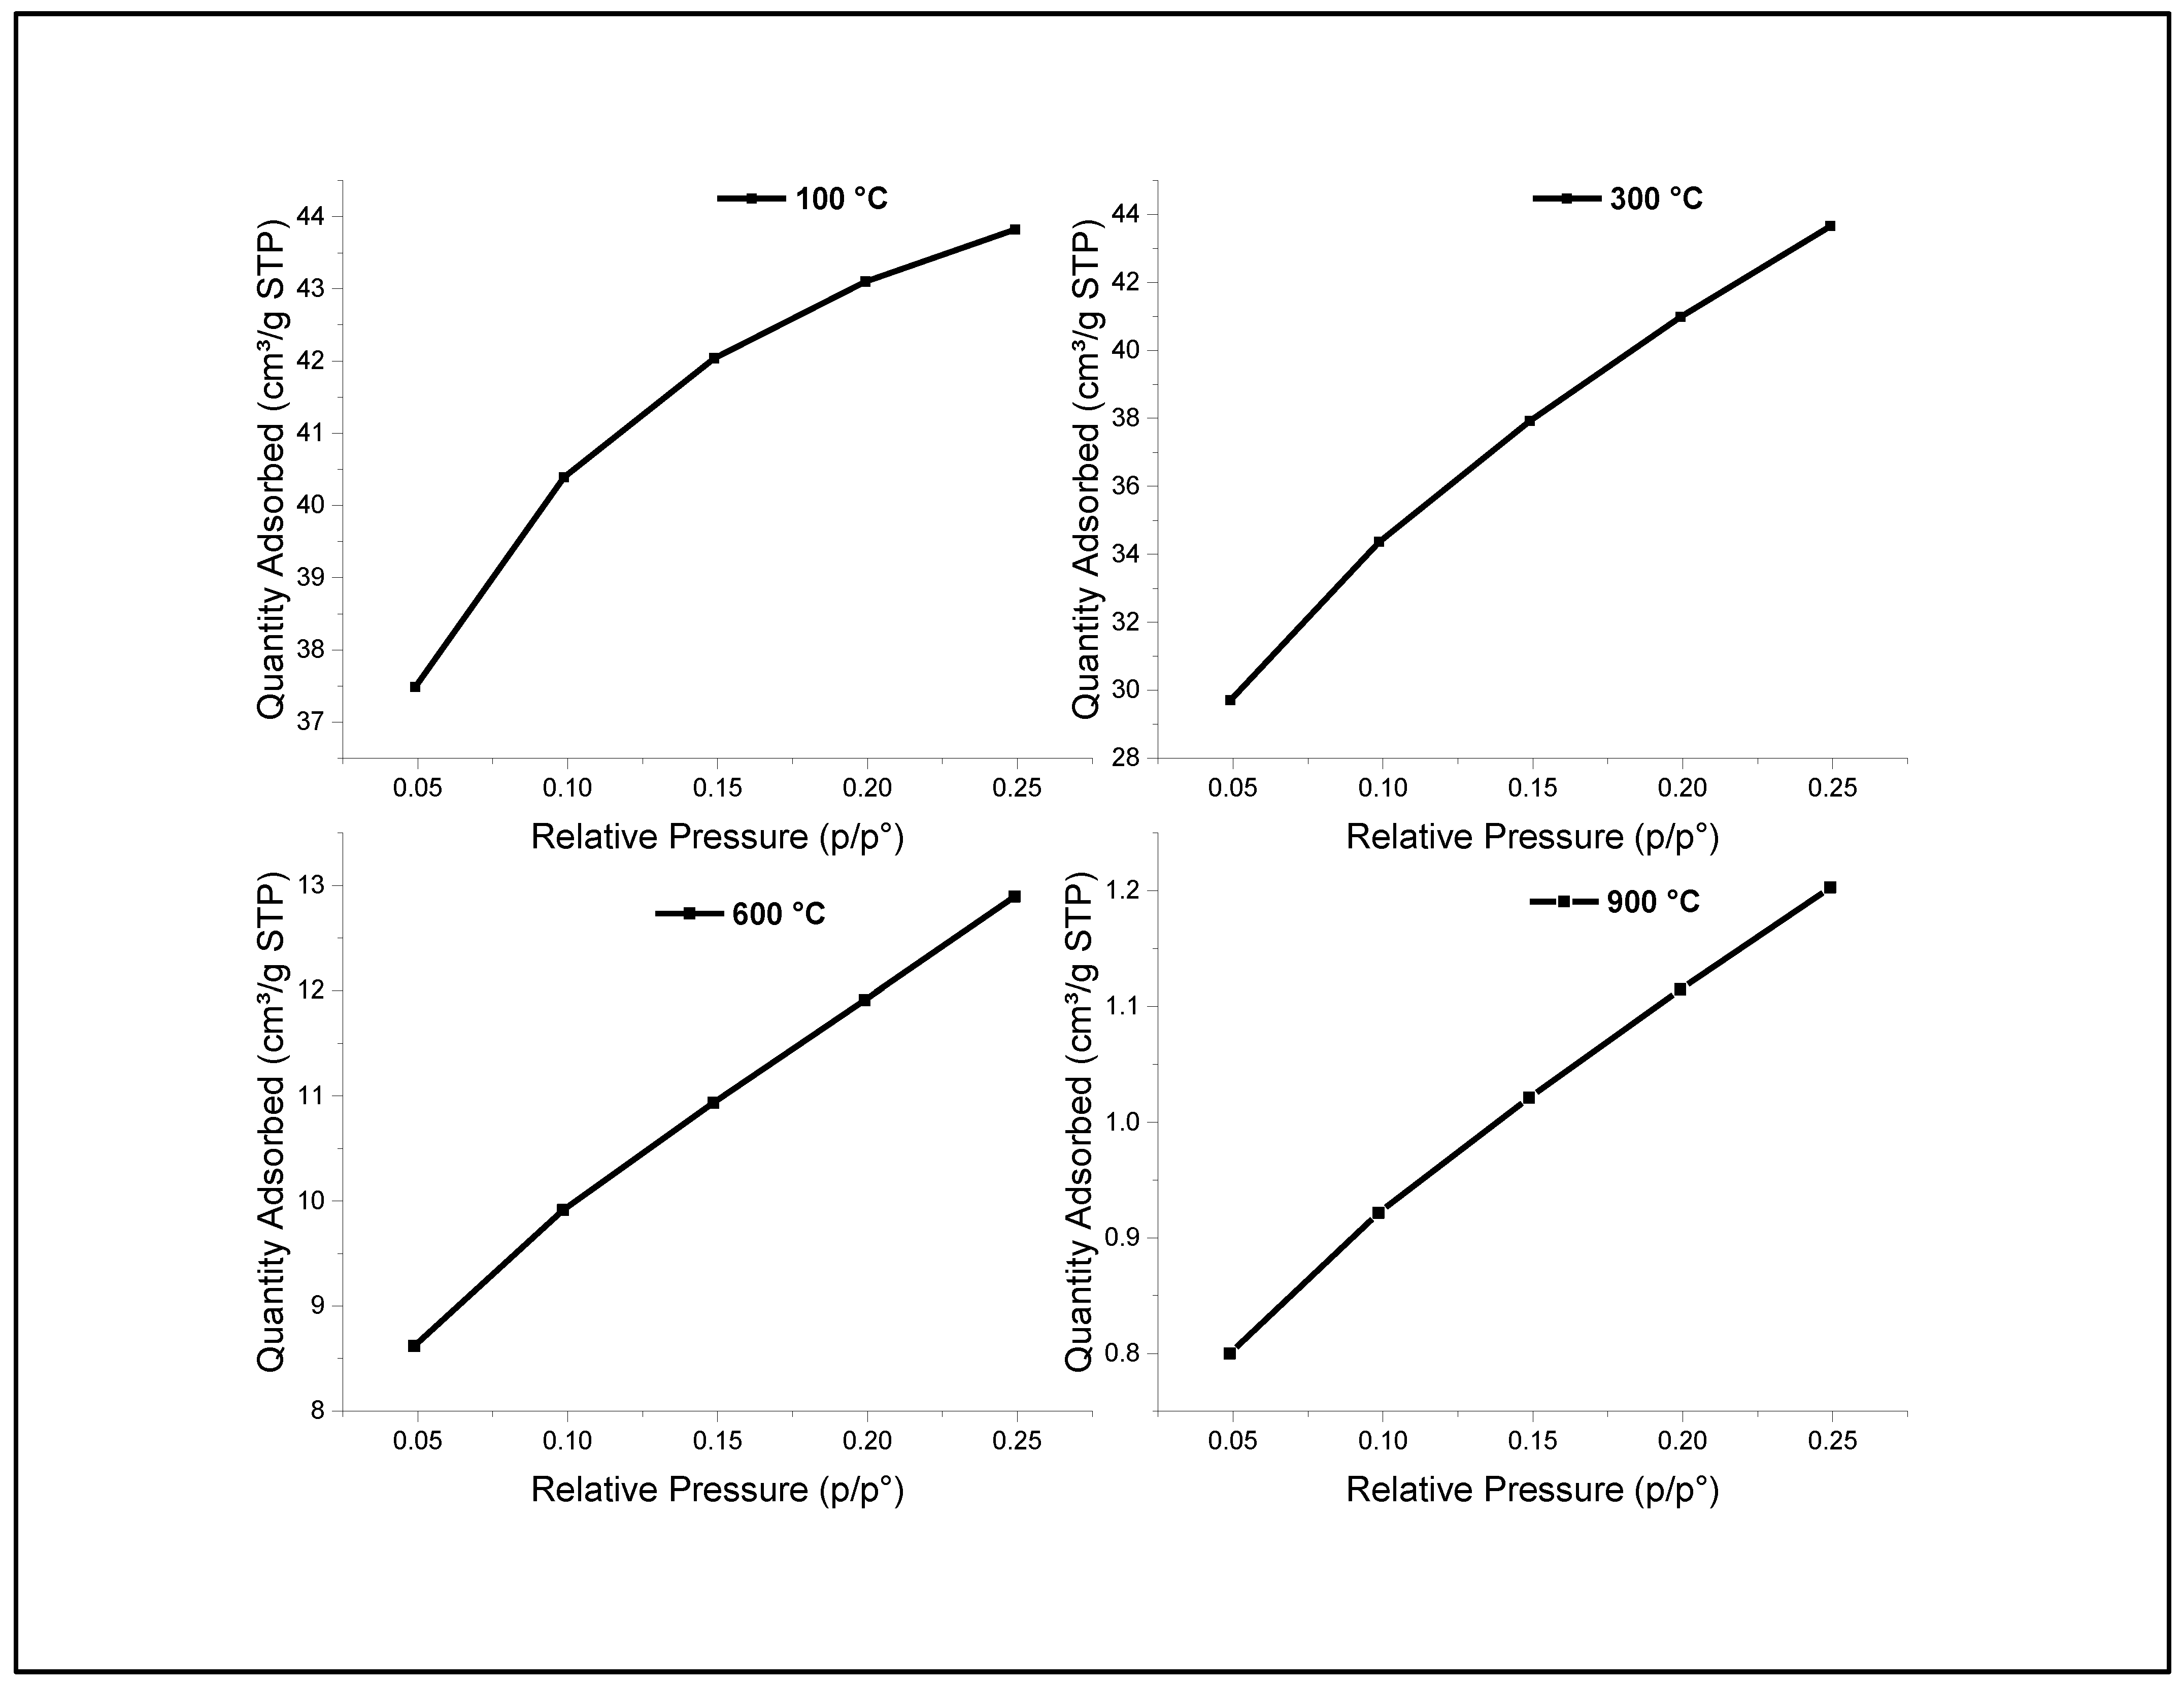
2.2. Surface Area and Pore Size Distribution
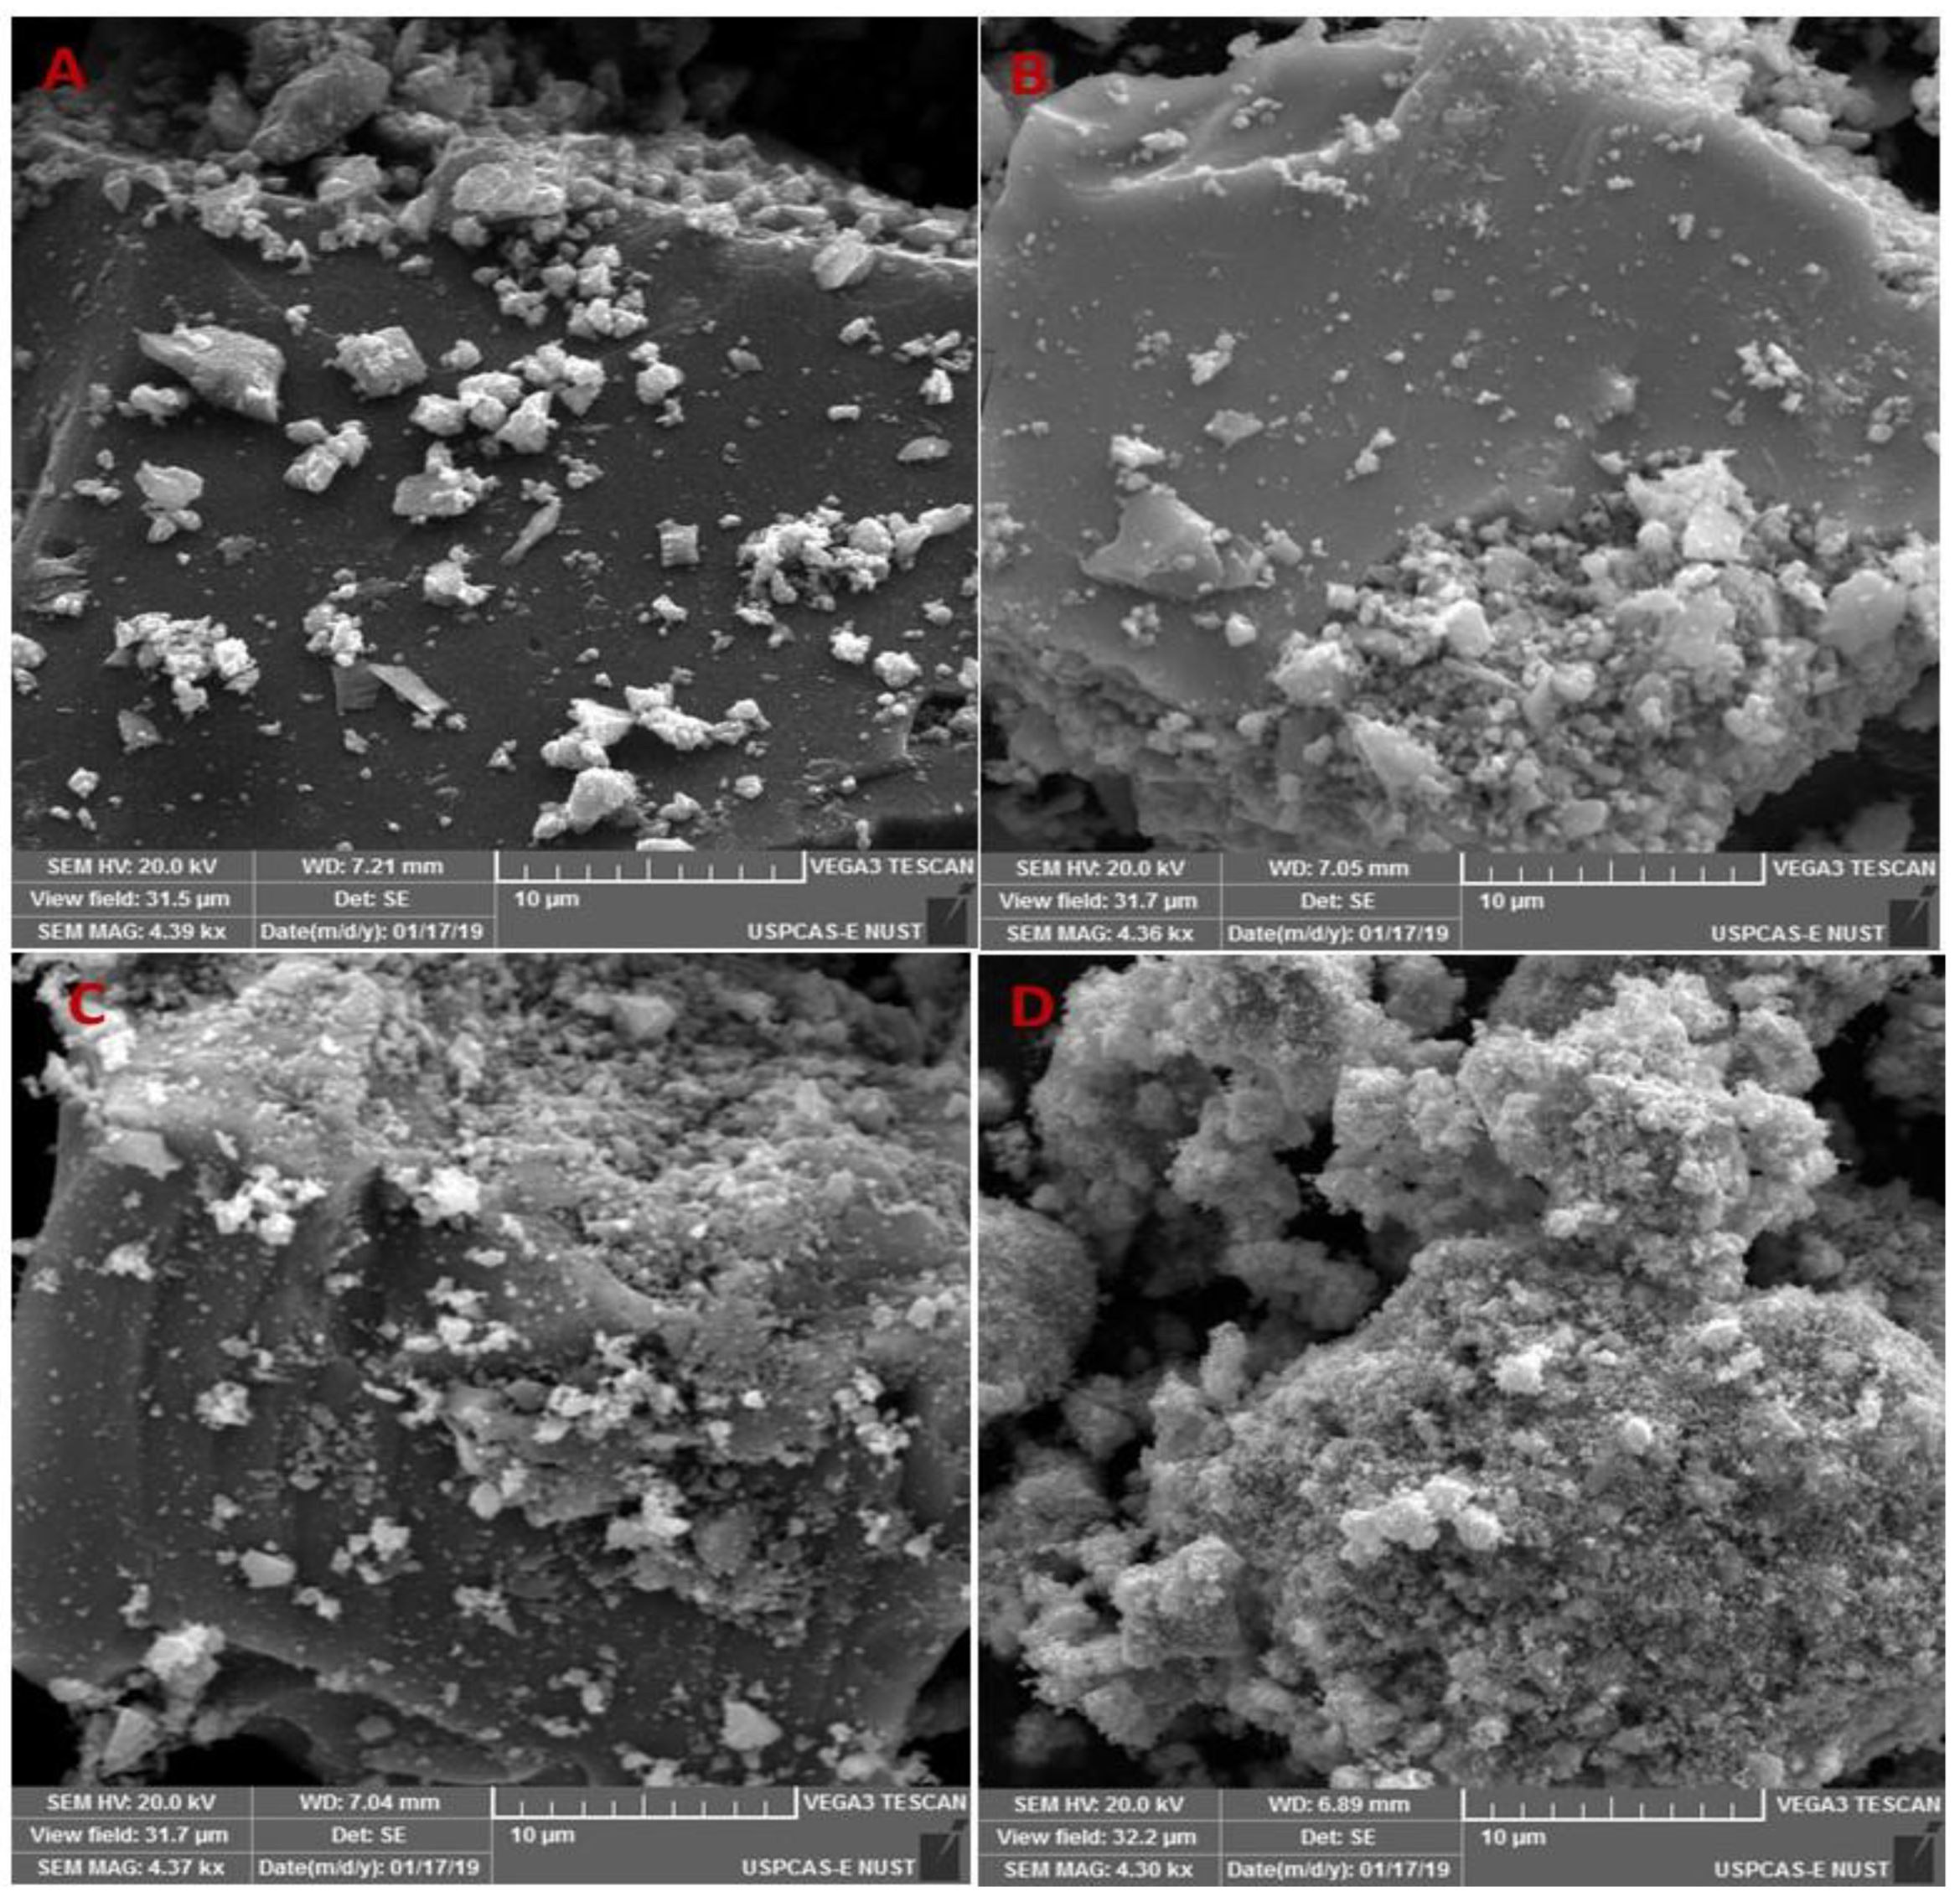
The surface area and the pore size distribution of the synthesized SnO2 NPs were determined by the BJH and BET methods based on N2 adsorption–desorption data. The N2 adsorption experiment was carried out at 760.00 mmHg and the obtained linear N2 adsorption plots of SnO2 NPs, calcined at different temperatures, are presented in Figure 2. The plots show that the adsorption capacity of the NPs decreases with the increasing calcination temperature. The adsorption in the case of SnO2 NPs calcined at 100 °C tending toward equilibrium might be due to the smaller pore size, while those in the case of the sample calcined at 300 °C are due to the larger pore size, whereas the adsorption capacity of the SnO2 NPs calcined at 600 °C and 900 °C is gradually decreased.
The surface area and porous parameters (volume and size) were calculated, as listed in Table 1. These data show that the surface area decreases with the elevation in calcination temperature while the pore size and the pore-volume increase when the temperature rises from 100 to 300 °C. Thus, the SnO2 NPs are converted from microporous to mesoporous. Further, the rise in calcination temperature shows a slight decrease in the porous parameter. The initial increase is due to the loss of water molecules followed by a decrease, which is due to the growth and rearrangement of SnO2 crystallite-induced collapse of the crystal structure [28]. The shrinkage of the surface area is due to the increase in the crystallite size of the SnO2 NPs.

2.3. SEM Analysis

SEM analysis was performed to explore the effects of calcination temperature on the morphology of SnO2 NPs. SEM micrographs of SnO2 NPs calcined at 100, 300, 600 and 900 °C reveal significant morphological changes with elevating calcination temperatures (Figure 3A–D). These changes may be explained by the phenomena of coarsening, coalescence, and fragmentation, which occur with increasing temperature. Indeed, smaller, and irregular-shaped particles are observable at 100 °C (Figure 3A). At this temperature, the nucleation rate is more likely higher than the growth rate, producing very small, nucleated particles with a considerably lower growth rate [29]. The particles become agglomerated (the formation of a compact solid structure with a significant increase in particle size, thickness, and density) when the calcination temperature raise to 300 °C (Figure 3B). This increase in particles size (PS) can be accredited to the dehydration, concurrent nucleation, and rapid growth of the particles. Resultantly, this simultaneous nucleation and growth produces a wide particle size distribution (PSD). When the calcination temperature is elevated up to 600 °C, some gaps are seen on the surface of the compact solid nanostructure (Figure 3C). These gaps occur because of cracks that occurred at this relatively high temperature. When the temperature reached to 900 °C, the previous structure is almost denatured and new particles with small size and rough surface are formed (Figure 3D).
Overall, as the calcination temperature increases, the continuous agglomeration of the particles will occur, and the rapid growth of the particles will take place after the termination of agglomeration. Consequently, the pores of the material b trapped at high calcination temperature proceeding shrinkage.

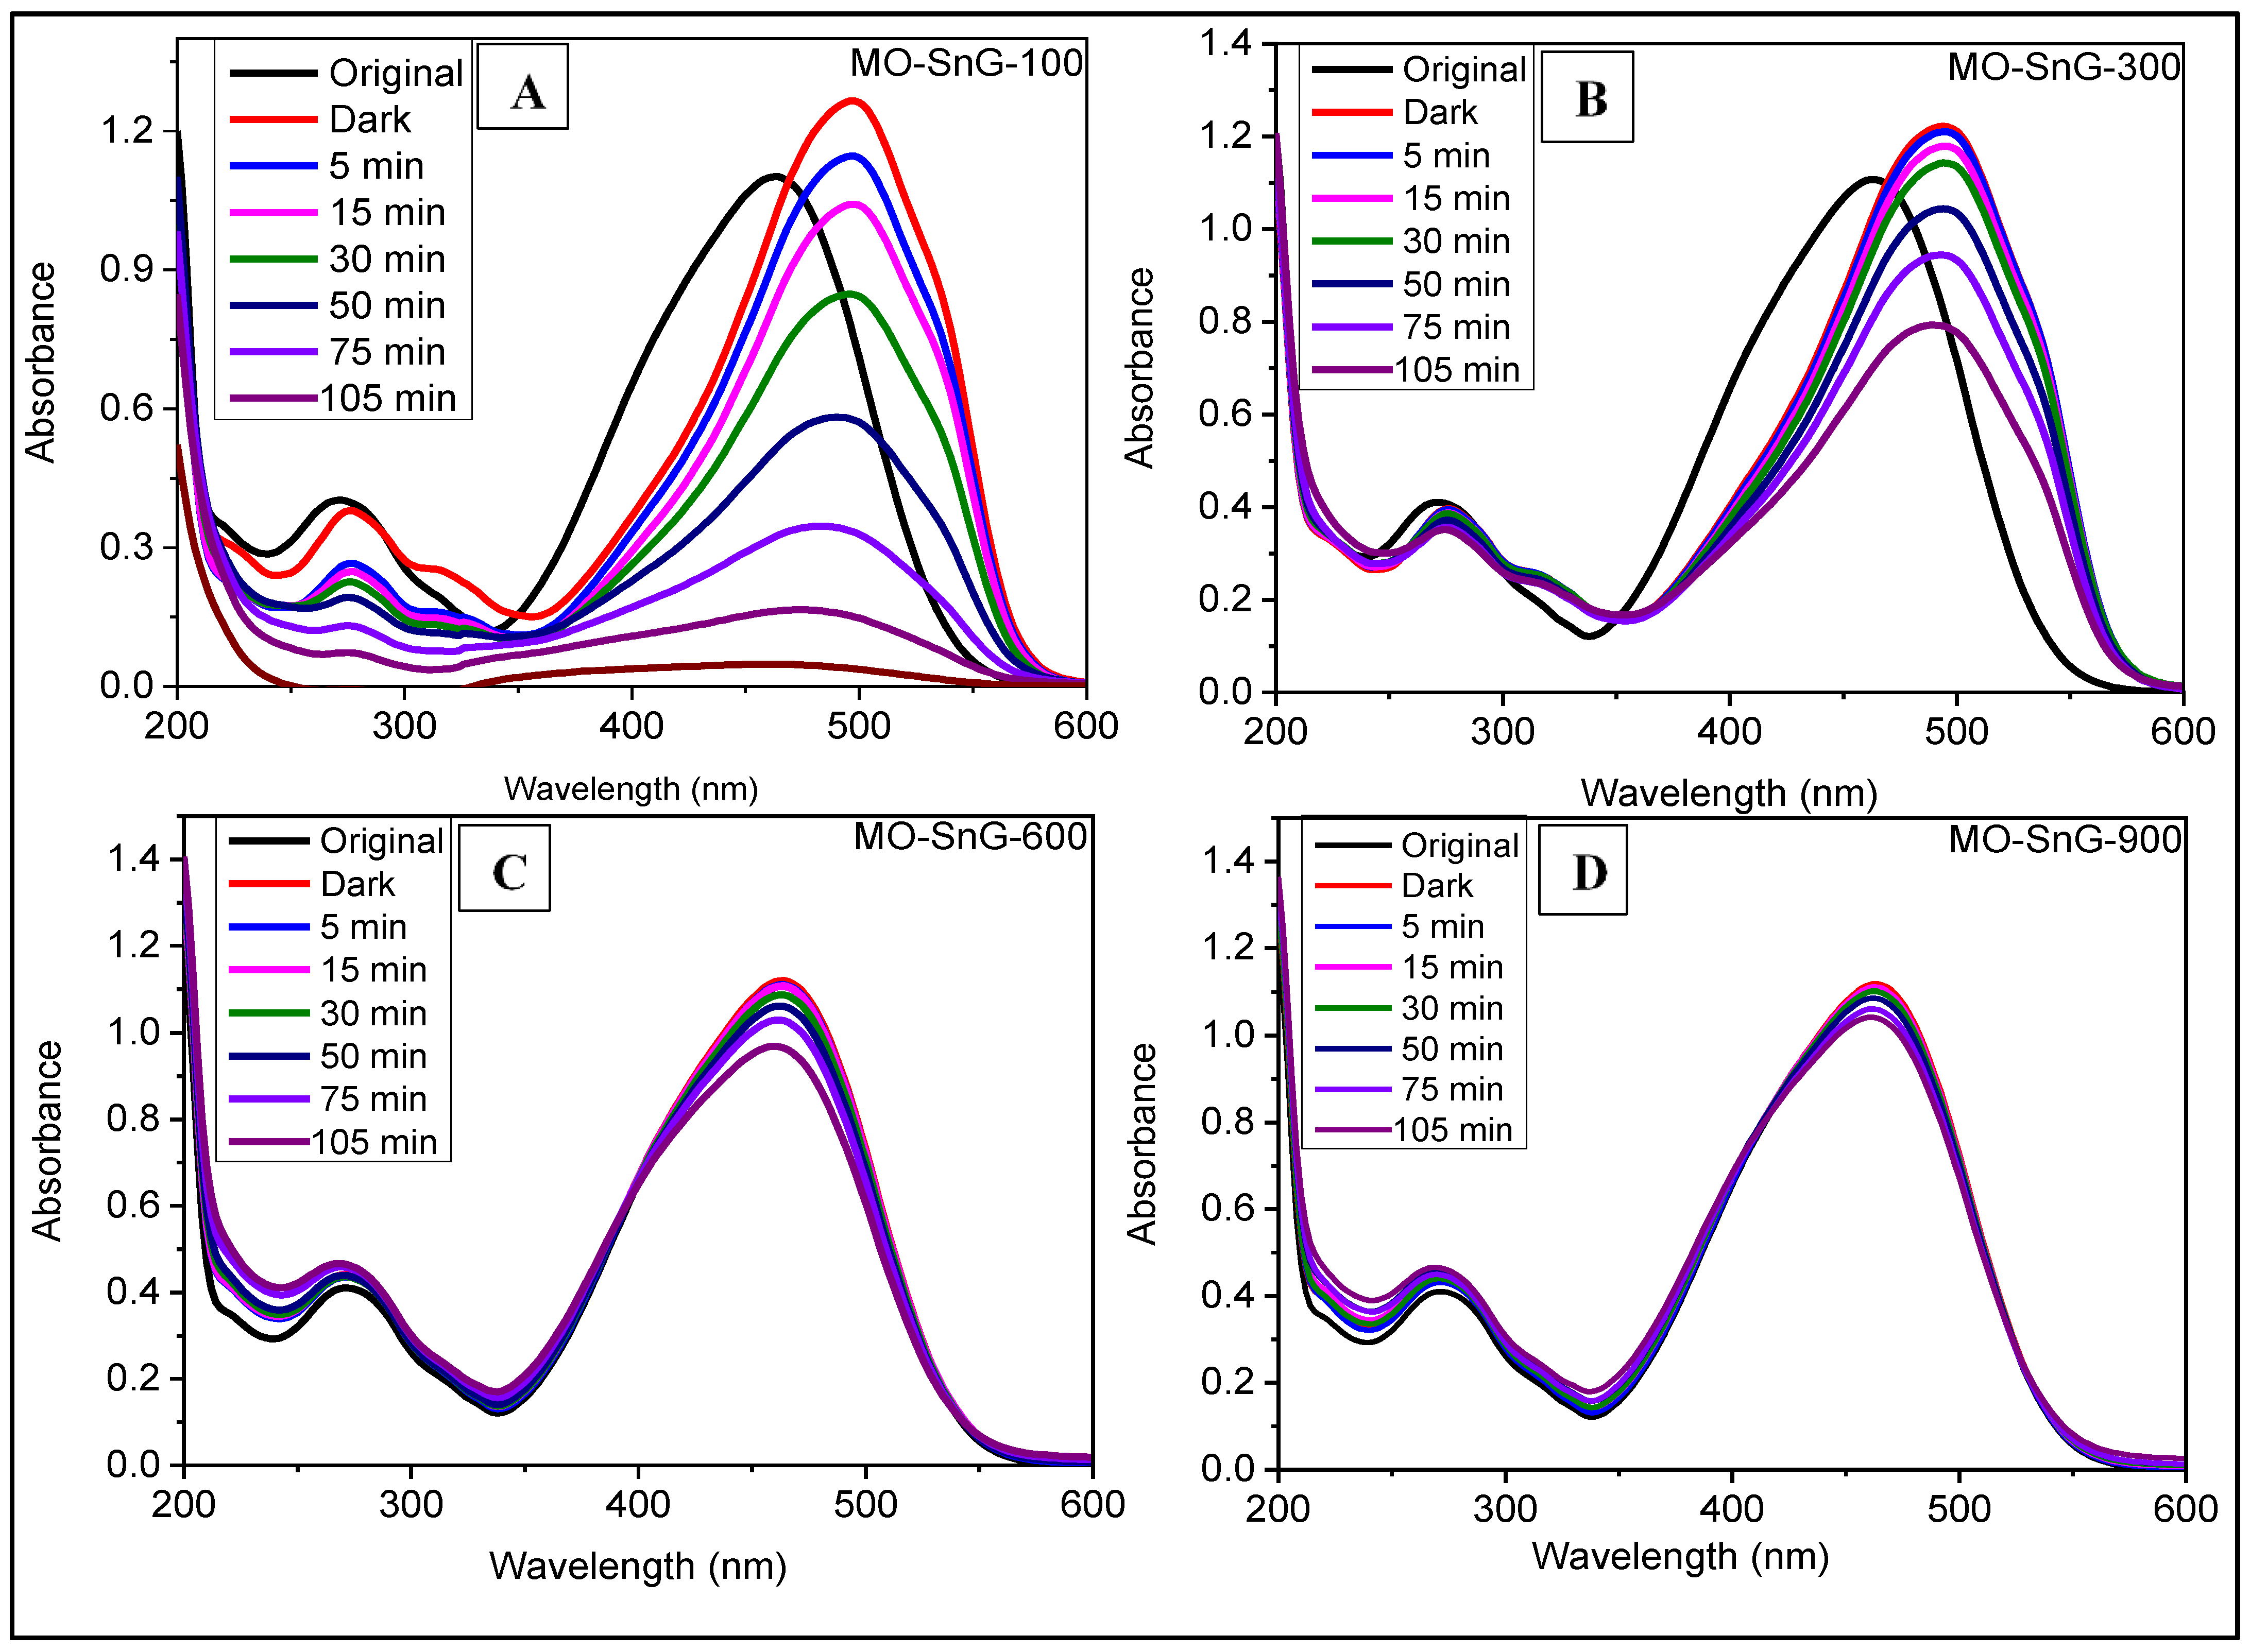
2.4. UV–Vis DRS Analysis

The UV–Vis DRS spectra of all calcined samples of SnO2 NPs fabricated via green method are represented in Figure 4. In accordance with the previous results, the sharp rising portion in the UV–Vis curve was aligned with the x-axis of the DRS spectrum to calculate the wavelength of the transmittance edge [30]. The transmittance edges, obtained for SnO2 NPs calcined at 100, 300, 600, and 900 °C, are 387.82, 368.84, 431.42 and 376.19 nm, respectively, suggesting that the all the samples show maximum absorbance in visible range. Moving toward higher wavelengths, a sudden decrease was observed in the absorbance of the samples. A small, broad band centered at 445 nm was seen in the spectra of SnO2 calcined at 100 °C, which may be due to the presence of an unknown crystal phase, which was detected during XRD analysis. The increase in absorbance beyond 500 nm in the case of SnO2 NPs calcined at 600 and 900 nm may be due to the calcination temperature-mediated cracks that visible in the SEM samples.
Upon comparing the optical and structural properties of the SnO2 NPs calcined at different temperatures, an alternate blue and red shift was observed with increasing calcination. When the calcination increased from 100 °C to 300 °C, a blue shift was seen in the absorbance edge. At 300 °C, the dehydration occurred, leading to the formation of a compact structure where maximum absorption or minimum reflectance of light is expected. A subsequent red shift for SnO2 NPs calcined at 600 °C might be due to the degeneration/infringement of the compact structure that might enhance the transmittance of light. The absorbance edge for the SnO2 NPs calcined at 900 °C was seen at a lower wavelength than that observed for the sample calcined at 600 °C. This might be due to the rearrangement of small particles, leading to the formation of a bit larger particles with a rough surface and a larger surface defect.
The as-calculated band gap energy values via Tauc’s plot are 3.70, 3.72, 3.38, and 3.55 eV for the SnO2 NPs calcined at 100, 300, 600, and 900 °C (Figure 4). The initial slight increase in the band gap with the elevation in temperature from 100 to 300 °C is attributed the phase transition from unknown crystal system to tetragonal crystal phase [30]. The significant decrease occurred in the band gap at 600 °C could be ascribed to the complete dehydration and formation of a compact large size solid structure. The slight increase in the band gap at 900 °C, is more likely due to the small size of particles formation due to cracking compact solid into small particles.

2.5. FTIR Analysis

The FTIR spectrum of the biosynthesized SnO2 NPs, shown in Figure 5, reveals a broadband in the range 3189–3518 cm−1 and another band at 1620.65 cm−1 attributed to water molecules stretching and bending vibrations [18]. The intensity of these bands is reduced on elevating calcination temperature suggesting the removal of water molecules (dehydration). The set of peaks ranging from 1247 to 922 cm−1 in the spectra SnO2 NPs calcined at 100 and 300 °C are attributed to vibrations of the hydroxyl-tin bonds [20]. Peaks also disappeared at higher calcination temperature due to the condensation of Sn(OH)2 to SnO2. The peaks seen at 663.90 cm−1 and 575.09 cm−1 are ought to the O-Sn-O and the terminal Sn-OH vibration correspondingly [31]. The reduced intensity of the FTIR peaks at 3189–3518 cm−1, 1620.65 cm−1 and 1247 to 922 cm−1 at higher calcination temperatures suggests that an evaporation of water molecules and condensation tin hydroxide [16].

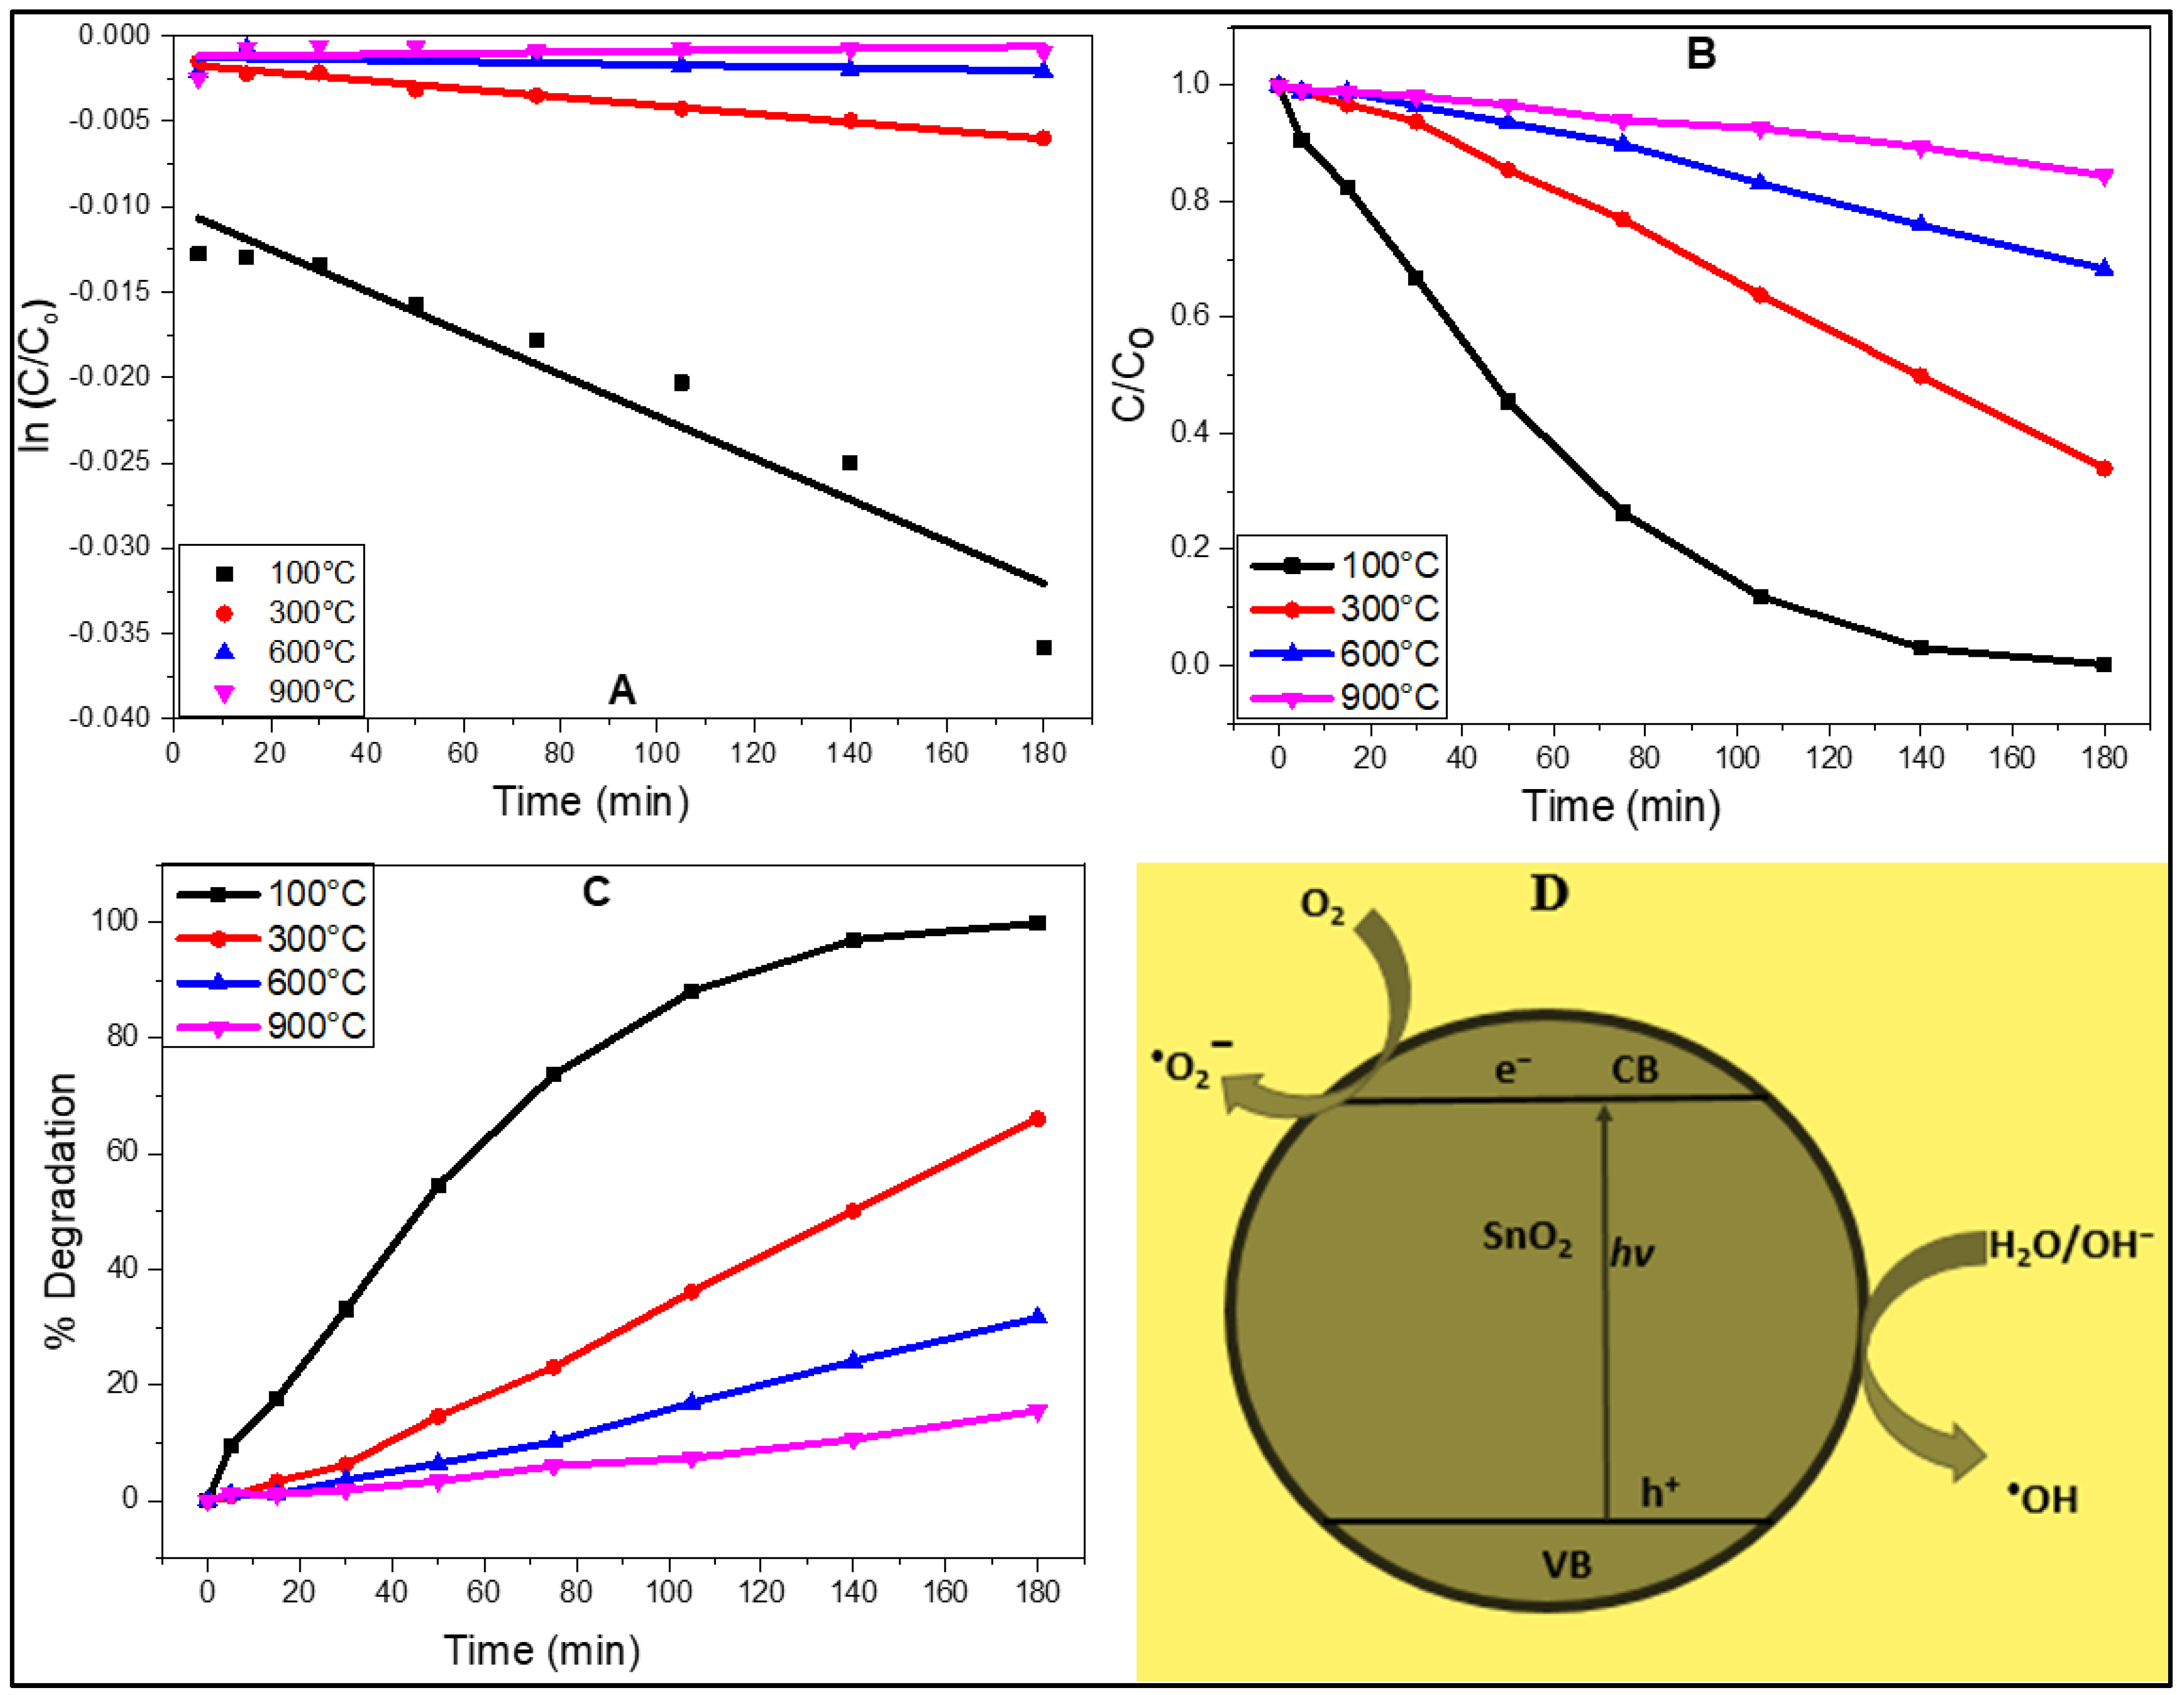
2.6. Photocatalytic Activity and Underlying Mechanism

The photocatalytic performance of SnO2 NPs toward MO was investigated across the entire light spectrum (Figure 6). An aqueous solution of 15 ppm of MO was prepared, and 50 mL from this solution was transferred to the reaction tank, along with 20 mg of the catalyst (0.4 g/L). To attain the adsorption–desorption equilibrium, this reaction mixture was stirred for 30 min in the dark. The reaction was monitored by UV–Vis spectrophotometer where λ-max of MO was revealed at 464 nm. At different time points (i.e., 5, 15, 30, 50, 75, 105 and 140 min), the clear liquid samples calcined at 100 °C were examined spectrophotometrically and a decrease in λ-max was noted as a function of time. The same experiment was repeated for the mineralization of the MO with SnO2 NPs calcined at 300, 600 and 900 °C. After the dark test of 30 min, a clear red shift was noticed in the λ-max of MO in the presence of SnO2 NPs calcined at 100 °C. The λ-max shifted to a higher wavelength (500 nm) and became more intense, as shown in Figure 6A. This red-shift is assigned to the hydroxyl radical incorporated at the ortho-position in the benzene ring associating with the dimethylamine group of the MO. The internal hydrogen bond could be formed in this structure, which favors the delocalization of the conjugated π-electrons, the symmetry and stability of the intermediate molecule, consequently decreasing the polarity of the intermediate molecule [23]. The shift was seen to be slightly decreased with the elevation in calcination temperature up to 300 °C (Figure 6B), whereas no such shift was observed in the MO solution treated with SnO2 NPs calcined at 600 °C (Figure 6C) and 900 °C (Figure 6D). This might be due to decrease in the quantity of hydroxyl moiety with increasing calcination temperature as shown in FTIR spectra (Figure 5).
The color solution was constantly observed, which became padded with the progression of time up to 105 min, suggesting the gradual degradation of the chromophore responsible for absorbance. The degradation parameters were calculated by applying mathematical equations (Figure 7A–C) and a model of photocatalytic degradation is proposed (Figure 7D).
The kinetic study of the photocatalytic reaction was carried out on applying the Langmuir Hinshelwood kinetic model (Equation (1)) and the straight line was obtained when ln(C/Co) was plotted against time (t), suggesting that the reaction follows pseudo first order kinetics [32]. The degradation rate constant (k) was found to be 0.2, 0.004, 0.0011 and 0.001 min−1 for the photocatalytic reaction carried out in the presence of SnO2 NPs calcined at 100, 300, 600 and 900 °C, respectively (Figure 7A).
ln C C o = kt
The plots (C/Co vs. time) reveal a successive decrease in the absorbance with increasing time duration, strongly suggesting the degradation of MO molecules (Figure 7B). It was seen that the light absorbance capacity of the solution was higher with increasing calcination temperature, which demonstrates that the photocatalytic efficacy of SnO2 NPs decreases with the increase in temperature.
The percentage degradation determined by Equation (2), shows that 99.85, 66.04, 31.64 and 15.54% of MO was degraded by SnO2 NPs calcined at 100, 300, 600 and 900 °C, respectively (Figure 7C). The drastic decrease was seen in the percentage degradation of MO with an elevating calcination temperature up to 900 °C.
%   degradation = C o C e C o × 100
The photocatalytic reaction mechanism depends on the band gap energy of the catalyst and light energy or wavelength. Mostly, semiconductors are used as catalysts which sensitize the irradiations of the redox process (light-simulated) because of their electronic structure, characterized by a vacant conduction band and filled valence band [33]. When the photon of equal or greater energy than the band gap energy of the semiconductor hits its surface, the valence band electrons are perturbed and are shifted towards the conduction band [15]. The donor molecules become oxidized by the holes left in the valence band which resultantly react with the water molecules to generate hydroxyl radicals. The stronger oxidizing ability of these radicals brings about the mineralization of MO [1]. The conduction band electrons produce superoxide ions on reaction with oxygen species, thereby inducing redox reactions. These electrons and holes produce the necessary products after sequential oxidation and reduction reactions with the specie adsorbed on the semiconductor surface [34].

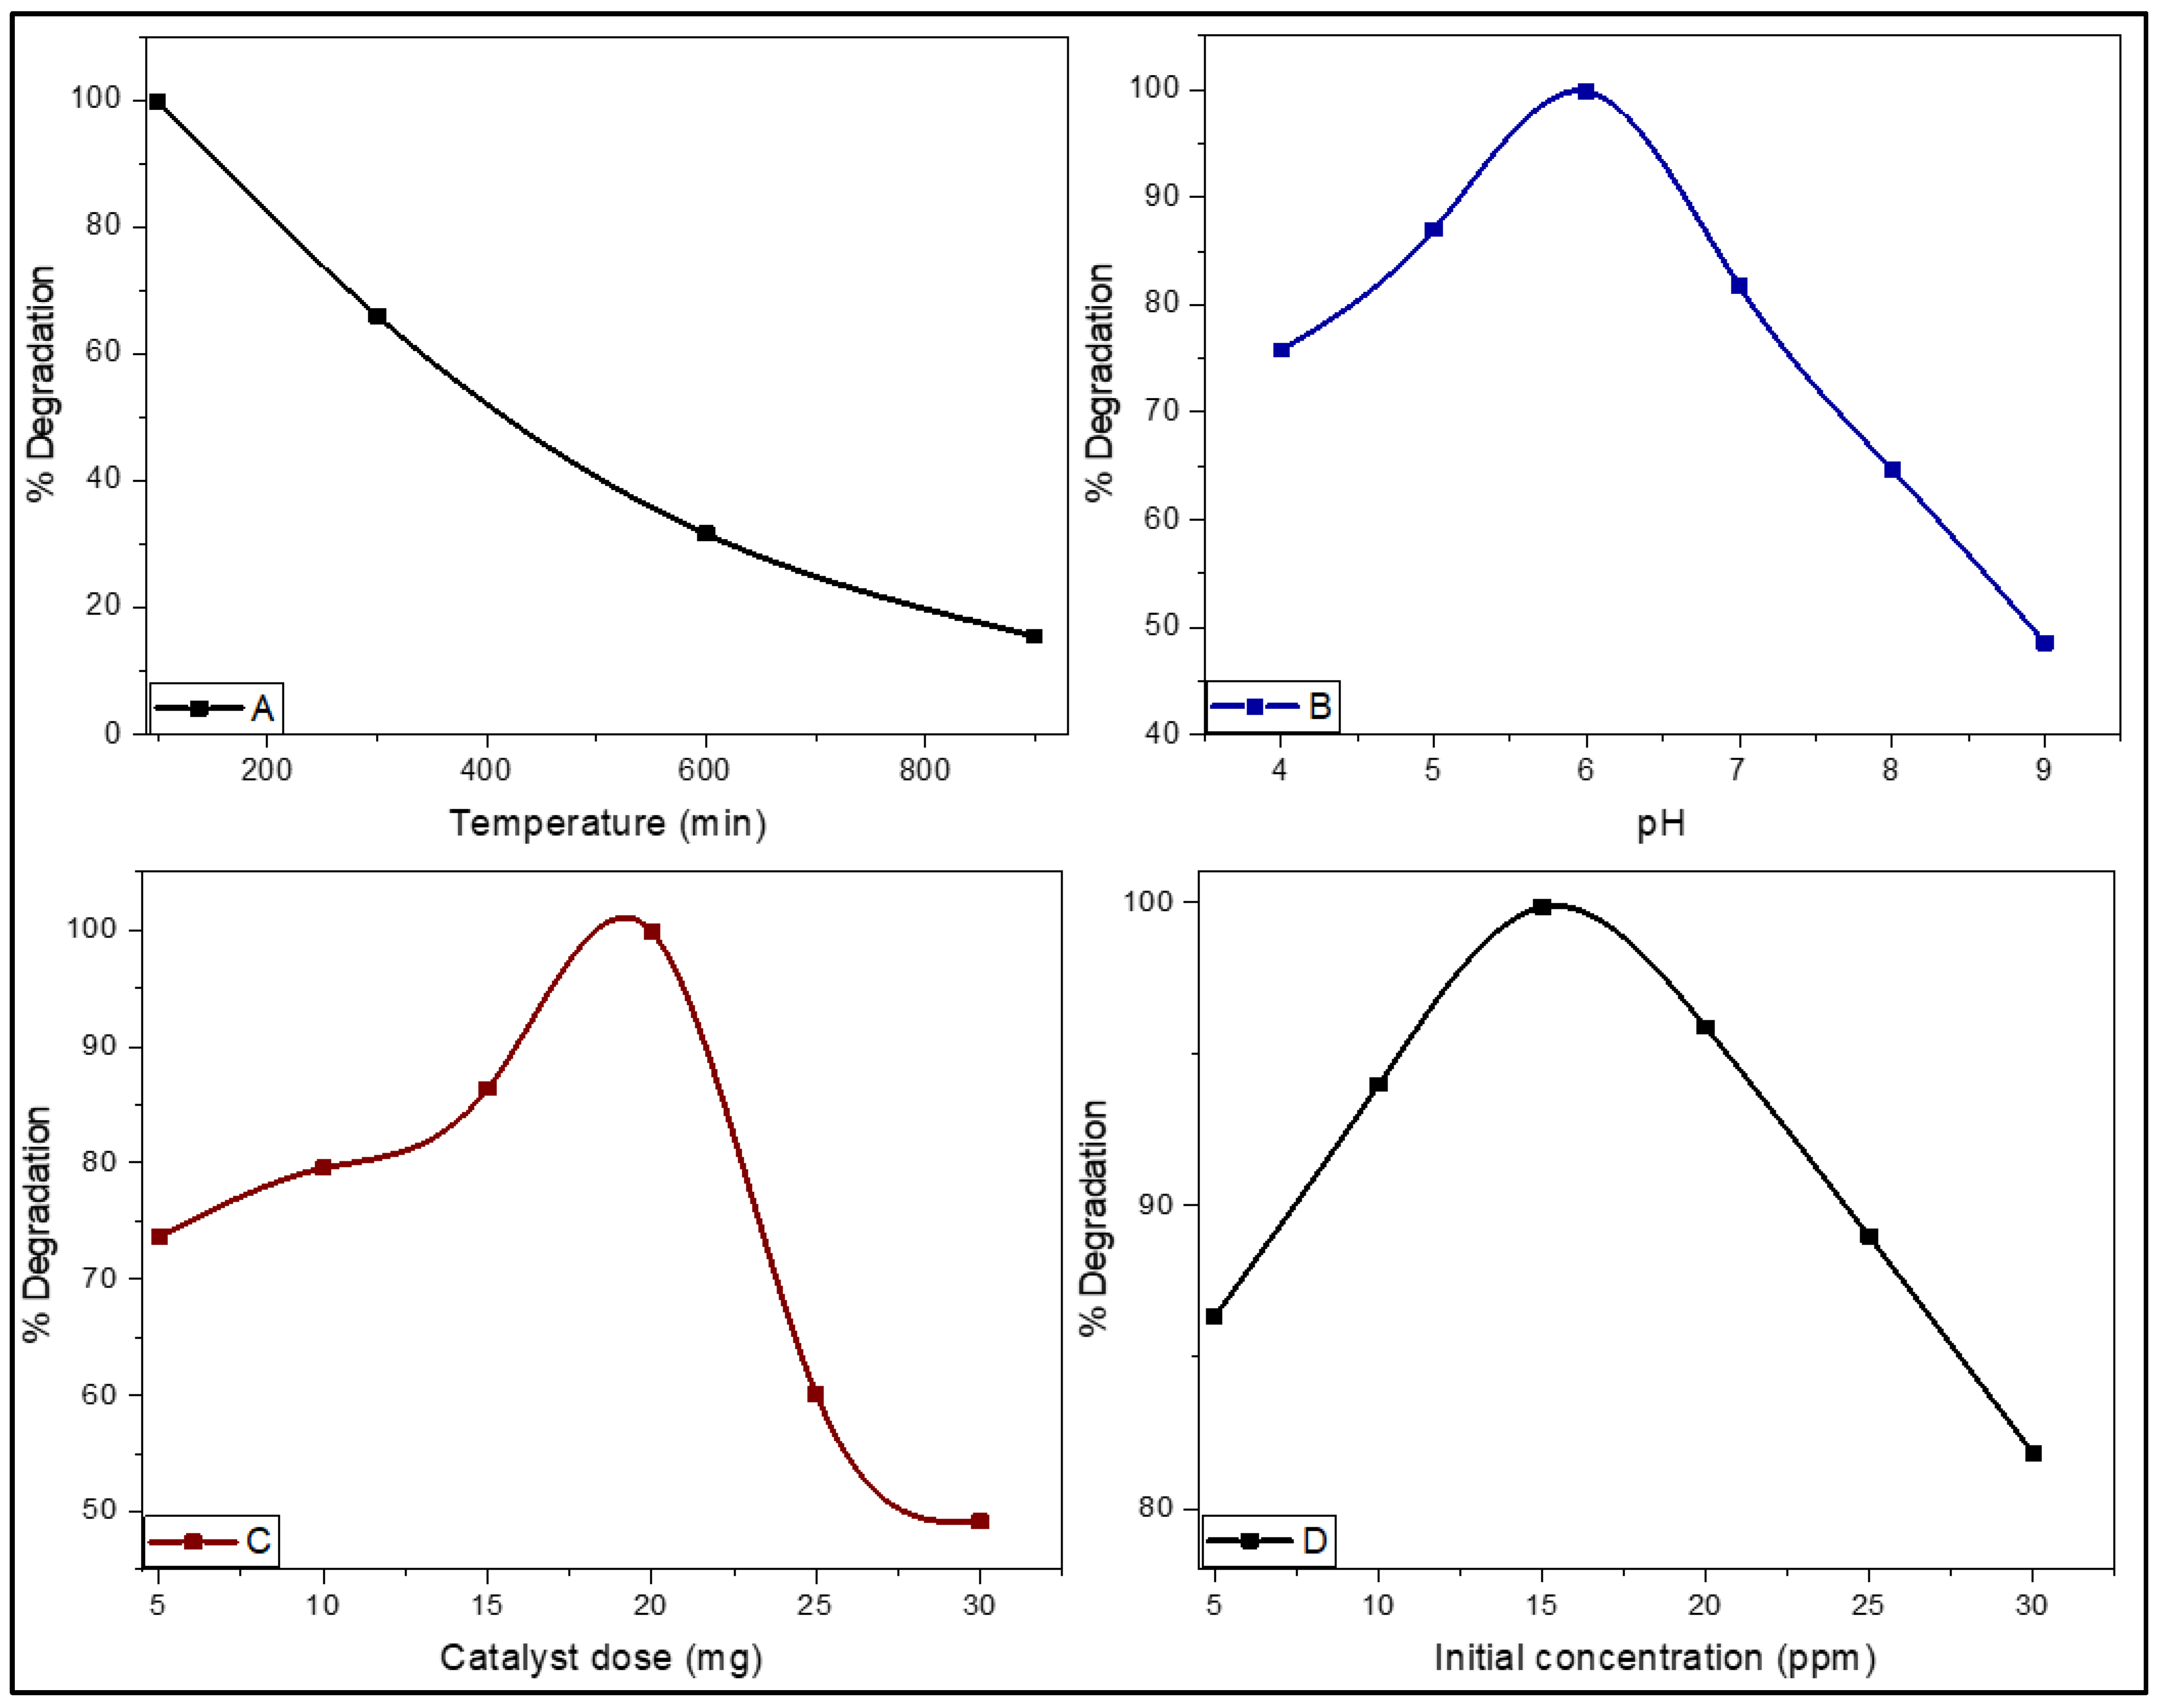
2.6.1. Factors Affecting the Photocatalytic Activity

Photocatalytic efficiency is considerably affected by the initial concentration, pH, catalyst dose and the annealing temperature (Figure 8A–D). In this study, the photocatalytic activity of SnO2 NPs that were calcined at 100 °C (optimal temperature) was investigated under the effect of the catalyst dose, initial MO concentration, and the pH (Figure 8B–D). We found that the optimal conditions for efficient photocatalytic activity of the greenly synthesized SnO2 NPs are 100 °C, pH = 6, catalyst dose = 15 mg, and initial MO concentration = 15 ppm.

Effect of pH

The percentage degradation capacity of SnO2 NPs on the degradation of the MO was examined at pH ranging from 4 to 9 while keeping all other optimal reaction conditions constant (Figure 8B). Initially the percentage degradation increases with increasing pH up to pH 6, but a further increase in pH decreases the degradation rate. Thus, the results showed that the optimum degradation is obtained at pH 6. This phenomenon can be elucidated on the basis of the surface properties of the adsorbate and the adsorbent [35]. The percentage degradation is correspondingly higher in the acidic media with respect to the alkaline medium. The organic compound reacts with the dissolved oxygen in the solution under sunlight and becomes dissociated into radicals in the acidic medium, thus accelerating the photo-oxidation. The charges of the particle surface are changed by the pH, resulting in the disperse condition. At a pH close to 6, the agglomeration of particles is not easy due to the Van Der Waals force because there is no surface charge on the SnO2 that benefits the disperse. Therefore, at pH 6 the mineralization efficiency is maximum [36].

Effect of Photocatalysts Dosage

The photocatalytic effect of SnO2 NPs on MO was investigated by varying the quantity of SnO2 NPs (i.e., 5, 10, 15 20, 25 and 30 mg) while keeping all other optimal reaction conditions constant (Figure 8C). The results infer that mineralization of MO enhances with the increase in the quantity of the catalyst. Fifteen milligrams were found to be the quantity of catalyst for optimal photocatalysis. The increasing tendency lowers gradually when the catalyst dose increased from 15 mg. The reason behind this phenomenon lies on the fact that increasing the catalyst amount enhances the number of active centers and the absorbed photon, consequently enhancing the photocatalytic activity, whereas the dosage higher than 15 mg of the catalyst causes the light blockage and subsequently affects the photocatalytic efficacy [36].

Effect of Initial Concentration of MO

Various concentrations of MO solution (i.e., 5, 10, 15, 20, 25 and 30 ppm) were exposed to SnO2 NPs to check the photocatalytic activity while keeping all other optimal reaction conditions constant (Figure 8D). The results indicated that the initial concentration of the dye significantly affects the photocatalytic activity of NPs. The maximum photocatalytic activity was obtained with the 15-ppm solution of MO whereas a gradual decrease was seen when the initial concentration was increased beyond 15 ppm. The basic reason for this gradual increase is certainly due to the greater interaction of MO molecules with the penetrating light. The subsequent decrease in the photocatalytic activity with the increasing initial concentration is due to the blockage of light. Thus, the SnO2 NPs surface was exposed to a limited number of low-intensity light radiations, and a smaller number of electrons will be consequently excited on the conduction band. Ultimately, fewer hydroxyl radicals will be generated to degrade MO [37].

3. Materials and Methods

3.1. Reagents

The analytical grade chemicals, including tin chloride pentahydrates, sodium hydroxide and methyl orange (Sigma–Aldrich, St. Louis, MO, USA) were used without any further purification. All the working solutions were prepared using deionized water.

3.2. Plant

The leaves of B. wallichiana were amassed from village of Parshali, Buner district, Pakistan, and the taxonomic identification of the plant (voucher # BW22PB) was made in the Department of Botany, University of Azad Jammu and Kashmir, Muzaffarabad, Pakistan, by an experienced herbalist.

3.3. Preparation of the Plant Extract

The amassed leaves of B. wallichiana were thoroughly washed using deionized water to expunge the dust particles and were subsequently shade dried. Then, 50 g of the dried leaves were introduced to 1000 mL boiled deionized water in an airtight jar and left for 6 h. The resulting light-green crude extract was filtrated and centrifuged at a speed of 4000 rpm to draw out suspended impurities. The upper layer was stored at 4 °C for further experiment.

3.4. Green Synthesis of SnO2 NPs

Green synthesis of SnO2 NPs was inspired by a previous published protocol [24]. 5 mM stock solution of SnO2 NPs was prepared by using 1.75 g of SnCl4·5H2O dissolved in distilled water, and 50 mL of this solution was combined with 20 mL of the as-formulated extract. The reaction mixture was heated to 50 °C and mixed for 30 min at 300 rpm to form a light-green gel, which was then aged at room temperature for 12 h. The well-stilled solid product was thoroughly washed using deionized water and dried at 100 °C. The ultimate product was calcined at 300, 600 and 900 °C in a muffle oven and stored in a polythene bottle.

3.5. Physicochemical Characterizations

3.5.1. BET/BJH

The N2 adsorption/desorption experiment of the greenly prepared SnO2 NPs was carried out by running GeminiVII2390i (Micromeritics Instrument Corp., Norcross, GA, USA) in which the sample was de-gassed at 200 °C for 16 h under vacuum. Further, the textural parameters viz surface area and the pore sizes were estimated using the BJH and BET methods [38]. BET is used to determine the surface area of the sample while the BJH method is used to determine the pore volume distribution in the mesopore range [39].

3.5.2. XRD, SEM, UV–Vis, and FTIR

XRD is a widely used non-destructive method to assess the crystallinity and structure of solid samples [13,14,15,39,40]. The fluctuations of crystallographic properties with calcination temperature were scrutinized by using XRD Panalytical X-pert Pro (PANanalytical B.V., EA Almelo, The Netherlands) that was operated at 2-theta (20°–80°). The Debye–Scherrer equation was applied on consideration of width at the half maxima to articulate the crystallite sizes.
SEM is a high-resolution surface imaging method in which the incident electron beam scans across the sample surface and interacts with the sample to generate backscattered and secondary electrons that are used to create an image of the sample surface microarchitecture [13,14,15,17,18]. The morphology of the prepared SnO2 NPs was analyzed via SEM model 5910 (JEOL, Tokyo, Japan).
To study the optical behavior of the SnO2 NPs, UV–Vis DRS model Lambda 950 (PerkinElmer, Waltham, MA, USA), was operated in the range of 400–1000 nm [30]. The band gap calculation was performed from the obtained data by using Tauc’s plot [16].
FTIR is an instrumental technique used to identify the chemical bonds present in organic and inorganic compounds by measuring their absorption of infrared radiation over a range of wavelengths [13,14,15,17,18]. FTIR analysis was performed in the range of 400–4000 cm−1 using Nicolet 6700 (ThermoFisher Instruments, Waltham, MA, USA) apparatus to recognize the functional groups present in SnO2 NPs calcined in various temperatures (range of 100–900 °C). The shift in λ-max of MO and absorbance intensity were recorded by the double beam UV–Vis spectrophotometer model Unicam UV500 (Thermo Spectronic, Rochester, NY, USA) during the photocatalytic degradation.

3.5.3. Photocatalytic Assay

Using a solar light lamp (US-800 (250 W)) as a light source, the photocatalytic potency of SnO2 NPs was investigated during the mineralization of MO in aqueous media. The experiment was performed in a double-walled glass reactor using 50 mL of MO solution and 0.02 g of SnO2 NPs (0.4 g/L). The reactor was enclosed in aluminum foil. The adsorption–desorption equilibria were achieved by agitation for 30 min in the dark followed by illumination with the artificial solar light source. Next, 3 mL from the reaction mixture was centrifuged for 5 min at 4000 rpm to remove any suspended particles. Then, the clear sample was examined with the double beam UV–Vis spectrophotometer model Unicam UV500 (Thermo Spectronic, Rochester, NY, USA), and the decrease in λ-max was recorded as a function of time. The effect of initial MO concentration, pH, and catalyst dose on the photocatalytic behavior of SnO2 NPs calcined at various temperatures was also checked [41,42].

4. Conclusions

An eco-friendly and un-demanding process was generated for the fabrication of highly crystalline SnO2 NPs. The structural and surface properties were altered with modification of the calcination temperature. The surface area was gradually decreased with the increase in the particle size and with the band gap, which in turn affect the photocatalytic performance of SnO2 NPs. The red shift observed after the dark test was credible to the insertion of hydroxyl radical at the ortho position in benzene ring that is linked with dimethylamine group of methyl orange. The photodegradation of MO was found to increase with increasing irradiation time, however, the drastic decrease was noticed in the photocatalytic efficacy with an elevation in calcination temperature. The optimum photocatalytic activity was experienced with a 15 ppm MO solution treated with 15 mg of catalyst at pH 6 under simulated solar light.

Author Contributions

All the authors have contributed to this manuscript substantially. Conceptualization, Investigation, Project administration, Supervision: S.H., F.M. and W.R.; Methodology, Formal analysis, Software: S.H., F.M., W.R., R.E., N.S., W.A., H.A.A. and S.A.A.; Validation, Visualization, Data curation: S.H., F.M., W.R., S.U.D., M.I.S., M.W., W.A., H.A.A. and S.A.A.; Resources: S.H., F.M., W.R., W.A., H.A.A. and S.A.A.; Writing—original version: S.H., R.E., N.S., S.U.D., M.I.S. and M.W. Writing-revised version: F.M.; Edition, Submission: F.M. All authors have read and agreed to the published version of the manuscript.

Funding

This research received no external funding.

Institutional Review Board Statement

Not applicable.

Data Availability Statement

Data sharing upon request to the corresponding authors.

Acknowledgments

We thank University of Azad Jammu and Kashmir, Muzaffarabad for its support and lab core facilities. We also thank California Innovations Corp. for optical characterizations expertise and data validation.

Conflicts of Interest

The authors declare no conflict of interest.

References

  1. Haq, S.; Shoukat, S.; Rehman, W.; Waseem, M.; Shah, A. Green fabrication and physicochemical investigations of zinc-cobalt oxide nanocomposite for wastewater treatment. J. Mol. Liq. 2020, 318, 114260. [Google Scholar] [CrossRef]
  2. Tammina, S.K.; Mandal, B.K.; Kadiyala, N.K. Photocatalytic degradation of methylene blue dye by nonconventional synthesized SnO2 nanoparticles. Environ. Nanotechnol. Monit. Manag. 2018, 10, 339–350. [Google Scholar] [CrossRef]
  3. Khan, B.; Nawaz, M.; Waseem, M.; Hussain, R.; Arif, S.; Price, G.J. Adsorption of methylene blue onto size controlled magnetite nanoparticles Adsorption of methylene blue onto size controlled magnetite nanoparticles. Mater. Res. Express 2019, 6, 095511. [Google Scholar] [CrossRef]
  4. Zou, W.; Li, K.; Bai, H.; Shi, X.; Han, R. Enhanced Cationic Dyes Removal from Aqueous Solution by Oxalic Acid Modified Rice Husk. J. Chem. Eng. Data 2011, 56, 1882–1891. [Google Scholar] [CrossRef]
  5. Gherbi, B.; Laouini, S.E.; Meneceur, S.; Bouafia, A.; Hemmami, H.; Tedjani, M.L.; Thiripuranathar, G.; Barhoum, A.; Menaa, F. Effect of pH Value on the Bandgap Energy and Particles Size for Biosynthesis of ZnO Nanoparticles: Efficiency for Photocatalytic Adsorption of Methyl Orange. Sustainability 2022, 14, 11300. [Google Scholar] [CrossRef]
  6. Harikumar, B.; Okla, M.K.; Alaraidh, I.A.; Mohebaldin, A.; Soufan, W.; Abdel-Maksoud, M.A.; Aufy, M.; Thomas, A.M.; Raju, L.L.; Khan, S.S. Robust visible light active CoNiO2–BiFeO3–NiS ternary nanocomposite for photo-fenton degradation of rhodamine B and methyl orange: Kinetics, degradation pathway and toxicity assessment. J. Environ. Manag. 2022, 317, 115321. [Google Scholar] [CrossRef]
  7. Jana, M.; Taheruddin, S.; Mitra, M.; Kulsi, C. Applied Surface Science Visible-light in fl uenced photocatalytic activity of polyaniline -bismuth selenide composites for the degradation of methyl orange, rhodamine B and malachite green dyes. Appl. Surf. Sci. 2019, 470, 472–483. [Google Scholar]
  8. Kazazi, M.; Moradi, B.; Delshad Chermahini, M. Enhanced photocatalytic degradation of methyl orange using Ag/Sn-doped CeO2 nanocomposite. J. Mater. Sci. Mater. Electron. 2019, 30, 6116–6126. [Google Scholar] [CrossRef]
  9. Sivakarthik, P.; Thangaraj, V.; Perumalraj, K.; Balaji, J. Synthesis of co-doped tin oxide nanoparticles for photo catalytic degradation of synthetic organic dyes. Dig. J. Nanomater. Biostruct. 2016, 11, 935–943. [Google Scholar]
  10. Lin, C.; Liu, H.; Guo, M.; Zhao, Y.; Su, X.; Zhang, P.; Zhang, Y. Plasmon-induced broad spectrum photocatalytic overall water splitting: Through non-noble bimetal nanoparticles hybrid with reduced graphene oxide. Colloids Surf. A Physicochem. Eng. Asp. 2022, 646, 128962. [Google Scholar] [CrossRef]
  11. Wei, P.; Zhang, P.; Zhang, Y.; Li, X. Highly efficient photocatalytic overall water splitting on plasmonic Cu6Sn5/polyaniline nanocomposites. J. Colloid Interface Sci. 2022, 609, 785–793. [Google Scholar] [CrossRef]
  12. Lu, Y.; Wu, D.; Qin, Y.; Xie, Y.; Ling, Y.; Ye, H.; Zhang, Y. Facile construction of BiOBr/CoAl-LDH heterojunctions with suppressed Z-axis growth for efficient photoreduction of CO2. Sep. Purif. Technol. 2022, 302, 122090. [Google Scholar] [CrossRef]
  13. Zafar, N.; Uzair, B.; Menaa, F.; Khan, B.A.; Niazi, M.B.K.; Alaryani, F.S.; Majrashi, K.A.; Sajjad, S. Moringa concanensis-Mediated Synthesis and Characterizations of Ciprofloxacin Encapsulated into Ag/TiO2/Fe2O3/CS Nanocomposite: A Therapeutic Solution against Multidrug Resistant E. coli Strains of Livestock Infectious Diseases. Pharmaceutics 2022, 14, 1719. [Google Scholar] [CrossRef]
  14. Wijesinghe, U.; Thiripuranathar, G.; Menaa, F.; Iqbal, H.; Razzaq, A.; Almukhlifi, H. Green synthesis, structural characterization and photocatalytic applications of ZnO nanoconjugates using Heliotropium indicum. Catalysts 2021, 11, 831. [Google Scholar] [CrossRef]
  15. Wijesinghe, U.; Thiripuranathar, G.; Iqbal, H.; Menaa, F. Biomimetic synthesis, characterization, and evaluation of fluorescence resonance energy transfer, photoluminescence, and photocatalytic activity of zinc oxide nanoparticles. Sustainability 2021, 13, 2004. [Google Scholar] [CrossRef]
  16. Haq, S.; Rehman, W.; Waseem, M.; Meynen, V.; Awan, S.U.; Khan, A.R.; Hussain, S.; Zain-ul-Abdin; Din, S.U.; Hafeez, M.; et al. Effect of Annealing Temperature on Structural Phase Transformations and Band Gap Reduction for Photocatalytic Activity of Mesopores TiO2 Nanocatalysts. J. Inorg. Organomet. Polym. Mater. 2021, 31, 1312–1322. [Google Scholar] [CrossRef]
  17. Haq, S.; Ahmad, P.; Khandaker, M.U.; Faruque, M.R.I.; Rehman, W.; Waseem, M.; Din, S.U. Antibacterial, antioxidant and physicochemical investigations of tin dioxide nanoparticles synthesized via microemulsion method. Mater. Res. Express 2021, 8, 035013. [Google Scholar] [CrossRef]
  18. Haq, S.; Rehman, W.; Waseem, M.; Shah, A.; Khan, A.R. Green synthesis and characterization of tin dioxide nanoparticles for photocatalytic and antimicrobial studies. Mater. Res. Express 2020, 7, 025012. [Google Scholar] [CrossRef]
  19. Ahmad, M.; Rehman, W.; Khan, M.M.; Qureshi, M.T.; Gul, A.; Haq, S.; Ullah, R.; Rab, A.; Menaa, F. Phytogenic fabrication of ZnO and gold decorated ZnO nanoparticles for photocatalytic degradation of Rhodamine B. J. Environ. Chem. Eng. 2021, 9, 104725. [Google Scholar] [CrossRef]
  20. Bibi, N.; Haq, S.; Rehman, W.; Waseem, M.; Rehman, M.U.; Shah, A.; Khan, B.; Rasheed, P. Low temperature fabrication of SnO2, ZnO and Zn2SnO4 nanostructures for the degradation of Rhodamine 6G: Characterization. Biointerface Res. Appl. Chem. 2020, 10, 5895–5900. [Google Scholar]
  21. Yao, W.; Wu, S.; Zhan, L.; Wang, Y. Two-dimensional porous carbon-coated sandwich-like mesoporous SnO2/graphene/mesoporous SnO2 nanosheets towards high-rate and long cycle life lithium-ion batteries. Chem. Eng. J. 2019, 361, 329–341. [Google Scholar] [CrossRef]
  22. Elango, G.; Roopan, S.M. Efficacy of SnO2 nanoparticles towards photocatalytic degradation of methylene blue dye. J. Photochem. Photobiol. B Biol. 2015, 155, 34–38. [Google Scholar] [CrossRef] [PubMed]
  23. Dai, K.; Chen, H.; Peng, T.; Ke, D.; Yi, H. Photocatalytic degradation of methyl orange in aqueous suspension of mesoporous titania nanoparticles. Chemosphere 2007, 69, 1361–1367. [Google Scholar] [CrossRef]
  24. Haq, S.; Yasin, K.A.; Rehman, W.; Waseem, M.; Ahmed, M.N.; Shahzad, M.I.; Shahzad, N.; Shah, A.; Rehman, M.U.; Khan, B. Green Synthesis of Silver Oxide Nanostructures and Investigation of Their Synergistic Effect with Moxifloxacin Against Selected Microorganisms. J. Inorg. Organomet. Polym. Mater. 2020, 31, 1134–1142. [Google Scholar] [CrossRef]
  25. Haq, S.; Afsar, H.; Ali, M.B.; Almalki, M.; Albogami, B.; Hedfi, A. Green Synthesis and Characterization of a ZnO–ZrO2 Heterojunction for Environmental and Biological Applications. Crystals 2021, 11, 1502. [Google Scholar] [CrossRef]
  26. Nandeesh, R.; Ashok Kumar, B.S.; Lakshman, K.; Ranganayakulu, D.; Manoj, B.; Ganapathy, S. Histological and Physico-Chemical Evaluation of Buxus wallichiana Baill. In World Journal of Fungal and Plant Biology; Idress Hamad Attitalla, Sandra Ann Ingela Wright, Eds.; IDOSI Publications: Faisalabad, Pakistan, 2010; Volume 1, pp. 46–50. ISSN 2219-4312. [Google Scholar]
  27. Cheng, B.; Russell, J.M.; Shi, W.; Zhang, L.; Samulski, E.T. Large-Scale, Solution-Phase Growth of Single-Crystalline SnO2 Nanorods. J. Am. Chem. Soc. 2004, 126, 5972–5973. [Google Scholar] [CrossRef]
  28. Aziz, M.; Saber Abbas, S.; Wan Baharom, W.R. Size-controlled synthesis of SnO2 nanoparticles by sol-gel method. Mater. Lett. 2013, 91, 31–34. [Google Scholar] [CrossRef]
  29. Yu, J.-G.; Yu, H.-G.; Cheng, B.; Zhao, X.-J.; Yu, J.C.; Ho, W.K. The Effect of Calcination Temperature on the Surface Microstructure and Photocatalytic Activity of TiO2 Thin Films Prepared by Liquid Phase Deposition. J. Phys. Chem. B 2003, 107, 13871–13879. [Google Scholar] [CrossRef]
  30. Haq, S.; Rehman, W.; Waseem, M.; Javed, R.; Mahfooz-ur-Rehman; Shahid, M. Effect of heating on the structural and optical properties of TiO2 nanoparticles: Antibacterial activity. Appl. Nanosci. 2018, 8, 11–18. [Google Scholar] [CrossRef] [Green Version]
  31. Haq, S.; Rehman, W.; Waseem, M.; Rehman, M.; Shah, K.H. Modeling, Thermodynamic Study and Sorption Mechanism of Cadmium Ions onto Isopropyl Alcohol Mediated Tin Dioxide Nanoparticles. J. Inorg. Organomet. Polym. Mater. 2019, 30, 1198. [Google Scholar] [CrossRef]
  32. Manjula, P.; Boppella, R.; Manorama, S.V. A facile and green approach for the controlled synthesis of porous SnO2 nanospheres: Application as an efficient photocatalyst and an excellent gas sensing material. ACS Appl. Mater. Interfaces 2012, 4, 6252–6260. [Google Scholar] [CrossRef]
  33. Khan, M.M.; Pradhan, D.; Sohn, Y. Springer Series on Polymer and Composite Materials Nanocomposites for Visible Light-induced Photocatalysis. In Nanocomposites for Visible Light-Induced Photocatalysis; Springer: Berlin/Heidelberg, Germany, 2017; pp. 19–40. [Google Scholar] [CrossRef]
  34. Fu, L.; Zheng, Y.; Ren, Q.; Wang, A.; Deng, B. Green biosynthesis of SnO2 nanoparticles by plectranthus amboinicus leaf extract their photocatalytic activity toward rhodamine B degradation. J. Ovonic Res. 2015, 11, 21–26. [Google Scholar]
  35. Kulkarni, R.M.; Malladi, R.S.; Hanagadakar, M.S. Cu-ZnO nanoparticles for degradation of methyl orange photocatalytic. Adv. Mater. Proc. 2018, 3, 521–525. [Google Scholar] [CrossRef]
  36. Yuan, H.; Xu, J. Preparation, characterization and photocatalytic activity of nanometer SnO2. Int. J. Chem. Eng. Appl. 2010, 1, 241–246. [Google Scholar] [CrossRef]
  37. Kansal, S.K.; Singh, M.; Sud, D. Studies on photodegradation of two commercial dyes in aqueous phase using different photocatalysts. J. Hazard. Mater. 2007, 141, 581–590. [Google Scholar] [CrossRef]
  38. He, Y.; Chen, Q.; Tian, Y.; Yan, C.; He, Y.; Li, K. Estimation of shale pore-size-distribution from N2 adsorption characteristics employing modified BJH algorithm. Pet. Sci. Technol. 2021, 39, 843–859. [Google Scholar] [CrossRef]
  39. Rasheed, P.; Haq, S.; Waseem, M.; Rehman, S.U.; Rehman, W. Green synthesis of vanadium oxide-zirconium oxide nanocomposite for the degradation of methyl orange and picloram. Mater. Res. Express 2020, 7, 025011. [Google Scholar] [CrossRef]
  40. Shoukat, S.; Haq, S.; Rehman, W.; Waseem, M.; Hafeez, M.; Din, S.U.; Zain-ul-Abdin; Ahmad, P.; Rehman, M.U.; Shah, A.; et al. Remediation of Chromium (VI) and Rhodamine 6G via Mixed Phase Nickel-Zinc Nanocomposite: Synthesis and Characterization. J. Inorg. Organomet. Polym. Mater. 2021, 31, 1565–1575. [Google Scholar] [CrossRef]
  41. Haq, S.; Afsar, H.; Din, I.U.; Ahmad, P.; Khandaker, M.U.; Osman, H.; Alamri, S.; Shahzad, M.I.; Shahzad, N.; Rehman, W.; et al. Enhanced photocatalytic activity of ficus elastica mediated zinc oxide-zirconium dioxide nanocatalyst at elevated calcination temperature: Physicochemical study. Catalysts 2021, 11, 1481. [Google Scholar] [CrossRef]
  42. Haq, S.; Rehman, W.; Waseem, M.; Meynen, V.; Awan, S.U.; Saeed, S.; Iqbal, N. Fabrication of pure and moxifloxacin functionalized silver oxide nanoparticles for photocatalytic and antimicrobial activity. J. Photochem. Photobiol. B Biol. 2018, 186, 116–124. [Google Scholar] [CrossRef]
Figure 1. X-ray diffractogram of SnO2 NPs calcined at different temperatures.
Catalysts 12 01397 g001
Figure 2. Linear N2 adsorption plots of SnO2 NPs calcined at different temperatures.
Catalysts 12 01397 g002
Figure 3. Scanning electron micrographs of SnO2 NPs calcined at 100 °C (A), 300 °C (B), 600 °C (C), and 900 °C (D).
Catalysts 12 01397 g003
Figure 4. Tauc’s plot (inset: DRS spectra) of SnO2 NPS calcined at the indicated temperatures.
Catalysts 12 01397 g004
Figure 5. FTIR spectra of SnO2 NPS calcined at different temperatures.
Catalysts 12 01397 g005
Figure 6. Degradation kinetics of methyl orange with SnO2 NPs calcined at 100 °C (A), 300 °C (B), 600 °C (C), and 900 °C (D).
Catalysts 12 01397 g006
Figure 7. Percentage degradation, kinetic rate constant (AC), and schematic mechanism of photodegradation reaction (D).
Catalysts 12 01397 g007
Figure 8. Effect of (A) temperature (0–900 °C), (B) pH (4–9); (C) catalyst dose (0–30 mg), (D) initial methyl orange (MO) concentration (0–30 ppm) on SnO2 NP-induced degradation of MO. For each effect to be analyzed, all other variables were optimized and kept constant.
Catalysts 12 01397 g008
Table 1. Surface area, pore size, and volume of SnO2 NPs.
Cal. Temp
(°C)
SBET (m2/g)Pore Size (Ǻ)Pore Volume (cm3/g)
100143.2019.890.0180
300142.6721.220.0938
60042.5121.280.0272
9004.0821.060.0025
Publisher’s Note: MDPI stays neutral with regard to jurisdictional claims in published maps and institutional affiliations.

