

Acid Gas and Tar Removal from Syngas of Refuse Gasification by Catalytic Reforming


Abstract
:1. Introduction
2. Results and Discussion
2.1. HCl
2.1.1. CaO Adsorbent
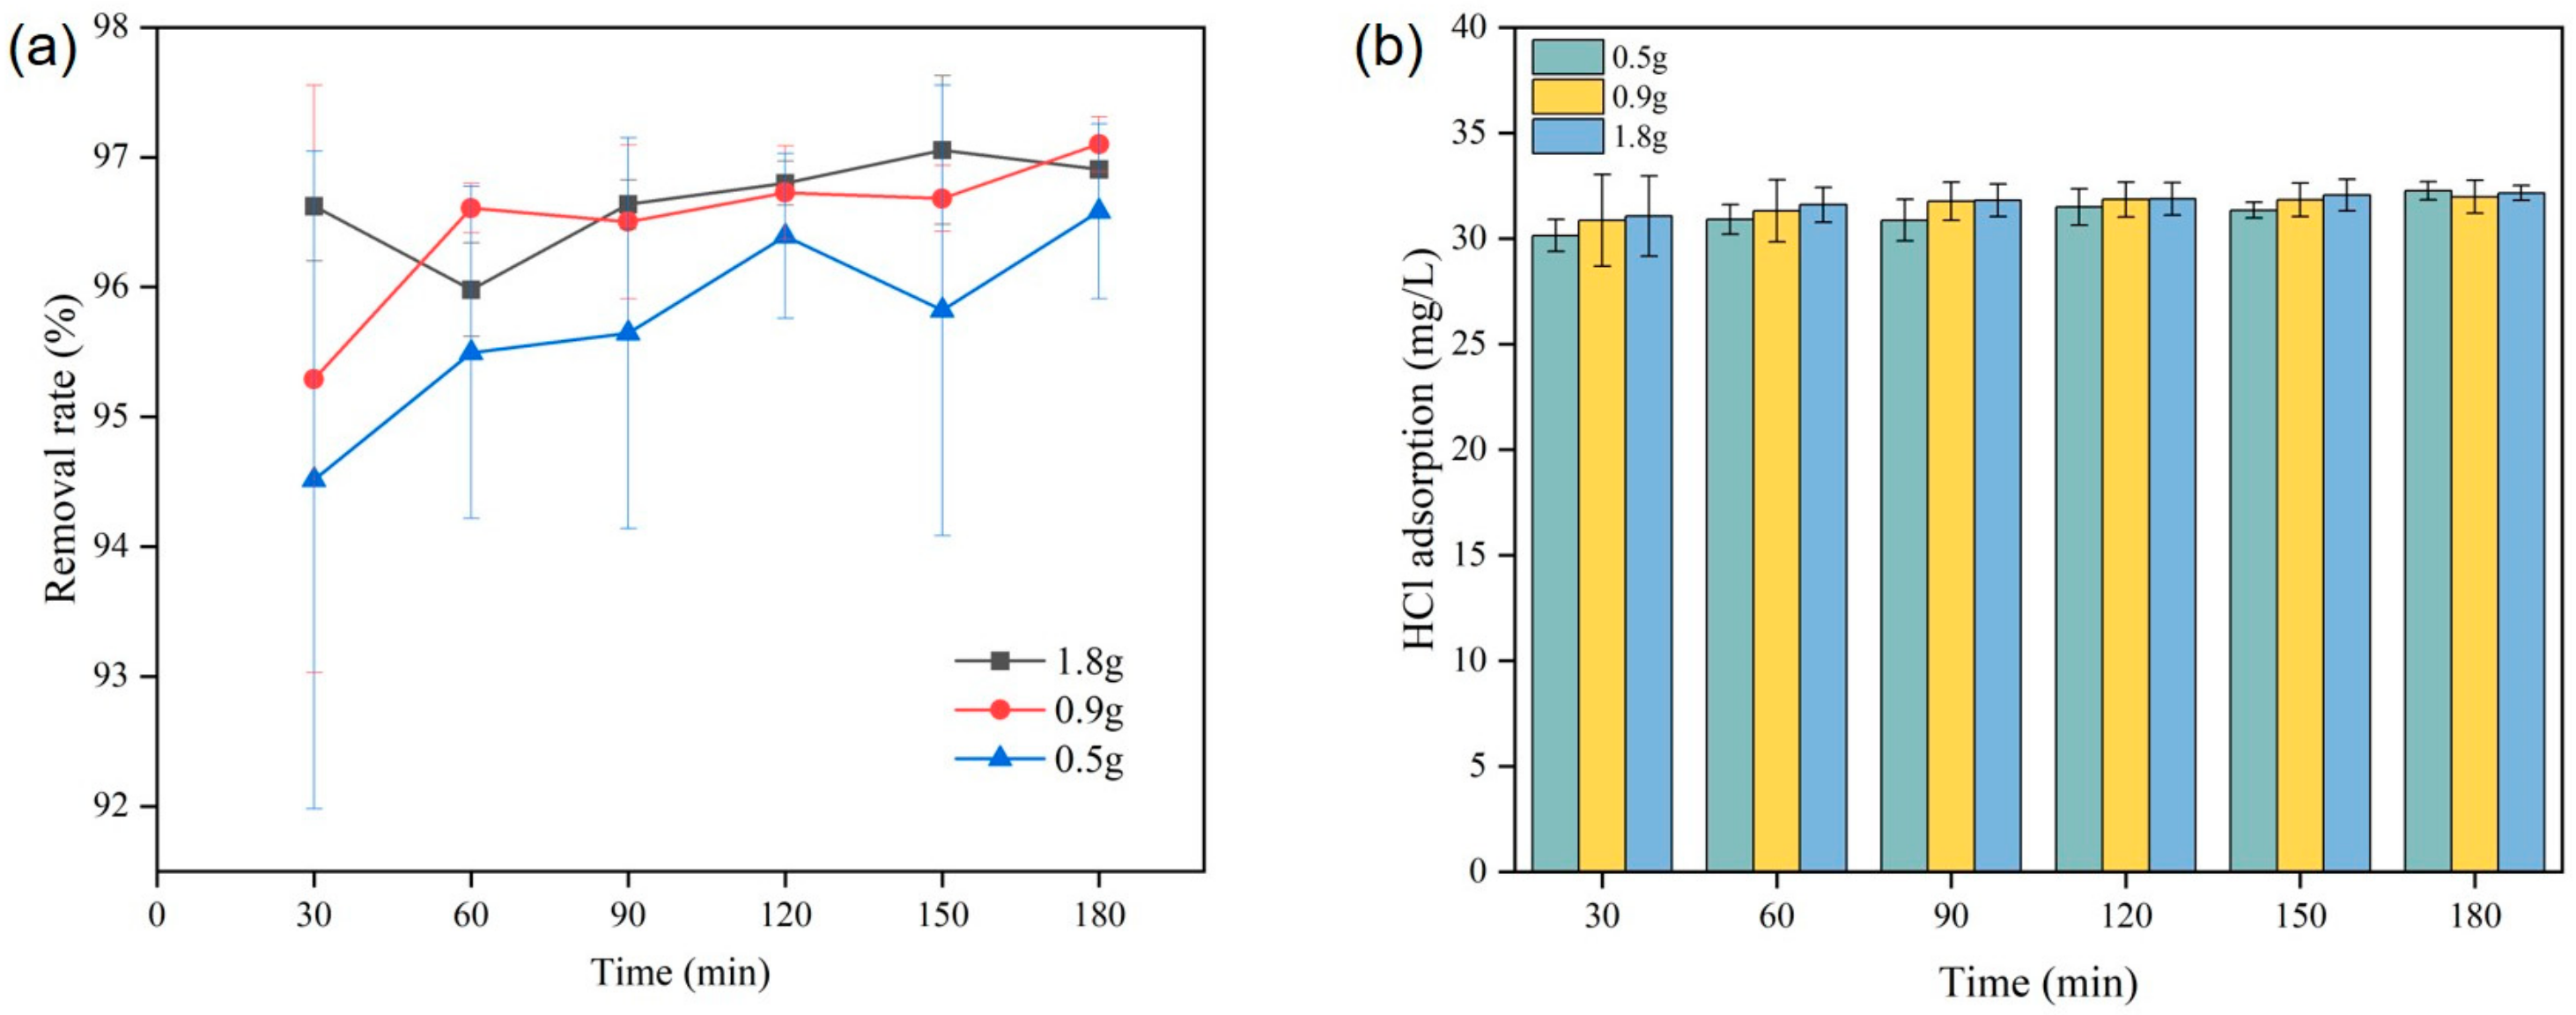
2.1.2. NaAlO2 Adsorbent
2.1.3. Characterization of NaAlO2 before and after the Experiment
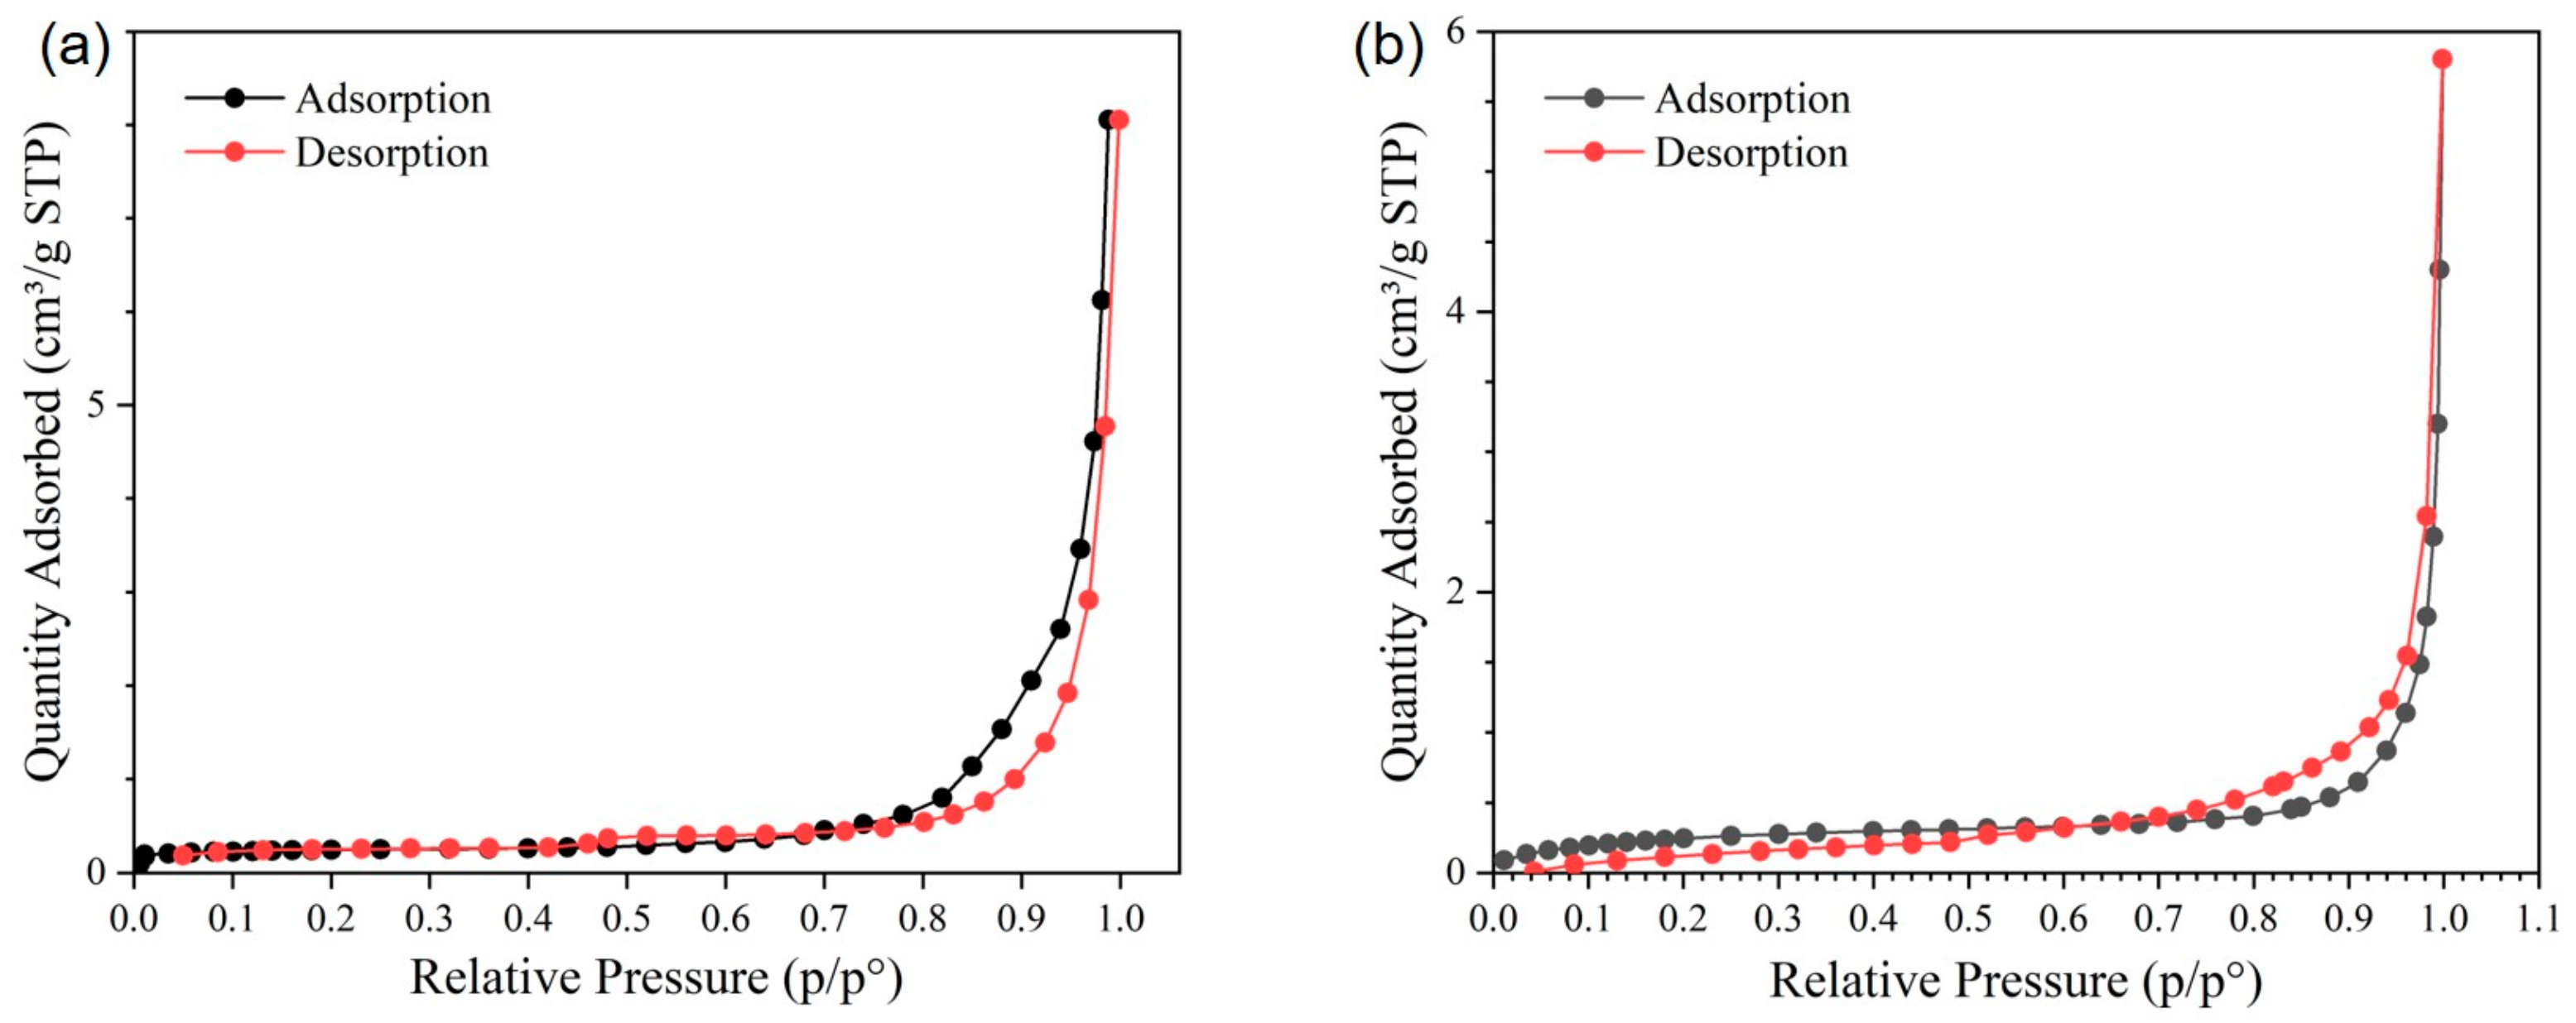
BET
SEM
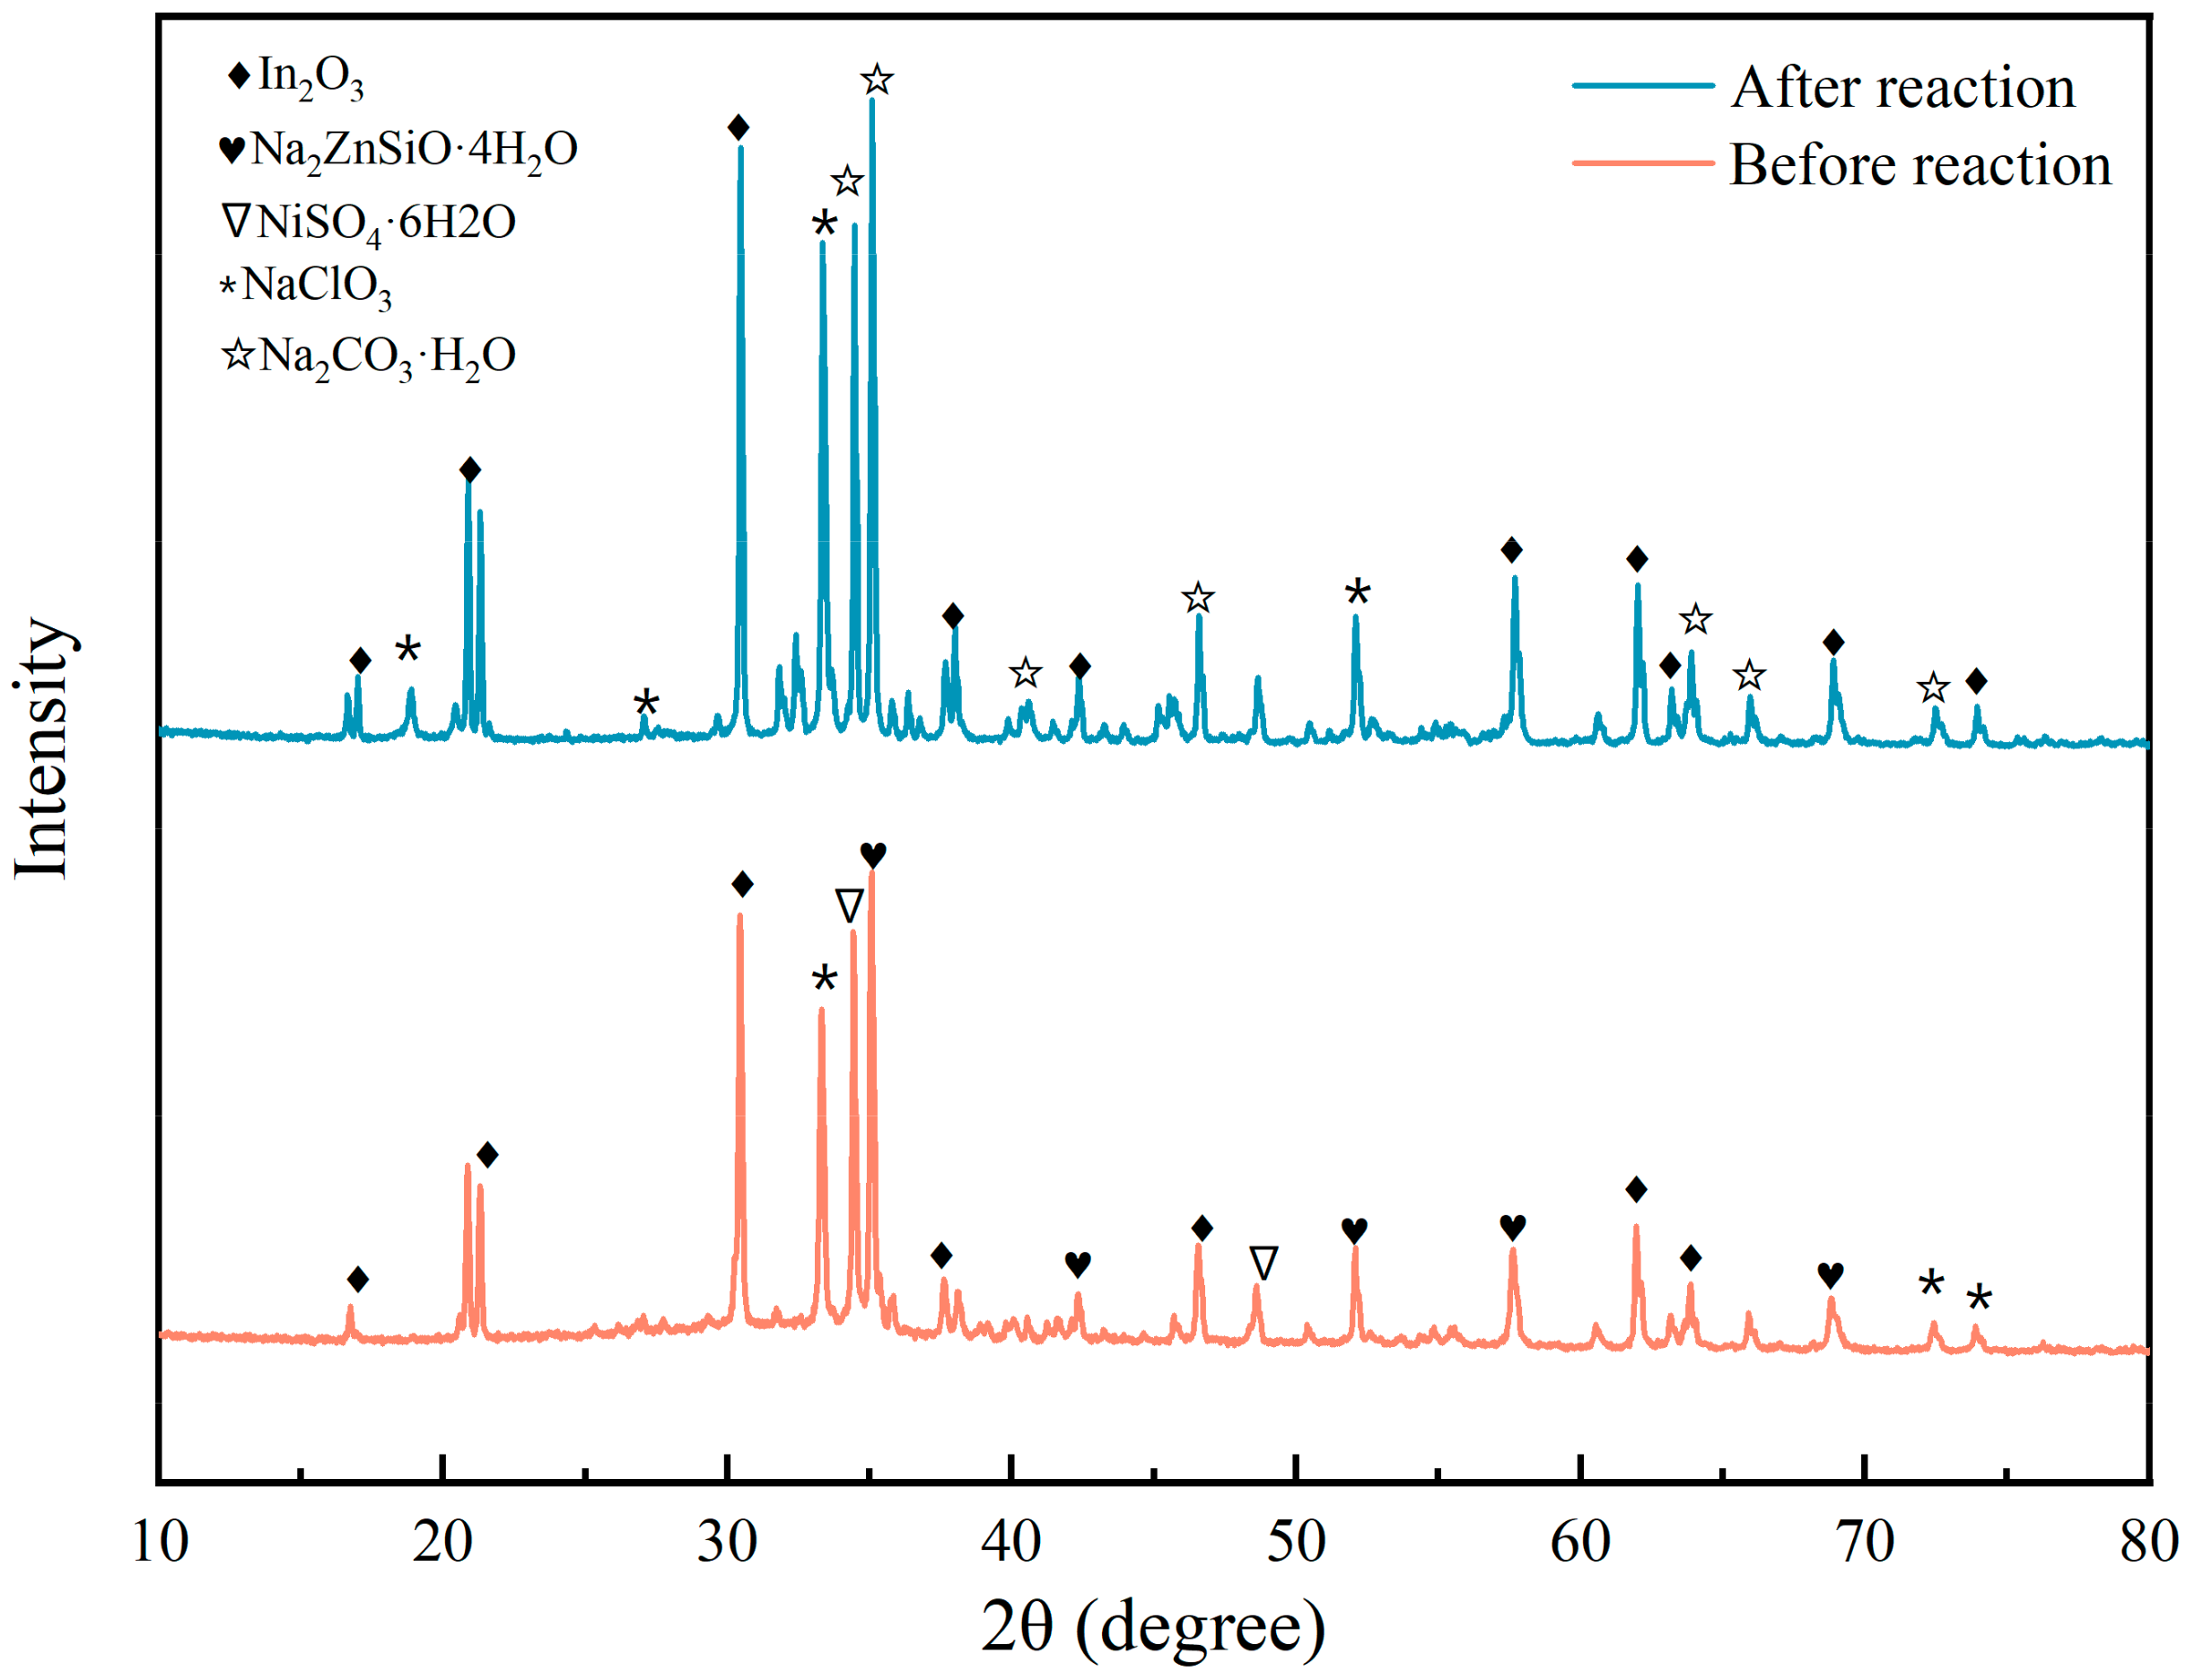
XRD
2.2. Tar
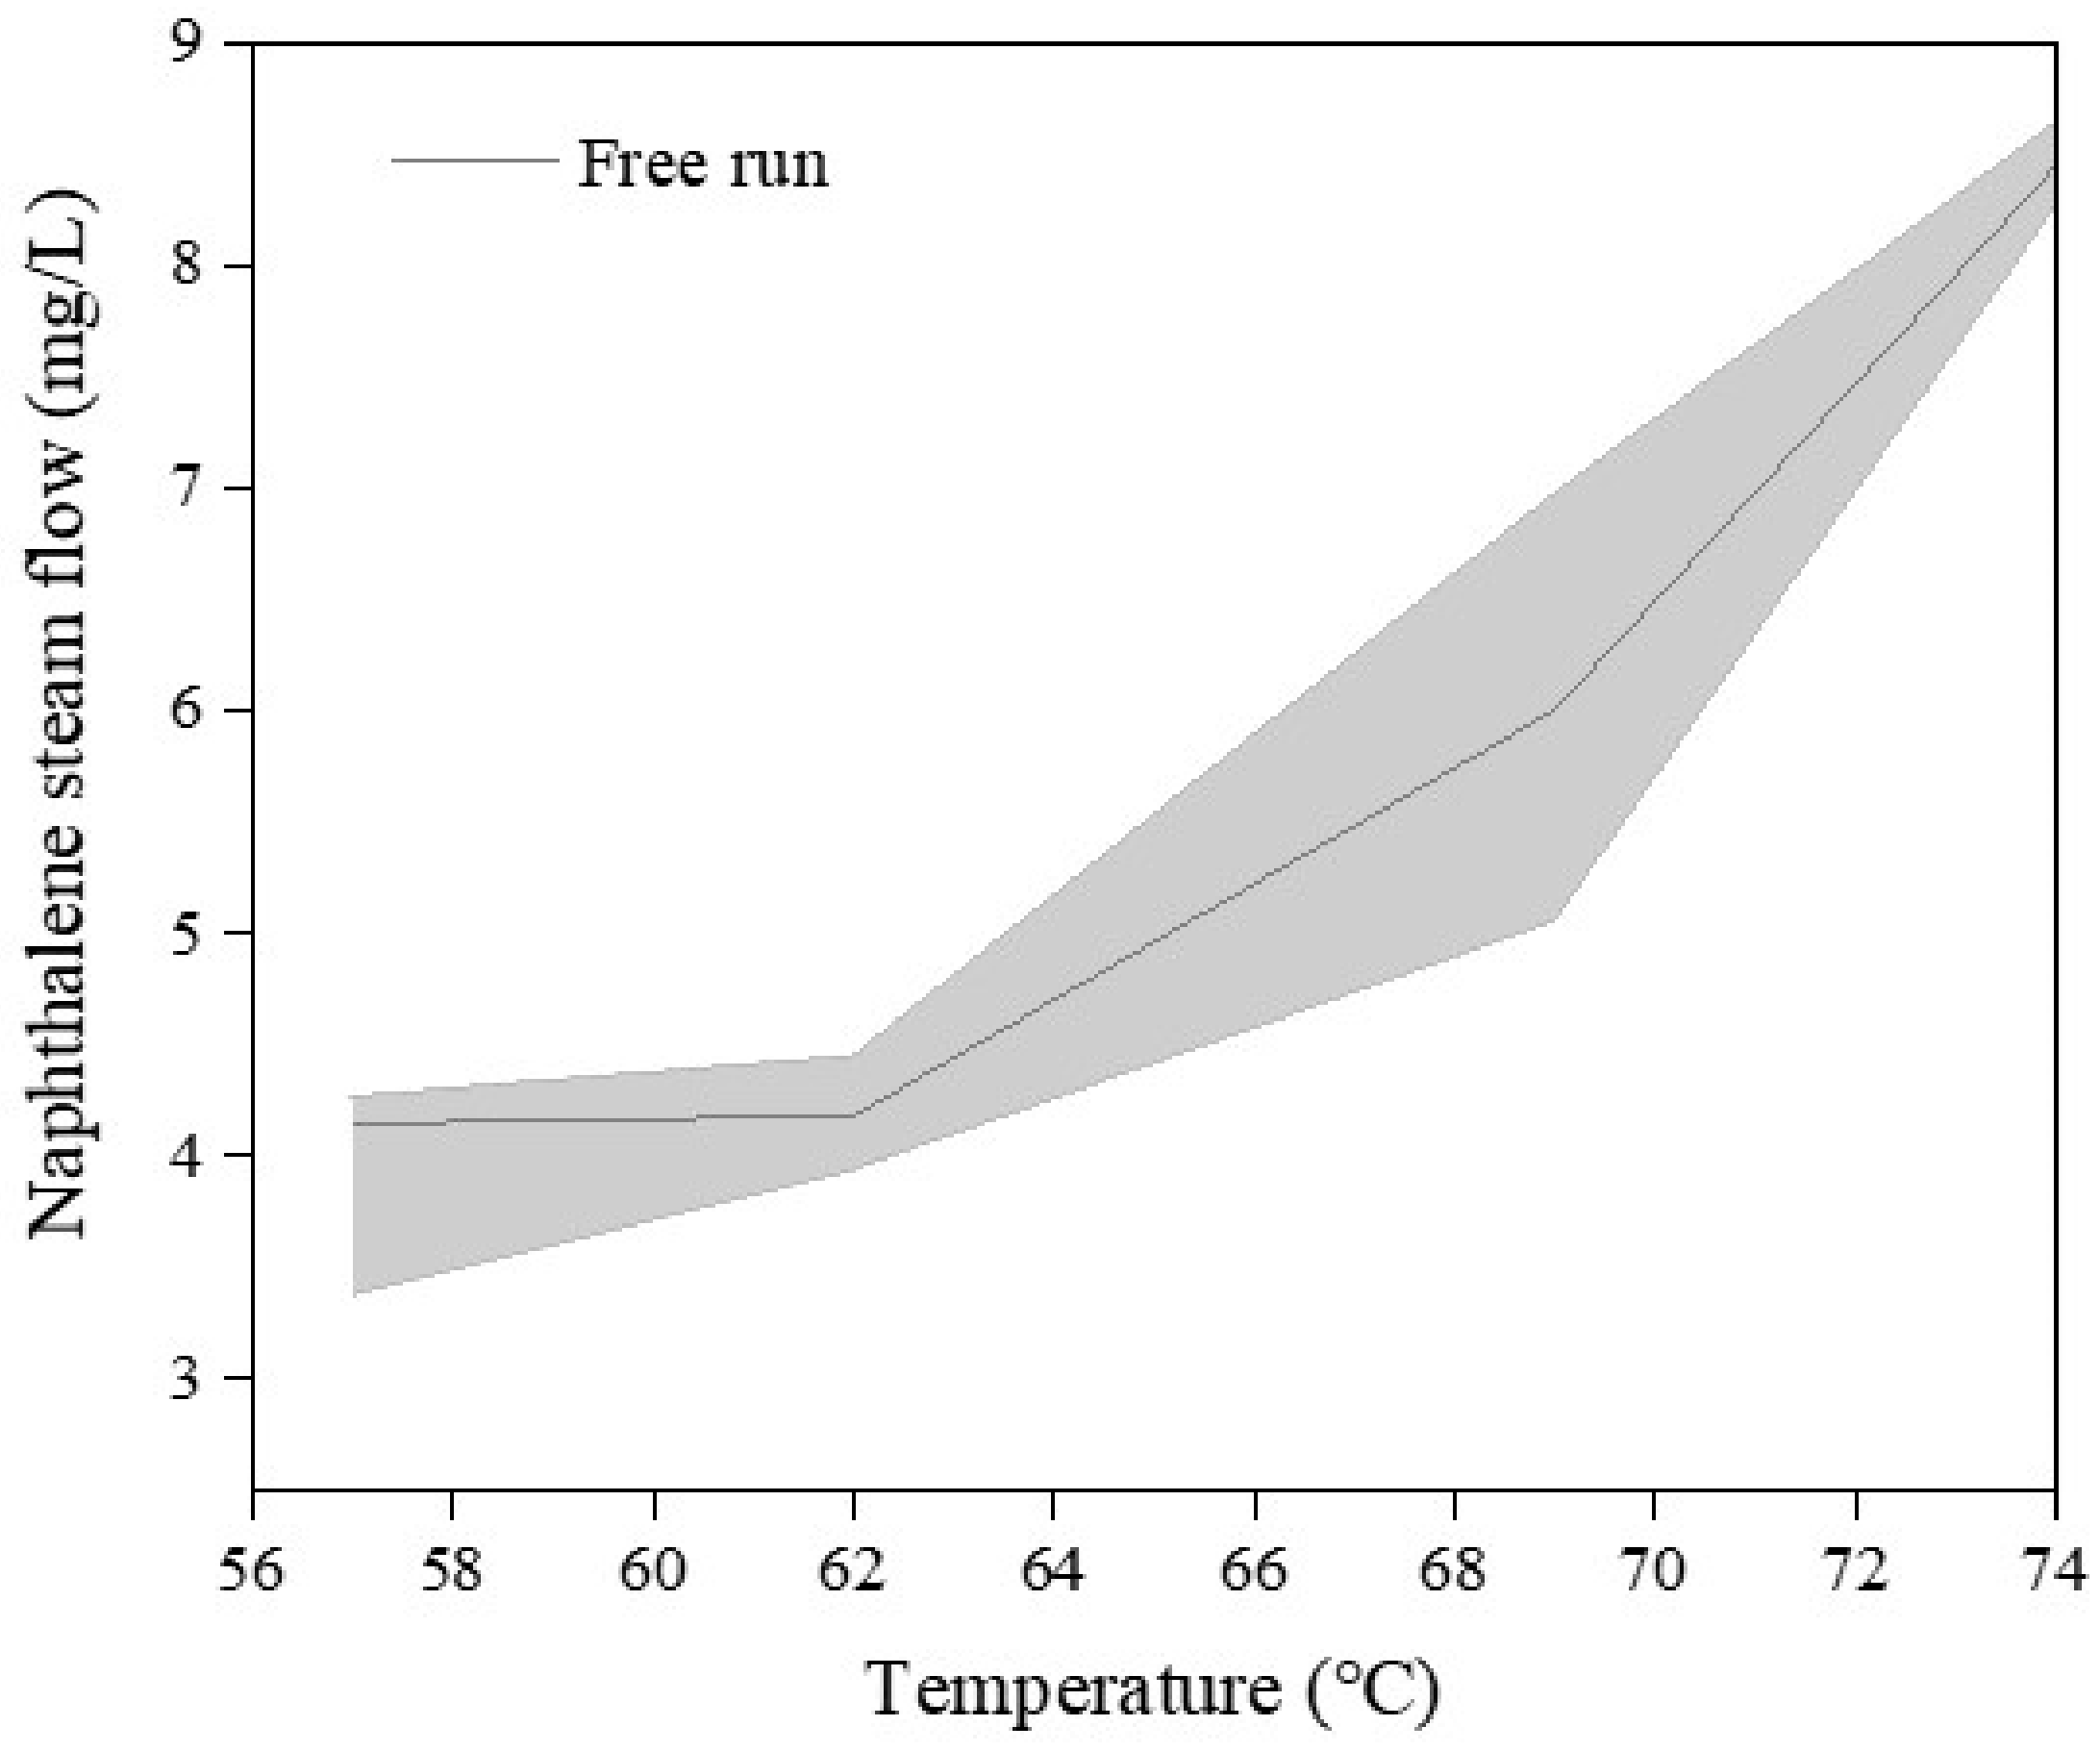
2.2.1. Determination of the Flux of Naphthalene
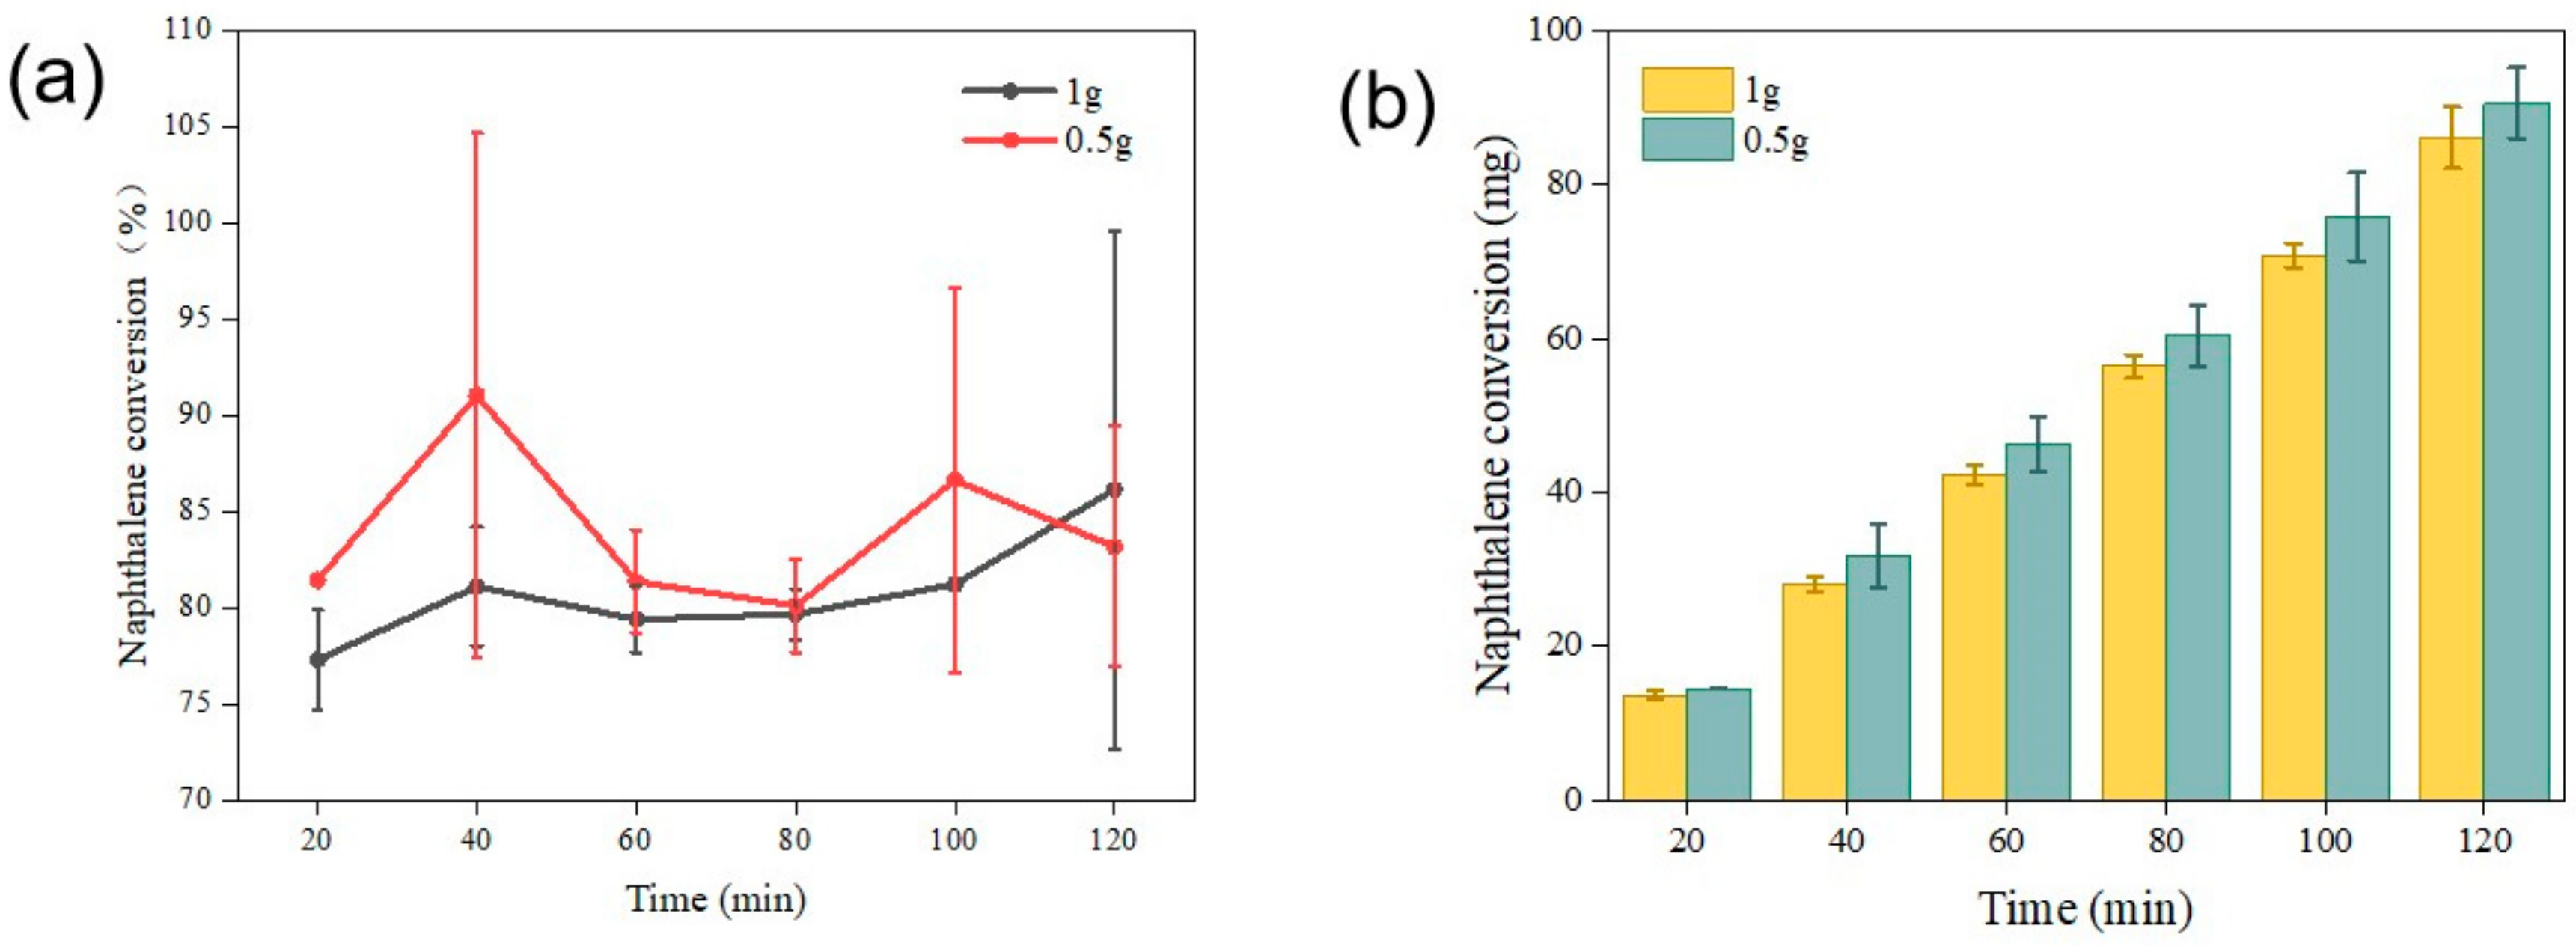
2.2.2. The Effects of Space Velocity on Tar Catalytic Reforming
2.2.3. The Effects of Temperature on Tar Catalytic Reforming
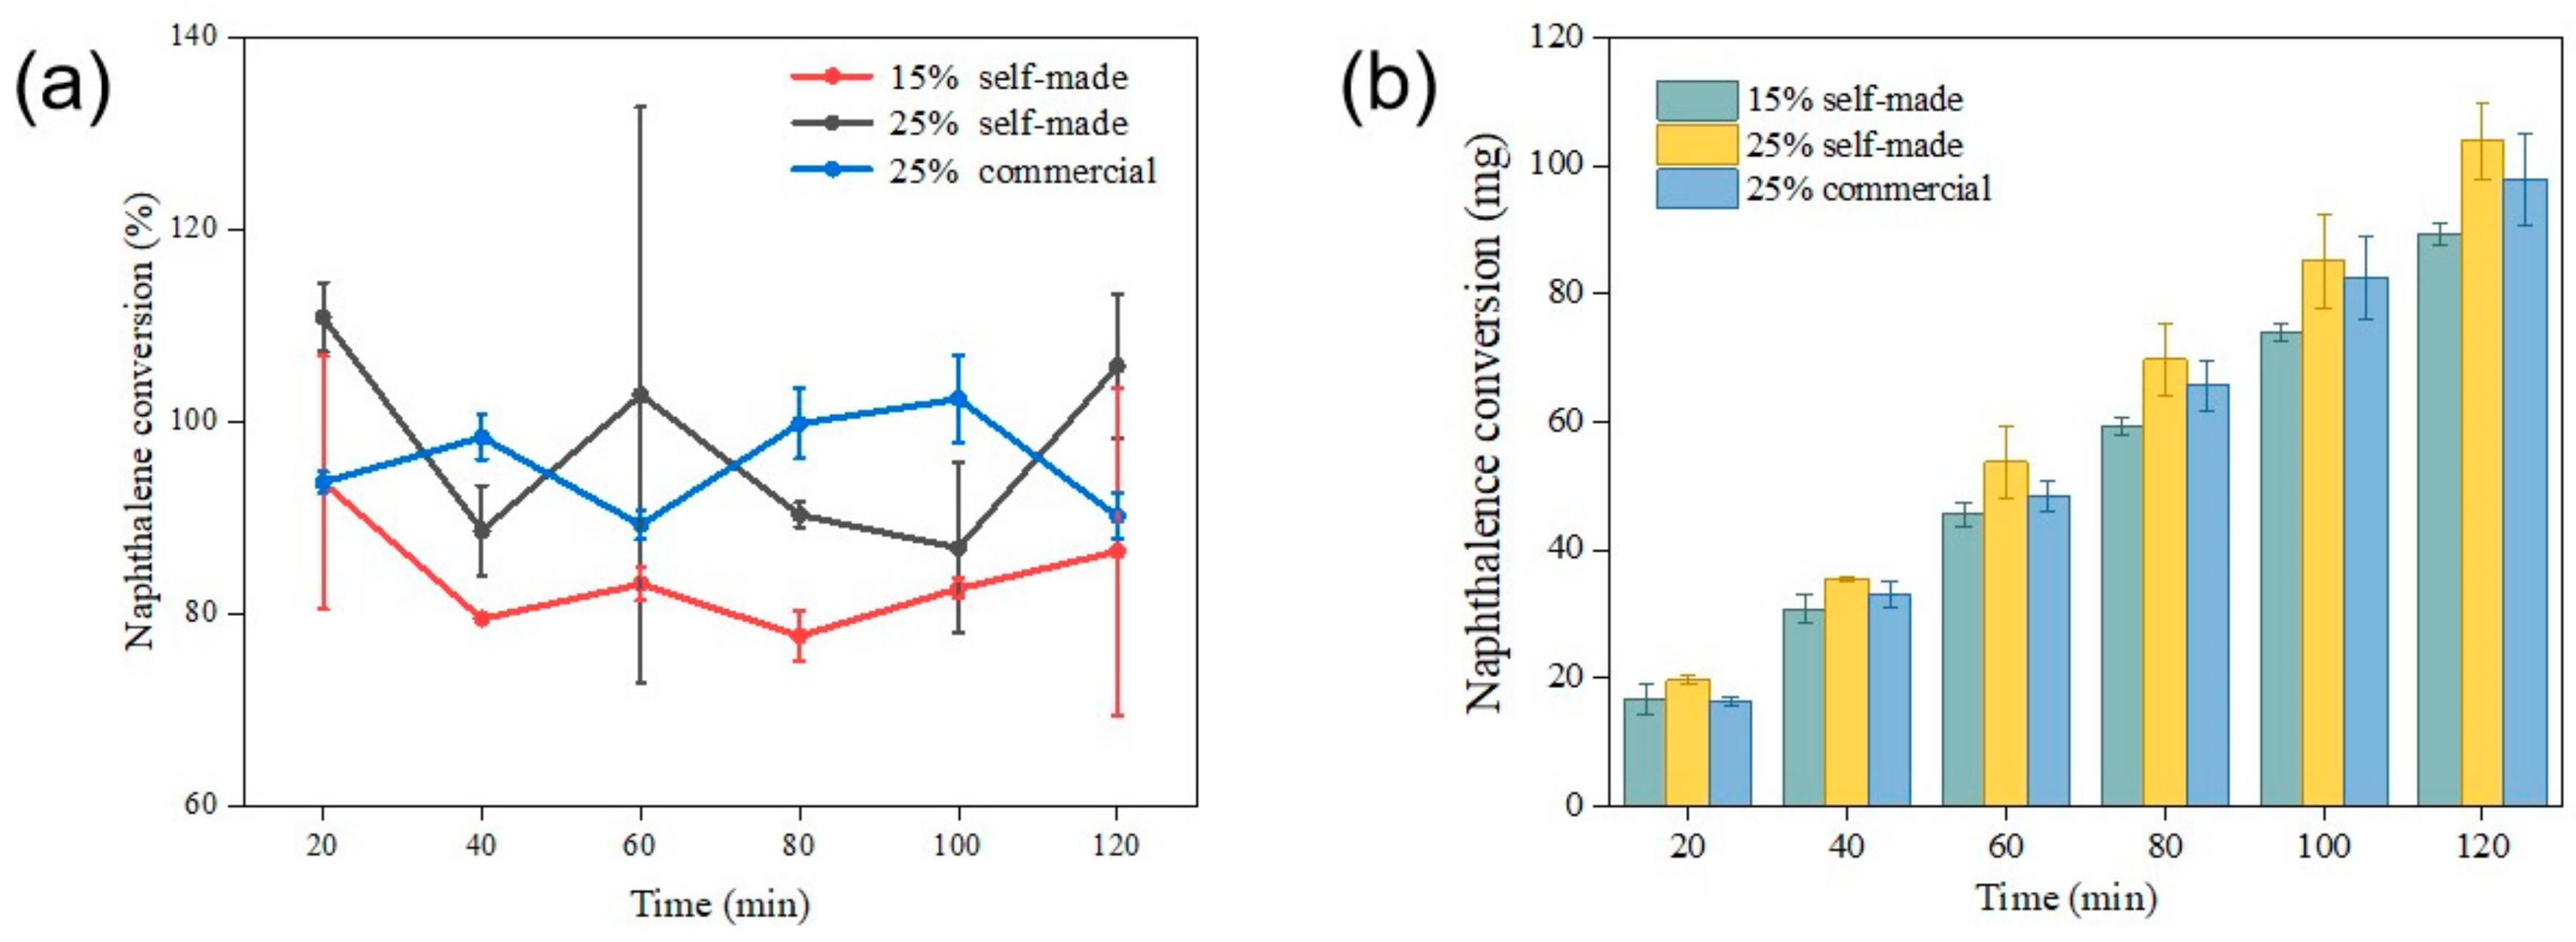
2.2.4. The Effects of Different Catalysts and Associated Loading Rates on Tar Removal
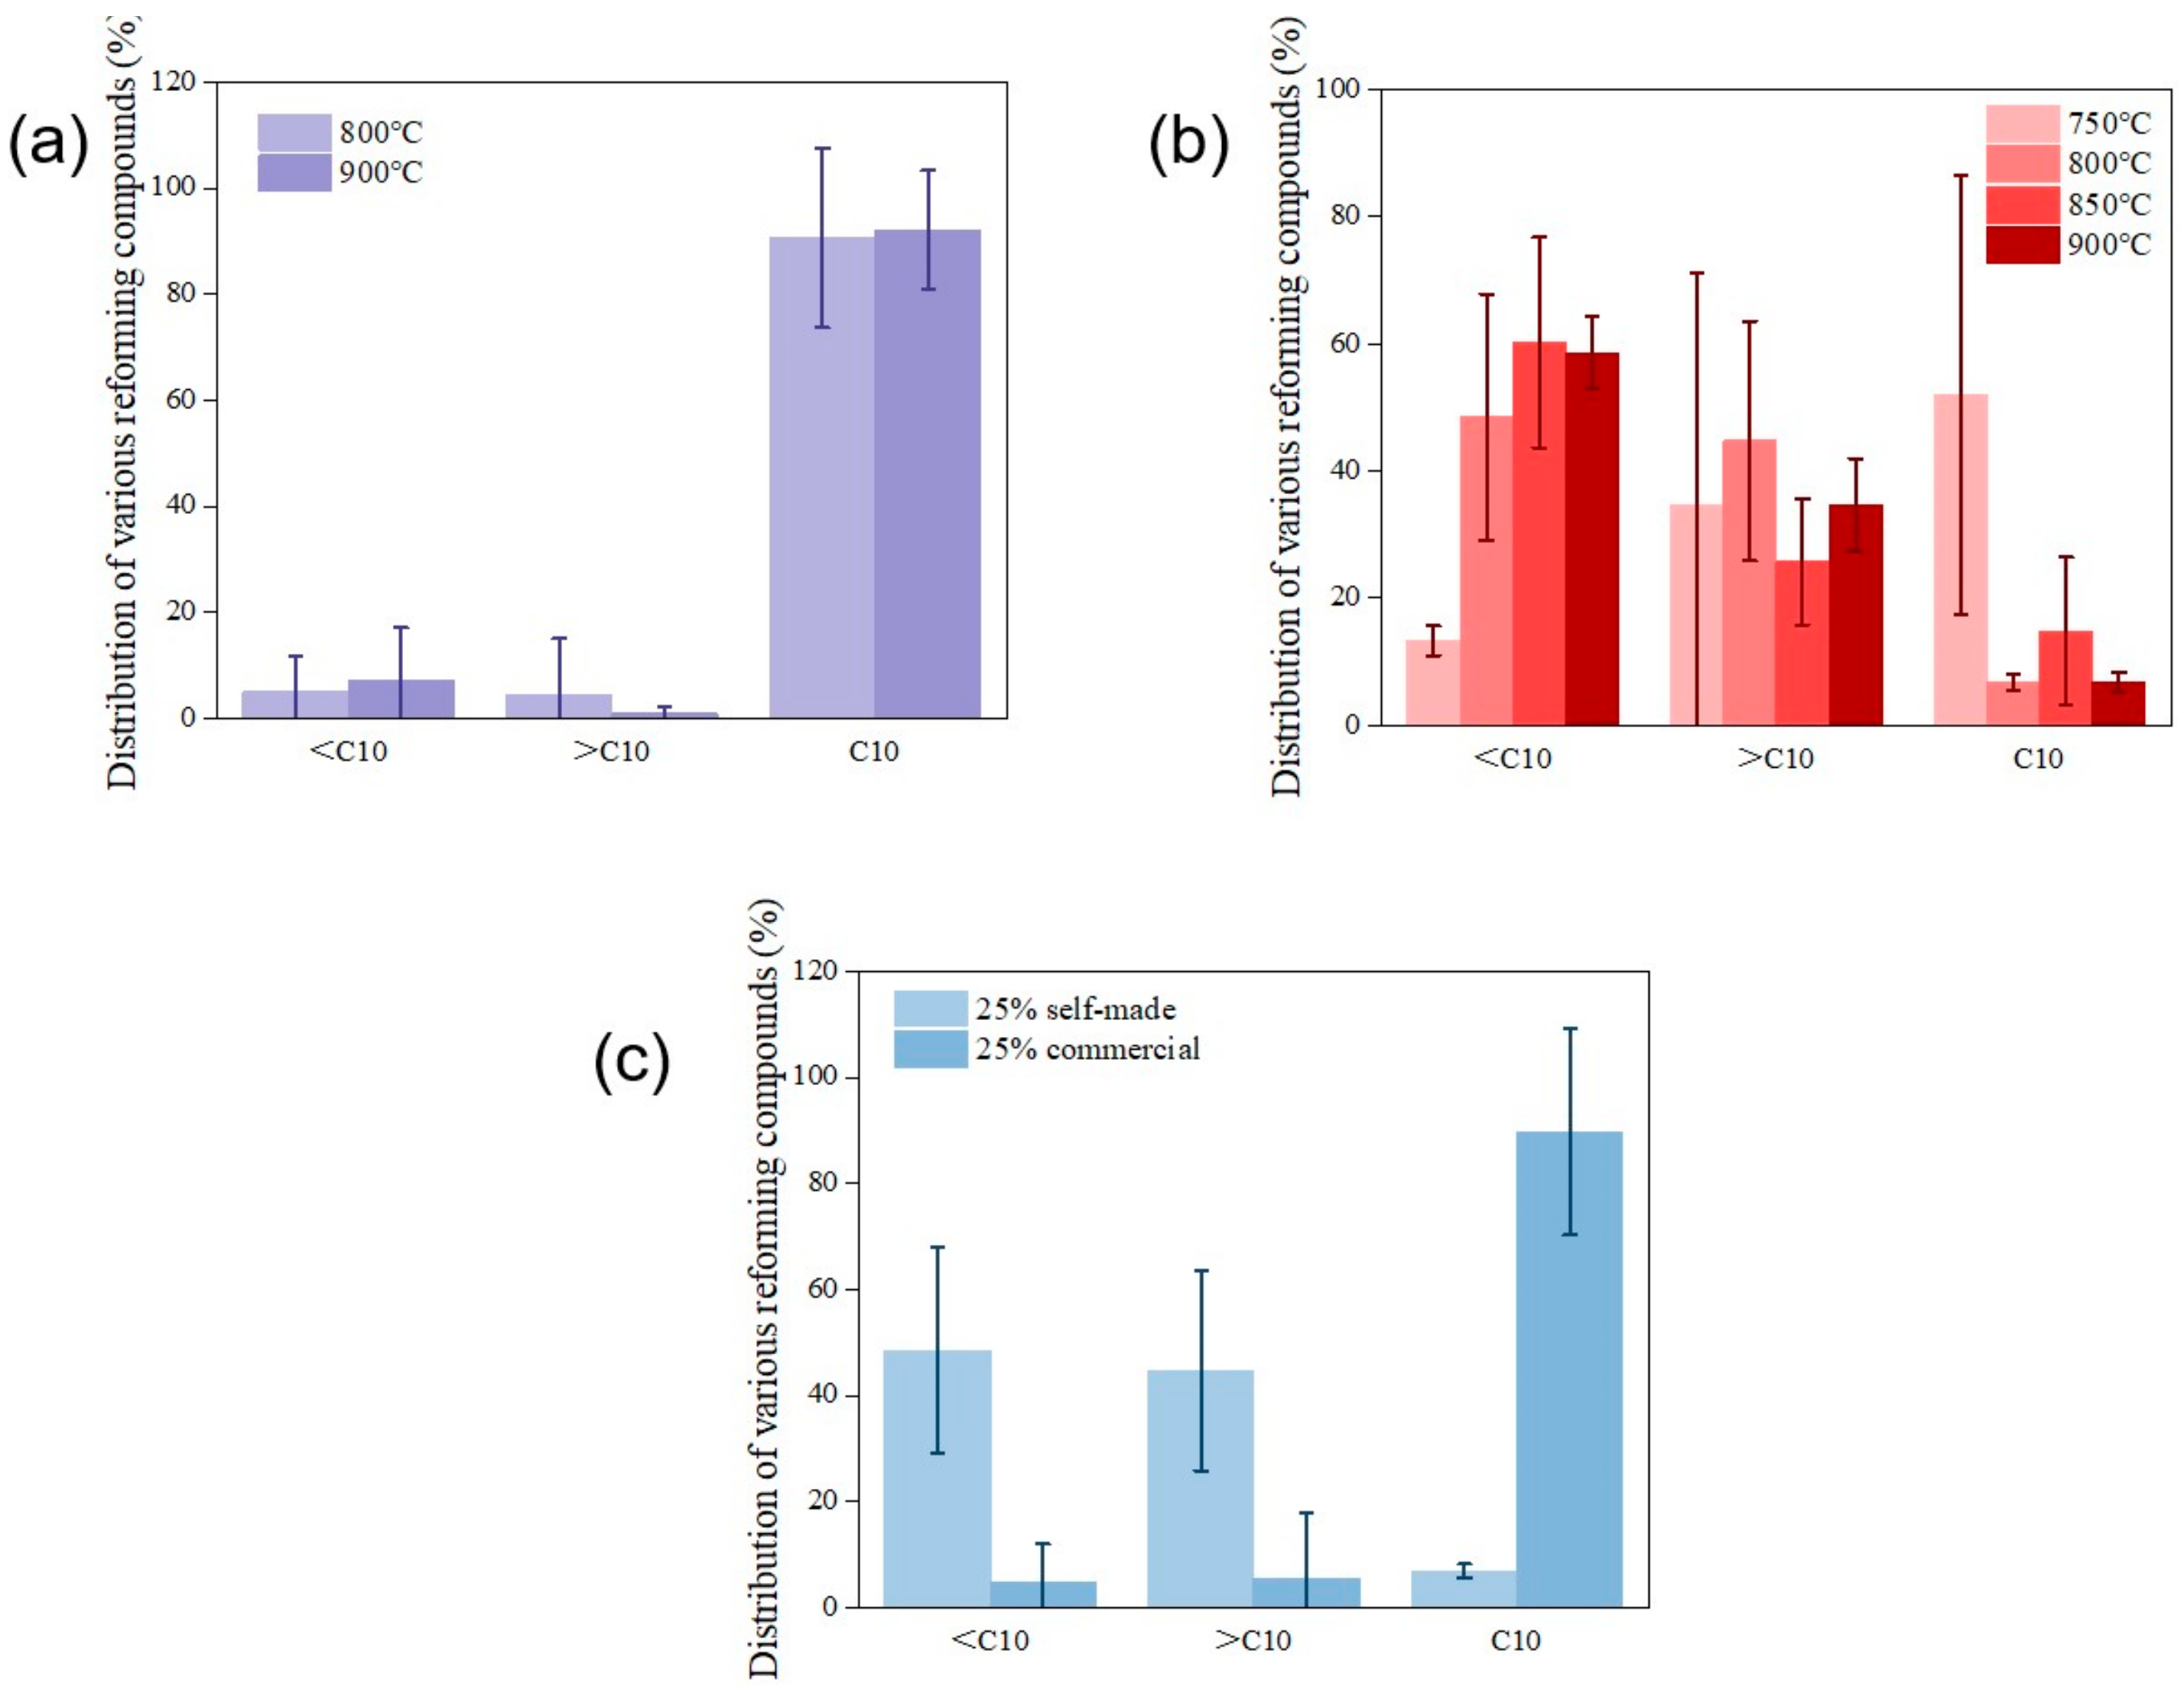
2.2.5. Gas Chromatography Analysis of Tar-Reforming End Products
2.2.6. Characterization of Various Catalysts before and after Tar Reforming for Mechanism Investigation
XRD Characterization
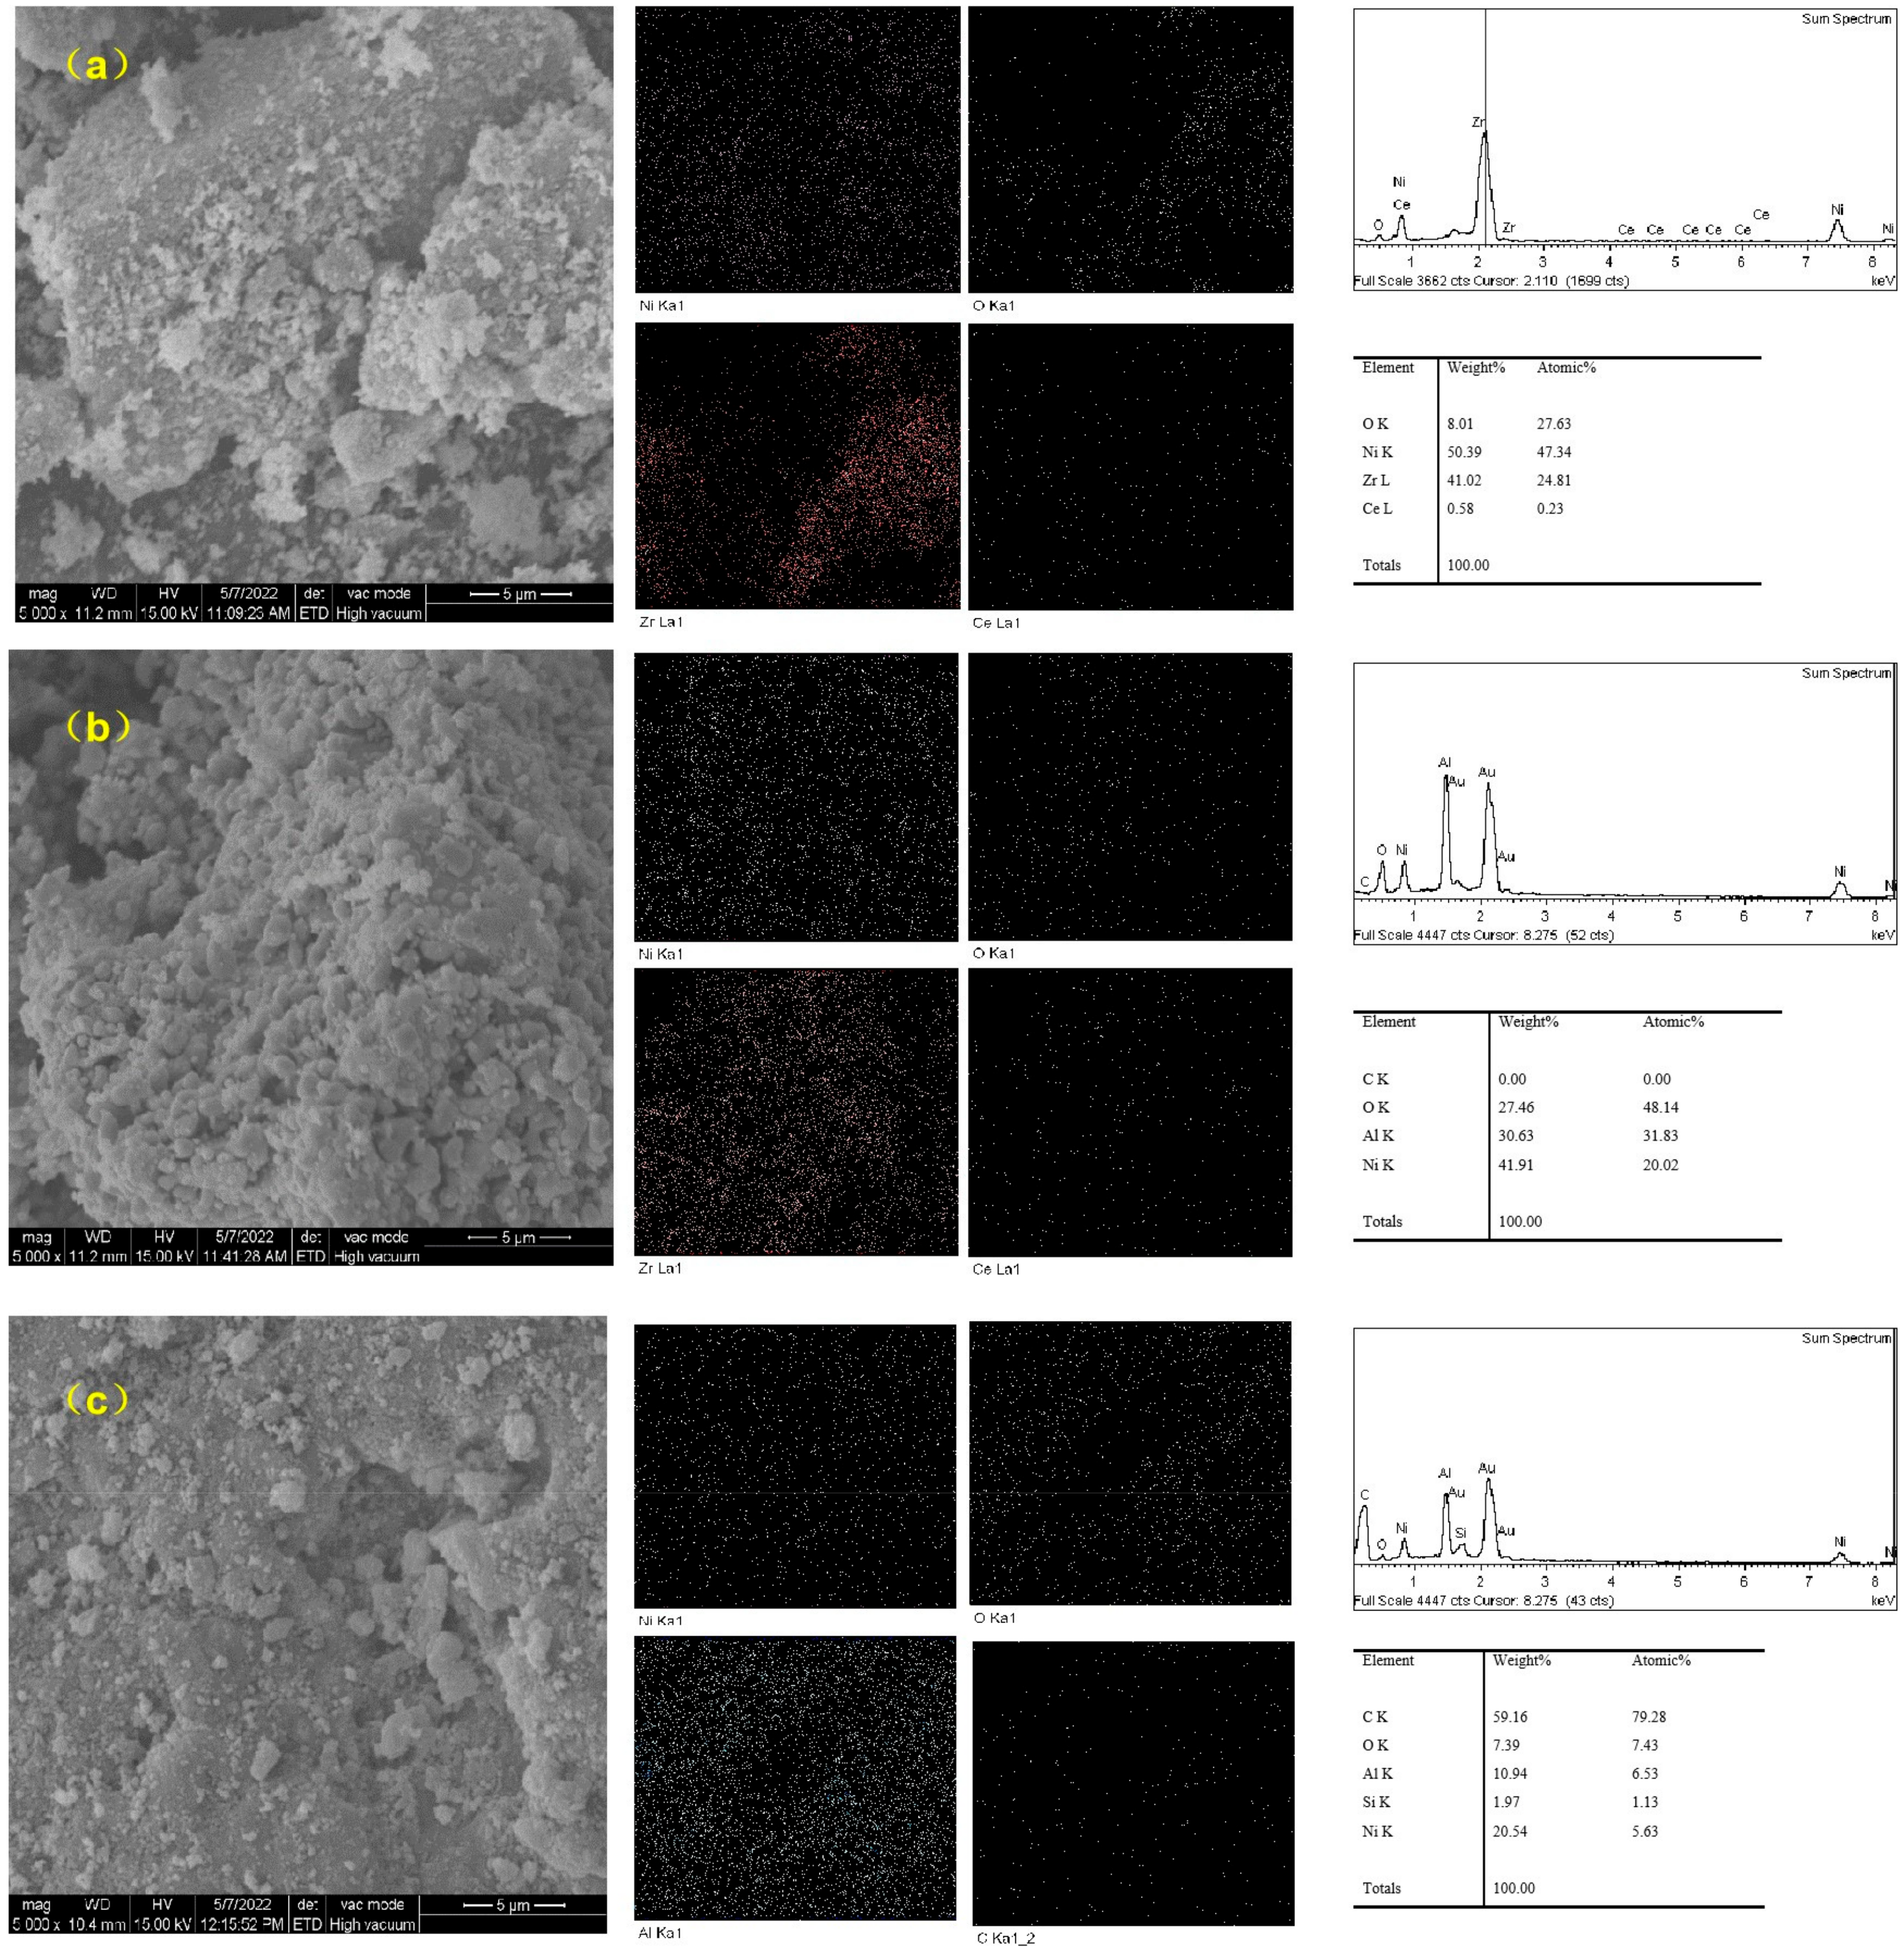
SEM Characterization
BET Characterization
3. Materials and Methods
3.1. Catalyst Preparation
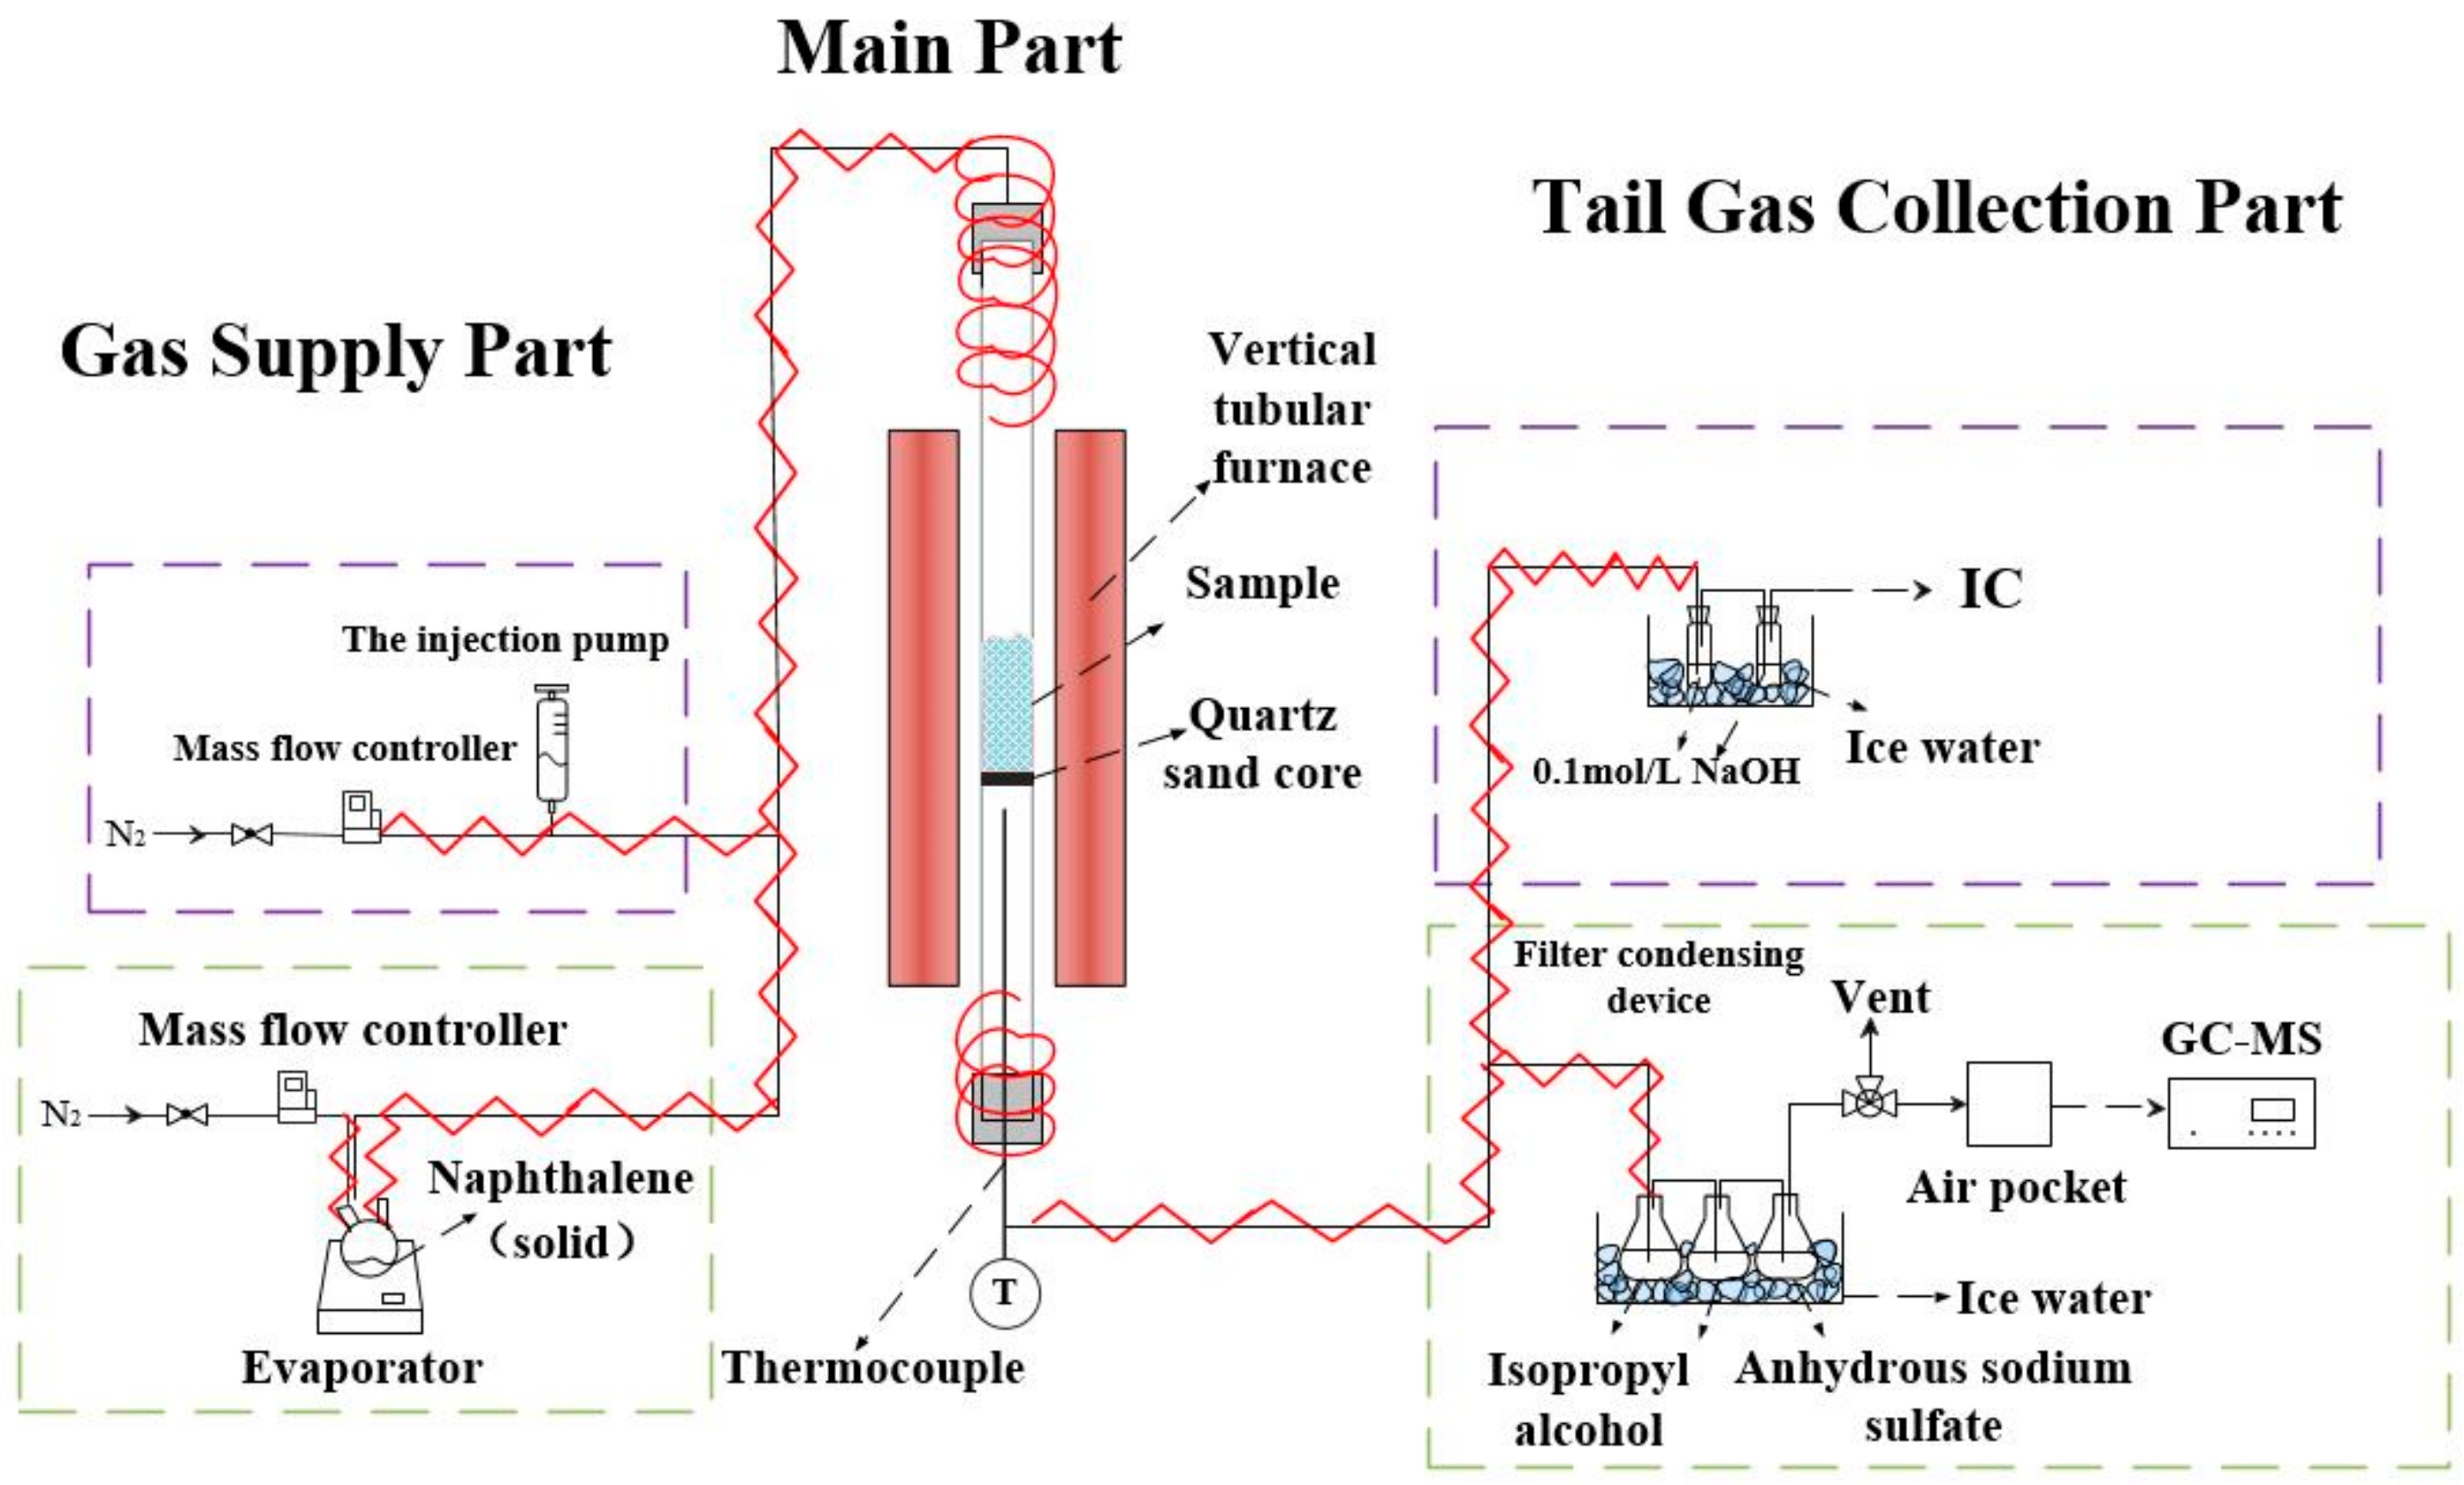
3.2. Experimental Setup
3.3. Calculations and Characterization
3.3.1. Data Analysis
3.3.2. Characterization
4. Conclusions
- (1)
- CaO adsorbent shows high efficiency of combining with HCl. At 400 °C, the removal rate of CaO adsorbent with HCl reaches 95.62%, and the adsorption capacity of the adsorbent may decrease when the temperature exceeds 500 °C. The reaction between NaAlO2 adsorbent and HCl is more intense, but with the increase in the amount of adsorbent, HCl cannot easily enter the interior of the adsorbent and react with it. Therefore, for NaAlO2, the removal efficiency of HCl is the highest when the reaction space velocity ratio is 1.0.
- (2)
- Experiments show that both the prepared nickel-based industrial catalysts for tar catalytic reforming and the synthesized catalysts can provide more than 80% tar removal. When the space velocity ratio is 1.89, a larger reaction area can be provided for naphthalene catalytic reforming. At 800 °C, 25% Ni-based synthetic catalyst can convert tar to low-molecular-weight organic compounds (compounds with a carbon number greater than 10). While commercial catalysts may have similar tar removal effects, the greater carbon precipitation potential hinders the sustainability of their long-term applications.
- (3)
- For tar catalytic reforming experiments, no matter whether for commercial or homemade catalysts, the oxygen of nickel oxide in the catalyst is consumed in the catalytic reforming process to form CO, CO2, etc., which indicates that a small amount of oxygen left after the reaction may come from the carrier. Naphthalene has difficulty reaching the catalyst in the process of high temperature reaction, thus forming an incomplete reaction to yield fixed carbon, covering the reactor and the surface with catalyst particles, thus preventing further catalytic reaction. Carbon deposition and coking are the two main causes of catalyst deactivation.
- (4)
- The syngas purification system used in this study has strong potential application value in removing tar and acid gas produced by gasification. However, the larger scale of domestic waste purification technology needs to be discussed in future studies, and more attention should be paid to the possibility of converting tar into small molecular organic compounds for reuse and the treatment of deactivated catalysts.
Author Contributions
Funding
Data Availability Statement
Acknowledgments
Conflicts of Interest
References
- Hameed, Z.; Aslam, M.; Khan, Z.; Maqsood, K.; Atabani, A.E.; Ghauri, M.; Khurrama, M.S.; Rehan, M.; Nizami, A.-S. Gasification of municipal solid waste blends with biomass for energy production and resources recovery: Current status, hybrid technologies and innovative prospects. Renew. Sustain. Energy Rev. 2021, 136, 110375. [Google Scholar] [CrossRef]
- Lee, D.-J. Gasification of municipal solid waste (MSW) as a cleaner final disposal route: A mini-review. Bioresour. Technol. 2022, 344, 126217. [Google Scholar] [CrossRef] [PubMed]
- Woolcock, P.J.; Brown, R.C. A review of cleaning technologies for biomass-derived syngas. Biomass Bioenergy 2013, 52, 54–84. [Google Scholar] [CrossRef]
- Veses, A.; Sanahuja-Parejo, O.; Callen, M.S.; Murillo, R.; Garcia, T. A combined two-stage process of pyrolysis and catalytic cracking of municipal solid waste for the production of syngas and solid refuse-derived fuels. Waste Manag. 2020, 101, 171–179. [Google Scholar] [CrossRef] [PubMed]
- Yrjas, P.; Iisa, K.; Hupa, M. Limestone and dolomite as sulfur absorbents under pressurized gasification conditions. Fuel 1996, 75, 89–95. [Google Scholar] [CrossRef]
- Heesink, A.; Swaaij, W. The sulphidation of calcined limestone with hydrogen sulphide and carbonyl sulphide. Chem. Eng. Sci. 1995, 50, 2983–2996. [Google Scholar] [CrossRef] [Green Version]
- Al-Fatesh, A.S.; Khatri, J.; Kumar, R.; Kumar Srivastava, V.; Osman, A.I.; AlGarni, T.S.; Ibrahim, A.A.; Abasaeed, A.E.; Fakeeha, A.H.; Rooney, D.W. Role of Ca, Cr, Ga and Gd promotor over lanthana-zirconia-supported Ni catalyst towards H2-rich syngas production through dry reforming of methane. Energy Sci. Eng. 2022, 10, 866–880. [Google Scholar] [CrossRef]
- Irfan, M.; Li, A.; Zhang, L.; Ji, G.; Gao, Y.; Khushk, S. Hydrogen-rich syngas from wet municipal solid waste gasification using Ni/Waste marble powder catalyst promoted by transition metals. Waste Manag. 2021, 132, 96–104. [Google Scholar] [CrossRef]
- Liu, Z. Gasification of municipal solid wastes: A review on the tar yields. Energy Sources Part A Recovery Util. Environ. Eff. 2019, 41, 1296–1304. [Google Scholar] [CrossRef]
- Husár, J.; Haydary, J.; Šuhaj, P.; Steltenpohl, P. Potential of tire pyrolysis char as tar-cracking catalyst in solid waste and biomass gasification. Chem. Pap. 2019, 73, 2091–2101. [Google Scholar] [CrossRef]
- Chan, W.P.; Veksha, A.; Lei, J.; Oh, W.-D.; Dou, X.; Giannis, A.; Lisak, G.; Lim, T.-T. A hot syngas purification system integrated with downdraft gasification of municipal solid waste. Appl. Energy 2019, 237, 227–240. [Google Scholar] [CrossRef]
- Fakeeha, A.H.; Naeem, M.A.; Khan, W.U.; Al-Fatesh, A.S. Syngas production via CO2 reforming of methane using Co-Sr-Al catalyst. J. Ind. Eng. Chem. 2014, 20, 549–557. [Google Scholar] [CrossRef]
- Zhang, L.; Wu, W.; Siqu, N.; Dekyi, T.; Zhang, Y. Thermochemical catalytic-reforming conversion of municipal solid waste to hydrogen-rich synthesis gas via carbon supported catalysts. Chem. Eng. J. 2019, 361, 1617–1629. [Google Scholar] [CrossRef]
- Abdoulmoumine, N.; Adhikari, S.; Kulkarni, A.; Chattanathan, S. A review on biomass gasification syngas cleanup. Appl. Energy 2015, 155, 294–307. [Google Scholar] [CrossRef]
- Dutta, A.; Cheah, S.; Bain, R.; Feik, C.; Magrini-Bair, K.; Phillips, S. Integrated Process Configuration for High-Temperature Sulfur Mitigation during Biomass Conversion via Indirect Gasification. Ind. Eng. Chem. Res. 2012, 51, e47856. [Google Scholar] [CrossRef] [Green Version]
- Zhang, Z.; Liu, L.; Shen, B.; Wu, C. Preparation, modification and development of Ni-based catalysts for catalytic reforming of tar produced from biomass gasification. Renew. Sustain. Energy Rev. 2018, 94, 1086–1109. [Google Scholar] [CrossRef] [Green Version]
- Zhang, L.; Wu, W.; Zhang, Y.; Zhou, X. Clean synthesis gas production from municipal solid waste via catalytic gasification and reforming technology. Catal. Today 2018, 318, 39–45. [Google Scholar] [CrossRef]
- Ibrahim, A.A.; Fakeeha, A.H.; Lanre, M.S.; Al-Awadi, A.S.; Alreshaidan, S.B.; Albaqmaa, Y.A.; Adil, S.F.; Al-Zahrani, A.A.; Abasaeed, A.E.; Al-Fatesh, A.S. The Effect of Calcination Temperature on Various Sources of ZrO2 Supported Ni Catalyst for Dry Reforming of Methane. Catalysts 2022, 12, 361. [Google Scholar] [CrossRef]
- Zhang, R.; Wang, Y.; Brown, R.C. Steam reforming of tar compounds over Ni/olivine catalysts doped with CeO2. Energy Convers. Manag. 2007, 48, 68–77. [Google Scholar] [CrossRef]
- Mura, G.; Lallai, A. On the kinetics of dry reaction between calcium oxide and gas hydrochloric acid. Chem. Eng. Sci. 1992, 47, 2407–2411. [Google Scholar] [CrossRef]
- Mura, G.; Lallai, A. Reaction kinetics of gas hydrogen chloride and limestone. Chem. Eng. Sci. 1994, 49, 4491–4500. [Google Scholar] [CrossRef]
- Weinell, C.E.; Jensen, P.I.; Dam-Johansen, K.; Livbjerg, H. Hydrogen chloride reaction with lime and limestone: Kinetics and sorption capacity. Ind. Eng. Chem. Res. 1992, 31, 164–171. [Google Scholar] [CrossRef]
- Dou, X.; Veksha, A.; Chan, W.P.; Oh, W.-D.; Liang, Y.N.; Teoh, F.; Mohamed, D.K.; Giannis, A.; Lisak, G.; Lim, T.-T. Poisoning effects of H2S and HCl on the naphthalene steam reforming and water-gas shift activities of Ni and Fe catalysts. Fuel 2019, 241, 1008–1018. [Google Scholar] [CrossRef]
- Qian, K.; Kumar, A. Catalytic reforming of toluene and naphthalene (model tar) by char supported nickel catalyst. Fuel 2017, 187, 128–136. [Google Scholar] [CrossRef] [Green Version]
- Ashok, J.; Kawi, S. Nickel–Iron Alloy Supported over Iron–Alumina Catalysts for Steam Reforming of Biomass Tar Model Compound. ACS Catal. 2014, 4, 289–301. [Google Scholar] [CrossRef]
- Wu, W.; Zhou, X.; Zhang, P.; Liu, W.; Danzeng, D.; Wang, S.; Wang, Y. Study on Characteristics of Synthesis Gas Generation During Catalytic Gasification of Municipal Solid Waste. Procedia Environ. Sci. 2016, 31, 505–513. [Google Scholar] [CrossRef]


| NaAlO2 | Before Reaction | After Reaction |
|---|---|---|
| BET surface area (m2/g) | 0.8188 | 0.9314 |
| Pore volume (cm3/g) | 6.77 × 10⁻³ | 4.58 × 10⁻³ |
| Average diameter (nm) | 44.61 | 26.09 |
| 25% Ni-Based Synthetic Catalyst | Before Reaction | After Reaction |
|---|---|---|
| BET surface area (m2/g) | 3.03 | 4.84 |
| Pore volume (cm3/g) | 2.74 × 10⁻² | 4.82 × 10⁻² |
| Average diameter (nm) | 36.90 | 39.80 |
| Metal Oxides (%) | Commercial (25%) | Self-Made (15%) | Self-Made (25%) |
|---|---|---|---|
| Al2O3 | 71.896 | 0 | 0 |
| ZrO2 | 0 | 71.05 | 63.21 |
| CeO2 | 0 | - | - |
| NiO | 24.252 | 17.43 | 27.83 |
| SO3 | 1.157 | 0.79 | 0.69 |
| SiO2 | 2.219 | 0 | 0 |
| P2O5 | 0 | 0 | 0 |
| CaO | 0.228 | 0 | 0 |
| Ta2O5 | 0.089 | 0 | 0 |
| Fe2O3 | 0.092 | 0 | 0 |
| Cr2O3 | 0.021 | 0 | 0 |
| K2O | 0.027 | 0 | 0 |
| HfO2 | 0 | 1.45 | 1.23 |
| MoO3 | 0 | 0.62 | 0.62 |
| Nb2O3 | 0 | 0.31 | 0.16 |
| Na2O | 0 | 0 | 0.13 |
Publisher’s Note: MDPI stays neutral with regard to jurisdictional claims in published maps and institutional affiliations. |
© 2022 by the authors. Licensee MDPI, Basel, Switzerland. This article is an open access article distributed under the terms and conditions of the Creative Commons Attribution (CC BY) license (https://creativecommons.org/licenses/by/4.0/).
Share and Cite
Yuan, G.; Zhou, W.; Yang, R.; Liu, Y.; Zhu, J.; Yin, K.; Chen, D. Acid Gas and Tar Removal from Syngas of Refuse Gasification by Catalytic Reforming. Catalysts 2022, 12, 1519. https://doi.org/10.3390/catal12121519
Yuan G, Zhou W, Yang R, Liu Y, Zhu J, Yin K, Chen D. Acid Gas and Tar Removal from Syngas of Refuse Gasification by Catalytic Reforming. Catalysts. 2022; 12(12):1519. https://doi.org/10.3390/catal12121519
Chicago/Turabian StyleYuan, Guoan, Wei Zhou, Rui Yang, Yuru Liu, Jingyu Zhu, Ke Yin, and Dezhen Chen. 2022. "Acid Gas and Tar Removal from Syngas of Refuse Gasification by Catalytic Reforming" Catalysts 12, no. 12: 1519. https://doi.org/10.3390/catal12121519
APA StyleYuan, G., Zhou, W., Yang, R., Liu, Y., Zhu, J., Yin, K., & Chen, D. (2022). Acid Gas and Tar Removal from Syngas of Refuse Gasification by Catalytic Reforming. Catalysts, 12(12), 1519. https://doi.org/10.3390/catal12121519