Review

Brief Review on High-Temperature Electrochemical Hydrogen Sensors

by
Elena Gorbova
1,2,3,
Georgia Balkourani
1,
Costas Molochas
1,
Dimitrios Sidiropoulos
1,
Angeliki Brouzgou
4,*,
Anatoly Demin
2,3,* and
Panagiotis Tsiakaras
1,2,3,*
1
Laboratory of Alternative Energy Conversion Systems, Department of Mechanical Engineering, School of Engineering, University of Thessaly, 1 Sekeri Str., Pedion Areos, 38834 Volos, Greece
2
Institute of Chemical Engineering, Ural Federal University, 19 Mira Str., 620002 Yekaterinburg, Russia
3
Laboratory of Electrochemical Devices Based on Solid Oxide Proton Electrolytes, Institute of High Temperature Electrochemistry (RAS), 620990 Yekaterinburg, Russia
4
Department of Energy Systems, Faculty of Technology, University of Thessaly, Geopolis, 41500 Larissa, Greece
*
Authors to whom correspondence should be addressed.
Catalysts 2022, 12(12), 1647; https://doi.org/10.3390/catal12121647
Submission received: 22 November 2022 / Revised: 9 December 2022 / Accepted: 12 December 2022 / Published: 15 December 2022
(This article belongs to the Section Electrocatalysis)

Abstract

:
Hydrogen sensors, especially those operating at high temperatures, are essential tools for the emerging hydrogen economy. Monitoring hydrogen under process conditions to control the reactions for detecting confined species is crucial to the safe, widespread use and public acceptance of hydrogen as fuel. Hydrogen sensors must have a sensitivity ranging from traces of hydrogen (parts per million (ppm)) up to levels near the lower explosive limit (LEL = 4% H2 in the air) for safety reasons. Furthermore, they need to operate in cryogenic, ambient, and high-temperature environments. Herein, emphasis is given to hydrogen sensors based on solid oxide electrolytes (operating at high temperatures), in particular oxygen ion and proton conductors. The review is devoted to potentiometric, amperometric, and combined amperometric-potentiometric hydrogen sensors. Experimental results already reported in the international literature are presented and analyzed to reveal the configuration, principle of operation, and the applied solid electrolytes and electrodes of the high-temperature hydrogen sensors. Additionally, an amperometric sensor able to detect hydrogen and steam in atmospheric air through a two-stage procedure is presented and thoroughly discussed. The discussion reveals that high-temperature hydrogen sensors face different challenges in terms of the electrodes and solid electrolytes to be used, depending on the operating principle of each sensor type.

1. Introduction

Among the reducing gases, hydrogen (H2) is undoubtedly regarded by the scientific and industrial communities as one of the most important. Participating in many chemical processes, hydrogen has a plethora of industrial applications, such as power generation, petrochemicals, transportation, and organic synthesis [1,2]. Currently, hydrogen is gaining widespread interest as a sustainable energy carrier used in fuel cells for power generation in automotive applications. The emissions of fuel cells are negligible compared to those of internal combustion engines, contributing to the mitigation of environmental pollution [3]. Thus, hydrogen as a fuel has the potential to meet energy demands and simultaneously ensure environmental and human safety.
Hydrogen possesses unique properties compared with combustible gases, such as propane, methane, and gasoline. More precisely, it is the lightest element having a low boiling point (20.39 K) and, simultaneously, high fluidity. Concerning its combustion properties, hydrogen has a considerably higher heat of combustion than other combustible gases (142 kJ/g H2), with the ignition temperature in the air ranging from 520 to 580 °C. Moreover, hydrogen has minimum ignition energy of about 0.02 mJ combined with a broad flammable range in the air (4–75 vol.%) [4]. In case of a leak, hydrogen can be easily ignited, thus, hydrogen sensing technologies are an integral part of the hydrogen energy future. More precisely, hydrogen sensors are required to detect hydrogen leaks and measure hydrogen content during storage, production, and transportation. Consequently, hydrogen sensors can be used in various applications, such as hydrogen production plants, storage tanks, and automotive vehicles, playing a vital role in their operation [5,6].
The detection of hydrogen and the quantification of its concentration are only realized through suitably designed sensors, as it is an odorless, colorless, and tasteless gas. These sensors should provide accurate, fast, and selective measurements of hydrogen gas under the operating conditions of the corresponding applications. Moreover, many industrial fields, such as metallurgy, petrochemicals, nuclear, and manufacturing, require hydrogen sensors that can operate at high temperatures and in harsh environments (e.g., hydrogen monitoring in molten aluminum during the casting process [7,8] or in nuclear power stations for the safety of nuclear reactors [5,6]).
Several hydrogen sensing technologies have emerged through ongoing scientific research. Electrochemical hydrogen sensors are among the well-established technologies bearing a considerable impact on the sensors’ market. These sensors use oxygen-anion and proton-conducting solid electrolytes to detect hydrogen in high temperatures. Generally, they are applied in many industrial sectors, such as automotives, steelmaking, etc. Their widespread use arises from the remarkable properties of solid-state electrolytes, which are stable, highly ionic-conductive in elevated working temperatures, and resistant to harsh operating conditions [9].
Depending on the operating principle and response signal, electrochemical hydrogen sensors can be divided into potentiometric, amperometric, and combined amperometric-potentiometric sensors. The potentiometric hydrogen sensors include the equilibrium (Nernst type) and non-equilibrium potentiometric sensors (mixed potential sensors). In potentiometric hydrogen sensors, the voltage between the electrodes is the response signal and is logarithmically related to the concentration of hydrogen. In amperometric hydrogen sensors, the output current caused by an externally applied voltage provides information about the hydrogen content in the analyzed gas. In combined amperometric-potentiometric hydrogen sensors, there are two electrochemical cells; one operates as an amperometric and the other as a potentiometric sensor. In this case, the operating principle is more complex than single amperometric or potentiometric sensors, but the detection reliability is enhanced [6,10].
The detection of hydrogen with potentiometric sensors using oxygen-conducting solid electrolytes has been thoroughly investigated. The well-established yttria-stabilized zirconia (YSZ) and selective oxide electrodes have been intensively reported for hydrogen measurement [11,12,13]. Despite the numerous investigations, hydrogen detection with these devices remains problematic. The problem mainly pertains to selecting a reference electrode that maintains a stable potential throughout the sensor operation. This challenge is not easy to overcome, given that the operating temperatures of these sensors exceed 600 °C [10].
On the contrary, hydrogen detection, employing proton-conducting solid electrolytes, is gradually gaining increasing research attention. This class of solid electrolytes presents good physical and chemical durability under harsh working environments, expanding their range of high-temperature applications. For instance, high-temperature proton conductors have been implemented in hydrogen sensors and were examined for application in steelmaking and aluminum casting processes [14,15]. Generally, the investigation of proton conductors has mainly been focused on oxide materials based on BaCeO3 and BaZrO3 because they combine high conductivity and stability [16,17,18,19,20]. Nevertheless, alternative solid-state materials with lower proton conductivity, such as LaNbO4 and Ba2ln2O5, also attracted great attention. Still, the abovementioned materials should meet strict requirements to be used practically as gas sensor electrolytes. More precisely, they should present pure ionic conductivity, high stability in aggressive environments, and similar thermal expansion to the sensor components [16].
In the present review, representative literature studies of high-temperature hydrogen sensors are discussed to provide the fundamental aspects of the operation, configuration, and materials used in solid-state electrolytes and electrodes. The discussion is focused on potentiometric (equilibrium and non-equilibrium), amperometric, and combined amperometric-potentiometric hydrogen sensors. Lastly, a special mention is made of a novel amperometric sensor recently designed to detect hydrogen and steam in atmospheric air through a two-stage procedure.

2. Types of Electrochemical Hydrogen Sensors

In this section, literature works are discussed to reveal the fundamentals of high-temperature hydrogen sensors. The hydrogen sensors are presented according to their type of operational principle, i.e., potentiometric, amperometric, and combined amperometric-potentiometric. For more details on the fundamental principles of high-temperature gas detection sensors, the readers are referred to a previously reported, more extensive, comprehensive review [10].

2.1. Potentiometric Hydrogen Sensors

2.1.1. Equilibrium Potentiometric Sensors

The operation of equilibrium potentiometric sensors is based on the concentration gradient of the detected gas between the reference (RE) and the sensing electrode (SE). Focusing on hydrogen sensors, the different partial pressures of hydrogen at each compartment correspond to different chemical potentials due to the varying concentrations of the hydrogen ions, thus generating an electromotive force (EMF) in the cell. The EMF is the sensor’s open circuit voltage (OCV), meaning the potential difference between SE and RE, and can be calculated by the Nernst equation [10,21]:
E = RT 2 F ln ( P H 2 P H 2 )
where R is the ideal gas constant, F is the Faraday constant, T is the absolute temperature, and P H 2 and P H 2 are the hydrogen partial pressures in the sensing and reference compartments.
If the hydrogen partial pressure in the reference atmosphere is adjusted, then by measuring the OCV, the hydrogen concentration of interest can be calculated. The solid electrolyte separating the RE and SE is a key component in designing stable and sensitive potentiometric hydrogen sensors, as it stabilizes the OCV through its ionic conductivity. For industrial applications, solid electrolytes should possess high ionic conductivity combined with a low detection limit and a wide range of thermal stability [22].
Iwahara et al. [23] fabricated and tested a Nernstian-type hydrogen sensor using a proton-conducting electrolyte based on BaCeO3 at 200–900 °C. More precisely, the ceramic material, with the chemical composition of BaCe0.9Nd0.1O3-α (BCN), where α denotes the oxygen deficit per perovskite-type unit cell, was applied in two types of concentration cells, as illustrated in Figure 1a, including two platinum electrodes (Pt|BCN|Pt). The type A cell was utilized for high-temperature hydrogen detection, and the type B cell for lower temperatures (<400 °C).
The manufactured sensor used pure hydrogen (pH2 = 1 atm) as the reference atmosphere and a mixture containing hydrogen and argon (pH2 = 10−4–1 atm) as the analyzed atmosphere. The hydrogen sensor presented stable EMFs in the wide range of tested pH2 and operating temperatures, confirming the high protonic conductivity of the BCN solid electrolyte (Figure 1b). As shown in Figure 1b, the experimental measurements of EMF values conform to the theoretical values derived from the Nernst equation, indicating a reversible behavior. The slight deviation at lower temperatures and pH2 was considered independent of the BCN and attributed to hydrogen diffusion limitations in the porous Pt electrode. The authors examined the impact of oxygen on EMF to reveal the source of BCN conductivity. BCN conductivity was independent of pO2 at about 600 °C, exhibiting proton conduction. However, at higher temperatures, above 700 °C, the BCN conductivity was increased with increasing pO2, indicating a p-type (hole) conduction. Nevertheless, as the authors stated [23], there were some phenomena observed for this material that cannot be fully explained assuming proton or p-type conduction.
Subsequently, Yajima et al. [24] tested the composite AlPO4∙xH2O-La0.4Sr0.6CoO3 (AP-LSC) as standard material and CaZr0.9ln0.1O3-δ (CZI) as proton-conducting electrolyte to fabricate a high-temperature Nernstian-type hydrogen sensor for CO2-containing gas atmospheres. The optimum ratio in weight of AlPO4∙xH2O (where x = 0.34) to La0.4Sr0.6CoO3 was calculated to be 1:9 for the solid standard material. The produced sensor based on the H2 + Ar, Pt|CZI|Pt, AP-LSC cell was proved suitable for hydrogen concentration analysis at 700 °C, showing stable EMF response with linearity over a wide range of hydrogen pressure, as can be seen in Figure 1c. Additionally, the fabricated sensor showed a fast response (Figure 1d) when 0.9% of the hydrogen was replaced with argon and vice versa, reaching 90% of the final EMF within 20 s. Finally, the EMF of the hydrogen sensor remained stable in the presence of CO2, verifying its suitability for application in exhaust gases.
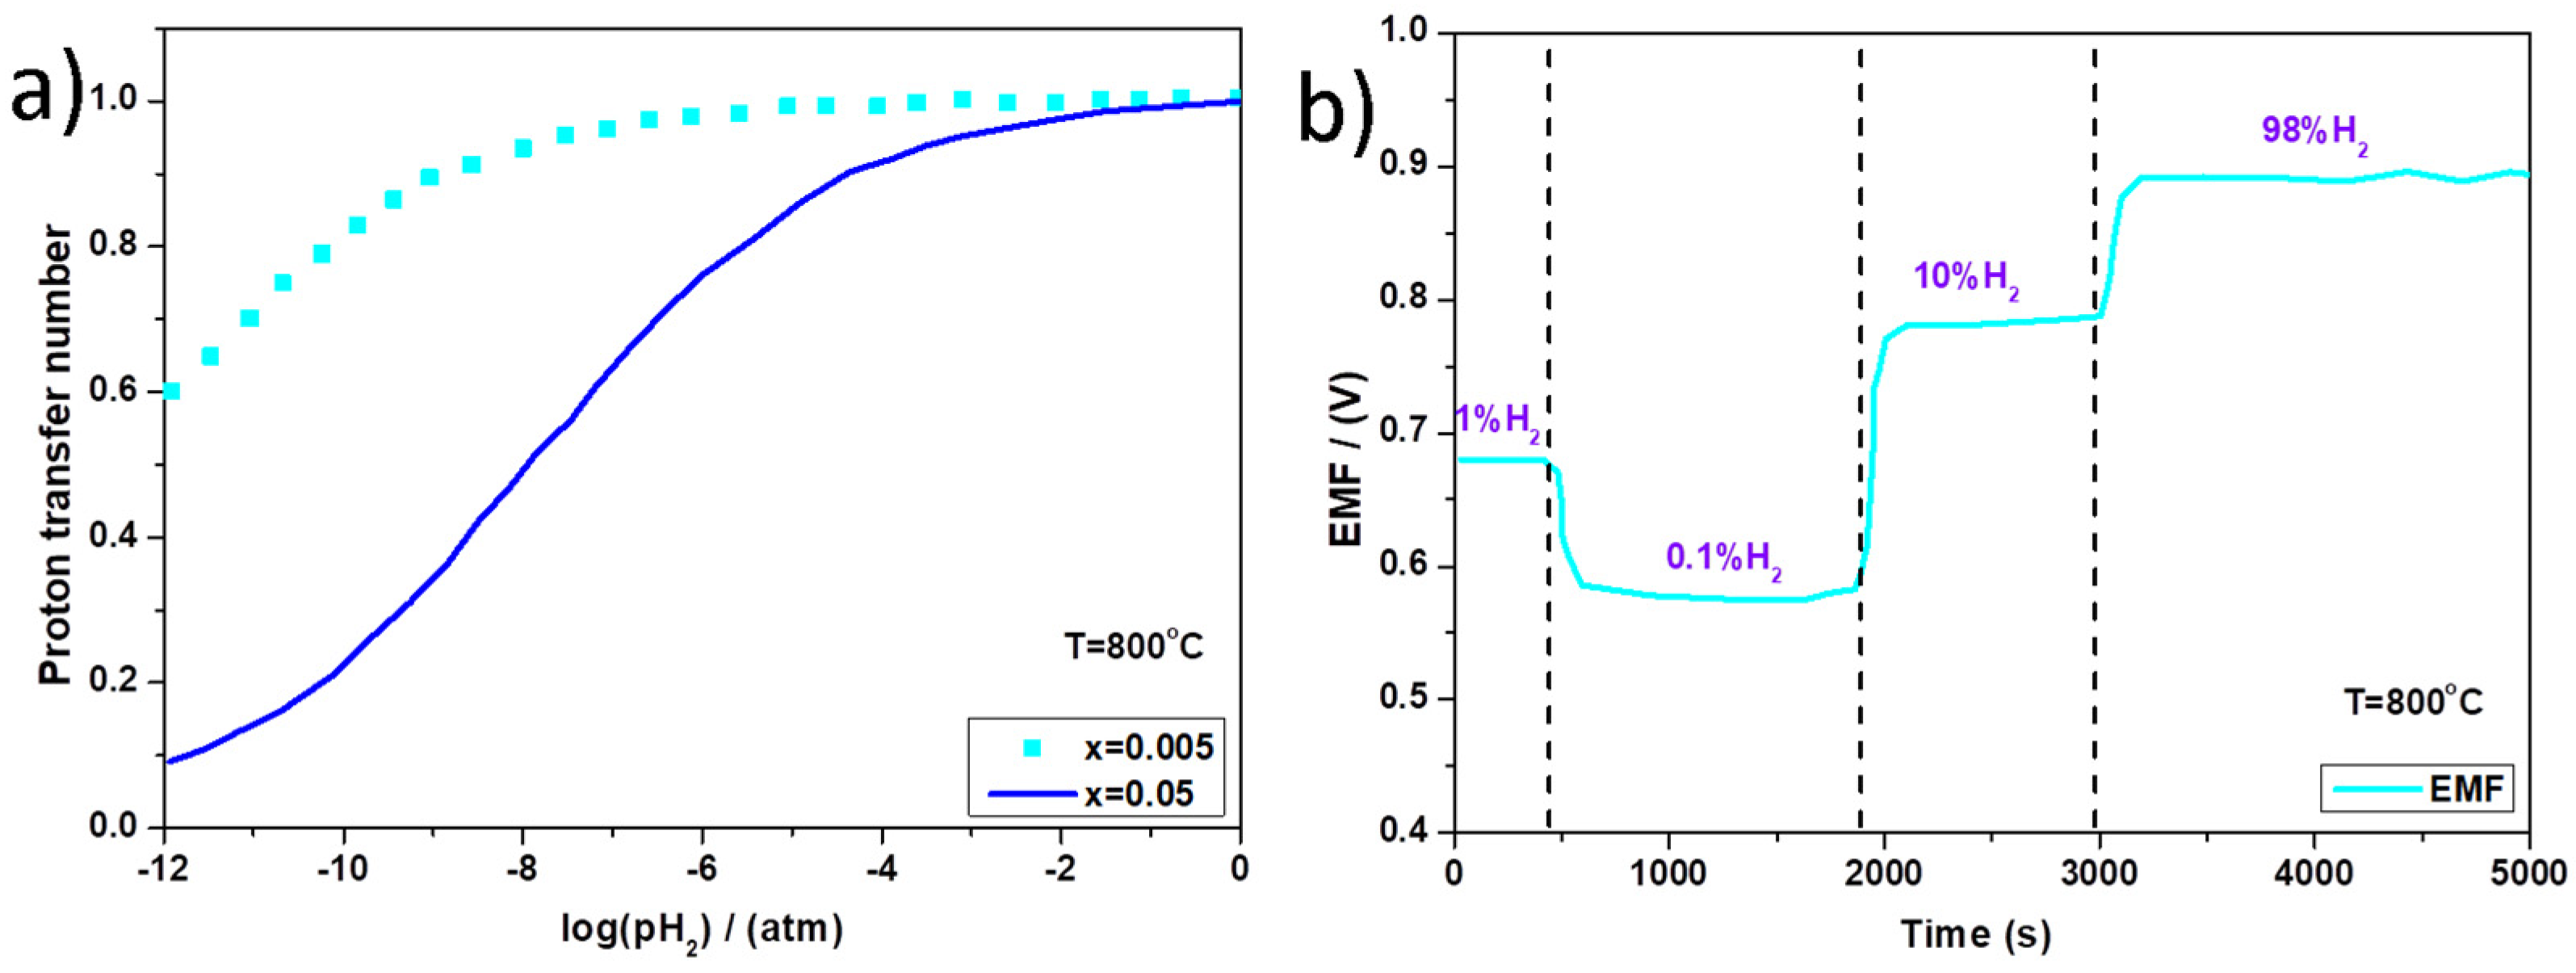
Recently, Mn-doped CaZrO3 (CZM) was examined by Okuyama et al. [25] as an electrolyte in an EMF-type hydrogen sensor to serve as a self-standing reference electrode in air. The bulk conductivity was measured for CaZr1-xMnxO3-δ (x = 0.05 or x = 0.005) in (i) 1.9% H2O, 1% O2/Ar, at 800 °C and (ii) 1.9% H2O, 1% H2/Ar, at 800 °C. The results revealed that CaZr0.95Mn0.05O3-δ has higher conductivity than the widely used CaZr0.9In0.1O3-δ in 1.9% H2O, 1% H2, in Ar atmosphere.
Moreover, the activation energy of the conductivity in 1.9% H2O, 1% O2/Ar was higher than in 1.9% H2O, 1% H2/Ar for CaZr1-xMnxO3 (more precisely for O2/Ar the activation energy values are: 1.10 eV for x = 0.05 and 1.23 eV for x = 0.005; while for H2/Ar those are: 0.66 eV for x = 0.05 and 0.63 eV for x = 0.005). That behavior implied an alteration of the predominant charge carrier and the conductivity’s dependence on the atmosphere. More precisely, hydrogen activity strongly affected the conductivity in H2O/H2. That observation, combined with EMF response studies, led to the conclusion that the Mn-doped CaZrO3 exhibits proton conduction in an H2O/H2 atmosphere and hole conduction in an H2O/O2 atmosphere [25].
The changes in the proton transfer number with the hydrogen activity change for the different manganese contents are shown in Figure 2a. More precisely, the value of the proton transfer number starts from 1 for CaZr0.95Mn0.05O3-δ in the hydrogen atmosphere and falls to under 0.2 in air [25].
It was also proven that when CaZr0.95Mn0.05O3-δ was used as an electrolyte and air as the reference gas in a gas concentration cell, the EMF depended only on the hydrogen potential of the working electrode. More particularly, the EMF of the constructed cell, shown in Figure 2b, varied with the hydrogen concentration changes. Thus, they constructed and evaluated a galvanic cell, where the reference atmosphere was wet air, and the analyzed atmosphere was a wet mixture containing hydrogen and argon. The obtained experimental data of the wet H2 + Ar, Pt | CaZr0.95Mn0.05O3-δ | Pt, wet air cell were in agreement with the operational principles of a hydrogen sensor based on the Nernst equation [25]. Considering its fast dynamic response, the developed sensor with the proton-conducting electrolyte (CZM) had the potential to detect hydrogen in hydrogen-rich atmospheres. It should be also noted that the described sensor was capable of detecting hydrogen even in mixtures with inert gases or nitrogen [12,21].

2.1.2. Mixed Potential Sensors

During recent decades, the detection of hydrogen in oxygen-containing media via mixed potential sensors has attracted research interest. In this type of sensor, an equilibrium potential cannot be established between the RE and SE, because of the competing reactions occurring on the SE. Therefore, a potential lying between the equilibrium potentials of the two compartments is formed. In this case, the observed non-Nernstian potential provides information about the hydrogen in a gas mixture [10,21,26]. Generally, mixed potential hydrogen sensors use YSZ as a solid electrolyte and platinum as a reference electrode (RE). Thus, the research on these sensors mainly focuses on developing suitable sensing electrodes (SEs).
Vogel et al. [27] tested different binary Pt alloys as SEs for small amounts of combustible gases, including CO and H2, during a combustion process. Pt was combined with Au, Ag, Ni, Cu, and Rh and compared to a Mo sensing electrode. The solid electrolyte used was stabilized zirconia, and Pt was used as the RE. It should be noted that, for applications in such harsh environments, sensors have to exhibit considerable long-term stability without degradation (1-year continuous operation), and the sensing electrodes have to operate stably at high temperatures (600 °C).
The results showed higher H2 than CO sensitivity for all the examined electrodes (Figure 3a,b). Pt/Au and Pt/Ni presented higher H2 sensitivity. The produced non-Nernstian potential was attributed to the competing electrochemical O2 reduction and H2 and CO oxidation on the SEs.
As for the different sensitivities of the SEs, it was argued that they are determined by the chemical and physical properties of the combined metals, i.e., the H2 and CO adsorption energies and the number of active catalyst sites. Based on this assumption and results, they concluded that Ag does not essentially adsorb CO while Au adsorbs CO adequately and H2 even more preferentially [27].
The sensitivity of the electrode materials tested was degraded over time, with the Pt/Au SE being the only exception. Thus, the Pt/Au electrode was further tested in a chimney of a commercial burner of 7 MW. As shown in Figure 3c, for a 2-month test, no change was seen in the characteristic EMF, highlighting its high stability. The EMF differences in Figure 3a,c stem from the fact that, in the laboratory setup (i.e., Figure 3a,b), the CO concentration was set by a flowmeter. On the contrary, under practical conditions of incomplete combustion (Figure 3c), there are both CO and H2 in the flue gas, so EMF values surpassed those of the laboratory experiments [27].
Later, Tan et al. [29] coated a Pt sensing electrode with a catalyst layer containing a mixture of CuO, ZnO, and Al2O3 in a molar ratio of 7:10:3. The produced hydrogen sensor operated at 415–500 °C, using YSZ as a solid electrolyte, and could detect a few ppm (0–1450 ppm) of H2 in an air-hydrogen mixture. The sensor response was measured through the cell voltage increment with the H2 concentration increment.
The results showed an almost linear increase in the cell voltage with increasing H2 concentration in the low concentration range (0–54 ppm at 430 °C). For higher H2 concentrations, the cell voltage increased exponentially. It was observed that the linear increment concentration range was slightly increased with the increasing temperature (from a limit of 54 ppm at 430 °C to 145 ppm at 500 °C) [29]. The authors analyzed the mechanism of the SE by developing a mathematical model for fitting the experimental results. By assuming ideal Langmuir adsorption characteristics of homogeneous active sites, they satisfactorily described the sensor response over the H2 concentration range of 0 to 145 ppm. For the overall H2 concentration range from 0 to 1450 ppm, the model which assumed non-ideal adsorption and heterogeneous active sites was the most suitable one [29].
However, the considerable cost of noble-metal-based SEs shifted the scientific research towards the exclusive use of single metal oxides, such as ZnO, as SEs [30,31]. Following this line, Fadeyev et al. [28] tested different simple metal oxides MxOy (M = Zn, Sn, Cr, In), complex oxides with perovskite structure (manganate and chromate-based), and silver as SEs. For the electrochemical sensor setup, YSZ served as the solid electrolyte, silver was used as the reference electrode, and the operating temperatures ranged from 450 to 700 °C, while the CO and H2 concentrations in the air varied from 50 or 100 ppm, up to 3.3%. Taking air as the reference atmosphere and changing the content of CO and H2, the responses of the different SEs were measured. Table 1 below contains an EMF comparison for the various examined electrodes.
SEs using Zn and Sn metal oxides had remarkable responses. However, they had irreversible behavior in air, and thus they could not serve as SEs for practical applications for flue gases. Additionally, the better sensitivity results obtained are presented in Figure 3d. It is observed that with the temperature increment up to 550 °C, the H2 sensitivities of SnO2 and La0.8Sr0.2CrO3 (LSC) are increased, while the H2 sensitivity of CrO3 is decreased. Focusing on the CO sensitivity, the EMF values of all the metal oxides are decreased. Conclusively, SnO2 showed a higher response as a working electrode, against low concentrations of H2 and CO [28].
Yamaguchi et al. [32] fabricated a mixed potential sensor for hydrogen detection at high temperatures (600 °C) using a pair of SnO2 (+30 wt.% YSZ) and NiO-TiO2 SEs. First, the authors proved that the traditional SnO2 SE showed better selectivity to propene (C3H6) than H2 when tested in a mixture of interfering gases (C3H6, CO, NO, NO2, and CH4). This obstacle was overcome by adding different YSZ contents in the SE. The optimum SE resulted by adding 30 wt.% YSZ, demonstrating better selectivity to H2 than C3H6.
To further enhance the H2 and simultaneously diminish the C3H6 sensitivity, the authors proposed the combined-type sensor, including SnO2 (+30 wt.% YSZ) SE vs. NiO (+50% mol. TiO2) SE. Indeed, this sensor demonstrated adequate H2 selectivity and sensitivity, attributed mainly to the SnO2 (+30 wt.% YSZ) SE, reducing at the same time the response to propene, which was used as interfering gas (along with CO, NO, NO2, and CH4), attributed to the synergy of the two SEs. Interestingly, the examined mixed potential sensor showed good sensitivity even toward low concentrations of H2 gas (20 and 50 ppm) with 25 s response time, while for higher amounts of H2 (100–800 ppm), it responded up to 90% within 9 s [32].
The same group [33] also applied a catalyst layer of Cr2O3 on the surface of the previously used SnO2 (+30 wt.% YSZ) SE and an interfering layer of Al2O3 to prevent the contact between the Cr2O3 catalyst and SnO2 SE. The sensor managed to co-detect H2 and C3H6 at 550 °C and in a 21 vol.% O2, 1.35 vol.% H2O atmosphere. More precisely, the SnO2 (+30 wt.% YSZ) sensing electrode and the Al2O3 interfering layer contributed to the sensitive and selective detection of H2, while the Cr2O3 catalytic layer contributed to the oxidation of C3H6. The sensitivity was linearly increased with the H2 concentration in the range of 20 to 800 ppm in humid conditions, while the response time for 100 ppm H2 and 90% response was 10 s.
Among other examined SEs, indium tin oxide (ITO) has been intensively used and tested in mixed potential hydrogen sensors [34,35,36]. Furthermore, tungstate-based composites, such as ZnWO4 [37], MnWO4 [38], CdWO4 [39], and CoWO4 [40], have been reported as alternative SEs [41,42].

2.2. Amperometric Hydrogen Sensors

Amperometric hydrogen sensors are gaining momentum due to their specific advantages over potentiometric sensors. Their principle of operation is based on a linear relationship between the observed limiting current and the hydrogen concentration. This relation facilitates the measurement of hydrogen content, utilizing a calibration curve. Thus, they offer adequate accuracy in analyzing gaseous mixtures. In addition, the fact that they do not need a reference atmosphere enhances, in some cases, their reliability. It should be noted that the amperometric sensors are equipped with a diffusion barrier, which plays a vital role in their operation, as it determines the diffusion flow of the analyzed gas from the outer to the inner chamber of the sensor. Conventionally, the diffusion barrier can be a porous ceramic or a laser-drilled hole. Recent investigations have reported different diffusion barriers in the form of a dense layer made of solid materials exhibiting mixed ionic-electronic conductivity [43,44,45]. However, the parameters of this type of diffusion barrier are not easily controlled and reproduced. This is an important limitation, given that the characteristics of the sensor, such as the limiting current, are strongly determined by these parameters [46].
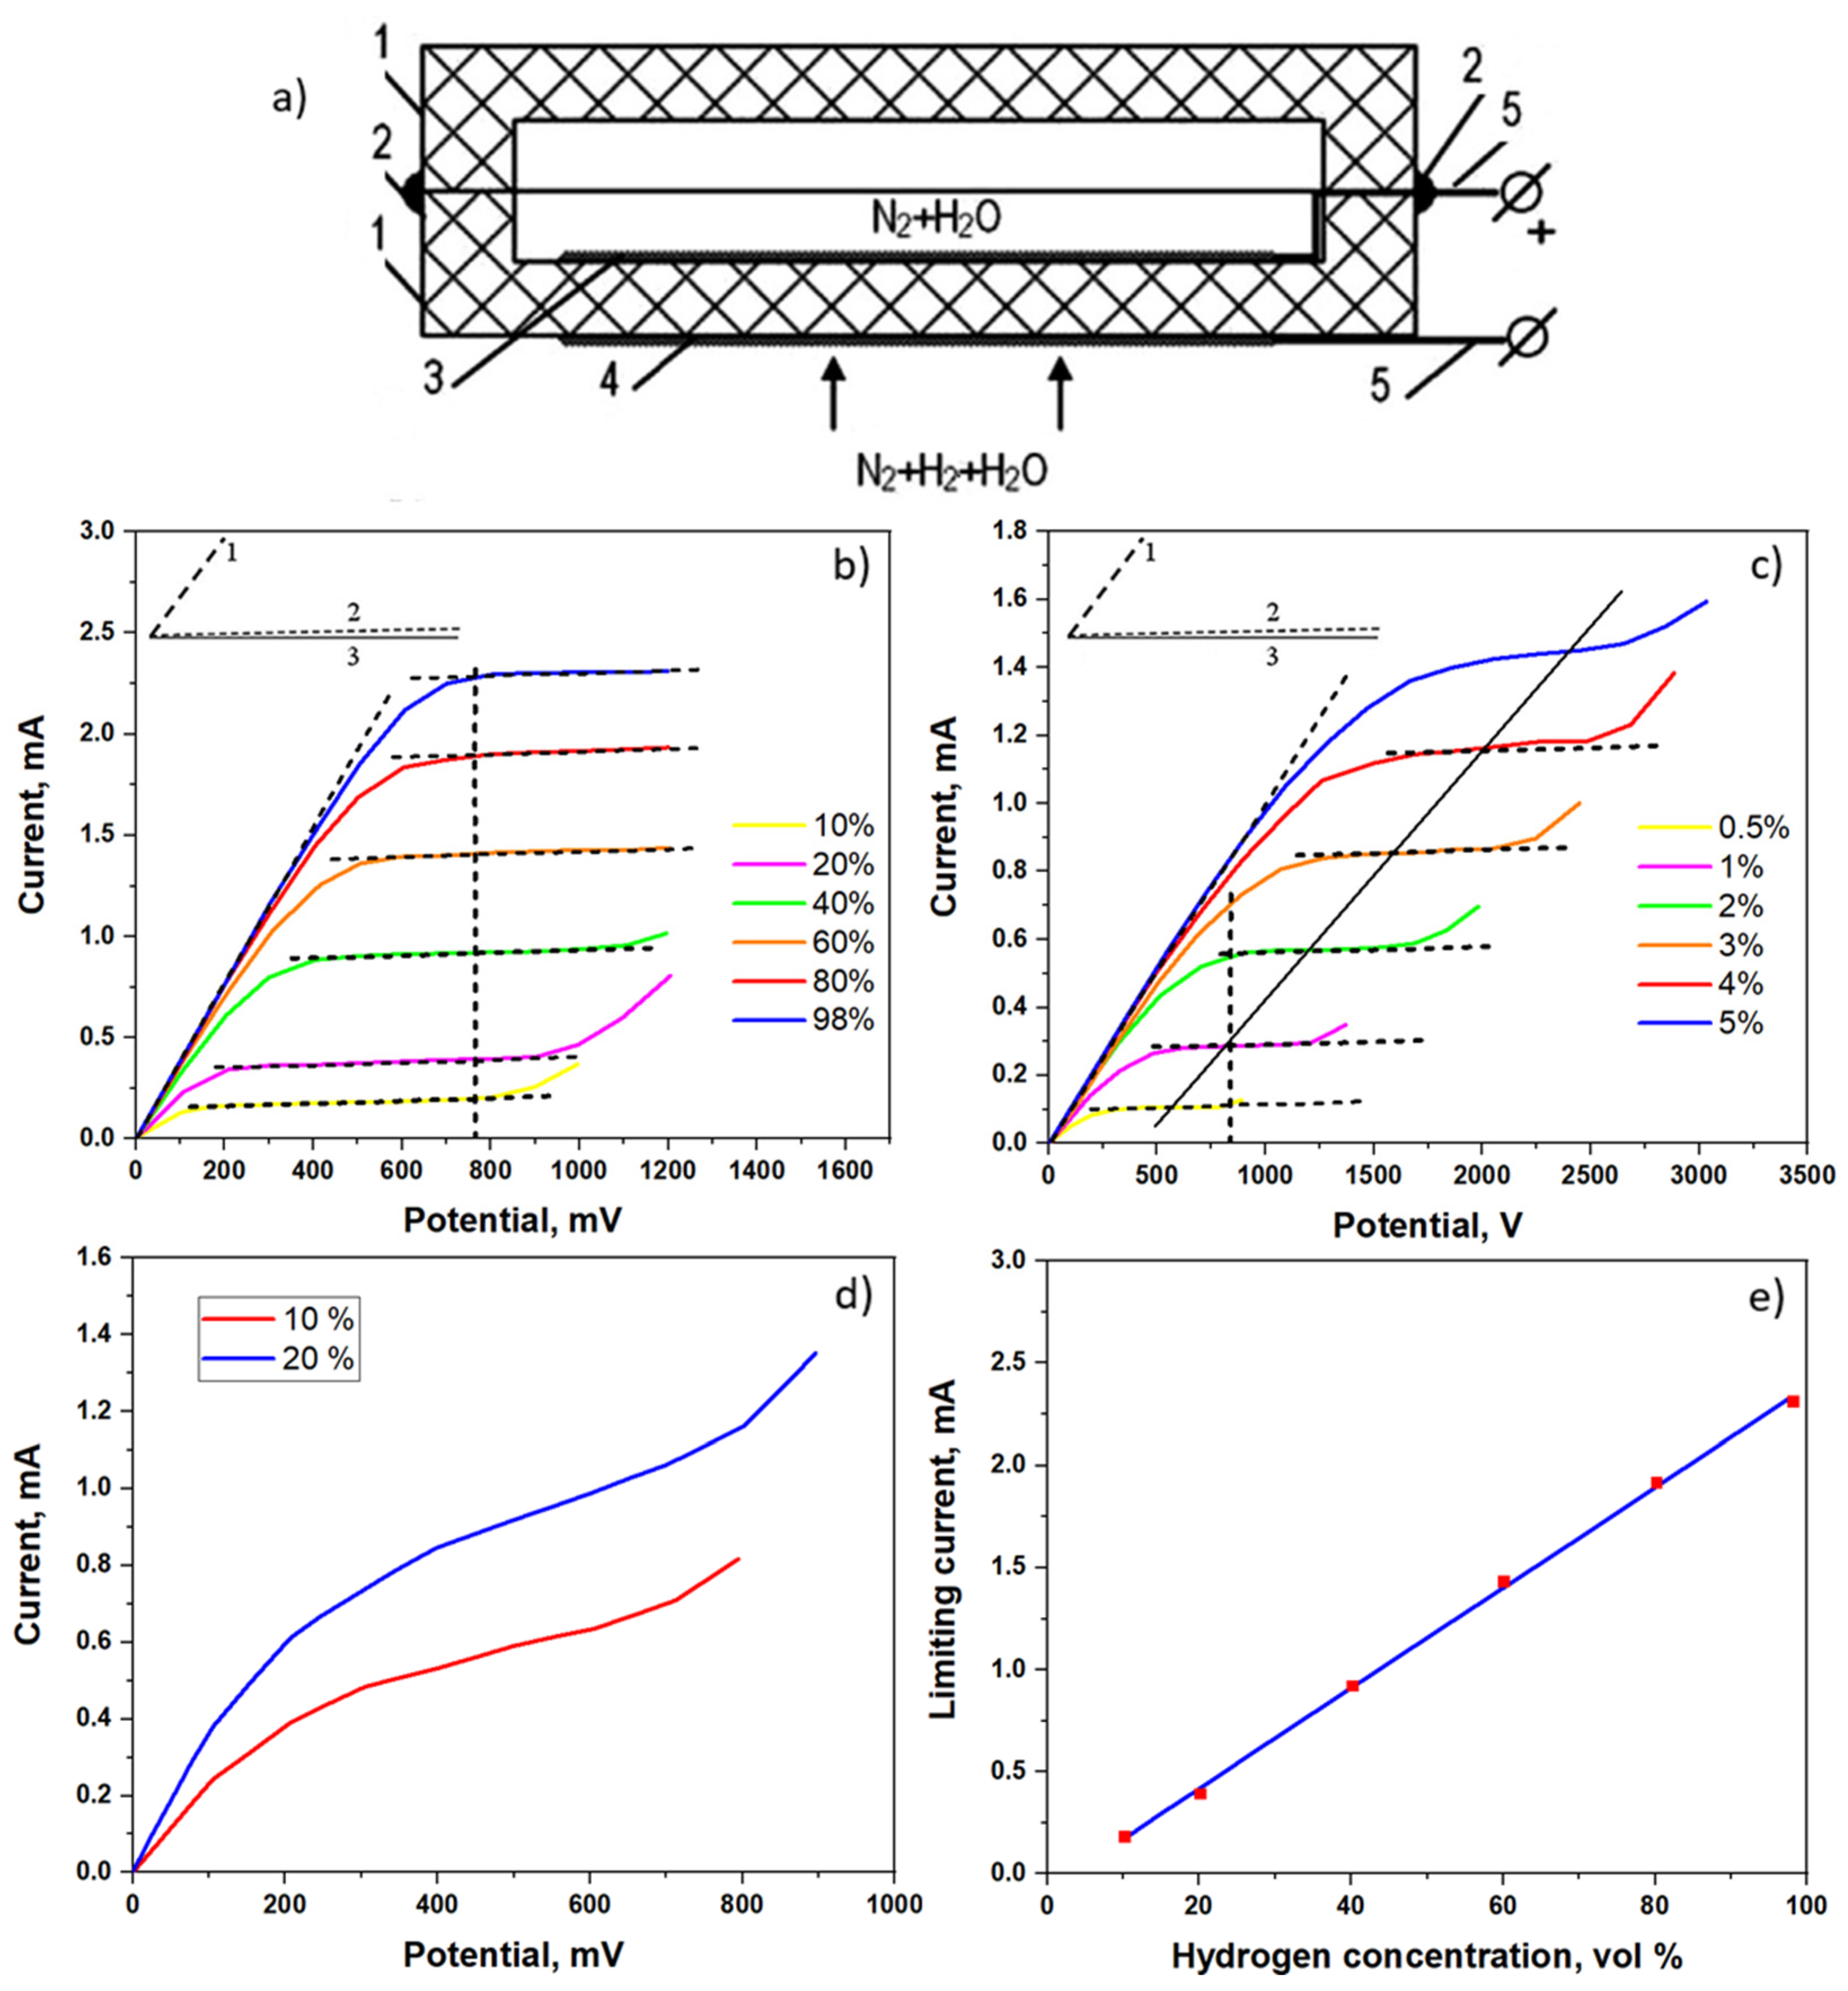
Proton-conducting solid electrolytes were used by Kalyakin et al. [46] to construct three amperometric H2 sensors. More precisely, three sensors were made of La0.95Sr0.05YO3, CaTi0.95Sc0.05O3, and CaZr0.9Sc0.1O3 solid electrolytes, and were tested for the analysis of a gas mixture of H2 + N2 + H2O at 800 °C. The configuration of the three fabricated sensors was the same as that shown in Figure 4a. The applied solid electrolyte was different in each case, and glass sealant was used to connect the two solid electrolyte plates (upper and lower), thus making an inner chamber between them. The lower solid electrolyte plate was painted on its internal and external sides with platinum paste to construct the platinum electrodes. The sensors were installed in a furnace, simulating the required operating temperature, about 800 °C.
When measuring, the exposed gas mixture of N2 + H2O + H2 filled the sensor’s inner chamber. Subsequently, a DC voltage was applied between the platinum electrodes to electrochemically pump out hydrogen from the sensor’s inner space. Thus, the hydrogen was oxidized, providing protons and electrons at the inner electrode, according to the following reaction:
H 2 2 H + + 2 e
The produced protons were transported to the external electrode via the proton conductor electrolyte, where they formed hydrogen molecules in conjunction with the electrons, as follows:
2 H + + 2 e H 2
The rate of hydrogen pumping out increased with the applied voltage increase, resulting in the decrease in the hydrogen amount in the inner chamber of the sensor. The obtained voltage-current curves of these sensors were affected by different parameters. More precisely, the solid electrolyte ohmic resistance and electrode polarization resistance influenced the slope of the V-I curves. In addition, the features of the diffusion barrier and the composition of the studied gas mixture affected the limiting current value. The decrease in the hydrogen amount inside the sensor chamber at the first stage of operation led to an increase in the inner electrode’s polarization resistance and, consequently, in cell resistance. For this reason, the slope of the V-I curves decreased as the applied voltage increased [46].
Figure 4b–d present the V-I curves of sensors 1, 2, and 3, where the applied solid electrolytes were La0.95Sr0.05YO3, CaZr0.9Sc0.1O3, and CaTi0.95Sc0.05O3, respectively. As seen in Figure 4b, sensor 1 was tested at high H2 concentrations (10–98%) and reached a plateau region representing the limiting current. Similarly, sensor 2 was tested at lower H2 concentrations (<5%) and reached a plateau region, as depicted in Figure 4c. Finally, the V-I curves of sensor 3, presented in Figure 4d, do not reach a plateau because of the high electronic conductivity of the solid electrolyte. Thus, the sensor based on CaTi0.95Sc0.05O3 is not applicable for hydrogen sensing. Figure 4e reveals the linear dependence between the limiting current and the hydrogen concentration for sensor 1, proving its suitability for H2 detection at high temperatures. Consequently, the solid electrolyte La0.95Sr0.05YO3 is effective for gas mixtures with high H2 concentrations, while the CaZr0.9Sc0.1O3 is more suitable for low H2 concentrations [46].

2.3. Combined Amperometric–Potentiometric H2 Sensors

In 2015, Kalyakin et al. [47] investigated the application of the proton-conducting material La0.9Sr0.1YO3-δ (LSY) for a hydrogen amperometric sensor. The properties of this material allowed its application together with an oxygen-conducting electrolyte. More precisely, this sensor comprised two electrochemical cells; one was made up of the well-known YSZ solid electrolyte, while the other was composed of the La0.9Sr0.1YO3-δ solid electrolyte. These materials played the role of the electrolyte and had the form of discs with cut segments; each disc had a recess on one of its sides. Each cell employed platinum electrodes placed on its opposite sides. The inner chamber, created by the two cells, was connected with the analyzed gas through a ceramic capillary. Figure 5a shows a schematic configuration of the as-described sensor, while Figure 5b presents the life-size fabricated sensor with a length scale [47].
The application of a DC voltage at the electrodes of the LSY electrolyte cell initiated the process described in amperometric sensors (Section 2.2), known as the hydrogen electrochemical pumping out. The hydrogen content inside the sensor chamber constantly lessened until reaching a negligible value. At this point, the observed current corresponds to the limiting current, which can be calculated as follows:
I lim = 2 FPAD H 2 RTL X H 2
where Ilim is the limiting current, X H 2 the mole fraction of hydrogen in the analyzed gas, F the Faraday constant, R the gas constant, D H 2 the diffusion coefficient of hydrogen, L and A the length and cross-section area of the ceramic capillary channel, respectively, T is the absolute temperature, and P is the absolute pressure.
The cell with the YSZ electrolyte operated as an oxygen concentration cell, detecting the changes in the oxygen partial pressure in the analyzed gas inside the sensor chamber. Oxygen was included in the analyzed gas, not in the form of molecular oxygen, but as bonded oxygen because of the presence of steam according to the following expression:
H 2 O K H 2 + 0.5 O 2
The oxygen partial pressure, pO2, is given by the following equation:
p O 2 = ( K   p H 2 O p H 2 ) 2
where K expresses the equilibrium constant of the reaction (4), and pH2O and pH2 are the partial pressures of steam and hydrogen, respectively. The continuous decrease in the hydrogen content in the sensor chamber caused the hydrogen partial pressure to decrease. The second cell continuously monitored this change through the generated open circuit voltage (OCV), obeying the Nernst equation. The water vapor partial pressure inside and outside the sensor’s chamber was equal, so the Nernst equation can be modified by substituting Equation (5) as follows [47]:
E = RT 2 F ln ( p H 2 p H 2 )
Figure 5c demonstrates the current and the measured OCV of Equation (6) against the applied voltage for the gas mixture of 0.7 vol.% H2 + N2 at 550 °C. As can be seen, the current produced in the LSY-based cell increases with the applied voltage. At a voltage value of ~0.7 V, the current stabilizes in the so-called limiting current, where the hydrogen concentration is estimated at 8 ppm. However, the current increases again when the applied voltage surpasses the value of 1.5 V. This phenomenon can be explained either by the appearance of electron conductivity in the LSY or by the beginning of the material’s partial decomposition. Concerning the measured OCV, the applied voltage induces a smooth increase in the OCV at the beginning of the sensing process. However, the OCV quickly increases when the hydrogen content inside the chamber tends to zero.
In Figure 5d, the I-V curves of the discussed sensor are presented for low hydrogen concentrations (0.10–0.38 vol.% H2) in the H2 +N2 gas mixture at 550 °C. Similarly, Figure 5e presents the I-V curves for higher hydrogen concentrations (0.38–3.3 vol.% H2). As observed, the applied voltage at which the curves start forming a plateau region increases with the hydrogen concentration increase. Thus, the present sensor is suitable to detect small hydrogen amounts (0.1–3.3 vol.%) in N2 atmospheres at 550 °C. This is verified by Figure 5f, which demonstrates the linear dependence between the hydrogen amount in the gas mixture and the limiting current [47].
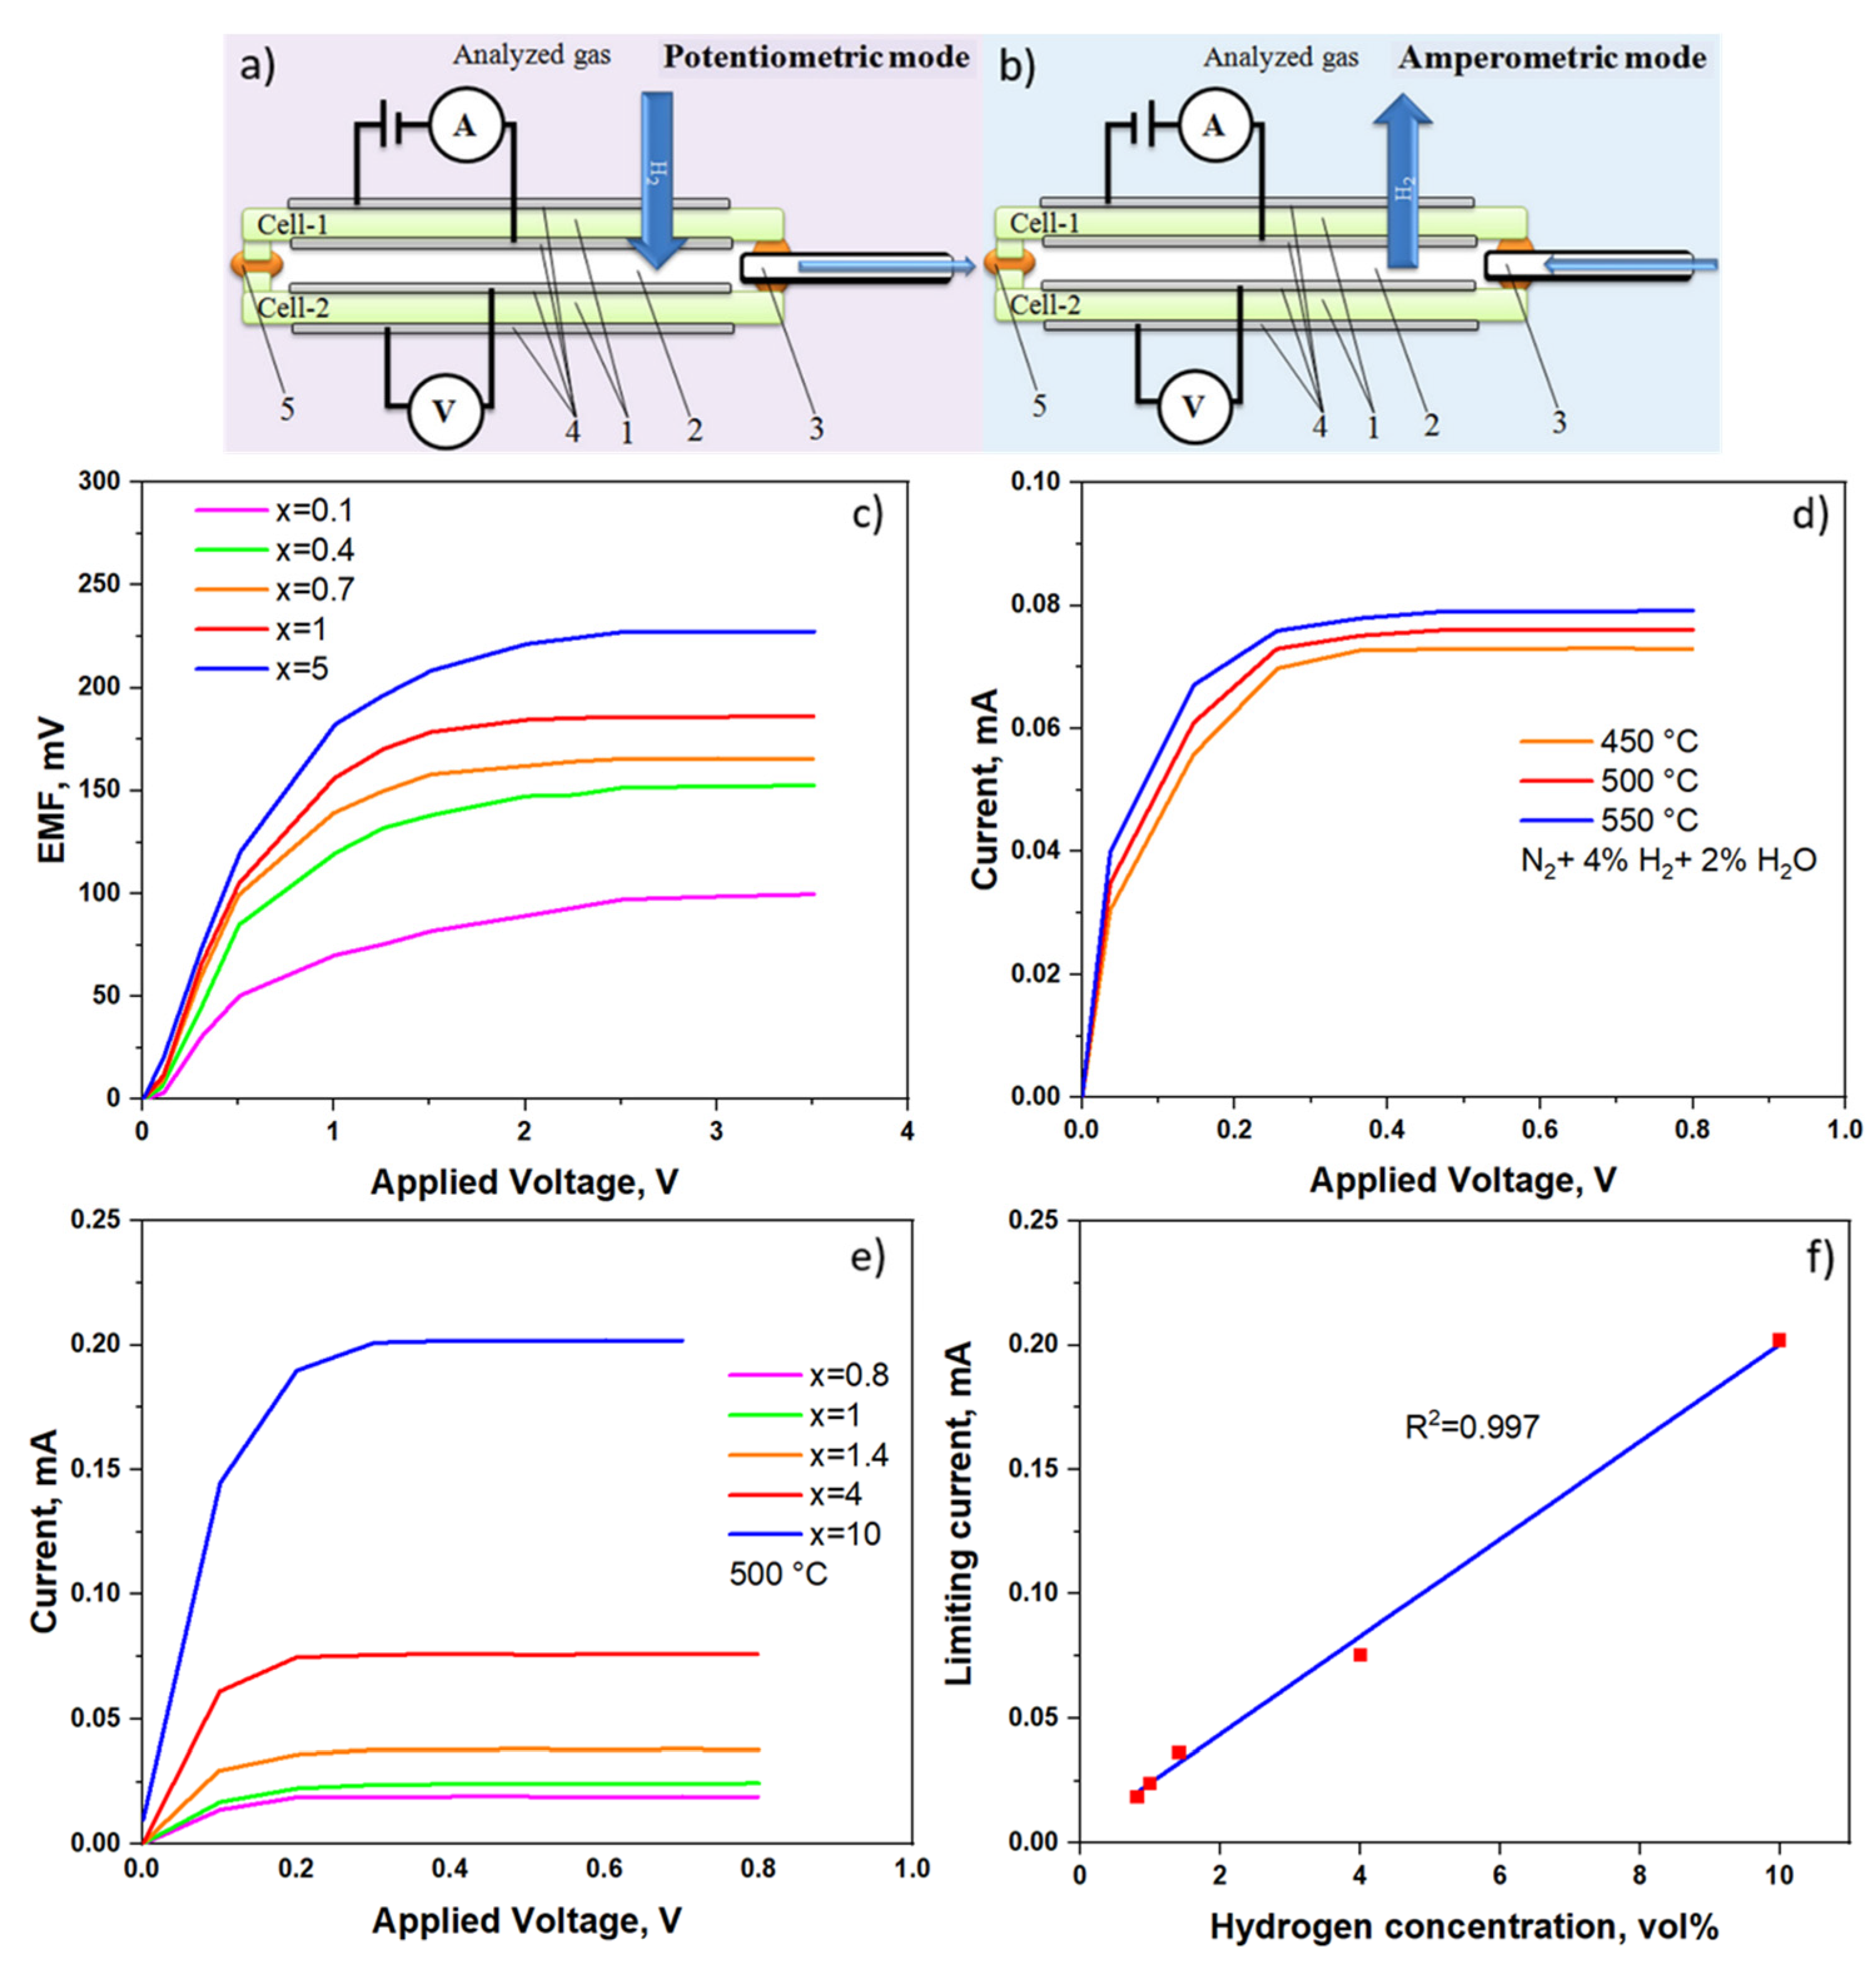
In 2016, Kalyakin et al. [48] constructed a combined amperometric-potentiometric hydrogen sensor to investigate the behavior of BaCe0.7Zr0.1Y0.2O3-δ (BZCY) as a solid electrolyte. BZCY was selected because it is regarded as one of the most promising high-temperature proton conductors since it shows high ionic conductivity and sufficient stability in aggressive environments. The sensor was designed for measuring the hydrogen content in wet mixtures of N2 + H2 at 450–550 °C (with 2% H2O). As depicted in Figure 6a, the sensor consisted of two electrochemical cells made of a BZCY-based electrolyte and Pt electrodes. A capillary connected the inner chamber, formed between the cells, with the analyzed gas mixture. In addition, a high-temperature glass sealant was employed to seal the parts of the sensors [10,48].
Figure 6a schematically represents a sensor for the amperometric mode of operation, while Figure 6b is for potentiometric. Cell-1 was designed to operate in the amperometric regime, acting as an electrochemical hydrogen pump, whereas cell-2 was the potentiometric part of the sensor. The polarity of the voltage applied on cell-1 determined the operating mode of the sensor (amperometric or potentiometric). The operational principles of the sensor, for the potentiometric and amperometric modes, are described below:
(i) Under the potentiometric mode, a DC voltage was applied at the electrodes of cell-1, forcing the hydrogen to electrochemically permeate from the outer space to the inner chamber of the sensor. That process is expressed with the following reactions:
External   electrode :   H 2 2 H + + 2 e
Internal   electrode :   2 H + + 2 e H 2
This way, the hydrogen content inside the sensor increased, displacing N2 through the capillary. Thus, an atmosphere with pure hydrogen was established in the sensor chamber, namely, p H 2 in = 1 . The constant electrochemical pumping of hydrogen generated a difference in hydrogen partial pressures between the inner chamber and the outer atmosphere of the sensor. Cell-2 recorded the electrical potential difference (EMF) caused by this difference in partial pressures. This potential obeys the Nernst equation. Since there is only hydrogen inside the sensor chamber, the measured EMF indicated the concentration of hydrogen in the analyzed gas. The relationship between the observed EMF and the applied voltage at cell-1 is depicted in Figure 6c, where the EMF vs. V curves are plotted for different hydrogen concentrations at 500 °C. As shown, in the first stage, the applied voltage increase results in a noticeable increase in the EMF. This is due to the ever-increasing difference in hydrogen partial pressure generated by the electrochemically pumped hydrogen inside the chamber. Subsequently, at applied voltages >2.0 V, the EMF maintains a maximum and a constant value, owing to the formed pure hydrogen atmosphere in the chamber [10,48].
(ii) In the amperometric mode of operation, the applied DC voltage at cell-1 removed the hydrogen from the inner chamber of the sensor. More precisely, Reaction (9) was realized at the internal electrode of cell-1, and Reaction (8) at the external electrode. Figure 6d shows the I-V behavior of the sensor operating under amperometric mode for a gas mixture of N2 + 4%H2 + 2%H2O in the temperature range of 450–550 °C. As seen, the limiting current increases with temperature, as described by Equation (3). Figure 6e presents the I-V curves for the mixture N2 + x%H2 + 2%H2O at 500 °C. The limiting current response is plotted against the hydrogen concentration in Figure 6f. There is a linear relationship between these two parameters, proving that the amperometric mode can also be used for hydrogen analysis [48].

3. Amperometric Sensor for Hydrogen and Steam Detection

The detection of hydrogen through electrochemical sensors working under the potentiometric or amperometric regime has been thoroughly reviewed above. Concerning the detection of steam, several reports have referred to employing oxygen ion electrolytes [49] and proton conductors [50,51,52,53,54,55,56] as solid electrolytes.
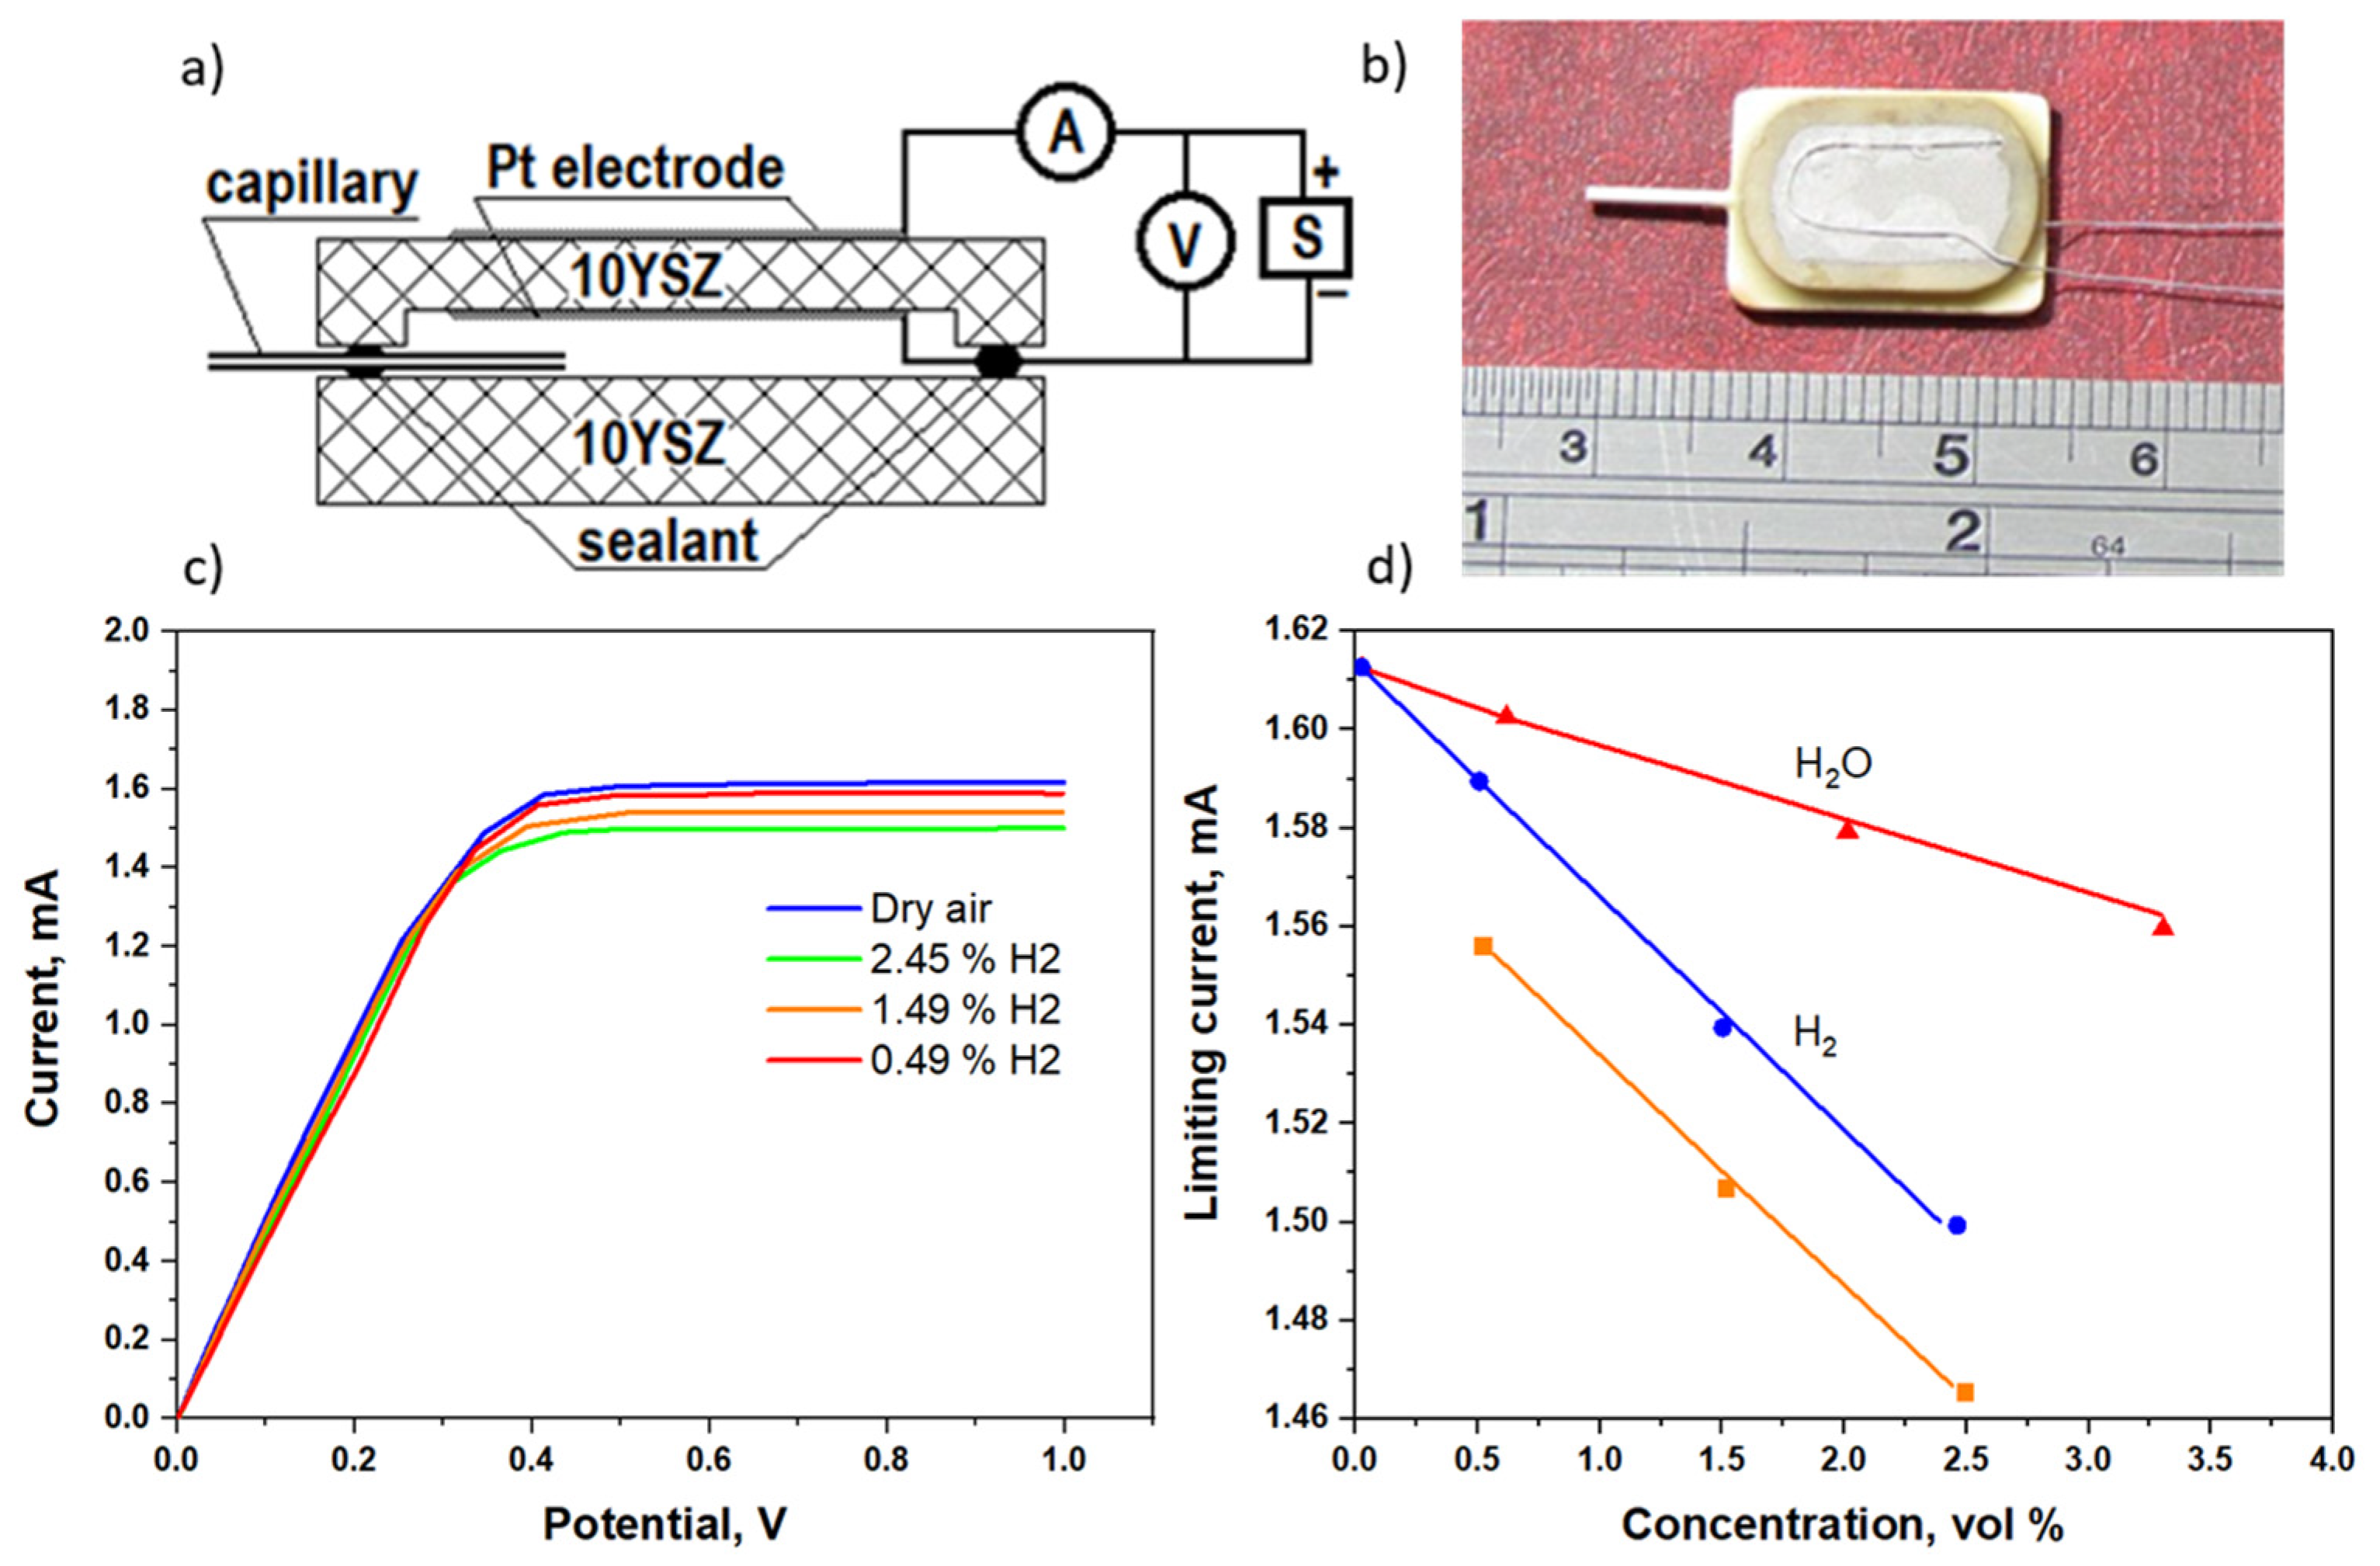
Recently, Kalyakin et al. [57] fabricated and tested an amperometric sensor that successfully detected water vapor and hydrogen in air at 700 °C. This sensor used a solid electrolyte composed of the well-known oxygen ion conductor YSZ, with the composition 0.9ZrO2 + 0.1Y2O3. The configuration and a photograph of the discussed amperometric sensor are demonstrated in Figure 7a,b, respectively. One of the YSZ plates that assemble the sensor has a recess on one side and is equipped with Pt electrodes on its opposite side along with Pt wires as current leads. The inner chamber between the plates is sealed by a high-temperature glass sealant, while a thin ceramic capillary tube plays the role of the diffusion barrier [57].
As can be seen from Figure 7a, the discussed sensor operates under the amperometric regime. More precisely, a positive potential was applied to the outer electrode, causing the electrochemical pumping of oxygen out of the sensor’s chamber. This process is expressed by the following reactions:
Internal   electrode :   1 2 O 2 + 2 e O 2
External   electrode :   O 2 1 2 O 2 + 2 e
As the applied voltage increased, the rate of the transferred oxygen ions through the YSZ electrolyte also increased. Thus, the sensor current increased until a specific voltage value, where the limiting current appeared. If this current is known, the concentration of oxygen in the analyzed gas mixture is calculated as follows:
I lim = 4 FD O 2 SP RTL ln ( 1 X O 2 )
where Ilim is the limiting current, Xo2 is the mole fraction of oxygen, Do2 is the diffusion coefficient of oxygen, P is the absolute gas pressure, T is the absolute temperature, F is the Faraday constant, R is the gas constant, L is the length of the capillary, and S is the cross-section area of the capillary. For oxygen concentrations of about Xo2 = 0.2, Equation (12) is simplified as follows:
I lim = 4 kFD O 2 SP RTL X O 2
where k = 1.12 is a coefficient considering the logarithmic dependence between the limiting current and oxygen concentration.
The standard oxygen concentration in dry air is 20.9 vol.% or Xo2 = 0.209 expressed as a mole fraction. The presence of steam and/or hydrogen in the analyzed gas mixture decreased the oxygen concentration in the hot air. Therefore, the limiting current also decreased as the steam and hydrogen concentrations increased. Nevertheless, the detection of hydrogen in a gas mixture containing both hydrogen and steam is a difficult process. The problem lies in the presence of steam which causes a further decrease in the oxygen concentration compared with the dry air-hydrogen mixture [57]. A possible solution for hydrogen detection is air-drying before the analysis using zeolite or phosphorus pentoxide P2O5.
Kalyakin et al. [57] proposed a two-stage procedure where the concentrations of steam and hydrogen in atmospheric air can be calculated. In the first stage, the limiting current was measured in atmospheric air, while in the second stage the limiting current was measured in dried atmospheric air. Thus, the observed limiting currents were used to calculate oxygen concentrations in a mixture of H2 + wet atmospheric air and dried hot atmospheric air. Moreover, the hydrogen concentration in humid air could be directly calculated if the water vapor content in the air was known, using, for example, a moisture meter.
In Figure 7c, the obtained V-I curves of the sensor for the gas mixture of hydrogen and dry air are demonstrated for different hydrogen concentrations. As shown, the limiting current area of all the analyzed hydrogen concentrations appears at 0.4 V. The values of the limiting current for the examined hydrogen concentrations have minor differences. Thus, very accurate measurements of limiting currents are required. Analogοus measurements were carried out for different steam concentrations in the air, reporting the same behavior in V-I curves.
In Figure 7d, the limiting current is plotted against the concentration of hydrogen (circles) and steam (triangles). As can be seen, the limiting current dependence on the concentration of hydrogen is stronger than the steam concentration. In addition, the limiting current dependence on the H2 + air mixture (rectangles) containing a known amount of humidity (3.3%) is shown. The experimental data expressed by symbols are in good agreement with theoretical data (straight lines) calculated by the following equation [57]:
I lim ( X O 2 ) = I lim ( X O 2 0 ) X O 2 X O 2 0
For simplicity reasons, the sensors presented in this review are summarized below in Table 2.

4. Concluding Remarks

The present review was devoted to electrochemical hydrogen sensors using solid electrolytes with oxygen ion and proton conductivity, operating at high temperatures. Indicative literature works were discussed according to the sensors type, i.e., potentiometric, amperometric, and combined amperometric-potentiometric. From the discussion, it can be revealed that each hydrogen sensor type presents its own challenges regarding the electrolyte and electrode material properties depending on their operating principle and conditions.
Potentiometric sensors are classified into equilibrium potentiometric and mixed potential sensors. The former sensors are applied to detect hydrogen in inert and humid atmospheres, where equilibrium can be established between the reference and sensing compartments. Due to the hydrogen partial pressure gradient between the two compartments, an EMF is generated in the electrochemical cell, indicating the hydrogen concentration in the SE according to the Nernst equation as long as the RE atmosphere composition is known. Since hydrogen is the only active gas in equilibrium sensors, Pt has been established as the apparent material for the RE and SE due to its acknowledged efficiency and stability. Therefore, research has been devoted to developing highly conductive solid electrolytes which should possess stable EMF in a wide temperature and hydrogen range and reversible and fast response. A few works have further advanced the ceramic structures by developing mixed composites or doping with metals, achieving advances in equilibrium potentiometric hydrogen sensors in humid mixtures or in the presence of interfered combustible gases.
In the other category of potentiometric sensors, namely the mixed potential sensors, two or more competitive potentiometric reactions simultaneously occur at the sensing electrode. EMF value in the mixed potential sensors depends on the changes in the Fermi level occurring by the chemisorption of the hydrogen gas in the three-phase boundary between the SE, the electrolyte, and the hydrogen gas. YSZ has mainly been employed as solid electrolyte material in that type of sensor, as it presents the required ionic conductivity and thermal stability. Thus, the research has been focused on the SEs’ improvement. According to the literature, for the well-established Pt electrodes to be replaced, scientists have turned to other metallic nanoparticles to combine with Pt metal, reducing the cost and even promoting selectivity, and also to transition metal oxides and complex oxides combined with perovskite materials, eliminating the use of Pt metal. It should be noted that mixed potential sensors require further research regarding reference electrode materials capable of stable operation in harsh operating conditions.
Amperometric hydrogen sensors using proton-conducting electrolytes are also considered. They are gaining significant attention as, contrary to potentiometric sensors, they do not need a reference atmosphere for their operation. Additionally, they present a linear relation between the limiting current and the hydrogen concentration, thus facilitating hydrogen concentration measurements through simple calibration curves. Among the materials that have been reported to operate successfully as solid electrolytes in amperometric sensors are CaZr0.9Sc0.10O3 and La0.95Sr0.05YO3. They were used in an amperometric hydrogen sensor operating at 850 °C and managed to detect low (0.5–5%) and high (up to 100%) hydrogen concentrations, respectively. Additionally, the proton conductor La0.9Sr0.1YO3 was synthesized and tested as part of an amperometric hydrogen sensor in conjunction with an YSZ electrolyte. This sensor operates at 500–600 °C, detecting hydrogen in low concentrations (0.1–3.3 vol.%) in H2 + N2 gas mixtures. Recently, a sensor working under the amperometric regime was constructed and tested for the detection of steam and hydrogen in atmospheric air. The YSZ with oxygen ion conductivity and composition 0.9ZrO2 + 0.1Y2O3 was used in this sensor which can operate at 700 °C. The developed sensor managed to detect remarkably low hydrogen concentrations both in dry and humid air.
A combined amperometric-potentiometric sensor is made of two electrochemical cells, one that operates under amperometric operating principles and one under potentiometric operating principles. Recently, BaCe0.7Zr0.1Y0.2O3-δ solid electrolyte was designed and manufactured for hydrogen detection in wet mixtures of N2 + H2. The sensor can successfully detect hydrogen content (0.1–10 vol.%) at 450–550 °C. Those solid electrolyte materials employed in an amperometric and a combined sensor, respectively, were proven to detect hydrogen at low concentrations of 0.1 vol.% (in N2 +H2 mixtures), far from the lower flammability limit of hydrogen (4–75 vol.% in the air).
The discussed sensors can be employed to control the ambient air in applications where hydrogen can be present, for example, stationary fuel cell facilities, hydrogen isolation industries, and fuel cell engines using hydrogen tanks.
While hydrogen is gaining interest as a sustainable energy carrier, in recent years a literature gap has been observed, regarding high-temperature hydrogen sensors. There is research on the topic of solid electrolytes, but there is a lack of experimental data concerning a full-sensor configuration and real-conditions operation. Taking into consideration the emerging hydrogen economy, we hope this brief review fills the literature gap and perhaps leads to a resurgence of research in the field of high-temperature hydrogen sensors.

Author Contributions

Investigation, Data Curation, Validation, Writing—Original Draft, Methodology: E.G., G.B., C.M. and D.S. Conceptualization, Writing—Review and Editing, Supervision, Resources: A.B., A.D. and P.T. All authors have read and agreed to the published version of the manuscript.

Funding

This research received no external funding.

Data Availability Statement

The data presented in this study are available on request from the corresponding authors.

Acknowledgments

Georgia Balkourani thankfully acknowledges the Hellenic Foundation for Research and Innovation (H.F.R.I.) for the funding under the “3rd Call for H.F.R.I. Ph.D. Fellowships” (Fellowship Number: 5869). The research of Costas Molochas was supported by the Hellenic Foundation for Research and Innovation (HFRI) under the 3rd Call for HFRI PhD Fellowships (Fellowship Number: 5426).

Conflicts of Interest

The authors declare that they have no conflict of interests.

References

  1. Qazi, U.Y. Future of hydrogen as an alternative fuel for next-generation industrial applications; Challenges and expected opportunities. Energies 2022, 15, 4741. [Google Scholar] [CrossRef]
  2. Ramachandran, R.; Menon, R.K. An overview of industrial uses of hydrogen. Int. J. Hydrog. Energy 1998, 23, 593–598. [Google Scholar] [CrossRef]
  3. Jiao, K.; Xuan, J.; Du, Q.; Bao, Z.; Xie, B.; Wang, B.; Zhao, Y.; Fan, L.; Wang, H.; Hou, Z. Designing the next generation of proton-exchange membrane fuel cells. Nature 2021, 595, 361–369. [Google Scholar] [CrossRef] [PubMed]
  4. Adamson, K.-A.; Pearson, P. Hydrogen and methanol: A comparison of safety, economics, efficiencies and emissions. J. Power Source 2000, 86, 548–555. [Google Scholar] [CrossRef]
  5. Korotcenkov, G.; Han, S.D.; Stetter, J.R. Review of Electrochemical Hydrogen Sensors. Chem. Rev. 2009, 109, 1402–1433. [Google Scholar] [CrossRef]
  6. Hübert, T.; Boon-Brett, L.; Black, G.; Banach, U. Hydrogen sensors—A review. Sens. Actuators B Chem. 2011, 157, 329–352. [Google Scholar] [CrossRef]
  7. Yajima, T.; Koide, K.; Fukatsu, N.; Ohashi, T.; Iwahara, H. A new hydrogen sensor for molten aluminum. Sens. Actuators B Chem. 1993, 14, 697–699. [Google Scholar] [CrossRef]
  8. Schwandt, C.; Fray, D.J. Hydrogen sensing in molten aluminium using a commercial electrochemical sensor. Ionics 2000, 6, 222–229. [Google Scholar] [CrossRef]
  9. Serret, P.; Colominas, S.; Reyes, G.; Abellà, J. Characterization of ceramic materials for electrochemical hydrogen sensors. Fusion Eng. Des. 2011, 86, 2446–2449. [Google Scholar] [CrossRef]
  10. Gorbova, E.; Tzorbatzoglou, F.; Molochas, C.; Chloros, D.; Demin, A.; Tsiakaras, P. Fundamentals and Principles of Solid-State Electrochemical Sensors for High Temperature Gas Detection. Catalysts 2021, 12, 1. [Google Scholar] [CrossRef]
  11. Zosel, J.; Schiffel, G.; Gerlach, F.; Ahlborn, K.; Sasum, U.; Vashook, V.; Guth, U. Electrode materials for potentiometric hydrogen sensors. Solid State Ion. 2006, 177, 2301–2304. [Google Scholar] [CrossRef]
  12. Volkov, A.; Gorbova, E.; Vylkov, A.; Medvedev, D.; Demin, A.; Tsiakaras, P. Design and applications of potentiometric sensors based on proton-conducting ceramic materials. A brief review. Sens. Actuators B Chem. 2017, 244, 1004–1015. [Google Scholar] [CrossRef]
  13. Pasierb, P.; Rekas, M. Solid-state potentiometric gas sensors—Current status and future trends. J. Solid State Electrochem. 2009, 13, 3–25. [Google Scholar] [CrossRef]
  14. Yajima, T.; Koide, K.; Takai, H.; Fukatsu, N.; Iwahara, H. Application of hydrogen sensor using proton conductive ceramics as a solid electrolyte to aluminum casting industries. Solid State Ion. 1995, 79, 333–337. [Google Scholar] [CrossRef]
  15. Li, Y.; Wang, C.; Zhang, Z.; Wang, J. A Hydrogen Sensor Using SrCe0.95Yb0.05O3-α as Proton Conductor and YHx+YH2−z as Reference Electrode for Determining Hydrogen Pressure in Solid Steel. J. Mater. Sci. Technol. 2010, 26, 957–960. [Google Scholar] [CrossRef]
  16. Medvedev, D.; Brouzgou, A.; Demin, A.; Tsiakaras, P. Proton-Conducting Electrolytes for Solid Oxide Fuel Cell Applications. In Advances in Medium and High Temperature Solid Oxide Fuel Cell Technology; Boaro, M., Salvatore, A.A., Eds.; Springer International Publishing: Cham, Switzerland, 2017; Volume 574, pp. 77–118. [Google Scholar]
  17. Kochetova, N.; Animitsa, I.; Medvedev, D.; Demin, A.; Tsiakaras, P. Recent activity in the development of proton-conducting oxides for high-temperature applications. RSC Adv. 2016, 6, 73222–73268. [Google Scholar] [CrossRef]
  18. Medvedev, D.A.; Lyagaeva, J.G.; Gorbova, E.V.; Demin, A.K.; Tsiakaras, P. Advanced materials for SOFC application: Strategies for the development of highly conductive and stable solid oxide proton electrolytes. Prog. Mater. Sci. 2016, 75, 38–79. [Google Scholar] [CrossRef]
  19. Medvedev, D.; Murashkina, A.; Pikalova, E.; Demin, A.; Podias, A.; Tsiakaras, P. BaCeO3: Materials development, properties and application. Prog. Mater. Sci. 2014, 60, 72–129. [Google Scholar] [CrossRef]
  20. Zou, D.; Yi, Y.; Song, Y.; Guan, D.; Xu, M.; Ran, R.; Wang, W.; Zhou, W.; Shao, Z. The BaCe0.16Y0.04Fe0.8O3−δ nanocomposite: A new high-performance cobalt-free triple-conducting cathode for protonic ceramic fuel cells operating at reduced temperatures. J. Mater. Chem. A 2022, 10, 5381–5390. [Google Scholar] [CrossRef]
  21. Demin, A.; Gorbova, E.; Brouzgou, A.; Volkov, A.; Tsiakaras, P. Chapter 6—Sensors based on solid oxide electrolytes. In Solid Oxide-Based Electrochemical Devices. Lo Faro, M., Ed.; Academic Press: Cambridge, MA, USA, 2020; pp. 167–215. [Google Scholar]
  22. Göpel, W.; Reinhardt, G.; Rösch, M. Trends in the development of solid state amperometric and potentiometric high temperature sensors. Solid State Ion. 2000, 136, 519–531. [Google Scholar] [CrossRef]
  23. Iwahara, H.; Uchida, H.; Ogaki, K.; Nagato, H. Nernstian Hydrogen Sensor Using BaCeO3 - Based, Proton-Conducting Ceramics Operative at 200–900 °C. J. Electrochem. Soc. 1991, 138, 295–299. [Google Scholar]
  24. Yajima, T.; Iwahara, H.; Koide, K.; Yamamoto, K. CaZrO3-type hydrogen and steam sensors: Trial fabrication and their characteristics. Sens. Actuators B Chem. 1991, 5, 145–147. [Google Scholar] [CrossRef]
  25. Okuyama, Y.; Nagamine, S.; Nakajima, A.; Sakai, G.; Matsunaga, N.; Takahashi, F.; Kimata, K.; Oshima, T.; Tsuneyoshi, K. Proton-conducting oxide with redox protonation and its application to a hydrogen sensor with a self-standard electrode. RSC Adv. 2016, 6, 34019–34026. [Google Scholar] [CrossRef]
  26. Zhang, J.; Zhang, H.; Teng, Y.; Yi, J. Simulation of dynamic response of mixed-potential hydrogen sensors. Int. J. Hydrog. Energy 2022, 47, 33891–33902. [Google Scholar] [CrossRef]
  27. Vogel, A.; Baier, G.; Schüle, V. Non-Nernstian potentiometric zirconia sensors: Screening of potential working electrode materials. Sens. Actuators B Chem. 1993, 15, 147–150. [Google Scholar] [CrossRef]
  28. Fadeyev, G.; Kalakin, A.; Demin, A.; Volkov, A.; Brouzgou, A.; Tsiakaras, P. Electrodes for solid electrolyte sensors for the measurement of CO and H2 content in air. Int. J. Hydrog. Energy 2013, 38, 13484–13490. [Google Scholar] [CrossRef]
  29. Tan, Y.; Tan, T.C. Characteristics and Modeling of A Solid State Hydrogen Sensor. J. Electrochem. Soc. 1994, 141, 461–467. [Google Scholar] [CrossRef]
  30. Lu, G.; Miura, N.; Yamazoe, N. High-temperature hydrogen sensor based on stabilized zirconia and a metal oxide electrode. Sens. Actuators B Chem. 1996, 35, 130–135. [Google Scholar] [CrossRef]
  31. Miura, N.; Sato, T.; Anggraini, S.A.; Ikeda, H.; Zhuiykov, S. A review of mixed-potential type zirconia-based gas sensors. Ionics 2014, 20, 901–925. [Google Scholar]
  32. Yamaguchi, M.; Anggraini, S.A.; Fujio, Y.; Breedon, M.; Plashnitsa, V.V.; Miura, N. Selective hydrogen detection at high temperature by using yttria-stabilized zirconia-based sensor with coupled metal-oxide-based sensing electrodes. Electrochim. Acta 2012, 76, 152–158. [Google Scholar] [CrossRef]
  33. Yamaguchi, M.; Anggraini, S.A.; Fujio, Y.; Sato, T.; Breedon, M.; Miura, N. Stabilized zirconia-based sensor utilizing SnO2-based sensing electrode with an integrated Cr2O3 catalyst layer for sensitive and selective detection of hydrogen. Int. J. Hydrog. Energy 2013, 38, 305–312. [Google Scholar] [CrossRef]
  34. Martin, L.P.; Glass, R.S. Hydrogen Sensor Based on YSZ Electrolyte and Tin-Doped Indium Oxide Electrode. J. Electrochem. Soc. 2005, 152, 43. [Google Scholar] [CrossRef]
  35. Martin, L.P.; Pham, A.Q.; Glass, R.S. Electrochemical hydrogen sensor for safety monitoring. Solid State Ion. 2004, 175, 527–530. [Google Scholar] [CrossRef] [Green Version]
  36. Sekhar, P.K.; Brosha, E.L.; Mukundan, R.; Nelson, M.A.; Williamson, T.L.; Garzon, F.H. Development and testing of a miniaturized hydrogen safety sensor prototype. Sens. Actuators B Chem. 2010, 148, 469–477. [Google Scholar] [CrossRef]
  37. Tang, Z.; Li, X.; Yang, J.; Yu, J.; Wang, J.; Tang, Z. Mixed potential hydrogen sensor using ZnWO4 sensing electrode. Sens. Actuators B Chem. 2014, 195, 520–525. [Google Scholar] [CrossRef]
  38. Li, Y.; Li, X.; Tang, Z.; Tang, Z.; Yu, J.; Wang, J. Hydrogen sensing of the mixed-potential-type MnWO4/YSZ/Pt sensor. Sens. Actuators B Chem. 2015, 206, 176–180. [Google Scholar] [CrossRef]
  39. Li, Y.; Li, X.; Tang, Z.; Wang, J.; Yu, J.; Tang, Z. Potentiometric hydrogen sensors based on yttria-stabilized zirconia electrolyte (YSZ) and CdWO4 interface. Sens. Actuators B Chem. 2016, 223, 365–371. [Google Scholar] [CrossRef]
  40. Li, Y.; Li, X.; Wang, J.; Jun, Y.; Tang, Z. A cobalt tungstate compound sensing electrode for hydrogen detection based upon mixed-potential type sensors. RSC Adv. 2017, 7, 2919–2925. [Google Scholar] [CrossRef] [Green Version]
  41. Liu, T.; Zhang, X.; Yuan, L.; Yu, J. A review of high-temperature electrochemical sensors based on stabilized zirconia. Solid State Ion. 2015, 283, 91–102. [Google Scholar] [CrossRef]
  42. Ramaiyan, K.P.; Mukundan, R. Editors’ Choice—Review—Recent Advances in Mixed Potential Sensors. J. Electrochem. Soc. 2020, 167, 037547. [Google Scholar] [CrossRef]
  43. Zhang, X.; Liu, T.; Yu, J.; Gao, X.; Jin, H.; Wang, X.; Wang, C. A limiting current oxygen sensor with La0.8Sr0.2(Ga0.8Mg0.2)1-xFexO3-δ dense diffusion barrier. J. Solid State Electrochem. 2017, 21, 1323–1328. [Google Scholar] [CrossRef]
  44. Liu, T.; Jin, H.; Li, L.; Yu, J. A novel method for preparing dense diffusion barrier limiting current oxygen sensor. J. Am. Ceram. Soc. 2018, 101, 1537–1543. [Google Scholar] [CrossRef]
  45. Zhang, X.; Liu, T.; Zhang, H.; Yu, J.; Jin, H.; Wang, X.; Wang, C.; Gao, X. Limiting current oxygen sensors with La0.8Sr0.2Ga0.8Mg0.2O3-δ electrolyte and La0.8Sr0.2(Ga0.8Mg0.2)1-xCoxO3-δ dense diffusion barrier. Ionics 2018, 24, 827–832. [Google Scholar] [CrossRef]
  46. Kalyakin, A.; Fadeyev, G.; Demin, A.; Gorbova, E.; Brouzgou, A.; Volkov, A.; Tsiakaras, P. Application of Solid oxide proton-conducting electrolytes for amperometric analysis of hydrogen in H2+N2+H2O gas mixtures. Electrochim. Acta 2014, 141, 120–125. [Google Scholar] [CrossRef]
  47. Kalyakin, A.; Lyagaeva, J.; Medvedev, D.; Volkov, A.; Demin, A.; Tsiakaras, P. Characterization of proton-conducting electrolyte based on La0.9Sr0.1YO3–δ and its application in a hydrogen amperometric sensor. Sens. Actuators B Chem. 2016, 225, 446–452. [Google Scholar] [CrossRef]
  48. Kalyakin, A.; Volkov, A.; Lyagaeva, J.; Medvedev, D.; Demin, A.; Tsiakaras, P. Combined amperometric and potentiometric hydrogen sensors based on BaCe0.7Zr0.1Y0.2O3−δ proton-conducting ceramic. Sens. Actuators B Chem. 2016, 231, 175–182. [Google Scholar] [CrossRef]
  49. Yagi, H.; Ichikawa, K. Humidity sensing characteristics of a limiting current type planar oxygen sensor for high temperatures. Sens. Actuators B Chem. 1993, 13, 92–95. [Google Scholar] [CrossRef]
  50. Iwahara, H.; Uchida, H.; Kondo, J. Galvanic cell-type humidity sensor using high temperature-type proton conductive solid electrolyte. J. Appl. Electrochem. 1983, 13, 365–370. [Google Scholar] [CrossRef]
  51. Katahira, K.; Matsumoto, H.; Iwahara, H.; Koide, K.; Iwamoto, T. A solid electrolyte steam sensor with an electrochemically supplied hydrogen standard using proton-conducting oxides. Sens. Actuators B Chem. 2000, 67, 189–193. [Google Scholar] [CrossRef]
  52. Taniguchi, N.; Kuroha, T.; Nishimura, C.; Iijima, K. Characteristics of novel BaZr0.4Ce0.4In0.2O3 proton conducting ceramics and their application to hydrogen sensors. Solid State Ion. 2005, 176, 2979–2983. [Google Scholar] [CrossRef]
  53. Kalyakin, A.S.; Lyagaeva, J.G.; Chuikin, A.Y.; Volkov, A.N.; Medvedev, D.A. A high-temperature electrochemical sensor based on CaZr0.95Sc0.05O3–δ for humidity analysis in oxidation atmospheres. J. Solid State Electrochem. 2019, 23, 73–79. [Google Scholar] [CrossRef]
  54. Kalyakin, A.S.; Volkov, A.N.; Gorshkov, M.Y. An electrochemical sensor based on zirconia and calcium zirconate electrolytes for the inert gas humidity analysis. J. Taiwan Inst. Chem. Eng. 2020, 111, 222–227. [Google Scholar] [CrossRef]
  55. Kalyakin, A.S.; Danilov, N.A.; Volkov, A.N. Determining humidity of nitrogen and air atmospheres by means of a protonic ceramic sensor. J. Electroanal. Chem. 2021, 895, 115523. [Google Scholar] [CrossRef]
  56. Medvedev, D.; Kalyakin, A.; Volkov, A.; Demin, A.; Tsiakaras, P. Electrochemical moisture analysis by combining oxygen- and proton-conducting ceramic electrolytes. Electrochem. Commun. 2017, 76, 55–58. [Google Scholar] [CrossRef]
  57. Kalyakin, A.; Demin, A.K.; Gorbova, E.; Volkov, A.; Tsiakaras, P.E. Sensor Based on a Solid Oxide Electrolyte for Measuring the Water-Vapor and Hydrogen Content in Air. Catalysts 2022, 12, 1558. [Google Scholar] [CrossRef]
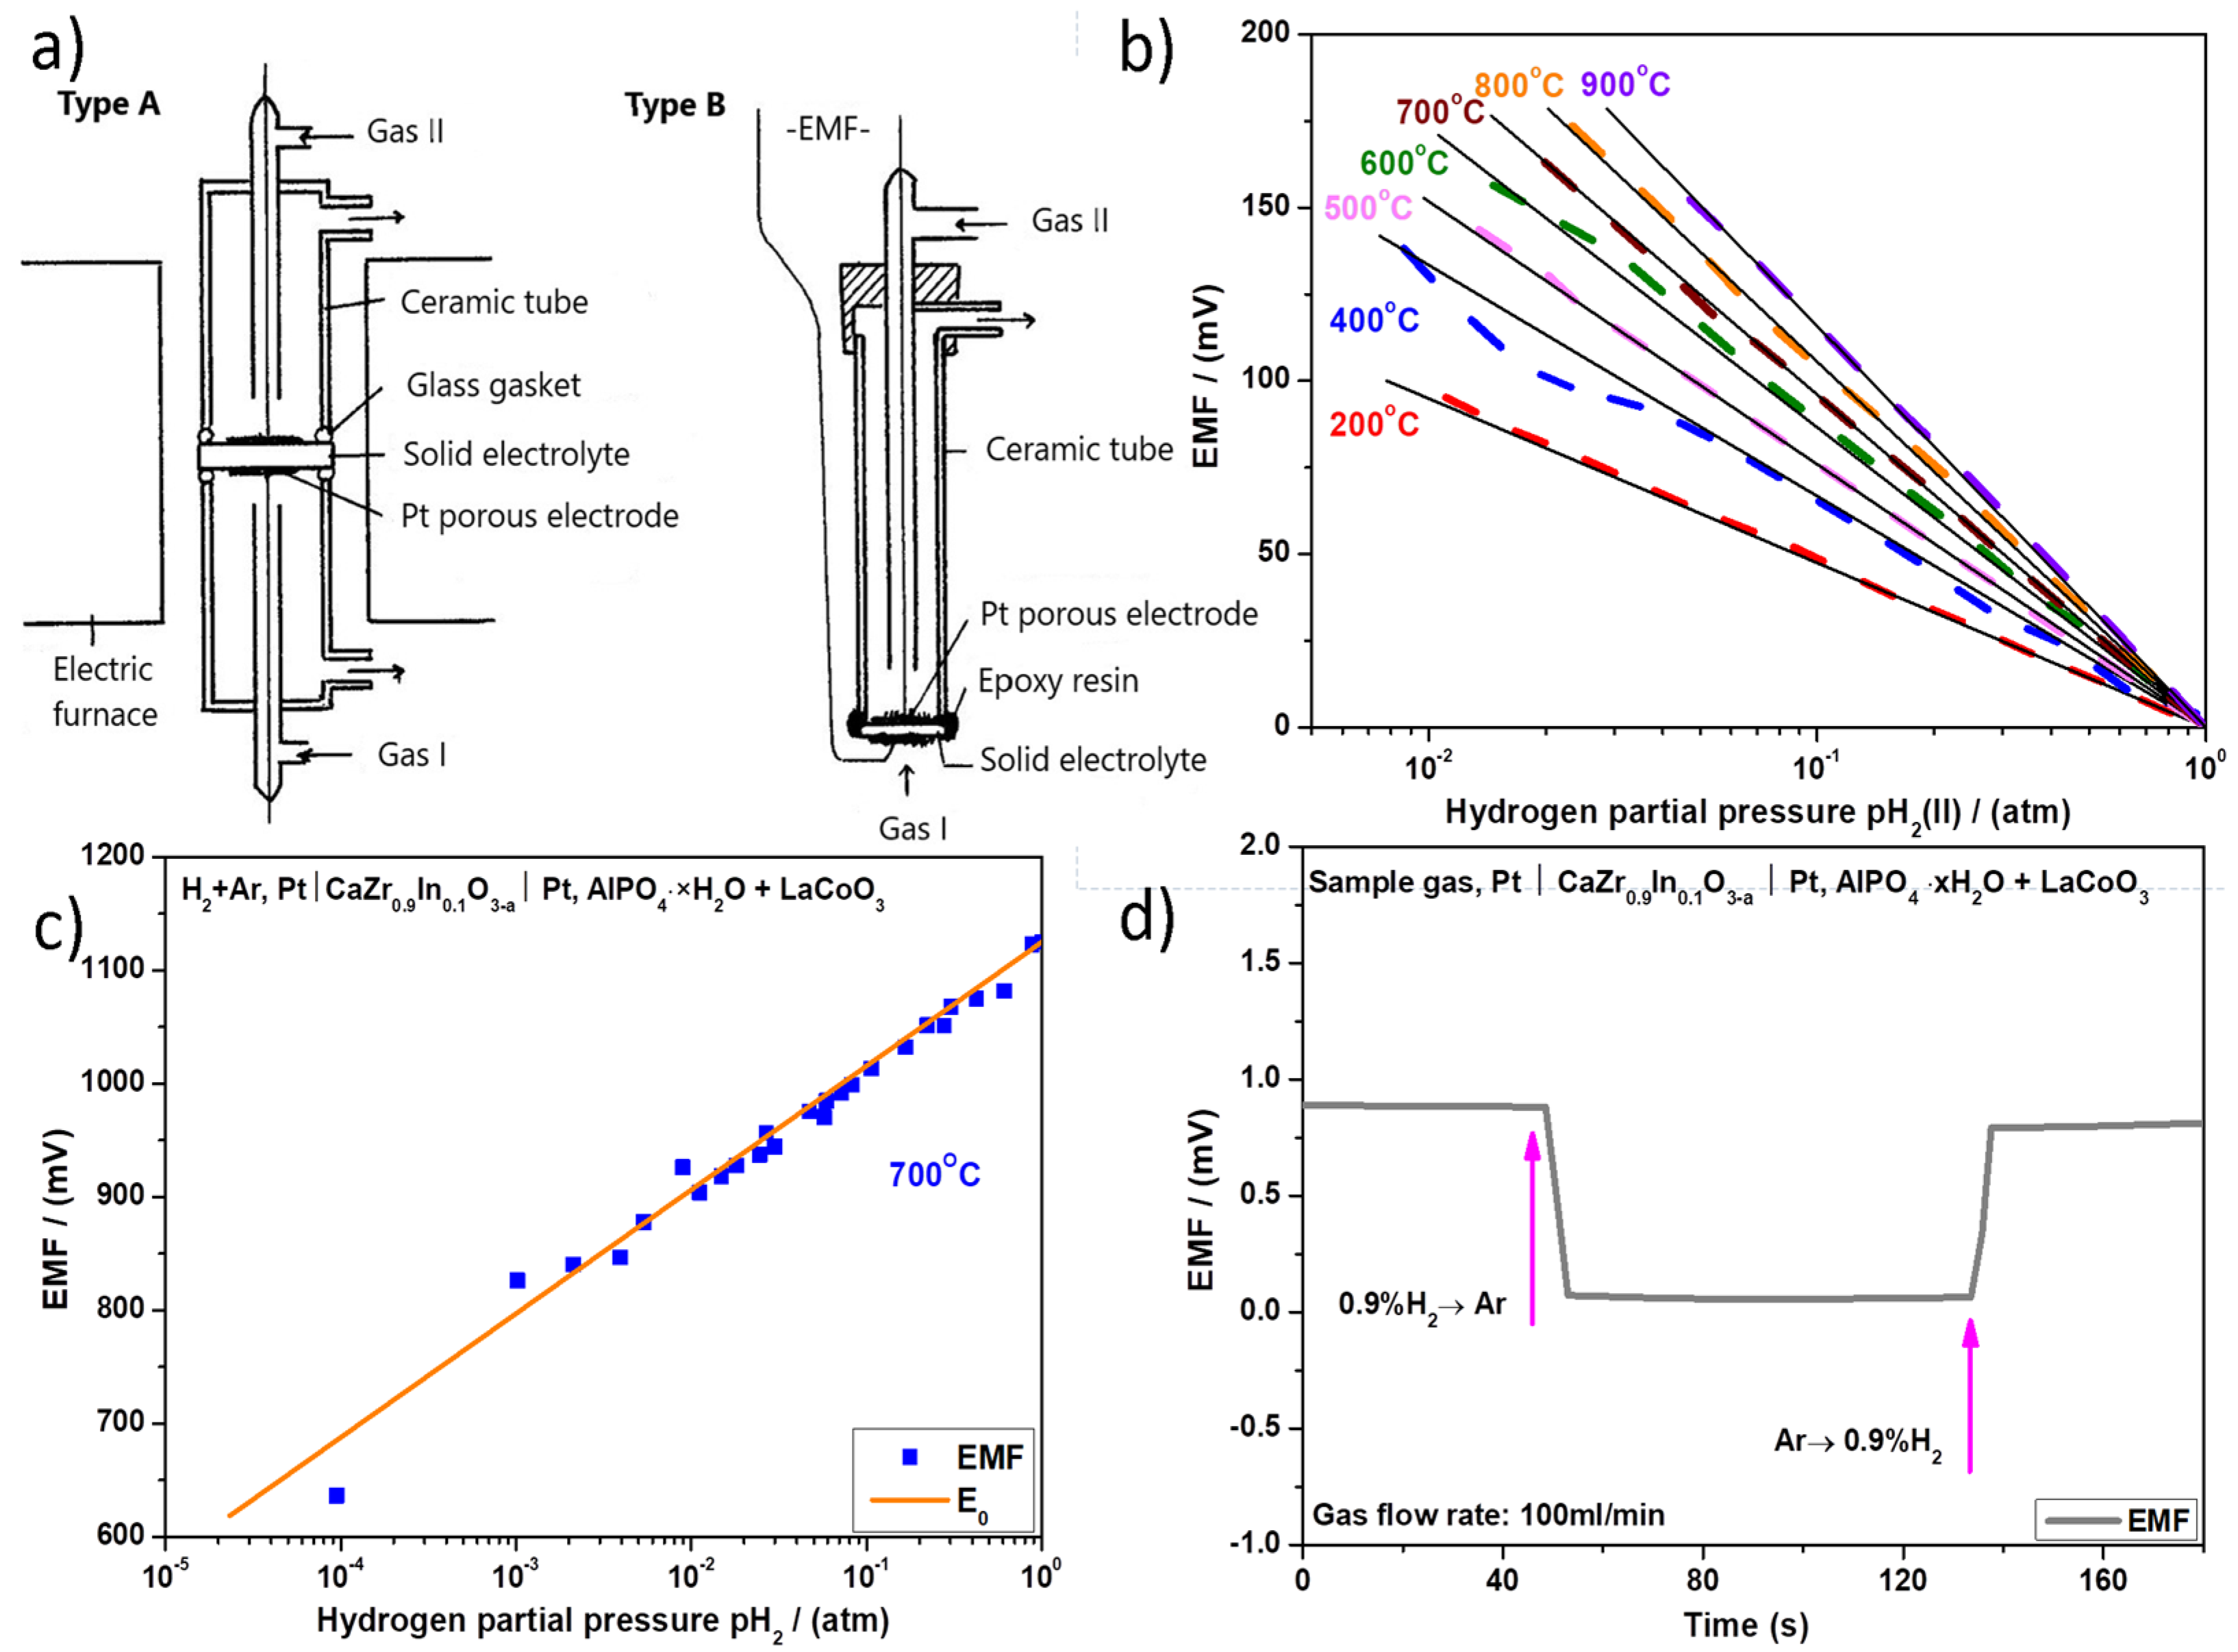
Figure 1. (a) Test hydrogen sensors; type A for temperatures above 400 °C and type B for temperatures below 400 °C. (b) EMF response of Pt|BCN|Pt sensor (type A sensor for T ≥ 400 °C and type B for T = 200 °C) against pH2 (II). Solid lines show the theoretical EMF (Eo), while dashed lines correspond to the calculated EMF at each temperature. (Data reproduced with permission from [23]. Copyright ©1991 Electrochemical Society. All rights reserved.) (c) EMF response of H2 + Ar, Pt|CZI|Pt, AP-LSC sensor against pH2 at 700 °C. (d) EMF response time when changing 0.9% of hydrogen gas to argon and vice versa. (Data reproduced from [24].)
Catalysts 12 01647 g001
Figure 2. (a) Proton transfer number change with alteration of the atmosphere, for CaZr1-xMnxO3-δ, the dashed line corresponds to x = 0.005, while the solid line corresponds to x = 0.05. (b) EMF variation and time response to the changes in the gas mixture, for the galvanic cell using CaZr0.95Mn0.05O3-δ as electrolyte. (Data reproduced from [25].)
Catalysts 12 01647 g002
Figure 3. EMF response for the different SEs with 8% O2 in the flue gas and (a) CO concentration ranging from 0 to 10,000 ppm and (b) H2 concentration ranging from 0 to 1000 ppm. (c) The long-term stability of the EMF characteristic for a solid electrolyte sensor using Pt/Au working electrode and tested in a chimney of a 7MW commercial burner (black dots—1st day, white dots—after 2 months). (Data reproduced with permission from [27]. Copyright ©1993 Elsevier. All rights reserved.) (d) EMF responses of SnO2, Cr2O3, and LSC electrodes in 200 ppm H2 in air or 200 ppm CO in air, at 500, 550, and 650 °C. (Data reproduced with permission from [28]. Copyright ©2013 Elsevier. All rights reserved.)
Catalysts 12 01647 g003
Figure 4. (a) Schematic illustration of the discussed amperometric hydrogen sensor: 1—solid electrolyte (proton conductor), 2—glass sealant, 3—internal Pt electrodes, 4—external Pt electrode, and 5—Pt leads; (b) the I-V curves for sensor 1 using La0.95Sr0.05YO3 as solid electrolyte at different hydrogen concentrations in the gas mixture of N2 + 2%H2O + H2 (800 °C); (c) I-V curves for sensor 2 using CaZr0.9Sc0.1O3 as solid electrolyte at different hydrogen concentrations in the gas mixture of N2 + 2%H2O + H2 (800 °C); (d) I-V curves for sensor 3 using CaTi0.95Sc0.05O3 as solid electrolyte at different hydrogen concentrations in the gas mixture of N2 + 2%H2O + H2 (800 °C); and (e) the limiting current of sensor 1 plotted against the hydrogen concentration. (Data reproduced with permission from [46]. Copyright ©2014 Elsevier. All rights reserved.)
Catalysts 12 01647 g004
Figure 5. (a) The configuration of the amperometric H2 sensor: (1) the analyzed gas, (2) ceramic capillary, (3) Pt electrodes, and (4) glass sealant; (b) photo of the fabricated sensor; (c) I and OCV related to the voltage for 0.7 vol.% H2 + N2 at the temperature of 550 °C; (d) I-V curves for low hydrogen concentration (0.1–0.38 vol.% H2) at 550 °C; (e) I-V curves for the hydrogen concentrations ranging from 0.38 to 3.3 vol.% H2 in the H2 + N2 at 550 °C; (f) the limiting current plotted against the hydrogen concentration. (Data reproduced with permission from [47]. Copyright ©2014 Elsevier. All rights reserved.)
Catalysts 12 01647 g005
Figure 6. (a) Schematic illustration of the potentiometric mode of the sensor: (1) solid electrolyte based on BZCY, (2) inner chamber, (3) ceramic capillary, (4) Pt electrodes, (5) high-temperature glass sealant; (b) schematic illustration of the amperometric mode of the sensor; (c) EMF-V curves plotted for different hydrogen concentrations (x = 0.1–5 vol.% H2) at 500 °C; (d) I-V curves of the amperometric part for the gas mixture N2 + 4%H2 + 2%H2O at different operating temperatures; (e) I-V curves plotted for different hydrogen concentrations (x = 0.8–10 vol.% H2) at 500 °C; and (f) the limiting current response of the amperometrically operating sensor against the hydrogen concentration. (Data reproduced with permission from [48]. Copyright ©2016 Elsevier. All rights reserved.)
Catalysts 12 01647 g006
Figure 7. (a) The configuration of the amperometric sensor for the detection of hydrogen and steam in atmospheric air; (b) a photograph of the manufactured sensor along with a ruler for the estimation of its dimensions; (c) V-I curves of the amperometric sensor for the H2 + dry air mixture plotted at different hydrogen concentrations; and (d) the limiting current plotted against the hydrogen concentration (triangles) in dry air, steam concentration (circles) in air and the hydrogen concentration in the humidified mixture (3.3%) of H2 + air. (Data reproduced from [57].)
Catalysts 12 01647 g007
Table 1. EMF response of the different tested solid electrolytes (SEs) at 550 °C. (Data reproduced from [28].)
Electrode MaterialEMF/mV
0.02% H2 + Air0.02% CO + Air
Ag10
SnO212766
ZnO11562
Cr2O35035
In2O32718
La0.6Sr0.4MnO365
La0.8Sr0.2CrO36017
Table 2. Electrochemical gas sensors based on oxygen ion and proton-conducting solid electrolytes.
TypeTarget GasTemperature °CElectrolyteYearRefs
potentiometricH2200–900BaCe0.9Nd0.1O3-α1991[23]
potentiometricH2600–800CaZr0.95Mn0.05O3-δ2016[25]
amperometricH2850CaZr0.9Sc0.1O32014[46]
amperometricH2850La0.95Sr0.05YO32014[46]
amperometricH2500–600La0.9Sr0.1YO3-δ2016[47]
combinedH2450–550BaCe0.7Zr0.1Y0.2O3-δ2016[48]
amperometricH2, H2O7000.9ZrO2 + 0.1Y2O3 (YSZ)2022[57]
Publisher’s Note: MDPI stays neutral with regard to jurisdictional claims in published maps and institutional affiliations.