Article

Theoretical Studies of Acetyl-CoA Synthase Catalytic Mechanism

Institute of Chemistry, University of Silesia in Katowice, Szkolna 9, 40-006 Katowice, Poland
*
Author to whom correspondence should be addressed.
Catalysts 2022, 12(2), 195; https://doi.org/10.3390/catal12020195
Submission received: 29 November 2021 / Revised: 29 January 2022 / Accepted: 29 January 2022 / Published: 4 February 2022
(This article belongs to the Special Issue Mechanism/Kinetic Modeling Study of Catalytic Reactions)

Abstract

:
DFT calculations were performed for the A-cluster from the enzyme Acetyl-CoA synthase (ACS). The acid constants (pK a ), reduction potentials, and pH-dependent reduction potential for the A-cluster with different oxidation states and ligands were calculated. Good agreement of the reduction potentials, dependent on pH in the experiment, was obtained. On the basis of the calculations, a mechanism for the methylation reaction involving two–electron reduction and protonation on the proximal nickel atom of the reduced A-cluster is proposed.

1. Introduction

Acetyl-CoA synthase (ACS) is a bacterial enzyme [1,2,3,4,5,6,7,8,9,10,11,12,13,14,15,16,17,18,19,20,21,22] which synthetizes acetyl-CoA (acetyl coenzyme A) from CO and the methyl group. CO is formed from the CO 2 reduction reaction catalyzed by the carbon monoxide dehydrogenase (CODH) enzyme, and the methyl group is derived from the corrinoid iron-sulfur protein (CoFeSP). CoFeSP [23,24,25,26,27,28,29] belongs to the group of methyltransferase enzymes [29,30] in which the methylating agent is methylcobalamin. Methylcobalamin in CoFeSP is in the configuration in which the dimethylbenzimidazole ligand trans to the methyl group is dissociated [28,31] (Figure S1). The ACS catalyzed reaction can be described by the equation:
CH 3 Co ( III ) FeSP + CO + CoASH CH 3 CO - SCoA + Co ( I ) FeSP + H + .
The ACS active center is an iron–nickel complex called the A–cluster with the formula Fe 4 S 4 Ni p Ni d presented in Figure 1. The iron–sulfur cubane (Fe 4 S 4 ) is connected through a cysteine sulfur with the proximal nickel ion (Ni p ), which in turn is linked by two cysteine sulfur atoms to the distal nickel atom (Ni d ).
The ACS enzyme has been extensively studied using experimental [12,32,33,34,35,36,37,38,39,40,41,42,43,44,45,46] and theoretical [47,48,49,50,51,52,53,54,55] methods. Different oxidation states are postulated for Ni p from Ni(0) to Ni(III) while the distal nickel is always in Ni(II) oxidation state. The catalytic reaction of acetyl group formation from CO and methyl occurs on the Ni p site, it is followed by the reaction with CoA and acetyl–CoA generation.
Several forms of the A–cluster relevant to the catalytic reaction were characterized structurally or spectroscopically [8,36,37,46,56,57,58,59,60,61,62,63,64,65]. They can be described by the oxidation state, electronic configuration, spin, and ligands attached to Ni p , as shown in Table 1.
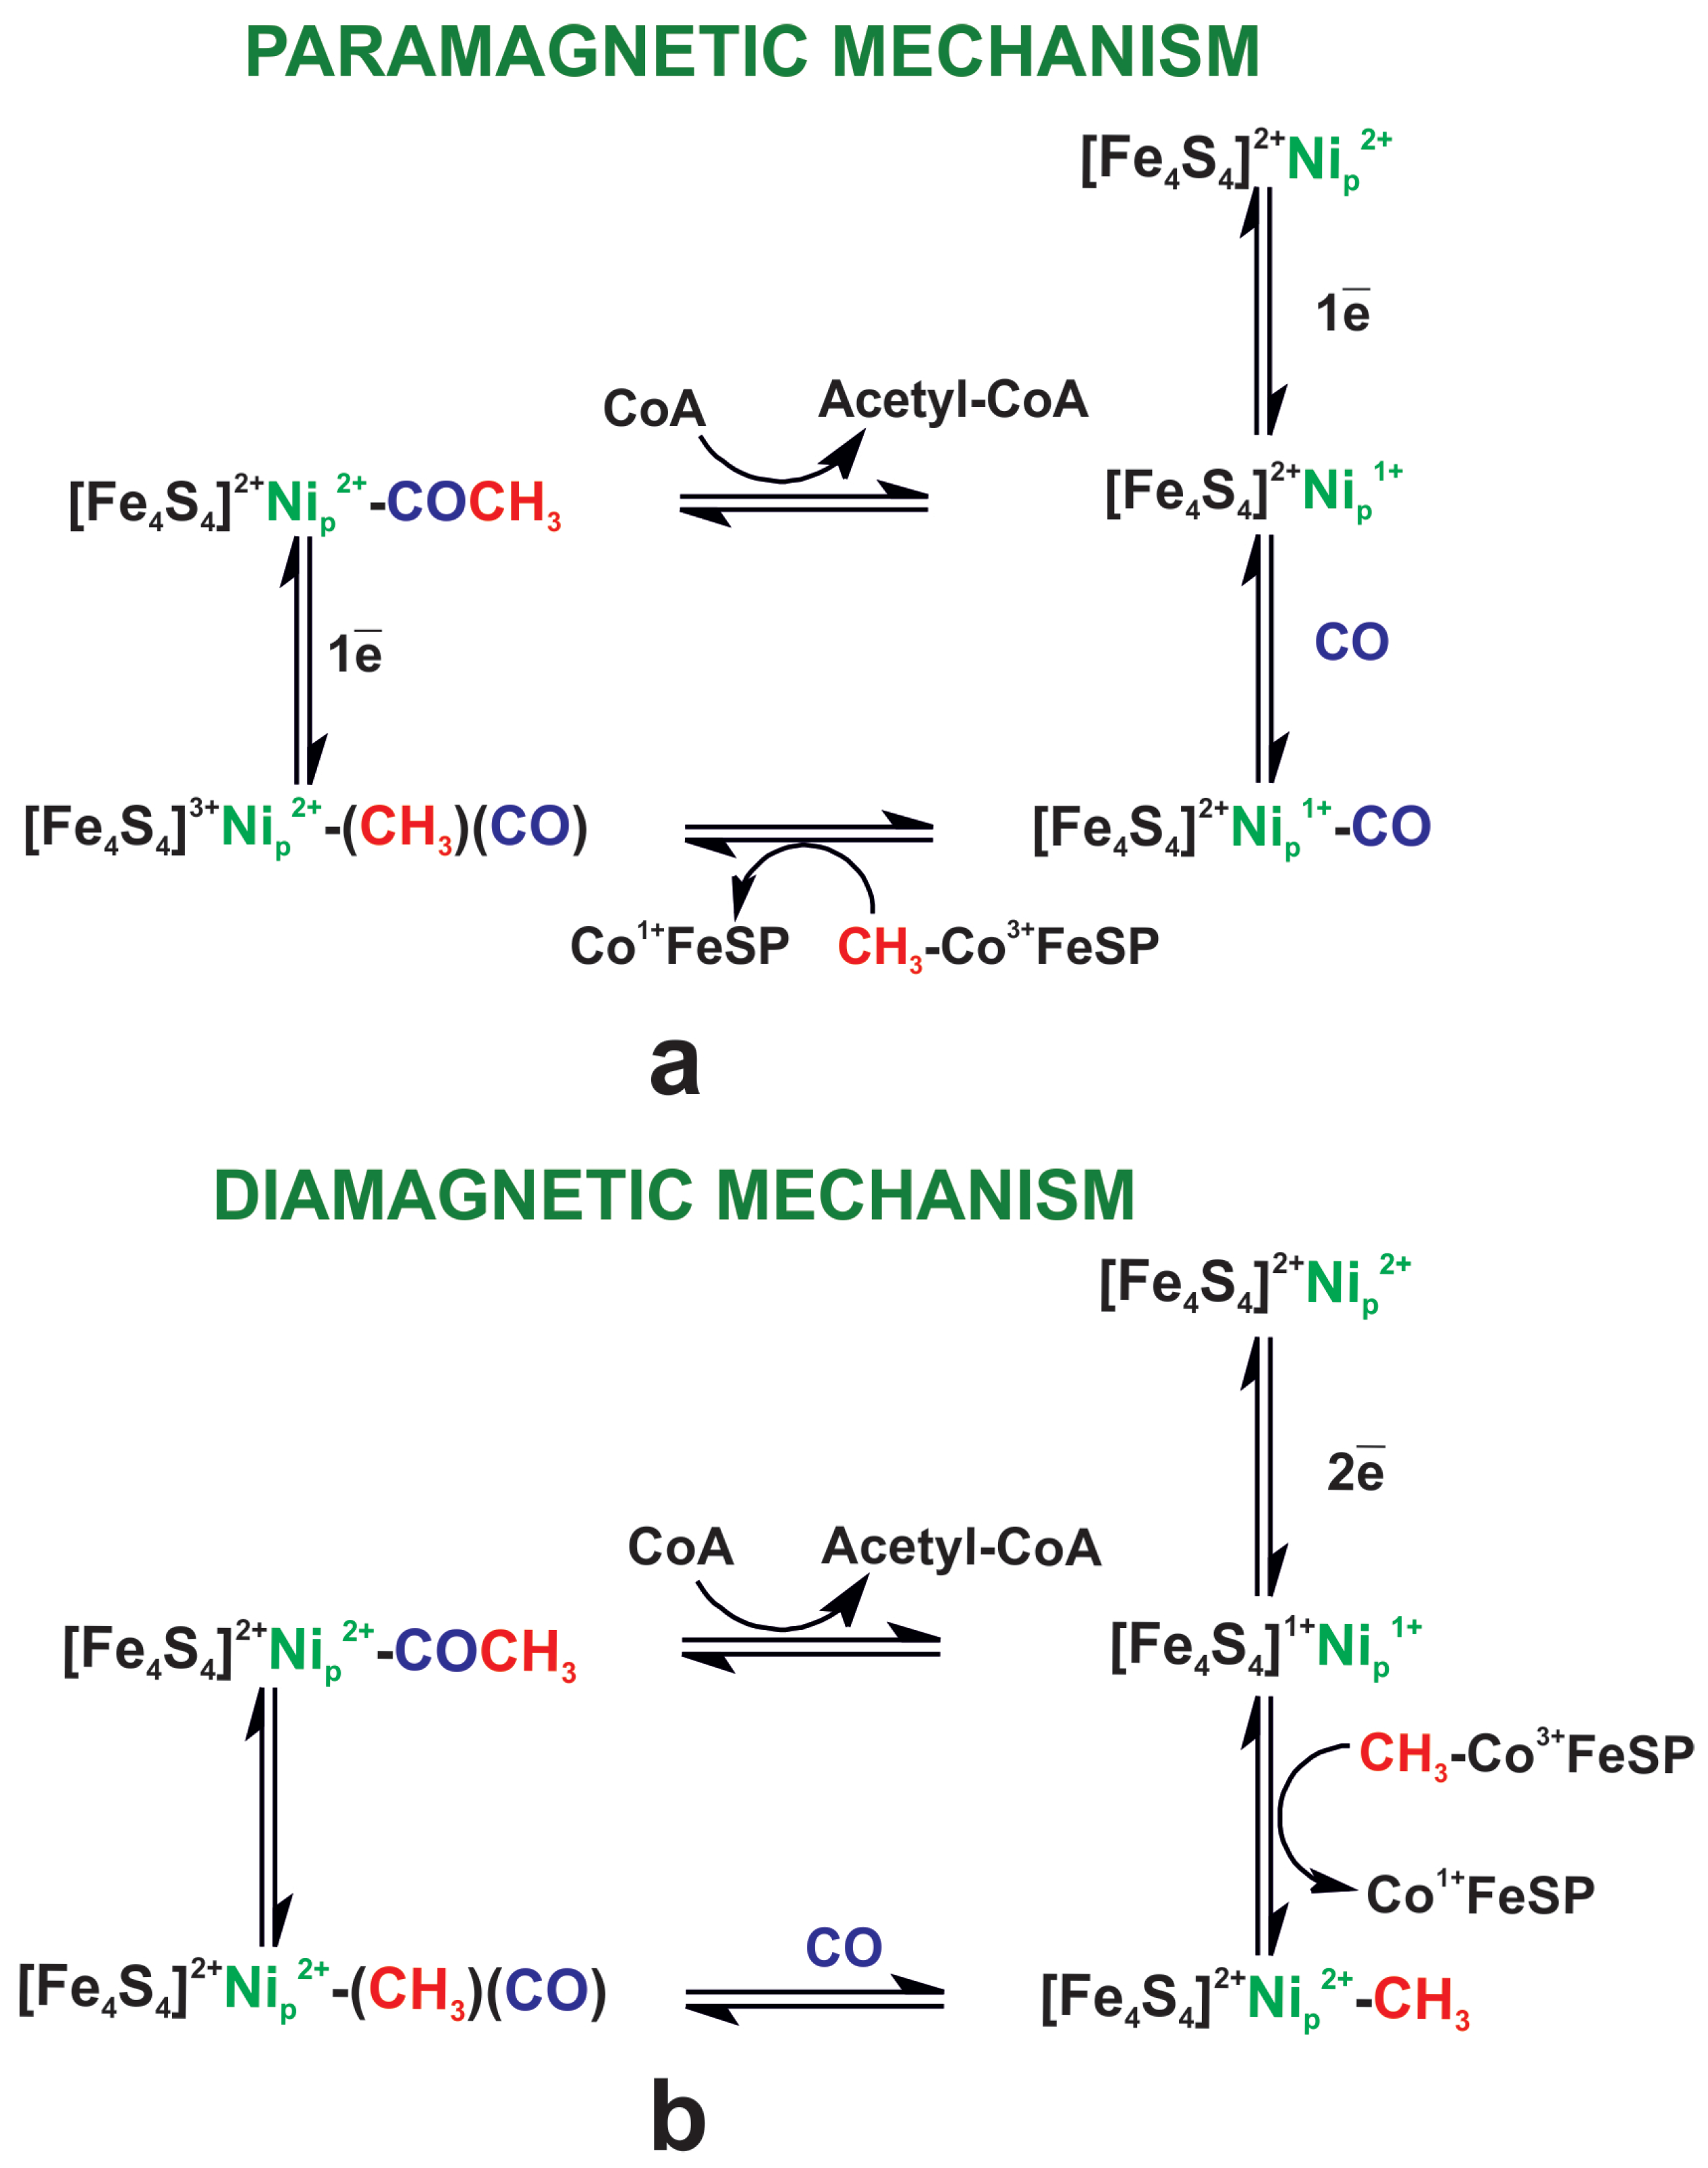
In the methylation step, the methyl group is transferred as the CH 3 + cation from methylcobalamin CH 3 Co(III)balamin to the A–cluster and the Co(I)balamin is formed. Since in the resting state, the A–cluster is in an oxidized state, A o x , therefore two electrons are needed to form the Ni p –methyl (or acetyl) bond. Two mechanisms are proposed for the catalytic reaction of the ACS enzyme, which differ in the one– or two–electron reduction of the A–cluster and the order of methylation and carbonylation. They are depicted in Figure 2. In the paramagnetic mechanism, [67,72,73,74] the A–cluster is reduced by one electron; next, the CO molecule is attached to Ni p forming the NiFeC specie. This is followed by methyl transfer from CH 3 Co(III)FeSP to Ni p (I). As a result, Ni p –acetyl and Co(I)FeSP are formed. After methylation, the second reduction step takes place. The order of methylation and carbonylation in the paramagnetic mechanism is random [73]. The intermediate (one electron reduced), product with Ni p (III)–CH 3 or Ni p (III)CO(CH 3 ) (depending on the methylation order) is pertinent to the paramagnetic mechanism. The second electron is added in the later stage of the reaction.
In the diamagnetic mechanism, [66,75,76,77,78] the two–electron reduction of the A–cluster with Ni p (0) formation is postulated. In the next step, the methyl group is transferred from CH 3 Co(III)FeSP to Ni p . This results in the formation of Ni p (II)CH 3 and Co(1)FeSP. After that, the addition of CO and formation of the acetyl derivative Ni(II) p –acetyl takes place. In studies of the ACS enzyme, the dependence of reductive methylation on pH was found, implying protonation of the A–cluster in the reaction course [79].
In this work, we present theoretical calculations of geometrical and electronic structure, acid dissociation constants pK a , reduction potentials, and pH–dependent reduction potentials for different forms of the A–cluster. On this basis, the ACS enzyme methylation mechanism is proposed. In previous work [49], we proposed the radical mechanism of the methyl transfer reaction with the reduction of the base–off methylcobalamin by the A–cluster in two–electron reduced state, based mainly on a small model and the unligated A–cluster. The calculations with a large model and with ligands present at Ni p show that the reduction of methylcobalamin is unlikely and the mechanism which involves first protonation of the proximal nickel and then methylation with concomitant deprotonation by an external base is suggested. The methyl group is transferred as a cation and the cobalt in methylcobalamin is in Co(III) state. We also show that an important role is played by an arginine residue which is close to the A–cluster in the reaction site. As a small model is used to determine some quantities, its properties are also presented in the calculations for comparison and validation.

2. Computational Details

2.1. Methods of Computation

Calculations were carried out with the use of Gaussian16 program [80]. The broken symmetry DFT (BS–DFT) method [81,82] was employed with the BP86 functional [83,84] along with the TZVP basis set [85]. The BP86 functional was chosen because it allows obtaining a good description of the cobalt–methyl bond in alkylcobalamins, while the hybrid functionals significantly underestimate the energy of this bond [86,87]. This is especially important in catalytic mechanisms of the ACS enzyme, where metal–methyl bonds are formed. Calculations for transition metal complexes also show that the BP86 functional gives a good estimation of redox potential [88,89].
The PCM solvent model [90] was applied with the dielectric constant equal to 20 and 80. The dielectric constant ε = 4 is often used for modeling the protein environment; however, it has been shown that higher ε values are necessary for calculation of pK a and reduction potentials in protein [91,92,93,94].
Two models of the active center of the ACS enzyme were used. The models were constructed on the basis of the crystal structure PDB ID: 1RU3 [95]. They are shown in Figure 3. In the M1 model, cysteine residues around the cubane were modeled by SCH 2 CH 3 thiolate groups. In the M2 model additional amino acid residues were added around the A–cluster including Arg 619. During optimization, some atoms were frozen to keep the position of the A–cluster similar to the protein. The frozen atoms are marked by asterisks.
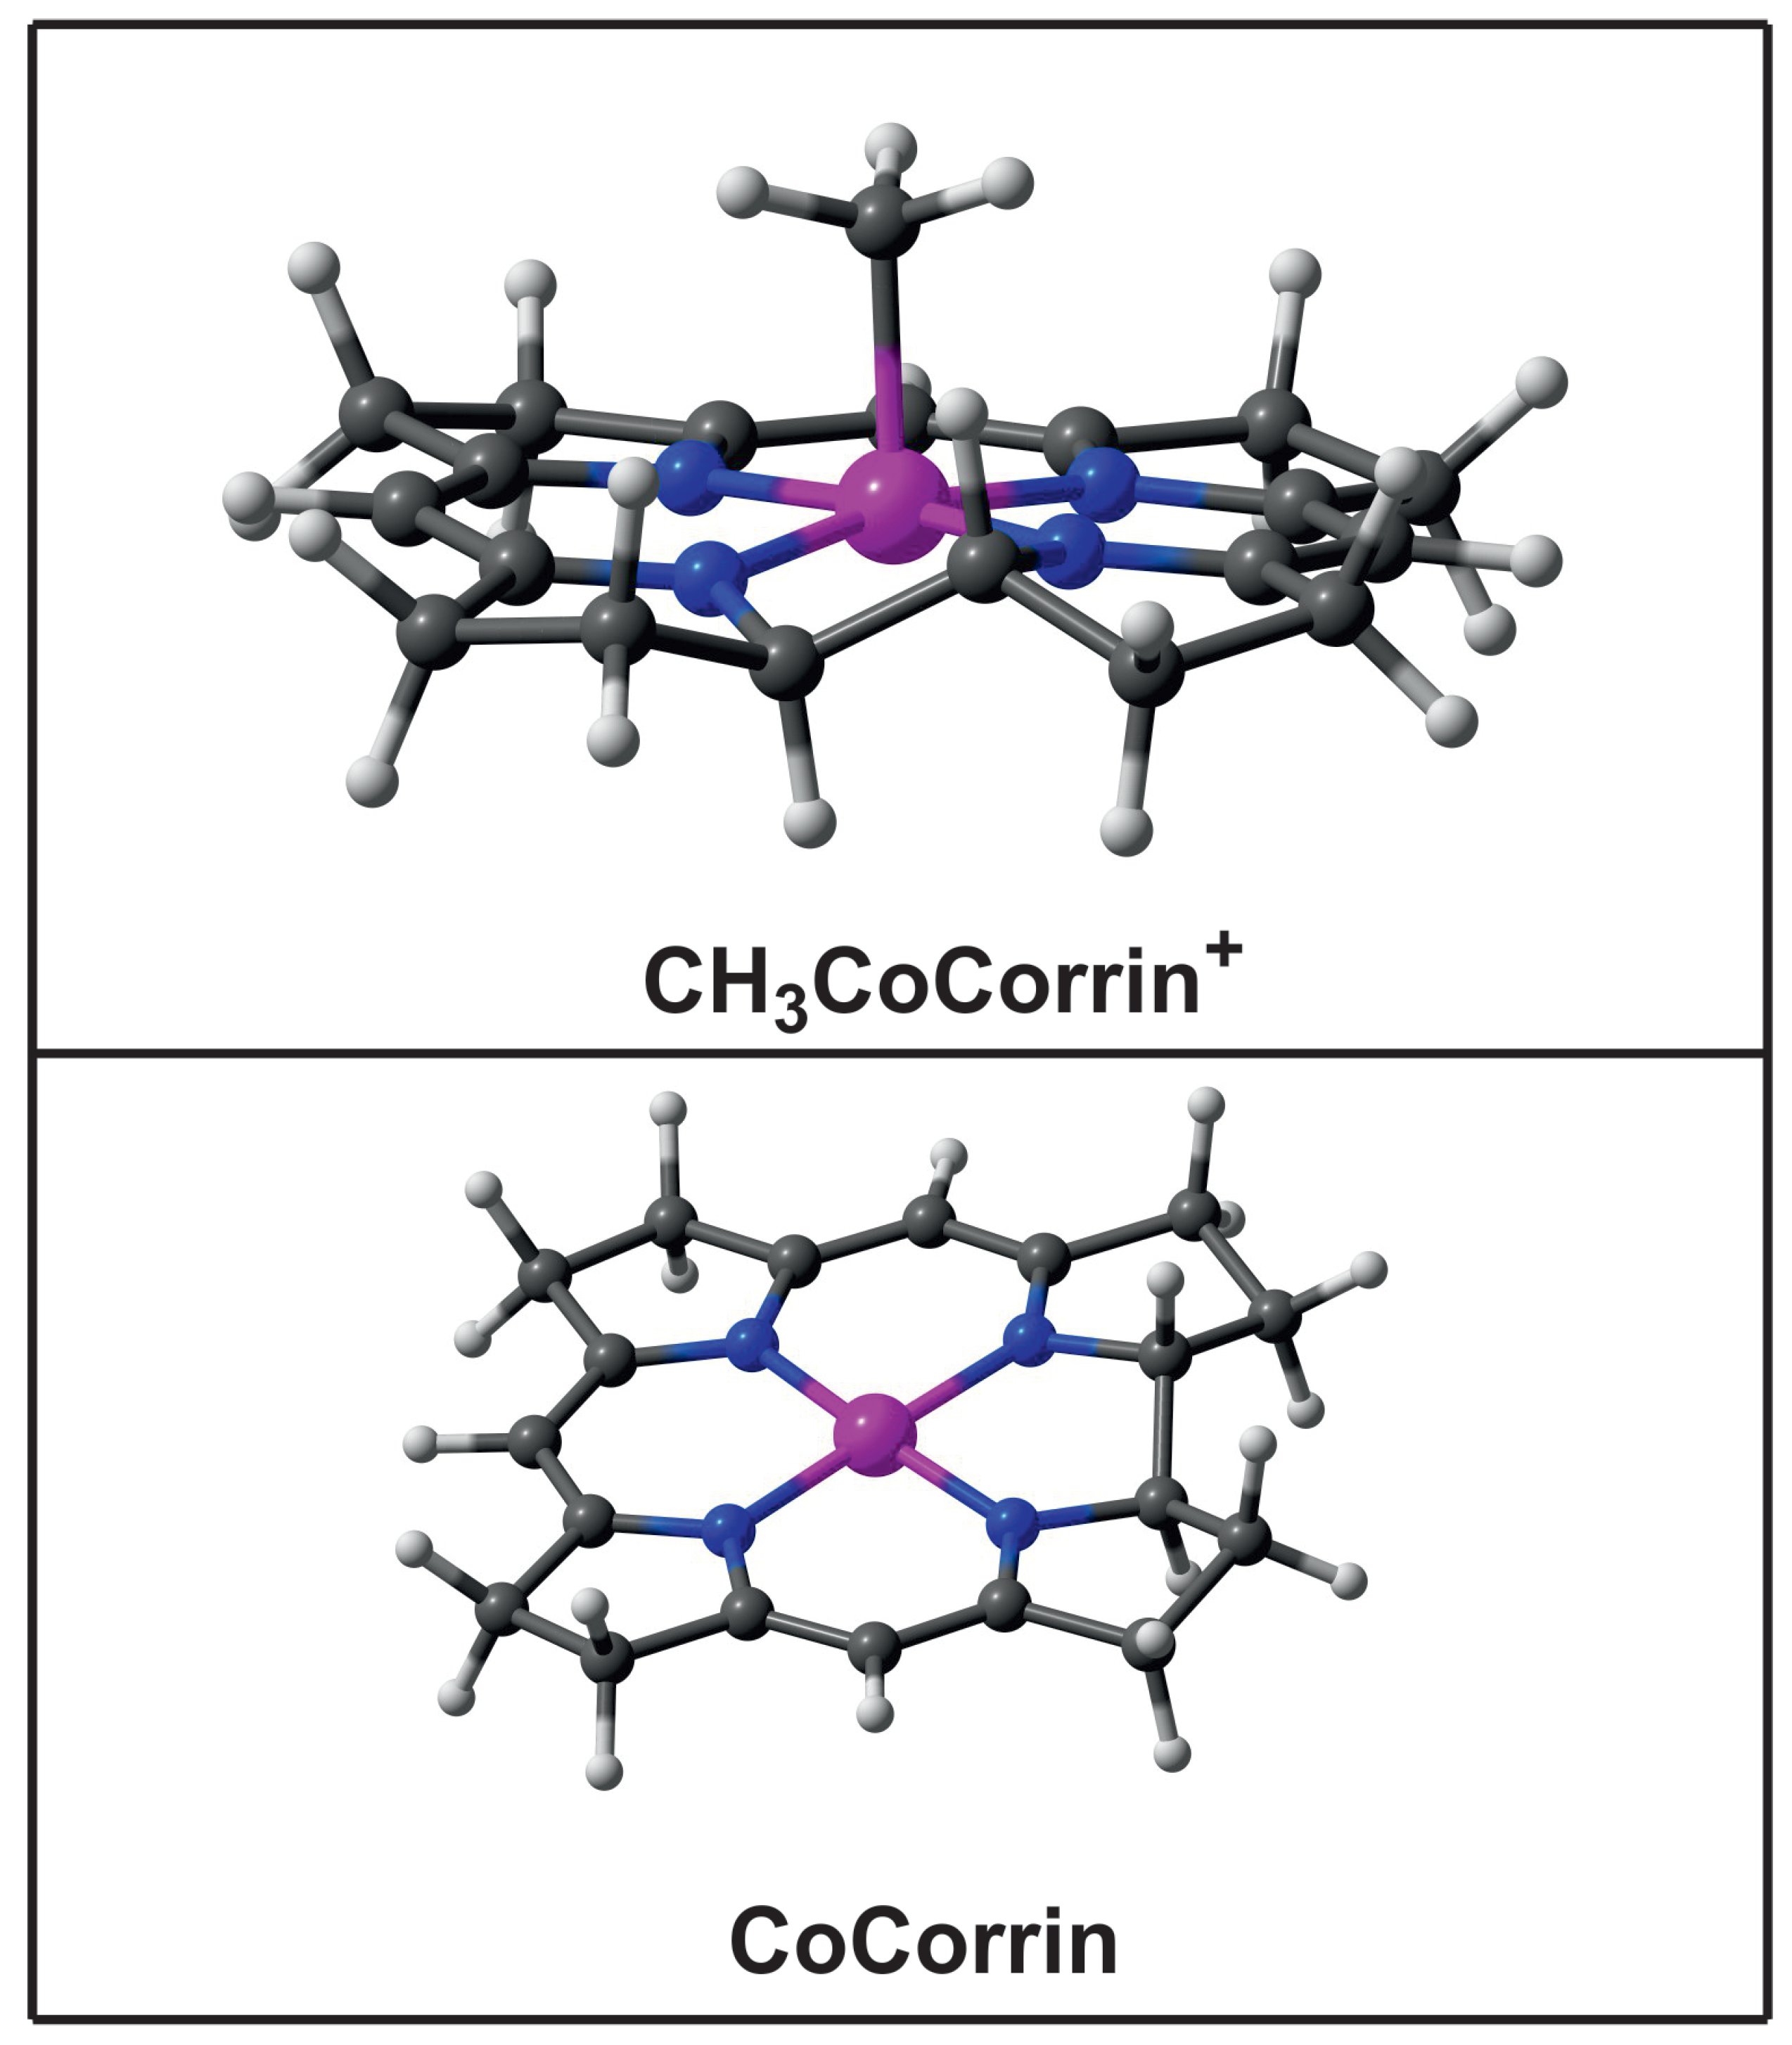
The CH 3 Co(III)cobalamin and Co(I)cobalamin from CoSFeP protein are modeled in the calculations by simplified forms denoted CH 3 Co(III)Corrin + and Co(I)Corrin (Figure 4).
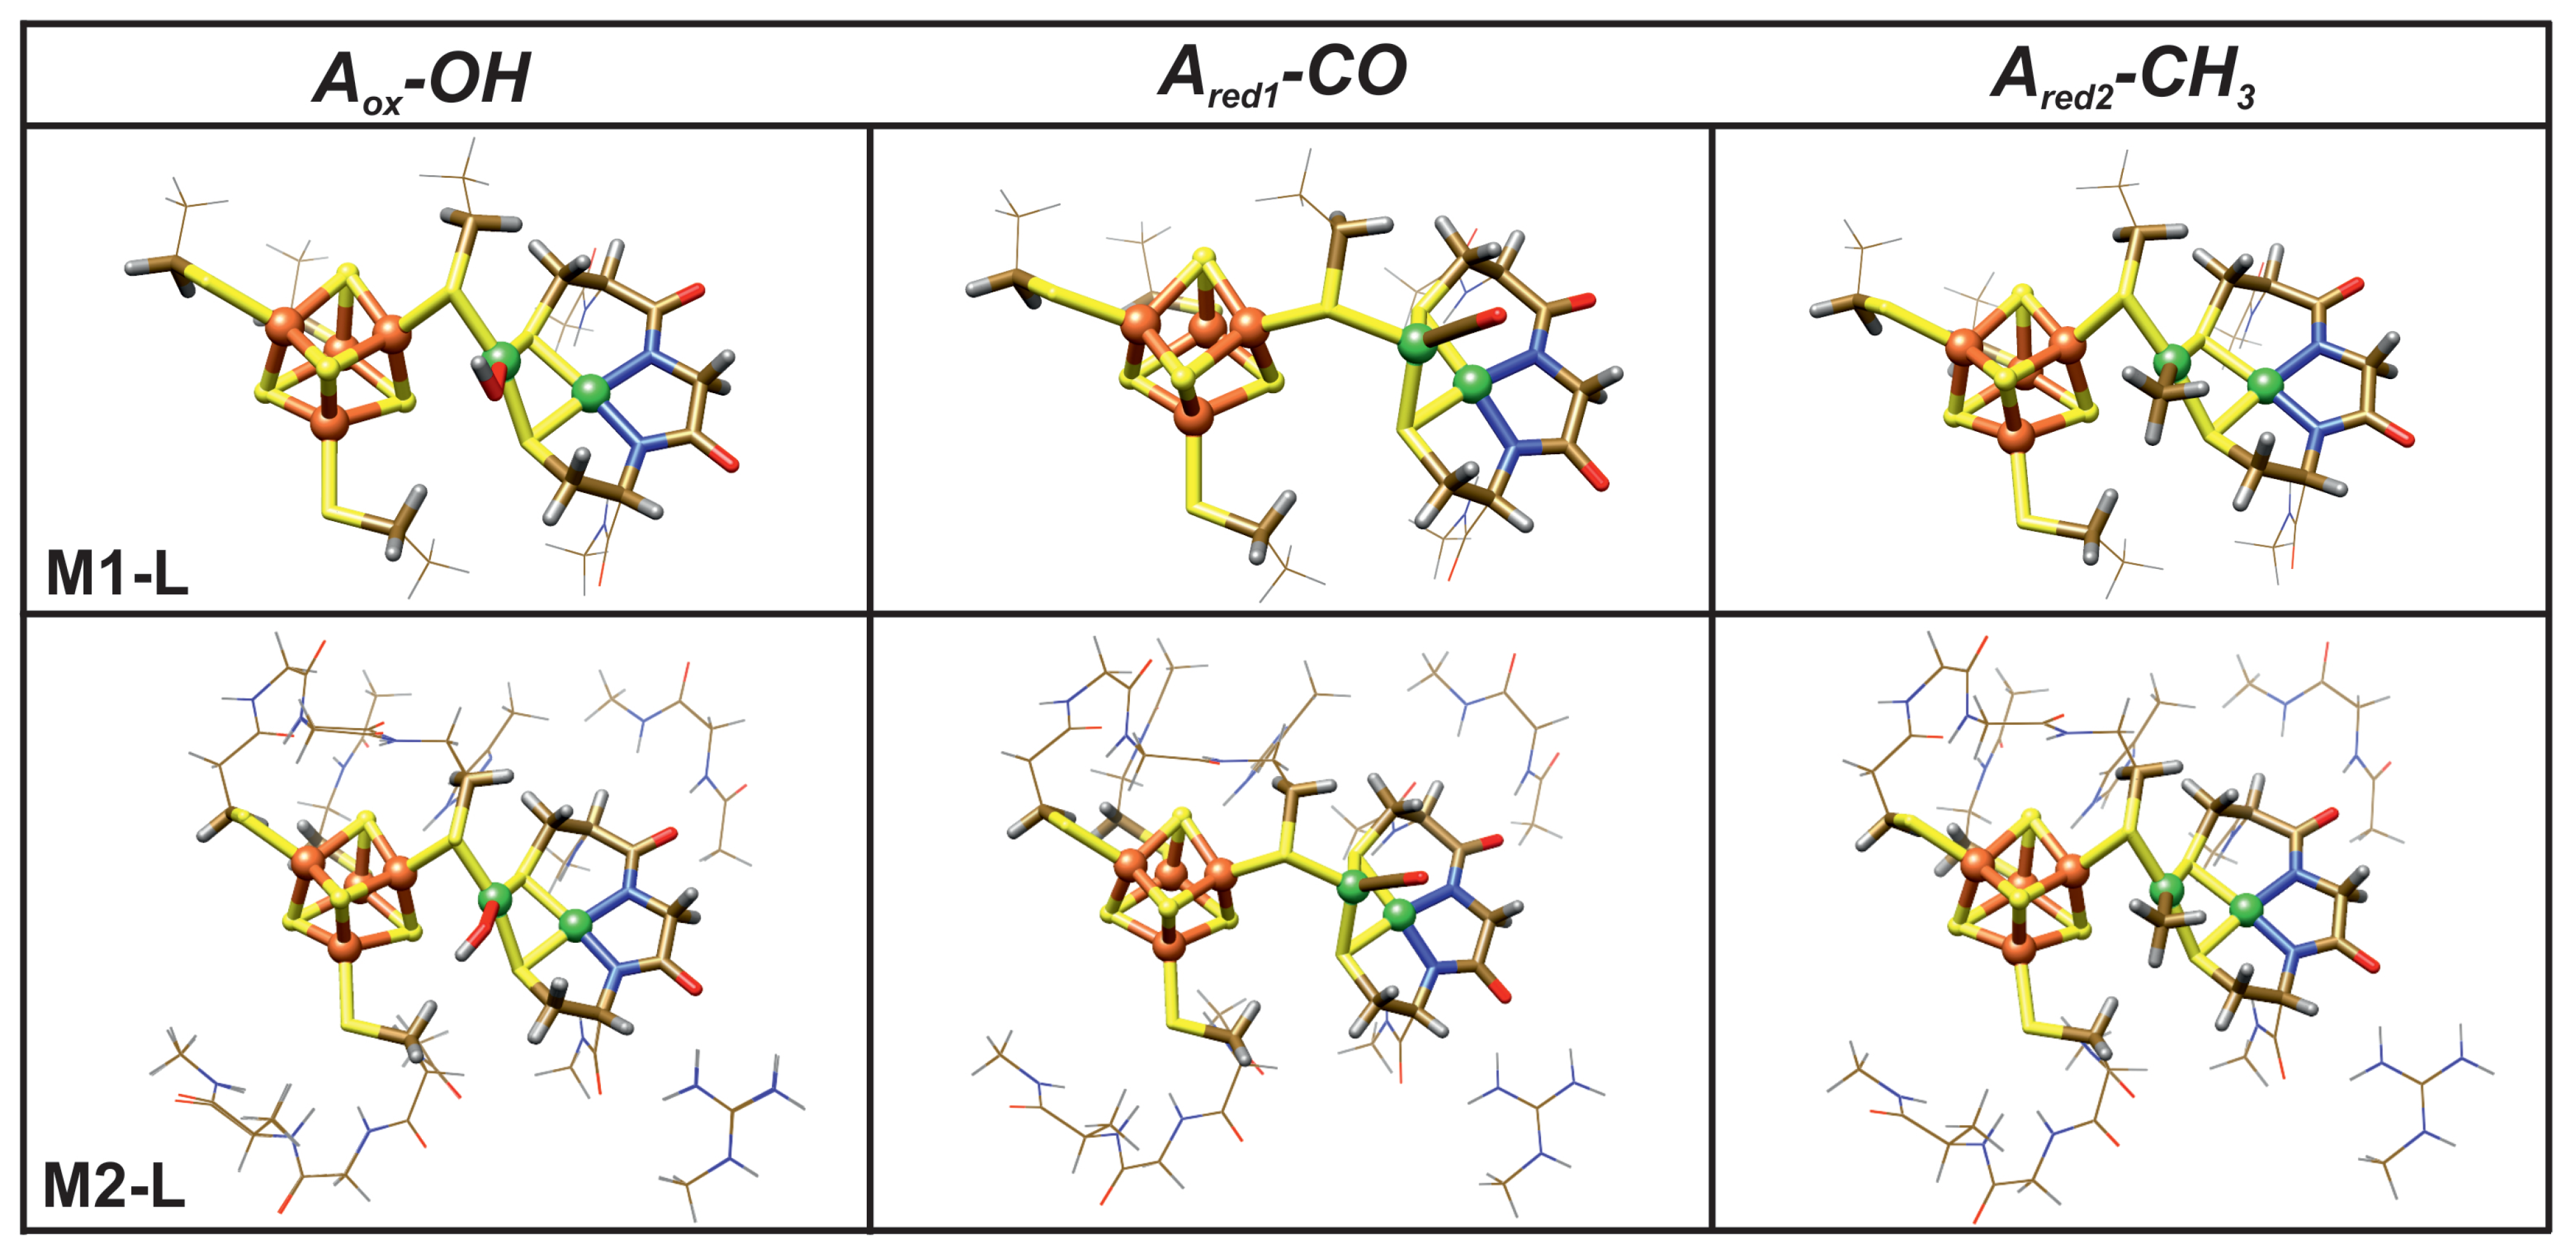
The M1 and M2 models were also used in the calculations for the A–cluster with the catalytically relevant ligands. They are presented in Figure 5.

2.2. Redox Potential

The reduction potentials were calculated with Equation [96,97]:
E 0 = ( E ( M + ) s o l E ( M ) s o l ) n Δ S H E ,
Δ S H E = 4.28 V ,
where the standard hydrogen electrode potential (ΔSHE) of 4.28 V is used and n is the number of electrons (1 or 2). In Equation (3) E ( M + ) s o l and E ( M ) s o l stand for the energy of a ionized and neutral molecules in the solution, respectively.

2.3. pK a Calculation

pK a values and pH–dependent redox potentials were calculated with the methodology used for metalloenzymes [98,99,100]. The pK a values were calculated according to the formula:
p K a = ( E ( M ) s o l E ( M H + ) s o l + Δ G s o l ( H + , 1 atm ) T Δ S g a s ( H + ) + 5 2 R T + Δ Z P E ) 1.364 ,
where
Δ G s o l ( H + , 1 atm ) = 263.98 kcal / mol .
E ( M ) s o l and E ( M H + ) s o l are the energies of the protonated and unprotonated molecules in solution, respectively. Δ G s o l (H+,1 atm) is the solvation free energy of a proton at 1 atm of gas hydrogen pressure, for which the experimental value of −263.98 kcal/mol is used [101,102]. The translational entropy contribution to the gas–phase free energy of a proton is taken as T Δ G g a s ( H + ) = 7.76 kcal/mol at 298 K and 1 atm of pressure. (5/2)RT includes the proton translational energy (3/2)RT and PV = RT. Δ ZPE values for the protonated species were calculated for small model complexes [49]. The reason for that is the fact that for models used in this work, the optimization was performed with geometry constraints.

2.4. pH Dependent Redox Potentials

The reduction potentials coupled to protonation are calculated according to the formula [98,99,100]:
E 0 = E 0 + 1.37 m 23.06 n ( p K a p H ) ,
where n is the number of electrons (1 or 2) and m is the number of protons (1 in this work). In Equation (6) E 0 and E 0 denote pH–dependent and pH–independent reduction potentials, whereas pK a value is for the reduced specie.

3. Results

3.1. Structural Properties

The selected experimental bond distances in the different forms of the A–cluster are gathered in Table 2. In the crystal structure of the A–cluster, copper, zinc and nickel can be found in the proximal position [8,61,103,104,105]. It was shown that only the enzyme with nickel in this site is catalytically active [105]. In Table 3, the calculated structural parameters are given for the M1 and M2 models with and without catalytically important ligands (Figure 5). Among the ligands, there is the formate ion as suggested by the data in crystal structure [34]. The calculated geometry parameters for M1 and M2 differ at most by a few hundredths of Å; however this does not apply to the structure with CO ligand where the differences are substantial, especially for the Ni p –Fe1 distance.
The data in Table 2 shows that the experimental Ni p –Ni d distances are approximately in the ∼2.9–3.0 Å range, the same can be found in the calculated values in Table 3. In turn, the Ni p –Fe1 distances are in the range ∼2.6–2.8 Å. Similar values can be seen in the calculations (Table 3) although these distances are slightly longer for the formate and hydroxyl ligands. At the same time, it can be found that the Ni p –Fe1 distance is very small (2.243 Å) in the PDB ID: 6YTT crystal structure [46] where there is no ligand on Ni p and in turn very long in the crystal structure PDB ID: 6X5K [36] with the carbonyl ligand. This is not the case in the EXAFS results for the CO ligand, where this distance is equal to 2.80 Å [56] (Table 2). If we look at the Ni p –Fe1 distances obtained from the calculations, it can be seen that the M1 model with CO gives values similar to the crystal structure and the M2 model to EXAFS [56]; however, both calculated values are longer than in the experimental case. The carbonyl bound Ni(I) ion has a tetrahedral coordination sphere which can be seen from the valence angles around Ni p (Table 2). Calculated valence angles in the coordination sphere of the carbonylated A–cluster also indicate the tetrahedral structure. Tetraahedral coordination of Ni p in NiFeC models was also obtained in other theoretical studies [48,51]. The remaining ligated A–cluster forms reveal a planar or distorted planar Ni p coordination, as it can be inferred from the valence angles presented in Table 3.

3.2. Electronic Structure

In Table 4, the spin densities on Ni p , Ni d and cubane for the A-cluster with different ligands are gathered. In the one–electron reduced A–cluster, there is a significant spin density on the Ni P ion which confirms that the unpaired electron is placed on this ion. This is true for the A-cluster without ligands as well as with CO and H 2 O ligands. These findings conform with other calculations and experimental data [37,48,51,106]. The situation is different for the methyl ligand where there is a relatively low spin density on Ni p (slightly higher for the M2 model), while the high spin density is on the iron–sulfur cubane. The calculations show that in this case the cubane is oxidized and not the proximal nickel atom, i.e., the Fe 4 S 4 3 + Ni 2 + CH 3 configuration instead of the Fe 4 S 4 2 + Ni 3 + CH 3 one is found.
The two–electron reduced, methylated form, A r e d 2 –CH 3 , has a Ni p (II) cation oxidation state, since the two electrons are present on the Ni p –CH 3 bonding orbital. This is due to the fact that the methyl group is transferred in the cationic form, CH 3 + . The two–electron reduced A-cluster, A r e d 2 , has spin densities of opposite sign both on Ni p and on the cubane which means that two electrons are antiferromagnetically coupled. Such antiferromegnetic coupling was confirmed by Mössbauer spectroscopy and was found in many calculational studies [48,49,50,55,65]. The spin density on the Ni d atom is close to zero except for A o x without ligand and A r e d 1 –CO where some spin density is shifted from Ni p .
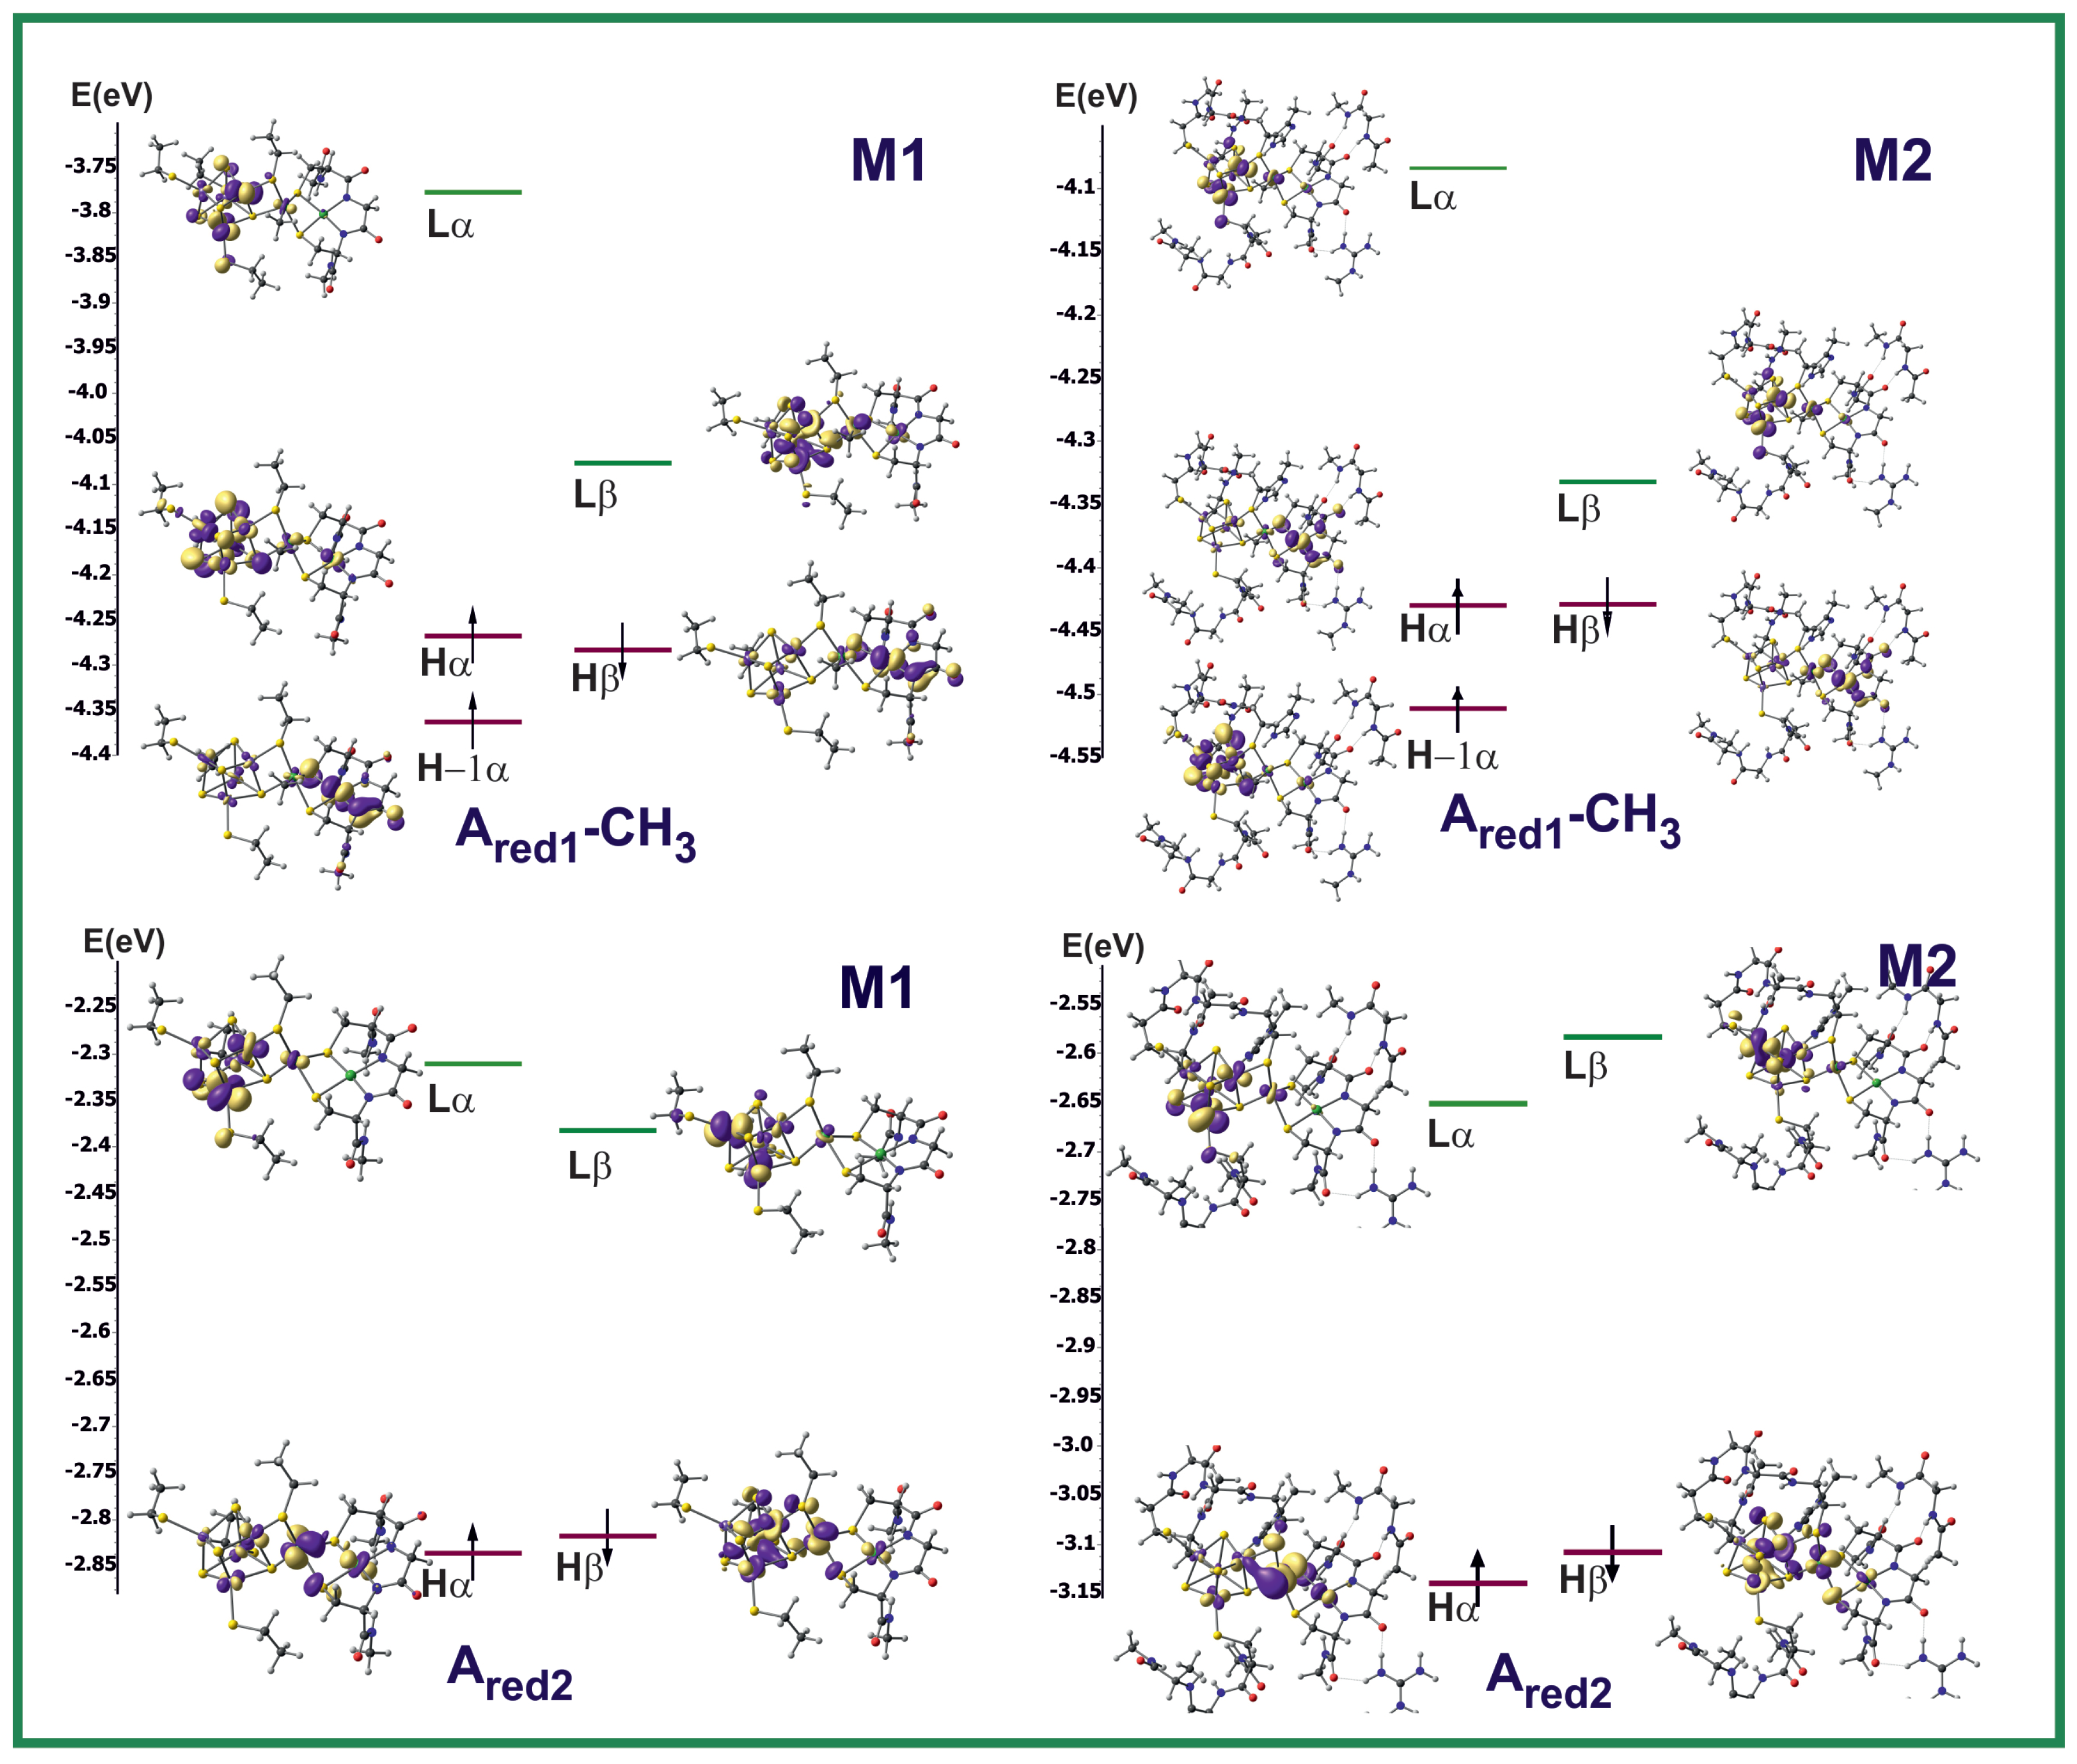
In Figure 6, the frontier molecular orbitals of A r e d 2 and A r e d 1 –CH 3 are depicted. The MOs form shows that they are similar for both models. The main difference is the reverse order of HOMO α and HOMO–1 α in A r e d 1 –CH 3 ; however this is not relevant considering the small energy difference between these orbitals of only about 0.1 eV.

3.3. Energetics of Methylation and Carbonylation Reaction

In Table 5, the energies for methylation and carbonylation reaction of one and two-electron reduced A-clusters are gathered for the M1 model. The reaction energy is calculated as:
Δ E = E ( P r o d u c t s ) E ( R e a g e n t s )
The upper part of Table 5 presents the reaction energies pertinent to the paramagnetic mechanism involving one-electron reduced A-cluster.
Inspection of Table 5 reveals that in the paramagnetic mechanism, methylation is weakly exoenergetic or weakly endoenergetic depending on the dielectric constant and whether it occurs first or after the carbonylation step. Moreover, for ε = 80 the methylation product is able to oxidize Co(I)corrin. The carbonylation step is highly exothermic in both cases. The possible oxidation of base-off cobalamin would be disadvantageous, since it is associated with the deactivation of the cobalamin enzyme, because in the next step it undergoes remethylation by tetrahydrofolate in the reduced form [25,30,107]. In the lower part of Table 5, the calculated energies for the mechanism involving the two-electron reduced A-cluster are gathered. In this case, methylation is exothermic and the carbonylation energy is similar to the paramgnetic mechanism.
Spin densities in Table 4 show that one electron reduced form with methyl and acetyl ligands does not have the electronic structure Fe 4 S 4 2 + Ni p 3 + but Fe 4 S 4 3 + Ni p 2 + , hence the electron is transferred from the cubane to Ni p as a result of an intramolecular redox reaction. The species with configurations Fe 4 S 4 3 + Ni p 2 + CH 3 (CO) and Fe 4 S 4 2 + Ni p 2 + CH 3 (CO) (reaction No. 3 and 8) are five-coordinate intermediate products which in the next step undergo izomerization to the acetyl derivative of the one or two-electron reduced A-cluster (Figure S2).
The paramagnetic and diamagnetic mechanisms both involve unstable species, Fe 4 S 4 2 + Ni p + (A r e d 1 ) and Fe 4 S 4 + Ni p + (A r e d 2 ), respectively. The former one is a radical and the latter one has a very low reduction potential as will be shown later, and would be difficult to obtain. It also would be prone to oxidation and would be unstable in biological environment. A r e d 1 was observed experimentally, it can be formed as the product of Fe 4 S 4 2 + Ni p + CO photolysis and it binds back CO very quickly [36]. The direct presence of Fe 4 S 4 + Ni p + in the catalytic reaction has not been proven.
Gencic and Grahame [79,108] proposed a mechanism with participation of the protonated two-electron reduced A-cluster. Based on the dependence of the reduction potentials on pH, they concluded that the mechanism includes two one-electron reduction steps coupled to protonation. On the basis of the same experimental data Bramlett et al. [44] suggested one step two-electron reduction mechanism.
In the following section, using as a basis the calculated reduction potentials and pK a of different forms of the A-cluster, we justify that the two-electron reduction coupled to protonation is a probable mechanism of the ACS enzyme action. The formation of a stable nickel protonated, doubly reduced A-cluster, followed by its methylation, is a mechanism that avoids the problems of the diamagnetic and paramagnetic mechanisms.

3.4. pK a

We calculated pK a values for different forms of the A-cluster according to Equation (5). At first, the M1 model was used and different protonation sites were considered and namely Ni p , S1, S4, and S2. The calculated values are shown in Table S1. The largest pK a values are found for Ni p atom in the two-electron reduced A-cluster. Taking this into account, later in the calculations for the large model, M2, pK a values were calculated only for the protonation on Ni p . pK a values were calculated for various forms and models of the A-cluster, without ligands and with ligands such as formate and hydroxyl anions. These ligands were present or suggested in the structures of the resting form of the A-cluster [34,95].
Water molecules which are present in the crystal structure or near the enzyme surface can influence properties such as pK a and redox potentials. To take this into account, we also performed calculations for the M2 model with one and four water molecules. M2 models with four water molecules are shown in Figure 7 and Figure 8. It can be noticed that water molecules gather around the Arg619 residue. This is caused by the positive charge of arginine which is protonated due to its high pK a (13.8) [109].
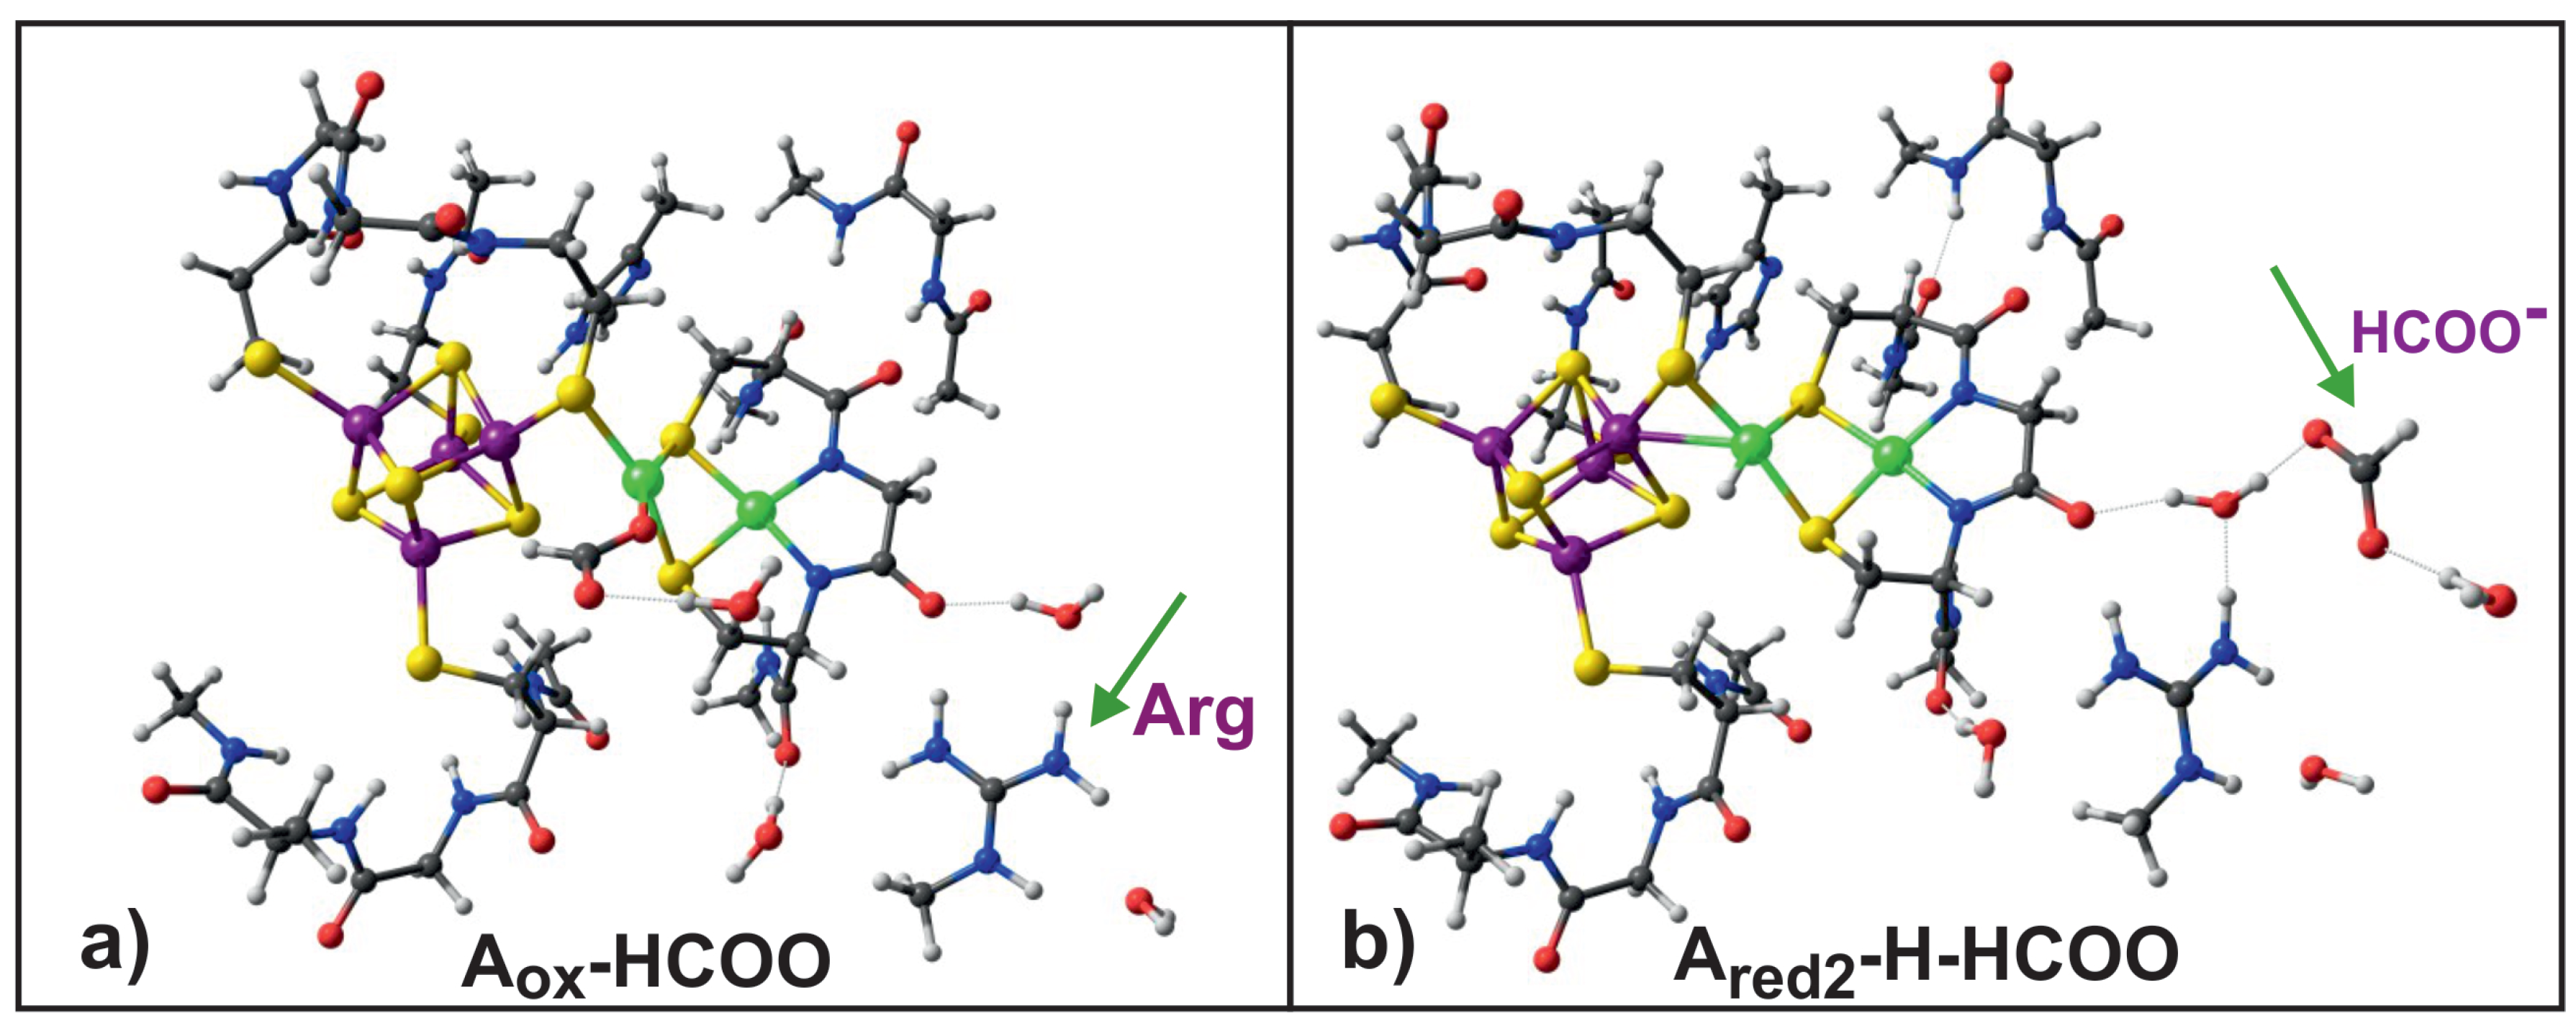
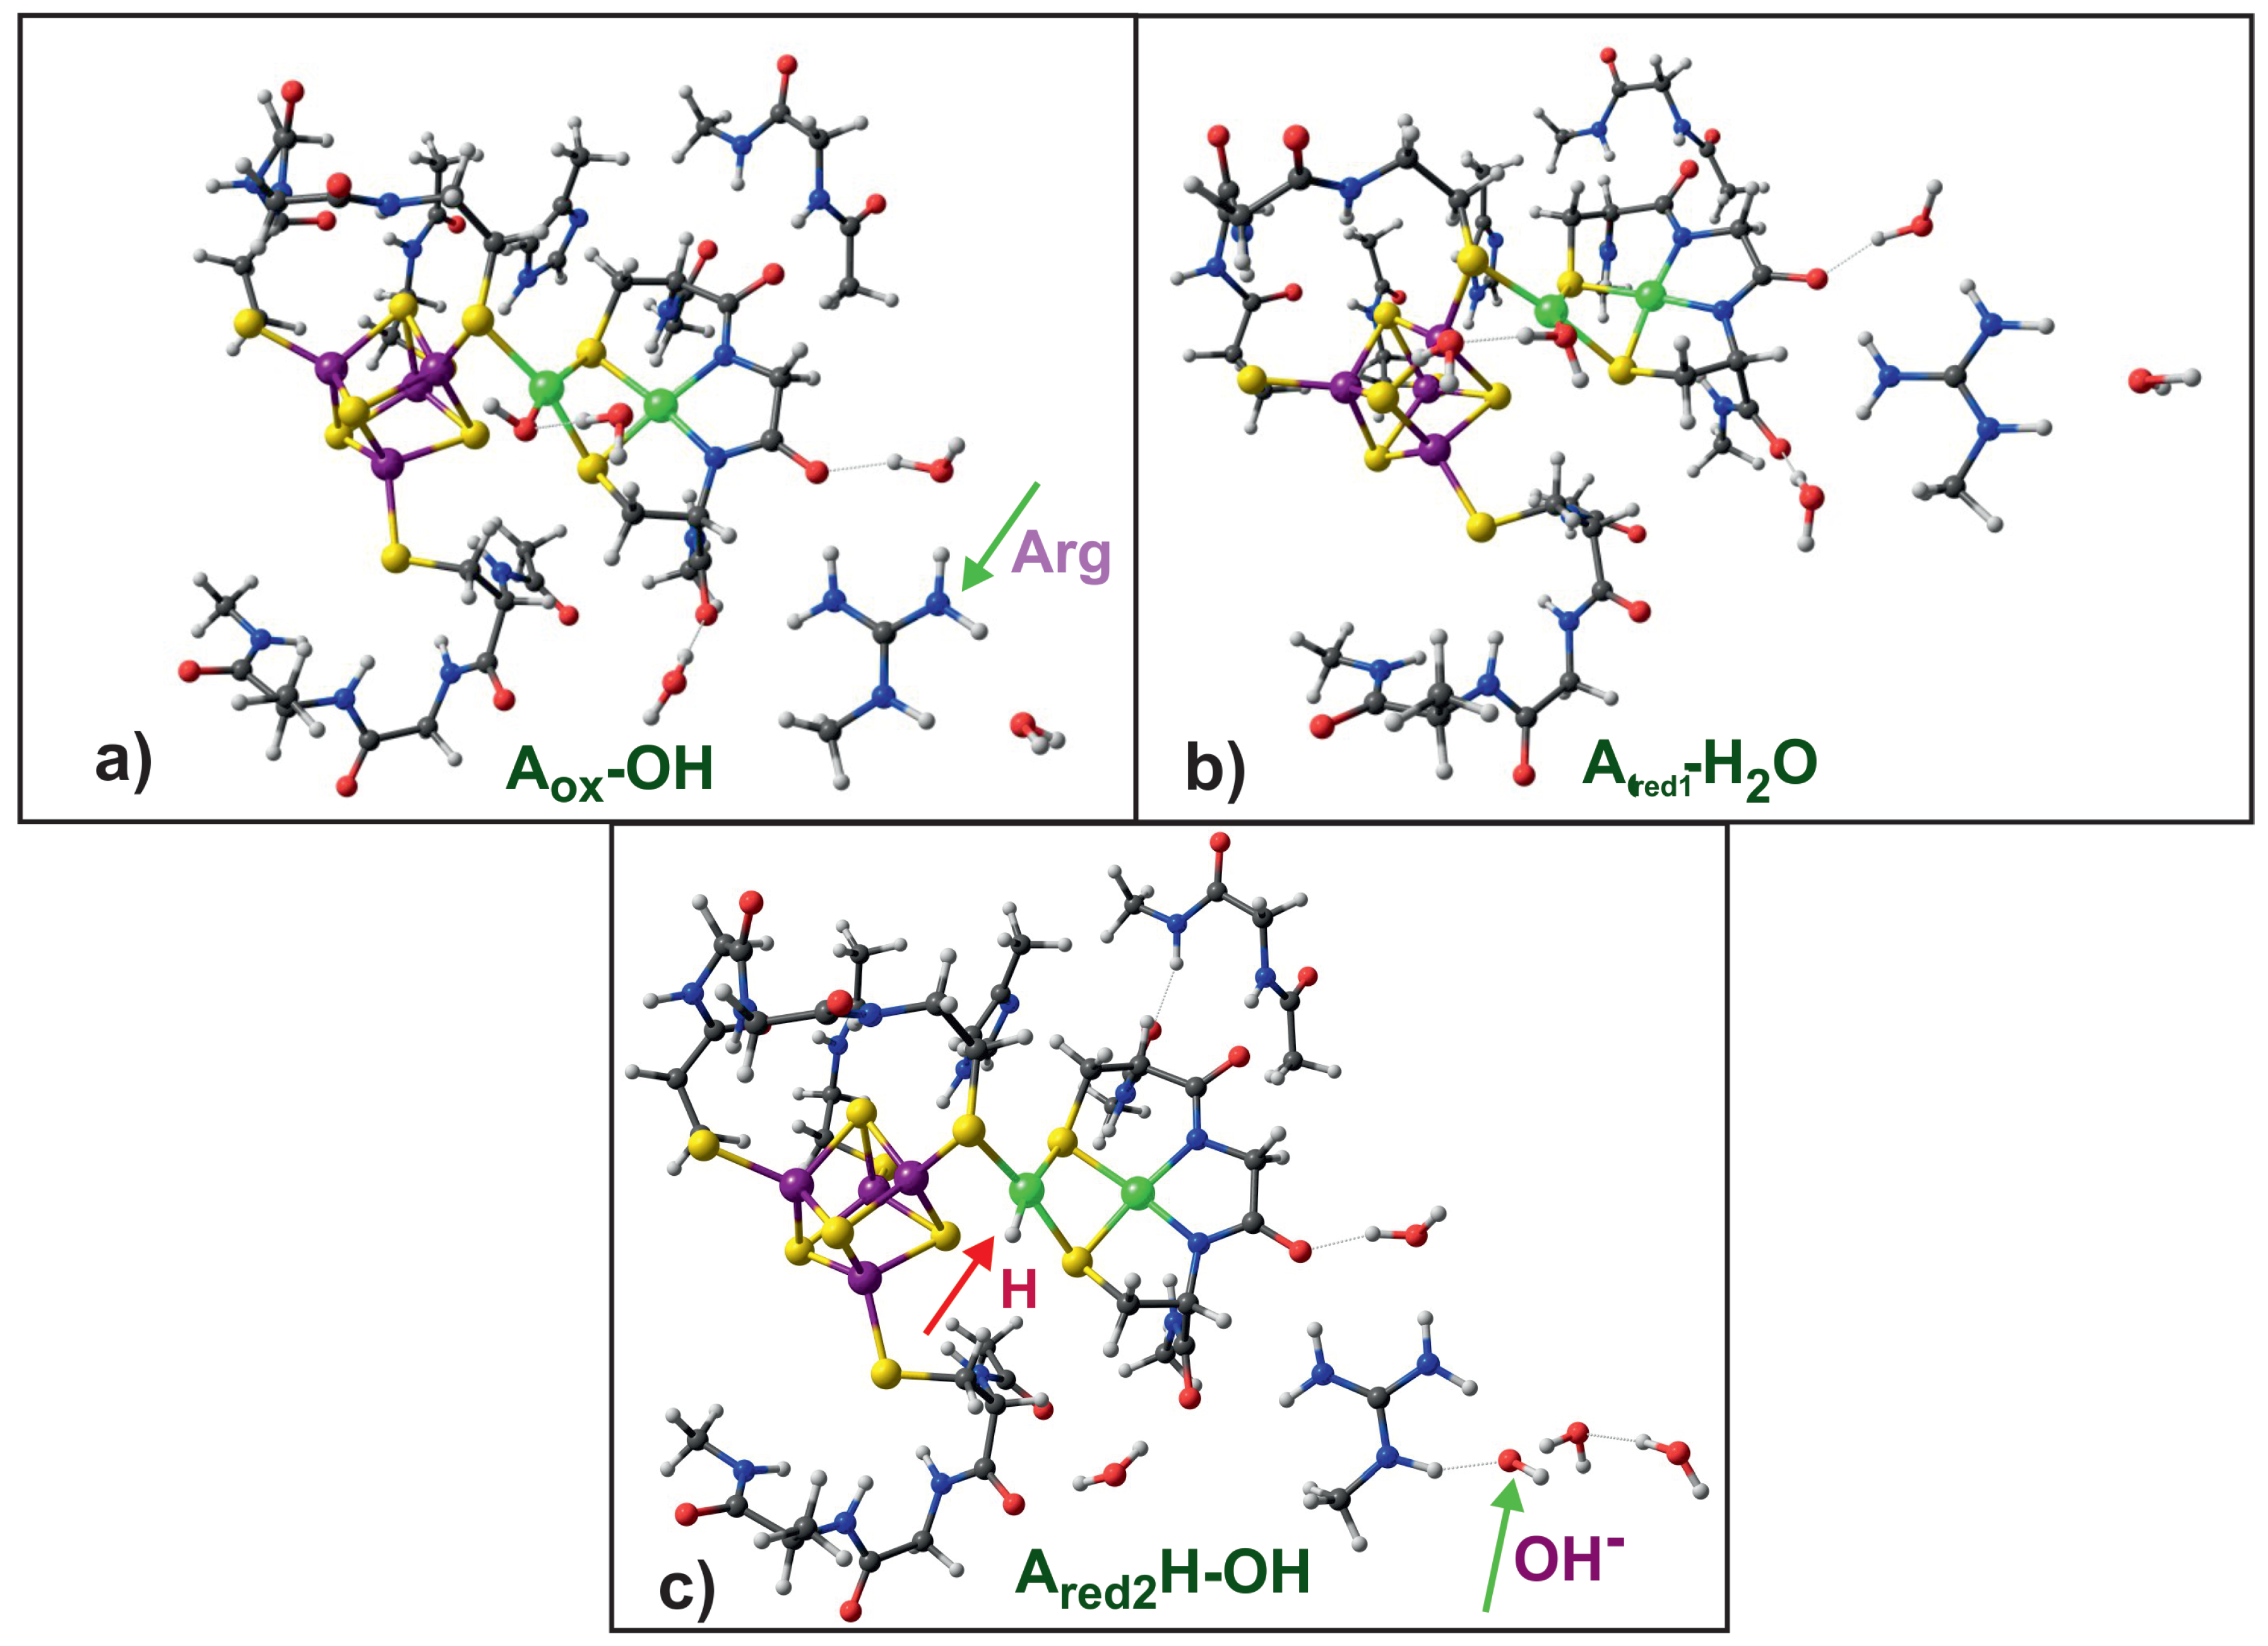
The calculated pK a values for the A-cluster are collected in Table 6. The pK a values were determined for dielectric constants equal to 20 and 80. Several possibilities for the protonation were considered, i.e., the A-cluster protonation without and with ligands such as formate, water and hydroxyl anion, as well as the protonation of the oxidized, one and two–electron reduced forms. Based on the data collected in Table S2, it can be concluded that the large model, M2, gives values several units lower than the model model. Furthermore, an increase in the dielectric constant leads to a decrease in the pK a value. The calculated pK a values for one-electron reduced form, A r e d 1 , are very small and even negative for the M2 model, which indicates that the unligated one-electron reduced form is not protonated in the neutral pH. The protonation on Ni p in A r e d 1 with ligands HCOO and H 2 O is also associated with small pK a . This shows that the one-electron reduced form is not protonated in the neutral pH. On the other hand the two-electron reduced form A r e d 2 has large pK a values, especially for the ligated forms. This is clearly visible for the models with water molecules, where the ligands OH and HCOO are stabilized after the protonation by interaction with an arginine residue (Figure 7 and Figure 8).
In Figure 7a, the oxidized form of the A-cluster with the formate ion attached to Ni p and four water molecules is depicted. Figure 7b shows two-electron reduced, protonated A-clusters. The formate ion is shifted toward the arginine and water molecules. Figure 8a presents the oxidized A-cluster complexed with the hydroxyl anion. In Figure 8b, the one-electron reduced A-cluster complexed with a water molecule is presented. In this case, protonation takes place on the hydroxyl anion producing a water molecule. Figure 8c depicts the two–electron reduced, protonated A-cluster. The protonation occurs on the Ni p ion and the hydroxyl ion is near arginine, bound to its hydrogen atoms by hydrogen bonds.
The data in Table 6 for protonation on the hydroxyl ligand in A o x and A r e d 1 shows that pK a values are relatively low for the oxidized form and high for one-electron reduced form. This is in accordance with the experimental findings that the oxidized form has a hydroxyl ligand and one-electron reduced a water one [56]. The pK a values for A r e d 2 with ligands are quite large and significantly lower for the dielectric constant 80. The determined pK a values point to the high proton affinity of the two-electron reduced A-cluster.

3.5. Reduction Potentials

In Table 7, the calculated redox potentials for reduction of A o x and A r e d 1 forms are presented. As stated previously, two values of the dielectric constant were taken into account, i.e., 20 and 80. The data in Table 7 show that the addition of water molecules increases the A o x /A r e d 1 potential and lowers A r e d 1 /A r e d 2 . The unligated A o x has a reduction potential higher than −0.5 V; this potential becomes lower after adding formate or hydroxyl ligand. This means that the ligand on the Ni p atom prevents the reduction of the A-cluster in the resting state of the enzyme. However, the reduction potential for the oxidized form with water ligand is quite high which confirms that in this case a hydroxyl anion formate should occur in the enzyme. The reduction potential A r e d 1 /A r e d 2 is very low for the A-cluster with and without ligands, which implies that two-electron reduced form is unstable in the biological environment and that there is no reductant strong enough to obtain it.
The reduction potential for A r e d 1 -CH 3 /A r e d 2 -CH 3 is also shown in Table 7 and it amounts to −0.071 V. With such a high potential, A r e d 1 -CH 3 would undergo fast reduction hence it hardly could be formed as an intermediate in the enzymatic reaction.

3.6. pH-Dependent Reduction Potentials

It was found experimentally that the methylation reaction is pH-dependent. Therefore, the protonation of the A-cluster was suggested and the pH-dependent reduction potentials were determined [79,108]. We calculated the pH-dependent redox potentials, and they are gathered in Table 8 together with the experimental values. The two-electron reduction process was considered leading to Ni p protonation (Equation (6)). After reduction and protonation, the ligand present at Ni p is dissociated and in the case of the M2 model, moves toward arginine and water molecules forming hydrogen bonds. One-electron reduction is considered for protonation on the hydroxyl ligand. This is because the pK a values for the one-electron reduced A-cluster in the case of protonation on Ni p is very small (Table 6 and Table S2).
There is a good agreement of the calculated values with the experimental ones for the M2 model with four water molecules both for formate and hydroxyl ligand and ε = 80 , the difference is of 0.05–0.1 V. There is also a good agreement for one-electron reduction and protonation on the hydroxyl leading to water molecule. It is interesting that the differences in the values of the protonation-coupled reduction potentials are relatively small for ε = 20 and 80, around 0.05–0.08 V. However, the agreement for ε = 80 is better, confirming the need for calculating pK a and reduction potentials with large dielectric constant values. The differences in pK a (Table 6) and reduction potentials (Table 7) for dielectric constants 20 and 80 are significant, on the other hand the pH-dependent reduction potentials are close, which is the effect of error compensation for these two values.

4. Discussion

The energetics of the two-electron reducted A-cluster in the mechanistic steps of catalytical reaction is more favorable than the one-electron reducted one (Section 3.2). The problem in the former case is the very low reduction potential of the two-electron reduced A-cluster (Table 7), which makes it unstable in the biological environment. The A-cluster in the resting state is present in the oxidized form with the proximal nickel in Ni(II) oxidation state. Methyl group is transferred in the cationic form, hence additional electrons are needed to form Ni p -CH 3 bond. The methylation reaction needs reductive activation and on the other hand it is pH-dependent, which implies protonation [79,108].
On the basis of the calculated pK a , reduction potentials and pH-dependent reduction potentials, the reduction of the A-cluster coupled with proton transfer can be proposed. Several possible pathways of this process can be considered:
A o x OH p K a = 7.1 H + A o x H 2 O 0.482 V e A r e d 1 H 2 O 0.766 V e A r e d 2 H OH
A o x OH 0.490 V , pH = 7.2 H + , e A r e d 1 H 2 O 0.766 V e A r e d 2 H OH
A o x OH 0.580 V , pH = 7.2 H + , 2 e A r e d 2 H OH
Equation (8) shows a three step reaction, first protonation of the resting state A o x OH on the hydroxyl ligand with pK a 7.1 (Table 6), then reduction at potential −0.482 V (Table 7) and finally reduction to A r e d 2 H-OH system, with the proton on Ni p and OH near arginine, at potential −0.766 V (Table 7). Equation (9) puts the first two steps together in proton coupled electron transfer with −0.490 V at pH = 7.2 (Table 8) and again this is followed by reduction leading to A r e d 2 H-OH. The third possibility is two-electron reduction coupled with proton transfer at pH = 7.2 and potential −0.580 V with the same product formation. The first two mechanisms in Equations (8) and (9) can be eliminated because of a low potential needed in the reduction of A r e d 1 H 2 O (−0.766 V) which is below biologically available reduction potentials.
The most probable reaction is the one in Equation (10) involving two-electron reduction of the A-cluster coupled with protonation. The calculated reduction potential is lower than −0.5 eV, but it is underestimated in calculation compared to the experimental one (−0.490 V). In [79,108], two one-electron steps are proposed and on the other hand one two-electron step is suggested in [44]. Our calculations point to the two-electron mechanism, due to the low reduction potential of the second reduction step (Equations (8) and (9)).
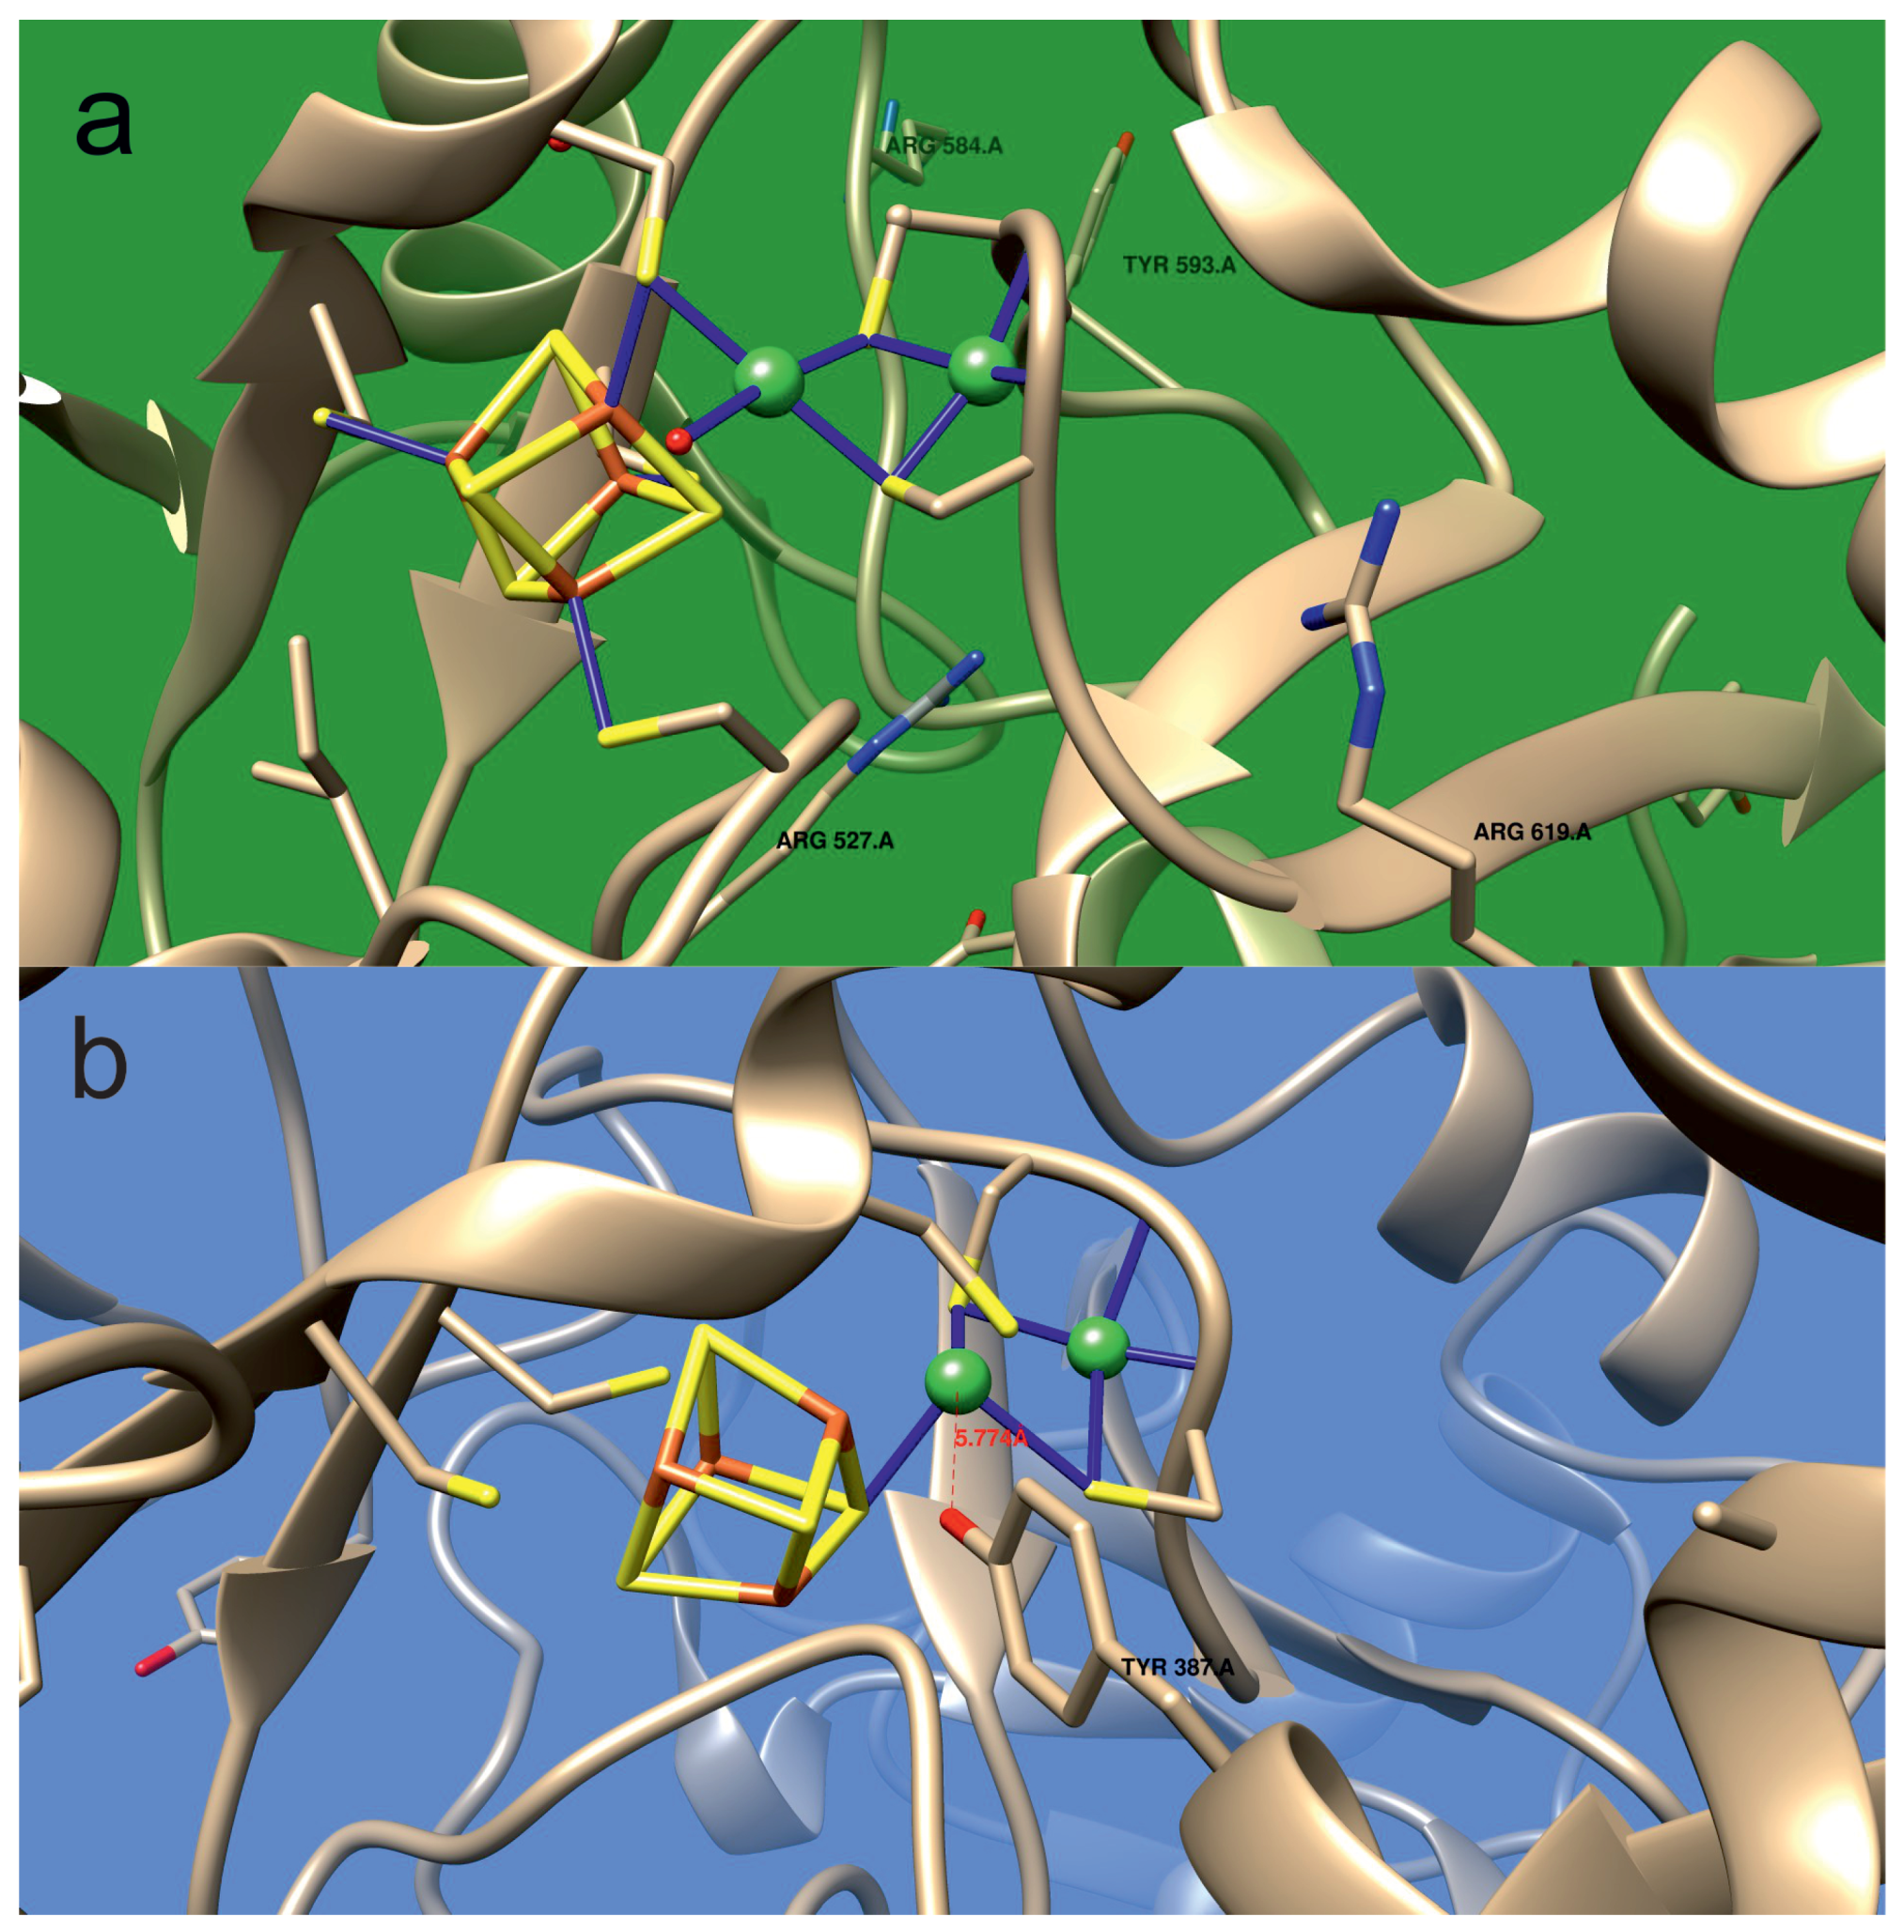
Figure 9 shows the proposed mechanism of action of the ACS enzyme. According to this mechanism, before the methylation the A-cluster undergoes the two-electron reduction with concomitant proton addition to Ni p . In the methylation step by methylcobalamin from CoFeSP, the proton is removed by the outer base. We suggest that the role of the base may be played by a tyrosine ion present in the vicinity of the A-cluster. The tyrosine residue is close to the A-cluster in the crystal structure PDB ID: 6YTT [46], shown in Figure 10b. In the next stage, the carbonylation of the methyl derivative takes place.
The important role is played by the arginine molecule close to the A-cluster which attracts negative ions such as OH and HCOO facilitating protonation of Ni p . The arginine residue from PDB: 1RU3 [95] is shown in Figure 10a. Its action is equivalent to lowering the local pH.
Ragsdale [74] invoked the Electrochemical—Chemical Coupling (EC) mechanism for substrate binding in enzymes. When a chemical reaction occurs with the reduced form of the redox couple the apparent midpoint potential is shifted to a more positive value. This explains why the A o x , which is difficult to reduce in the resting state, undergoes reduction in the presence of CO forming A r e d 1 –CO. The EC mechanism can also be applied to the case of Ni p protonation in the A-cluster, presented in this work. As it results from the calculations (Table 8), protonation shifts the reduction potential of the A-cluster toward more positive values, which enables the two-electron reduction leading to A r e d 2 –H.

5. Conclusions

  • Unligated or water ligated oxidized A-clusters have high reduction potential; the HCOO or OH ligands lower the reduction potential making A o x less susceptible for reduction.
  • Protonation takes place at Ni p .
  • Protonation stabilizes the two-electron reduced A-cluster.
  • The pH-dependent reduction potential for the large model with water molecules agrees with the experimental ones.
  • We propose a mechanism in which two-electron reduction of A o x –L is coupled to Ni p protonation and ligand loss. During methylation reaction Ni p is deprotonated by an external base. In the last step, CO binds to the methylated A-cluster and the acetyl group is formed. The role of the external base can be played by a tyrosine residue.
  • The arginine residue present in the vicinity of the A-cluster acts as negative ion sink, which facilitates protonation of the A-cluster.

Supplementary Materials

The following are available online at https://www.mdpi.com/article/10.3390/catal12020195/s1, Figure S1: (a) Base-on methylcobalamin, (b) Base-off methylcobalamin, Figure S2: (a) Five-coordinate intermediate of the methylation and carbonylation reactions of the A-cluster, Fe 4 S 4 Ni p (CH 3 )(CO) (b) Acetyl derivative of the A-cluster, Fe 4 S 4 Ni p -acetyl, Table S1: pK a values calculated for different protonation sites in one and two-electron reduced A-cluster (M1 model, dielectric constant ε = 20 ). Atom numbering from Figure 3, Table S2: pK a values calculated for the M1 and M2 models, Table S3. Reduction potential of the M1 M2 models vers and versus NHE (in V).

Author Contributions

Conceptualization, M.J; methodology, M.J and P.L.; validation, M.J. and P.L.; investigation, M.J.; writing—original draft preparation, M.J.; writing—review and editing, P.L.; visualization, M.J. and P.L.; supervision, M.J. All authors have read and agreed to the published version of the manuscript.

Funding

This research received no external funding.

Data Availability Statement

The data presented in this study are available on request from the corresponding author.

Acknowledgments

Calculations have been carried out in Wroclaw Centre for Networking and Supercomputing (http://www.wcss.pl accessed on 28 November 2021), grant No. 18.

Conflicts of Interest

The authors declare no conflict of interest.

Abbreviations

The following abbreviations are used in this manuscript:
ACSAcetyl coenzyme A synthase
CoFeSPCorrinoid Iron-Sulfur Protein
Acetyl-CoAacetyl coenzyme A

References

  1. Appel, A.; Bercaw, J.; Bocarsly, A.; Dobbek, H.; Dubois, D.; Dupuis, M.; Ferry, J.; Fujita, E.; Hille, R.; Kenis, P.; et al. Frontiers, opportunities, and challenges in biochemical and chemical catalysis of CO2 fixation. Chem. Rev. 2013, 113, 6621–6658. [Google Scholar] [CrossRef] [PubMed] [Green Version]
  2. Bender, G.; Pierce, E.; Hill, J.; Darty, J.; Ragsdale, S. Metal centers in the anaerobic microbial metabolism of CO and CO2. Metallomics 2011, 3, 797–815. [Google Scholar] [CrossRef] [PubMed] [Green Version]
  3. Ragsdale, S. Enzymology of the Wood-Ljungdahl pathway of acetogenesis. Ann. N. Y. Acad. Sci. 2008, 1125, 129–136. [Google Scholar] [CrossRef] [PubMed] [Green Version]
  4. Ragsdale, S. Nickel containing CO dehydrogenases and hydrogenases. Sub-Cell. Biochem. 2000, 35, 487–518. [Google Scholar] [CrossRef]
  5. Ragsdale, S.; Wood, H. Enzymology of the acetyl-coa pathway of CO2 fixation. Crit. Rev. Biochem. Mol. Biol. 1991, 26, 261–300. [Google Scholar] [CrossRef] [PubMed]
  6. Burton, R.; Can, M.; Esckilsen, D.; Wiley, S.; Ragsdale, S. Production and properties of enzymes that activate and produce carbon monoxide. Methods Enzymol. 2018, 613, 297–324. [Google Scholar] [CrossRef]
  7. Can, M.; Armstrong, F.; Ragsdale, S. Structure, function, and mechanism of the nickel metalloenzymes, CO dehydrogenase, and acetyl-CoA synthase. Chem. Rev. 2014, 114, 4149–4174. [Google Scholar] [CrossRef]
  8. Darnault, C.; Volbeda, A.; Kim, E.; Legrand, P.; Vernède, X.; Lindahl, P.; Fontecilla-Camps, J. Ni-Zn-Fe4-S4 and Ni-Ni-Fe4-S4 clusters in closed and open α subunits of acetyl-CoA synthase/carbon monoxide dehydrogenase. Nat. Struct. Biol. 2003, 10, 271–279. [Google Scholar] [CrossRef]
  9. Lindahl, P.; Graham, D. Acetyl-Coenzyme A Synthases and Nickel-Containing Carbon Monoxide Dehydrogenases; John Wiley & Sons: Chichester, UK, 2007; Volume 2, pp. 357–415. [Google Scholar] [CrossRef]
  10. Ragsdale, S. Life with carbon monoxide. Crit. Rev. Biochem. Mol. Biol. 2004, 39, 165–195. [Google Scholar] [CrossRef]
  11. Lindahl, P. The Ni-containing carbon monoxide dehydrogenase family: Light at the end of the tunnel? Biochemistry 2002, 41, 2097–2105. [Google Scholar] [CrossRef] [Green Version]
  12. Gencic, S.; Grahame, D. Nickel in subunit β of the acetyl-CoA decarbonylase/synthase multienzyme complex in methanogens: Catalytic properties and evidence for a binuclear Ni-Ni site. J. Biol. Chem. 2003, 278, 6101–6110. [Google Scholar] [CrossRef] [PubMed] [Green Version]
  13. Jeoung, J.H.; Fesseler, J.; Goetzl, S.; Dobbek, H. Carbon monoxide. Toxic gas and fuel for anaerobes and aerobes: Carbon monoxide dehydrogenases. Met. Ions Life Sci. 2014, 14-113, 37–69. [Google Scholar] [CrossRef]
  14. Ragsdale, S. Nickel and the carbon cycle. J. Inorg. Biochem. 2007, 101, 1657–1666. [Google Scholar] [CrossRef] [PubMed]
  15. Kung, Y.; Drennan, C. One-Carbon Chemistry of Nickel-Containing Carbon Monoxide Dehydrogenase and Acetyl-CoA Synthase. RSC Metall. 2017, 2017, 121–148. [Google Scholar] [CrossRef]
  16. Kumar, M.; Lu, W.P.; Liu, L.; Ragsdale, S. Kinetic Evidence that Carbon Monoxide Dehydrogenase Catalyzes the Oxidation of Carbon Monoxide and the Synthesis of Acetyl-CoA at Separate Metal Centers. J. Am. Chem. Soc. 1993, 115, 11646–11647. [Google Scholar] [CrossRef]
  17. Maynard, E.; Lindahl, P. Catalytic coupling of the active sites in acetyl-CoA synthase, a bifunctional CO-channeling enzyme. Biochemistry 2001, 40, 13262–13267. [Google Scholar] [CrossRef]
  18. Ragsdale, S.; Pierce, E. Acetogenesis and the Wood-Ljungdahl pathway of CO2 fixation. Biochim. Biophys. Acta Proteins Proteom. 2008, 1784, 1873–1898. [Google Scholar] [CrossRef] [Green Version]
  19. Ragsdale, S.; Riordan, C. The role of nickel in acetyl-CoA synthesis by the bifunctional enzyme CO dehydrogenase/acetyl-CoA synthase: Enzymology and model chemistry. J. Biol. Inorg. Chem. 1996, 1, 489–493. [Google Scholar] [CrossRef]
  20. Zhu, X.; Tan, X. Metalloproteins/metalloenzymes for the synthesis of acetyl-CoA in the Wood-Ljungdahl pathway. Sci. China Ser. B Chem. 2009, 52, 2071–2082. [Google Scholar] [CrossRef]
  21. Tan, X.; Volbeda, A.; Fontecilla-Camps, J.; Lindahl, P. Function of the tunnel in acetylcoenzyme A synthase/carbon monoxide dehydrogenase. J. Biol. Inorg. Chem. 2006, 11, 371–378. [Google Scholar] [CrossRef]
  22. Jeoung, J.H.; Martins, B.; Dobbek, H. X-ray crystallography of carbon monoxide dehydrogenases. Methods Mol. Biol. 2019, 1876, 167–178. [Google Scholar] [CrossRef] [PubMed]
  23. Harder, S.; Lu, W.P.; Feinberg, B.; Ragsdale, S. Spectroelectrochemical Studies of the Corrinoid/Iron-Sulfur Protein Involved in Acetyl Coenzyme A Synthesis by Clostridium thermoaceticum. Biochemistry 1989, 28, 9080–9087. [Google Scholar] [CrossRef] [PubMed]
  24. Wirt, M.; Chance, M.; Kumar, M.; Ragsdale, S. X-ray Absorption Spectroscopy of the Corrinoid/Iron-Sulfur Protein Involved in Acetyl Coenzyme A Synthesis by Clostridium thermoaceticum. J. Am. Chem. Soc. 1993, 115, 2146–2150. [Google Scholar] [CrossRef]
  25. Zhao, S.; Ragsdale, S. A conformational change in the methyltransferase from Clostridium thermoaceticum facilitates the methyl transfer from (6S)-methyltetrahydrofolate to the corrinoid/iron-sulfur protein in the acetyl-CoA pathway. Biochemistry 1996, 35, 2476–2481. [Google Scholar] [CrossRef]
  26. Svetlitchnaia, T.; Svetlitchnyi, V.; Meyer, O.; Dobbek, H. Structural insights into methyltransfer reactions of a corrinoid iron-sulfur protein involved in acetyl-CoA synthesis. Proc. Natl. Acad. Sci. USA 2006, 103, 14331–14336. [Google Scholar] [CrossRef] [Green Version]
  27. Goetzl, S.; Teutloff, C.; Werther, T.; Hennig, S.; Jeoung, J.H.; Bittl, R.; Dobbek, H. Protein Dynamics in the Reductive Activation of a B12-Containing Enzyme. Biochemistry 2017, 56, 5496–5502. [Google Scholar] [CrossRef] [Green Version]
  28. Meister, W.; Hennig, S.; Jeoung, J.H.; Lendzian, F.; Dobbek, H.; Hildebrandt, P. Complex formation with the activator RACo affects the corrinoid structure of CoFeSP. Biochemistry 2012, 51, 7040–7042. [Google Scholar] [CrossRef]
  29. Schrapers, P.; Mebs, S.; Goetzl, S.; Hennig, S.; Dau, H.; Dobbek, H.; Haumann, M. Axial ligation and redox changes at the cobalt ion in cobalamin bound to Corrinoid Iron-Sulfur Protein (CoFeSP) or in solution characterized by XAS and DFT. PLoS ONE 2016, 11, e0158681. [Google Scholar] [CrossRef]
  30. Matthews, R.; Banerjee, R.; Ragsdale, S. Cobamide-dependent methyl transferases. BioFactors 1990, 2, 147–152. [Google Scholar]
  31. Seravalli, J.; Brown, K.; Ragsdale, S. Acetyl coenzyme a synthesis from unnatural methylated corrinoids: Requirement for “base-off” coordination at cobalt [14]. J. Am. Chem. Soc. 2001, 123, 1786–1787. [Google Scholar] [CrossRef]
  32. Fan, C.; Gorst, C.; Ragsdale, S.; Hoffman, B. Characterization of the Ni-Fe-C Complex Formed by Reaction of Carbon Monoxide with the Carbon Monoxide Dehydrogenase from Clostridium thermoaceticum by Q-Band ENDOR. Biochemistry 1991, 30, 431–435. [Google Scholar] [CrossRef] [PubMed]
  33. Volbeda, A.; Darnault, C.; Tan, X.; Lindahl, P.; Fontecilla-Camps, J. Correction to novel domain arrangement in the crystal structure of a truncated acetyl-CoA synthase from Moorella thermoacetica. Biochemistry 2009, 48, 12058. [Google Scholar] [CrossRef] [Green Version]
  34. Volbeda, A.; Fontecilla-Camps, J. Crystallographic evidence for a CO/CO2 tunnel gating mechanism in the bifunctional carbon monoxide dehydrogenase/acetyl coenzyme A synthase from Moorella thermoacetica. J. Biol. Inorg. Chem. 2004, 9, 525–532. [Google Scholar] [CrossRef] [PubMed]
  35. Wang, P.H.; Bruschi, M.; De Gioia, L.; Blumberger, J. Uncovering a dynamically formed substrate access tunnel in carbon monoxide dehydrogenase/acetyl-CoA synthase. J. Am. Chem. Soc. 2013, 135, 9493–9502. [Google Scholar] [CrossRef]
  36. Cohen, S.; Can, M.; Wittenborn, E.; Hendrickson, R.; Ragsdale, S.; Drennan, C. Crystallographic Characterization of the Carbonylated A-Cluster in Carbon Monoxide Dehydrogenase/Acetyl-CoA Synthase. ACS Catal. 2020, 10, 9741–9746. [Google Scholar] [CrossRef]
  37. Can, M.; Giles, L.; Ragsdale, S.; Sarangi, R. X-ray Absorption Spectroscopy Reveals an Organometallic Ni-C Bond in the CO-Treated Form of Acetyl-CoA Synthase. Biochemistry 2017, 56, 1248–1260. [Google Scholar] [CrossRef] [Green Version]
  38. Grahame, D. Methods for analysis of acetyl-CoA synthase: Applications to bacterial and archaeal systems. Methods Enzymol. 2011, 494, 189–217. [Google Scholar] [CrossRef]
  39. Grahame, D. Acetate C-C bond formation and decomposition in the anaerobic world: The structure of a central enzyme and its key active-site metal cluster. Trends Biochem. Sci. 2003, 28, 221–224. [Google Scholar] [CrossRef]
  40. Gorst, C.; Ragsdale, S. Characterization of the NiFeCO complex of carbon monoxide dehydrogenase as a catalytically competent intermediate in the pathway of acetyl-coenzyme A synthesis. J. Biol. Chem. 1991, 266, 20687–20693. [Google Scholar] [CrossRef]
  41. Gencic, S.; Duin, E.; Grahame, D. Tight coupling of partial reactions in the Acetyl-CoA Decarbonylase/ Synthase (ACDS) multienzyme complex from Methanosarcina thermophila: Acetyl C-C bond fragmentation at the A cluster promoted by protein conformational changes. J. Biol. Chem. 2010, 285, 15450–15463. [Google Scholar] [CrossRef] [Green Version]
  42. Gencic, S.; Kelly, K.; Ghebreamlak, S.; Duin, E.; Grahame, D. Different modes of carbon monoxide binding to acetyl-CoA synthase and the role of a conserved phenylalanine in the coordination environment of nickel. Biochemistry 2013, 52, 1705–1716. [Google Scholar] [CrossRef] [PubMed]
  43. Bender, G.; Stich, T.; Yan, L.; Britt, R.; Cramer, S.; Ragsdale, S. Infrared and EPR spectroscopic characterization of a Ni(I) species formed by photolysis of a catalytically competent Ni(I)-CO intermediate in the acetyl-CoA synthase reaction. Biochemistry 2010, 49, 7516–7523. [Google Scholar] [CrossRef] [PubMed] [Green Version]
  44. Bramlett, M.; Stubna, A.; Tan, X.; Surovtsev, I.; Münck, E.; Lindahl, P. Mössbauer and EPR study of recombinant acetyl-CoA synthase from Moorella thermoacetica. Biochemistry 2006, 45, 8674–8685. [Google Scholar] [CrossRef] [PubMed]
  45. Bramlett, M.; Tan, X.; Lindahl, P. Inactivation of acetyl-CoA synthase/carbon monoxide dehydrogenase by copper. J. Am. Chem. Soc. 2003, 125, 9316–9317. [Google Scholar] [CrossRef] [PubMed]
  46. Lemaire, O.; Wagner, T. Gas channel rerouting in a primordial enzyme: Structural insights of the carbon-monoxide dehydrogenase/acetyl-CoA synthase complex from the acetogen Clostridium autoethanogenum. Biochim. Biophys. Acta Bioenerg. 2021, 1862. [Google Scholar] [CrossRef] [PubMed]
  47. Webster, C.; Darensbourg, M.; Lindahl, P.; Hall, M. Structures and Energetics of Models for the Active Site of Acetyl-Coenzyme A Synthase: Role of Distal and Proximal Metals in Catalysis. J. Am. Chem. Soc. 2004, 126, 3410–3411. [Google Scholar] [CrossRef]
  48. Amara, P.; Volbeda, A.; Fontecilla-Camps, J.; Field, M. A quantum chemical study of the reaction mechanism of acetyl-coenzyme A synthase. J. Am. Chem. Soc. 2005, 127, 2776–2784. [Google Scholar] [CrossRef]
  49. Chmielowska, A.; Lodowski, P.; Jaworska, M. Redox potentials and protonation of the A-cluster from acetyl-CoA synthase. A density functional theory study. J. Phys. Chem. A 2013, 117, 12484–12496. [Google Scholar] [CrossRef]
  50. Brunold, T. Spectroscopic and computational insights into the geometric and electronic properties of the A-cluster of acetyl-coenzyme A synthase. J. Biol. Inorg. Chem. 2004, 9, 533–541. [Google Scholar] [CrossRef]
  51. Elghobashi-Meinhardt, N.; Tombolelli, D.; Mroginski, M.A. QM/MM computations reveal details of the acetyl-CoA synthase catalytic center. Biochim. Biophys. Acta Gen. Subj. 2020, 1864, 129579. [Google Scholar] [CrossRef]
  52. Kisgeropoulos, E.; Manesis, A.; Shafaat, H. Ligand Field Inversion as a Mechanism to Gate Bioorganometallic Reactivity: Investigating a Biochemical Model of Acetyl CoA Synthase Using Spectroscopy and Computation. J. Am. Chem. Soc. 2021, 143, 849–867. [Google Scholar] [CrossRef] [PubMed]
  53. Mathrubootham, V.; Thomas, J.; Staples, R.; McCraken, J.; Shearer, J.; Hegg, E. Bisamidate and mixed amine/amidate NiN2S2 complexes as models for nickel-containing acetyl coenzyme A synthase and superoxide dismutase: An experimental and computational study. Inorg. Chem. 2010, 49, 5393–5406. [Google Scholar] [CrossRef] [PubMed] [Green Version]
  54. Chen, S.L.; Siegbahn, P. Insights into the Chemical Reactivity in Acetyl-CoA Synthase. Inorg. Chem. 2020, 59, 15167–15179. [Google Scholar] [CrossRef] [PubMed]
  55. Schenker, R.; Brunold, T. Computational Studies on the A Cluster of Acetyl-Coenzyme A Synthase: Geometric and Electronic Properties of the NiFeC Species and Mechanistic Implications. J. Am. Chem. Soc. 2003, 125, 13962–13963. [Google Scholar] [CrossRef]
  56. Schrapers, P.; Ilina, J.; Gregg, C.; Mebs, S.; Jeoung, J.H.; Dau, H.; Dobbek, H.; Haumann, M. Ligand binding at the A-cluster in full-length or truncated acetyl-CoA synthase studied by X-ray absorption spectroscopy. PLoS ONE 2017, 12, e0171039. [Google Scholar] [CrossRef]
  57. Cohen, S.; Brignole, E.; Wittenborn, E.; Can, M.; Thompson, S.; Ragsdale, S.; Drennan, C. Negative-Stain Electron Microscopy Reveals Dramatic Structural Rearrangements in Ni-Fe-S-Dependent Carbon Monoxide Dehydrogenase/Acetyl-CoA Synthase. Structure 2021, 29, 43–49. [Google Scholar] [CrossRef]
  58. Chen, J.; Huang, S.; Seravalli, J.; Gutzman, H., Jr.; Swartz, D.; Ragsdale, S.; Bagley, K. Infrared Studies of Carbon Monoxide Binding to Carbon Monoxide Dehydrogenase/Acetyl-CoA Synthase from Moorella thermoacetica. Biochemistry 2003, 42, 14822–14830. [Google Scholar] [CrossRef]
  59. Kumar, M.; Qiu, D.; Spiro, T.; Ragsdale, S. A methyl-nickel intermediate in a bimetallic mechanism of acetyl-coenzyme A synthesis by anaerobic bacteria. Science 1995, 270, 628–630. [Google Scholar] [CrossRef]
  60. Maynard, E.; Sewell, C.; Lindahl, P. Kinetic mechanism of acetyl-CoA synthase: Steady-state synthesis at variable CO/CO2 pressures. J. Am. Chem. Soc. 2001, 123, 4697–4703. [Google Scholar] [CrossRef]
  61. Tan, X.; Bramlett, M.; Lindahl, P. Effect of Zn on Acetyl Coenzyme A Synthase: Evidence for a Conformational Change in the α Subunit during Catalysis. J. Am. Chem. Soc. 2004, 126, 5954–5955. [Google Scholar] [CrossRef]
  62. Qiu, D.; Kumar, M.; Ragsdale, S.; Spiro, T. Raman and infrared spectroscopy of cyanide-inhibited CO dehydrogenase/acetyl-CoA synthase from Clostridium thermoaceticum: Evidence for bimetallic enzymatic CO oxidation. J. Am. Chem. Soc. 1996, 118, 10429–10435. [Google Scholar] [CrossRef]
  63. Russell, W.; Støalhandske, C.; Xia, J.; Scott, R.; Lindahl, P. Spectroscopic, redox, and structural characterization of the Ni-labile and nonlabile forms of the acetyl-CoA synthase active site of carbon monoxide dehydrogenase. J. Am. Chem. Soc. 1998, 120, 7502–7510. [Google Scholar] [CrossRef]
  64. Tan, X.; Sewell, C.; Yang, Q.; Lindahl, P. Reduction and methyl transfer kinetics of the α subunit from acetyl coenzyme A synthase. J. Am. Chem. Soc. 2003, 125, 318–319. [Google Scholar] [CrossRef] [PubMed] [Green Version]
  65. Tan, X.; Martinho, M.; Stubna, A.; Lindahl, P.; Münck, E. Mössbauer evidence for an exchange-coupled [Fe4S4]1+ Ni p 1+ A-cluster in isolated α subunits of acetyl-coenzyme A synthase/carbon monoxide dehydrogenase. J. Am. Chem. Soc. 2008, 130, 6712–6713. [Google Scholar] [CrossRef] [PubMed] [Green Version]
  66. Lindahl, P. Acetyl-coenzyme A synthase: The case for a Nip0-based mechanism of catalysis. J. Biol. Inorg. Chem. 2004, 9, 516–524. [Google Scholar] [CrossRef]
  67. Seravalli, J.; Kumar, M.; Ragsdale, S. Rapid kinetic studies of acetyl-CoA synthesis: Evidence supporting the catalytic intermediacy of a paramagnetic NiFeC species in the autotrophic Wood-Ljungdahl pathway. Biochemistry 2002, 41, 1807–1819. [Google Scholar] [CrossRef]
  68. George, S.; Seravalli, J.; Ragsdale, S. EPR and infrared spectroscopic evidence that a kinetically competent paramagnetic intermediate is formed when acetyl-coenzyme A synthase reacts with CO. J. Am. Chem. Soc. 2005, 127, 13500–13501. [Google Scholar] [CrossRef]
  69. Ragsdale, S.; Wood, H.; Antholine, W. Evidence that an iron-nickel-carbon complex is formed by reaction of CO with the CO dehydrogenase from Clostridium thermoaceticum. Proc. Natl. Acad. Sci. USA 1985, 82, 6811–6814. [Google Scholar] [CrossRef] [Green Version]
  70. Ragsdale, S.; Ljungdahl, L.; DerVartanian, D. 13C and 61Ni isotope substitutions confirm the presence of a nickel(III)-carbon species in acetogenic CO dehydrogenases. Biochem. Biophys. Res. Commun. 1983, 115, 658–665. [Google Scholar] [CrossRef]
  71. Lindahl, P.; Ragsdale, S.; Munck, E. Mossbauer study of CO dehydrogenase from Clostridium thermoaceticum. J. Biol. Chem. 1990, 265, 3880–3888. [Google Scholar] [CrossRef]
  72. Menon, S.; Ragsdale, S. Evidence that carbon monoxide is an obligatory intermediate in anaerobic acetyl-CoA synthesis. Biochemistry 1996, 35, 12119–12125. [Google Scholar] [CrossRef] [PubMed]
  73. Seravalli, J.; Ragsdale, S. Pulse-chase studies of the synthesis of acetyl-CoA by carbon monoxide dehydrogenase/acetyl-CoA synthase: Evidence for a random mechanism of methyl and carbonyl addition. J. Biol. Chem. 2008, 283, 8384–8394. [Google Scholar] [CrossRef] [PubMed] [Green Version]
  74. Ragsdale, S.W. 8.24—Biological Carbon Fixation by an Organometallic Pathway: Evidence Supporting the Paramagnetic Mechanism of the Nickel-Iron-Sulfur Acetyl-CoA Synthase. In Comprehensive Coordination Chemistry III; Constable, E.C., Parkin, G., Que, L., Jr., Eds.; Elsevier: Oxford, UK, 2021; pp. 611–633. [Google Scholar] [CrossRef]
  75. Barondeau, D.; Lindahl, P. Methylation of carbon monoxide dehydrogenase from Clostridium thermoaceticum and mechanism of acetyl coenzyme A synthesis. J. Am. Chem. Soc. 1997, 119, 3959–3970. [Google Scholar] [CrossRef]
  76. Fraser, D.; Lindahl, P. Evidence for a proposed intermediate redox state in the CO/CO2 active site of acetyl-CoA synthase (carbon monoxide dehydrogenase) from Clostridium thermoaceticum. Biochemistry 1999, 38, 15706–15711. [Google Scholar] [CrossRef]
  77. Fraser, D.; Lindahl, P. Stoichiometric CO reductive titrations of acetyl-CoA synthase (carbon monoxide dehydrogenase) from Clostridium thermoaceticum. Biochemistry 1999, 38, 15697–15705. [Google Scholar] [CrossRef]
  78. Lindahl, P. Metal-metal bonds in biology. J. Inorg. Biochem. 2012, 106, 172–178. [Google Scholar] [CrossRef] [Green Version]
  79. Gencic, S.; Grahame, D. Two separate one-electron steps in the reductive activation of the A cluster in subunit β of the ACDS complex in Methanosarcina thermophila. Biochemistry 2008, 47, 5544–5555. [Google Scholar] [CrossRef]
  80. Frisch, M.J.; Trucks, G.W.; Schlegel, H.B.; Scuseria, G.E.; Robb, M.A.; Cheeseman, J.R.; Scalmani, G.; Barone, V.; Petersson, G.A.; Nakatsuji, H.; et al. Gaussian˜16 Revision C.01; Gaussian Inc.: Wallingford, CT, USA, 2016. [Google Scholar]
  81. Noodleman, L.; Norman, J., Jr. The Xα valence bond theory of weak electronic coupling. Application to the low-lying states of Mo2 Cl 8 4 . J. Chem. Phys. 1979, 70, 4903–4906. [Google Scholar] [CrossRef]
  82. Noodleman, L. Valence bond description of antiferromagnetic coupling in transition metal dimers. J. Chem. Phys. 1981, 74, 5737–5743. [Google Scholar] [CrossRef]
  83. Becke, A. Density-functional exchange-energy approximation with correct asymptotic behavior. Phys. Rev. A 1988, 38, 3098–3100. [Google Scholar] [CrossRef]
  84. Perdew, J. Density-functional approximation for the correlation energy of the inhomogeneous electron gas. Phys. Rev. B 1986, 33, 8822–8824. [Google Scholar] [CrossRef] [PubMed]
  85. Schäfer, A.; Huber, C.; Ahlrichs, R. Fully optimized contracted Gaussian basis sets of triple zeta valence quality for atoms Li to Kr. J. Chem. Phys. 1994, 100, 5829–5835. [Google Scholar] [CrossRef]
  86. Jensen, K.; Ryde, U. Theoretical Prediction of the Co–C Bond Strength in Cobalamins. J. Phys. Chem. A 2003, 107, 7539–7545. [Google Scholar] [CrossRef]
  87. Kozlowski, P.; Kumar, M.; Piecuch, P.; Li, W.; Bauman, N.; Hansen, J.; Lodowski, P.; Jaworska, M. The cobalt-methyl bond dissociation in methylcobalamin: New benchmark analysis based on density functional theory and completely renormalized coupled-cluster calculations. J. Chem. Theory Comput. 2012, 8, 1870–1894. [Google Scholar] [CrossRef] [PubMed]
  88. Emelyanova, N.; Sanina, N.; Krivenko, A.; Manzhos, R.; Bozhenko, K.; Aldoshin, S. Comparison of pure and hybrid DFT functionals for geometry optimization and calculation of redox potentials for iron nitrosyl complexes with “μ–SCN” bridging ligands. Theor. Chem. Accounts 2013, 132, 1316. [Google Scholar] [CrossRef]
  89. Castro, L.; Bühl, M. Calculations of one-electron redox potentials of oxoiron(IV) porphyrin complexes. J. Chem. Theory Comput. 2014, 10, 243–251. [Google Scholar] [CrossRef] [Green Version]
  90. Tomasi, J.; Mennucci, B.; Cammi, R. Quantum mechanical continuum solvation models. Chem. Rev. 2005, 105, 2999–3093. [Google Scholar] [CrossRef]
  91. Fitch, C.; Karp, D.; Lee, K.; Stites, W.; Lattman, E.; Bertrand García-Moreno, E. Experimental pKa values of buried residues: Analysis with continuum methods and role of water penetration. Biophys. J. 2002, 82, 3289–3304. [Google Scholar] [CrossRef] [Green Version]
  92. Bashford, D.; Karplus, M. pKa’s of Ionizable Groups in Proteins: Atomic Detail from a Continuum Electrostatic Model. Biochemistry 1990, 29, 10219–10225. [Google Scholar] [CrossRef]
  93. Karp, D.; Gittis, A.; Stahley, M.; Fitch, C.; Stites, W.; García-Moreno E., B. High apparent dielectric constant inside a protein reflects structural reorganization coupled to the ionization of an internal Asp. Biophys. J. 2007, 92, 2041–2053. [Google Scholar] [CrossRef] [Green Version]
  94. Harms, M.; Schlessman, J.; Chimenti, M.; Sue, G.; Damjanović, A.; García-Moreno, E.B. A buried lysine that titrates with a normal pKa: Role of conformational flexibility at the protein-water interface as a determinant of pKa values. Protein Sci. 2008, 17, 833–845. [Google Scholar] [CrossRef] [PubMed] [Green Version]
  95. Svetlitchnyi, V.; Dobbek, H.; Meyer-Klaucke, W.; Meins, T.; Thiele, B.; Römer, P.; Huber, R.; Meyer, O. A functional Ni-Ni-[4Fe-4S] cluster in the monomeric acetyl-CoA synthase from Carboxydothermus hydrogenoformans. Proc. Natl. Acad. Sci. USA 2004, 101, 446–451. [Google Scholar] [CrossRef] [PubMed] [Green Version]
  96. Trasatti, S. Components of the absolute electrode potential. conceptions and misinterpretations. Mater. Chem. Phys. 1986, 15, 427–438. [Google Scholar] [CrossRef]
  97. Lewis, A.; Bumpus, J.; Truhlar, D.; Cramer, C. Molecular modeling of environmentally important processes: Reduction potentials. J. Chem. Educ. 2004, 81, 596–603, Erratum in J. Chem. Educ. 2007, 84, 934. [Google Scholar]
  98. Noodleman, L.; Han Du, W.G.; McRee, D.; Chen, Y.; Goh, T.; Götz, A. Coupled transport of electrons and protons in a bacterial cytochrome: C oxidase-DFT calculated properties compared to structures and spectroscopies. Phys. Chem. Chem. Phys. 2020, 22, 26652–26668. [Google Scholar] [CrossRef]
  99. Han, W.G.; Giammona, D.; Bashford, D.; Noodleman, L. Density functional theory analysis of structure, energetics, and spectroscopy for the Mn-Fe active site of chlamydia trachomatis ribonucleotide reductase in four oxidation states. Inorg. Chem. 2010, 49, 7266–7281. [Google Scholar] [CrossRef] [Green Version]
  100. Han, W.G.; Liu, T.; Lovell, T.; Noodleman, L. Active site structure of class I ribonucleotide reductase intermediate X: A density functional theory analysis of structure, energetics, and spectroscopy. J. Am. Chem. Soc. 2005, 127, 15778–15790. [Google Scholar] [CrossRef]
  101. Tissandier, M.; Cowen, K.; Feng, W.; Gundlach, E.; Cohen, M.; Earhart, A.; Coe, J.; Tuttle, T., Jr. The proton’s absolute aqueous enthalpy and Gibbs free energy of solvation from cluster-ion solvation data. J. Phys. Chem. A 1998, 102, 7787–7794. [Google Scholar] [CrossRef]
  102. Tawa, G.; Topol, I.; Burt, S.; Caldwell, R.; Rashin, A. Calculation of the aqueous solvation free energy of the proton. J. Chem. Phys. 1998, 109, 4852–4863. [Google Scholar] [CrossRef]
  103. Doukov, T.; Iverson, T.; Seravalli, J.; Ragsdale, S.; Drennan, C. A Ni-Fe-Cu center in a bifunctional carbon monoxide dehydrogenase/acetyl-CoA synthase. Science 2002, 298, 567–572. [Google Scholar] [CrossRef] [Green Version]
  104. Seravalli, J.; Gu, W.; Tam, A.; Strauss, E.; Begley, T.; Cramer, S.; Ragsdale, S. Functional copper at the acetyl-CoA synthase active site. Proc. Natl. Acad. Sci. USA 2003, 100, 3689–3694. [Google Scholar] [CrossRef] [PubMed] [Green Version]
  105. Seravalli, J.; Xiao, Y.; Gu, W.; Cramer, S.; Antholine, W.; Krymov, V.; Gerfen, G.; Ragsdale, S. Evidence that NiNi Acetyl-CoA Synthase Is Active and that the CuNi Enzyme Is Not. Biochemistry 2004, 43, 3944–3955. [Google Scholar] [CrossRef] [PubMed]
  106. James, C.; Wiley, S.; Ragsdale, S.; Hoffman, B. 13C Electron Nuclear Double Resonance Spectroscopy Shows Acetyl-CoA Synthase Binds Two Substrate CO in Multiple Binding Modes and Reveals the Importance of a CO-Binding “alcove”. J. Am. Chem. Soc. 2020, 142, 15362–15370. [Google Scholar] [CrossRef] [PubMed]
  107. Roberts, J.; Lu, W.P.; Ragsdale, S. Acetyl-coenzyme A synthesis from methyltetrahydrofolate, CO, and coenzyme A by enzymes purified from Clostridium thermoaceticum: Attainment of in vivo rates and identification of rate-limiting steps. J. Bacteriol. 1992, 174, 4667–4676. [Google Scholar] [CrossRef] [PubMed] [Green Version]
  108. Bhaskar, B.; DeMoll, E.; Grahame, D. Redox-dependent acetyl transfer partial reaction of the acetyl-coa decarbonylase/synthase complex: Kinetics and mechanism. Biochemistry 1998, 37, 14491–14499. [Google Scholar] [CrossRef]
  109. Fitch, C.; Platzer, G.; Okon, M.; Garcia-Moreno, B.; McIntosh, L. Arginine: Its pKa value revisited. Protein Sci. 2015, 24, 752–761. [Google Scholar] [CrossRef] [Green Version]
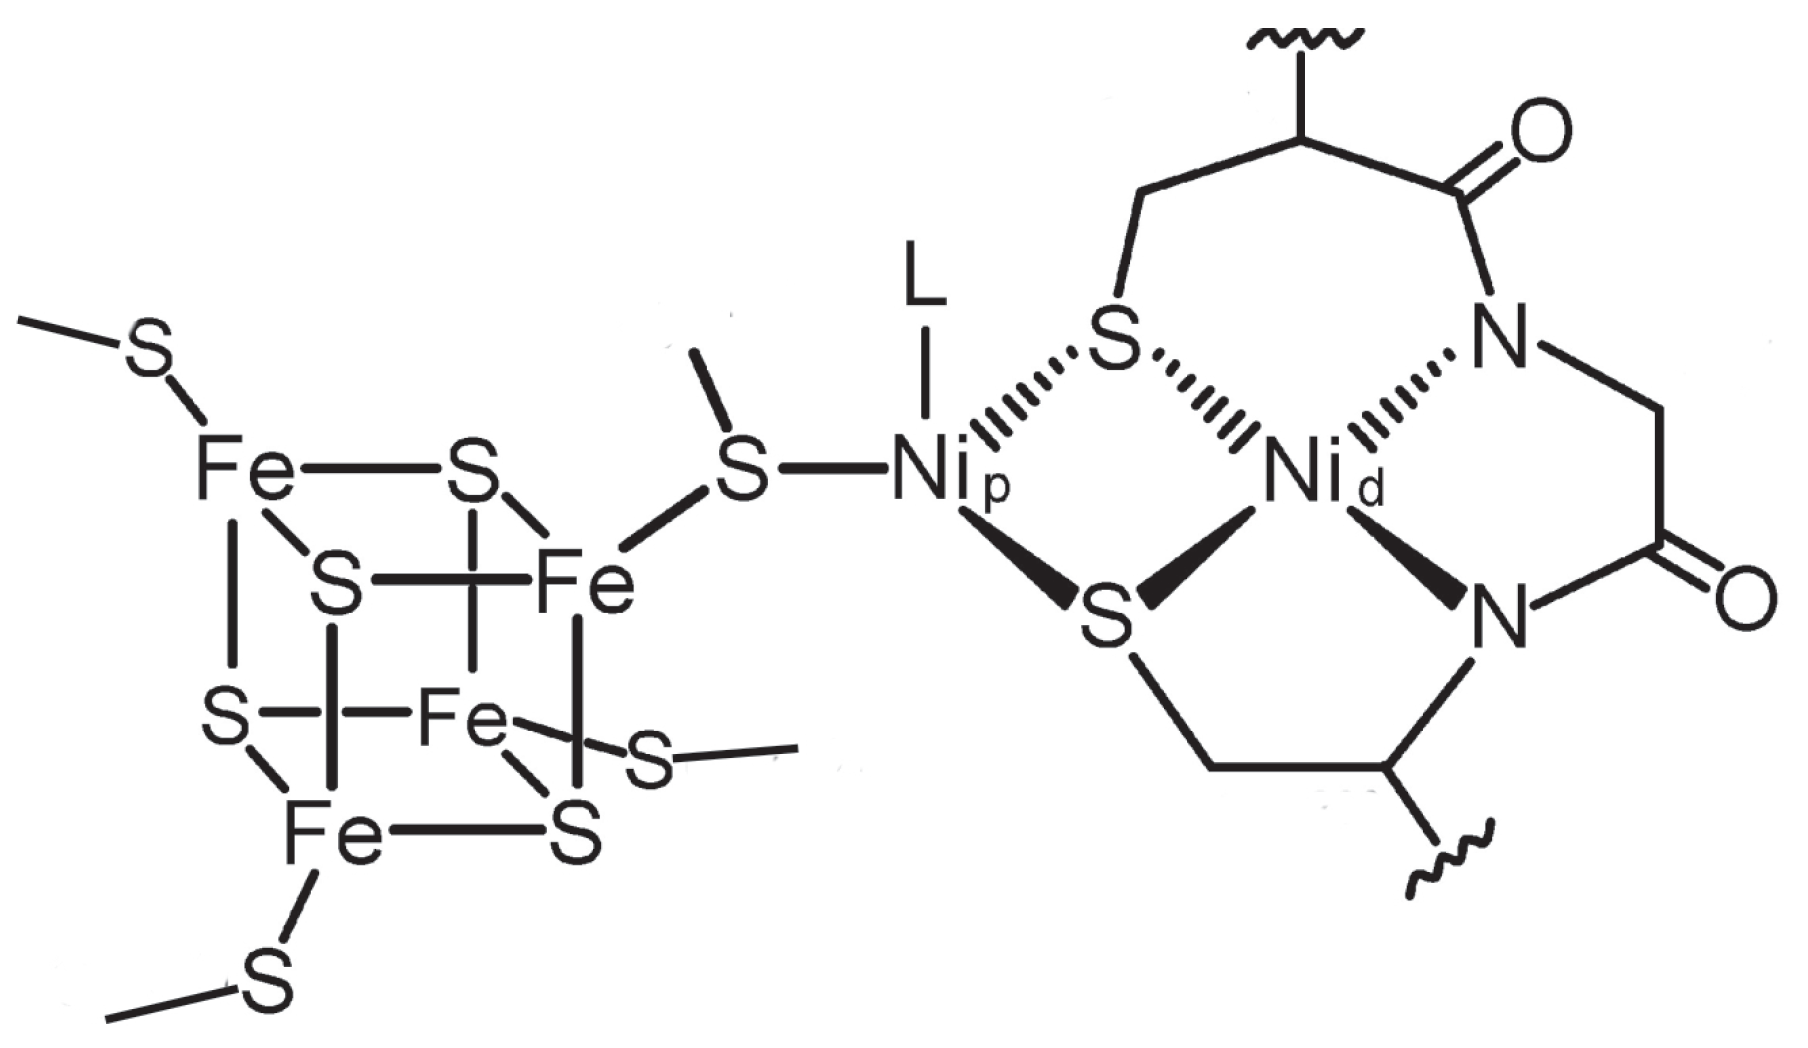
Figure 1. The A–cluster.
Catalysts 12 00195 g001
Figure 2. Proposed mechanisms of action of the ACS enzyme: (a) paramagnetic, (b) diamagnetic. The antiferromagnetic coupling in the two–electron reduced A–cluster is shown, and the one electron–reduced carbonyl–methyl derivative has Ni 2 + configuration.
Catalysts 12 00195 g002
Figure 3. M1 and M2 models of the A–cluster. The aminoacid residues from PDB:1RU3 crystal structure are shown. The atoms frozen in the optimization are marked with asterisks.
Catalysts 12 00195 g003
Figure 4. Models of base–off cobalamins. The side chains of the corrin ring are replaced by hydrogen atoms.
Catalysts 12 00195 g004
Figure 5. M1 and M2 models of the A–cluster with catalytically relevant liganads.
Catalysts 12 00195 g005
Figure 6. Frontier molecular orbitals of A r e d 1 –CH 3 and A r e d 2 for the M1 and M2 models. The lowest occupied molecular orbitals of A r e d 1 –CH 3 are localized mainly on Ni d and cubane, confirming Fe 4 S 4 3 + Ni p 2 + electronic structure. In A r e d 2 the antiferromagnetic coupling can be seen, where HOMO α is localized on Ni p and HOMO β on the cubane.
Catalysts 12 00195 g006
Figure 7. M2 model with formate ligand and four water molecules used in calculations pK a : (a) oxidized A-cluster with formate ligand, (b) two-electron reduced A-cluster with protonated Ni p and formate anion near arginine residue.
Catalysts 12 00195 g007
Figure 8. M2 model with the hydroxyl ligand and four water molecules used in calculations of pK a : (a) oxidized A-cluster with the hydroxyl anion at Ni p , (b) one-electron reduced A-cluster protonated at hydroxyl with H 2 O formation, (c) the two-electron reduced A-cluster protonated at Ni p and OH near the arginine residue.
Catalysts 12 00195 g008
Figure 9. Proposed mechanism of the ACS enzyme catalytic mechansim.
Catalysts 12 00195 g009
Figure 10. (a) Arginine residue Arg 619 located near the A-cluster in the crystal structure (PDB ID: 1RU3, [95]), (b) Tyrosine residue TYR 387 located near the A-cluster in ACS crystal structure (PDB ID: 6YTT, [46]).
Catalysts 12 00195 g010
Table 1. Forms of the A–cluster.
NameElectronic ConfigurationSpin StateDescriptionReferences
A o x [Fe 4 S 4 ] 2 + Ni p 2 + Ni d 2 + S = 0resting state, oxidized form[44]
stable at potential >−0.5 V
A r e d 1 [Fe 4 S 4 ] 2 + Ni p 1 + Ni d 2 + S = 1/2one–electron reduced[43]
A r e d 2 [Fe 4 S 4 ] 2 + Ni p 0 Ni d 2 + ( a ) S = 0two–electron reduced,[66]
postulated as catalytic intermediate
A r e d 2 –CH 3 [Fe 4 S 4 ] 2 + Ni p 2 + (CH 3 )Ni d 2 + S=0methylated form[44]
A r e d 1 –CO[Fe 4 S 4 ] 2 + Ni p 1 + (CO)Ni d 2 + S = 1/2one–electron reduced,
carbonylated form called NiFeC[32,37,44,67,68,69,70,71]
A o x –OH [Fe 4 S 4 ] 2 + Ni p 2 + (OH)Ni d 2 + S = 0 [56]
A r e d 1 –H 2 O[Fe 4 S 4 ] 1 + Ni p 2 + (H 2 O)Ni d 2 + S = 1/2 [56]
(a) Ared2 has a configuration [Fe4S4]1+ Ni p 1+ Ni d 2+ [48,49,50,55,65], where the cubane and Ni p are antiferromagnetically coupled with spins on the cubane and Ni p of opposite signs.
Table 2. Experimental structural data for the A–cluster with different ligands.
X–ray
PDB ID: 1RU3 [95]PDB ID: 1OAO [8]PDB ID: 6YTT [46]PDB ID: 6X5K [36]
Ni p –Ni d 2.9803.0412.8822.744
Ni p –Fe12.6802.6622.2433.879
Ni p –H 2 O2.7
Ni p –CO 1.630
CO–Ni p –S1 123.9
CO–Ni p –S5 124.3
CO–Ni p –S6 105.3
EXAFS [95]
Ni p –Ni d 2.892.97/2.96
Ni p –Fe12.712.80
Ni p –H 2 O2.32
EXAFS [56]
Ni o x –OH Ni r e d H 2 ONi r e d CONi r e d CH 3
Ni p –Ni d 2.92.92.97/2.96
Ni p –Fe12.72.72.80
Ni p –L2.02.11.71.95
Table 3. Selected geometry parameters in optimized geometries of different forms of the A–cluster. Bond distances in Å, angles in degrees.
ModelM1M2M1M2M1M2M1M2M1M2M1M2
Distance (Å)Ni p –Ni d Ni p –Fe1Ni p –LL–Ni p –S1L–Ni p –S5L–Ni p –S6
A o x 2.9642.9372.8332.880
A r e d 1 3.1213.0912.6002.583
A r e d 2 3.1323.1292.4902.510
A o x –OH2.9382.9072.9002.8921.8761.882 92.1 169.9 82.7
A o x –HCOO2.9572.9172.9872.9411.9491.941 90.6 170.2 85.2
A r e d 1 –H 2 O 2.959 2.788 2.209
A r e d 1 –CO2.5922.7004.0973.3821.7661.763 108.8 134.7 98.8
A r e d 1 –CH 3 2.8902.9922.7392.7381.9761.981 89.3 165.4 85.2
A r e d 2 –CH 3 3.0192.9702.8132.7581.9711.971 89.9 166.4 85.6
A r e d 2 –H 2.951 2.680 1.470 85.2 166.7 82.9
Table 4. Spin densities on the iron–sulfur cubane and Ni p atom in different forms of the A–cluster.
Spin Density
Ni p Fe 4 S 4 Ni d
M1M2M1M2M1M2
A o x −0.1030.124−0.1400.0020.090−0.111
A r e d 1 0.591−0.574−0.0400.0020.0620.054
A r e d 2 −0.578−0.4210.6800.435−0.004−0.002
A o x –OH−0.132−0.1380.004−0.002−0.0050.000
A o x –HCOO−0.1210.109−0.020−0.002−0.0060.005
A r e d 1 –H 2 O 0.575 0.030 0.081
A r e d 1 –CO0.5350.4780.0660.1040.2370.126
A r e d 1 –CH 3 0.063−0.1590.4500.8300.059−0.013
A r e d 2 –CH 3 −0.158−0.1780.0110.063−0.006−0.009
Table 5. Methylation and carbonylation reaction energy for the case of a one- and two–electron reduced A–cluster (in kcal/mol). The data for the M1 model.
No.ReagentsProducts Δ E(kcal)
ε = 80 ε = 20
One-elctron reduced
1Fe 4 S 4 2 + Ni p + COFe 4 S 4 2 + Ni p + CO −24.0−30.9
2Fe 4 S 4 2 + Ni p + CH 3 CoCorrin + Fe 4 S 4 3 + Ni p 2 + CH 3 CoCorrin 0 1.1−1.7
2a Fe 4 S 4 2 + Ni p 2 + CH 3 CoCorrin + 1.5−1.4
3Fe 4 S 4 2 + Ni p + COCH 3 CoCorrin + Fe 4 S 4 3 + Ni p 2 + CH 3 (CO)  ( a ) CoCorrin 0 8.511.5
3a Fe 4 S 4 2 + Ni p 2 + CH 3 (CO)CoCorrin + 5.412.1
4Fe 4 S 4 3 + Ni p 2 + CH 3 COFe 4 S 4 3 + Ni p 2 + CH 3 (CO) −17.5−17.7
5Fe 4 S 4 3 + Ni p 2 + CH 3 (CO) Fe 4 S 4 2 + Ni p 2 + acetyl −10.2−13.4
6Fe 4 S 4 2 + Ni p 2 + acetylCoCorrin 0 Fe 4 S 4 3 + Ni p 2 + acetylCoCorrin + −3.1−7.4
Two-electron reduced
7Fe 4 S 4 + Ni p + CH 3 CoCorrin + Fe 4 S 4 2 + Ni p 2 + CH 3 CoCorrin 0 −12.0−15.9
8Fe 4 S 4 2 + Ni p 2 + CH 3 COFe 4 S 4 2 + Ni p 2 + CH 3 CO −18.4−17.4
9Fe 4 S 4 2 + Ni p 2 + CH 3 (CO) Fe 4 S 4 2 + Ni p 2 + acetyl −9.7−20.4
(a) Five-coordinate complex with CH3 and CO bound to Ni p (Figure S2)
Table 6. Calculated pK a values for the M2 model with the dielectric constants equal to 20 and 80.
ε 2080
A r e d 1 −1.2−2.6
A r e d 2 15.612.6
M2–L  ( a )
A r e d 1 –HCOO(H 2 O)11.57.3
A r e d 1 –HCOO(4H 2 O)6.13.0
A r e d 1 –H 2 O(4H 2 O)0.62.2
A r e d 2 –HCOO18.811.9
A r e d 2 –HCOO(H 2 O)33.626.2
A r e d 2 –HCOO(4H 2 O)29.023.3
A r e d 2 –OH(4H 2 O)32.625.5
A r e d 2 –H 2 O(4H 2 O)16.016.8
M2–OH/M2–H 2 ( b )
A o x –OH9.17.2
A o x –OH(4H 2 O)8.97.1
A r e d 1 –OH(4H 2 O)17.514.0
(a) Protonation on Ni p . (b) Protonation on hydroxyl ligand.
Table 7. Calculated redox potentials vs. SHE for the M2 model of the A-cluster (in V).
ε 20802080
E 0 (A o x /A r e d 1 )(A r e d 1 /A r e d 2 )
−0.324−0.232−1.052−0.849
L=HCOO
M2–L−1.065−0.839−1.384−1.045
M2–L(H 2 O)−0.960−0.755−1.479−1.152
M2–L(4H 2 O)−0.894−0.701−1.532−1.231
L=OH
M2–L(4H 2 O)−1.104−0.892−1.669−1.351
L=H 2 O
M2–L(4H 2 O)−0.591−0.482−1.279  a (−0.879  b )−1.060  a (−0.766  b )
L=CH 3
M2–CH 3 −0.071
a Ared2-H2O product. Ared2H-OH product.
Table 8. pH–dependent reduction potentials for the A-cluster with and without ligands (in Volts). The same pH values were used as in the experimental data [79].
ε 2080
E 0 (A o x –L/A r e d 2 –NiH–L)Expt.
 [79,108][44]
M2-HCOO
pH = 6.5−0.861−0.782−0.463−0.479
pH = 7.2−0.881−0.803−0.490−0.495
pH = 7.9−0.902−0.824−0.547−0.524
M2-HCOO(H 2 O)
pH = 6.5−0.418−0.371
pH = 7.2−0.439−0.392
pH = 7.9−0.460−0.413
M2-HCOO(4H 2 O)
pH = 6.5−0.547−0.469
pH = 7.2−0.568−0.490
pH = 7.9−0.588−0.510
M2-OH(4H 2 O)
pH = 6.5−0.615−0.560
pH = 7.2−0.637−0.580
pH = 7.9−0.657−0.601
A o x OH/A r e d 1 H 2 O ( a )
pH = 6.5 −0.445
pH = 7.2 −0.490
pH = 7.9 −0.531
(a) M2 model.
Publisher’s Note: MDPI stays neutral with regard to jurisdictional claims in published maps and institutional affiliations.