Article

A Novel Electrochemical Sensing Platform for the Sensitive Detection and Degradation Monitoring of Methylene Blue

1
Department of Chemistry, Quaid-i-Azam University, Islamabad 45320, Pakistan
2
National Centre of Excellence in Physical Chemistry, University of Peshawar, Peshawar 25120, Pakistan
3
Department of Chemistry, College of Science, United Arab Emirates University, Al Ain P.O. Box 15551, United Arab Emirates
4
Institute of Chemical Sciences, Bahauddin Zakaryia University, Multan 6100, Pakistan
*
Authors to whom correspondence should be addressed.
Catalysts 2022, 12(3), 306; https://doi.org/10.3390/catal12030306
Submission received: 26 January 2022 / Revised: 4 March 2022 / Accepted: 4 March 2022 / Published: 8 March 2022
(This article belongs to the Section Electrocatalysis)

Abstract

:
Methylene blue is a toxic dye that is extensively used as a colorant in textile industries. Industrial effluent containing methylene blue, when drained into water bodies without proper treatment, poses a serious threat to aquatic and human lives. In order to protect the biocycle, various methods have been established to detect and remove hazardous dyes from aqueous systems. Electrochemical methods are preferred, owing to their characteristic features of simplicity, portability, potential selectivity, cost effectiveness, and rapid responsiveness. Based on these considerations, an electrochemical sensor consisting of amino-group-functionalized, multi-walled carbon nanotubes (NH2-fMWCNTs) immobilized on a glassy carbon electrode (GCE) was developed for the sensitive detection of methylene blue in aqueous solutions. The performance of the designed sensor was analyzed by electrochemical impedance spectroscopy, cyclic voltammetry, and square wave voltammetry. The developed sensing tool demonstrated promising features of sensitivity, selectivity, stability, fast responsiveness, and the ability to work with a very small volume of the analyte, i.e., in microliters, for analysis. Amino groups rich in electrons provide a negative charge to multi-walled carbon nanotubes, which significantly enhances the electrocatalytic activity of NH2-fMWCNTs for cationic dyes such as methylene blue. Using the designed sensing platform, a linear calibration plot with a limit of detection of 0.21 nM was obtained for methylene blue under optimized conditions. The designed sensor was also employed to monitor the extent and kinetics of the degradation of methylene blue. Titania nanoparticles were used for photocatalytic degradation, and the kinetics of degradation was monitored by both UV-Visible spectroscopic and electrochemical methods. The results revealed more than 95% removal of methylene blue in a time span of just 30 min.

1. Introduction

Booming industrialization is fulfilling the demands of the growing population and sustaining a decent standard of living. However, the industrial revolution is also linked to environmental issues. The wastewater of textile, paint, and pigment industries is loaded with toxic dyes [1]. The presence of dyes changes the color, taste, smell, pH, and density of water. Their colors make the water too opaque for the penetration of light and reduce dissolved oxygen, which has a damaging impact on aquatic life. More than 7 × 10⁵ metric tons of annual dye production is required to fulfill the demands of the industry. About 15% of these dyes are drained into water bodies, which contaminates the natural water [2]. The current global colorant market is 32 billion US dollars and is expected to increase by more than 42 billion US dollars by 2022 [3]. The biological oxygen demand of water increases gradually due to the entrance of more dyestuffs into water bodies [4]. Methylene Blue (MB) is one of the toxic dyes that are extensively drained into water bodies from food and textile industries without appropriate treatment [5,6].
MB belongs to the basic class of dyes, which has a characteristic dark green appearance with a bronze luster. It shows a deep blue color in alcoholic and aqueous media [7]. It is inodorous and stable in the air [8,9]. In medical practices, MB is used for staining and as a marker for visualizing blood vessels [10,11]. It is also used as an antidote for cyanide poisoning [12]. MB was first proposed for the detection of sentinel nodes in various malignancies, including breast cancer [13]. The broad use of MB in medical fields is, however, not free from adverse health effects as it has been reported to cause vomiting, headaches, dizziness, hypertension, mental confusion, professed sweating, abdominal pain, nausea, and precordial pain [14,15,16,17]. The detection and removal of dyes from wastewater are significantly important for ensuring the safe discharge of treated liquid effluents. In this regard, a number of methods, such as spectrophotometry, chromatography, and fluorimetry, are used for monitoring dyes in water samples [18,19,20]. However, electrochemical techniques are preferred due to the ease of handling and high selectivity and sensitivity [21,22,23,24]. Electrodes are modified by suitable modifiers to impart sensitivity characteristics. Hence, the present work is focused on electrode modification for the sensitive detection of MB.
In sensor technology, carbon nanotubes (CNTs) have been found to be the most-promising nanoscale materials as these are endowed with appealing mechanical and electrical properties [25,26,27]. The presence of a strong covalent connection with sp2 hybridization between carbon atoms in graphene sheets provides extra high strength to CNTs [28,29]. The surfaces of CNTs are modified for creating unique intrinsic features. CNTs can be modified with a number of chemical functional groups, including carboxyl, hydroxyl, amine, and amino groups [30,31,32,33]. The introduction of functional groups makes CNTs appealing candidates for the preparation of high-performance sensors [34,35,36]. Amino groups provide nucleophilic properties to CNTs that activate the surface of CNTs for a variety of applications. Hence, functionalized multi-walled carbon nanotubes (MWCNTs) were used in the present work as the modifier of the electrode surface for detection and degradation monitoring studies of MB dye.
Photocatalysis is commonly applied for the degradation of toxic dyes. This technology relies on the creation of electron–hole pairs in a semiconductor material [37]. The generation of free radicals at the semiconductor surface leads to the breakdown of dye contaminants. Catalysis involves the interaction of the catalyst with the substrate and provides a new pathway with a lower-activation-energy barrier for the speedy formation of the product. In photocatalysis, the catalyst is activated by exposure to light. A photocatalyst on the absorption of band-gap-matching photons generates electron–hole pairs that trigger the free-radical-based degradation of water contaminants, such as dyes [38]. The intensity of light greatly affects the degradation rate of the dye if the photons of incident light possess energy equal to or greater than the band gap of photocatalysts. More-intense light produces more free radicals that enhance the dye degradation rate. The ability of semiconducting materials, employing UV, solar, or visible light to transform dyes into environmentally benign products, has sparked a great deal of interest in the photocatalytic degradation of dyes. With this consideration, we used a TiO2 photocatalyst for MB degradation. The photocatalytic degradation was monitored by the designed sensing platform made of a glassy carbon electrode modified with NH2-fMWCNTs. The degradation of dye was also monitored by UV-Visible spectroscopy. Moreover, the color variation of the dye solution and the final disappearance of color offered evidence of dye removal via the naked eye.

2. Experimental

2.1. Reagent and Materials

Analytical-grade chemicals were used in the present work. MB and TiO2 were purchased from Sinopharm Chemical Reagent (Shanghai, China). A 0.1 M phosphate buffer saline (PBS) was prepared from 0.1 M Na2HPO4 and 0.1 M NaH2PO4. HCl and NaOH solutions of 0.1 M each were used for the preparation of PBS solutions of different pH (3–9). The NH2-fMWCNTs (purity > 95%) were used for electrode modification.

2.2. Electrode Modification

Metrohm Autolab PGSTAT302N Switzerland was used for electrochemical studies. A three-electrode system was used, which comprised a bare GCE (0.07 cm2) and modified GCE as working electrodes, platinum wire as a counter electrode, and Ag/AgCl (3 M KCl) as a reference electrode. Before the commencement of the electrochemical experiment, the GCE was used for cleaning until the appearance of a shiny surface was achieved [39]. For cleaning purposes, an 0.05 μm alumina-water slurry was used to rub the GCE over a rubbing pad in a figure-8 pattern to remove all the unwanted particles to obtain a clean surface. GCE was then sonicated and rinsed with deionized water to remove any loosely bonded particles. Cyclic voltammetry (CV) was performed in a potential window of 0–1.4 V to obtain reproducible CVs for ensuing cleanliness of the GCE surface [40]. To obtain the modified surface of GCE, a 5 μL droplet of the modifier solution was drop-casted on the activated surface of the bare GCEs.

2.3. Experimental Procedure

Stock solutions of the desired analyte were prepared by using distilled water as a solvent. First, 5 μL of MWCNTs and NH2-fMWCNTs with a concentration of 0.89 mg/mL was drop-casted on two separate pre-cleaned GCEs and were allowed to dry in a vacuum oven at 50 °C. Then, 10 μL of the targeted analyte (MB) with a concentration of 10 μM was drop-casted onto each of the prepared sensors and dried to ensure the dye molecules were properly absorbed onto the surface of the designed sensors. The ability of the designed sensors (MWCNTs/GCE, NH2-fMWCNTs/GCE) to detect MB was examined using square wave voltammetry in phosphate buffer saline as the supporting electrolyte. The voltammograms were recorded by applying a potential window from the negative to positive direction allowing the dye molecules to oxidize. The designed sensors significantly enhanced the signal of MB as compared to bare GCE. The NH2-fMWCNTs were found to be a very promising electrode modifier for the detection of cationic dye MB as compared to MWCNTs. The reason may be the nitrogen-containing group (NH2) that lends a negative charge to the surface of MWCNTs to preconcentrate the positively charged MB molecules.

3. Results and Discussion

3.1. Electrochemical Characterization

Electrochemical Impedance Spectroscopy (EIS) was used to assess the charge transfer features of bare and modified GCEs. The frequency was varied from 1 to 14 kHz with an amplitude of 10 mV in a solution of 5 mM K3[Fe(CN)6] and 0.1 M KCl. Nyquist plots constructed from the EIS data obtained at bare and modified GCEs showed a semicircle in the high-frequency region and a linear portion in the low-frequency region. The resistance due to the charge transfer at the electrode/electrolyte interface is shown by the semicircular part, while the straight-line segment of the plot in the lower-frequency region corresponds to diffusion mass transfer as represented by Warburg impedance [41,42,43]. The lower diameter of the semicircle in the Nyquist plot for NH2-fMWCNTs/GCE as compared to MWCNTs/GCE and the bare GCE demonstrates faster charge transfer as evident from Figure 1A [44]. The Rct values obtained for MWCNTs/GCE (3070.5 Ω) and NH2-fMWCNTs/GCE (2.6 Ω) are lower than the bare glassy carbon electrode (5493.7 Ω). This may be attributed to an increase in surface area of the modified GCE with enhanced conductivity characteristics for rapid charge transport of the redox probe. Randle’s equivalent circuit (inset Figure 1A) was used to fit EIS data for the evaluation of parameters as listed in Table S1 where Rs denotes the solution resistance, Rct is the charge transfer resistance, and CPE is the constant phase element. The solution resistance (Rs) is offered to the migration of charges through the electrolyte solution, the constant phase element corresponds to the electrical double layer capacitance, Rct corresponds to the occurrence of charge transfer of the redox probe at the surface of the electrode, and the Warburg (W) impedance models represent the diffusional mass transport from the electrode surface to the bulk, and vice versa.
CV was performed to probe the current response of the analyte to the bare and modified GCEs. A 5 mM K3[Fe(CN)6] was used as a redox probe with a 0.1 M potassium chloride solution as a supporting electrolyte. In Figure 1B, the modified GCE shows an enhanced peak current of the redox probe as compared to bare GCE. The Randle–Sevcik equation (Ip = 2.6 × 10⁵ n3/2 D1/2 ν1/2 AC) was used to measure the active surface area of the modified and bare GCE. The calculated active surface areas, redox peak currents, and ΔEp of the modified and bare GCEs are listed in Table S2, which indicates that the designed sensor (NH2-fMWCNTs/GCE) provides more sites for [Fe(CN)6]−3/−4 than the signals obtained at MWCNTs/GCE and bare GCE, as witnessed by the enhanced peak current signal of K3[Fe(CN)6].

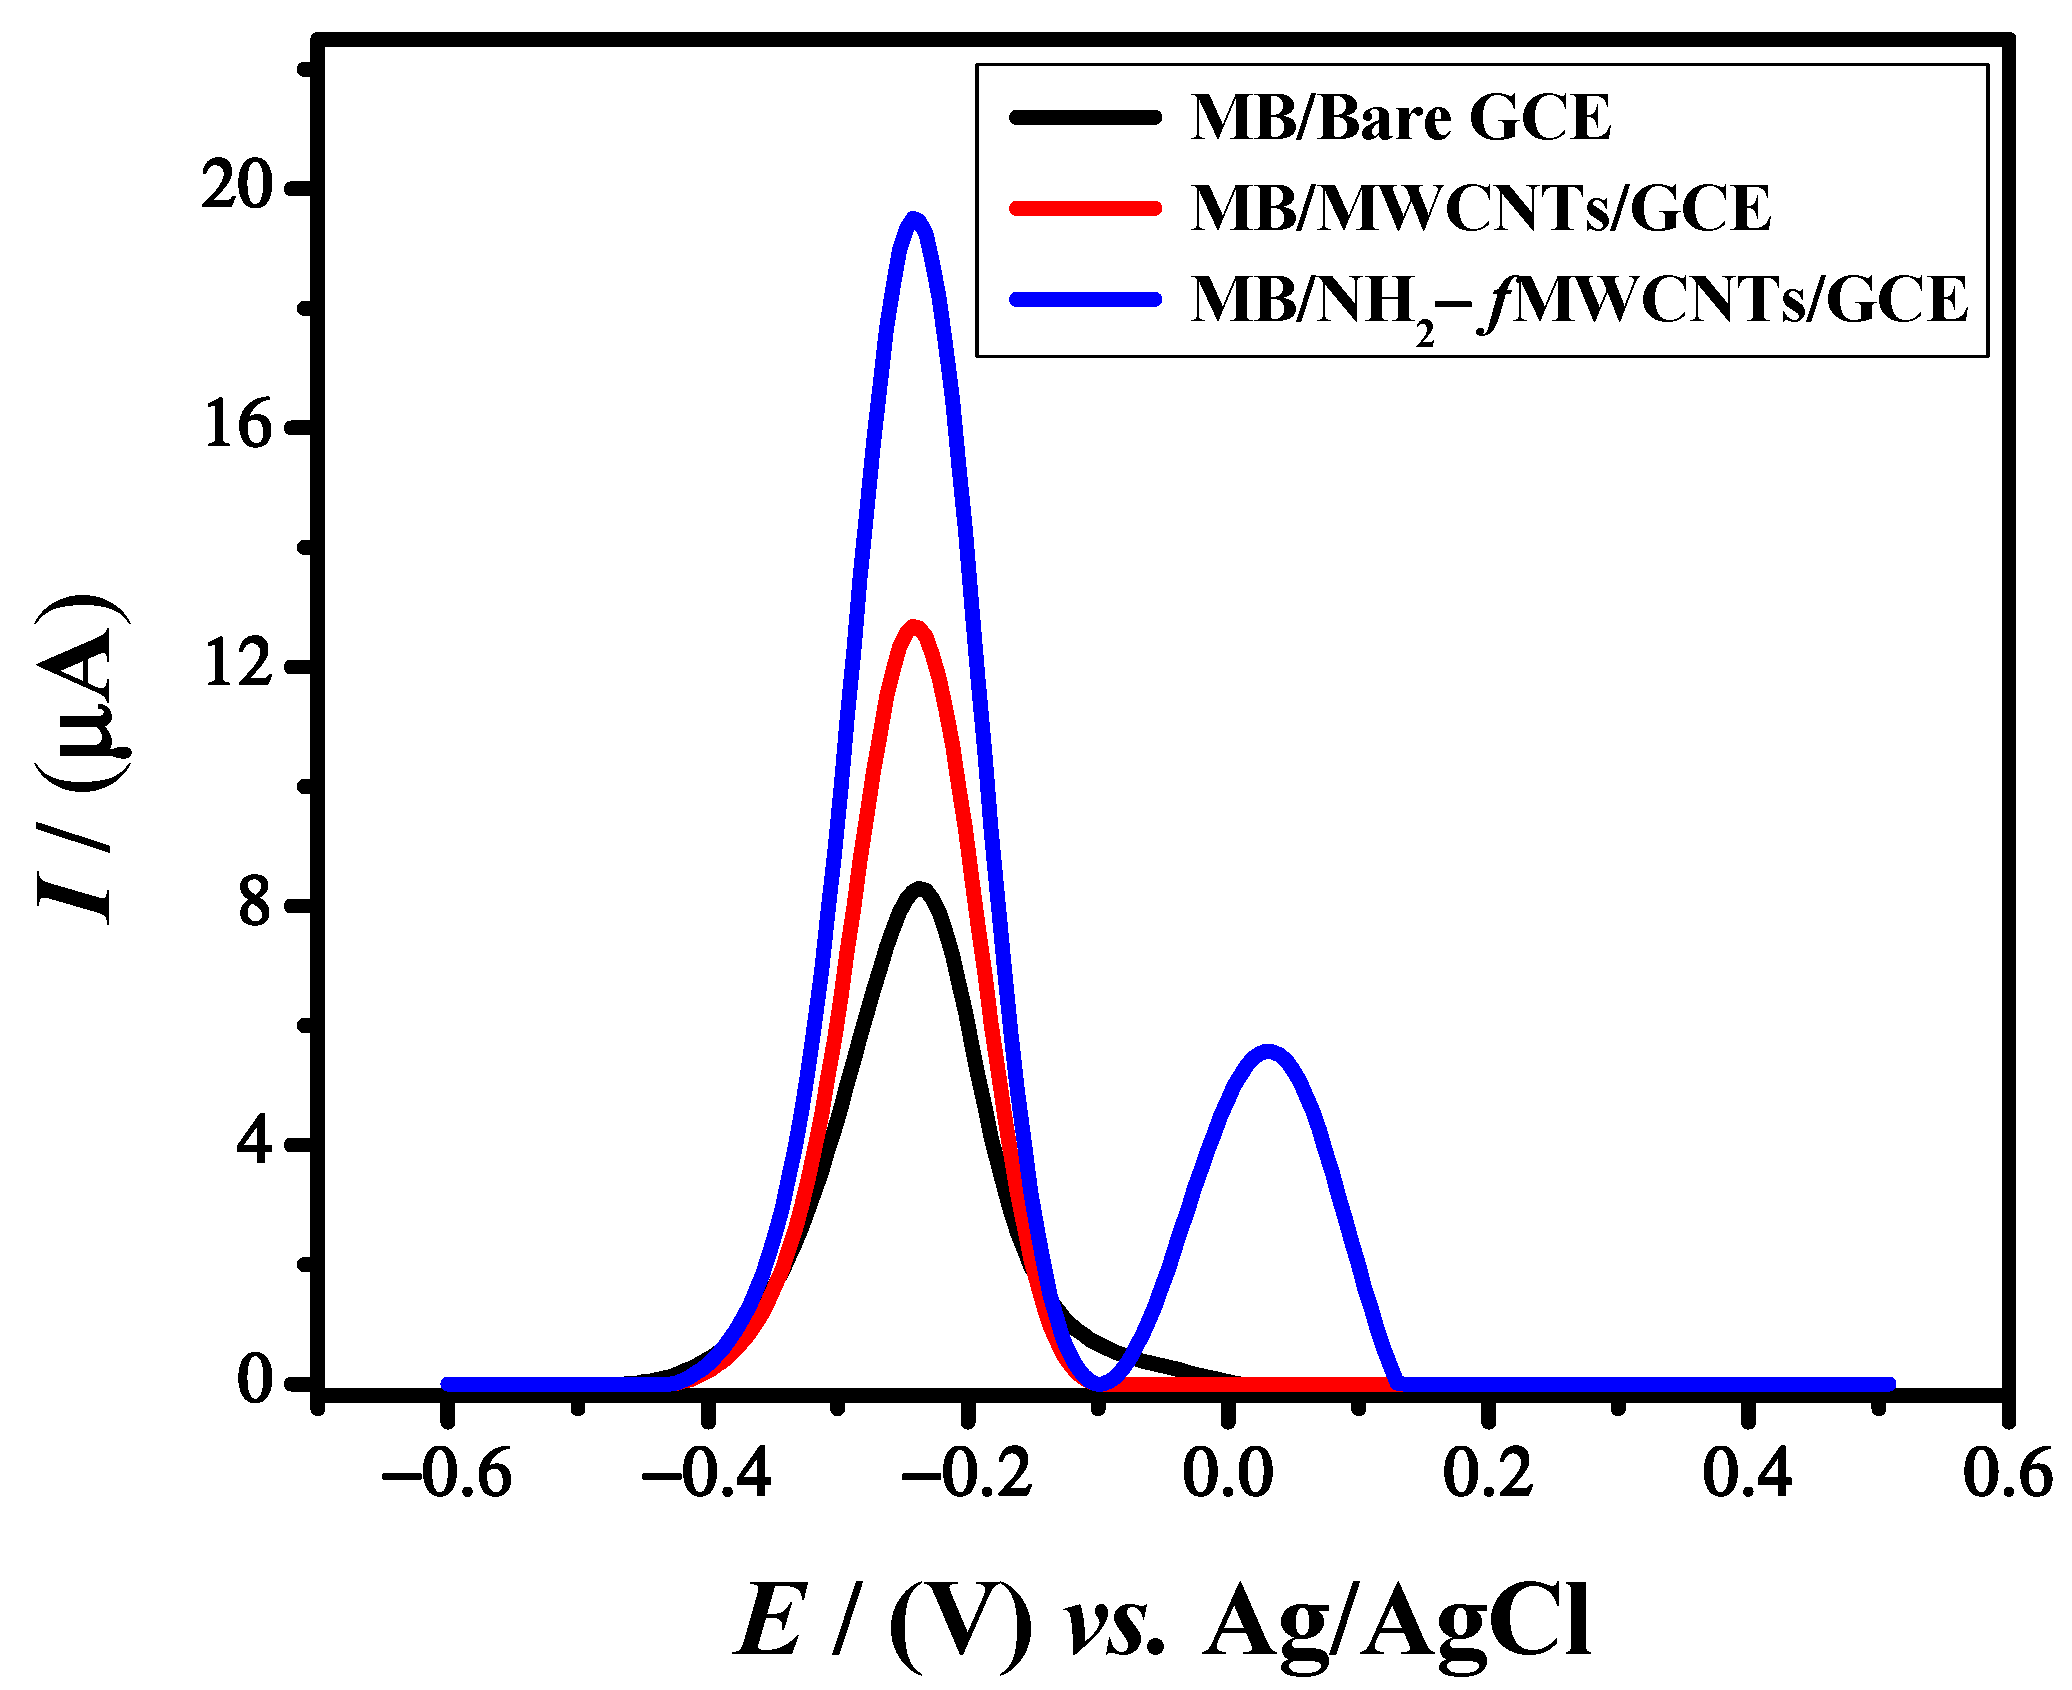
3.2. Voltammetric Analysis of the Targeted Analyte

Square wave voltammetry is a sensitive and rapid electroanalytical technique for analyzing the analyte signals with a high resolution. The voltammetric response of the MB dye at the bare and modified working electrodes was obtained in a 0.1 M PBS solution of pH 6 in a potential window of −0.6 V to 0.5 V at a scan rate of 125 mV/s. MB oxidized at −0.24 V with a maximum current response of 8.3 μA at bare GCE. The current response of MB jumped to 12.6 μA and 19.5 μA at MWCNTs/GCE and NH2-fMWCNTs/GCE, respectively, as shown in Figure 2. Thus, GCE modified with NH2-fMWCNTs is the best platform for MB detection. The amino group is introduced for enhancing the electrocatalytic activity of MWCNTs. However, due to the amino group, the modified electrode (NH2-fMWCNTs/GCE), when tested in a blank solution, gives an oxidation peak at 0.03 V. Every material has its own electrochemical oxidation potential [45]. It is interesting to note that the signal does not overlap with the response of MB. Hence, NH2-fMWCNTs/GCE allows the sensitive detection of MB.

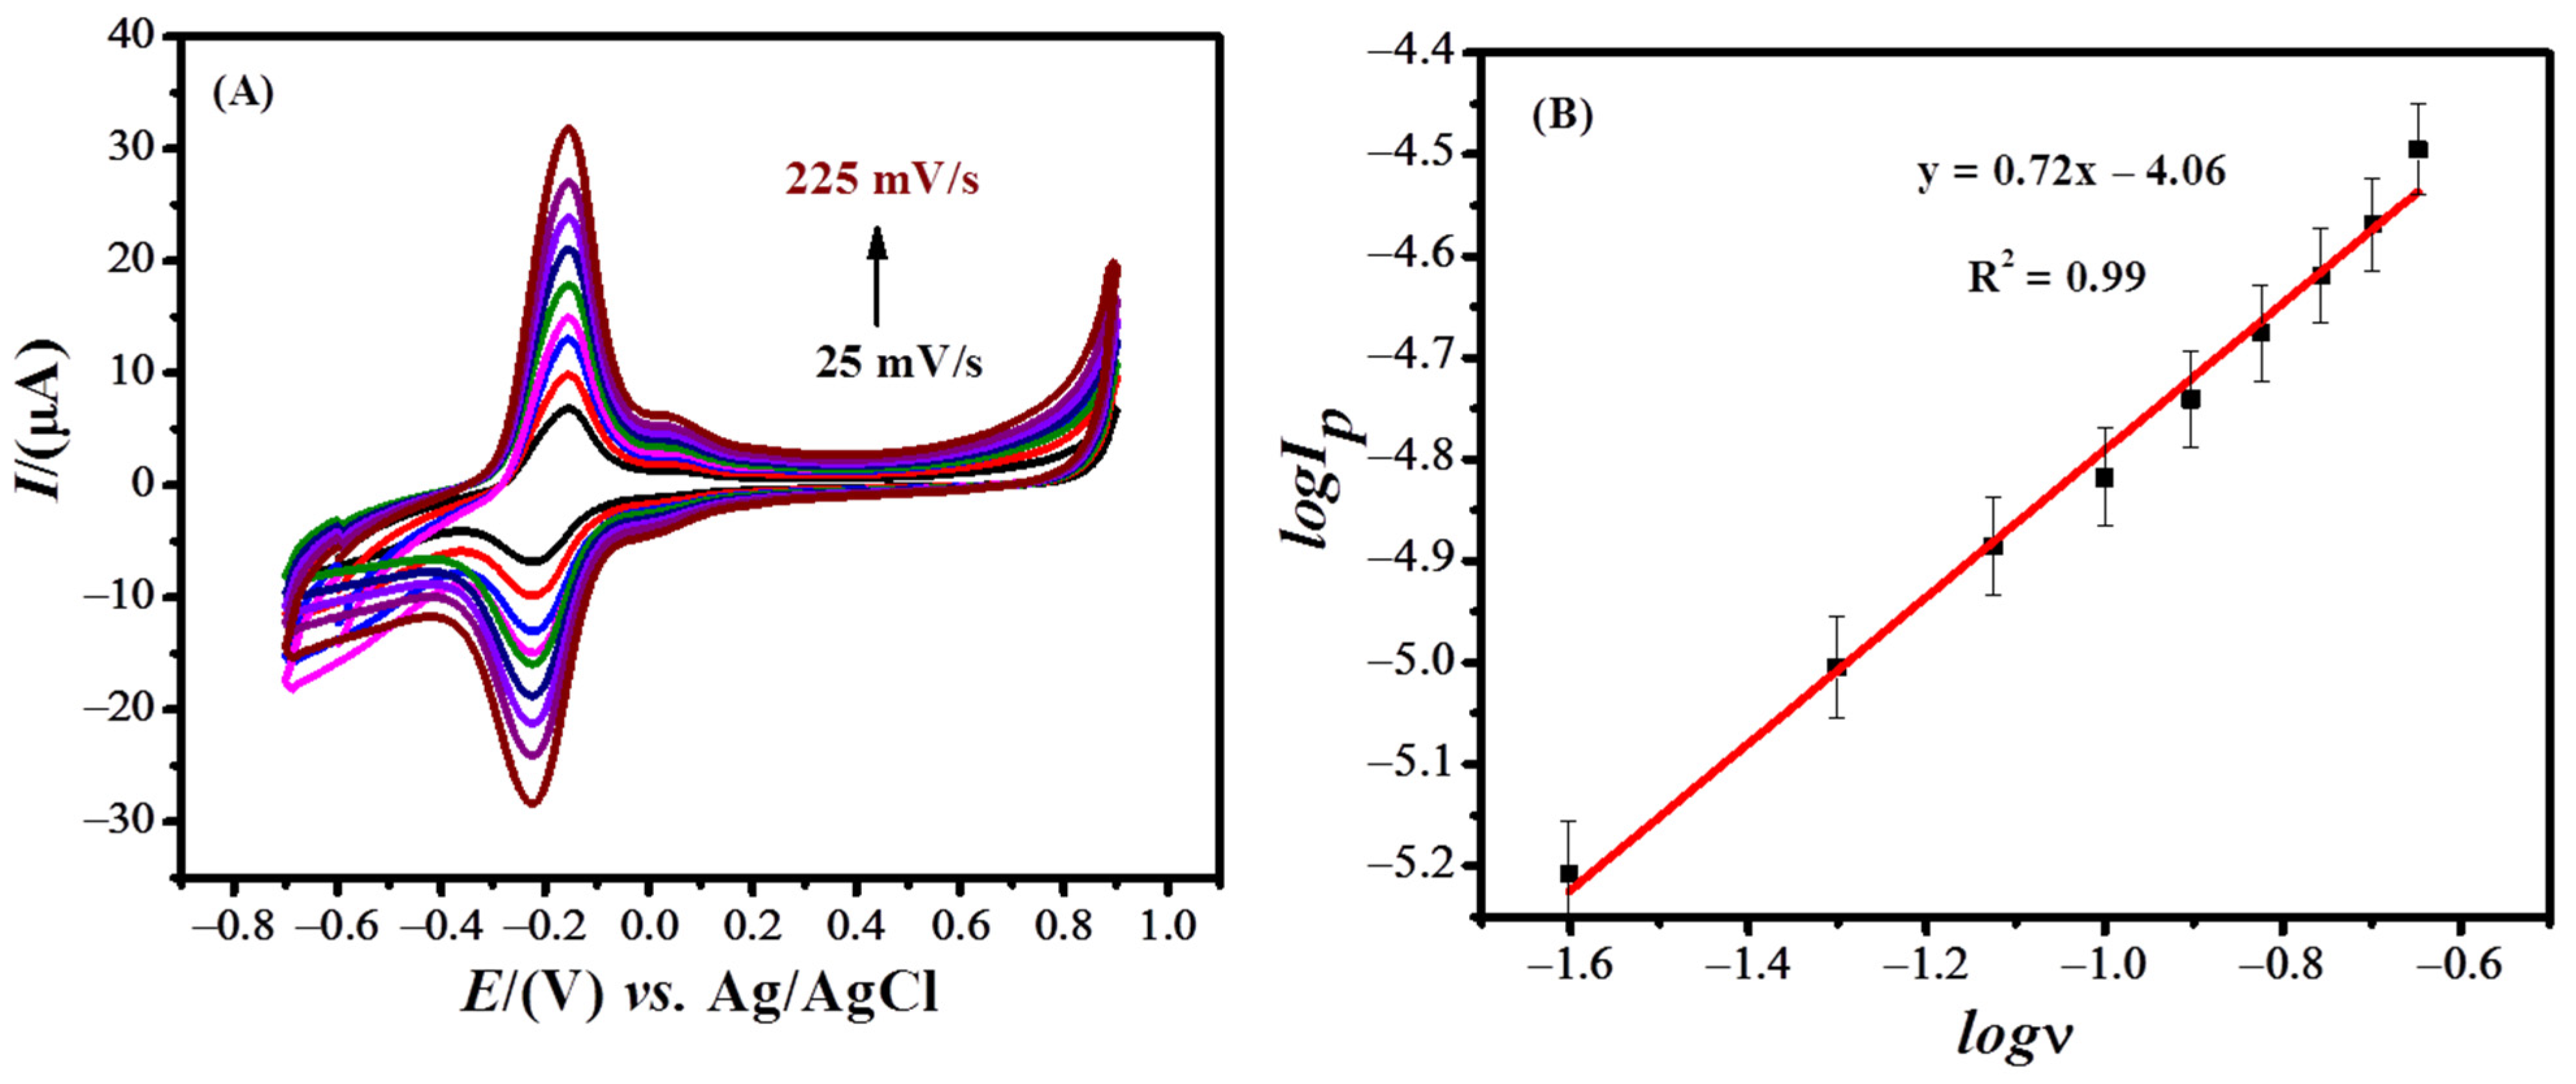
3.3. Effect of Scan Rate

CV was performed to check the effect of the scan rate on the peak current of MB (Figure 3A). To ascertain whether the electrochemical reactions are surface assisted or diffusion controlled, the relation between the signal intensity and scan rate was investigated. A linear plot between the peak current and scan rate shows a surface-controlled reaction, while linearity between the peak current and the square root of the scan rate shows a diffusion-controlled reaction. The oxidative peak current of MB was plotted against the scan rate and square root of the scan rate as shown in Figure S1A,B, respectively. A literature survey reveals that the process should be diffusion controlled if the plot of the log of the peak current vs. the log of the scan rate has a slope of 0.5 and adsorption controlled if the slope is equal to 1 [46]. The plot between the log of the oxidation peak current and the log of scan rates shown in Figure 3B, with a slope of 0.72, suggests the involvement of both surface and diffusional processes. However, the adsorption process seems dominant as the correlation coefficient of the plot between the peak current and scan rates (Figure S1A) is higher as compared to the R2 of the plot between the peak current and the square root of scan rates (Figure S1B).

3.4. Optimization of Experimental Parameters. Influence of Supporting Electrolyte, pH, Deposition Potential, and Deposition Time

Several parameters were optimized to obtain the maximum current response of MB using NH2-fMWCNTs modified GCE. The selection of the supporting electrolyte is important for obtaining a robust, intense signal of the targeted analyte. To investigate the maximum current response of the targeted analyte (MB), different supporting electrolytes, such as the Britton Robinson buffer (BRB), KCl, NaCl, HCl, H2SO4, NaOH, Acetate buffer, and phosphate buffer saline (pH = 6.0), of a 0.1 M concentration were examined. The most suitable supporting electrolyte was found to be PBS in which the analyte oxidized with the maximum current response and well-defined peak shape as compared to other electrolytes, as shown in Figure S2. The corresponding bar graph shown in Figure 4 demonstrates PBS as the most suitable supporting electrolyte for the detection of MB.
The effect of pH on the response of MB was investigated using PBS solutions of pH 3–9. The most intense signal was obtained in a medium of pH 6.0 as shown in Figure 5A. In an acidic electrolyte, the oxidation peak of methylene blue was decreased due to the high concentration of H+ ions. The reason could be the gain of protons from the solution by the electron-rich modifier (NH2-fMWCNTs) instead of MB. With the increase in pH of the medium, the availability of H+ competing with cationic MB should decrease in the solution and, as a result, modifier molecules are expected to interact with more MB molecules and thus preconcentrate them at the electrode surface. Hence, at the oxidation potential of MB, an intense anodic peak appears in the solution of pH 6. At a pH higher than 6, the availability of more OH ions in the solution may hinder cationic MB molecules from accessing the electrode surface, and as a consequence, lower peak current MB is evidenced. Therefore, in a basic medium, the oxidation current of MB decreased significantly. The pH-dependent shift of the peak potential suggests the involvement of protons during electron transfer reactions. The ratio of the number of electrons and protons participating in the proton-coupled oxidation process was calculated from the plot of the peak potential as a function of pH using the equation ΔEp/ΔpH = 2.303 mRT/nF, where m/n is the ratio of protons and electrons. The Nernstian slope of 58 mV/pH as shown in Figure 5B was obtained by the linear fitting of the peak potential vs. the pH plot, which reveals an equal number of protons and electrons involved in the oxidation process of MB. The proposed oxidation mechanism of MB involving two electrons and two protons can be seen in Scheme 1.
SWV was used to investigate the effect of the deposition potential and time on the peak current of 10 μM MB. The signal intensity was found to increase by increasing the negative potential up to −0.3 V. With the increase in negative potential, cationic dye molecules are expected to bind strongly to the anionic modifier NH2-fMWCNTs as evident from Figure S3. The effect of deposition time on the response of MB was also investigated. At an accumulation time of 60 s, the maximum current response, as shown in Figure S4, can be related to the effective orientation of preconcentrated molecules at the modified GCE. Therefore, in the subsequent experiments, a 60 s accumulation time was chosen for the analytical detection of the targeted analyte.

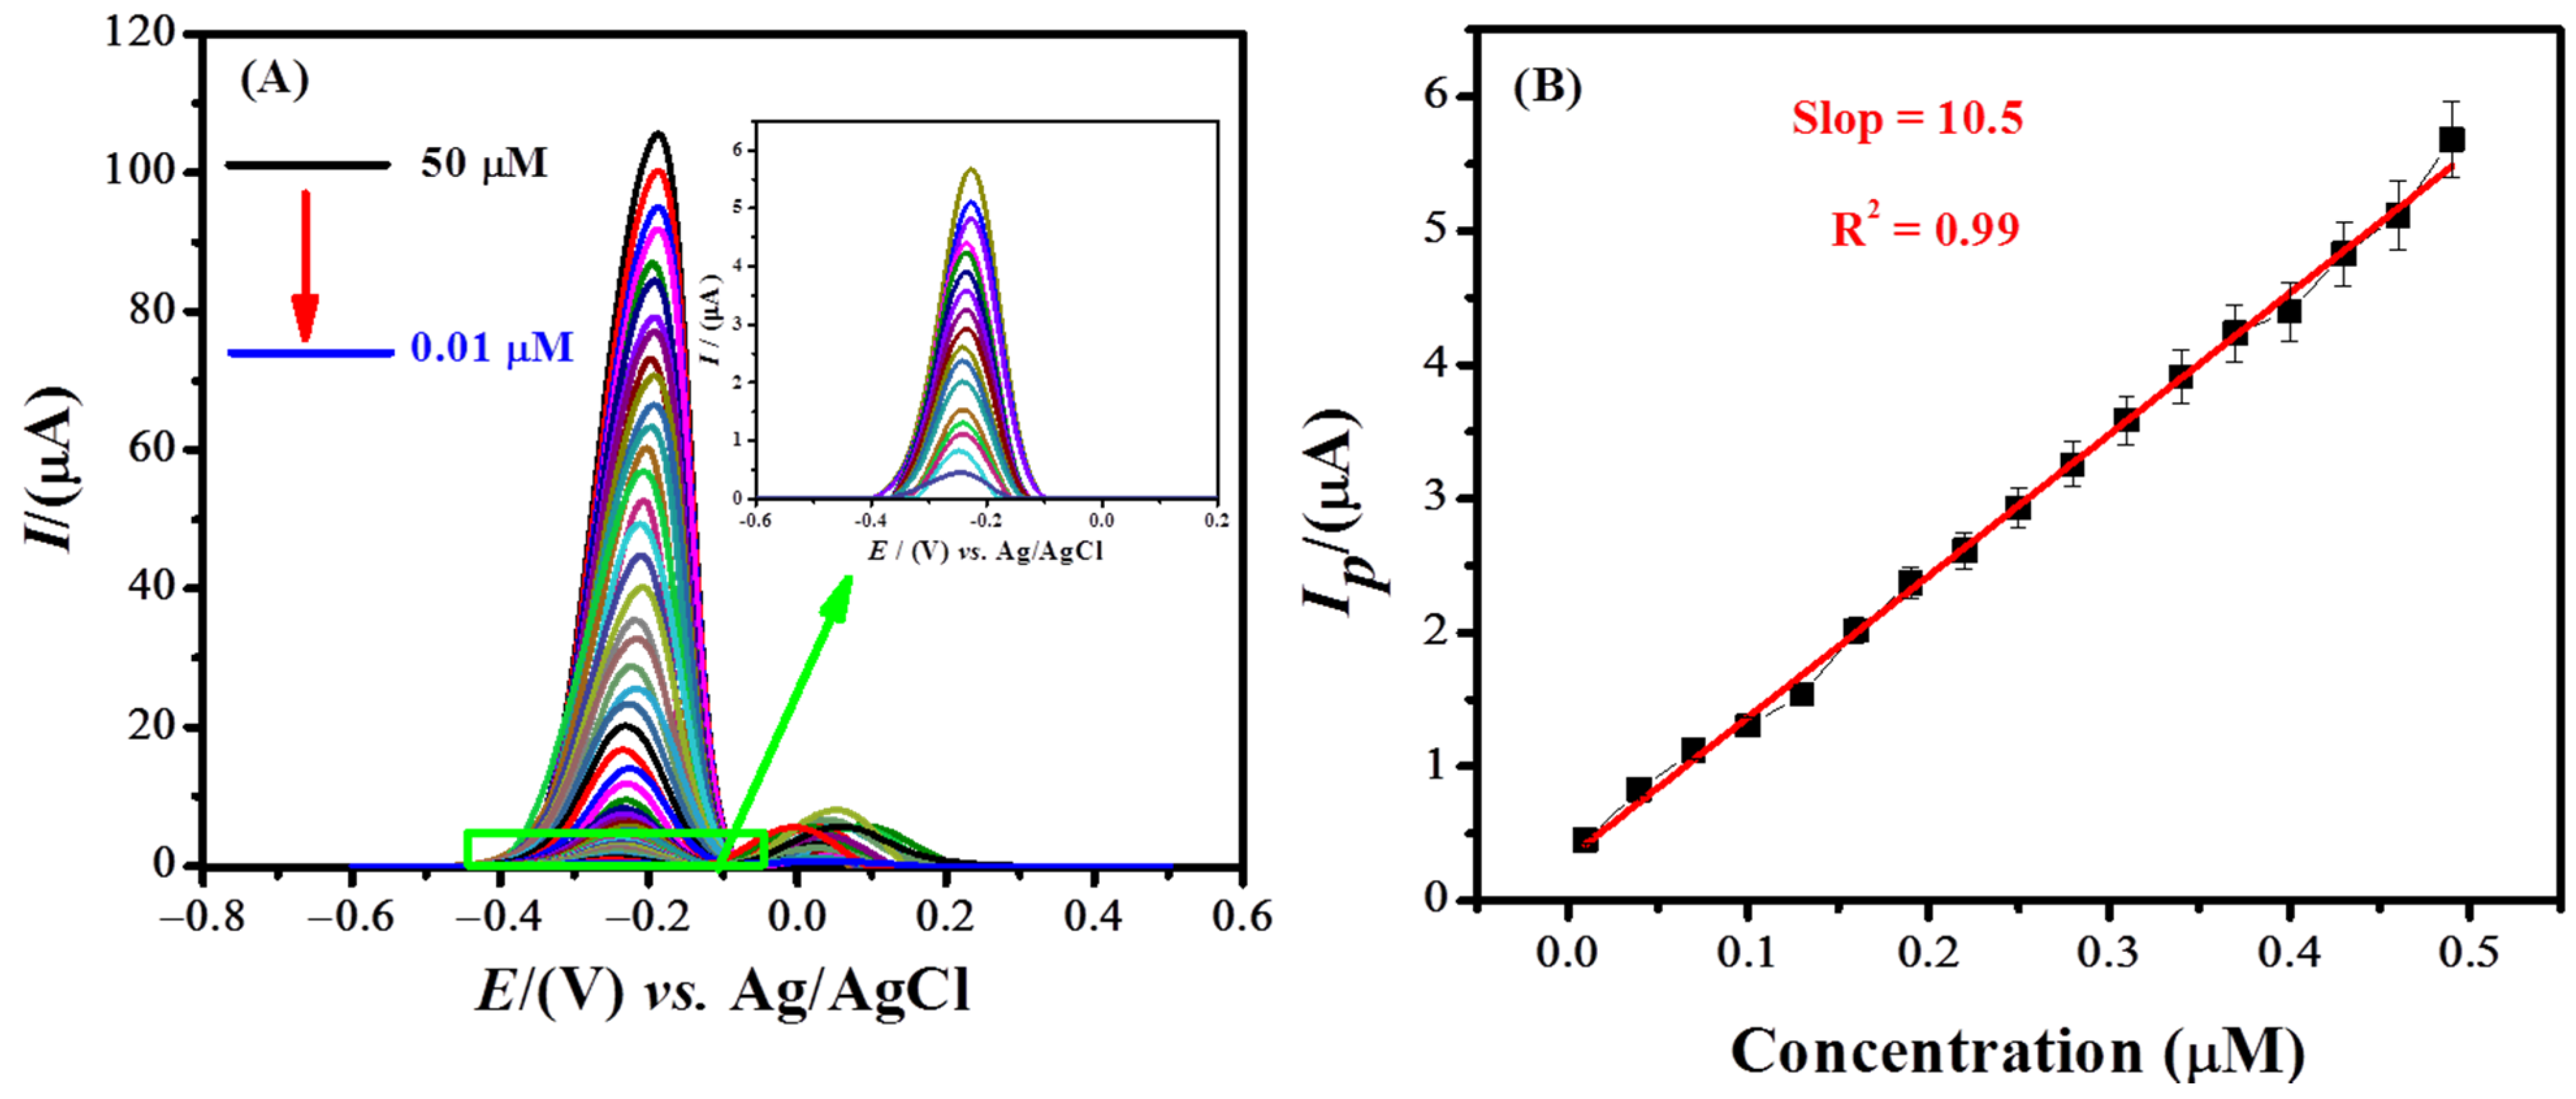
3.5. Analytical Characterization

The designed sensor was applied for the determination of MB up to its lowest limit of detection by using square wave voltammetry. The concentration-based voltammograms of MB are shown in Figure 6A. A linear calibration curve plotted between the peak current and concentration (0.01 μM to 0.5 μM) can be seen in Figure 6B. The limit of detection (LOD = 3 σ/m) and limit of quantification (LOQ = 10 σ/m) of the targeted analyte were evaluated from the calibration plot by applying IUPAC guidelines [47]. The standard deviation represented by σ was calculated by the current values (n = 11) of the blank solution at the peak position of the analyte [48]. The calculated limit of detection and limit of quantification of MB are 0.21 nM and 0.70 nM, respectively. Table 1 shows the comparison of MB sensors and reveals figures of merit of our designed sensing platform.

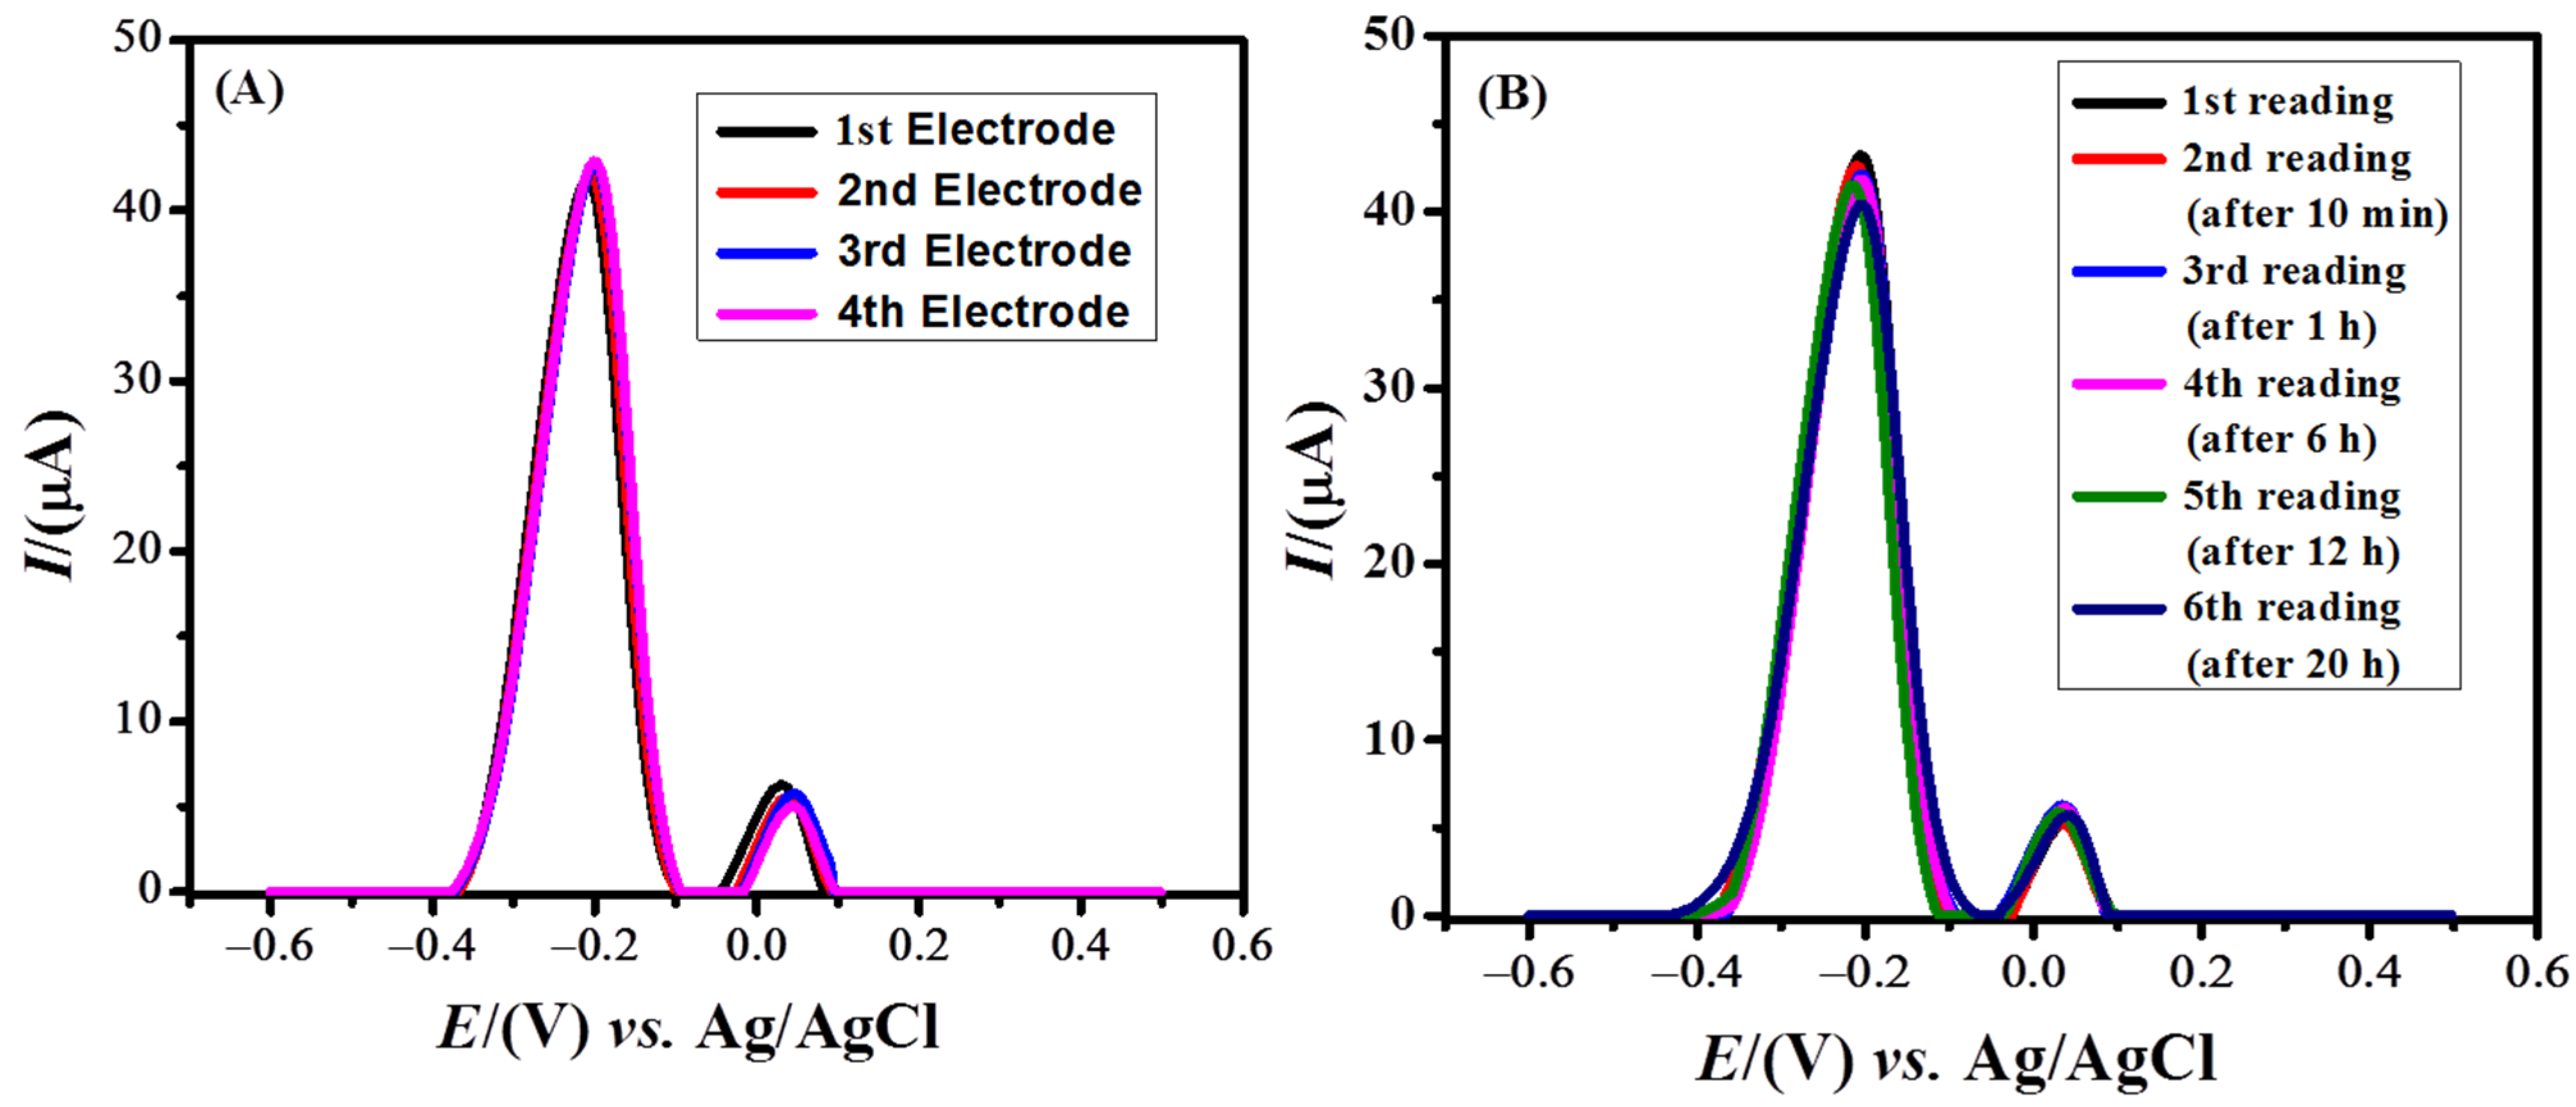
3.6. Validity of the Designed Sensor

Reproducibility and repeatability are the key factors for assessing the validity of a sensor. For the reproducibility test, we prepared four modified GCEs under the same conditions and applied these for recording SW voltammograms of MB under optimized conditions. On all four electrodes, the oxidation peak current of MB was almost the same, with an RSD value of 1.27%, as shown in Figure 7A. The repeatability of the designed sensor was also examined under optimized conditions. For this purpose, one electrode was prepared with NH2-fMWCNTs as a sensing platform and the same electrode was repeated several times for sensing experiments of MB. The peak current remained almost the same in all six experiments as shown in Figure 7B. Thus, the designed sensor showed inter-day repeatability and stability up to 20 h with an RSD value of 2.3%.

3.7. Degradation Study of MB on the Designed Electrochemical Sensor

The photocatalytic degradation of MB by TiO2 nanoparticles was investigated in an electrochemical cell. A stock solution of 0.1 mM MB (pH = 13.0) was prepared. Fifty milliliters of the stock solution were added to a beaker, to which 10 mg of TiO2 nanoparticles were added. This was then stirred for 10 min in the dark. Ten microliters of the as-prepared solution were drop-casted onto the modified GCE (NH2-fMWCNTs/GCE) and subsequently dried. The influence of pH on the photodegradation of MB was studied. The breakdown of dye was found to occur faster in basic conditions. [52] Therefore, photodegradation experiments were conducted in an alkaline medium using 0.3 M NaOH solution as the supporting electrolyte. The voltammogram of the MB was recorded under optimized conditions by employing a modified electrode under direct sunlight. At intervals of every 3 min, the same procedure was followed as described above. The corresponding voltammograms for the photodegradation of MB are shown in Figure 8A. The concentration of the dye in the solution decreased over time due to degradation, and as a result, a decrease in the peak current was observed. Initially, the peak current decreased more rapidly, indicating faster loss of electrophores (moiety of the MB molecule undergoing oxidation) present in the dye structure. The overall degradation percentage of MB was calculated using Equation (1).
%   degradation = Maximum   peak   current     Minimum   peak   current Maximum   peak   current   ×   100
The graphs of the percent degradation and extent of degradation vs. time can be seen in Figure S5. The % degradation was calculated to be 95.9%. The kinetics of MB degradation was also investigated. The rate constant (k) with a value of 0.11 min−1 was calculated from the plot between ln[(Ip)t/(Ip)o] and time using the equation of first-order kinetics (Figure 8B).

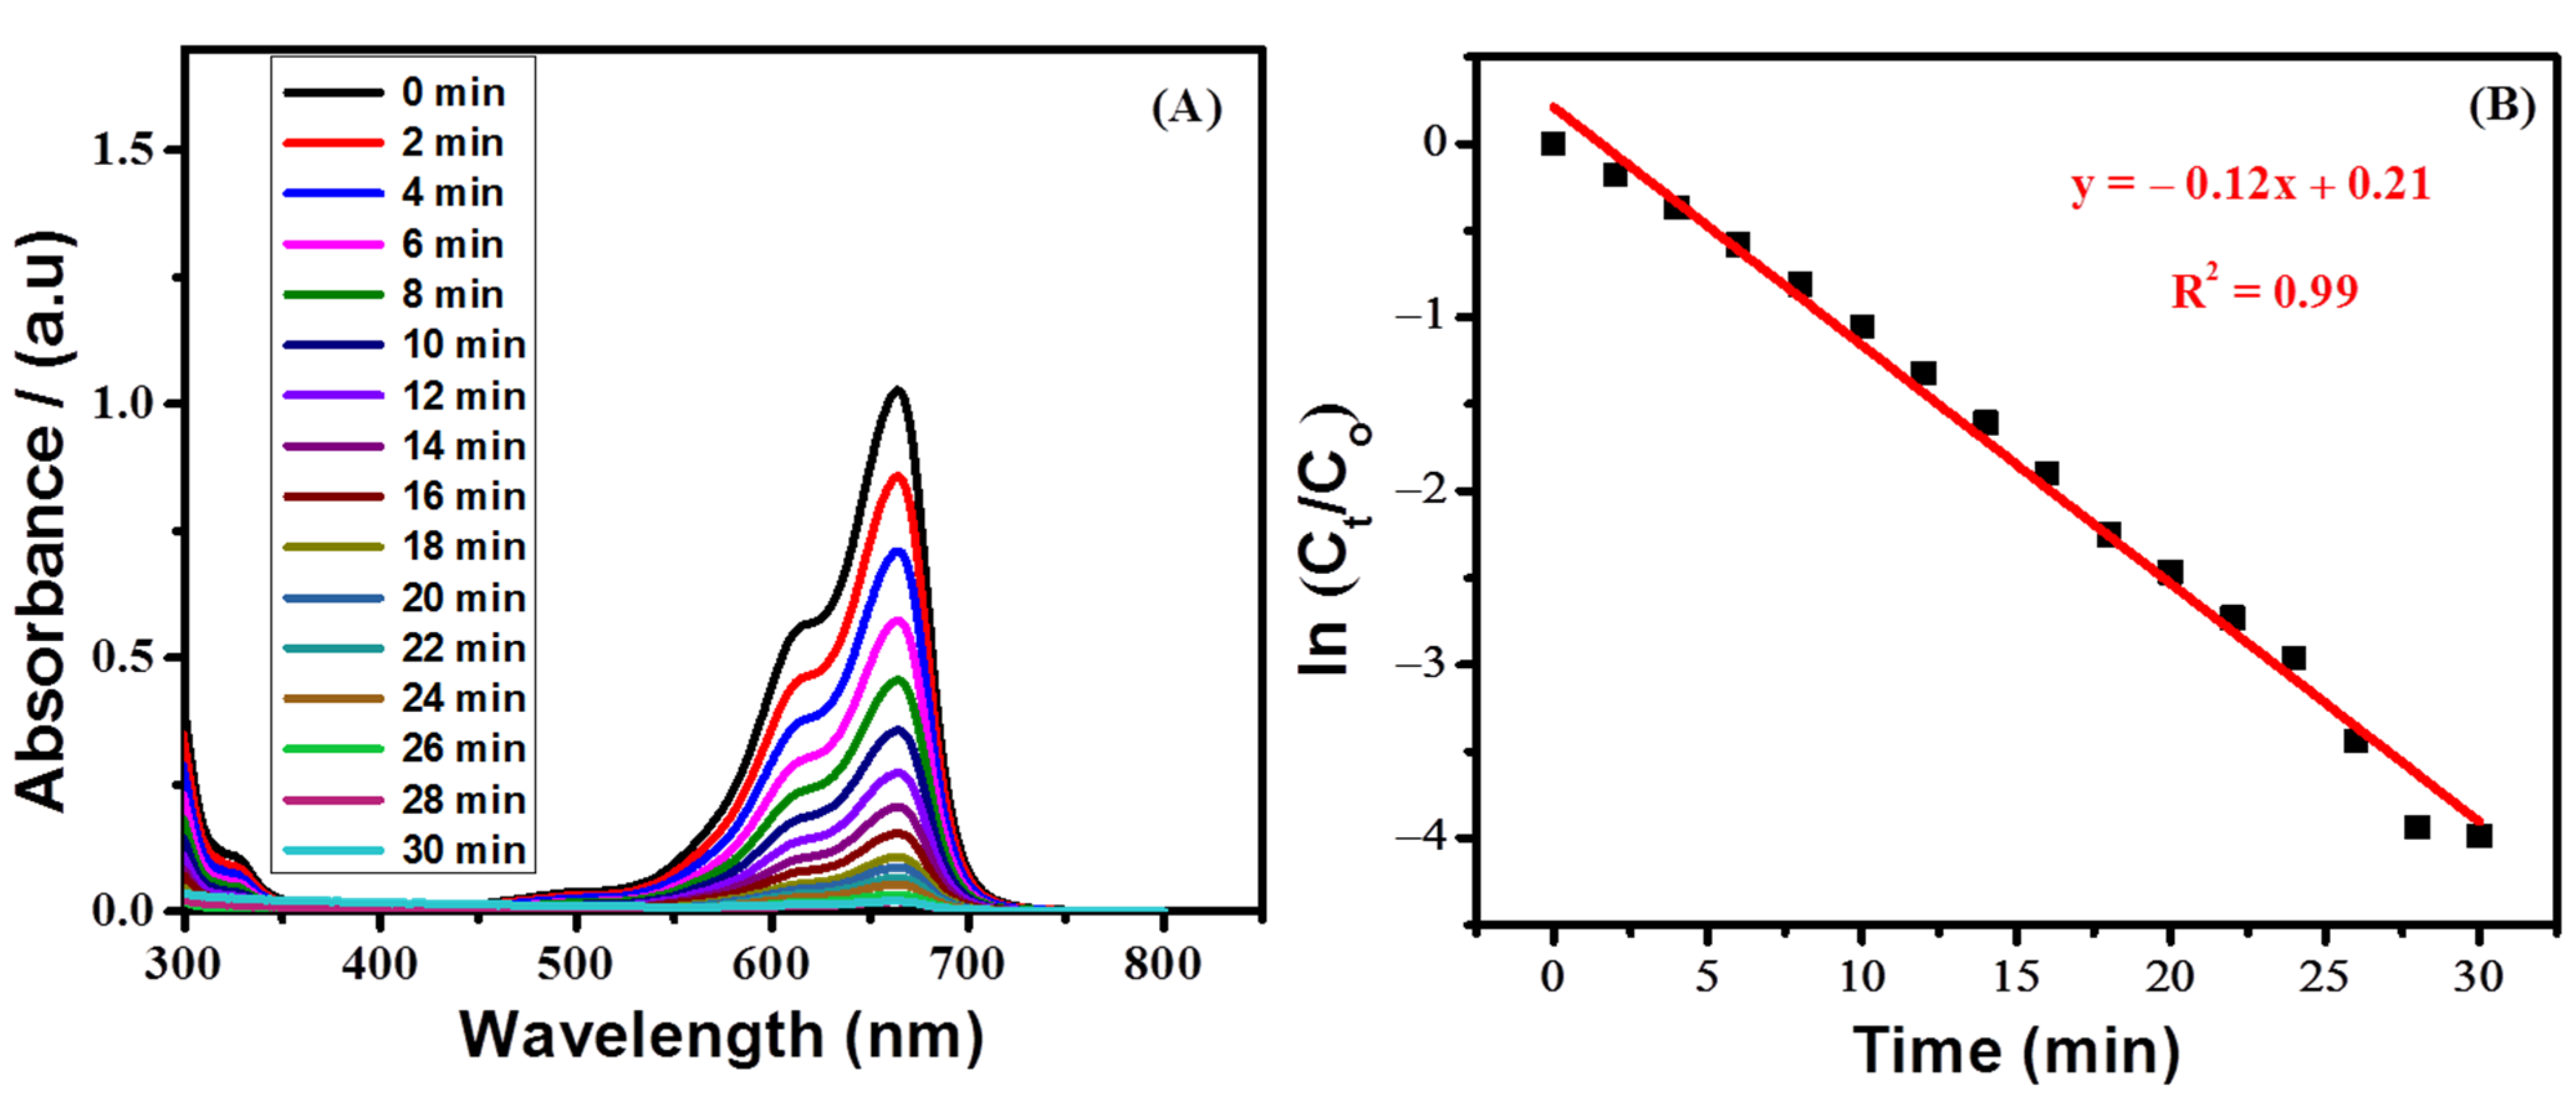
3.8. Spectrophotometric Study of the Degradation of MB

Time-based UV-visible spectra of the irradiated MB solution containing titania nanoparticles were recorded. Figure 9A shows a decrease in the absorption spectra of MB over time. The diminution in the absorption spectra corresponds to the degradation of MB by TiO2 nanoparticles under sunlight. The study was conducted in basic conditions to determine the influence of irradiation time on the photocatalytic degradation of MB. The increase in radiation time of sunlight caused an increase in the photodegradation of dye molecules. Over a time span of 30 min, the maximum degradation (98.1%) was observed. The order of the reaction was ensured from the linearity of the plot between ln (Ct/C0) and the irradiation time (Figure 9B) using a first-order equation (ln(Ct/Co) = −kt), where Co represents the absorbance at time 0 and Ct is the absorbance at time t. The rate constant with a value of 0.12 min−1 was calculated from the slope of the first-order kinetic plot. Figure S6 shows graphs of the percent and extent of the degradation of MB.

4. Conclusions

A fast, sensitive, and stable sensor based on NH2-fMWCNTs/GCE was developed for the determination of the concentration of MB. Under optimized conditions, detection and quantification limits were found to be 0.21 nM and 0.70 nM, respectively. MB was found to oxidize in a pH-dependent manner involving the loss of two electrons and two protons. The sensor demonstrated the qualities of simplicity, reproducibility, and repeatability. The sensor also showed promise for monitoring the photocatalytic degradation of MB. The results of both electrochemical and UV-Vis spectrophotometric techniques suggested that the breakdown of MB follows first-order kinetics. The percent degradation evaluated by employing voltammetric and spectrophotometric methods was found to be 95.9% and 98.1%, respectively. In the future, the applicability horizon of such sensors may be extended by coupling them with industries for early sensing and degradation of dye pollutants prior to the release of industrial effluents into freshwater bodies.

Supplementary Materials

The following are available online at https://www.mdpi.com/article/10.3390/catal12030306/s1, Table S1: Parameters obtained from EIS, Table S2: Calculated surface areas of working electrodes, Figure S1: (A) Plot of oxidation peak current of 0.1 mM MB vs. scan rate. (B) Plot of oxidation peak current of 0.1 mM MB vs. square root of scan rate, Figure S2: SWV of 10 μM MB recorded for 0.1 M different supporting electrolytes at deposition time of 5 s and accumulation potential of −0.5 V, Figure S3: (A) Square wave voltammograms of MB dye at various accumulation potentials using NH2-fMWCNTs /GCE. (B) Plot of Ip vs. accumulation potential, Figure S4: (A) Square wave voltammograms for the selection of optimum deposition time for the sensing of MB dye at NH2-fMWCNTs/GCE in 0.1 M PBS (pH = 6.0) at −0.3 V accumulation potential. (B) Plot of Ip vs. deposition time, Figure S5: (A) Plot of % degradation of 0.1 mM MB vs. time using electrochemical data of degradation obtained at the designed sensor; (B) plot showing the extent of degradation of MB dye, Figure S6: (A) Plot of % degradation of 0.1 mM MB vs. time using UV-visible spectroscopic data; (B) plot showing the extent of the breakdown of methylene blue dye.

Author Contributions

Conceptualization, A.S. and M.H.; methodology, M.H.; software, A.H.; validation, J.N., I.S. and A.S.; formal analysis, M.H.; investigation, M.H.; resources, I.S. and M.N.A.; data curation, A.H.; writing—original draft preparation, M.H. and A.H.; writing—review and editing, A.S. and M.N.A.; visualization, M.H.; supervision, A.S. All authors have read and agreed to the published version of the manuscript.

Funding

This research received no external funding.

Acknowledgments

Iltaf Shah graciously acknowledges the generous support of the UAE University (UPAR-Grant-2022). Afzal Shah acknowledges the support of Quaid-i-Azam University and the Higher Education Commission of Pakistan.

Conflicts of Interest

Authors declare no conflict of interest.

References

  1. Veisi, H.; Razeghi, S.; Mohammadi, P.; Hemmati, S. Silver nanoparticles decorated on thiol-modified magnetite nanoparticles (Fe3O4/SiO2-Pr-S-Ag) as a recyclable nanocatalyst for degradation of organic dyes. Mater. Sci. Eng. C 2019, 97, 624–631. [Google Scholar] [CrossRef] [PubMed]
  2. Singh, J.; Kumar, V.; Kim, K.H.; Rawat, M. Biogenic synthesis of copper oxide nanoparticles using plant extract and its prodigious potential for photocatalytic degradation of dyes. Environ. Res. 2019, 177, 108569. [Google Scholar] [CrossRef] [PubMed]
  3. Anwer, H.; Mahmood, A.; Lee, J.; Kim, K.H.; Park, J.-W.; Yip, A.C. Photocatalysts for degradation of dyes in industrial effluents: Opportunities and challenges. J. Nano Res. 2019, 12, 955–972. [Google Scholar] [CrossRef]
  4. Pandey, S.; Do, J.Y.; Kim, J.; Kang, M. Fast and highly efficient catalytic degradation of dyes using κ-carrageenan stabilized silver nanoparticles nanocatalyst. Carbohydr. Polym. 2020, 230, 115597. [Google Scholar] [CrossRef] [PubMed]
  5. Shakoor, S.; Nasar, A. Adsorptive treatment of hazardous methylene blue dye from artificially contaminated water using cucumis sativus peel waste as a low-cost adsorbent. Groundw. Sustain. Dev. 2017, 5, 152–159. [Google Scholar] [CrossRef]
  6. Pacheco-Álvarez, M.O.; Picos, A.; Pérez-Segura, T.; Peralta-Hernández, J.M. Proposal for highly efficient electrochemical discoloration and degradation of azo dyes with parallel arrangement electrodes. J. Electroanal. Chem. 2019, 838, 195–203. [Google Scholar] [CrossRef]
  7. Hossain, M.A.; Ali, M.M.; Islam, T.S.A. Comparative Adsorption of Methylene Blue on Different Low Cost Adsorbents by Continuous Column Process. Phys. Astron. 2018, 77, 26–34. [Google Scholar] [CrossRef] [Green Version]
  8. Kim, K.H.; Ihm, S.K. Heterogeneous catalytic wet air oxidation of refractory organic pollutants in industrial wastewaters: A review. J. Hazard. Mater. 2011, 186, 16–34. [Google Scholar] [CrossRef]
  9. Berneth, H. Azine dyes. In Ullmann’s Encyclopedia of Industrial Chemistry; John Wiley & Sons, Ltd.: Hoboken, NJ, USA, 2005. [Google Scholar] [CrossRef]
  10. Mathelin, C.; Croce, S.; Brasse, D.; Gairard, B.; Gharbi, M.; Andriamisandratsoa, N.; Bekaert, V.; Francis, Z.; Guyonnet, J.-L.; Huss, D. Methylene blue dye, an accurate dye for sentinel lymph node identification in early breast cancer. Anticancer Res. 2009, 29, 4119–4125. [Google Scholar]
  11. Chen, W.; Chen, L.; Yang, S.; Chen, Z.; Qian, G.; Zhang, S.; Jing, J. A novel technique for localization of small pulmonary nodules. J. Chest. 2007, 131, 1526–1531. [Google Scholar] [CrossRef]
  12. Hamel, J. A review of acute cyanide poisoning with a treatment update. Crit. Care Nurse 2011, 31, 72–82. [Google Scholar] [CrossRef] [PubMed]
  13. Giuliano, A.E.; Kirgan, D.M.; Guenther, J.M.; Morton, D.L. Lymphatic mapping and sentinel lymphadenectomy for breast cancer. Ann. Surg. 1994, 220, 391. [Google Scholar] [CrossRef] [PubMed]
  14. Peter, C.; Hongwan, D.; Küpfer, A.; Lauterburg, B. Pharmacokinetics and organ distribution of intravenous and oral methylene blue. Eur. J. Clin. Pharmacol. 2000, 56, 247–250. [Google Scholar] [CrossRef] [PubMed]
  15. Salhab, M.; Mokbel, K. Skin and fat necrosis of the breast following methylene blue dye injection for sentinel node biopsy in a patient with breast cancer. Int. Semin. Surg. Oncol. 2005, 2, 1–3. [Google Scholar] [CrossRef] [Green Version]
  16. Bai, S.W.; Huh, E.H.; Park, J.H.; Rha, K.H.; Kim, S.K.; Park, S.W. Urinary tract injuries during pelvic surgery: Incidence rates and predisposing factors. Int. Urogynecol. J. 2006, 17, 360–364. [Google Scholar] [CrossRef]
  17. Lipskikh, O.; Korotkova, E.; Khristunova, Y.P.; Barek, J.; Kratochvil, B. Sensors for voltammetric determination of food azo dyes-A critical review. Electrochim. Acta 2018, 260, 974–985. [Google Scholar] [CrossRef]
  18. Tang, B.; Xi, C.; Zou, Y.; Wang, G.; Li, X.; Zhang, L.; Chen, D.; Zhang, J. Simultaneous determination of 16 synthetic colorants in hotpot condiment by high performance liquid chromatography. J. Chromatogr. B 2014, 960, 87–91. [Google Scholar] [CrossRef]
  19. Alesso, M.; Bondioli, G.; Talío, M.C.; Luconi, M.O.; Fernández, L.P. Micelles mediated separation fluorimetric methodology for Rhodamine B determination in condiments, snacks and candies. Food Chem. 2012, 134, 513–517. [Google Scholar] [CrossRef]
  20. Zhu, X.; Liu, J.; Zhang, Z.; Lu, N.; Yuan, X.; Wu, D. Green synthesis of a bromocresol purple/graphene composite and its application in electrochemical determination of 2, 4, 6-trichlorophenol. J. Anal. Methods Chem. 2015, 7, 3178–3184. [Google Scholar] [CrossRef]
  21. Terbouche, A.; Lameche, S.; Ait-Ramdane Terbouche, C.; Guerniche, D.; Lerari, D.; Bachari, K.; Hauchard, D. A new electrochemical sensor based on carbon paste electrode/Ru (III) complex for determination of nitrite: Electrochemical impedance and cyclic voltammetry measurements. Measurement 2016, 92, 524–533. [Google Scholar] [CrossRef]
  22. Yadav, S.; Carrascosa, L.G.; Sina, A.A.; Shiddiky, M.J.; Hill, M.M.; Trau, M. Electrochemical detection of protein glycosylation using lectin and protein–gold affinity interactions. Analyst 2016, 141, 2356–2361. [Google Scholar] [CrossRef] [PubMed]
  23. Patil, T.V.; Patel, D.K.; Dutta, S.D.; Ganguly, K.; Randhawa, A.; Lim, K.T. Carbon Nanotubes-Based Hydrogels for Bacterial Eradiation and Wound-Healing Applications. Appl. Sci. 2021, 11, 9550. [Google Scholar] [CrossRef]
  24. Li, Z.; Zhou, J.; Dong, T.; Xu, Y.; Shang, Y. Application of electrochemical methods for the detection of abiotic stress biomarkers in plants. Biosens. Bioelectron. 2021, 182, 113105. [Google Scholar] [CrossRef] [PubMed]
  25. Hierold, C.; Jungen, A.; Stampfer, C.; Helbling, T. Nano electromechanical sensors based on carbon nanotubes. Sens. Actuator A Phys. 2007, 136, 51–61. [Google Scholar] [CrossRef]
  26. Li, C.; Thostenson, E.T.; Chou, T.W. Sensors and actuators based on carbon nanotubes and their composites: A review. Compos. Sci. Technol. 2008, 68, 1227–1249. [Google Scholar] [CrossRef]
  27. Metters, J.P.; Banks, C.E. Banks, Electrochemical utilisation of chemical vapour deposition grown carbon nanotubes as sensors. J. Vac. 2012, 86, 507–519. [Google Scholar] [CrossRef]
  28. Ajayan, P.M.; Schadler, L.S.; Giannaris, C.; Rubio, A. Single-walled carbon nanotube–polymer composites: Strength and weakness. J. Adv. Mater. 2000, 12, 750–753. [Google Scholar] [CrossRef]
  29. Njuguna, J.; Pielichowski, K.; Alcock, J.R. Epoxy-based fibre reinforced nanocomposites. Adv. Eng. Mater. 2007, 9, 835–847. [Google Scholar] [CrossRef] [Green Version]
  30. Holzinger, M.; Abraham, J.; Whelan, P.; Graupner, R.; Ley, L.; Hennrich, F.; Kappes, M.; Hirsch, A. Functionalization of single-walled carbon nanotubes with (R-) oxycarbonyl nitrenes. J. Am. Chem. Soc. 2003, 125, 8566–8580. [Google Scholar] [CrossRef]
  31. Balasubramanian, K.; Burghard, M. Chemically functionalized carbon nanotubes. J. Small 2005, 1, 180–192. [Google Scholar] [CrossRef]
  32. Mahajan, A.; Kingon, A.; Kukovecz, A.; Konya, Z.; Vilarinho, P.M. Studies on the thermal decomposition of multiwall carbon nanotubes under different atmospheres. Mater. Lett. 2013, 90, 165–168. [Google Scholar] [CrossRef]
  33. Tasis, D.; Tagmatarchis, N.; Bianco, A.; Prato, M. Chemistry of carbon nanotubes. Chem. Rev. 2006, 106, 1105–1136. [Google Scholar] [CrossRef] [PubMed]
  34. Lim, S.H.; Wei, J.; Lin, J.; Li, Q.; KuaYou, J. A glucose biosensor based on electrodeposition of palladium nanoparticles and glucose oxidase onto Nafion-solubilized carbon nanotube electrode. Biosens. Bioelectron. 2005, 20, 2341–2346. [Google Scholar] [CrossRef] [PubMed]
  35. De Volder, M.F.; Tawfick, S.H.; Baughman, R.H.; Hart, A.J. Carbon nanotubes: Present and future commercial applications. J. Sci. 2013, 339, 535–539. [Google Scholar] [CrossRef] [PubMed] [Green Version]
  36. Kong, J.; Franklin, N.R.; Zhou, C.; Chapline, M.G.; Peng, S.; Cho, K.; Dai, H. Nanotube molecular wires as chemical sensors. J. Sci. 2000, 287, 622–625. [Google Scholar] [CrossRef] [PubMed]
  37. Nandhini, N.; Rajeshkumar, S.; Mythili, S. The possible mechanism of eco-friendly synthesized nanoparticles on hazardous dyes degradation. Biocatal. Agric. Biotechnol. 2019, 19, 101138. [Google Scholar] [CrossRef]
  38. Ollis, D.F. Photocatalytic purification and remediation of contaminated air and water. J. C R. Acad. Sci. IIC-Chem. 2000, 3, 405–411. [Google Scholar] [CrossRef]
  39. Shah, A.H.; Zaid, W.; Shah, A.; Rana, U.A.; Hussain, H.; Ashiq, M.N.; Qureshi, R.; Badshah, A.; Zia, M.A.; Kraatz, H.B. pH Dependent electrochemical characterization, computational studies and evaluation of thermodynamic, kinetic and analytical parameters of two phenazines. J. Electrochem. Soc. 2014, 162, 115–123. [Google Scholar] [CrossRef]
  40. Ahmad, K.; Shah, A.H.; Adhikari, B.; Rana, U.A.; Vijayaratnam, C.; Muhammad, N.; Shujah, S.; Rauf, A.; Hussain, H.; Badshah, A. pH-dependent redox mechanism and evaluation of kinetic and thermodynamic parameters of a novel anthraquinone. RSC Adv. 2014, 4, 31657–31665. [Google Scholar] [CrossRef]
  41. Sacco, A. Electrochemical impedance spectroscopy: Fundamentals and application in dye-sensitized solar cells. Renew. Sustain. Energy Rev. 2017, 79, 814–829. [Google Scholar] [CrossRef]
  42. Macdonald, J.R.; Johnson, W.B. Chapter 1: Theory, experiment, and applications, Fundamentals of Impedance Spectroscopy. In Impedance Spectroscopy, 3rd ed.; Barsoukov, E., Macdonald, J.R., Eds.; John Wiley & Sons Inc.: Hoboken, NJ, USA, 2018. [Google Scholar] [CrossRef]
  43. Amin, M.A.; Abd El-Rehim, S.S.; El-Sherbini, E.; Bayoumi, R.S. The inhibition of low carbon steel corrosion in hydrochloric acid solutions by succinic acid: Part I. Weight loss, polarization, EIS, PZC, EDX and SEM studies. Electrochim. Acta 2007, 52, 3588–3600. [Google Scholar] [CrossRef]
  44. Randviir, E.P.; Banks, C.E. Electrochemical impedance spectroscopy: An overview of bioanalytical applications. Anal. Methods 2013, 5, 1098–1115. [Google Scholar] [CrossRef]
  45. Mohajeri, S.; Dolati, A.; Rezaie, S.S. Electrochemical sensors based on functionalized carbon nanotubes modified with platinum nanoparticles for the detection of sulfide ions in aqueous media. J. Chem. Sci. 2019, 131, 1–18. [Google Scholar] [CrossRef] [Green Version]
  46. Zahid, A.; Lashin, A.; Rana, U.A.; Al-Arifi, N.; Ullah, I.; Dionysiou, D.D.; Qureshi, R.; Waseem, A.; Kraatz, H.-B.; Shah, A.J.E.A. Development of surfactant based electrochemical sensor for the trace level detection of mercury. Electrochim. Acta 2016, 190, 1007–1014. [Google Scholar] [CrossRef]
  47. Belter, M.; Sajnóg, A.; Barałkiewicz, D. Over a century of detection and quantification capabilities in analytical chemistry—Historical overview and trends. Talanta 2014, 129, 606–616. [Google Scholar] [CrossRef] [PubMed]
  48. Kokab, T.; Shah, A.; Nisar, J.; Khan, A.M.; Khan, S.B.; Shah, A.H. Tripeptide Derivative-Modified Glassy Carbon Electrode: A Novel Electrochemical Sensor for Sensitive and Selective Detection of Cd2+ Ions. ACS Omega 2020, 5, 10123–10132. [Google Scholar] [CrossRef] [PubMed] [Green Version]
  49. Soto, P.; Salamanca Neto, C.; Moraes, J.; Sartori, E.; Bessegato, G.G.; Lopes, F.; Almeida, L. A novel sensing platform based on self-doped TiO2 nanotubes for methylene blue dye electrochemical monitoring during its electro-Fenton degradation. J. Solid State Electrochem. 2020, 24, 1951–1959. [Google Scholar] [CrossRef]
  50. Tonlé, I.K.; Ngameni, E.; Tcheumi, H.L.; Tchiéda, V.; Carteret, C.; Walcarius, A. Sorption of methylene blue on an organoclay bearing thiol groups and application to electrochemical sensing of the dye. Talanta 2008, 74, 489–497. [Google Scholar] [CrossRef]
  51. Hassan, S.S.; Nafady, A.; Solangi, A.R.; Kalhoro, M.S.; Abro, M.I.; Sherazi, S.T.H. Ultra-trace level electrochemical sensor for methylene blue dye based on nafion stabilized ibuprofen derived gold nanoparticles. Sens. Actuators B Chem. 2015, 208, 320–326. [Google Scholar] [CrossRef]
  52. Zhang, W.; Huo, C.; Hou, B.; Lin, C.; Yan, X.; Feng, J.; Yana, W. Secondary particle size determining sedimentation and adsorption kinetics of titanate-based materials for ammonia nitrogen and methylene blue removal. J. Mol. Liq. 2021, 343, 117026. [Google Scholar] [CrossRef]
Figure 1. (A) Nyquist plots at bare and modified GCEs in a 5 mM K3[Fe(CN)6] and 0.1 M KCl solution and comparative cyclic voltammograms obtained at the bare and modified GCEs in 5 mM K3[Fe(CN)6] and (B) 0.1 M KCl solution at a scan rate of 100 mV/s in the potential range of −0.15 V to 0.6 V.
Catalysts 12 00306 g001
Figure 2. Comparative SWVs of 10 μM MB at bare GCE, MWCNT’s/GCE, and NH2-fMWCNT’s/GCE in a potential window of −0.6 to 0.5.
Catalysts 12 00306 g002
Figure 3. (A) Cyclic voltammograms of 0.1 mM MB at various scan rates. (B) Plot of the log of the oxidative peak current of MB dye vs. log of scan rate.
Catalysts 12 00306 g003
Figure 4. Effect of the various electrolytes on peak current response of 10 μM MB at 125 mV/s scan rate, 5 s deposition time, and −0.5 V accumulation potential.
Catalysts 12 00306 g004
Figure 5. (A) SWV of 10 μM MB in PBS solutions of pH (3.0–9.0) obtained by using NH2-fMWCNTs/GCE as a working electrode with deposition time of 5 s and accumulation potential of −0.5 V. (B) Ep–pH plot of MB using data of Figure 5A at scan rate of 125 mV/s.
Catalysts 12 00306 g005
Scheme 1. Proposed oxidation mechanism of MB at the NH2-fMWCNTs/GCE.
Catalysts 12 00306 sch001
Figure 6. (A) Square wave voltammograms of the MB solution of different concentrations using NH2-fMWCNTs/GCE under optimized conditions (0.1 M PBS (pH = 6.0), deposition potential = −0.3 V, deposition time = 60 s). (B) Calibration plot in a concentration range of 0.5 μM to 0.01 μM.
Catalysts 12 00306 g006
Figure 7. (A) Square wave voltammograms of MB showing the reproducibility and (B) SWV of MB showing repeatability of the developed sensor in PBS of pH of 6.
Catalysts 12 00306 g007
Figure 8. (A) SW voltammograms of the photocatalytic degradation of MB on NH2-fMWCNTs/GCE using TiO2 nanoparticles under deposition potential of −0.3 V and deposition time of 60 s. (B) A linear plot showed first-order kinetics of the photocatalytic degradation of methylene blue.
Catalysts 12 00306 g008
Figure 9. (A) UV-visible spectra showing photodegradation of 0.1 mM methylene blue in the presence of TiO2 nanoparticles (B) Plot showing first-order kinetics of the photocatalytic degradation of methylene blue under basic conditions.
Catalysts 12 00306 g009
Table 1. Methylene blue sensors and their performance parameters.
Methylene BlueElectrode ModifierLinearity Range/(μM)LOD/nMReference
OxidationSelf-doped TiO2 nanotubes1.0–7.94475[49]
OxidationThiol functionalized Clay1.0–14400[50]
OxidationIbu-AuNps0.01–1.13.9[51]
OxidationNH2-fMWCNTs0.01–0.50.21This work
Publisher’s Note: MDPI stays neutral with regard to jurisdictional claims in published maps and institutional affiliations.

