Article

Competitive Adsorption of NOx and Ozone on the Catalyst Surface of Ozone Converters

1
Univ Lyon, Université Claude Bernard Lyon 1, CNRS, IRCELYON, 69626 Villeurbanne, France
2
Institut de Chimie des Milieux et Matériaux de Poitiers, UMR 7285, Université de Poitiers-CNRS, 4 Rue Michel Brunet, BP633, CEDEX, 86022 Poitiers, France
3
Laboratory of Catalysis, Polymerization, Processes and Materials, CP2M UMR 5128 CNRS-UCB Lyon 1-CPE Lyon, CPE Lyon 43 Bd du 11 Novembre 1918, Institut de Chimie de Lyon, Université de Lyon, 69616 Villeurbanne, France
*
Authors to whom correspondence should be addressed.
Catalysts 2022, 12(7), 738; https://doi.org/10.3390/catal12070738
Submission received: 25 May 2022 / Revised: 23 June 2022 / Accepted: 27 June 2022 / Published: 4 July 2022
(This article belongs to the Special Issue Catalytic Removal and Resource Utilization of NOx)

Abstract

:
Four catalysts—1%Pd-2%Mn/ γ -Al2O3, 1%Pd/ γ -Al2O3, 2%Mn/ γ -Al2O3 and γ -Al2O3—were synthesized via a sol–gel method and characterized using various techniques to evaluate their physicochemical, textural, surface and acidic properties. They were used in the catalytic transformation of ozone and nitrogen oxides using in situ Diffuse Reflectance Infrared Fourier Transform Spectroscopy (DRIFTS) analysis. Different consecutive gas sequences were followed to unravel the poisoning role of nitrogen oxides and the possible reactivation by ozone. It has been proven that on palladium and manganese-based catalysts, the inhibition effect of nitrogen oxides was due to the formation of monodentate nitrites, monodentate, bidentate and bridged nitrates, which are difficult to desorb and decompose into gaseous NOx, either by oxidation or by thermal treatment. Interestingly, monodentate nitrites could be eliminated if the catalyst went through a co-adsorption of NOx and ozone prior to exposure in clean ozone flow. This transformation could be the reason why the catalytic conversion of ozone could return to its original value before the poison effect of nitrogen oxides.

1. Introduction

Pollution by ozone, O3 and NOx (NOx comprising NO and NO2) is a major concern at ground level because of their impact on human health and the natural environment. Both compounds are known to interact, and they are linked by the cycle: NO + O3 → NO2 + O2 and NO2 + h ν + O2 → NO + O3 [1,2]. Ozone is also a major pollutant in aircrafts because the cruise altitude is at a level where the ozone concentration exceeds the upper limit level specified in US Federal Aviation Regulations for long flights (100 ppbv) [3]. Catalytic converters, allowing the treatment of bleed air at 200 ° C , are classically used in aircrafts to reduce ozone. One of the preferred ways to decompose ozone is by catalytic abatement using transition metals for its mild reaction conditions, great activity and conversion rate and low cost. Studies have shown that manganese, silver and palladium-based catalysts proved to be highly effective in the decomposition of ozone [4,5,6]. However, for electrical aircraft in the future, ozone converters will no longer benefit from the high temperature of bleed air and will have to work efficiently at temperatures below 100 ° C . In addition to this issue and depending on the altitude, ozone and NOx can be present simultaneously or consecutively, and although the interaction between them is well studied in the atmosphere [7,8,9], the way they compete to adsorb and react at the catalyst surface is much less studied [10,11]. So far, the above-mentioned catalytic converters seem to be sensitive toward NOx as reported on a few studies concerning the catalytic ozone decomposition at low temperature [12,13,14]. Such pollutants might poison the catalysts, thus rendering them ineffective [12,13,14,15]. Our group published a preliminary study showing that the presence of NOx in the air is detrimental to the performances of ozone converters at low temperature [16]. Experiments at 40 ° C showed a stable conversion of ozone in pure air and a rapid decrease of the conversion in the presence of NOx. However, the poisoning effect was found to be reversible; at 120 ° C , NOx compounds were no longer adsorbed from a mixture of air and NOx, and they could even be desorbed from the surface with pure air [16]. Based on these preliminary studies, a deeper examination of the surface phenomena was necessary for the understanding of this competitive reaction mechanism. Note that in the state-of-the-art literature, competitive adsorption of NOx and ozone were only studied in the frame of ozone-assisted oxidation of NOx but not in the context of ozone abatement inhibited by NOx compounds [10]. Thus, the chemistry at the surface of the catalyst may depend on the sequence of introduction of different gaseous compounds which are able to adsorb at the surface and/or to react together. To understand the mechanism involved in the NOx and/or O3 adsorption/reaction, the influence of the chemical surface properties of different synthesized catalysts was studied in the present work. Various catalysts containing different transition metals were synthesized via a sol–gel method, which were then characterized by different analysis including N2 adsorption/desorption, X-ray diffraction, H2-temperature programmed reduction, X-ray photoelectron spectroscopy, inductively coupled plasma atomic emission spectroscopy (ICP-OES), pyridine infrared spectroscopy (pyridine-IR, high-resolution transmission electron microscopy (HRTEM) and Scanning Transmission Electronic Microscopy–High-Angle Annular Dark Field (STEM-HAADF). Several in situ Diffuse Reflectance Infrared Fourier Transform Spectroscopy (DRIFTS) measurements were carried out to identify the nature of adsorbed species under NOx and ozone sequenced adsorption or simultaneous adsorption in order to further elucidate their competitive adsorption/reaction and to confirm the inhibition effect of NOx on ozone decomposition and possible catalyst regeneration.

2. Results and Discussion

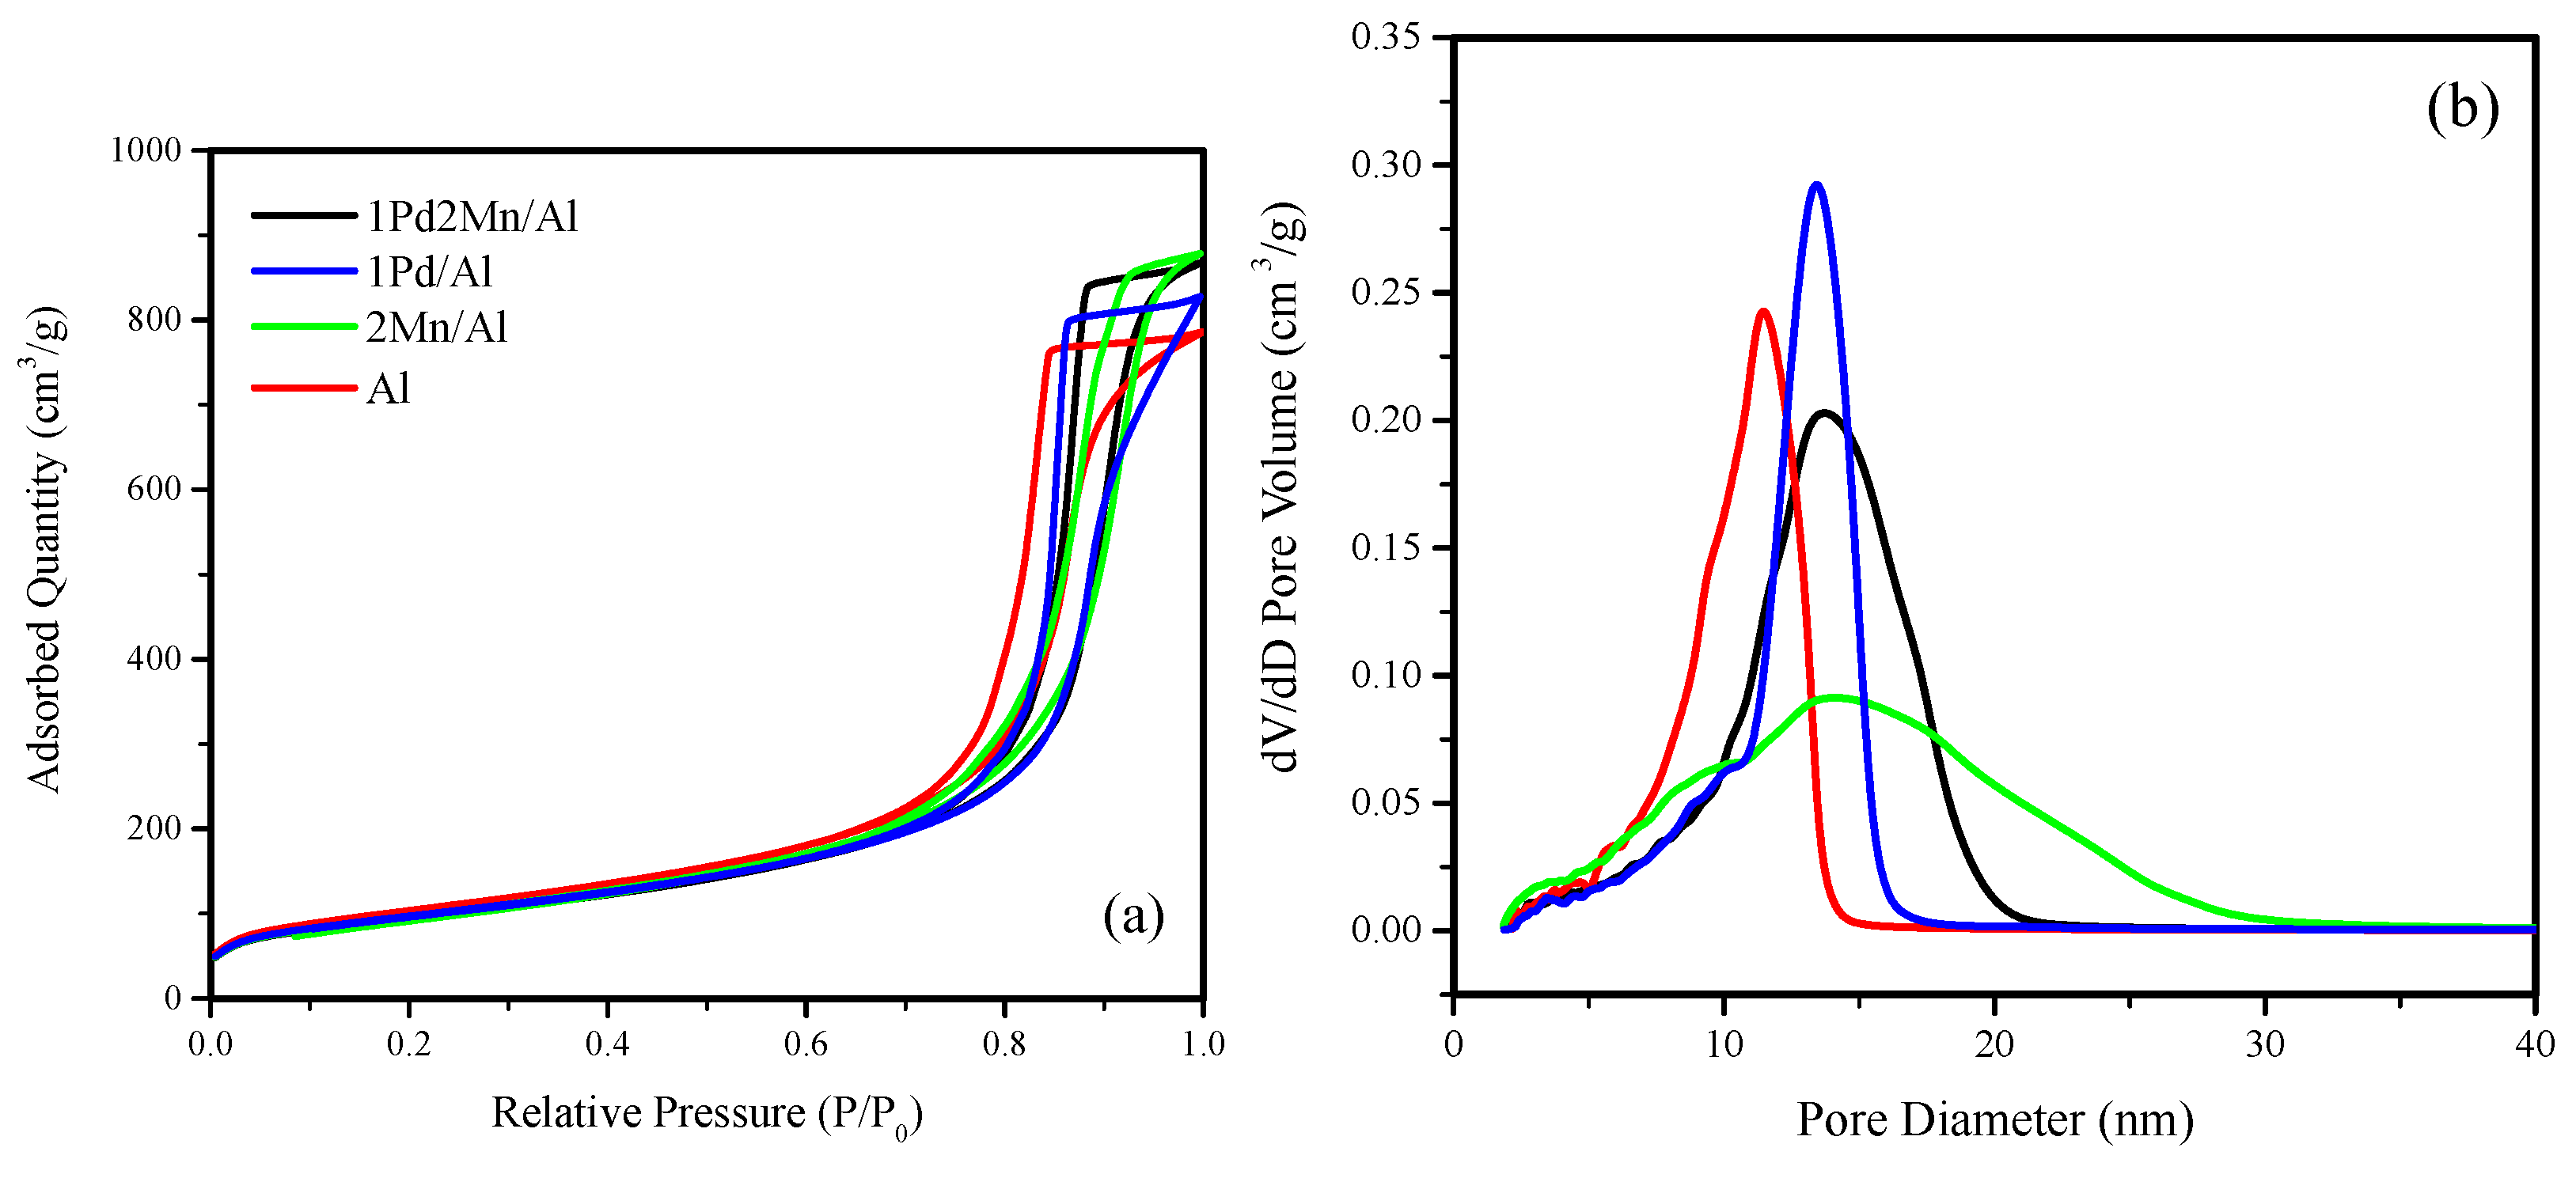
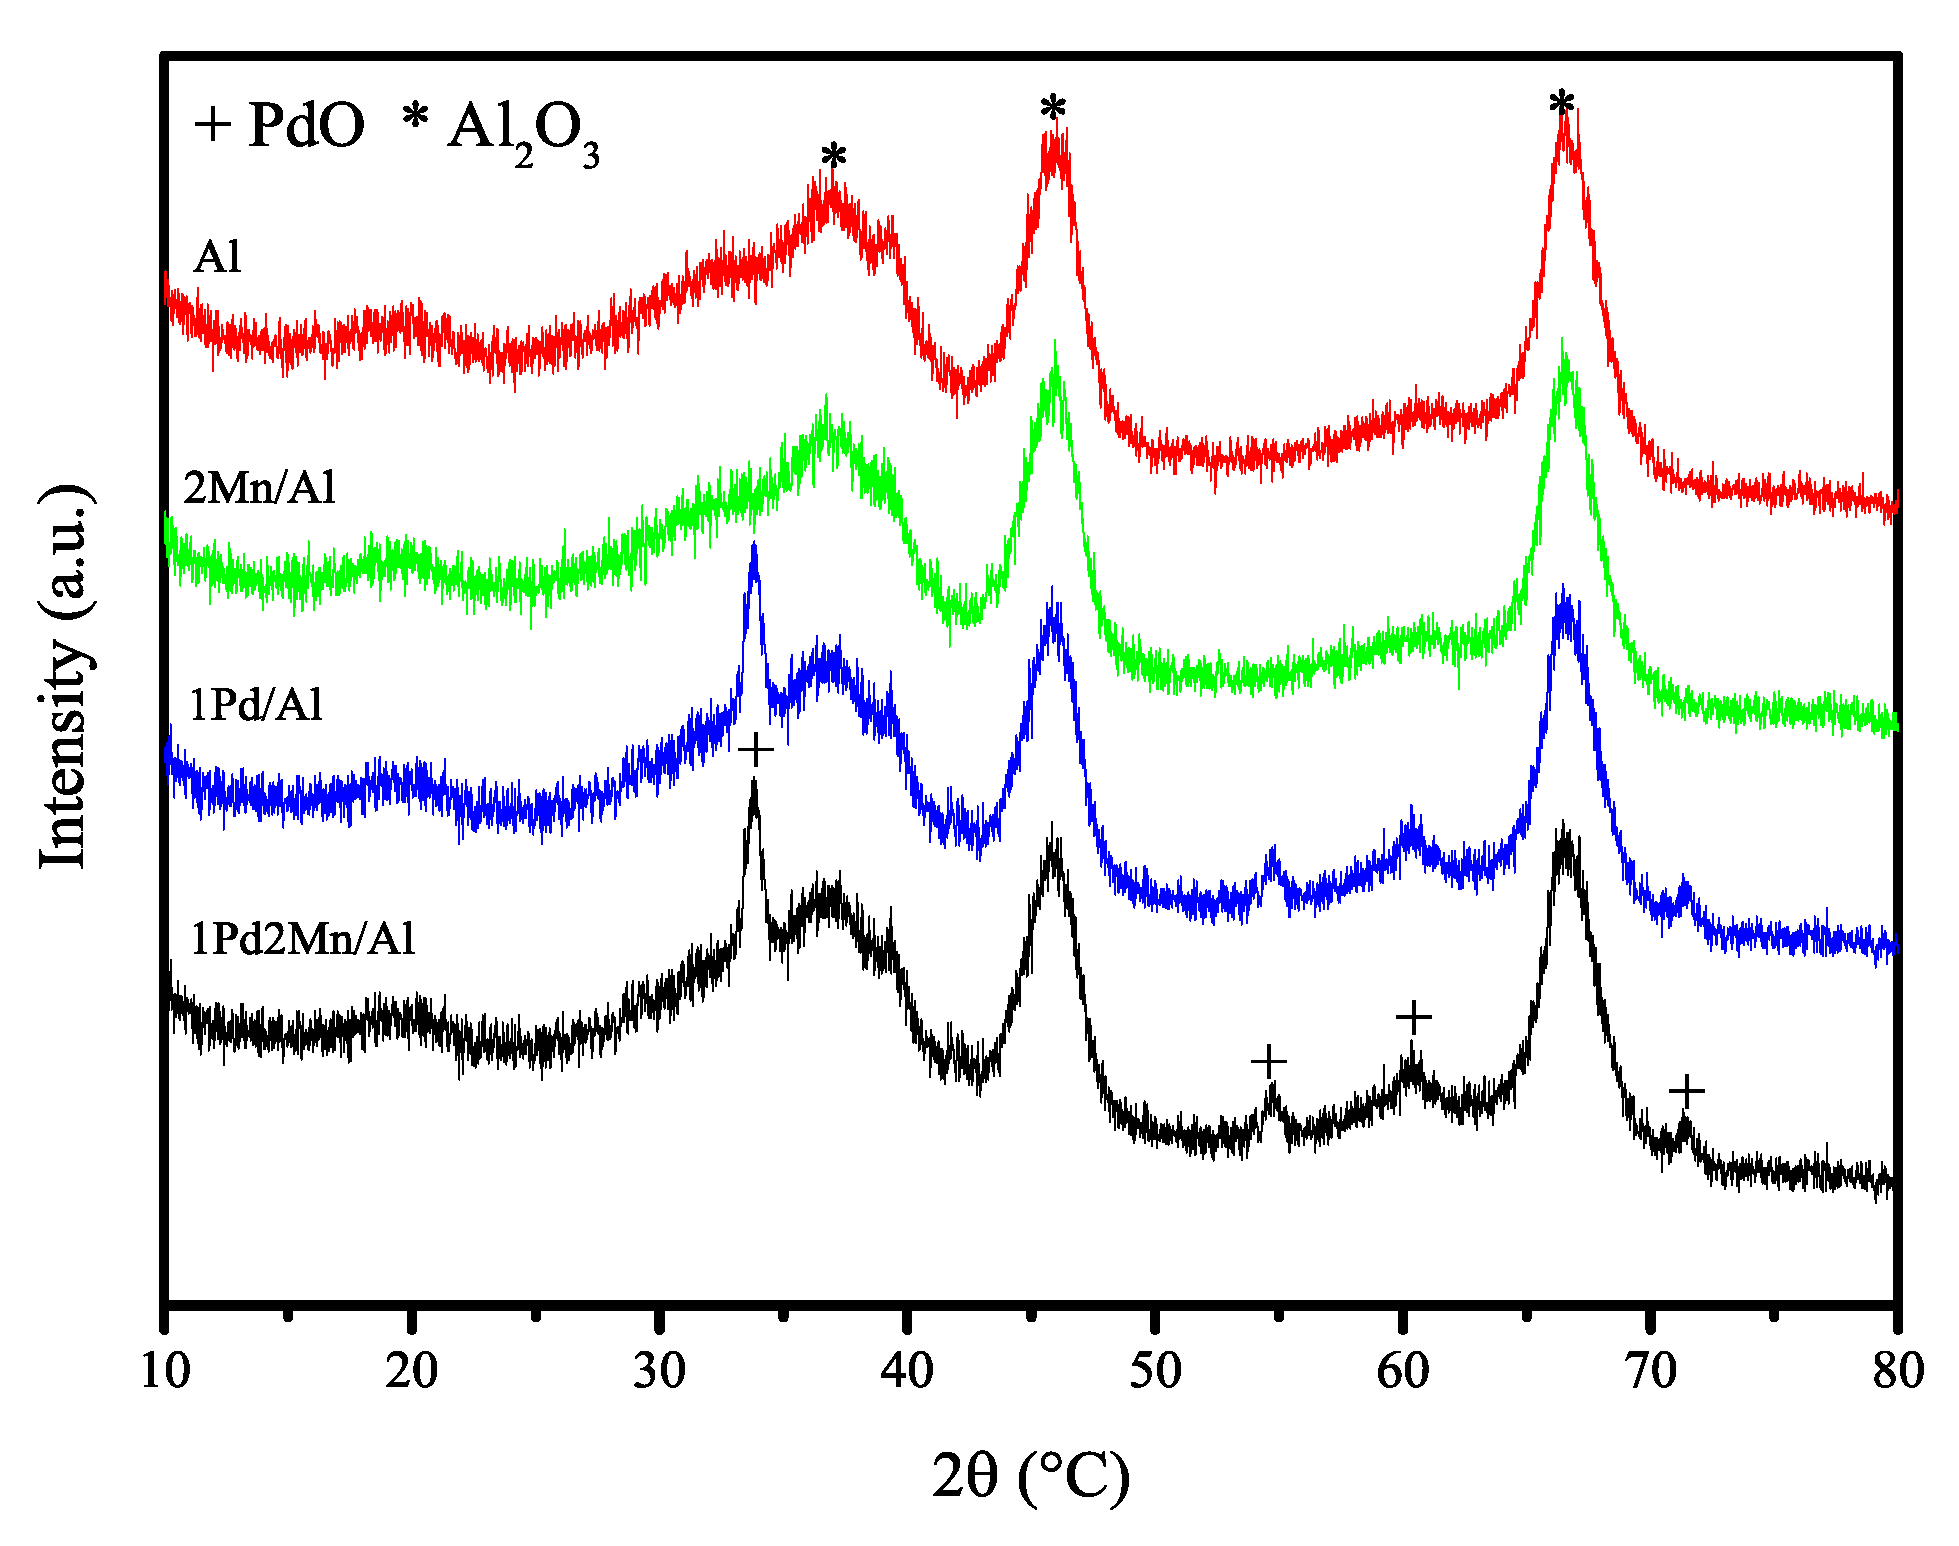
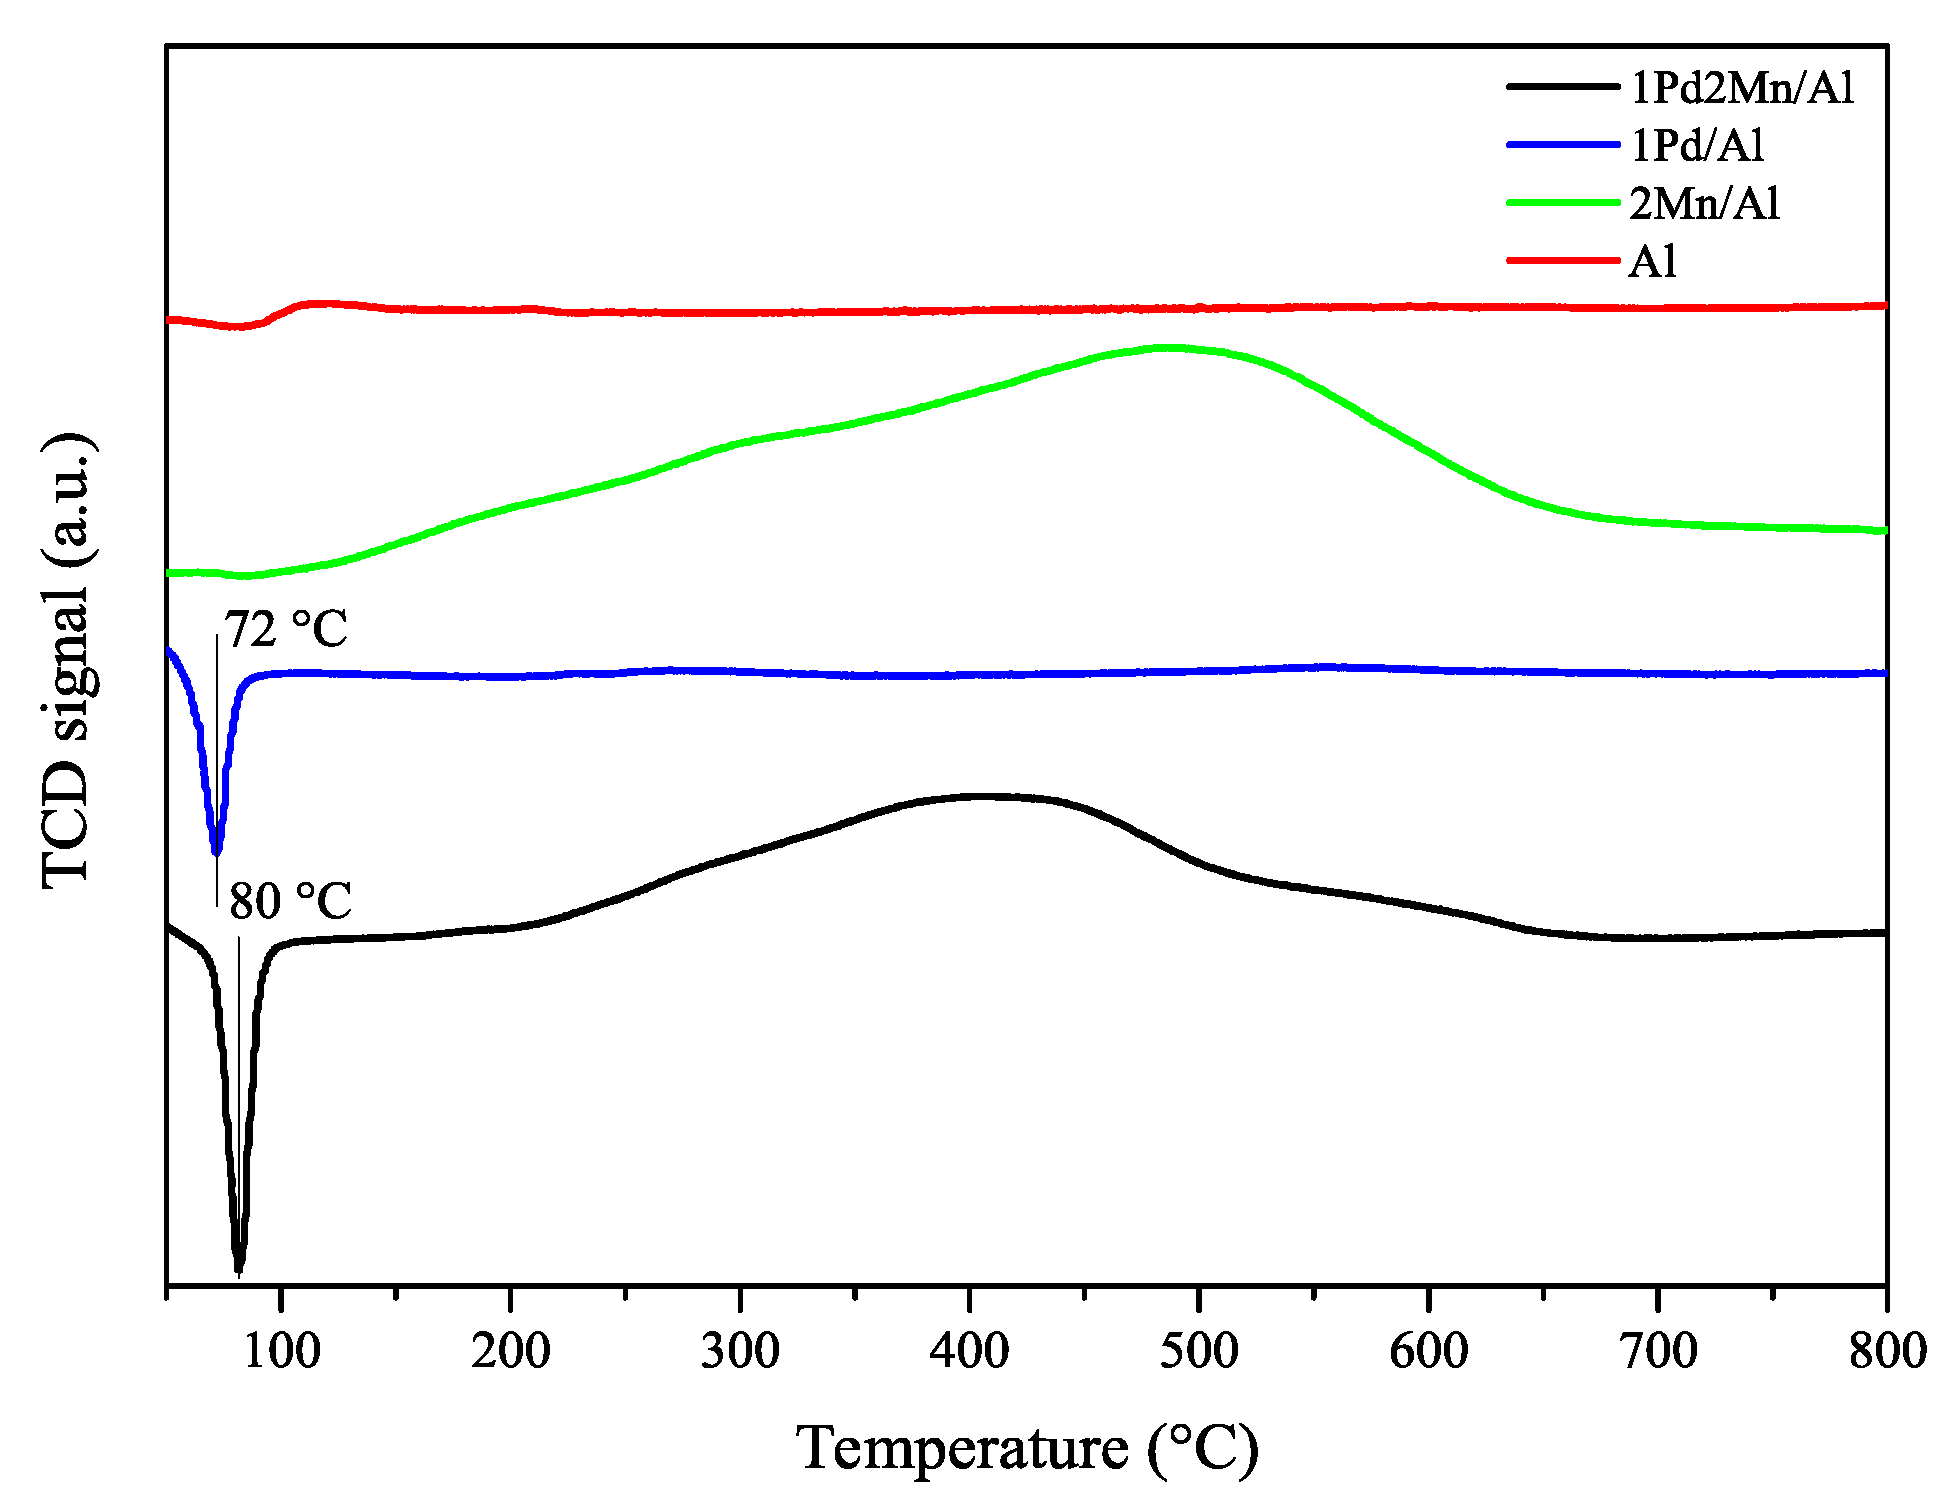
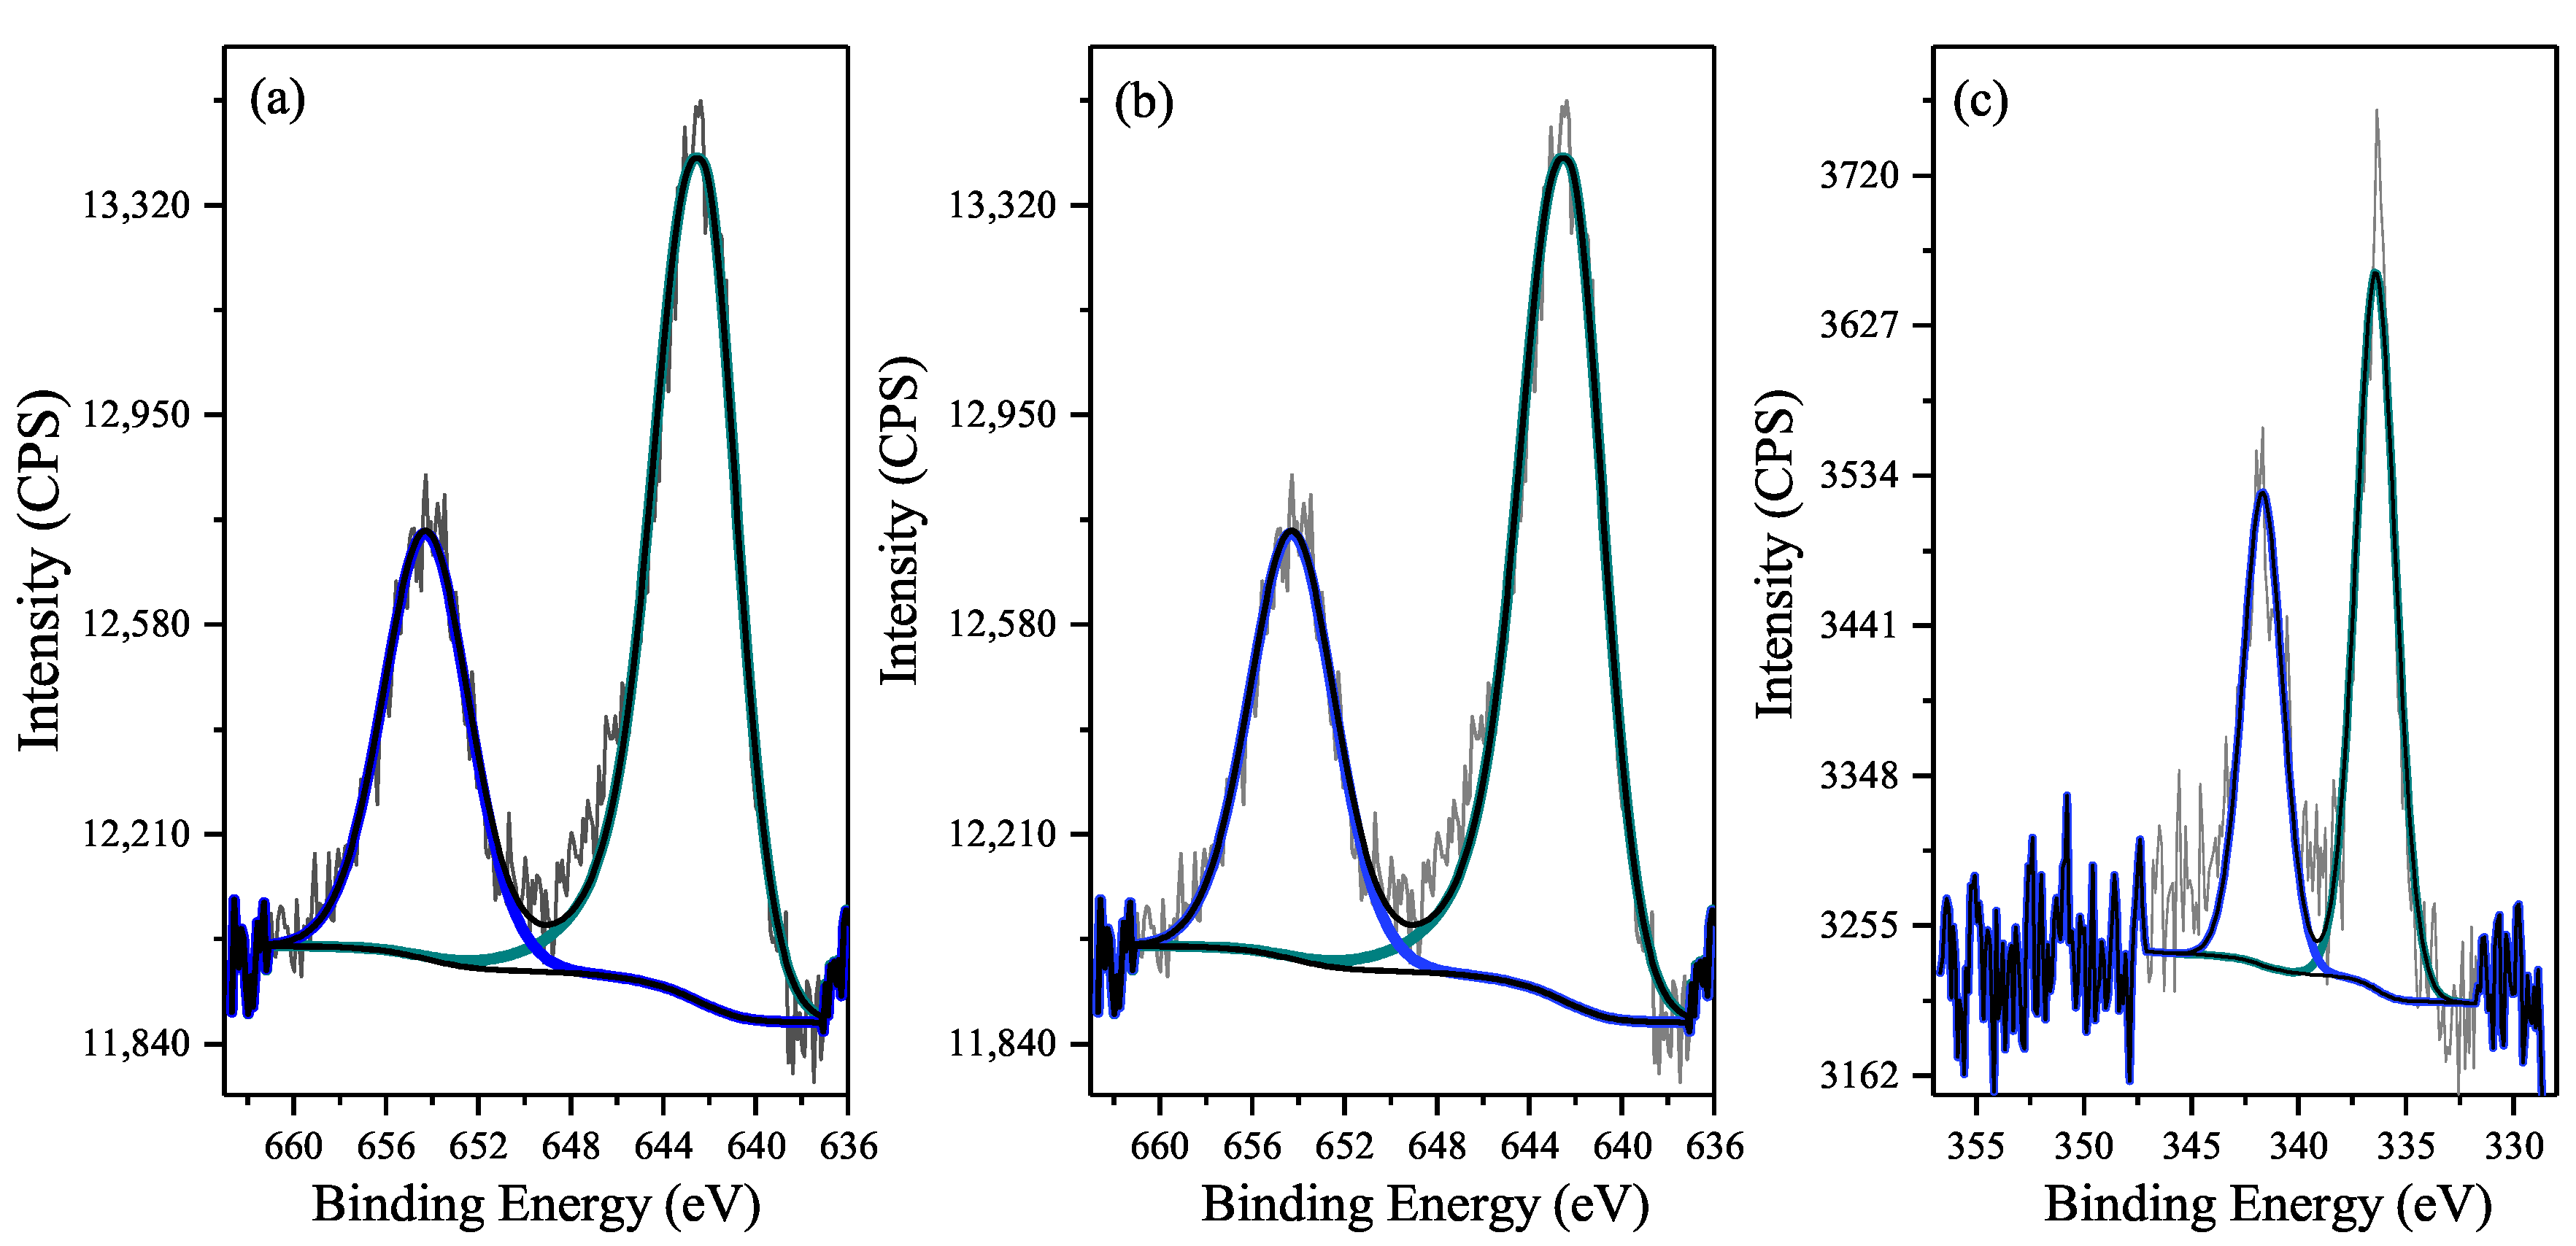
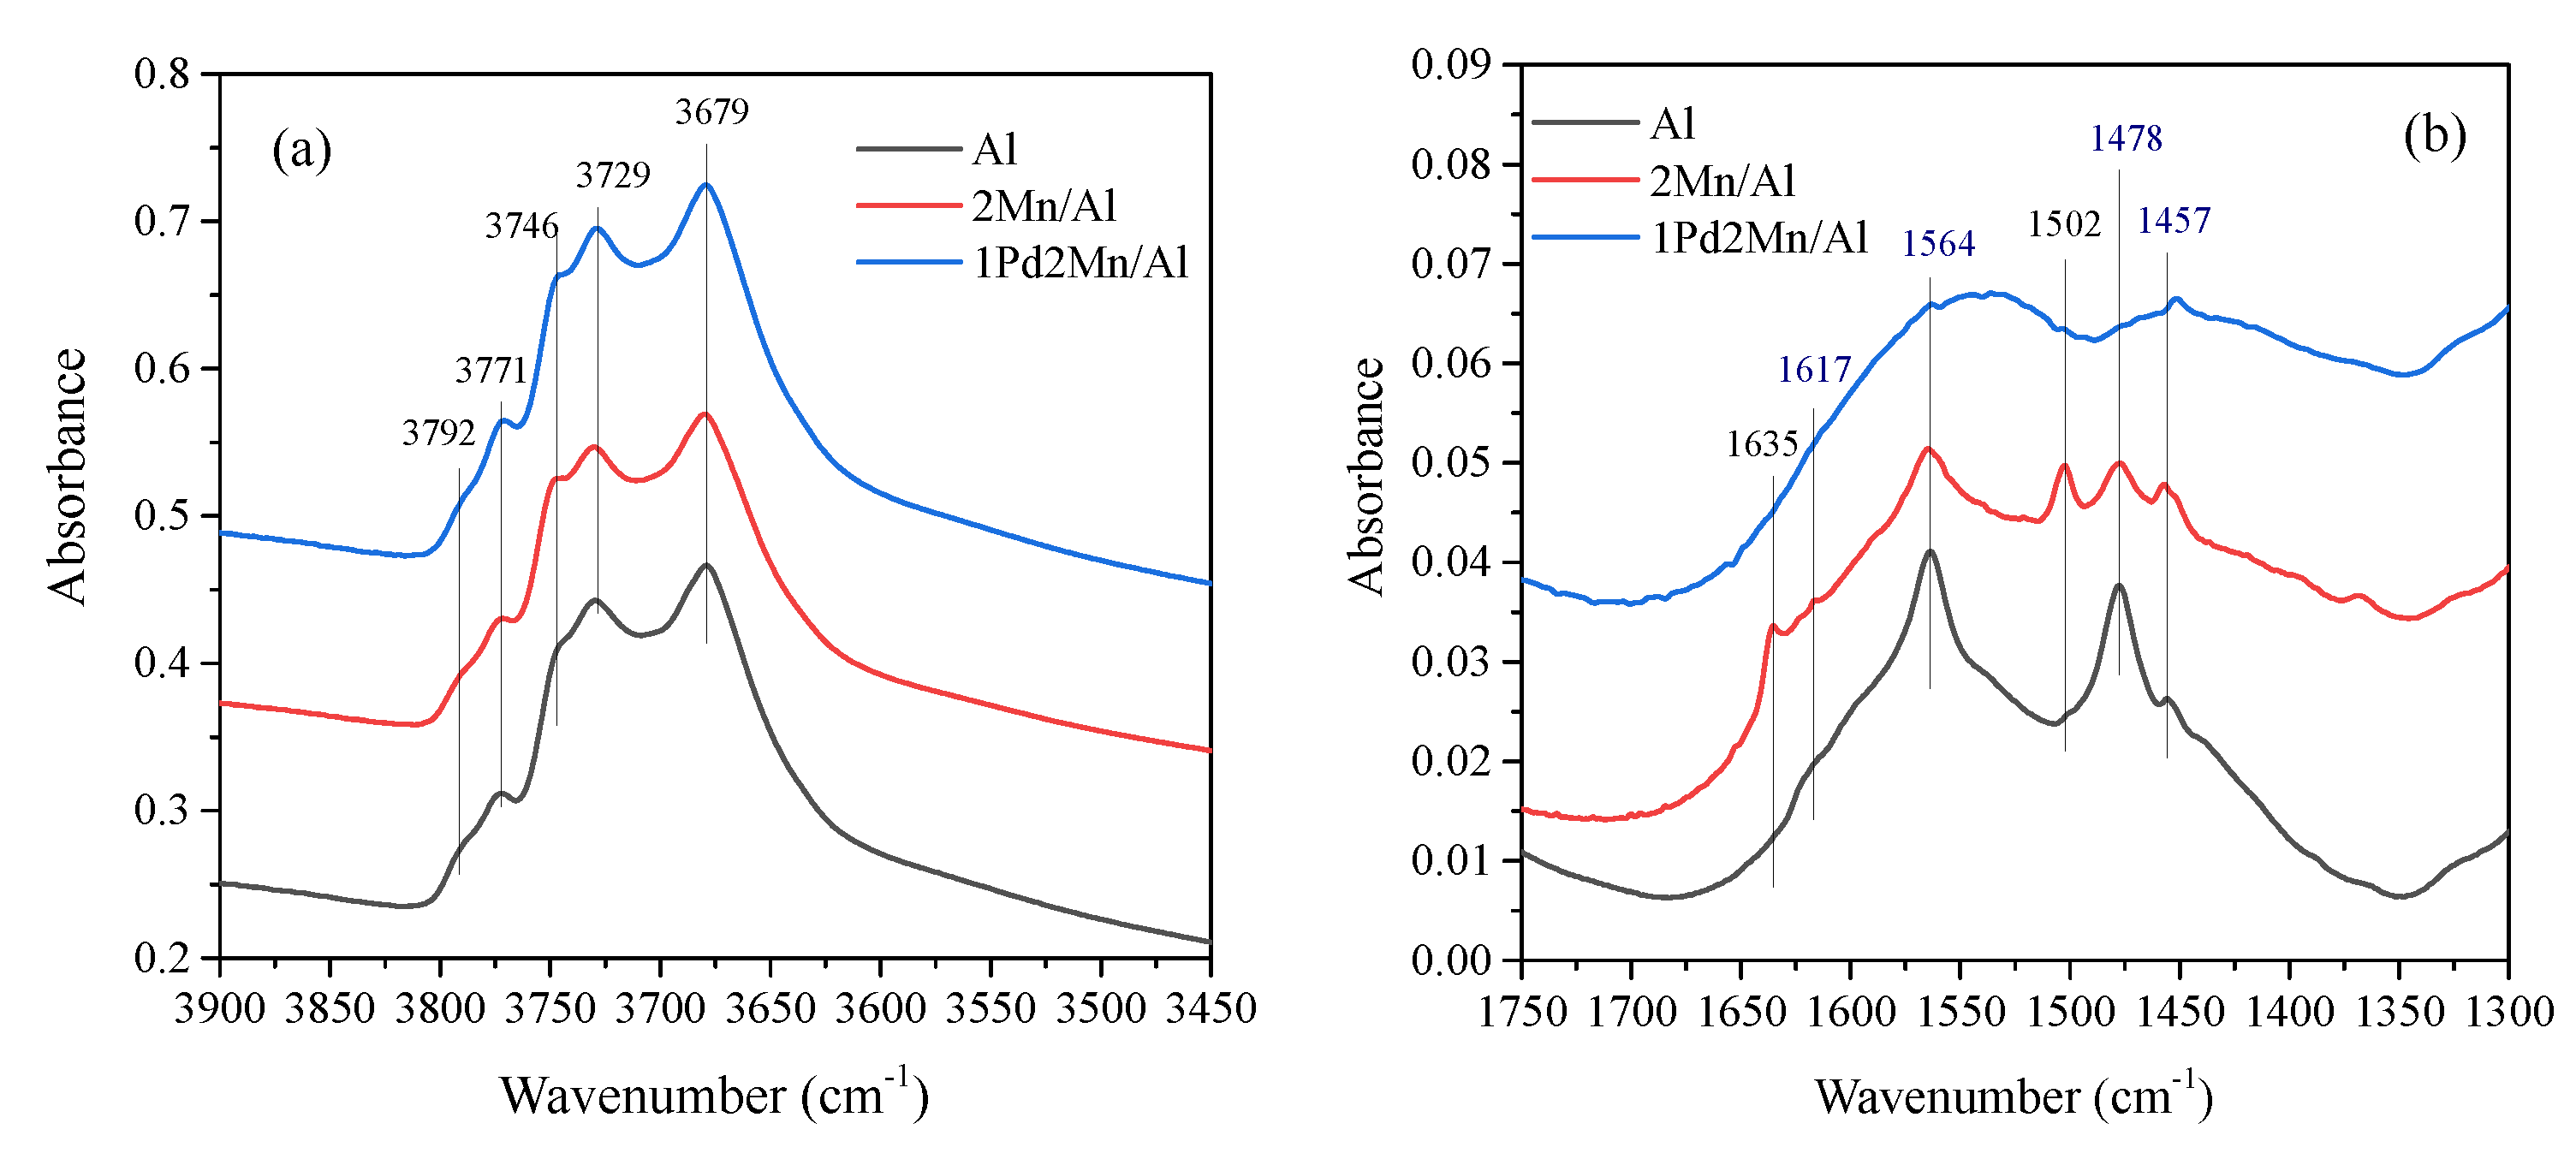
2.1. Catalyst Characterization Results

The physicochemical, textural, surface, and acidic properties of catalysts were studied in order to better understand the differences in the surface adsorption species. Thus, the textural properties and pore size distribution were firstly investigated by N2 adsorption/desorption measurements. Figure 1a shows the N2 adsorption/desorption isotherm and pore size distribution of the catalysts. All catalysts displayed a type-IV isotherm with H1 type hysteresis loops, according to the IUPAC classification, indicating a mesoporous structure with a narrow range of uniform mesopores where network effects are minimal [17]. As shown in Figure 1b, the pore size distribution curve determined by the BJH method from the desorption branch of the isotherm also confirmed the mesoporous structure of all materials, where Al had a tight distribution with an average diameter of 12 nm, while that of 1Pd2Mn/Al, 1Pd/Al and 2Mn/Al catalysts were of 14 nm (Table 1). A relatively broader pore size distribution was clearly observed for 2Mn/Al catalyst, which could be attributed to the introduction of manganese [18,19]. Table 1 shows the BET specific surface area, total volume pore and pore diameter of the four catalysts with different metal compositions. Thus, Al displayed the highest specific surface area whilst having the lowest pore volume and size. Moreover, the specific surface area decreased with the presence of metal particles, while the pore size increased.
Figure 2 shows the XRD patterns of different catalysts. The signal peaks at 37.6 ° , 45.9 ° and 67.0 ° assigned to γ -Al2O3 (JCPDS 29-0063) were observed in all cases, without important modifications, indicating that the addition of metal oxides did not change the crystallinity of the alumina. Nevertheless, new peaks at 34.1 ° , 54.9 ° , 60.5 ° and 71.3 ° appeared in the Pd-loaded catalysts, which indicated the formation of PdO (JCPDS 41-1107). Taking into account the low palladium loading in both catalysts, the high intensity of the palladium oxide peaks indicated that the PdO probably existed on the alumina support in the form of bulks. However, no characteristic peak representing manganese oxides was observed.
Examined by STEM-HAADF, 1Pd2Mn/Al and 1Pd/Al present bright spots corresponding to Pd particles (Figure 3). Their size varies from a few nm to several tens of nm, as traditionally observed for catalysts prepared by the impregnation of salts. On 1Pd2Mn/Al and 2Mn/Al, the Mn particles are not visible by STEM-HAADF, which is due to the lack of contrast between alumina and manganese oxide. EDX analysis of the pictures clearly shows some Pd on the bright spots and Mn on the other zones, showing that there is no direct interaction between either elements. From the HRTEM study and FT analysis, 1Pd2Mn/Al shows well-crystallized particles of PdO (tetragonal structure) and of MnO2 (orthorhombic structure), as confirmed by the JCPDS files. Some details are provided in the Supplementary Information.
The H2-TPR profiles of Pd-based catalysts illustrated in Figure 4 further proved that palladium oxide was indeed in bulk form. Bulk PdO was reduced with hydrogen to Pd(0) at room temperature and formed β -PdH, which decomposed at around 70– 80 ° C and thus gave negative peaks on samples loaded with palladium [20]. Nevertheless, both catalysts containing manganese oxides exhibited a reduction pattern over a broad temperature range as a convolution of overlapping peaks. The reduction of manganese oxides followed a path from MnO2 to MnO with Mn2O3 and Mn3O4 as intermediates [21]. The introduction of palladium modified the reduction profile of manganese-containing samples by means that were not known. Specifically, the reduction profile is shifted to lower temperatures for the sample containing palladium. The contribution of the noble metal therefore seems to favor the reduction rate of manganese-based material.
XPS analysis showed that due to the low concentration of Pd and Mn, the oxidation degree of Mn was difficult to measure as the Mn 3s was not visible due to the small quantity of Mn 2p [22]. The graphic (a) and (b) shown in Figure 5 corresponded to Mn (IV) and thus MnO2. The BE of Mn 2p was 642.3 ± 0.1 eV, and the BE of Pd 3d was 336.4 eV. The Pd 3d was a little lower than the reference, which was probably because the interaction of Pd with the alumina support modified the binding energy. Table 2 listed the relative atomic percentage of elements. The weight percentage of Mn was in agreement with the result of ICP (1.8 wt %), while that of Pd appeared to be much smaller compared to the ICP result (0.7 wt %). This was probably due to an inhomogeneous distribution of the metal or the fact that some Pd might be deep in the support instead of dispersed on the surface.
Aside from the oxidation degrees of metals, the mechanism of ozone decomposition and the inhibition effect of NOx could be associated with the metal sites and acid sites of alumina. In accordance, characterization of the acidic properties of materials is of fundamental importance. In this work, acid sites characterization was performed by means of pyridine adsorption monitored by infrared spectroscopy, which is a well-known method for alumina-based materials [23]. First, the spectra obtained after activation of the samples are shown in Figure 6 to illustrate the free hydroxyl groups region as well as the residual carbonate species, respectively. This information highlighted the initial surface state and the modifications of the alumina induced by Mn and Pd addition. In the region of ν (OH) vibrations, five main bands at about 3792, 3771, 3746, 3729 and 3679 cm 1 were observed. Theses free OH groups were assigned to the Ib, Ia, IIb, IIA and III OH-type of the Knözinger notation [24]. Minor modifications in band intensity among each sample were denoted, depending on Mn or Pd addition. More precisely, the band intensity of the most acidic OH groups (IIb, IIa and III, 3746, 3729, 3679 cm 1 , respectively) decreased with the addition of manganese. This result was coherent with the basic property of Mn. Surprisingly, the overall intensity of these ν (OH) bands is higher on 1Pd2Mn/Al. Especially the band at 3771 cm 1 , which was attributed to the Ia type linear group on tetrahedral alumina, was the most affected. This type of group is the most basic and is generally involved in the formation of hydrogen–carbonate compounds.
The carbonate zone (1400–1700 cm 1 ) is shown in Figure 6b. On alumina, the bands at 1564 and 1478 cm 1 might be attributed to the antisymmetric ν a s and symmetric ν s vibration of polydentate carbonates ( Δ ν = 86 cm 1 ) [25]. Two bands at 1617 and 1457 cm 1 were also observed. However, the attribution of these two bands was difficult, as the carbonates show a complex behavior on catalysts. Meanwhile, the increase in the frequency difference might be due to the increase in the number of cations present in the structure of these residual carbonates. The addition of Mn reinforced the intrinsic basicity, as the IR spectra related to residual carbonates were more defined and complex. For the 1Pd2Mn/Al, the spectra were quite different. The impregnation of palladium might have modified the properties brought by Mn. This could explain the observed intensity in the OH zone and the results following the pyridine adsorption, as presented below.
Pyridine was adsorbed (200 Pa at equilibrium) at room temperature and further evacuated at RT (Figure 7a). As expected, only pyridine coordinated to Lewis acid sites (LAS) was observed. The vibration mode of the cycle ν 19 b (1449 cm 1 ) and its associated area were used to quantify the number of total LAS with a molar extinction coefficient of 1.28 μmol 1 · cm 1 . The corresponding results, reported in Figure 7b, showed that the addition of manganese lowered the number of total acid sites. The opposite effect was observed for the 1Pd2Mn/Al sample. No discontinuity of the force or inversion of site quantity with the thermo-desorption was observed.
In Figure 7a, two ν 8 a bands can be distinguished at 1622 and 1613 cm 1 , which were previously assigned to pyridine coordinated to tetrahedral Al3+ (strong LAS) and to both tetrahedral Al3+ and an octahedral Al3+ (weak LAS) [26]. The influence of Mn and Pd species on the strength of LAS was assessed using the ν 8 a frequency deconvolution (Gaussian/Lorentzian) to provide a clearer view of the distribution of strong/weak acid sites (Figure S2—Supplementary Information). Results are reported in Table 3. The proportion of weak acid sites was predominant, and the addition of Mn and Pd increased the quantity of these sites. A redistribution of hydroxylation rate of the support was postulated with a contribution of the type IIa OH group (3729 cm 1 ) associated to Al (IV/VI) [24]. After Mn impregnation, the decrease in intensity of the IIa OH group could explain the liberation of coordinatively unsaturated sites associated to weak LAS. As for 1Pd2Mn/Al, the catalyst contained more sites in total, and its weak sites were reinforced probably because of the minor modification of the catalyst by palladium.

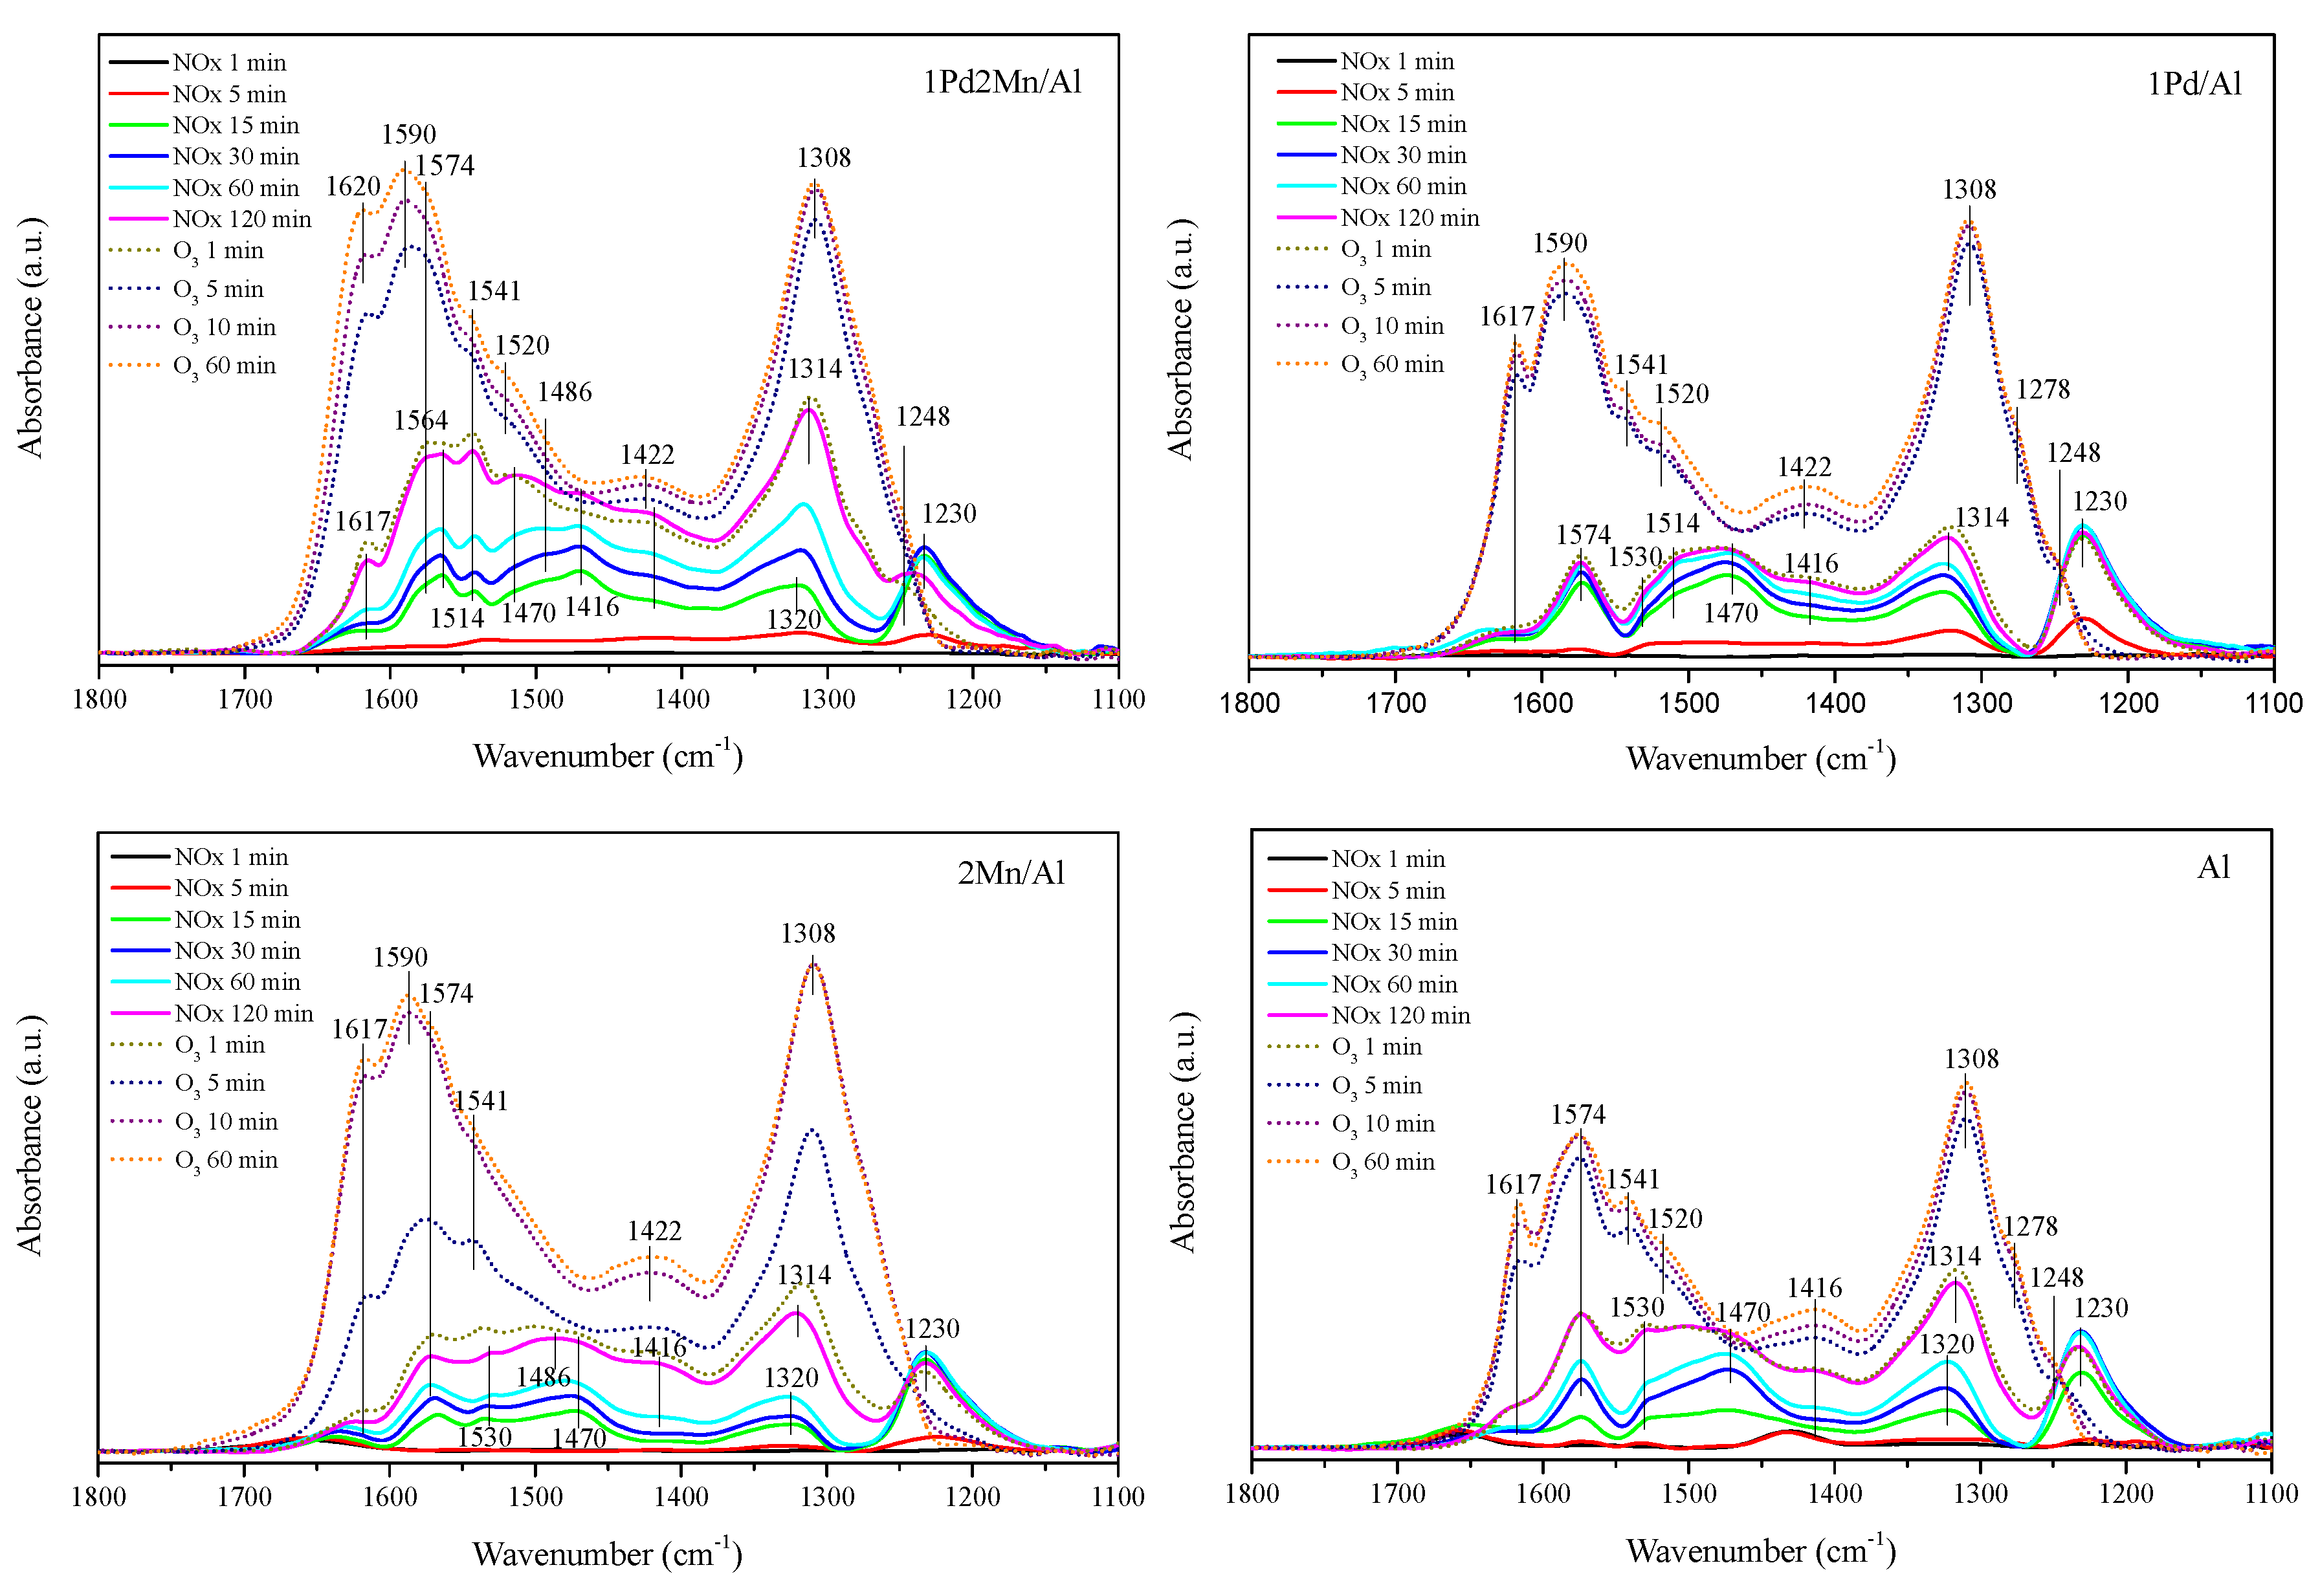
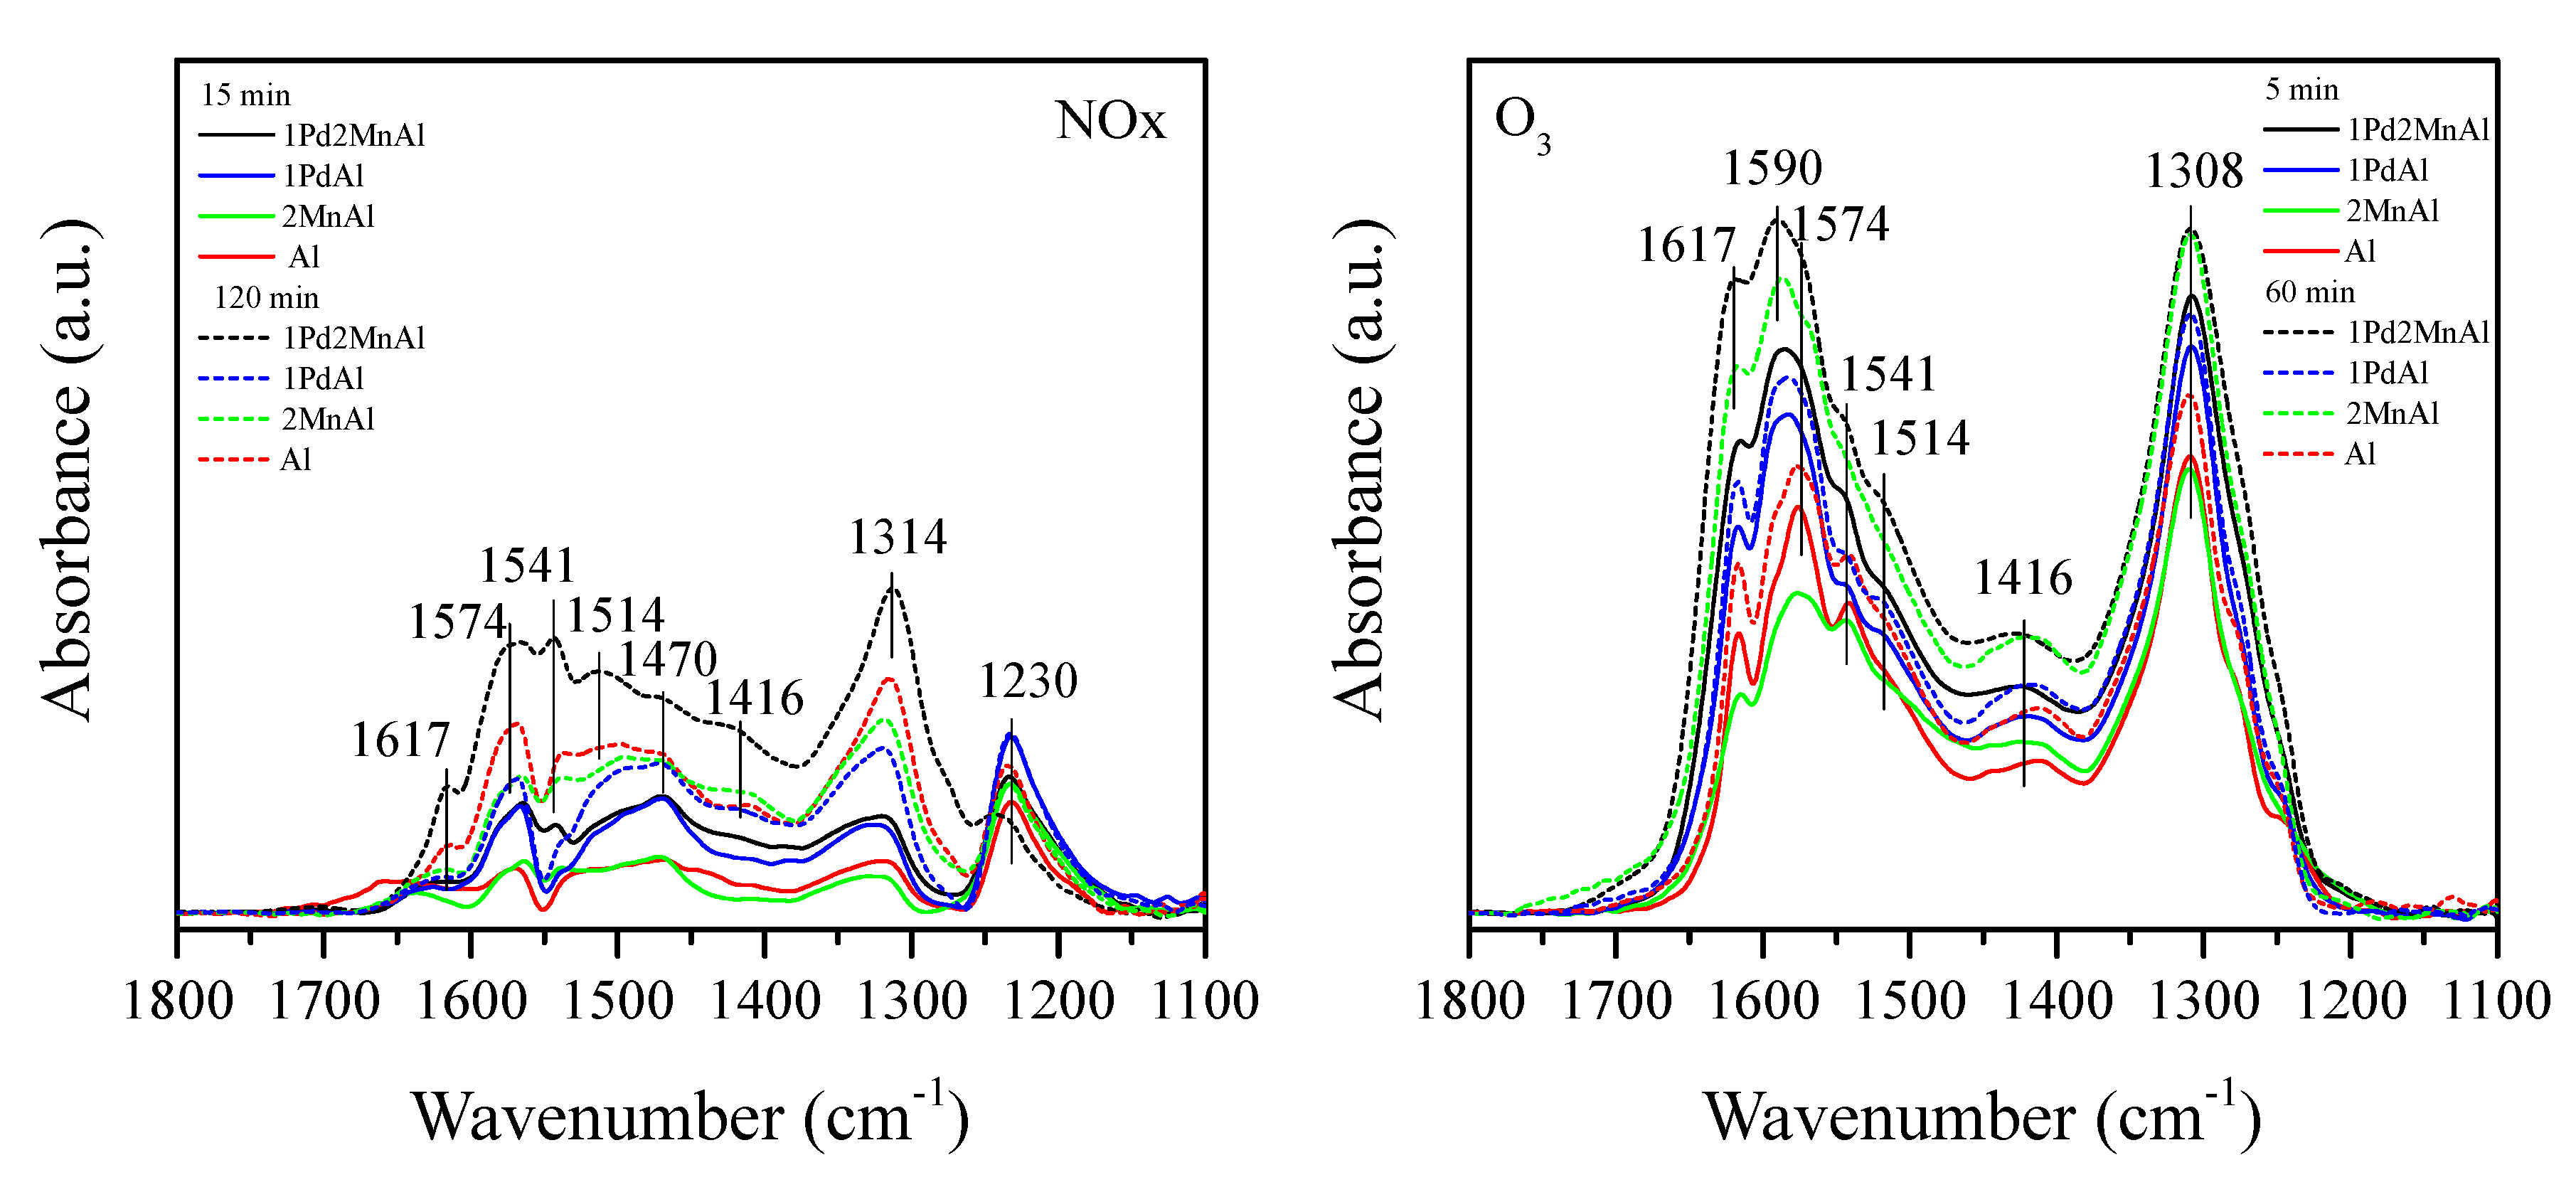
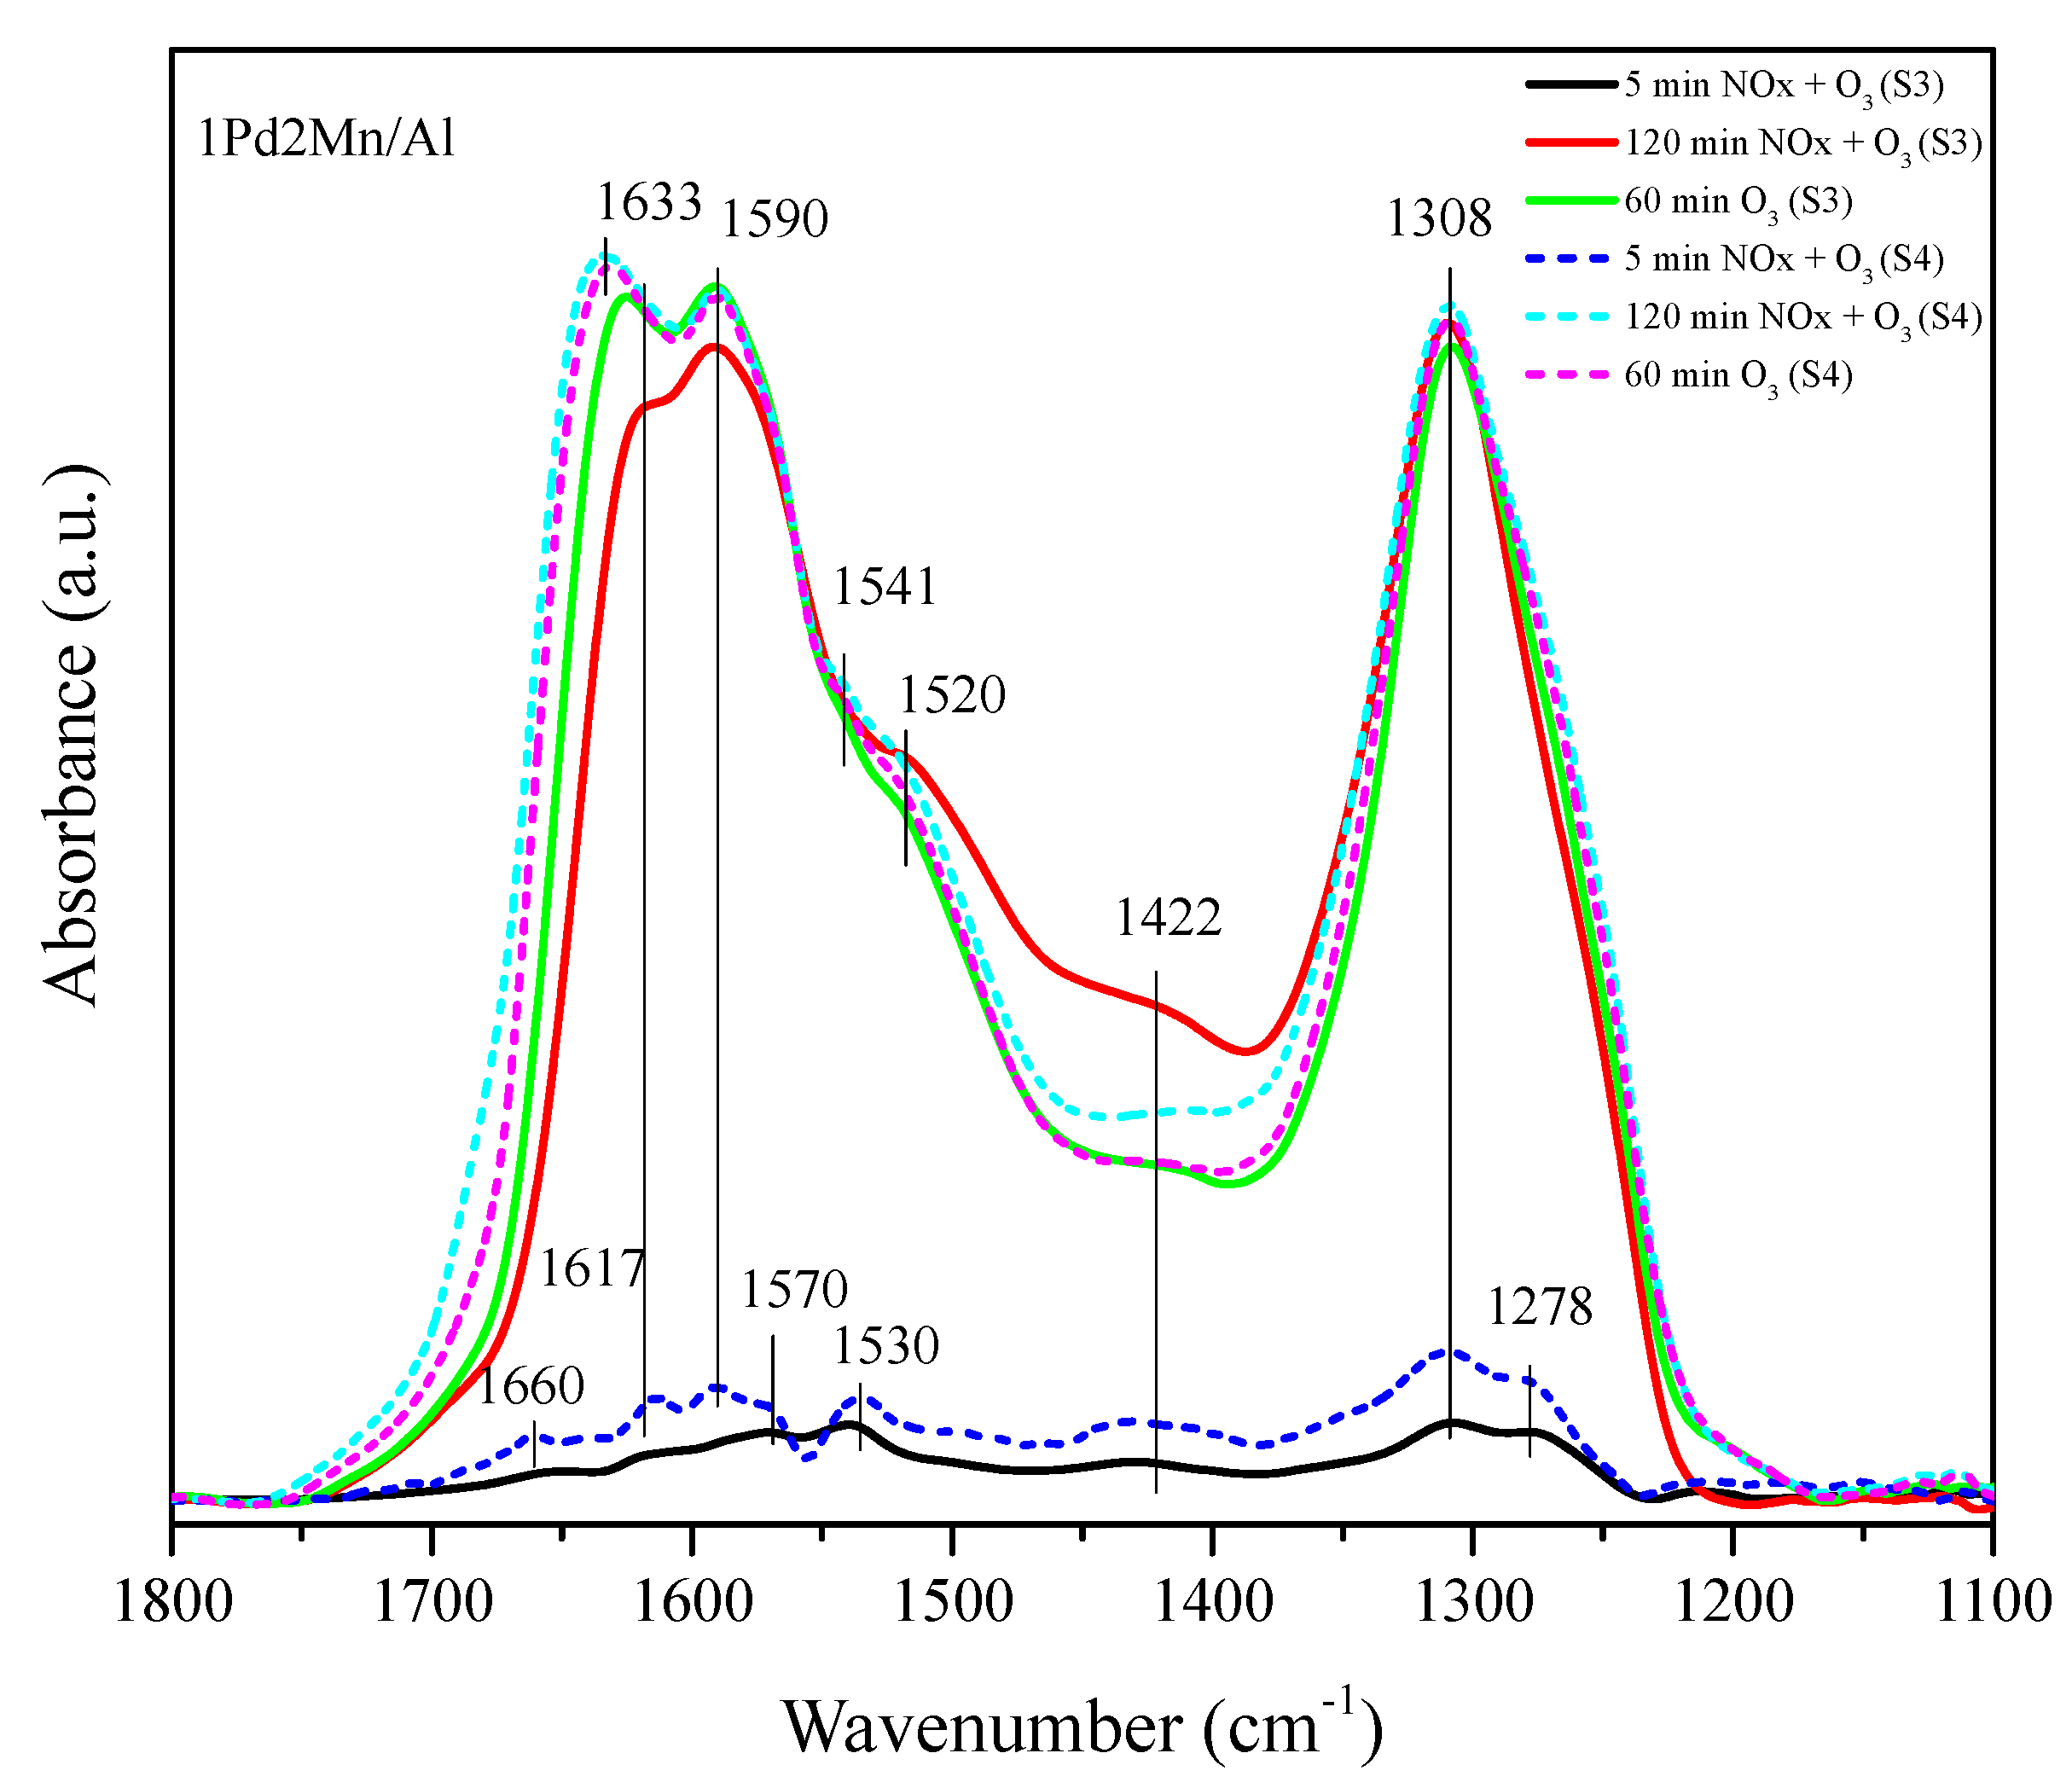
2.2. In Situ DRIFTS Measurements

In situ DRIFTS analysis was carried out under the sequences listed in Table 5 (Experimental section) in order to elucidate the competitive adsorption/reaction mechanism that took place during the sequential or simultaneous catalyst exposure to NOx and ozone pollutants. To study the species on the catalyst surface, blank spectra of catalysts were taken under 20 mL/min of helium at 40 ° C . Other spectra under different gas environments were subtracted by the blank spectra of the corresponding catalyst using OMNIC software to obtain the characteristic bands of surface species. The subtracted results were further adjusted by the creation of a baseline, subtraction by baseline and smoothing using Origin to give well-defined and illustrated graphs. Some of the possible surface species and their characteristic bands are listed in Table 4. The DRIFTS spectra of NO/O2 adsorption on 1Pd2Mn/Al, 1Pd/Al, 2Mn/Al and Al at 40 ° C for 120 min (solid lines) prior to exposure of ozone (dash lines), which correspond with the above-mentioned Sequence 1, are shown in Figure 8. The aim of this first approach was to have a clear visualization of the evolution of adsorbed surface species versus time over the surface of different catalysts to understand their stability and the velocity of their formation as well as to confirm the inhibition effect of nitrogen oxides on ozone decomposition. Note that ozone has a basic property and tends to occupy both strong and weak Lewis acid sites of alumina according to reactions (1)–(3), where * is added to represent the adsorbed species [27].
O 3 + 2 [ A l ] * [ A l ] O 2 + [ A l ] O
[ A l ] O 2 + [ A l ] * 2 [ A l ] O
2 [ A l ] O O 2 + 2 [ A l ] *
Moreover, oxygen molecules can also weakly adsorb on the catalysts following reaction (4), but such adsorption is less favored than that of ozone due to the fact that the basicity of oxygen molecule is weaker than that of ozone.
O 2 + [ M ] * [ M ] O 2
To analyze the IR spectra, the bands were compared to the characteristic peaks of N- and O-adsorbed species reported in Table 4. Nitrogen oxides, however, are relatively acidic and would thus occupy the weak Lewis acid sites of alumina but not the strong Lewis acid sites [37,38]. Both ozone and NOx can also coordinate to active metal sites of manganese and palladium [6,39]. Thus, NOx adsorption on 1Pd2Mn/Al (the first step in this sequenced adsorption) indicated the formation of ionic and bridged nitrites (1230, 1320 cm 1 , respectively [28,31,32]), which started to transform into other N-species after 30 min. The transformation of ionic and bridged nitrites could follow the general Equations (5) and (6) with (NO3) representing all possible nitrate compounds.
2 N O 2 + O 2 + 2 [ M ] * 2 [ M ] ( N O 3 )
2 [ M ] O N O [ M ] + O 2 2 [ M ] O N O O [ M ]
The formation of monodentate nitrites (in the range of 1416–1422 cm 1 ) was also observed [29,30], which did not decompose or transform into other species in O2 atmosphere, meaning that reaction (7) could not take place.
2 [ M ] O N O + O 2 2 [ M ] O N O 2
The formation of monodentate nitrates (1314, 1470, 1514 cm 1 ), bidentate nitrates (1541, 1564, 1574 cm 1 ) and bridged nitrates (1617 cm 1 ) was also observed [28,29,30,33,34,35], all of which were stable on the surface. After 120 min, the main species on the catalyst surface were monodentate, bidentate nitrates and monodentate nitrites. This suggested that monodentate nitrites cannot be directly oxidized into nitrates by oxygen in current condition. However, ionic and bridged nitrites could partially transform into other nitrogen species such as monodentate and bidentate nitrates. The adsorption of NO/O2 until saturation of the catalyst surface experiment was also conducted, which showed that the transformation could be total given enough time (Figure S3—Supplementary Information). Thus, the intensity of the band at 1230 cm 1 , for example, increased during the first hour and then continued to decrease until complete disappearance after saturation, confirming the instability of ionic nitrites (and their transformation) on the 1Pd2Mn/Al catalyst surface. However, after saturation (4 h of NOx/O2 exposition), the monodentate nitrites and monodentate, bidentate and bridging nitrates were still stable on catalyst surface. Similar DRIFTS spectra were obtained on bare alumina (Al) and 1Pd/Al catalyst compared to that of NOx adsorption on 1Pd2Mn/Al. Characteristic bands of ionic, monodentate and bridged nitrites as well as monodentate, bridged and bidentate nitrates were observed. Only two vibration bands associated to bidentate nitrates were nevertheless observed for Al and 1Pd/Al at 1530 and 1574 cm 1 , indicating that the other above-mentioned bidentate nitrate bands (1541, 1564 cm 1 ) might be connected to different sites on the surface of the 1Pd2Mn/Al catalyst. Thus, the bidentate nitrates with bands at 1530 and 1574 cm 1 might be the ones adsorbed on weak Lewis sites of alumina support via reaction (8).
[ A l 3 + ( I V / V I ) ] * + N O + O 2 [ A l 3 + ( I V / V I ) ] O 2 N O
Note that reaction (8) could also exist on the other three catalysts, and the bands of such bidentate nitrates could be masked, as other bands of bidentate nitrates coordinated on metal sites were stronger. Moreover, the band at 1486 cm 1 observed in 2Mn/Al spectra (Figure 8) may be due to the vibration of NO2 of nitrates, which were connected to manganese by reaction (9), since this band was slightly evidenced on 1Pd2Mn/Al spectra, but it was not observed on Al. Similarly, the band at 1514 cm 1 may be attributed to the vibration of NO2 of nitrates, which were connected to palladium by reaction (10), as this band was clearly observed on 1Pd2Mn/Al and 1Pd/Al catalysts but not on Al or 2Mn/Al.
2 [ M n ] * + 2 N O + O 2 2 [ M n ] O N O 2
2 [ P d ] * + 2 N O + O 2 2 [ P d ] O N O 2
Furthermore, the DRIFTS spectra of O3 adsorption after NOx exposure on 1Pd2Mn/Al catalyst (second step in sequenced adsorption during Sequence 1) showed the disappearance of the band at 1230 cm 1 , indicating that the ionic nitrites were completely oxidized into other N-species. This oxidation rate was much more rapid than that with oxygen (Figure S4—Supplementary Information), suggesting that ozone played a more efficient role toward the conversion of NO into NO2. Comparing the DRIFTS spectra of different catalysts under the same operating condition, a more rapid oxidation rate can also be observed for 1Pd2Mn/Al, in which the band associated to the ionic nitrites disappeared after only 1 min of O3 exposition, while at least 5 min were required to transform these species over the other catalysts. These results suggested that the combined or combined effect of Mn and Pd active sites is beneficial for NO2 formation. Studies have proposed a Langmuir–Hinshelwood mechanism model and an Eley–Rideal mechanism model for the catalytic oxidation of NO by O2 [40,41]. However, the mechanism of NOx oxidation by O3 is much less elucidated. Lin et al. proposed a Langmuir–Hinshelwood mechanism where the NO oxidation by ozone takes place on manganese oxides with a mainly oxidation degree of +3 [39]. Thus, comparing to the mechanism proposed by Lin et al. and considering the XPS results obtained in the present study, where the main composition of synthesized manganese oxide and palladium-based catalysts were MnO2 and PdO, the reactions could follow the path below:
3 O 3 + 2 [ M n 4 + ] 2 O 2 [ M n 7 + ] + O 2 + 3 O 2
2 O 2 [ M n 7 + ] + O 2 + 3 ( N O 2 ) [ M n ] 3 ( N O 3 ) [ M n ] + 2 [ M n 4 + ]
O 3 + [ P d 2 + ] O 2 [ P d 4 + ] + O 2
O 2 [ P d 4 + ] + ( N O 2 ) [ P d ] > ( N O 3 ) [ P d ] + [ P d 2 + ]
where (NO2) and (NO3) represent nitrites and nitrates in general. On the other hand, a new band at 1308 cm 1 , which could be attributed to either atomic oxygen, monodentate nitrates or both, was clearly observed after 5 min of O3 exposure for all the materials (Al support and catalysts). In order to compare the formation of adsorbed species on different catalysts at a fixed time, part of the spectra from Figure 8 were extracted and presented in Figure 9 with a common scale. Thus, the comparison of NOx adsorption on different catalysts at 15 min and 120 min showed that the formation of ionic nitrites was faster in the presence of transition and noble metals (Mn and Pd), but these nitrites were more stable on alumina support, as the intensity of the band at 1230 cm 1 was higher at 120 min than that at 15 min, contrary to other metal oxides-based catalysts. This stability shown on alumina suggests that reaction (4) was more rapid when [M]* surface catalyst sites are constituted by manganese or palladium. Interestingly, as for the bands for all nitrates (at 1470, 1541, 1564 and 1617 cm 1 ), within the first 15 min, manganese-based catalysts showed a strong capacity of the formation of nitrates. This result is coherent with the basic character of Mn, according to the decrease of acidic properties with the Mn addition in pyridine IR results. After 120 min, even though 2Mn/Al and 1Pd/Al catalysts spectra showed a lower intensity than alumina support, the 1Pd2Mn/Al catalyst spectra exhibited much more pronounced bands, indicating a possible combined effect between palladium and manganese on the formation of nitrates and thus the oxidation of NO into NO2. This assumption is in agreement with the previous one related to the rapid disappearance of ionic nitrites bands on 1Pd2Mn/Al. Under the operating conditions of Sequence 1, the monodentate nitrites and most of the nitrates seem to be stable on the catalysts surface, but since the band at 1308 cm 1 could be either atomic oxygen or monodentate nitrates or both [36,42], whether the liberation of NO2 from monodentate nitrates took place remained to be seen. However, the above-mentioned possible regeneration of the catalyst was susceptible to have not been achieved since monodentate nitrites, bidentate nitrates and bridging nitrates were not purged from the catalyst surface by ozone and continued blocking the active sites. Therefore, this first approach of in situ DRIFTS measurements spotlighted the oxidizing effect of ozone, favoring the NO oxidation into NO2 and so, the formation of nitrates. However, these nitrates species, and some nitrites, seemed to still adsorb on the catalyst surface after several minutes of O3 exposure, suggesting an inhibition effect of adsorbed NOx species for ozone decomposition.
In order to corroborate if such an inhibition effect would still be present if the catalysts were already pre-oxidized by ozone, a second approach—Sequence 2—was carried out. The catalysts were pre-oxidized by ozone prior to the NOx adsorption. Spectra of the pre-oxidized catalyst surfaces are shown in Figure S9—Supplementary Information. The corresponding spectra are shown in Figure 10. The ionic nitrite formation (band at 1230 cm 1 ) was not observed upon the introduction of NO/O2 on any catalyst surface. This confirmed that the surface had indeed oxidizing property thanks to O3. This oxidizing property could be the result of atomic oxygen (1320 cm 1 ) generated by reaction 2 or the result of O2− generated by reaction 11. Nevertheless, once the adsorbed oxidants were consumed through time under NOx converting nitrites into nitrates (or NO into NO2) rapidly, ionic nitrite species (1230 cm 1 ) began to form on the catalyst surface. Thus, after 15 min, the behavior of the catalyst resembled that of the previous corresponding experiments, as shown in Figure 8 and Figure 9. DRIFTS spectra of the second ozone adsorption that followed did not show any significant difference with that of Sequence 1, as better illustrated in Figure S5—Supplementary Information. Therefore, the results of this sequence indicate that the adsorption of ozone prior to that of NOx would not prevent the eventual inhibition effect of nitrogen oxides on the ozone abatement, even though it could alter the behavior of the catalyst during the beginning of NOx adsorption.
DRIFTS spectra obtained from Sequence 3, corresponding to the competitive co-adsorption of NOx and ozone at the same time prior to a possible purge of the surface by ozone, are presented in Figure 11. These spectra clearly showed that when NOx and O3 went through co-adsorption, due to ozone’s powerful oxidizing effect, ionic nitrites (band at 1230 cm 1 ) were not stable on the catalyst surface whatever the catalyst formulation was. They were either not formed at all, as NO was already oxidized into NO2, or they are transformed rapidly into nitrates. The formation of nitrates seems to be also much faster than that under NO/O2 feed, as shown in Figure 12. Interestingly, once the NOx feed was cut and only ozone was introduced into the DRIFTS reaction chamber, the intensity of the band at 1416–1422 cm 1 decreased for all catalysts containing active metals. This phenomenon was better illustrated in Figure S8—Supplementary Information. Meanwhile, the pure alumina support did not show this behavior. Neither did all the catalysts during Sequence 1, in which the catalyst surface was exposed to NO/O2 prior to the incorporation of ozone, as shown in Figure 8. As mentioned before, Lin et al. [39] has studied the oxidation of NO into NO2 by ozone on manganese and found that the change of oxidation state of metals could be the force that drove the transformation of nitrites into nitrates. Thus, the decrease of intensity in the band at 1416–1422 cm 1 could be explained by reactions (11), (13), (15) and (16).
2 O 2 [ M n 7 + ] + O 2 + 3 O N O [ M n ] 3 O 2 N O [ M n ] + 2 [ M n 4 + ]
O 2 [ P d 4 + ] + O N O [ P d ] O 2 N O [ P d ] + [ P d 2 + ]
Meanwhile, the atomic oxygen created by reaction (2) still could not completely oxidize monodentate nitrites. Nevertheless, these results indicated that when the catalysts went through the co-adsorption of nitrogen oxides and ozone and then were flushed by an ozone flow not containing NOx, reactions (15) and (16) could take place, and monodentate nitrites could be oxidized by ozone on transition metal sites. Such a transformation might be able to liberate some sites previously occupied by nitrites and thus partially regenerate the catalyst. This assumption could explain the phenomena observed by Touati et al. [16] that the catalytic conversion of ozone can be restored after the inhibition of nitrogen oxides by ozone purge. A similar catalyst sites regeneration was observed under Sequence 4, in which the surface was previously exposed to ozone before the competitive co-adsorption of NOx and ozone. The spectra of NOx and O3 co-adsorption after 5 min and 120 min and of O3 adsorption on 1Pd2Mn/Al after 60 min of both Sequence 3 and Sequence 4 were extracted and reassembled in Figure 13. It can be observed that after 5 min of NOx + O3 exposure on the pre-oxidated catalyst surface in Sequence 4, the formation of nitrates (1278, 1530, 1570 and 1653 cm 1 ) was faster than in Sequence 3, as the oxidizing property of the sample surface was stronger. After 120 min of exposure under NOx and O3, the intensity of the band at 1308 cm 1 is the same in both sequences, but the intensity of the band at 1422 cm 1 which was attributed to monodentate nitrites was much higher in Sequence 3 than in Sequence 4. These results indicate that the pre-adsorbed ozone had a promoting effect toward the oxidation of monodentate nitrites. At the same time, the formation of nitrates (1633 cm 1 ) was more rapid on a pre-adsorbed ozone surface. Moreover, 60 min of ozone adsorption following the co-adsorption step resulted in a same degree of decrease in monodentate nitrites (1422 cm 1 ) in both Sequence 3 and Sequence 4, implying that the pre-adsorption of ozone might have little influence on the final regeneration of the catalytic surface.
Therefore, running different sequences was helpful to elucidate the adsorbed species and the possible reversible inhibition of NOx by ozone. Further experiments using wet air instead of dry air would be helpful, since water can affect the ozone decomposition, as shown in a recent publication with Pd/TiO2 catalysts [43]. Furthermore, water can also impact the competition of ozone and NOx at the surface [44]. In this work, particular attention is paid to the mechanisms of O3-NOx interactions determined by spectroscopic study. The study in absence of water allows a first mechanistic approach. The role of water will be the focus of a future project.

3. Experimental Section

3.1. Catalyst Preparation

The boehmite sol was prepared from a commercial powder: Disperal P2 (72% Al2O3, V p o r e = 0.5 cm 3 /g, Sasol GmbH, Hamburg, Germany ) by a sol–gel method [45]. First, 2.78 g of the powder was added slowly into 40 mL of HNO3 solution (pH = 4). The sol was stirred at room temperature for 30 h followed by a slow addition of 3.49 g of Pluronic F-127 (poly(ethylene oxide) 106 -poly(propylene oxide) 70 -poly(ethylene oxide) 106 , Sigma-Aldrich, Merck, Darmstadt, Germany). The mixture was stirred at room temperature for 24 h. The ratio between the number of ethylene oxides and aluminum atoms (EO/Al) was maintained at 1.5. The addition of surfactant was reported to help form pores with larger diameters and obtain a better dispersion of supported metal particles [45]. Four catalysts, denoted as 1Pd2Mn/Al, 1Pd/Al, 2Mn/Al, and Al, were synthesized by dissolving in the suspensions the corresponding amounts of palladium (II) nitrate dihydrate (Pd(NO3)2·2H2O, Sigma-Aldrich, Merck, Darmstadt, Germany) and manganese (II) nitrate tetrahydrate (Mn(NO3)2·4H2O, Sigma-Aldrich, Merck, Darmstadt, Germany) to obtain catalysts containing respectively 1 wt % of Pd and 2 wt % of Mn, 1 wt % of Pd, 2 wt % of Mn, and pure alumina prior to a 24 h stirring. Xerogels were recovered after evaporation of the suspensions in a furnace at 80 ° C for 24 h, which were then calcinated at 500 ° C ( 1 ° C /min, 4 h, 100 mL/min air flow). The catalysts were crushed before use.

3.2. Catalyst Characterization

Several characterization measurements, including N2 adsorption/desorption, XRD, various spectroscopies (ICP-OES, XPS, pyridine-IR), H2-TPR and HRTEM were conducted to finely analyze the structure and chemical reactivity of the materials. The following protocols were used to carry out the catalyst characterization. The catalysts were degassed at 300 ° C for 5 h before the N2 adsorption/desorption analysis. The nitrogen adsorption and desorption isotherms were measured at 77 K on a Micromeritics Tristar 3000 surface area and porosity analyzer after pre-desorption at 200 ° C for 5 h. The specific surface area and the pore size distribution of each catalyst were calculated from the linear part of Brunauer–Emmett–Teller (BET) method and Barrett–Joyner–Halenda (BJH) method applied to the desorption branch, respectively. XRD data were collected on a Bruker AXS D8 Advance diffractometer with Cu K α radiation ( λ = 0.15418 nm). The angular scan range was between 4 ° and 80 ° with a step size of 0.02 ° , which allowed to determine each single-phase present in the sample, by comparison with well-defined and referenced patterns, provided by Diffrac. EVA software and the International Center for Diffraction Data-PDF4+—2019 database. ICP-OES measurements were carried out to dose the metal loading in the catalyst using an ICP-OES Activa Jobin Yvon spectrometer. The catalysts were reduced in hydrogen flow for 3 h at 400 ° C before measurement. H2-TPR was realized on a Thermo Scientific TPDRO 1100. Then, 100 mg of catalysts were pretreated at 450 ° C in 5% O2/95% He for 2 h prior to the reduction. The H2 consumption was measured from 50 to 800 ° C with a rate of 10 ° C /min in 5% H2/95% Ar with a flow rate of 40 mL/min. XPS was carried out on a Kratos Axis Ultra DLD X-ray photoelectron spectrometer with an Al K α source (1846.6 eV, 150 W) on a surface of 300 × 700 μm with an analysis depth of 10 nm. The general spectra were obtained with a passage energy of 160 eV and a step of 1 eV between points. The high-resolution spectra were obtained with a passage energy of 40 eV and a step of 0.1 eV. The charge effect correction compared to Al 2p on high resolution was 74 eV. The background noise subtraction was effectuated using the Shirley method. The relative atomic percentage was calculated by Formula (17), where A i represents the peak area for a given element and F S i is the sensitivity factor for the same element.
( a t . r e l ) i = A i / F S i n A n / F S n
The sensitivity factors table by C. D. Wagner was used. Traces of fluor on the survey were detected, which is highly likely to be the contamination from the instrument, since no substance containing F was using during the synthesis. HRTEM and STEM-HAADF were performed on a JEOL 2100 F microscope with an acceleration tension of 200 kV, equipped with an energy-dispersive X-ray (EDS) analyzer. Samples were dispersed in ethanol, and one drop was deposed on ultrathin C film of lacey carbon on copper grids with 400 mesh. Microscopy study was performed at the “Centre Technologique des Microstructures”, CTμ Villeurbanne, France. The surface acidity was evaluated by IR spectroscopy of adsorbed pyridine. IR spectra were recorded in a Nexus Nicolet spectrometer equipped with a DTGS (Deuterium TriGlyceride Sulfur) detector and KBr beam splitter. IR spectra were recorded with a resolution of 4 cm 1 and 64 scans. The presented spectra were normalized to a disc of 10 mg/cm 2 . After activation at 450 ° C under vacuum, pyridine was adsorbed (200 Pa at equilibrium) at room temperature and further desorbed until 450 ° C (by temperature step of 50 ° C ). The ν 8 a spectral regions were deconvoluted (Figure S1—Supplementary Information) using the peak resolve function of the Omnic software in order to obtain the amount of strong (Al3+IV) and weak (Al3+VI) Lewis acid sites (LAS). The total amount of LAS was determined from the area of the 19b band, using its molar coefficient ( ϵ 19 b = 1.28 cm/mol). Free hydroxyl groups of alumina were characterized by the study of IR spectra in the 3900–3500 cm 1 range.

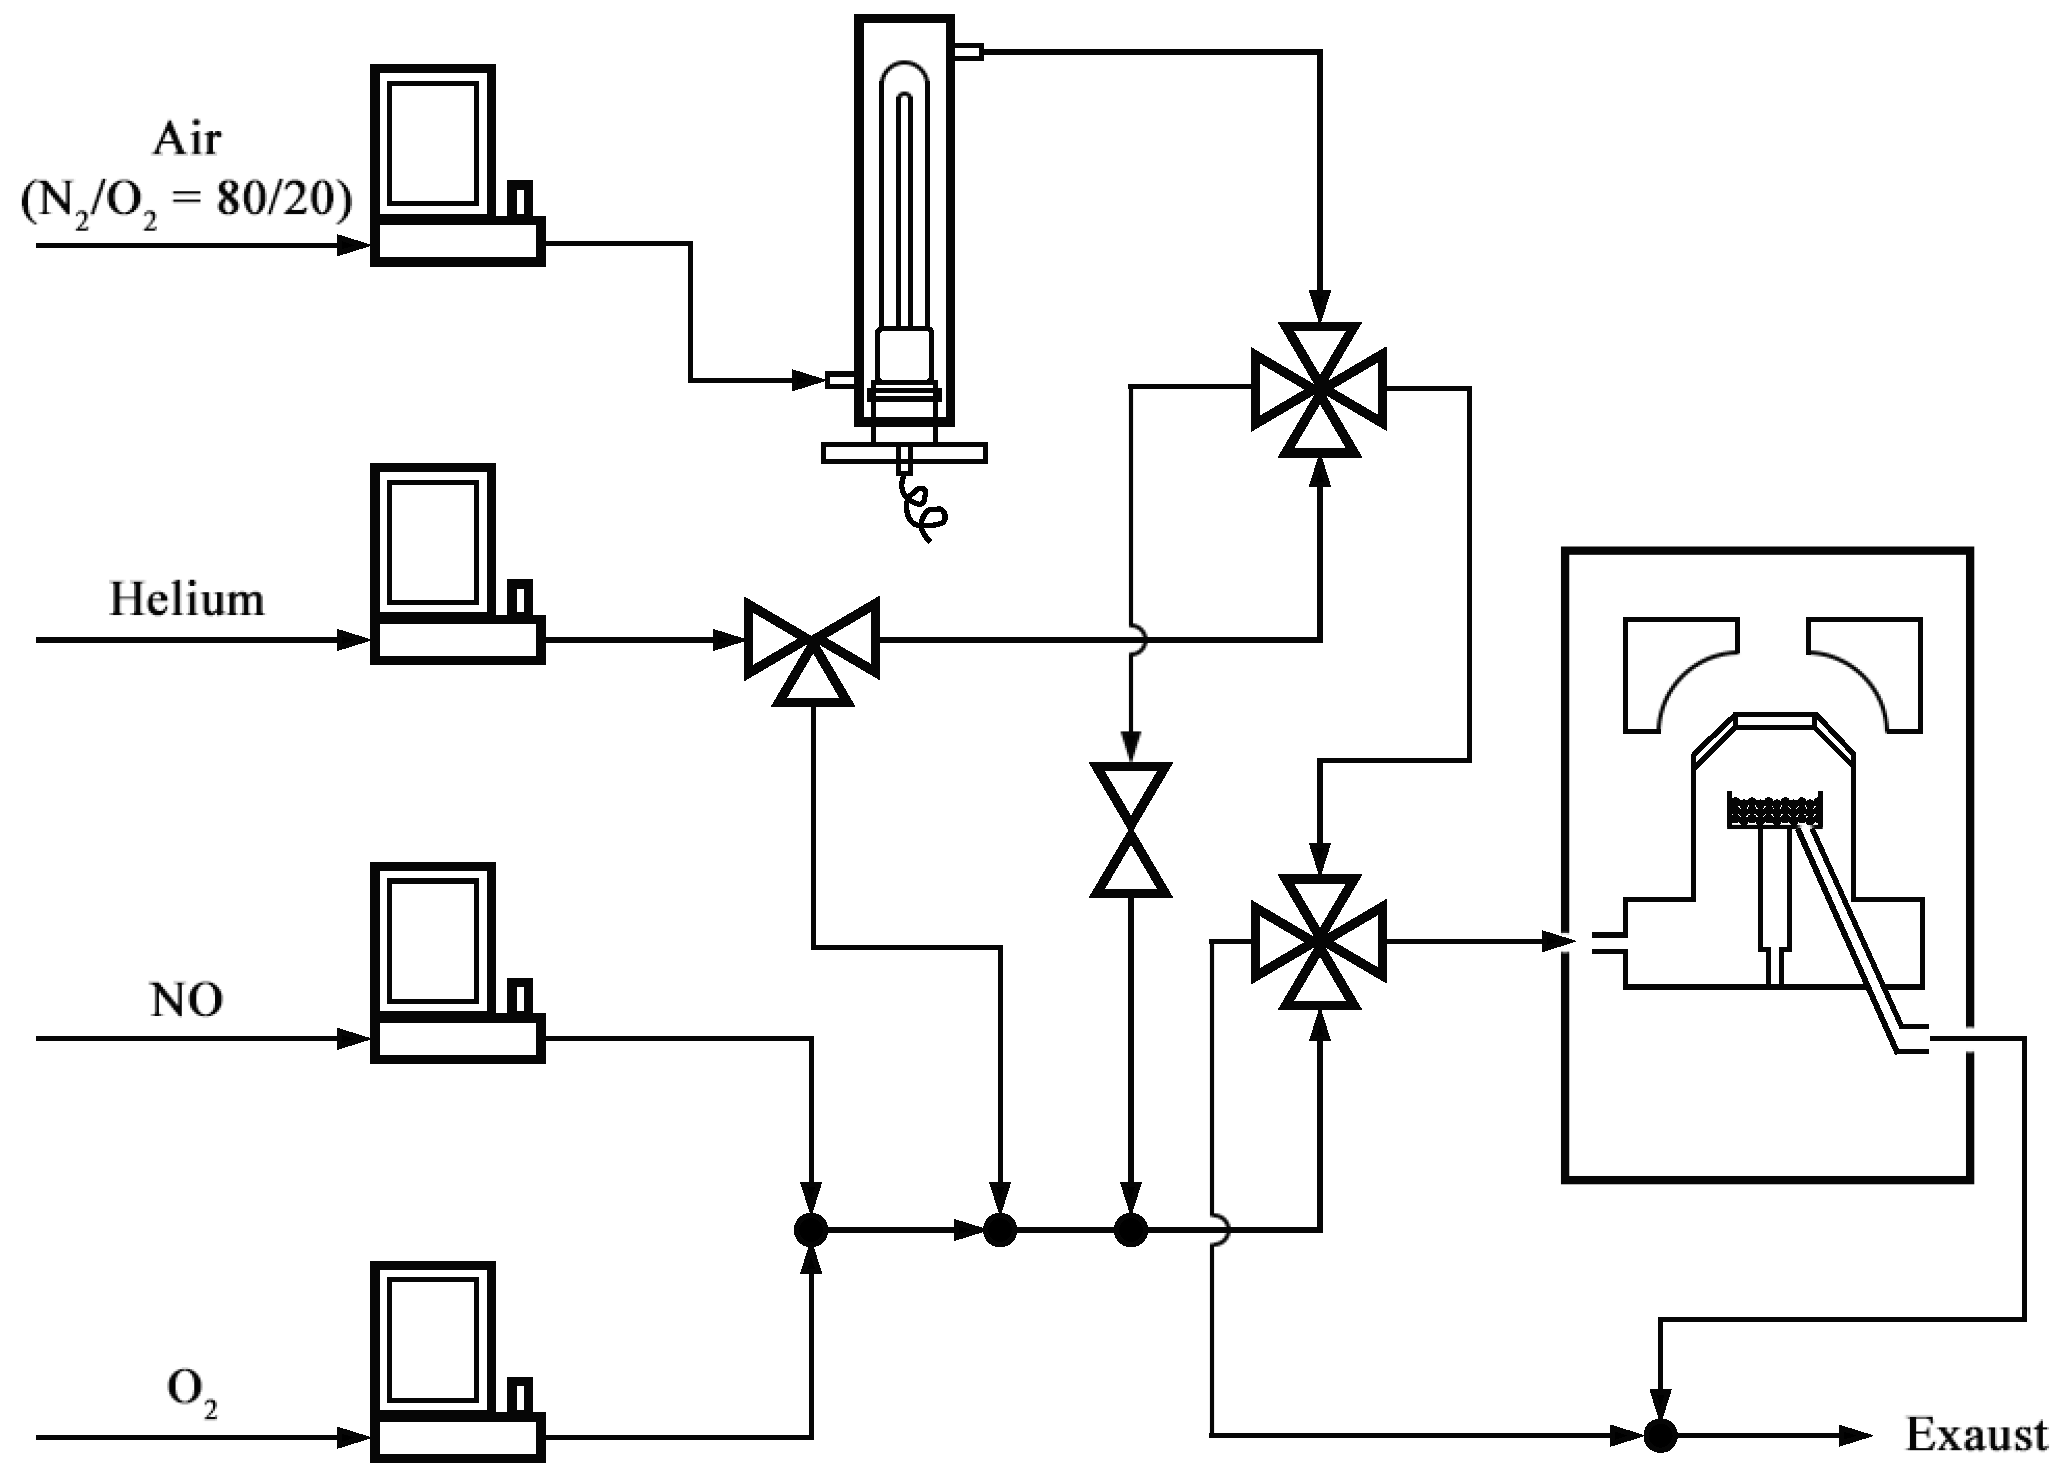
3.3. DRIFTS Experiments

A UV ozone generator (Jelight Ozone Generator Model 610, Zagreb, Croatia) was deployed to create ozone from dry air. The general equipment setup, which was principally constructed with an ozone generator and a DRIFTS analyzer (Thermo Scientific, California, USA NICOLET iS50 FT-IR spectrometer equipped with a mercury cadmium telluride (MCT)-based detector and a HARRICK Praying Mantis Diffuse Reflection Accessory) is illustrated in Figure 14. The ozone generator was configurated to be able to create 500 ppm of ozone in an air flow of 40 mL/min. Such flow could then be introduced into the DRIFTS chamber along with the NOx flow depending on the position of the two four-way valves and the simple open–close valve. The DRIFTS spectra were collected in a wavenumber range of 4000–650 cm 1 , accumulating 32 scans at 4 cm 1 resolution, of which the range of 1800–1100 cm 1 containing characteristic bands of adsorbed species was the focus of this study.
Prior to the experiments, the samples were pretreated in 20 mL/min He from 40 to 450 ° C with a rate of 10 ° C /min and were then maintained at 450 ° C for 30 min under 20 mL/min oxygen flow. Pretreated catalysts were exposed to gas mixtures in the various sequences, of which the ones with significant and representative results are described in Table 5. Sequence 1 was designed to study in the first place the species formed on the catalyst surface after the adsorption of NOx and to confirm the inhibition effect of nitrogen oxides on ozone decomposition. Sequence 2 was designed to test if such an inhibition effect would still be present if the catalysts were already pre-oxidized by ozone. The first step of Sequence 3 which would be referred to as co-adsorption of NOx and ozone was applied to study the competitive adsorption of the two gases at the same time prior to a possible purge of the surface by ozone. Sequence 4 was used to recreate the experiments carried out by Touati et al. [16] to understand the surface chemistry and test their hypothesis.
Situations similar to all 4 sequences could be encountered by a commercial aircraft during different stages of flights. Gases were mixed by BROOKS mass flow controllers and introduced into the reaction chamber with a total flow rate of 40 mL/min at 40 ° C . Temperature programmed desorption (TPD) of NOx, O3 was also carried out by saturating the catalyst surface with the corresponding gas at 40 ° C with a flow rate of 40 mL/min prior to desorption at 80, 125, 200, 300, and 450 ° C . Results of the air and ozone adsorption are shown in Figure S7—Supplementary Information. Note that the thermal decomposition of ozone begins to be significant above 100 ° C [46]. Thus, at 40 ° C , the temperature at which all the adsorption tests were recorded, the decomposition of ozone is only due to the presence of a catalyst. Previous studies have shown that at this temperature, adsorption without reaction can also occur, and thus, the analysis of the possible reactions at the surface will provide useful information.

4. Conclusions

Four catalysts—1%Pd-2%Mn/ γ -Al2O3, γ -Al2O3, 2%Mn/ γ -Al2O3 and 1%Pd/ γ -Al2O3—were successfully synthesized via a sol–gel method. These catalysts were characterized using various techniques to evaluate their physicochemical, textural, surface and acidic properties. N2 adsorption/desorption measurements confirmed the mesoporous structure of the catalysts with an average pore diameter of 12–14 nm. The XRD analysis indicated that the supports synthesized were γ -Al2O3 with all the characteristic peaks present in the pattern. From HRTEM observations, Pd and Mn species were found to be PdO and MnO2, respectively. Acidity tests with pyridine adsorption monitored by infrared spectroscopy successfully quantified the number of Lewis acid sites and the proportion of weak and strong sites, the former of which were the majority. The addition of Mn decreased the total acidity of the catalyst by reducing the total number of LAS and increasing the proportion of weak sites. The addition of Pd, however, seemed to have increased the total number of LAS, but the acidity of the catalyst was still weakened, as palladium created a significant amount of weak LAS. A series of in situ DRIFTS analysis was carried out under different consecutive gas sequences. It has been proven that on palladium and manganese-based catalysts, the inhibition effect of nitrogen oxides was due to the formation of monodentate nitrites, monodentate, bidentate and bridged nitrates, which are difficult to be transformed into NOx, either by oxidation or by thermal treatment, and to desorb from the catalyst surface. Interestingly, monodentate nitrites could be eliminated if a co-adsorption of NOx and ozone on the catalyst was performed prior to exposure to clean ozone. This transformation could be the reason why the catalytic conversion of ozone could return to its original value (before nitrogen oxide poisoning).

Supplementary Materials

The following supporting information can be downloaded at: https://www.mdpi.com/article/10.3390/catal12070738/s1, Figure S1: Original and deconvoluted curves of the v8a vibration domain; Figure S2: LAS distribution (left) and quantity (right) after pyridine evacuation at room temperature; Figure S3: Spectra of (a) 1Pd2Mn/Al catalyst surface saturation under NO/O2 and (b) TPD of the saturated catalyst; Figure S4: Evolution of band intensity at 1230 cm−1 over time during NOx adsorption followed by ozone adsorption; Figure S5: Comparison between Sequence 1 and Sequence 2 for 60 min of NOx adsorption followed by 60 min of O3 adsorption over 1Pd2Mn/Al; Figure S6: Deconvolution of DRIFTS spectra after 120 min of NOx adsorption over 2Mn/Al; Figure S7: (a) Dry air and (b) ozone adsorption over 1Pd2Mn/Al; Figure S8: Intensity evolution over time at 1416 cm−1 for all sequences over 1Pd2Mn/Al; Figure S9: Ozone adsorption over all four catalysts; Table S1: Nitrite/nitrate ratio over 1Pd2Mn/Al, 2Mn/Al and Al after 15 and 120 min−1.

Author Contributions

Conceptualization, X.J., J.-M.C., F.C., A.B., S.G. and V.M.; methodology, J.-M.C., F.C., A.B., S.G. and V.M.; validation, J.-M.C., F.C., S.G. and V.M.; formal analysis, X.J., J.-M.C., F.C. and S.G.; investigation, X.J., F.C., L.V. and S.G.; data curation, X.J., J.-M.C., F.C., L.V., S.G. and V.M.; writing—original draft preparation, X.J. and S.G.; writing—review and editing, X.J., J.-M.C., F.C., L.V. and S.G. and V.M.; supervision, V.M. and S.G.; project administration, V.M., S.G. and J.-M.C.; funding acquisition, V.M. and J.-M.C. All authors have read and agreed to the published version of the manuscript.

Funding

Part of this project was funded by the FUI program AIRCLEAN with a financial support from BPI France.

Data Availability Statement

Not applicable.

Acknowledgments

The authors would like to thank the scientific service and researchers of IRCELYON for the assistance in physico-chemical characterizations and for stimulating discussions; in particular Christian George, Pascale Mascunan, Yoann Aizac and Françoise Bosselet. J.-M.C. and F.C. acknowledge financial support from the European Union (ERDF) and Région Nouvelle Aquitaine.

Conflicts of Interest

The authors declare no conflict of interest.

References

  1. Pudasainee, D.; Sapkota, B.; Shrestha, M.L.; Kaga, A.; Kondo, A.; Inoue, Y. Ground Level Ozone Concentrations and Its Association with NOx and Meteorological Parameters in Kathmandu Valley, Nepal. Atmos. Environ. 2006, 40, 8081–8087. [Google Scholar] [CrossRef]
  2. Hagenbjörk, A.; Malmqvist, E.; Mattisson, K.; Sommar, N.J.; Modig, L. The Spatial Variation of O3, NO, NO2 and NOx and the Relation between Them in Two Swedish Cities. Environ. Monit. Assess. 2017, 189, 161. [Google Scholar] [CrossRef] [PubMed] [Green Version]
  3. Bhangar, S.; Cowlin, S.C.; Singer, B.C.; Sextro, R.G.; Nazaroff, W.W. Ozone Levels in Passenger Cabins of Commercial Aircraft on North American and Transoceanic Routes. Environ. Sci. Technol. 2008, 42, 3938–3943. [Google Scholar] [CrossRef]
  4. Jia, J.; Zhang, P.; Chen, L. Catalytic Decomposition of Gaseous Ozone over Manganese Dioxides with Different Crystal Structures. Appl. Catal. B Environ. 2016, 189, 210–218. [Google Scholar] [CrossRef]
  5. Jiang, C.; Zhang, P.; Zhang, B.; Li, J.; Wang, M. Facile Synthesis of Activated Carbon-Supported Porous Manganese Oxide via in Situ Reduction of Permanganate for Ozone Decomposition. Ozone Sci. Eng. 2013, 35, 308–315. [Google Scholar] [CrossRef]
  6. Batakliev, T.; Georgiev, V.; Anachkov, M.; Rakovsky, S.; Rakovsky, S. Ozone decomposition. Interdiscip. Toxicol. 2014, 7, 47–59. [Google Scholar] [CrossRef] [Green Version]
  7. İm, U.; Tayanç, M.; Yenigün, O. Analysis of Major Photochemical Pollutants with Meteorological Factors for High Ozone Days in Istanbul, Turkey. Water Air Soil Pollut. 2006, 175, 335–359. [Google Scholar] [CrossRef]
  8. Derwent, R.G.; Davies, T.J. Modelling the Impact of NOx or Hydrocarbon Control on Photochemical Ozone in Europe. Atmos. Environ. 1994, 28, 2039–2052. [Google Scholar] [CrossRef]
  9. Itano, Y.; Bandow, H.; Takenaka, N.; Saitoh, Y.; Asayama, A.; Fukuyama, J. Impact of NOx Reduction on Long-Term Ozone Trends in an Urban Atmosphere. Sci. Total Environ. 2007, 379, 46–55. [Google Scholar] [CrossRef]
  10. Lin, F.; Wang, Z.; Ma, Q.; He, Y.; Whiddon, R.; Zhu, Y.; Liu, J. N2O5 Formation Mechanism during the Ozone-Based Low-Temperature Oxidation deNOx Process. Energy Fuels 2016, 30, 5101–5107. [Google Scholar] [CrossRef]
  11. Liu, L.; Shen, B.; Si, M.; Lu, F. Performance and Mechanism of MnOx/γ-Al2O3 for Low-Temperature NO Catalytic Oxidation with O3/NO Ratio of 0.5. Fuel Process. Technol. 2021, 222, 106979. [Google Scholar] [CrossRef]
  12. Subrahmanyam, C.; Bulushev, D.A.; Kiwi-Minsker, L. Dynamic Behaviour of Activated Carbon Catalysts during Ozone Decomposition at Room Temperature. Appl. Catal. B Environ. 2005, 61, 98–106. [Google Scholar] [CrossRef]
  13. Mehandjiev, D.; Naydenov, A.; Ivanov, G. Ozone Decomposition, Benzene and CO Oxidation over NiMnO3-ilmenite and NiMn2O4-spinel Catalysts. Appl. Catal. A Gen. 2001, 206, 13–18. [Google Scholar] [CrossRef]
  14. Spasova, I.; Nikolov, P.; Mehandjiev, D. Ozone Decomposition over Alumina-Supported Copper, Manganese and Copper-Manganese Catalysts. Ozone Sci. Eng. 2007, 29, 41–45. [Google Scholar] [CrossRef]
  15. Mehandjiev, D.; Naidenov, A. Ozone Decomposition on α-Fe2O3 Catalyst. Ozone Sci. Eng. 1992, 14, 277–282. [Google Scholar] [CrossRef]
  16. Touati, H.; Guerin, A.; Swesi, Y.; Batiot-Dupeyrat, C.; Philippe, R.; Meille, V.; Clacens, J.M. Unexpected Role of NOx during Catalytic Ozone Abatement at Low Temperature. Catal. Commun. 2021, 148, 106163. [Google Scholar] [CrossRef]
  17. Sotomayor, F.; Cychosz, K.A.; Thommes, M. Characterization of Micro/Mesoporous Materials byPhysisorption: Concepts and Case Studies. Acc. Mater. Surf. Res. 2018, 3, 34–50. [Google Scholar]
  18. Daroughegi, R.; Meshkani, F.; Rezaei, M. Characterization and Evaluation of Mesoporous High Surface Area Promoted Ni-Al2O3 Catalysts in CO2 Methanation. J. Energy Inst. 2020, 93, 482–495. [Google Scholar] [CrossRef]
  19. Habibi, N.; Arandiyan, H.; Rezaei, M. Mesoporous MgO·Al2O3 Nanopowder-Supported Meso–Macroporous Nickel Catalysts: A New Path to High-Performance Biogas Reforming for Syngas. RSC Adv. 2016, 6, 29576–29585. [Google Scholar] [CrossRef]
  20. Chandra Shekar, S.; Krishna Murthy, J.; Kanta Rao, P.; Rama Rao, K.S. Selective Hydrogenolysis of Dichlorodifluoromethane on Carbon Covered Alumina Supported Palladium Catalyst. J. Mol. Catal. A Chem. 2003, 191, 45–59. [Google Scholar] [CrossRef]
  21. Kapteijn, F.; Singoredjo, L.; Andreini, A.; Moulijn, J.A. Activity and Selectivity of Pure Manganese Oxides in the Selective Catalytic Reduction of Nitric Oxide with Ammonia. Appl. Catal. B Environ. 1994, 3, 173–189. [Google Scholar] [CrossRef]
  22. Ardizzone, S.; Bianchi, C.L.; Tirelli, D. Mn3O4 and γ-MnOOH Powders, Preparation, Phase Composition and XPS Characterisation. Colloids Surfaces A Physicochem. Eng. Asp. 1998, 134, 305–312. [Google Scholar] [CrossRef]
  23. Hadjiivanov, K. Chapter Two—Identification and Characterization of Surface Hydroxyl Groups by Infrared Spectroscopy. In Advances in Catalysis; Jentoft, F.C., Ed.; Academic Press: Cambridge, MA, USA, 2014; Volume 57, pp. 99–318. [Google Scholar] [CrossRef]
  24. Knözinger, H.; Ratnasamy, P. Catalytic Aluminas: Surface Models and Characterization of Surface Sites. Catal. Rev. 2007, 17, 31–70. [Google Scholar] [CrossRef]
  25. Vimont, A.; Lavalley, J.C.; Sahibed-Dine, A.; Otero Areán, C.; Rodríguez Delgado, M.; Daturi, M. Infrared Spectroscopic Study on the Surface Properties of γ-Gallium Oxide as Compared to Those of γ-Alumina. J. Phys. Chem. B 2005, 109, 9656–9664. [Google Scholar] [CrossRef] [PubMed]
  26. Haneda, M.; Joubert, E.; Ménézo, J.C.; Duprez, D.; Barbier, J.; Bion, N.; Daturi, M.; Saussey, J.; Lavalley, J.C.; Hamada, H. Surface Characterization of Alumina-Supported Catalysts Prepared by Sol–Gel Method. Part I.—Acid–Base Properties. Phys. Chem. Chem. Phys. 2001, 3, 1366–1370. [Google Scholar] [CrossRef]
  27. Dhandapani, B.; Oyama, S.T. Kinetics and Mechanism of Ozone Decomposition on a Manganese Oxide Catalyst. Chem. Lett. 1995, 24, 413–414. [Google Scholar] [CrossRef]
  28. Castoldi, L.; Matarrese, R.; Morandi, S.; Righini, L.; Lietti, L. New insights on the adsorption, thermal decomposition and reduction of NOx over Pt- and Ba-based catalysts. Appl. Catal. B Environ. 2018, 224, 249–263. [Google Scholar] [CrossRef]
  29. Su, Y.; Amiridis, M.D. In situ FTIR studies of the mechanism of NOx storage and reduction on Pt/Ba/Al2O3 catalysts. Catal. Today 2004, 96, 31–41. [Google Scholar] [CrossRef]
  30. Hadjiivanov, K.I. Identification of Neutral and Charged NxOy Surface Species by IR Spectroscopy. Catal. Rev. 2000, 42, 71–144. [Google Scholar] [CrossRef]
  31. Huang, S.J.; Walters, A.; Vannice, M. TPD, TPR and DRIFTS studies of adsorption and reduction of NO on La2O3 dispersed on Al2O3. Appl. Catal. B Environ. 2000, 26, 101–118. [Google Scholar] [CrossRef]
  32. Koukiou, S.; Konsolakis, M.; Lambert, R.; Yentekakis, I. Spectroscopic evidence for the mode of action of alkali promoters in Pt-catalyzed de-NOx chemistry. Appl. Catal. B Environ. 2007, 76, 101–106. [Google Scholar] [CrossRef]
  33. Granger, P.; Praliaud, H.; Billy, J.; Leclercq, L.; Leclercq, G. Infrared Investigation of the Transformation of NO over Supported Pt- and Rh-based Three-Way Catalysts. Surf. Interface Anal. 2002, 34, 92–96. [Google Scholar] [CrossRef]
  34. Westerberg, B.; Fridell, E. A transient FTIR study of species formed during NOx storage in the Pt/BaO/Al2O3 system. J. Mol. Catal. A Chem. 2001, 165, 249–263. [Google Scholar] [CrossRef]
  35. Bourane, A.; Dulaurent, O.; Salasc, S.; Sarda, C.; Bouly, C.; Bianchi, D. Heats of Adsorption of Linear NO Species on a Pt/Al2O3 Catalyst Using In Situ Infrared Spectroscopy under Adsorption Equilibrium. J. Catal. 2001, 204, 77–88. [Google Scholar] [CrossRef]
  36. Wu, F.; Wang, M.; Lu, Y.; Zhang, X.; Yang, C. Catalytic removal of ozone and design of an ozone converter for the bleeding air purification of aircraft cabin. Build. Environ. 2017, 115, 25–33. [Google Scholar] [CrossRef]
  37. Yan, Z.; Zuo, Z.; Li, Z.; Zhang, J. A Cluster DFT Study of NH3 and NO Adsorption on the MoO22+/HZSM-5 Surface: Lewis versus Brønsted Acid Sites. Appl. Surf. Sci. 2014, 321, 339–347. [Google Scholar] [CrossRef]
  38. Oton, L.F.; Oliveira, A.C.; de Araujo, J.C.S.; Araujo, R.S.; de Sousa, F.F.; Saraiva, G.D.; Lang, R.; Otubo, L.; Carlos da Silva Duarte, G.; Campos, A. Selective Catalytic Reduction of NOx by CO (CO-SCR) over Metal-Supported Nanoparticles Dispersed on Porous Alumina. Adv. Powder Technol. 2020, 31, 464–476. [Google Scholar] [CrossRef]
  39. Lin, F.; Wang, Z.; Ma, Q.; Yang, Y.; Whiddon, R.; Zhu, Y.; Cen, K. Catalytic deep oxidation of NO by ozone over MnOx loaded spherical alumina catalyst. Appl. Catal. B Environ. 2016, 198, 100–111. [Google Scholar] [CrossRef]
  40. Irfan, M.F.; Goo, J.H.; Kim, S.D.; Hong, S.C. Effect of CO on NO Oxidation over Platinum Based Catalysts for Hybrid Fast SCR Process. Chemosphere 2007, 66, 54–59. [Google Scholar] [CrossRef]
  41. Irfan, M.F.; Goo, J.H.; Kim, S.D. Co3O4 Based Catalysts for NO Oxidation and NOx Reduction in Fast SCR Process. Appl. Catal. B Environ. 2008, 78, 267–274. [Google Scholar] [CrossRef]
  42. Roscoe, J.M.; Abbatt, J.P.D. Diffuse Reflectance FTIR Study of the Interaction of Alumina Surfaces with Ozone and Water Vapor. J. Phys. Chem. A 2005, 109, 9028–9034. [Google Scholar] [CrossRef] [PubMed]
  43. Touati, H.; Mehri, A.; Karouia, F.; Richard, F.; Batiot-Dupeyrat, C.; Daniele, S.; Clacens, J.M. Low-Temperature O3 Decomposition over Pd−TiO2 Hybrid Catalysts. Catalysts 2022, 12, 448. [Google Scholar] [CrossRef]
  44. Abdallah, G.; Bitar, R.; Kaliya Perumal Veerapandian, S.; Giraudon, J.M.; De Geyter, N.; Morent, R.; Lamonier, J.F. Acid Treated Ce Modified Birnessite–Type MnO2 for Ozone Decomposition at Low Temperature: Effect of Nitrogen Containing Co-Pollutants and Water. Appl. Surf. Sci. 2022, 571, 151240. [Google Scholar] [CrossRef]
  45. Bleta, R.; Alphonse, P.; Pin, L.; Gressier, M.; Menu, M.J. An efficient route to aqueous phase synthesis of nanocrystalline γ-Al2O3 with high porosity: From stable boehmite colloids to large pore mesoporous alumina. J. Colloid Interface Sci. 2012, 367, 120–128. [Google Scholar] [CrossRef] [Green Version]
  46. Wulf, O.R.; Tolman, R.C. The Thermal Decomposition of Ozone. Proc. Natl. Acad. Sci. USA 1927, 13, 272–275. [Google Scholar] [CrossRef] [Green Version]
Figure 1. (a) Adsorption/desorption isotherms and (b) pore size distribution.
Catalysts 12 00738 g001
Figure 2. XRD patterns of the catalysts.
Catalysts 12 00738 g002
Figure 3. From left to right: 1Pd/Al and 1Pd2Mn/Al and 2Mn/Al by STEM-HAADF. × stands for the multiplication sign (magnification).
Catalysts 12 00738 g003
Figure 4. H2-TPR profiles of all catalyst samples.
Catalysts 12 00738 g004
Figure 5. XPS profiles of Mn 2p of (a) 2Mn/Al and (b) 1Pd2Mn/Al and (c) Pd 3d of 1Pd2Mn/Al.
Catalysts 12 00738 g005
Figure 6. FTIR spectra of catalysts after activation at 450 °C under vacuum. (a): ν (OH) vibration; (b): carbonate wavenumber zone.
Catalysts 12 00738 g006
Figure 7. (a): FTIR spectra of samples after the adsorption and evacuation of pyridine at RT. (b): Quantity of LAS per gram of samples at different temperatures.
Catalysts 12 00738 g007
Figure 8. NO/O2 adsorption at 40 °C for 120 min prior to O3 adsorption for 60 min (Sequence 1) on different catalysts.
Catalysts 12 00738 g008
Figure 9. Band intensity comparison among different catalysts under NOx flow for 15 and 120 min (left) and under secondary O3 flow for 5 and 60 min (right) from Sequence 1.
Catalysts 12 00738 g009
Figure 10. O3 adsorption for 60 min (pre-oxidation of the catalyst) prior to NO/O2 adsorption for 120 min prior to a second O3 adsorption for 60 min on different catalysts that are pre-oxidized by ozone (Sequence 2).
Catalysts 12 00738 g010
Figure 11. O3 and NOx co-adsorption for 120 min prior to ozone purge for 60 min (Sequence 3) on different catalysts.
Catalysts 12 00738 g011
Figure 12. 1Pd2Mn/Al surface spectra after 60 min exposure under NOx (Sequence 1) and NOx + O3 (Sequence 3).
Catalysts 12 00738 g012
Figure 13. Comparison between Sequence 3 and Sequence 4 for 5 and 120 min of NOx adsorption before (solid line) and after (dash line) O3 adsorption, followed in both case by 60 min of O3 adsorption.
Catalysts 12 00738 g013
Figure 14. Experiment setup schematics.
Catalysts 12 00738 g014
Table 1. Textural properties of the catalysts.
CatalystBET Surface Area
(m 2 /g)
Total Pore Volume
(cm 3 /g)
Average Pore Diameter
(nm)
1Pd2Mn/Al3411.3314
1Pd/Al3401.2714
2Mn/Al3491.3514
Al3721.2112
Table 2. Relative atomic percentage of elements.
Element1Pd2Mn/Al2Mn/AlAl
C 1s1.21.31.9
O 1s59.659.360
Al 2p38.638.838.1
Mn 2p0.7 (1.8 wt %)0.6 (1.6 wt %)
Pd 3d0.06 (0.3 wt %)
Table 3. Quantitative distribution of Lewis acid sites ( μ mol/g) from pyridine evacuated at RT.
Strong LASWeak LASTotal
Al106278384
2Mn/Al31317348
1Pd2Mn/Al47376423
Table 4. Surface species and their characteristic peaks in FTIR.
Surface SpeciesPeak Position
(cm 1 )
References
Ionic nitrites NO21215–1260[28]
Monodentate nitrites1375–1470[29]
Catalysts 12 00738 i0011065–1206[30]
Bridged nitrites1266–1390[31]
Catalysts 12 00738 i0021230–1276[32]
Monodentate nitrates1415–1520[30]
Catalysts 12 00738 i0031250–1330[28]
Bidentate nitrates1550–1611[29,33,34,35]
Catalysts 12 00738 i0041200–1300
Bridging nitrates1600–1660[29,33,34,35]
Catalysts 12 00738 i0051200–1300
Atomic oxygen1318–1380[36]
Catalysts 12 00738 i006
Chemically adsorbed ozone1100[36]
Catalysts 12 00738 i007
Table 5. Sequences of experiments carried out under different gas mixtures.
Seq.Step 1Step 2Step 3
1200 ppm NO, 20% O2
(He balance, 40 mL/min)
2 h
500 ppm O3
(Air balance, 40 mL/min)
1 h
2500 ppm O3
(Air balance, 40 mL/min)
1 h
200 ppm NO, 20% O2
(He balance, 40 mL/min)
2 h
500 ppm O3
(Air balance, 40 mL/min)
1 h
3500 ppm O3
(Air balance, 20 mL/min)
+
200 ppm NO, 20% O2
(He balance, 20 mL/min)
2 h
500 ppm O3
(Air balance, 40 mL/min)
1 h
4500 ppm O3
(Air balance, 40 mL/min)
1 h
500 ppm O3
(Air balance, 20 mL/min)
+
200 ppm NO, 20% O2
(He balance, 20 mL/min)
2 h
500 ppm O3
(Air balance, 40 mL/min)
1 h
Publisher’s Note: MDPI stays neutral with regard to jurisdictional claims in published maps and institutional affiliations.

