1. Introduction
As we human beings tend to have the urge towards innovation and exploration in various fields, we are leaving behind a lot of detrimental effects on future generations via numerous hazardous outputs. We are responsible for making the world a better place to live. The major menaces to health are present in water and food products that entered through several insignificant ways and resulted in huge hazards. Nowadays, heavy metal contaminants and food additive poisoning are dominant in these environmental and health death traps. Heavy metals are widely utilized in chemical industries, mining, paint manufacturing, textile dyeing, and so on [
1]. Among these, the usage of chromium in chrome electroplating [
2] and leather tanning [
3] leads to an extensive release of this particular heavy metal into the environment and causes severe ecological pollution.
In general, chromium exists in two different forms as trivalent [Cr(III)] and hexavalent [Cr (VI)] species; the former does not have adverse effects [
4] and is immobile and less soluble and not widely absorbed by human cells. However, the hexavalent species of chromium (Cr
6+) is mobile, soluble, and bioavailable under oxidizing conditions and can easily cross the cellular membranes through sulphate permeases, which disrupt the human health system. Hexavalent chromium is carcinogenic and has a deterioration effect on kidneys, the respiratory system [
5], eyes, skin [
6], and even DNA levels [
7,
8]. As per the World Health Organization (WHO) and the United States Environmental Protection Agency (USEPA), the permissible limits of chromium are 0.05 ppm and 0.1 ppm in wastewater and soil, respectively [
9,
10]. The untreated discharge from industrial operations has made the presence of Cr
6+ in drinking water inevitable [
11]. Therefore, the chromium intake levels by human beings have surpassed the allowed limit. Chromium also accumulates in plants and enters animals and human biological systems [
12,
13]. Since the trivalent species is safer than the hexavalent form, this conversion is indispensable for all living organisms in the ecosystem [
14,
15].
Another primary concern is the hostile contaminants and additives in the food industry [
16]. In look, taste, and marketing strategies, the addition of unwanted flavoring agents and coloring dyes is normalized nowadays. However, there is a presence of azo (N-N) and aromatic (>C
6) functional groups in these synthetic dyes. When the human body consumes them for a prolonged period, this can negatively affect distinct parts of the body [
17,
18]. According to the survey by the World Health Organization (WHO) and Food and Agricultural Organization (FAO), Sunset Yellow FCF (SSY), also known as Orange Yellow S (E110), is a petroleum-derived synthetic azo dye that has a long history as a food-coloring agent and is extensively used in various food products owing to its gratifying color, low manufacturing cost, water solubility, and stability over diverse pH ranges; consumption of this dye exceeds the acceptable daily intake (ADI). However this embryotoxic azo dye can cause diarrhoea, migraines, allergies, anxiety, immunosuppression, hyperactivity (ADHD), eczema, histopathological effects in the kidney and liver, and even cancer in humans based on the level of consumption [
19,
20]. It also seriously affects other animals by damaging their DNA and chromosomal levels [
21,
22,
23,
24,
25] and aquatic plants by trapping sunlight and thereby hindering photosynthesis.
Consequently, it is elemental to design a competent and inexpensive approach to reduce these contaminants from effluents to a standard level. Many distinct systems such as electrocoagulation [
26], nanofiltration and reverse osmosis [
27], ion exchange [
28], and cross-flow microfiltration [
29] have actively participated in the removal of chromium from the natural ecosystem. However, these methods are often inefficient at lower concentrations and can be expensive. Some techniques that were dynamically employed to remove food colorants are Fenton’s oxidation process [
30], membrane filtration, aerobic biotreatment [
31], electrocoagulation [
32], adsorption [
33,
34], and a few quantitative determination techniques such as electrochemical sensing [
35,
36]. Some of these methods require an additional separation system during the large-scale removal of these pollutants in discharges.
Over the past few decades, an efficacious and economical photocatalytic technique has been developed and used to remove numerous pollutants from the environment [
37,
38]. The utilization of various semiconducting and metal-free materials as a photocatalyst has substantially advanced lately [
39,
40]. Graphitic carbon nitride (g-C
3N
4) is a metal-free n-type semiconducting organic polymer, majorly explored in photocatalytic performances. Due to its astounding thermal and chemical stabilities, it is modified through metal/non-metal doping, composite preparation, and optimization of heterojunctions and is used as a photocatalyst for CO
2 reduction, solar cells, water splitting, and organic degradation, exhibiting astounding efficiency. It has a simplistic but effective synthesis technique using thermal polycondensation reactions from abundant nitrogen precursors such as urea, melamine, cyanamide, and dicyandiamide [
41,
42]. The position of the conduction band at −1.12 eV and the medium bandgap of 2.7 eV accounts for enhanced reduction capabilities without the presence of metal, which sustains the importance of this material [
43]. In addition, it works as a promising host material for surface modifications considering its very stable tri-s-triazine allotropic form, which provides its unique stability and chemical resistance.
Though various methodologies have been used to improve the photocatalytic activity of g-C
3N
4, simple surface functionalization can make a substantial difference in its photocatalytic degradation ability [
44,
45]. In this paper, modest sulfonic acid functionalization of graphitic carbon nitride (g-C
3N
4–SO
3H) was carried out, and the enhancement in photocatalytic activity towards both the oxidation of SSY azo dye and reduction of hexavalent chromium was found to be phenomenal. This is due to the availability of more active sites on the surface that support fast photogenerated electron movement towards the catalyst surface and the electron-withdrawing nature of sulfate groups [
46]. The functionalization of electronegative groups on the g-C
3N
4 surface with sulfonic groups facilitated electron half-reactions by regulating the electron distribution on the catalyst surface. In work by Patnaik et al., the enhanced vacant sites on the g-C
3N
4 surface by sulfate functionalization imparted extraordinary photocatalytic activity that was 35 times higher than that of pristine g-C
3N
4 [
47].
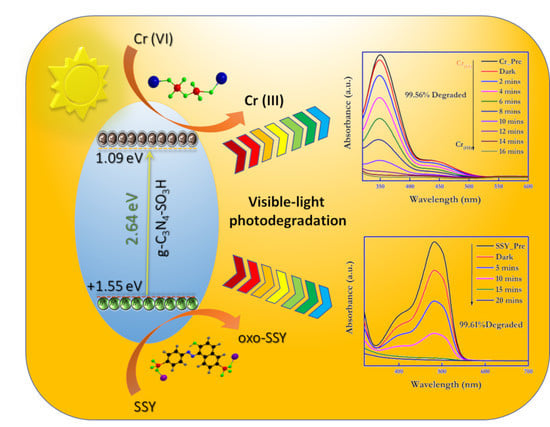
The current work reports the facile synthesis of pristine g-C3N4 and its sulfonic-modified catalytic material for the visible light photocatalytic degradation of hexavalent chromium (photoreduction) and sunset yellow dye (photooxidation). The presence of abundant sulfonic groups on the surface of bulk g-C3N4 aided a successful functionalization. Additionally, the physicochemical properties of the prepared photocatalytic materials were characterized, and a feasible photocatalytic charge transfer mechanism was formulated. The involved electrochemical and photoelectrochemical (PEC) measurements were also analyzed to corroborate the proposed mechanism of photo-induced redox reactions. The photocatalytic ability of the synthesized g-C3N4–SO3H material in various pH environments and its recycling capability were also investigated.
2. Results and Discussion
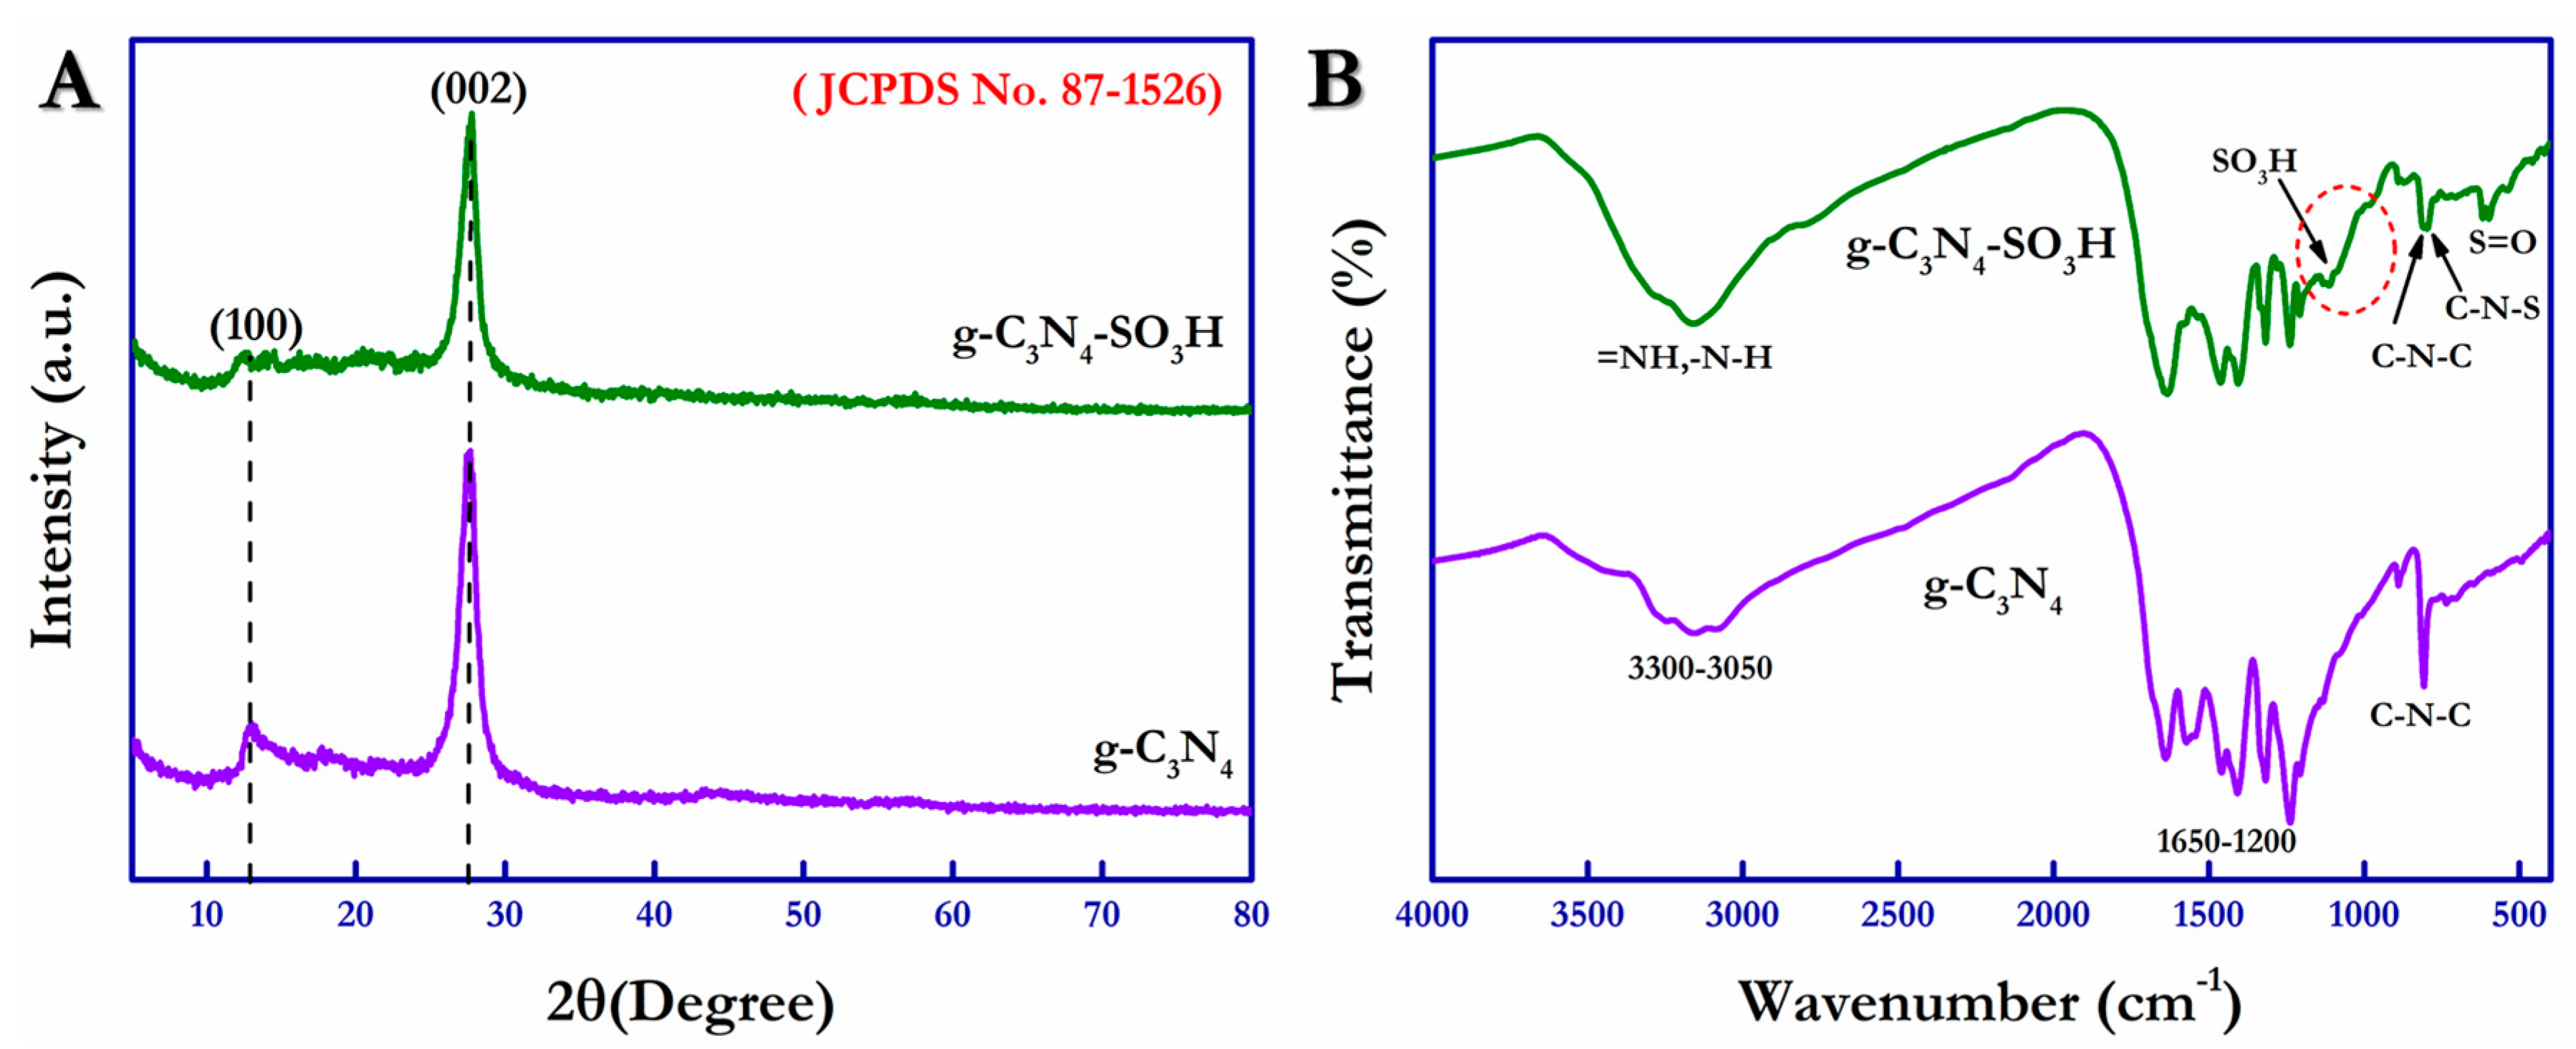
The chemical compositions of g-C
3N
4 and g-C
3N
4–SO
3H in their as-synthesized forms were investigated using FT-IR spectroscopy operated between 400 cm
−1 and 4000 cm
−1, and the obtained spectra are shown in
Figure 1A. From
Figure 1A, a sharp, significant characteristic peak appeared at 811 cm
−1, corresponding to the stretching vibration band of the triazine groups (C–N–C) present in the g-C
3N
4 structure. The standard vibration bands were traced between 1650 cm
−1 and 1200 cm
−1 and are attributed to the g-C
3N
4 containing C–N heterostructures in the heptazine cyclic arrangements. Different from this, distinct peaks located at 798 cm
−1 and 614 cm
−1 were ascribed to the C–N–S and –S = O groups due to their bending vibration modes related to the surface SO
3H group (dotted circle) [
44]. In addition, the surface sulfonic group was affirmed by the presence of vibration bands at 1116 cm
−1 and 978 cm
−1. Further, surface-absorbed water with –OH peaks and –N–H, =N–H peaks from the unpolymerized free amino groups were observed as the broad vibration band between 3300 and 3050 cm
−1 [
46].
The X-ray diffraction (XRD) spectra of pristine g-C
3N
4 and sulfonic acid functionalized g-C
3N
4–SO
3H were obtained and are exhibited in
Figure 1B.
Figure 1B displays the characteristic peak that appeared at 12.9°, corresponding to the interlayer structural packing (100), and the peak at 27.6° was attributed to the interplanar stacking (002) planes from the graphite-like structure exhibited by the g-C
3N
4 compound (JCPDS No. 87-1526). Similarly, the g-C
3N
4–SO
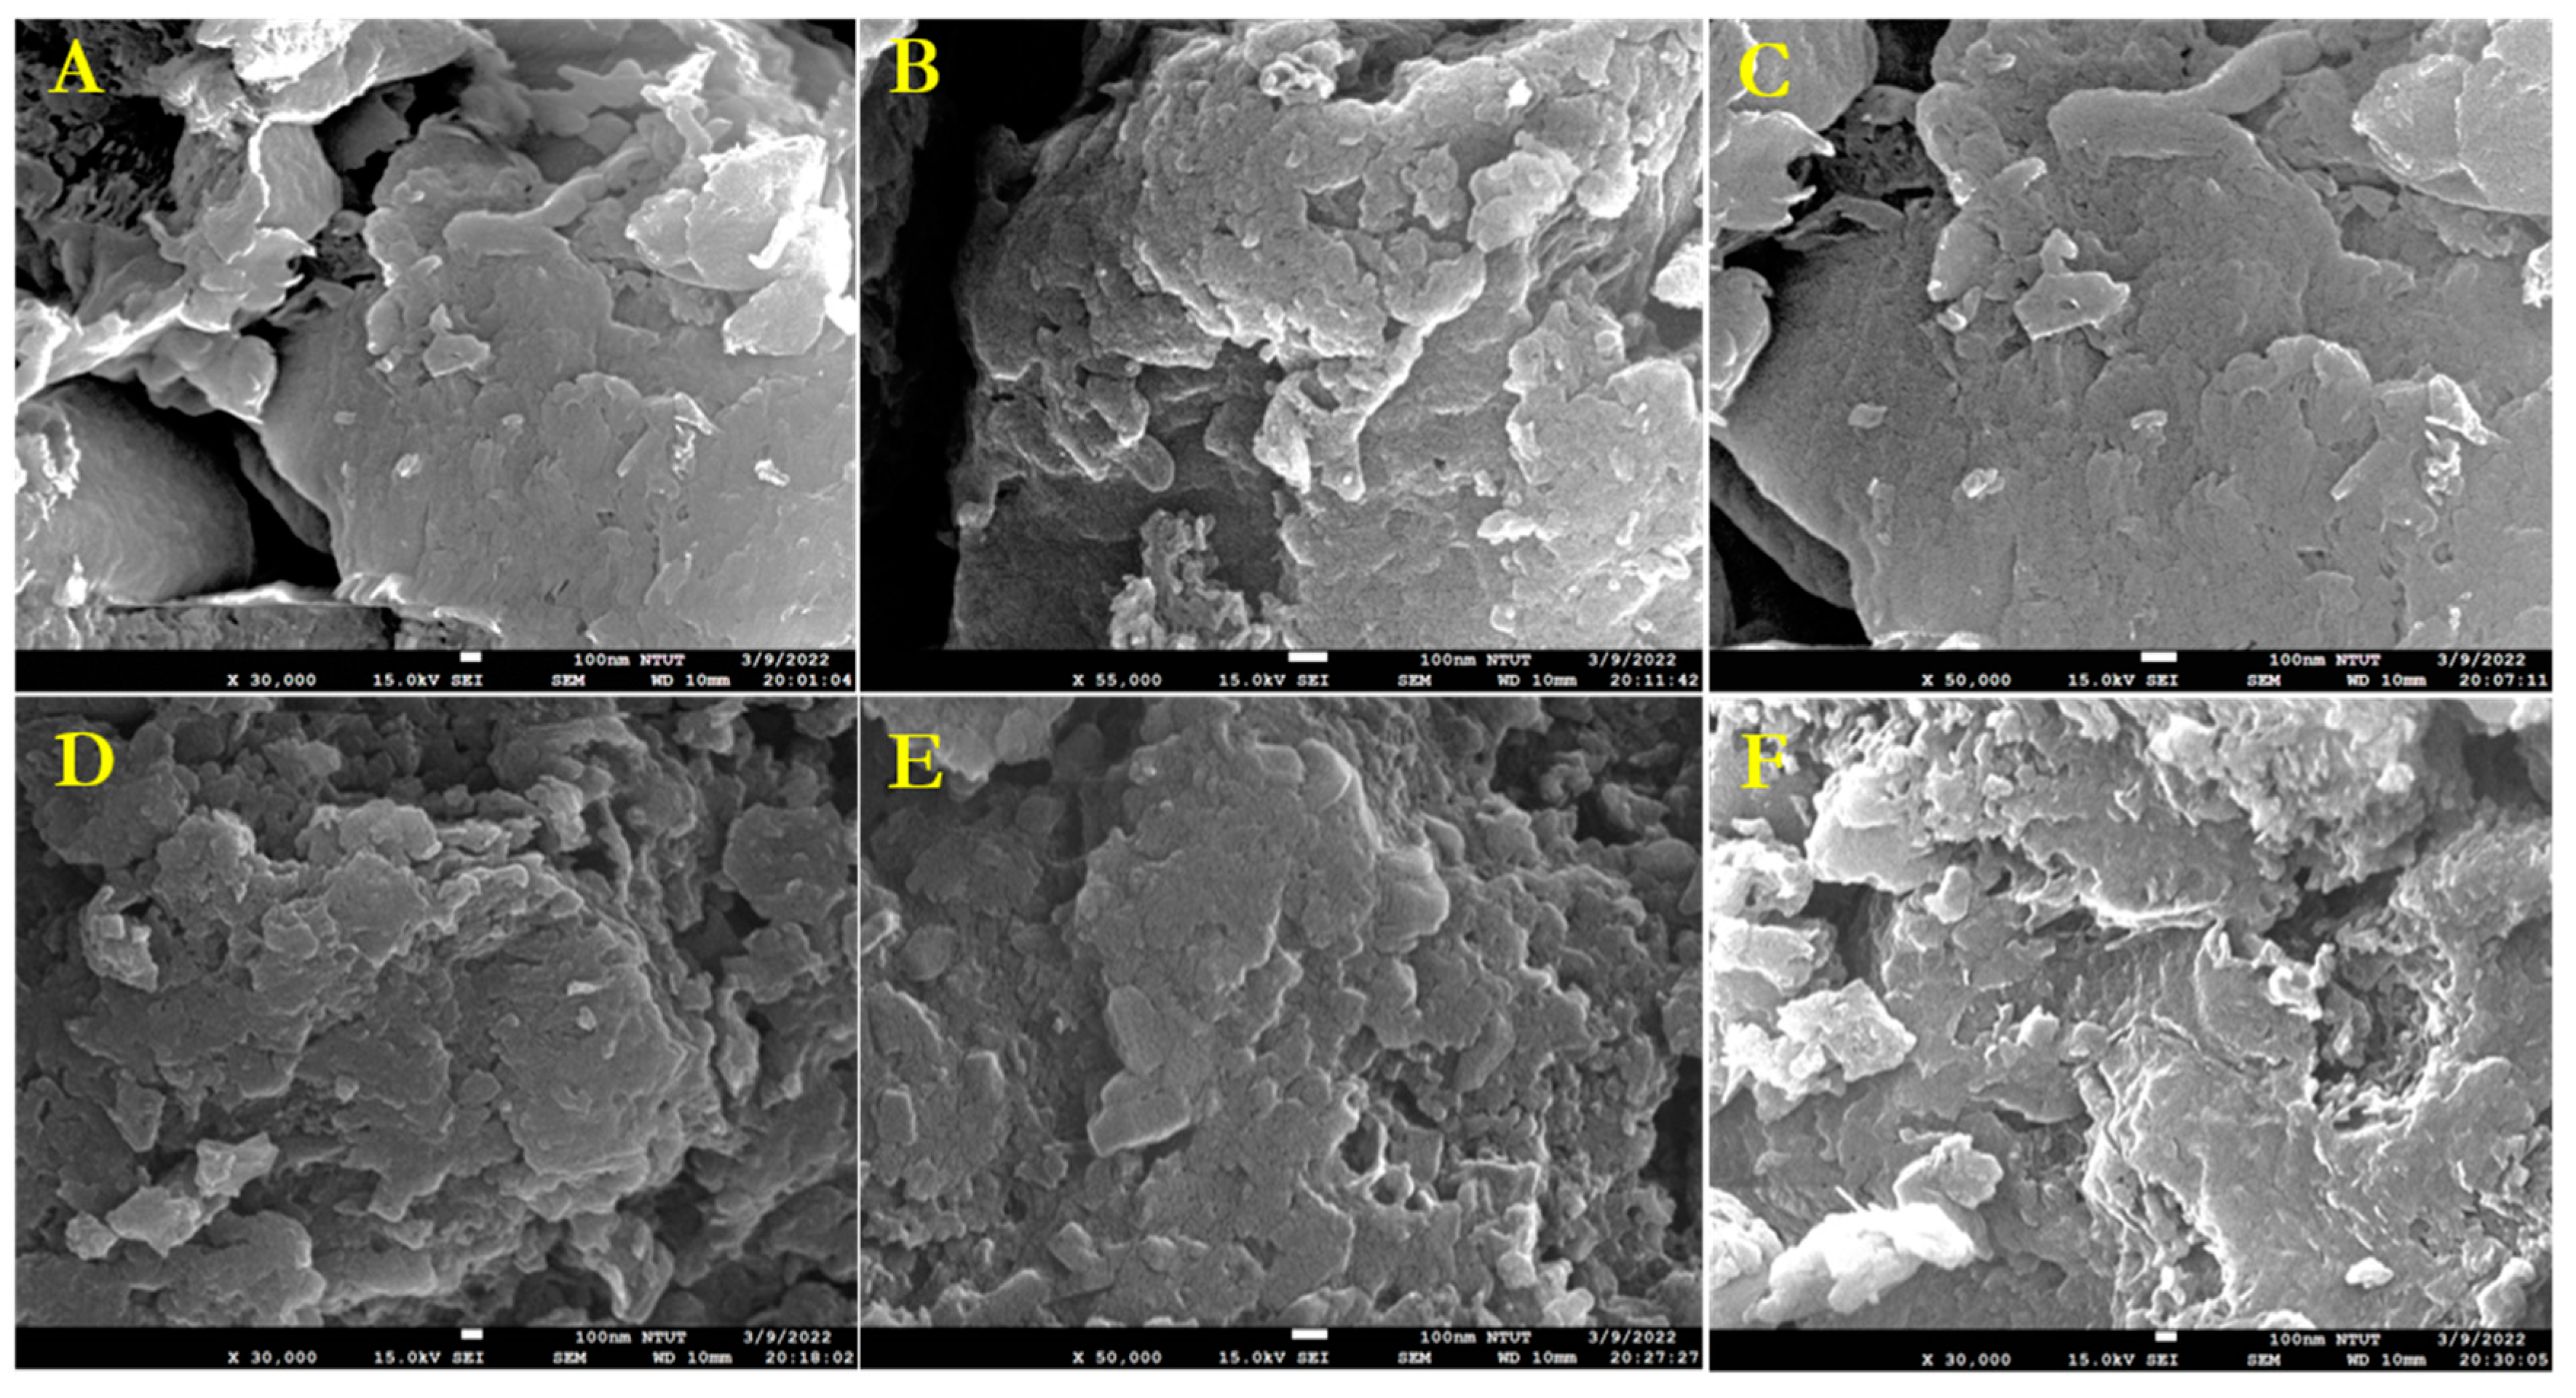
3H compound showed a similar diffraction pattern with a reduction in the peak intensity at 27.6° due to the increased interlayer distance resulting from surface functionalization by the sulfonic acid groups. The surface morphological analysis of the as-synthesized g-C
3N
4 and g-C
3N
4–SO
3H photocatalytic materials was scrutinized by Field-emission scanning electron microscopy (FE-SEM) analysis and is displayed in
Figure 2A–F. The graphite-like stacked layers of bulk g-C
3N
4 can be observed in
Figure 2A–C and the surface-functionalized g-C
3N
4–SO
3H in
Figure 2D–F. The results show that both g-C
3N
4 and g-C
3N
4–SO
3H have graphitic stacked 2D sheet-like morphologies. The results also demonstrate that the sulfonic group (–SO
3H) functionalization did not affect the structural/morphological nature of pristine g-C
3N
4.
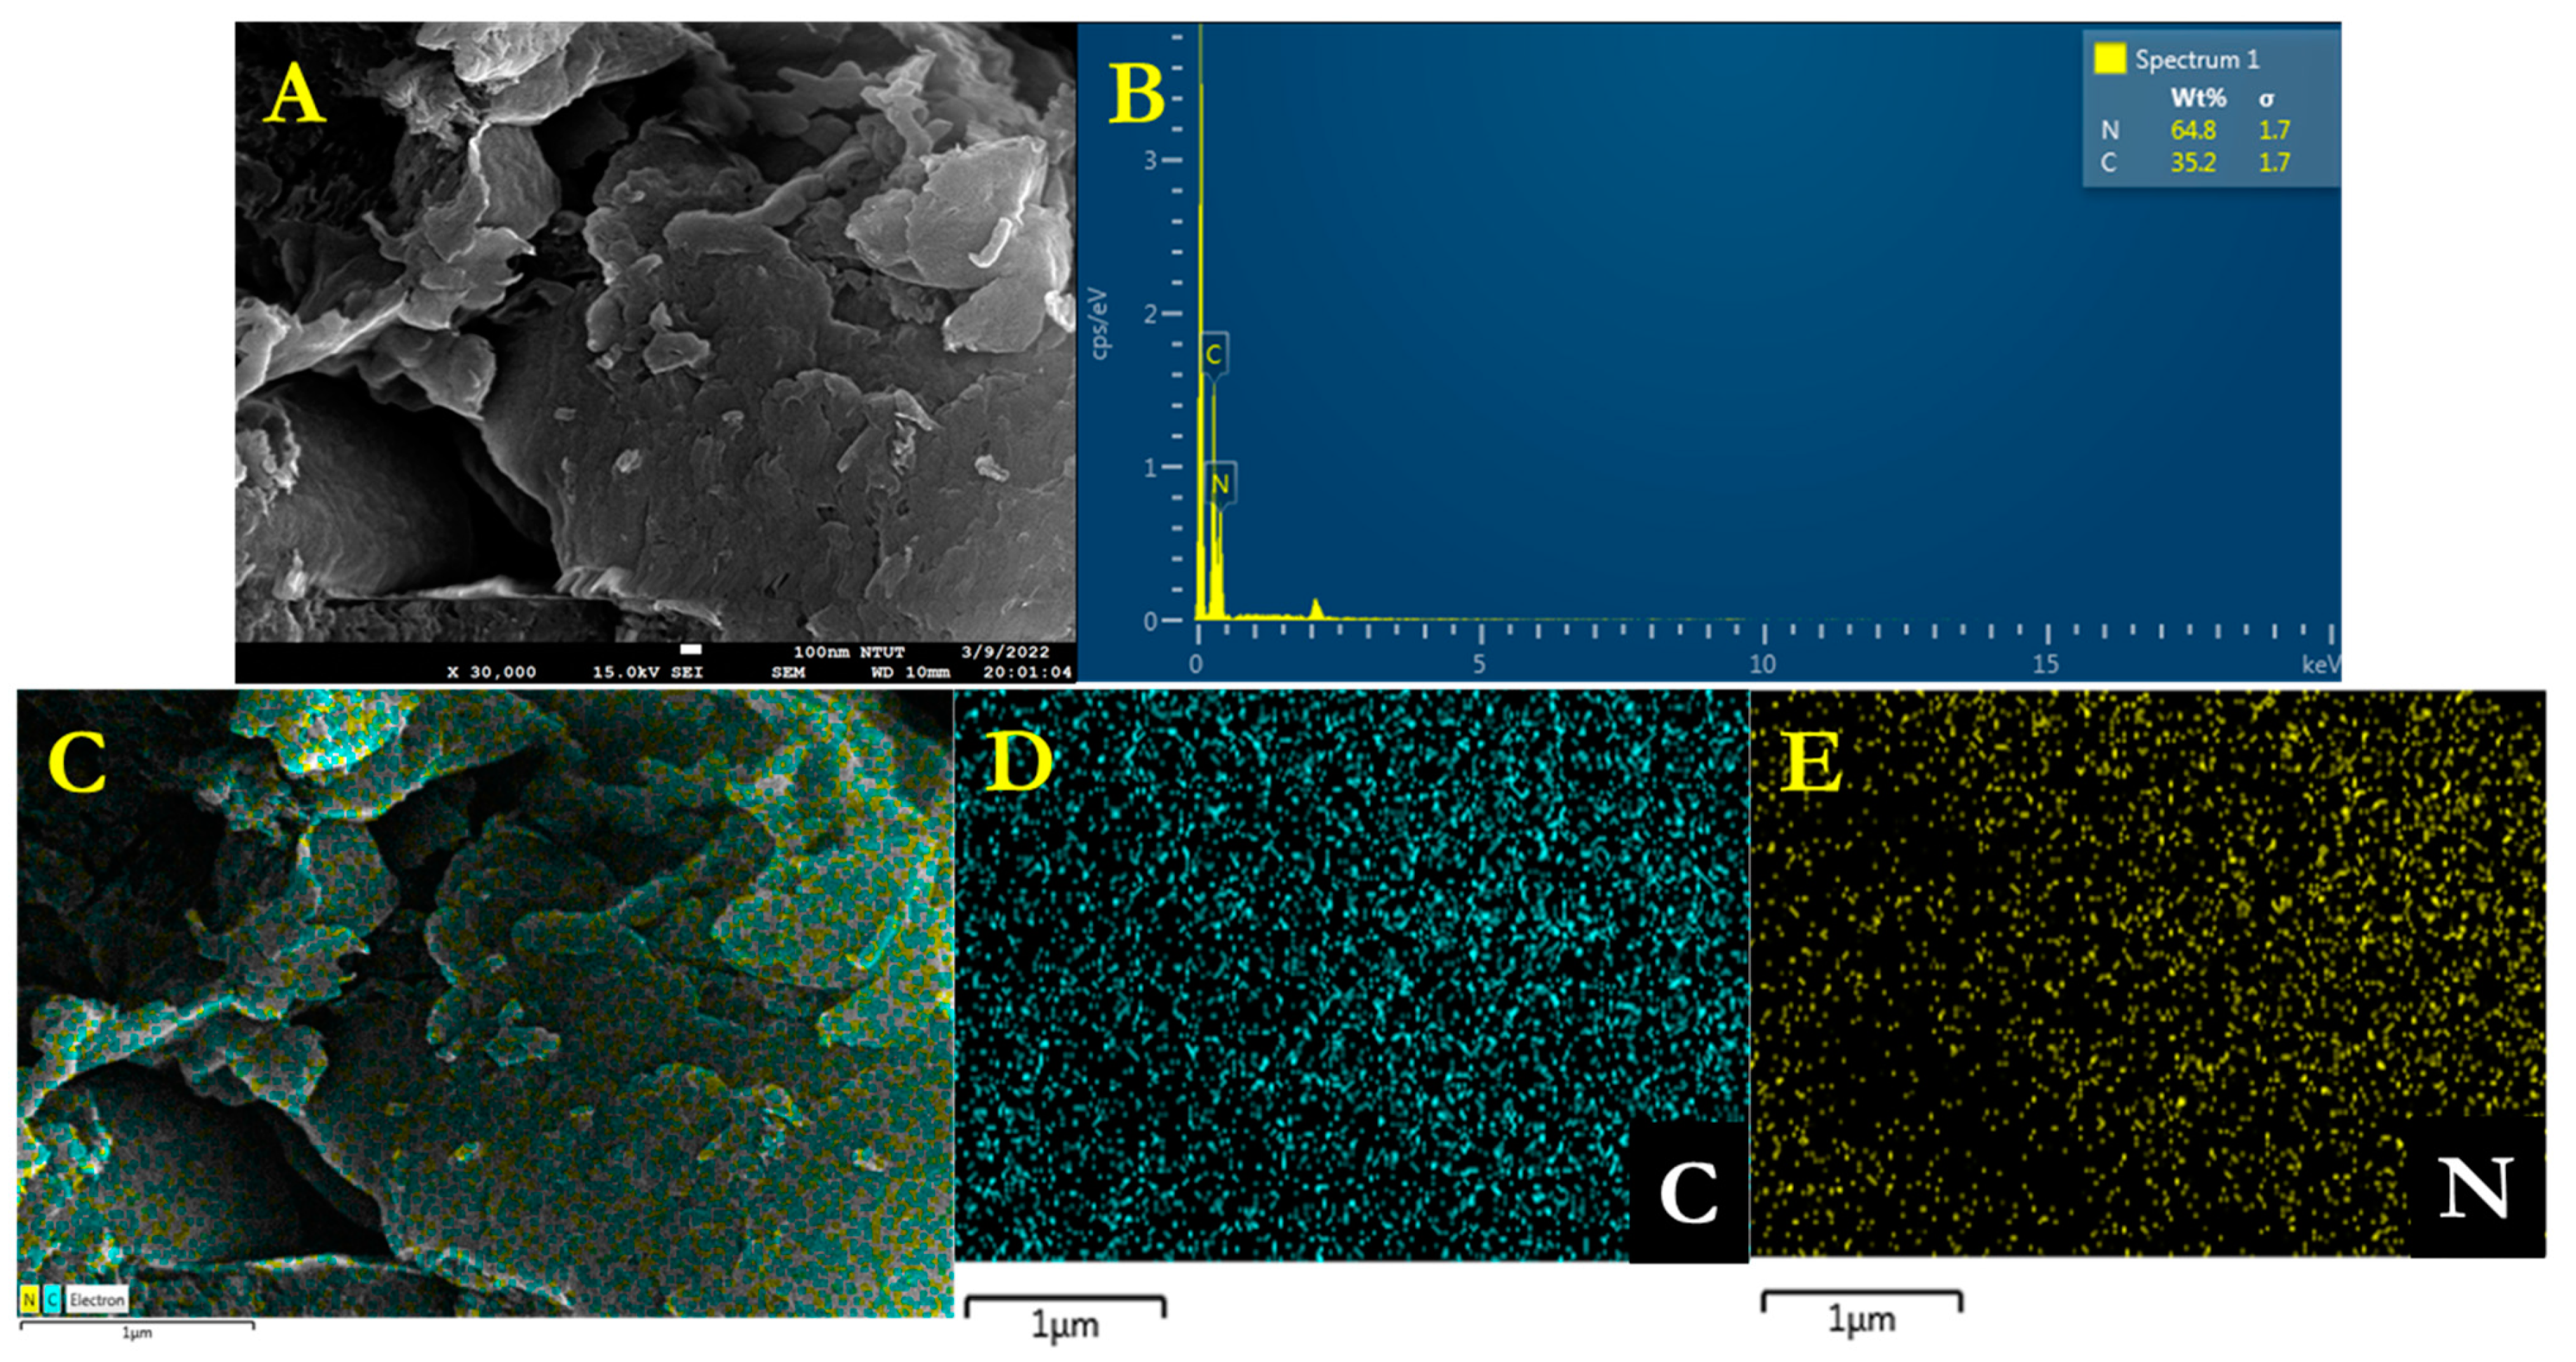
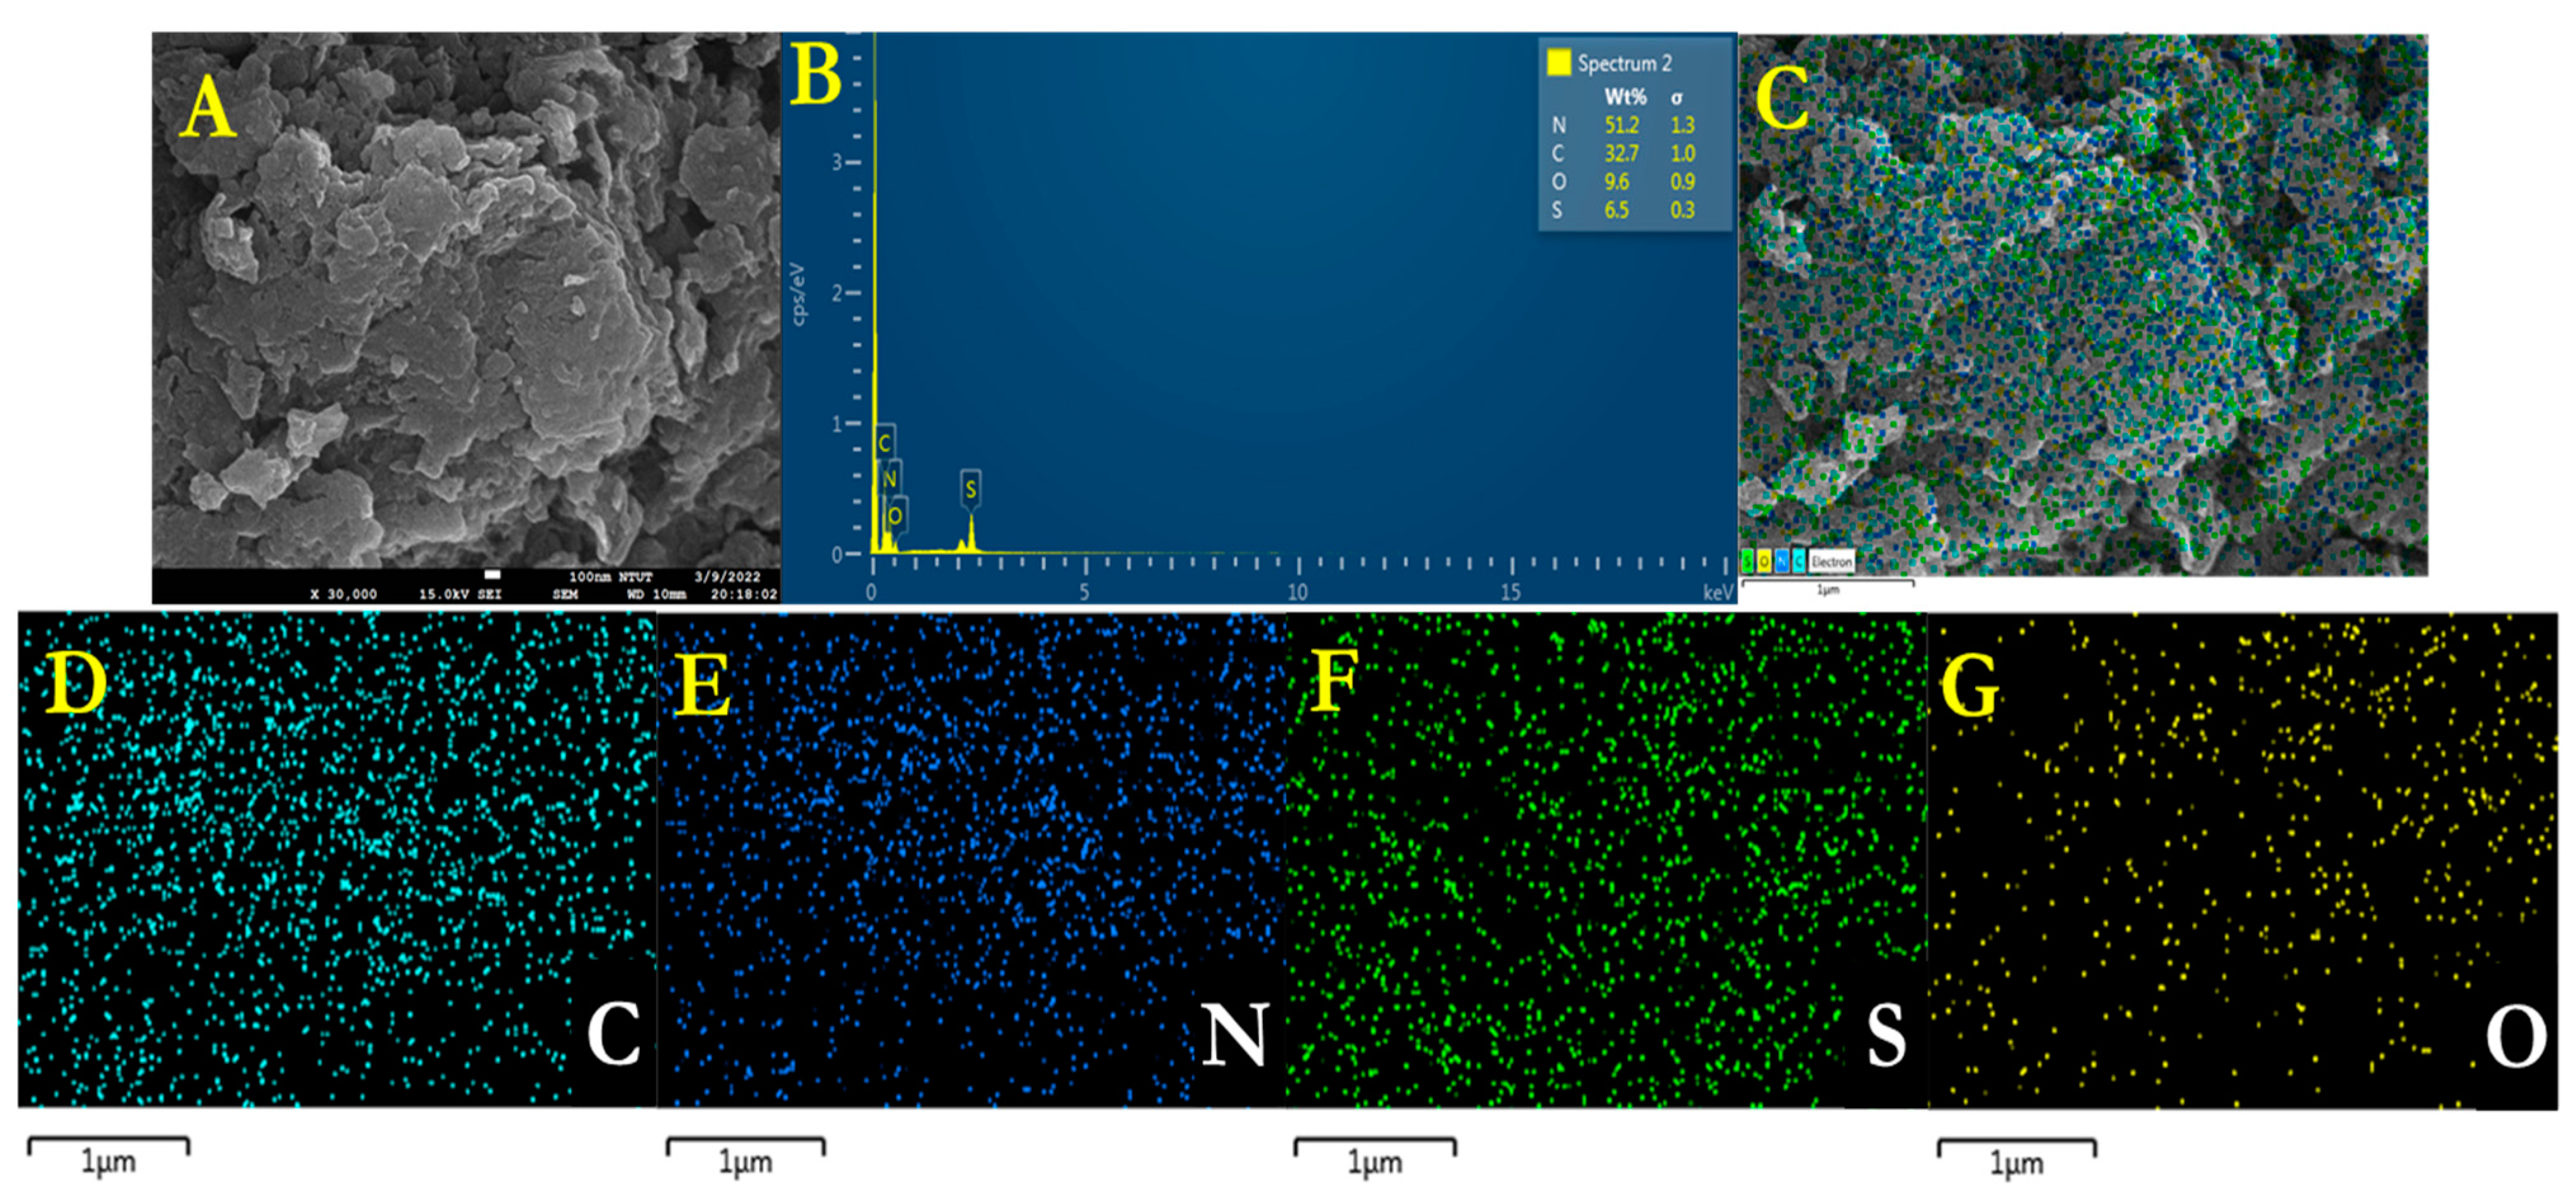
The energy dispersive X-ray (EDX) analysis with element composition and the overall elemental mapping of g-C
3N
4 and individual elements (C and N) are shown in
Figure 3A–E, where
Figure 3A,B corresponds to the EDX and
Figure 3C–E represents the elemental mapping. Likewise, the EDX spectra and the overall elemental mapping (
Figure 4A,B) and individual elements (C, N, S, and O) (
Figure 4C–G) of sulfonic acid-functionalized g-C
3N
4–SO
3H are depicted in
Figure 4A–G. Consequently, the obtained results confirm the formulated weight percentages of different elements and the uniform distribution of various elements (C, N, S, and O) from the functionalized sulfonic acid groups.
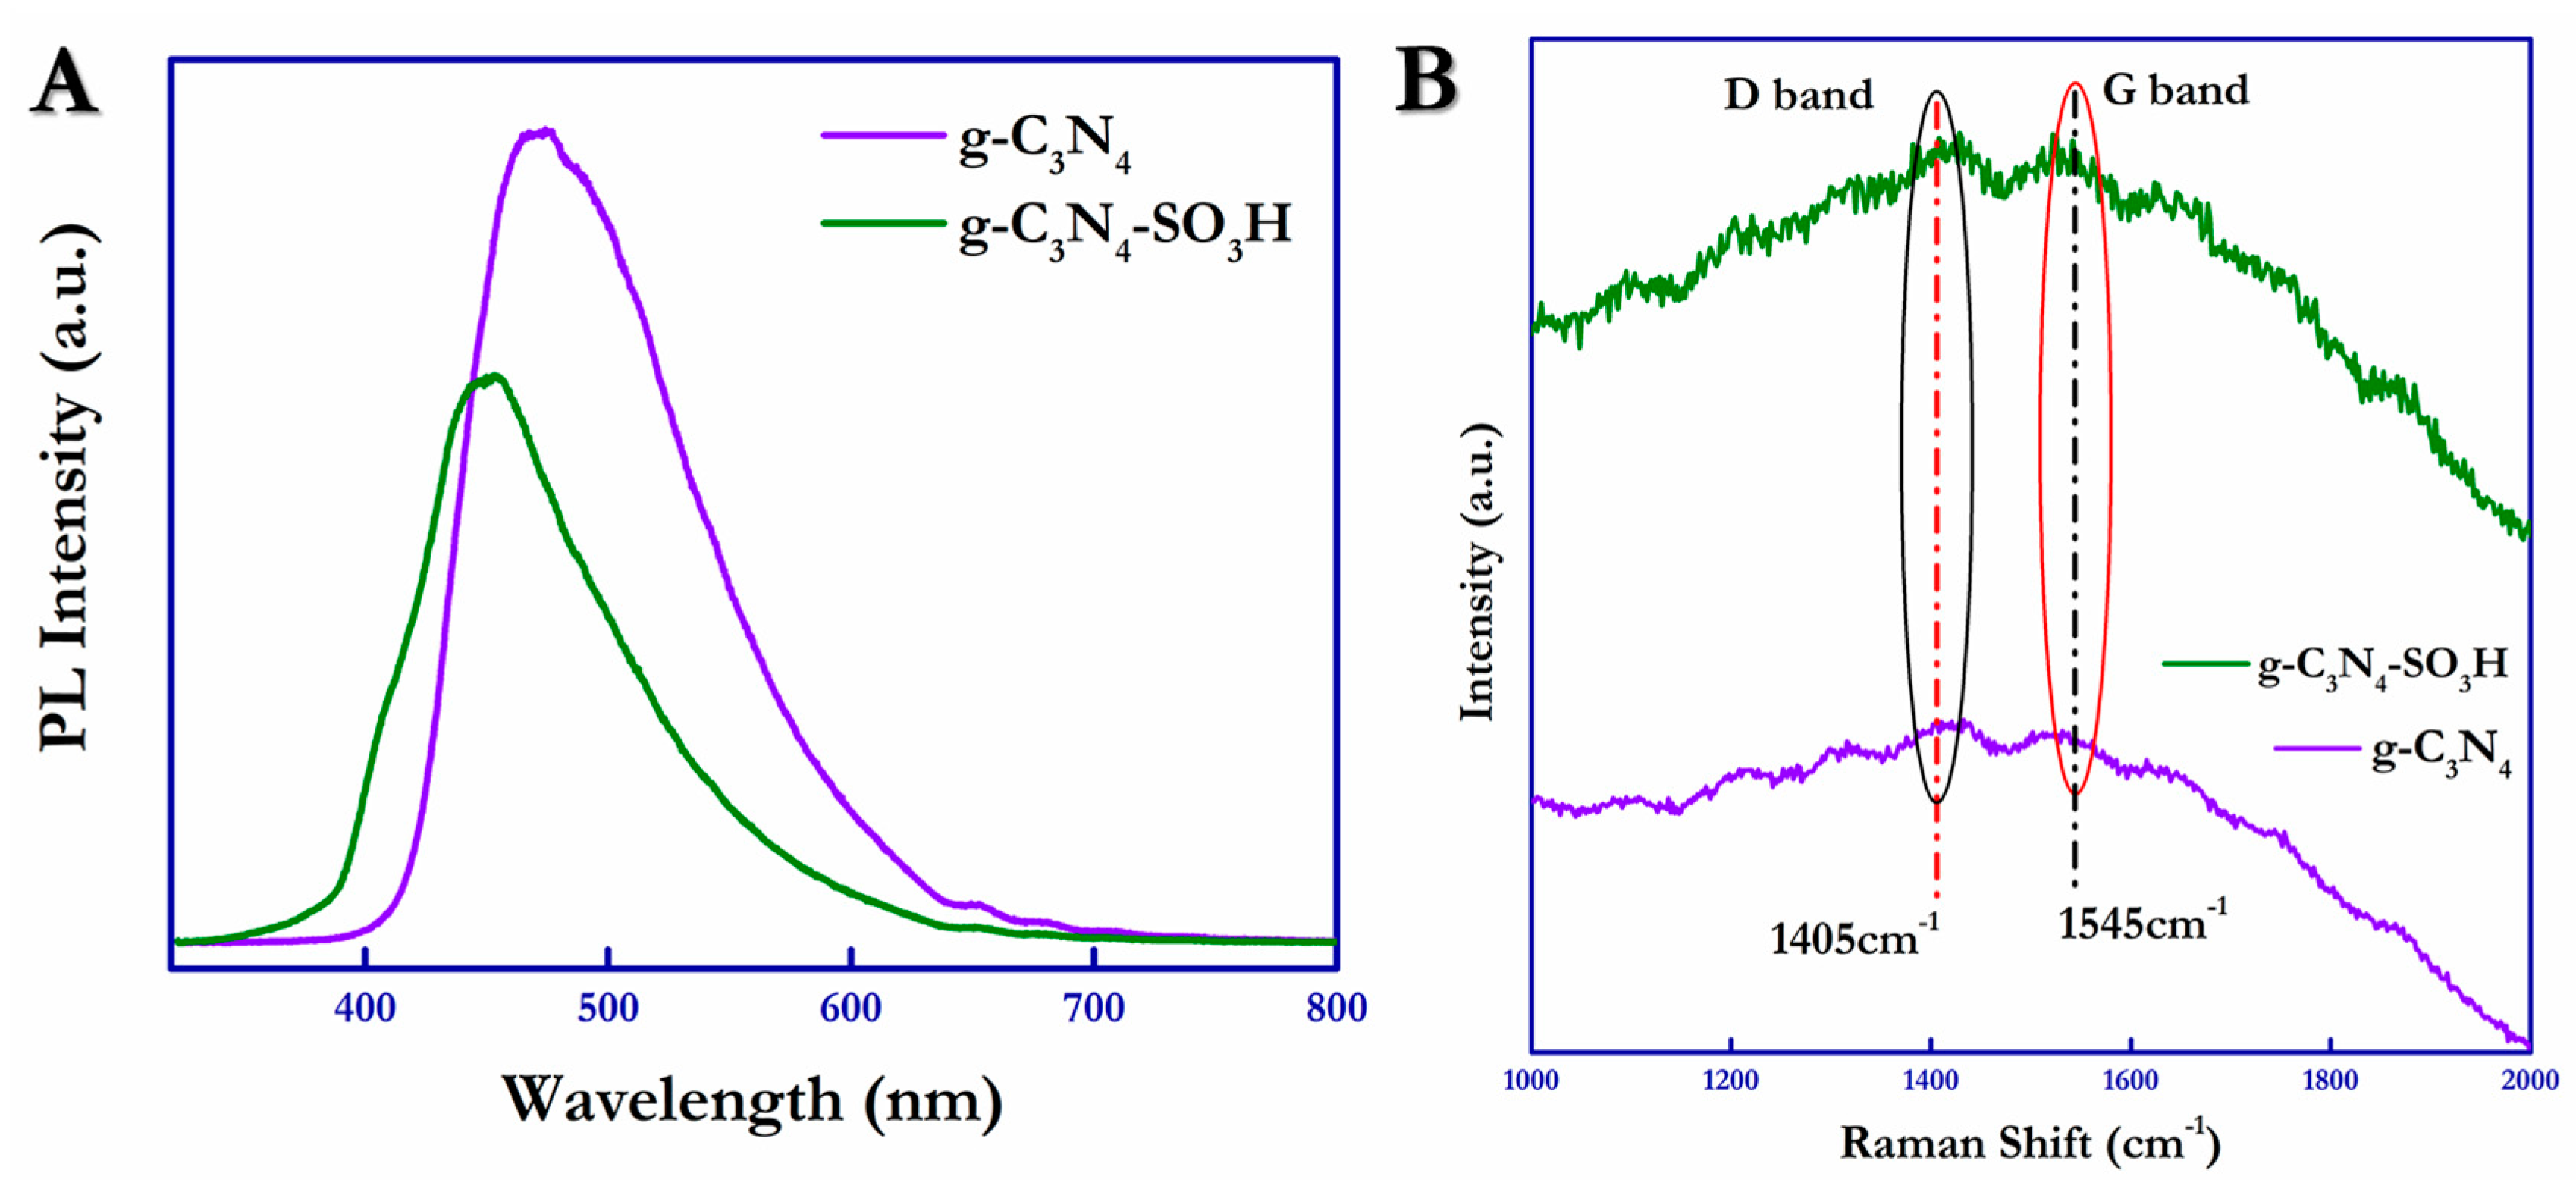
Photoluminescence (PL) emission occurs during the radiative recombination of charge carriers (electrons/holes); this was measured using the PL emission spectra and is shown in
Figure 5A. In this work, PL spectra were obtained using a 266 nm laser as an exciting source for the photocatalytic materials and were measured in the range of 350 nm to 800 nm at room temperature. From
Figure 5A, it is evident that the PL intensity of g-C
3N
4–SO
3H decreased significantly compared with g-C
3N
4 due to the reduced recombination effect exhibited by the functionalized photocatalytic material. In addition, the slight blue shift shown by g-C
3N
4–SO
3H was due to the electron-withdrawing ability of the –SO
3H present on the surface, which was confirmed by the UV-DRS. The efficiency of the catalytic materials was correlated using the full-width half maximum (FWHM) values of the PL peaks. This affirmed the extended lifetime of the photogenerated carriers (h
+/e
−), which facilitates better electron-hole separation and enhanced photocatalytic efficacy.
Furthermore, Raman spectra were obtained for the pure g-C
3N
4 and functionalized g-C
3N
4-SO
3H to measure the surface structural defects through molecular vibrations, as illustrated in
Figure 5B. From
Figure 5B, the graphitic nature and degree of graphitization of g-C
3N
4 and g-C
3N
4–SO
3H were ensured by establishing the position of the D (red line) and G (black line) bands concentrated at 1405 cm
−1 and 1545 cm
−1 [
48]. The intensity ratio (I
D/I
G) of the D and G bands, indicating the surface defect values of the materials, was calculated to be 1.00 and 1.005 for g-C
3N
4 and g-C
3N
4–SO
3H, respectively. A slight increase in the intensity ratio owing to the acid treatment for the surface functionalization indicated the increased defects on the surface of the g-C
3N
4–SO
3H photocatalytic material.
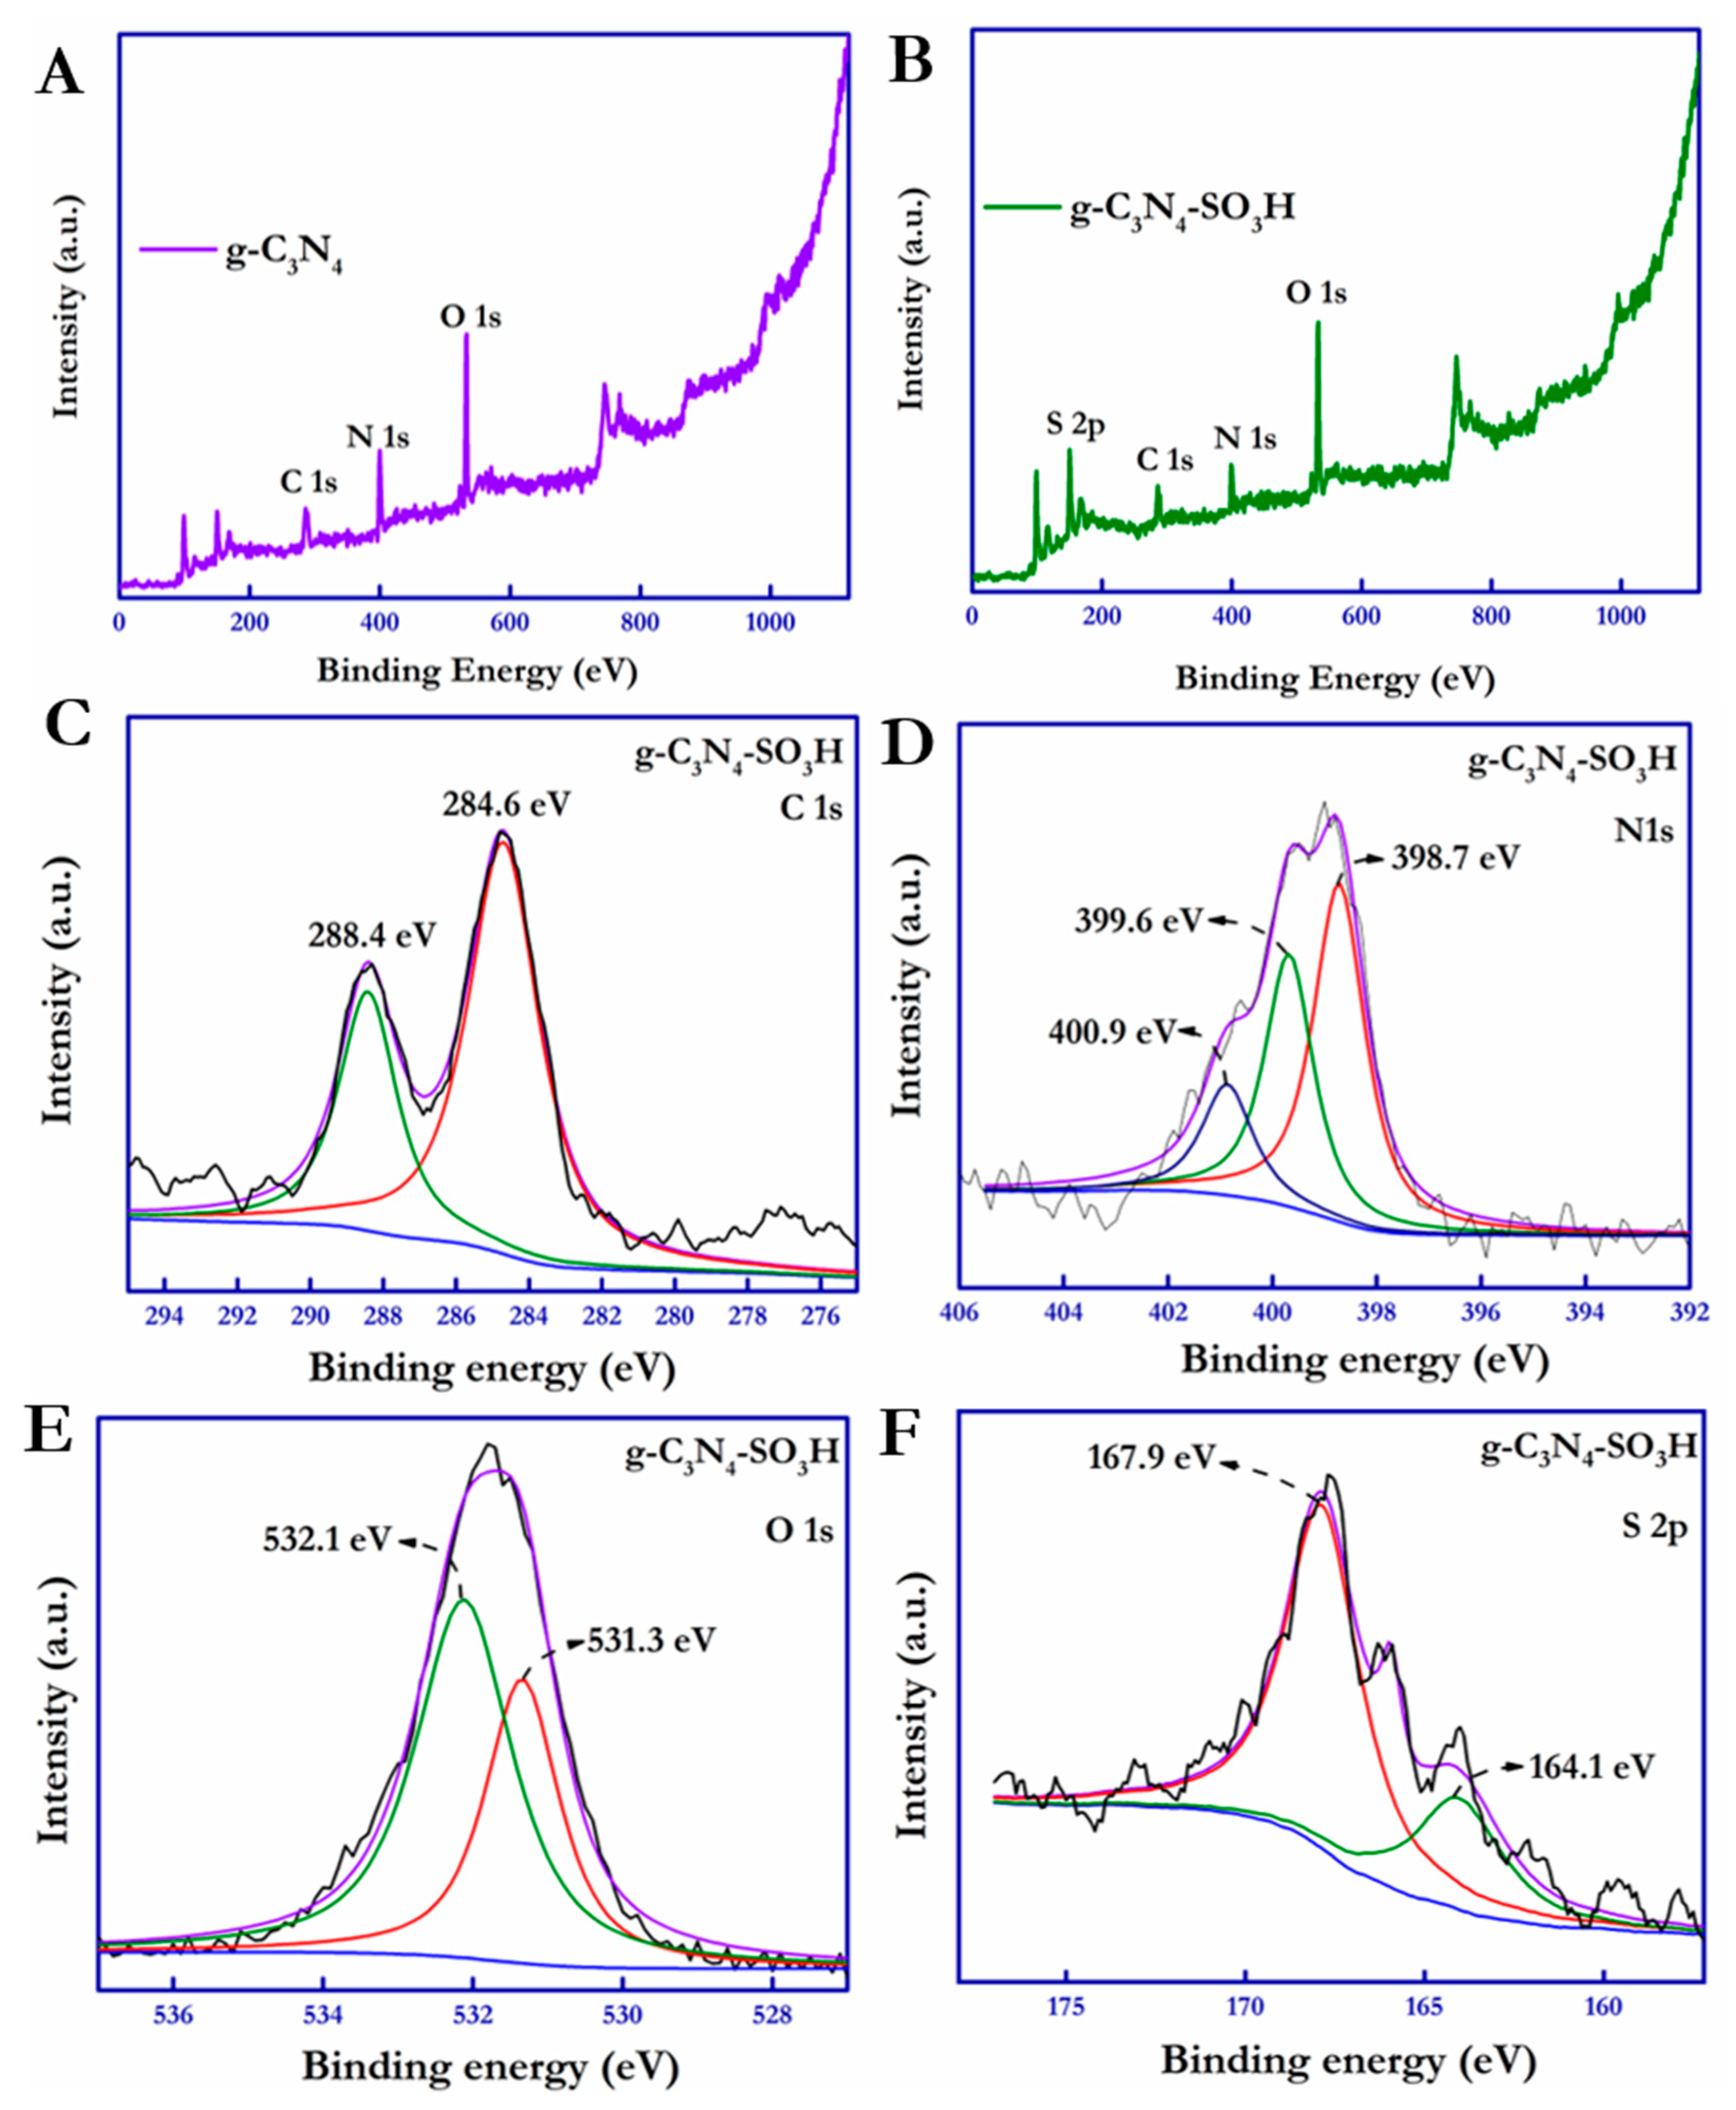
The chemical environment on the surface and the elemental composition of the as-synthesized photocatalytic materials were bolstered by the X-ray photoelectron spectroscopy (XPS) analysis. The XPS survey spectra of the g-C
3N
4 and g-C
3N
4–SO
3H materials operating in the binding energy range between 0 and 1200 eV were obtained and are shown in
Figure 6A–F.
Figure 6A,B displays the complete spectrum of g-C
3N
4 and g-C
3N
4–SO
3H. The high-resolution deconvoluted spectra of individual elements were adjusted with respect to the adventitious carbon peak at 284.6 eV.
Figure 6C shows the C
1s spectra of g-C
3N
4–SO
3H, deconvoluted to two separate peaks owing to the sp
2-hybridized carbon on the surface at 284.6 eV and the C–(N)
3 carbon present in the heptazine ring structure [
49].
From
Figure 6D, three distinct peaks of the high-resolution N
1s spectrum were obtained for the C–N = C, N–(C)
3, and C–NH groups at 398.7, 399.6, and 400.9 eV, respectively [
50]. The C
1s and N
1s spectra of g-C
3N
4–SO
3H that shifted towards higher binding energies than the unmodified g-C
3N
4 (
Figure S1) demonstrated the increased shielding effect owing to the high electron density caused by the surface –SO
3H groups. In addition, the high-resolution spectra of O
1s were deconvoluted into two distinct peaks located at 531.3 and 532.1 eV, attributed to S = O and S–OH, respectively [
51]. On the other hand, the XPS core-level spectra of S
2p deconvoluted into two discrete peaks located at 164.1 and 167.9 eV were assigned to the H–S and N–SO
3 groups, respectively [
52] (
Figure 6E,F).
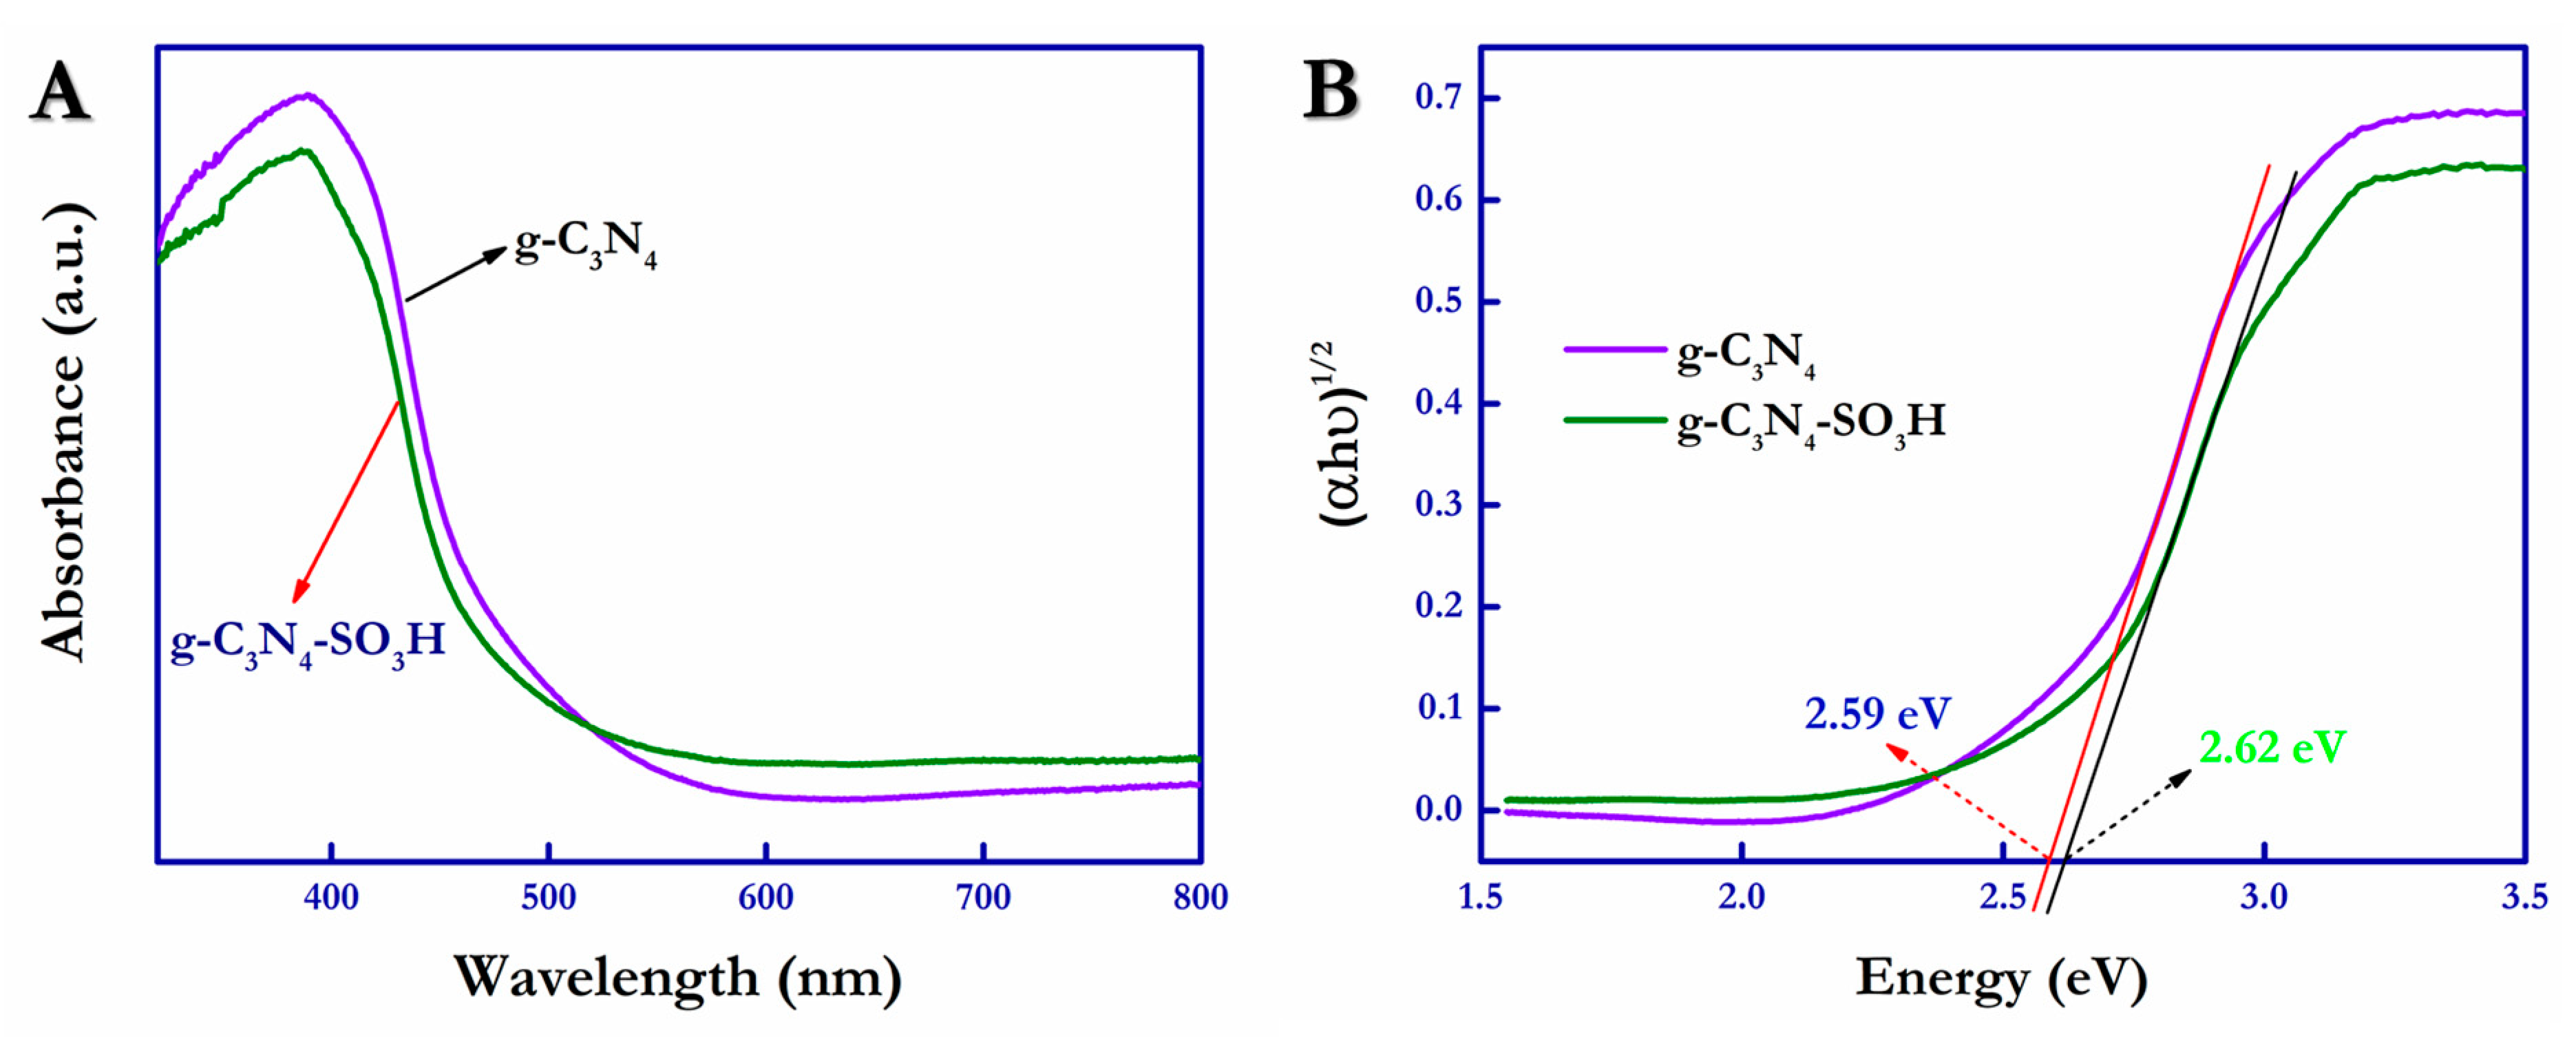
The electronic bandgap values and photo-absorption characteristics of the as-synthesized g-C
3N
4 and g-C
3N
4–SO
3H photocatalytic materials were calculated and measured using the UV–visible diffuse reflectance spectroscopy (UV-DRS) method (
Figure 7A,B).
Figure 7A shows that the optical absorption band edges of the synthesized g-C
3N
4 and g-C
3N
4–SO
3H materials were positioned at ~471 nm and ~459 nm, respectively. This slight blue shift observed in the spectra was due to the quantum confinement effect exerted by the g-C
3N
4–SO
3H material in its layered structure [
53]. Additionally, the electronic bandgap energy of the materials of interest was calculated using Tauc plots by employing the Kubelka–Munk formula.
where α = the absorption coefficient; h = Planck’s constant; ν = frequency; A = proportionality constant; E
g = bandgap energy, with n = ½ for direct allowed transition and n = 2 for indirect allowed transition [
54]. From the obtained values of UV-DRS, the Tauc plot was drawn and is shown in
Figure 7B; the bandgap energies of g-C
3N
4 and g-C
3N
4–SO
3H were 2.61 eV and 2.64 eV, respectively. The g-C
3N
4–SO
3H photocatalytic material had slightly increased bandgap energy compared with the pristine g-C
3N
4 photocatalyst.
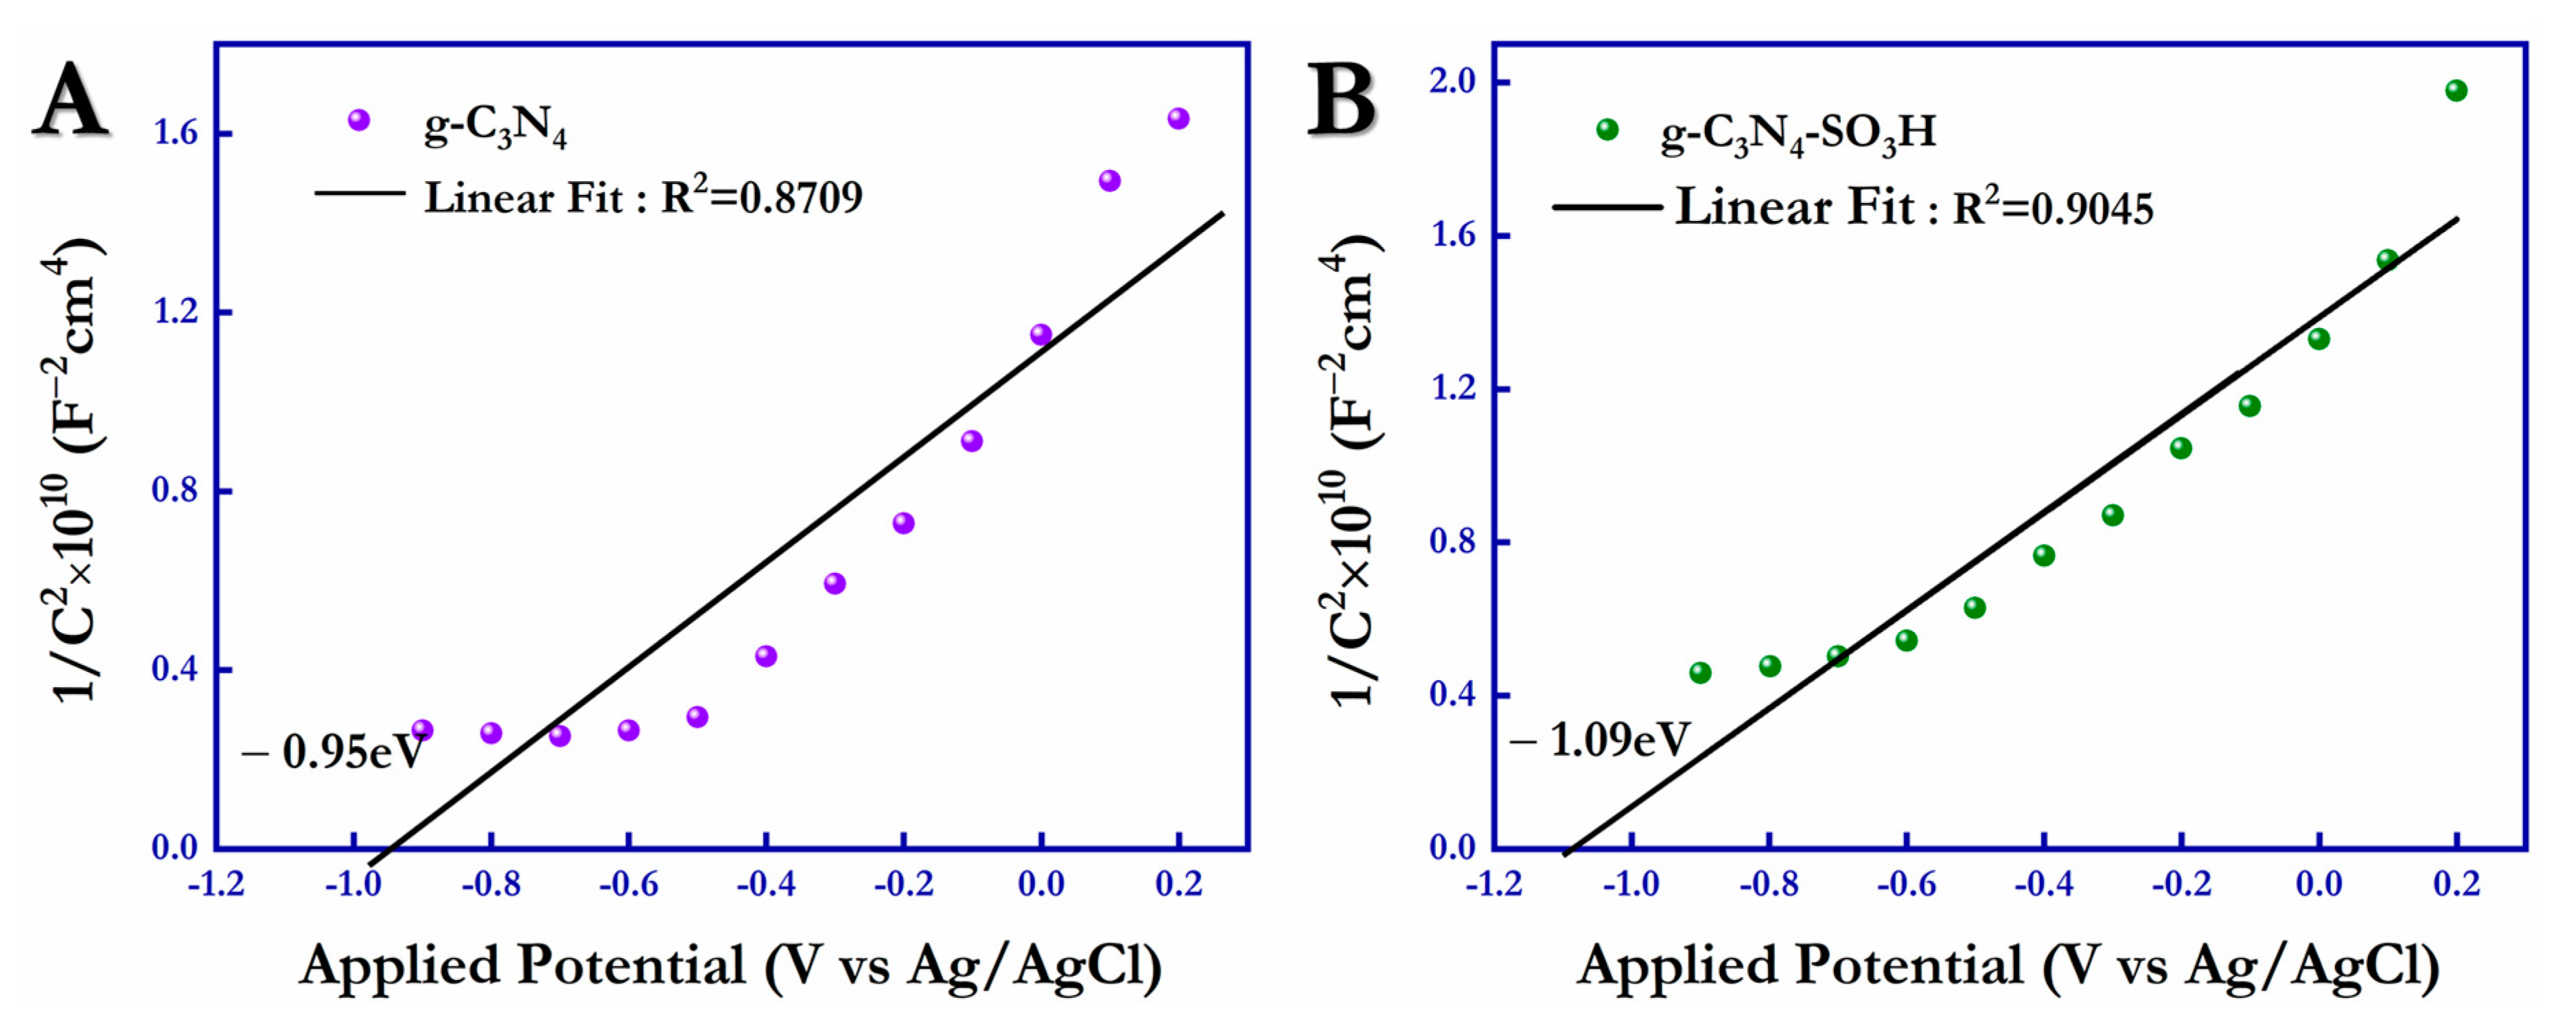
The flat band potentials (V
FB) of the photocatalysts, g-C
3N
4 and g-C
3N
4–SO
3H, were obtained using Mott–Schottky (M-S) analysis in the presence of the supporting electrolyte (0.1 M Na
2SO
4) under dark conditions. In
Figure 8A,B, the M-S plots of pure g-C
3N
4 and functionalized g-C
3N
4–SO
3H are illustrated, and from the positive slope obtained, the n-type semiconducting nature of g-C
3N
4 due to the n-type nitrogen donor atoms was affirmed. Based on the linear fitting of the obtained data, the conduction bands for the g-C
3N
4 and g-C
3N
4–SO
3H materials were measured with the intercept, and the values were −0.95 eV and −1.09 eV, respectively. Thus, the Mott–Schottky analysis confirmed that the CB of g-C
3N
4–SO
3H (−1.09 V) shifted to a more negative potential than the bulk g-C
3N
4 (−0.95 V), resulting in g-C
3N
4–SO
3H being the capable candidate for both photocatalytic oxidation and reduction reactions.
2.1. Photocatalytic Reduction of Cr (VI) and Oxidation of SSY
The photocatalytic reduction reactions were performed using the 100 ppm aqueous solution (0.1 g L
−1) of potassium dichromate (K
2Cr
2O
7) as the source of hexavalent chromium (Cr
6+), and 40 mL of this aqueous solution (pH = 2.58) was used in the presence of 10 mg of the g-C
3N
4 and g-C
3N
4–SO
3H catalysts. The photocatalytic reaction was accomplished under visible light (≥400 nm) irradiation and also in the presence of an organic sacrificial agent, citric acid (10 mg), to trap the holes from recombination. Likewise, the photocatalytic oxidation of the food colorant Sunset Yellow FCF (SSY) was performed using the aqueous solution (50 ppm) of Sunset Yellow FCF (pH = 2.92) under visible light irradiation in the presence of 10 mg of the g-C
3N
4 and g-C
3N
4–SO
3H photocatalytic materials. The entrapment of holes with the sacrificial agent was restricted to oxidize with the h
+ charge carriers. The photodegradation processes of Cr
6+ and SSY were monitored by the UV–visible spectrophotometer at regular intervals, and the degradation percentage was also calculated using the equation given below (Equation (2)):
where C
o = initial concentration; C = concentration at specific intervals.
Figure 9A,B shows the UV–Vis profiles for the photocatalytic reduction of hexavalent chromium (100 ppm) using bulk g-C
3N
4 and g-C
3N
4–SO
3H in the presence of citric acid (scavenger). Based on a comparison of the catalytic activity of the unmodified g-C
3N
4 (19.15%) and surface-functionalized g-C
3N
4–SO
3H (99.56%) photocatalytic material, the activity of the sulfonic acid-functionalized material was more than five times that of pristine carbon nitride, and the highest degradation rate was 99.56% within 16 min of visible light irradiation. The photooxidation activity by the g-C
3N
4–SO
3H (99.61%) photocatalyst towards the SSY was almost double that of the bulk g-C
3N
4 (53.74%), as shown in
Figure 9C,D. The final concentrations of Cr (VI) and SSY after the photoredox reactions over the g-C
3N
4–SO
3H catalyst were 0.36 mg/L, and 0.15 mg/L, respectively. The enhanced performance of the –SO
3H-modified g-C
3N
4 was nearly ~5.2 times higher than that of the pristine g-C
3N
4 sample; the increase in photocatalytic efficiency was mainly due to the high photogenerated electron-hole separation efficiency, higher surface electron transportability, and reduced charge recombination rates due to the high electronegativity of the surface-functionalized –SO
3H groups.
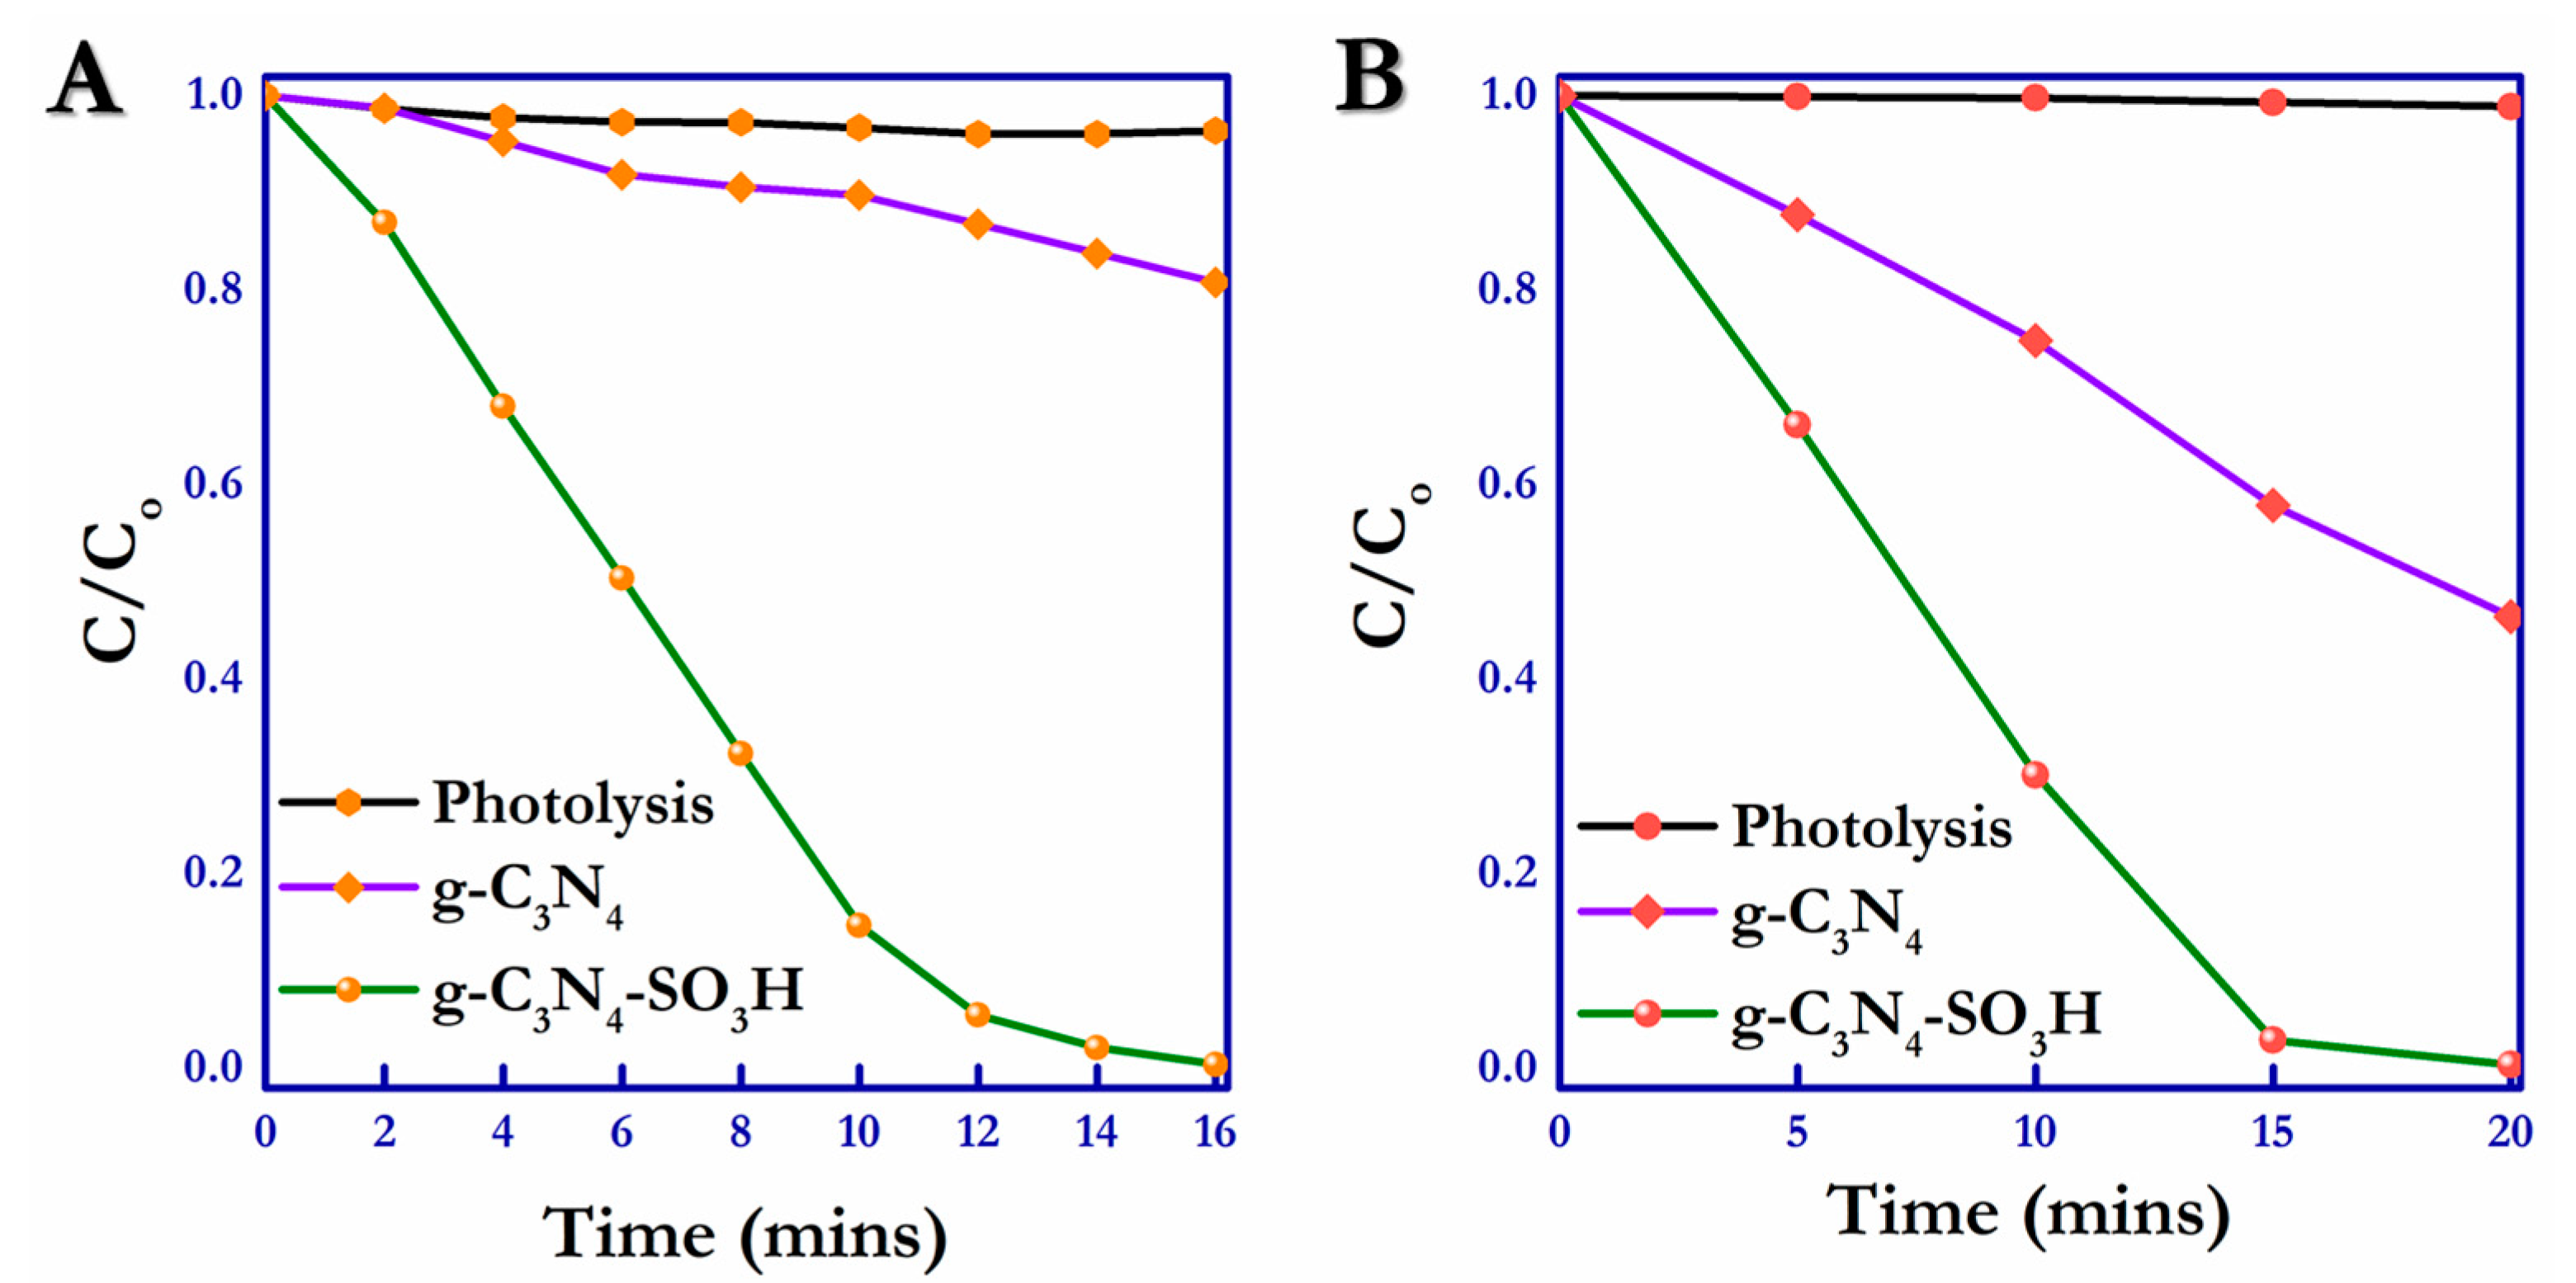
Under the same experimental conditions, the hexavalent chromium species and SSY did not degrade without the catalytic materials. Their comparative photolysis study is illustrated in
Figure 10A,B. The surface-modified g-C
3N
4–SO
3H material had fivefold activity towards the photoreduction of Cr (VI) and twofold activity towards the SSY compound compared to the bulk pristine g-C
3N
4, indicating the immense enhancement in the photocatalytic activity by the –SO
3H modification, which facilitated electron absorption and increased charge separation. In the meantime, the sulfonic acid group present in the modified carbon nitride material intensified the concentration of photogenerated electrons, enhancing the photoreduction and permitting the covering of the photogenerated holes during the photooxidation process.
2.2. The Possible Mechanism for the Photoreduction of Cr (VI) and Photooxidation of SSY
Under visible light irradiation, the g-C
3N
4–SO
3H photocatalyst underwent a photoexcitation reaction, and the photogenerated charge carriers (e
−/h
+) were separated. The photoexcited electrons moved towards the conduction band. They were readily available for the photoreduction reaction (Cr (VI)), where the recombination of excited species was hindered by the addition of a sacrificial agent (citric acid). In contrast, when the photocatalytic reactor was added with catalytic material (SSY) under visible light irradiation, the photogenerated h
+ species present in the valence band underwent a photooxidation reaction since the sacrificial hole trapping agent was not added. The enhanced photoactivity of the g-C
3N
4–SO
3H material was mainly influenced by the surface-functionalized sulfonic groups. Due to the strong electronegativity of the sulfonic groups, the photoexcited electrons migrated rapidly to the catalyst surface. This process can increase the surface electron density, which is beneficial for the photoreduction reactions. Furthermore, it effectively separates the photo-induced charge carriers and reduces recombination, which is also helpful for the photooxidation reactions. The photo–redox reactions over the g-C
3N
4–SO
3H surface can be ascribed as the following steps (Equations (3)–(5)):
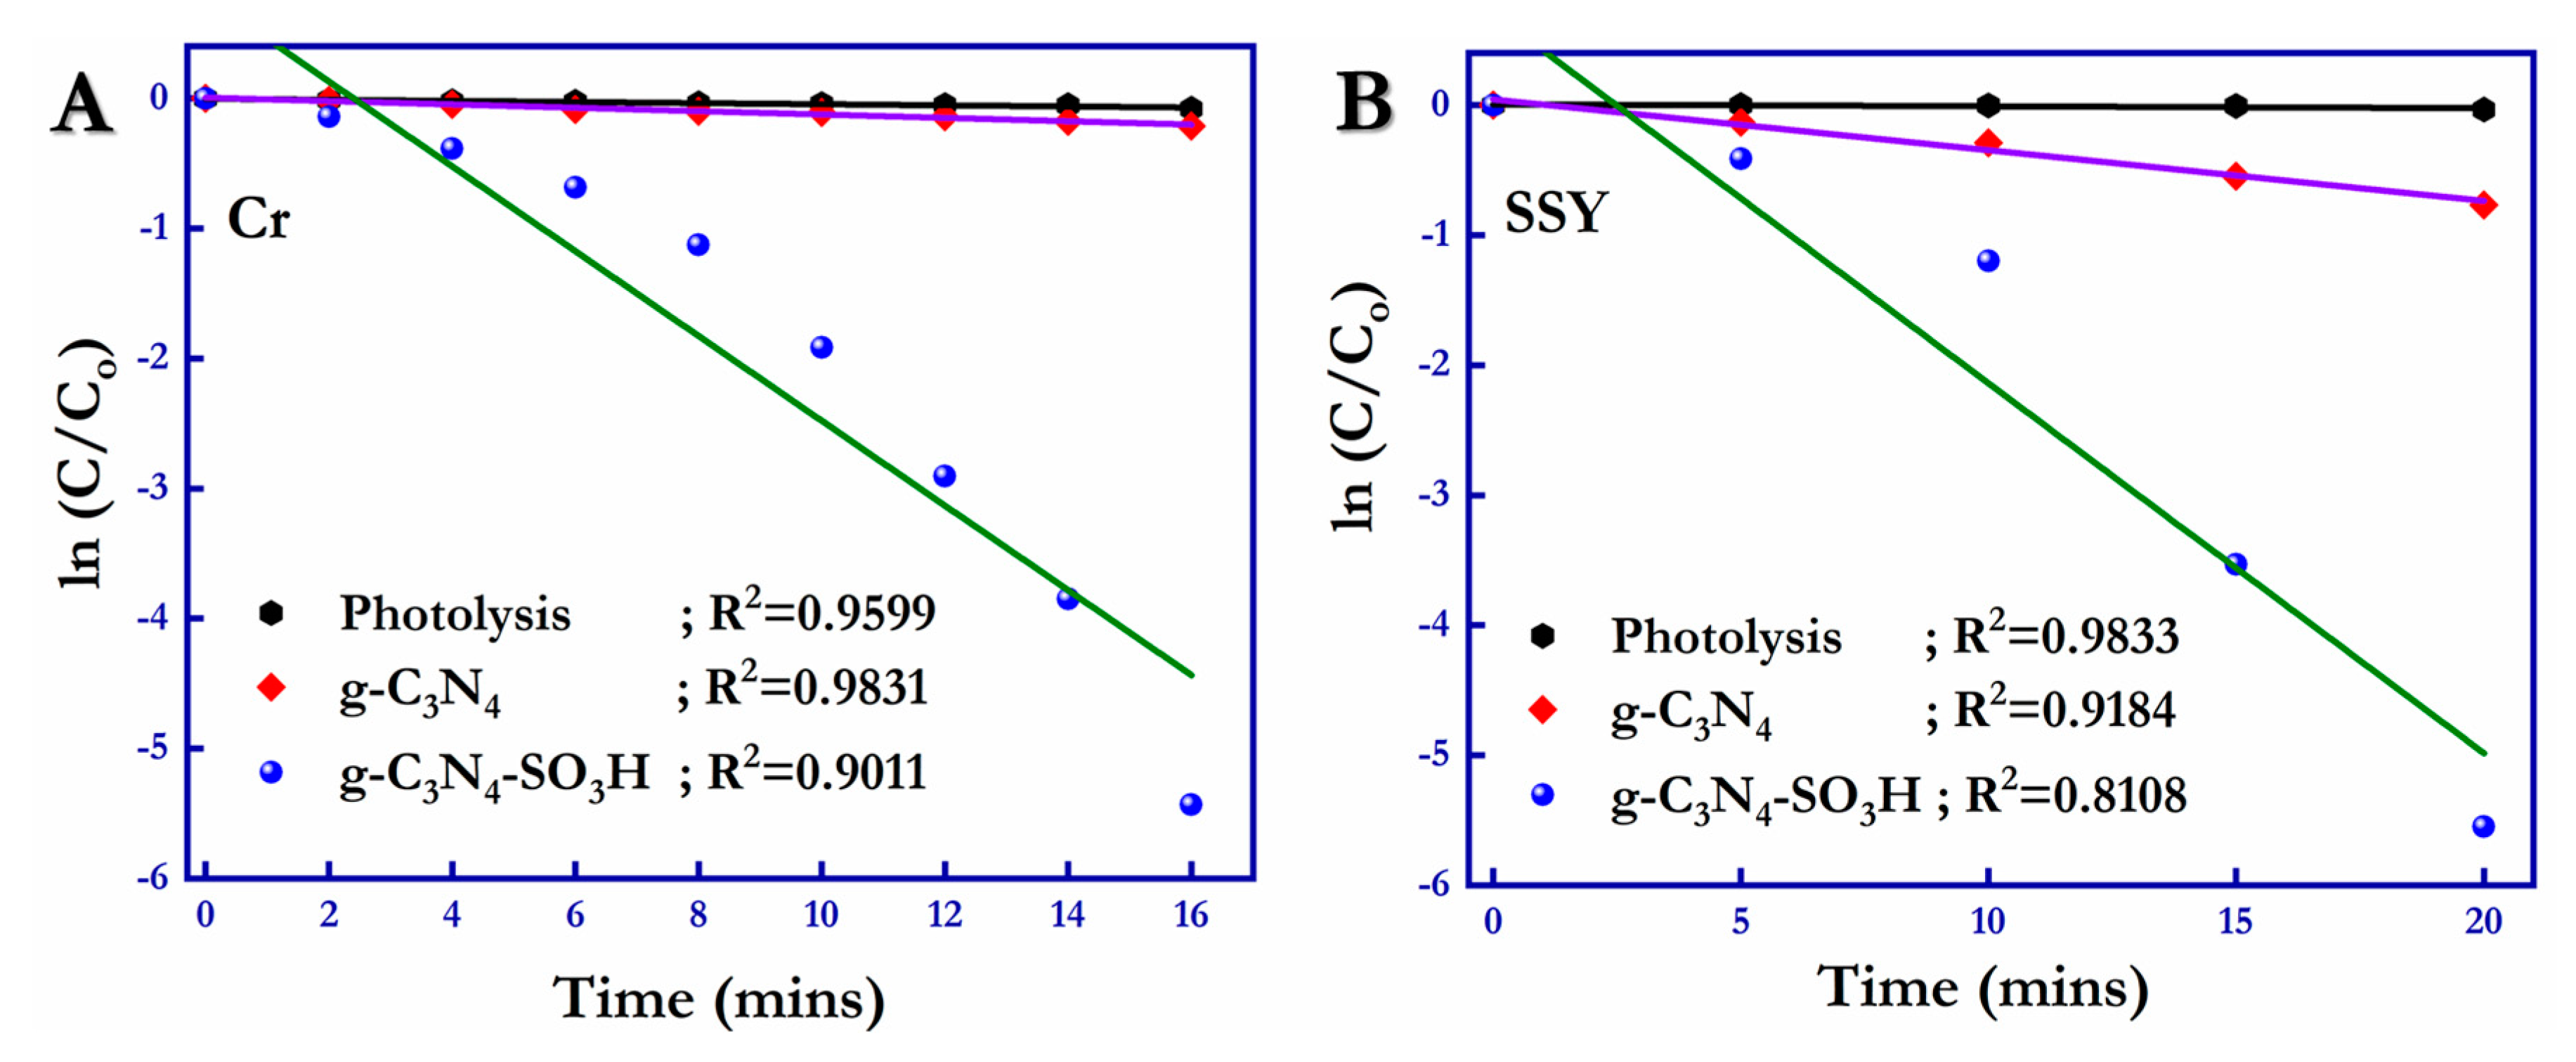
with the compilation of the photocatalytic behaviors of the g-C
3N
4 and g-C
3N
4–SO
3H semiconductor materials obtained and mentioned above, the relationship between the ln(C/C
o) and the degradation time was formulated (
Figure 11A,B) [
55], following pseudo-first-order kinetics (Equation (6)) for the photodegradation of Cr (VI) and SSY in the presence of photocatalytic materials.
where C is the concentration of SSY and Cr (VI) at time (t); C
o is the initial concentration of Cr (VI) and SSY (t = 0); K
app is the rate constant of the redox reactions; and t is the irradiation time or reaction time. For the photoreduction reaction of hexavalent chromium (Cr (VI)), g-C
3N
4–SO
3H showed a rate constant (K
app) of 0.783 min
−1, which was 313.2- and 142.36-fold higher compared to that of the blank (0.0025 min
−1) and g-C
3N
4 (0.0055 min
−1), respectively. The rate constant for the photooxidation of SSY was 0.706 min
−1 for the g-C
3N
4–SO
3H photocatalytic material, which was 117.67 times higher than that of the blank (0.0060 min
−1) and 16.37 times higher than that of the g-C
3N
4 (0.0431 min
−1) photocatalytic material.
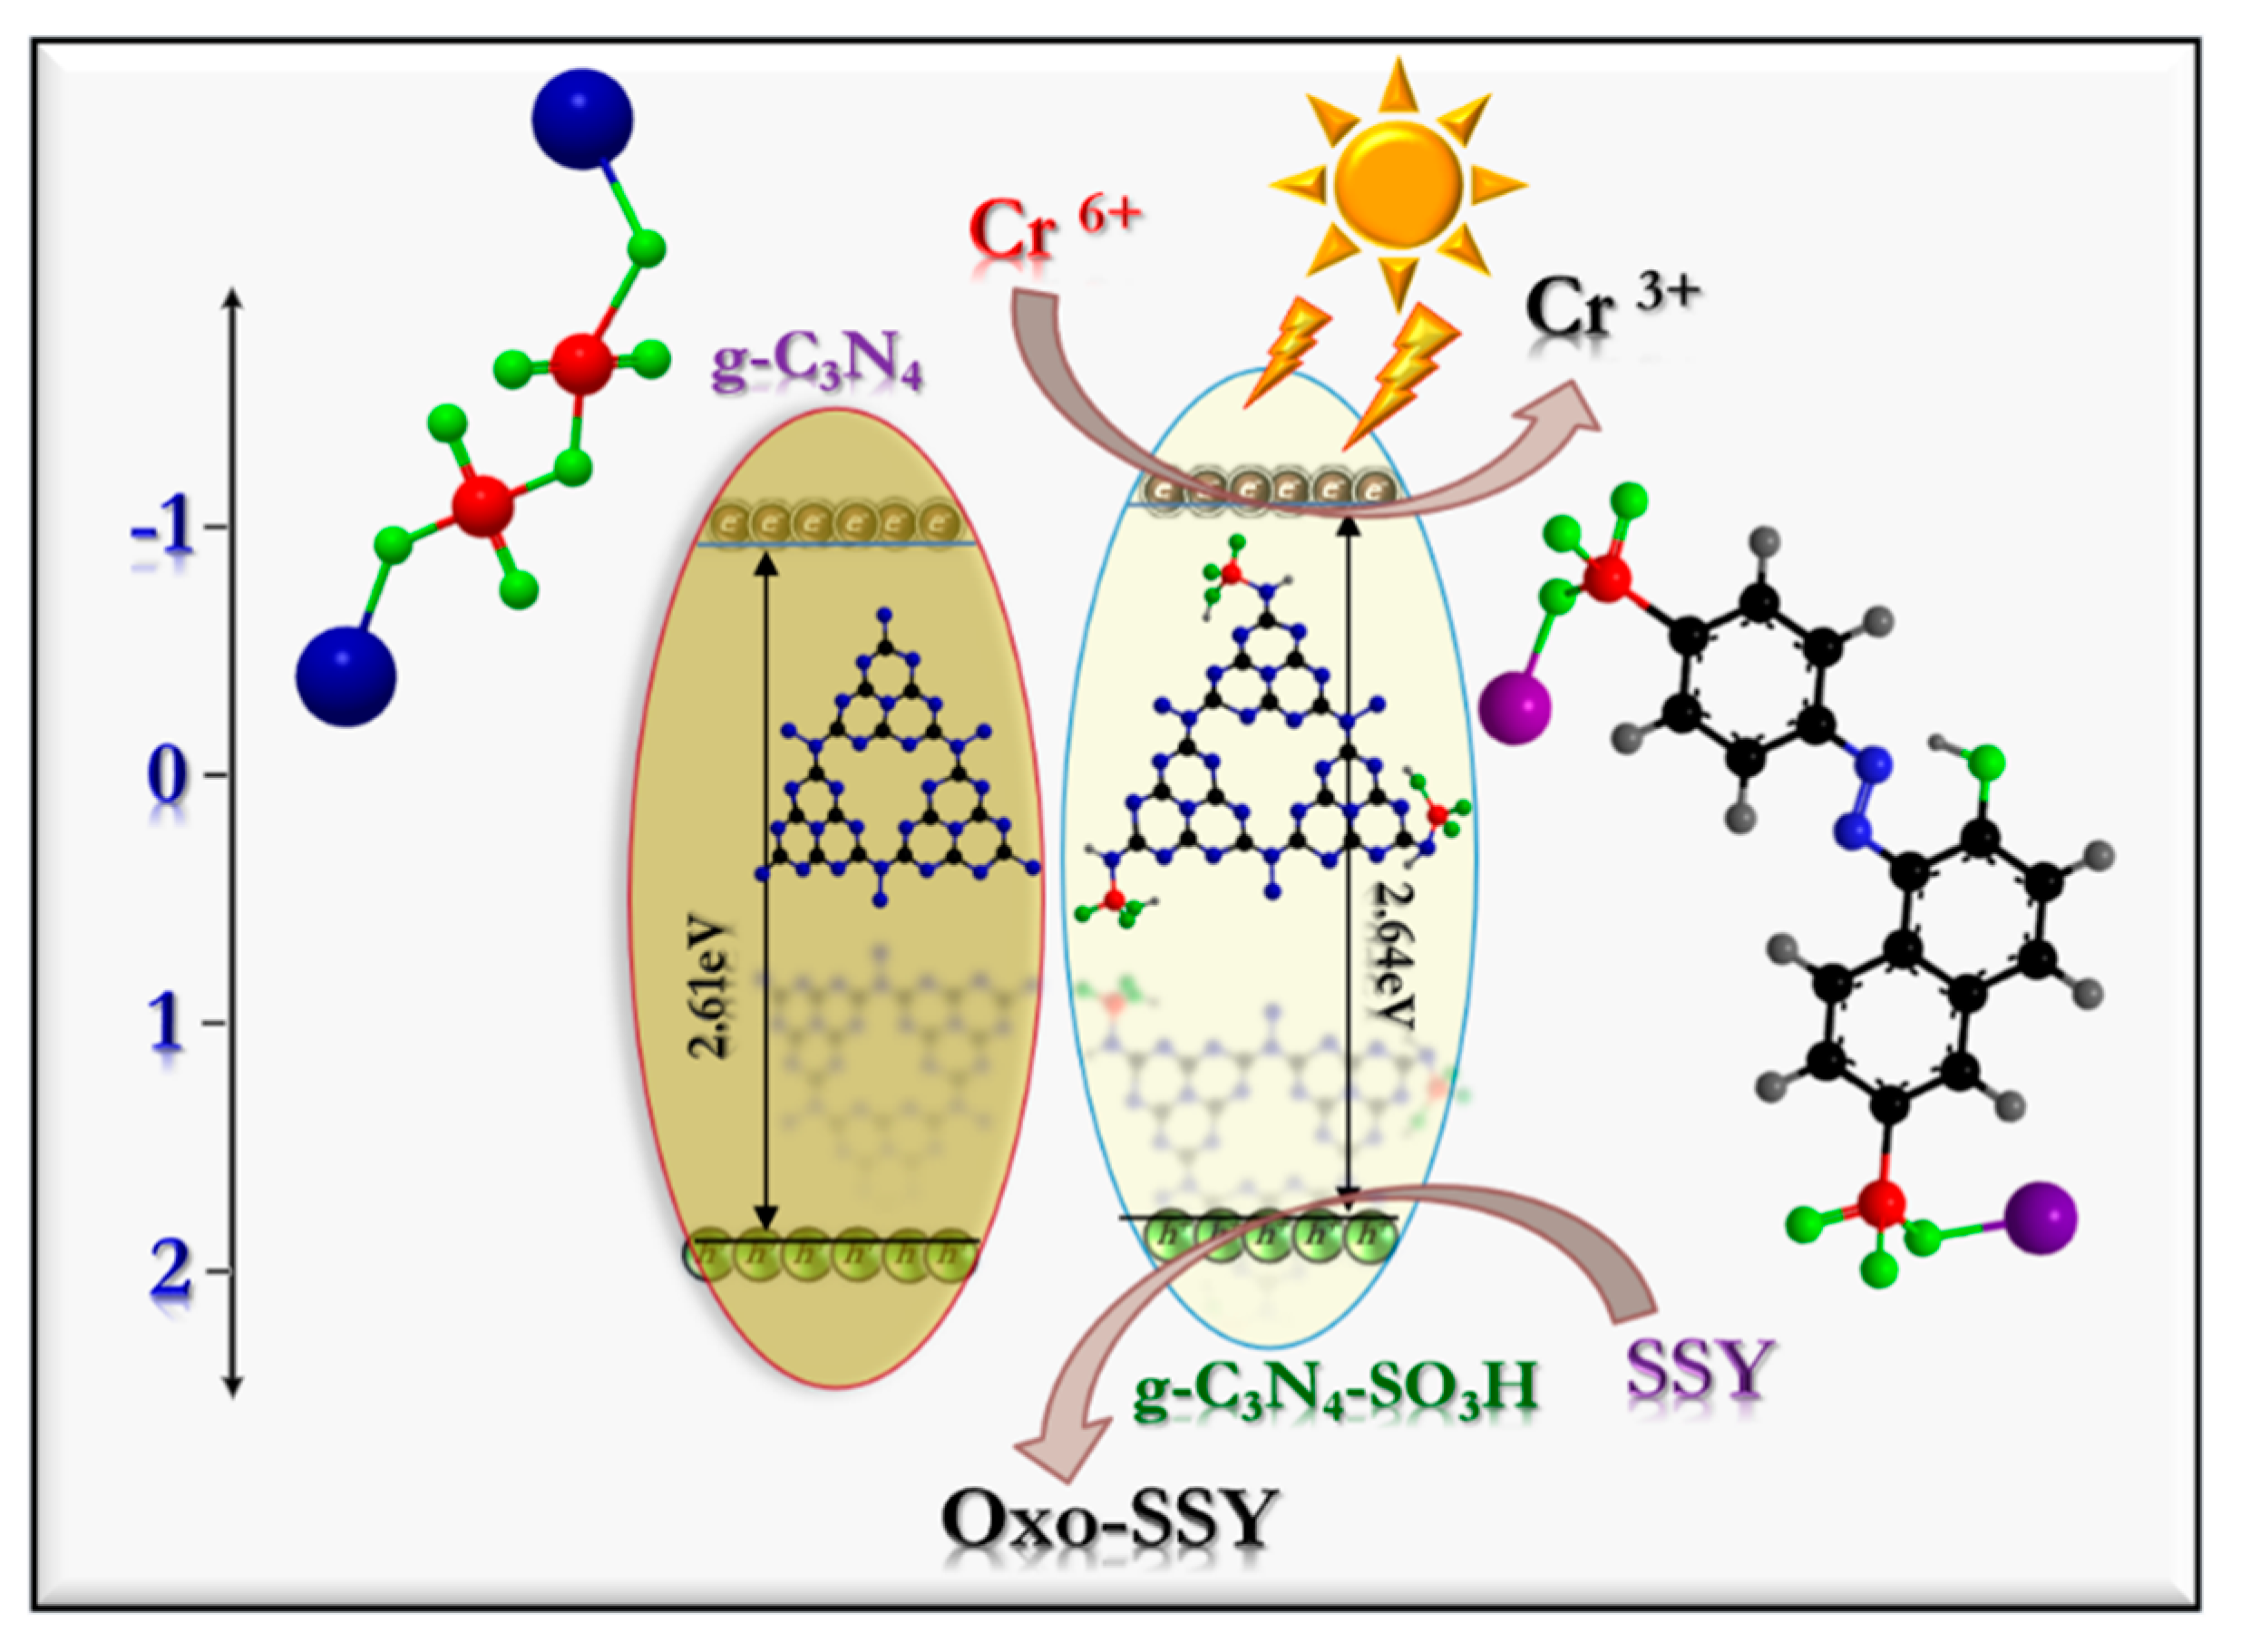
Interpreting the results mentioned above, the plausible photocatalytic mechanism for the photo–redox reactions for the degradation of the Cr (VI) and SSY contaminants was formulated and is displayed in
Scheme 1. The bandgap energies of the g-C
3N
4 (2.61 eV) and g-C
3N
4–SO
3H (2.64 eV) semiconductor photocatalysts were derived by Tauc plots obtained from the UV–diffuse reflectance spectra and the position of the conduction band (CB) established by the Mott–Schottky measurements. The valence band (VB) position was calculated using the formula mentioned below (Equation (7)).
where E
VB = valence band energy, E
CB = conduction band energy, and E
g = bandgap energy. The valence band (VB) and conduction band (CB) energies of the g-C
3N
4 and g-C
3N
4–SO
3H photocatalytic materials were measured to be +1.66 eV/+1.55 eV and −0.95 eV/−1.09 eV, respectively. These obtained values were confirmed by the valence band X-ray photoelectron spectroscopic (VB-XPS) data and are shown in
Figure S2. The CB potential of g-C
3N
4–SO
3H was more negative than that of unmodified g-C
3N
4, which is more beneficial for the photoreduction of Cr (VI). The surface-functionalized, high electron-withdrawing sulfonic groups dramatically increased the surface electron densities. This could be the reason for the prolonged lifetime of the photo-excited charge (e
−/h
+) carriers.
2.3. Influence of pH and Scavenging Species and Recycling Stability
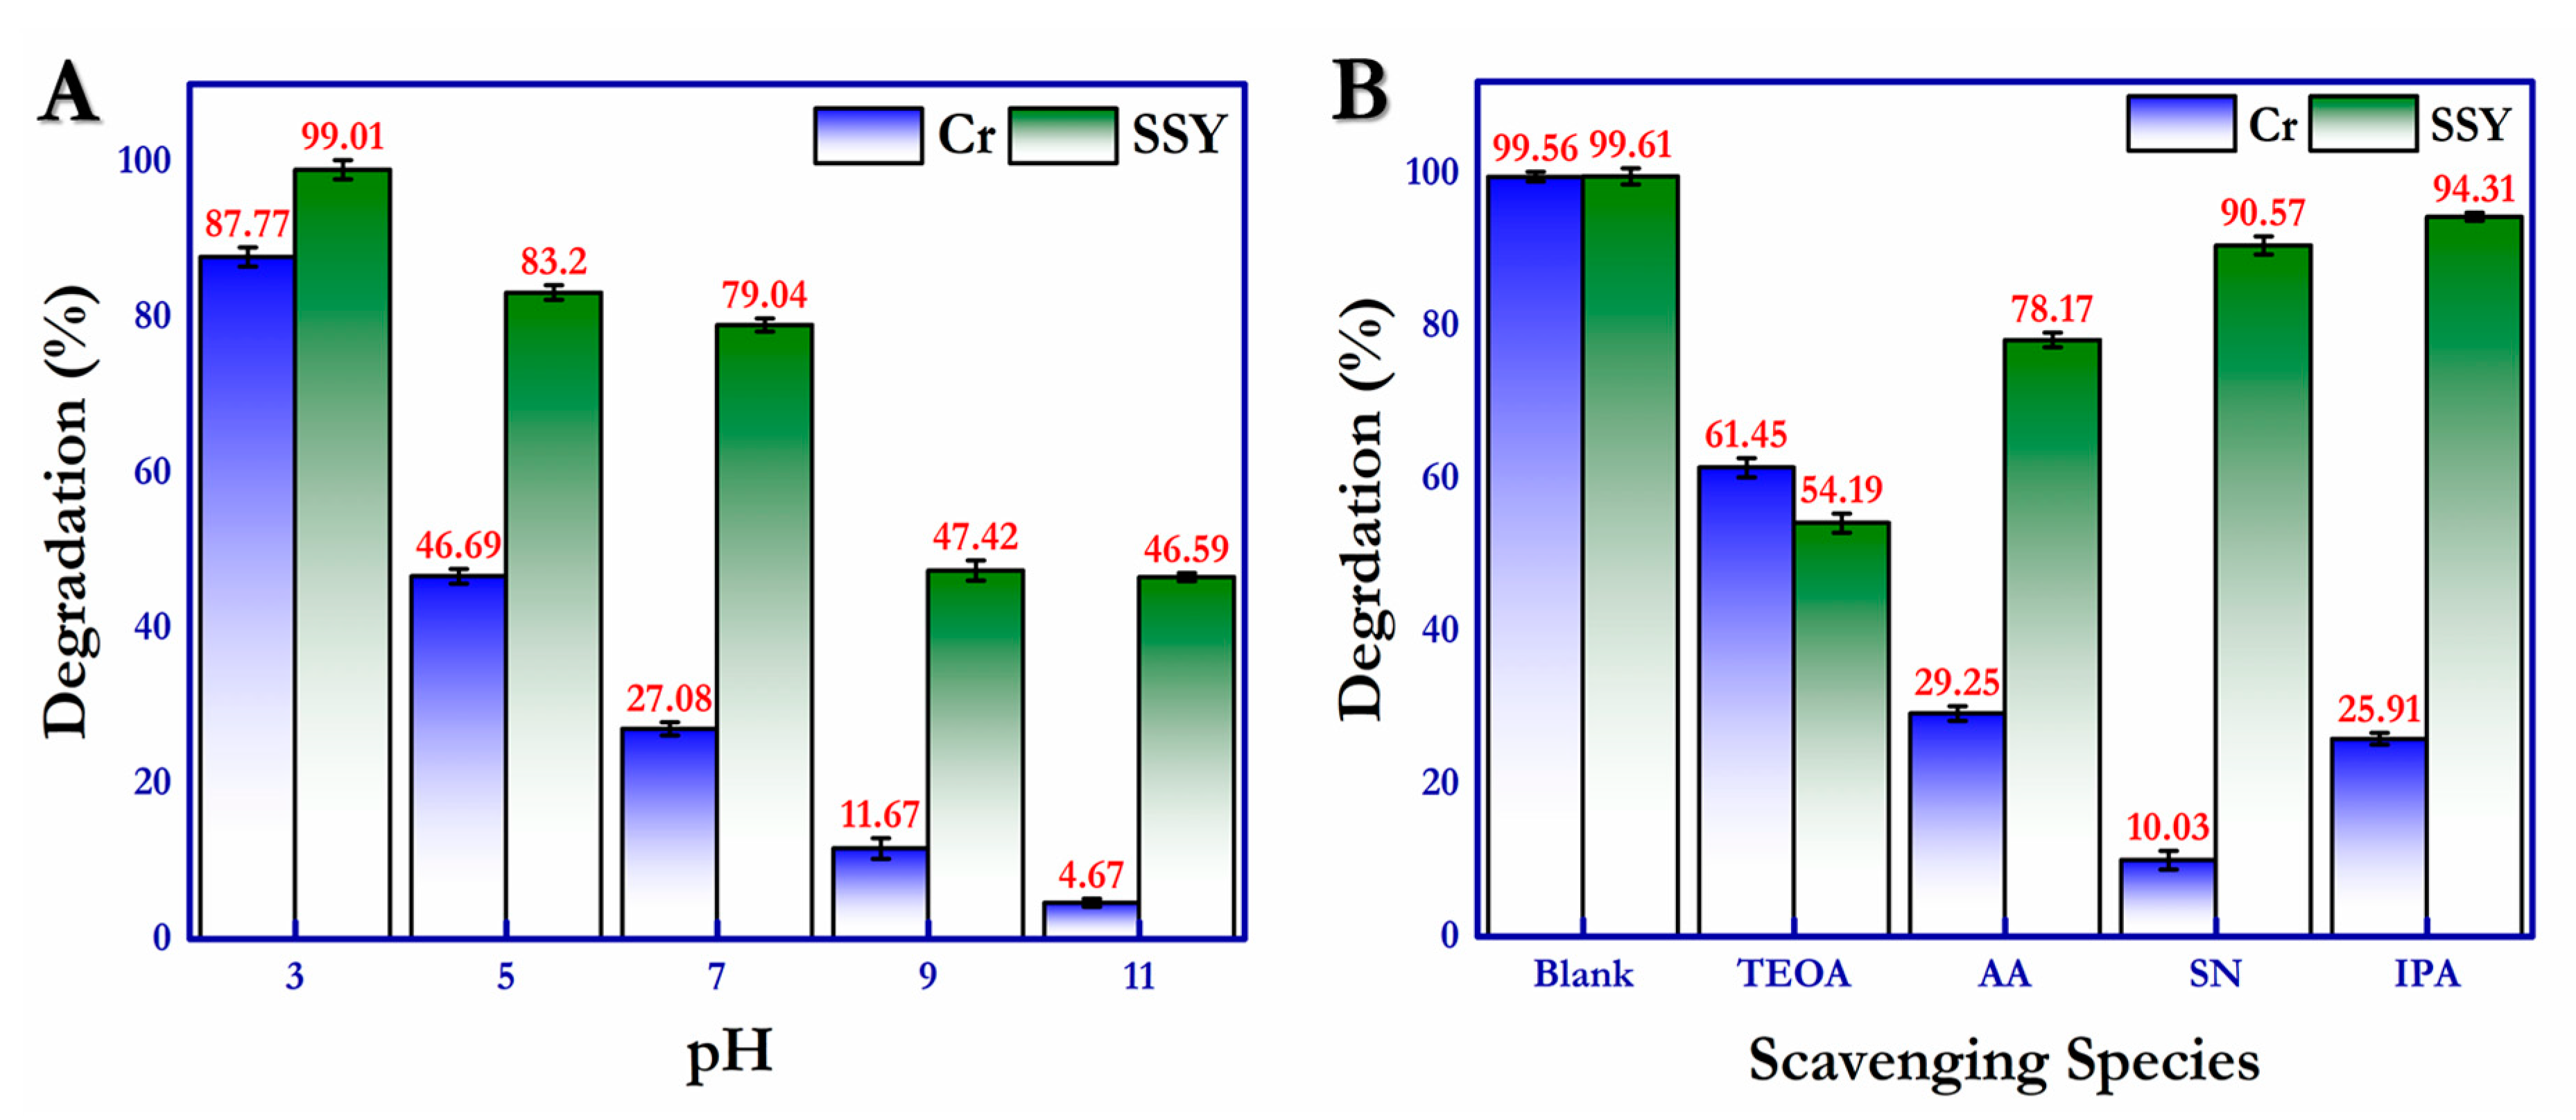
Predominantly, the pH of the reaction environment plays a vital role in the catalyst’s absorption–desorption ability and photocatalytic redox activity. The photoreduction of Cr(VI) and photooxidation of SSY under the influence of a wide pH range were determined in the presence of modified g-C
3N
4–SO
3H material and are illustrated in
Figure 12A.
Figure 12A demonstrates the photodegradation activity of Cr(VI) and SSY over the pH range of 3.0–11.0, and the acquired results show that the photoreduction of Cr(VI) was most favorable in the acidic environment; a drastic drop in the degradation ability was observed when the reaction mixture adjusted to the basic nature. This is due to the reduced attraction of reacting species towards the negatively charged catalytic surface under the basic conditions, and the pH of the photoreduction of Cr (VI) was found to be around ~2.5 throughout the reactions. The photooxidation of SSY was also promising under acidic conditions, and the pH of the reaction environment was measured at nearly ~2.9 for all other reactions throughout the work.
Likewise, to determine the active reacting species involved and to reaffirm the photodegradation mechanism, an active radical trapping experiment was performed, and the results are shown in
Figure 12B and
Figure S3. The active photogenerated species such as the hydroxyl radical (•OH), superoxide radicals (•O
2−), holes (h
+), and electrons (e
−) can be trapped using scavenging species such as isopropyl alcohol (IPA), acrylamide (AA), triethanolamine (TEOA), and silver nitrate (SN), respectively. The previous experimental result affirms that the presence of silver nitrate had the greatest influence in the photodegradation of Cr (VI) (10.3%), indicating the significance of photogenerated electrons (e
−) in the photoreduction reaction. On the other hand, photodegradation of the SSY contaminant was hampered by the trapping of holes (h
+) in the photooxidation reaction by TEOA (54.19%). The trend of the influence of scavenging species for the photoreduction of Cr (VI) was e
− > •OH > •O
2− > h
+, compared with h
+ > •O
2− > e
− > •OH for the photooxidation of SSY. These radical trapping experiments showed that the results supported the predicted photodegradation mechanism explained earlier in the discussion.
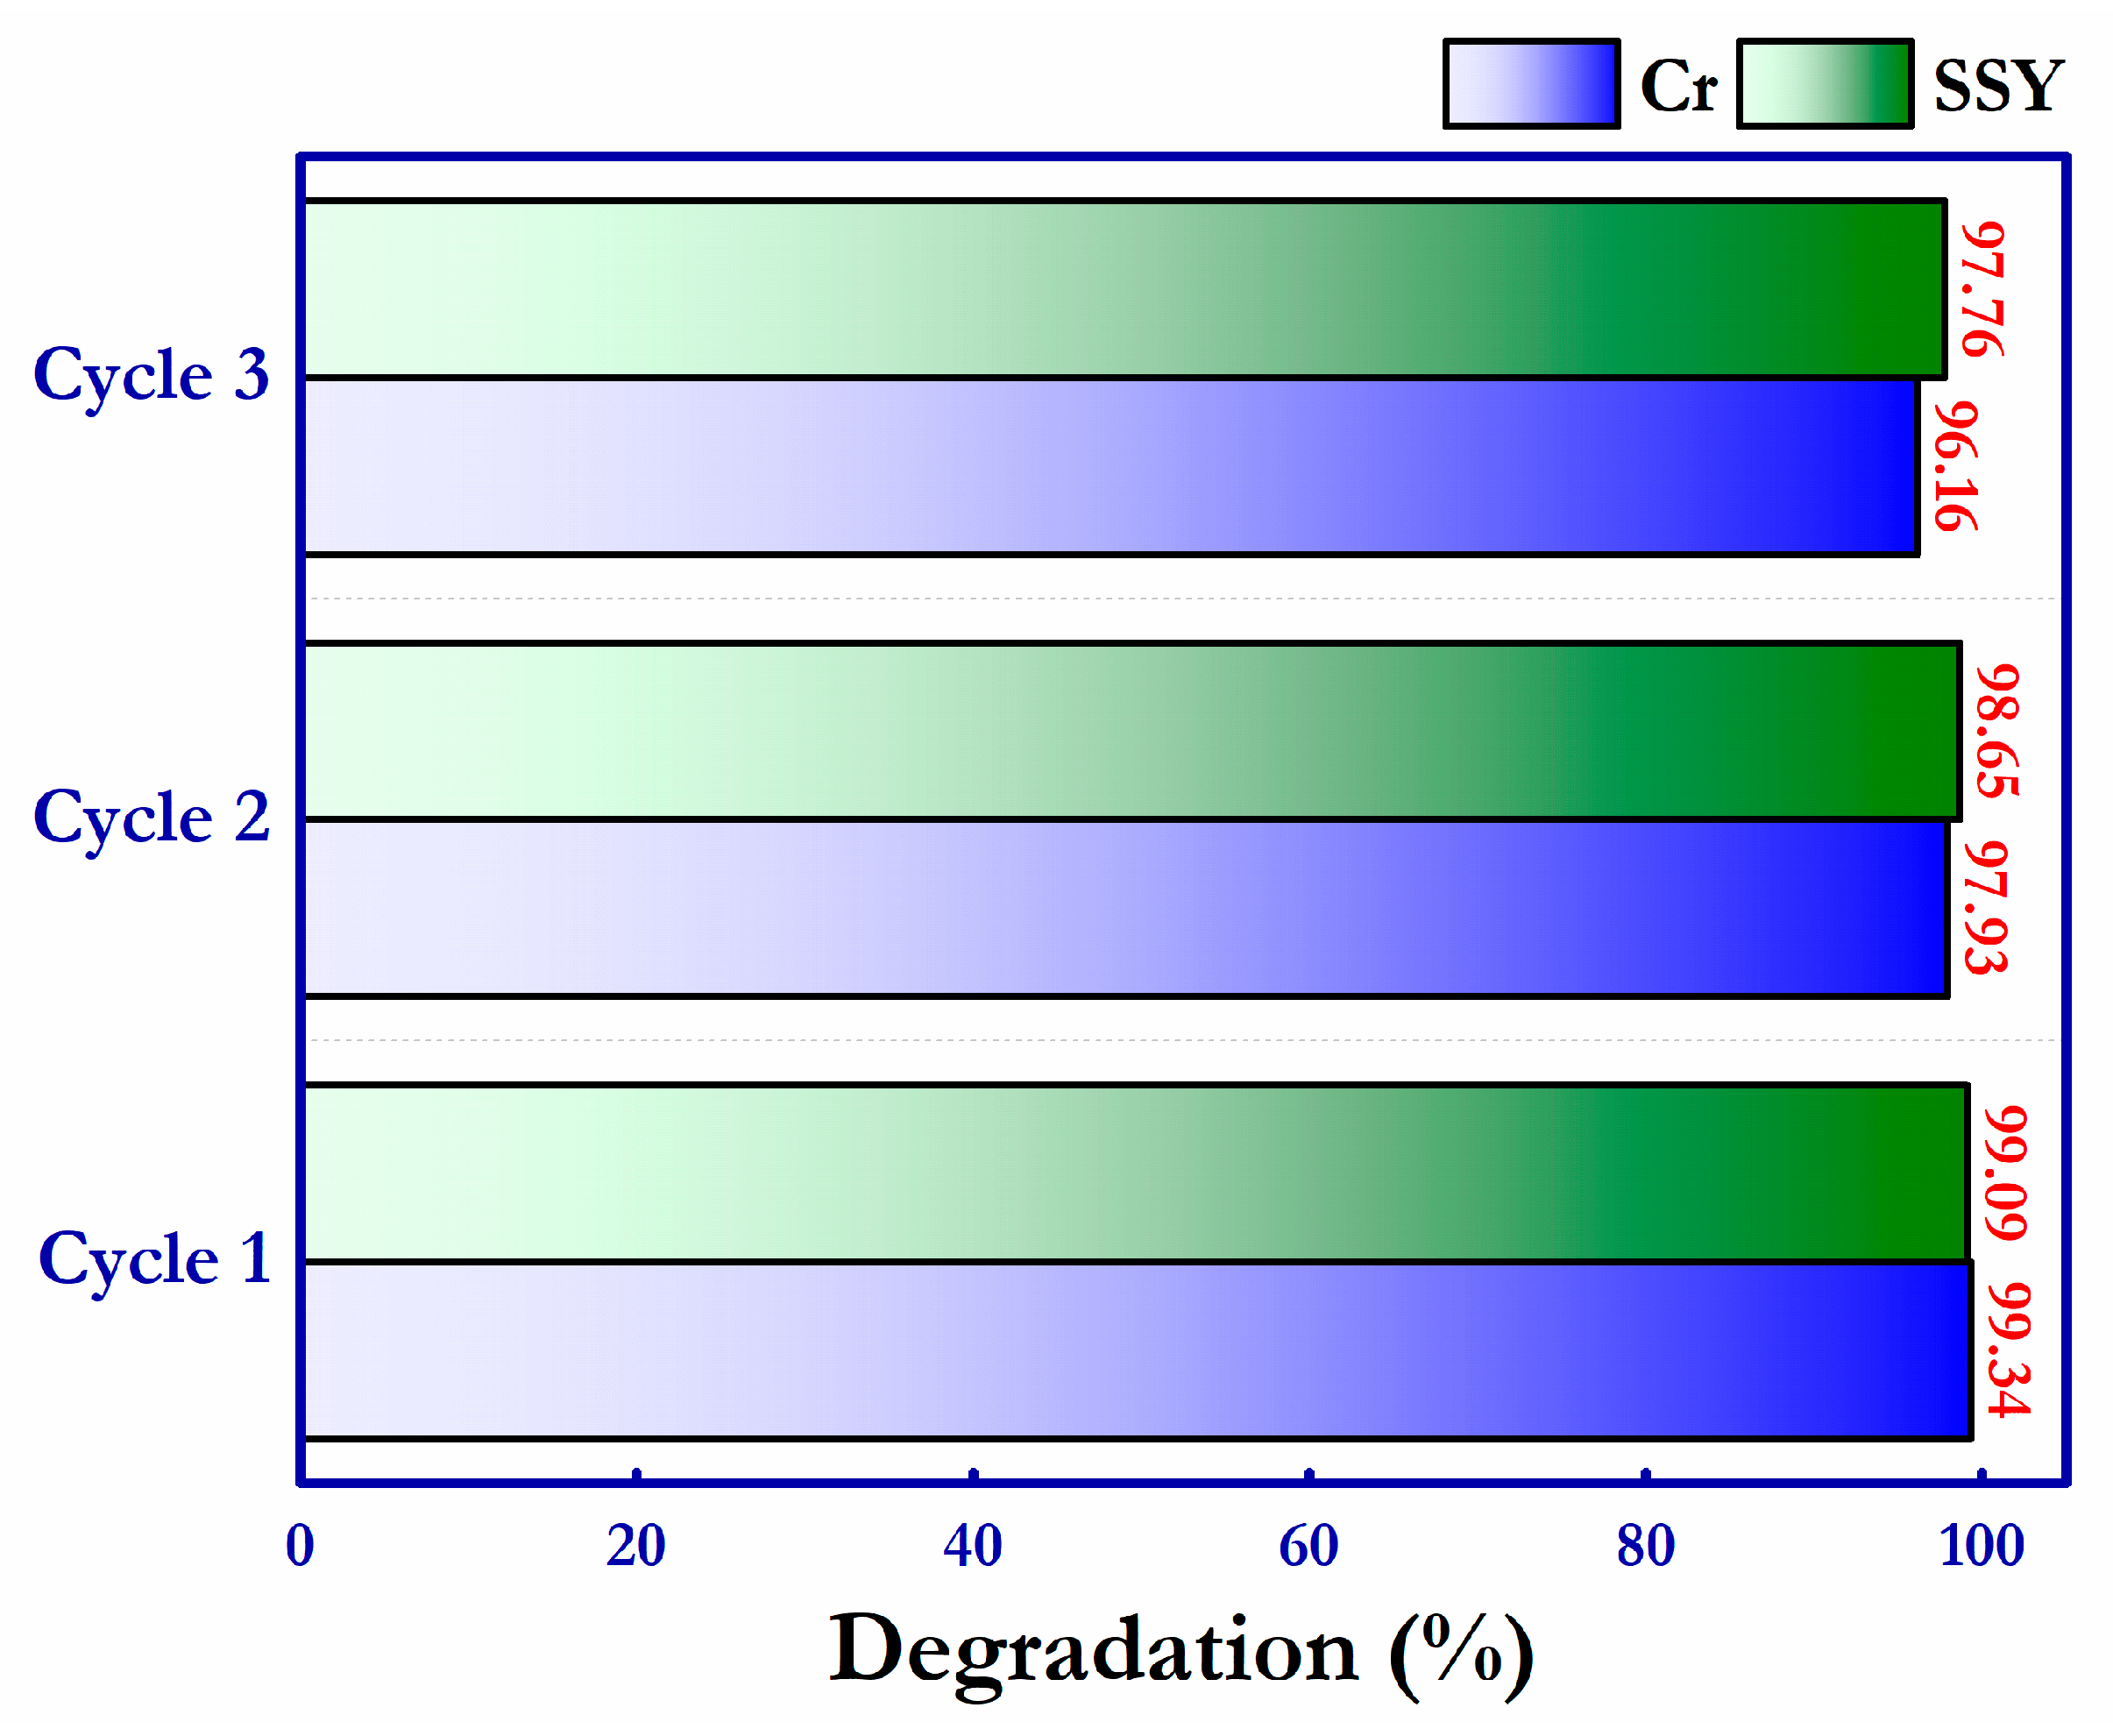
The recycling stability of the surface-functionalized g-C
3N
4–SO
3H photocatalytic material was examined in three consecutive repeated cycles. The utilized photocatalyst in the reaction was recovered by centrifugation and drying at 60 °C in between each successive step, and the acquired results are displayed in
Figure 13 and
Figure S4. At the end of the three successful photo–redox reactions, there was only 3.18% and 1.33% reduction in the degradation ability for the photoreduction of Cr (VI) and photooxidation of SSY, respectively. This proves the better repeating stability and high sustainability of the g-C
3N
4–SO
3H photocatalytic material for effective environmental remediation applications.
2.4. Comparative Study of the Photodegradation of Cr (VI) and SSY
Some of the previous distinctive works on the photocatalytic reduction of hexavalent chromium (Cr (VI)) and photocatalytic degradation of SSY azo dye were compared with this current work based on their different concentrations of contaminants and duration of irradiation of visible light or time taken for >92% degradation, shown in
Table 1.
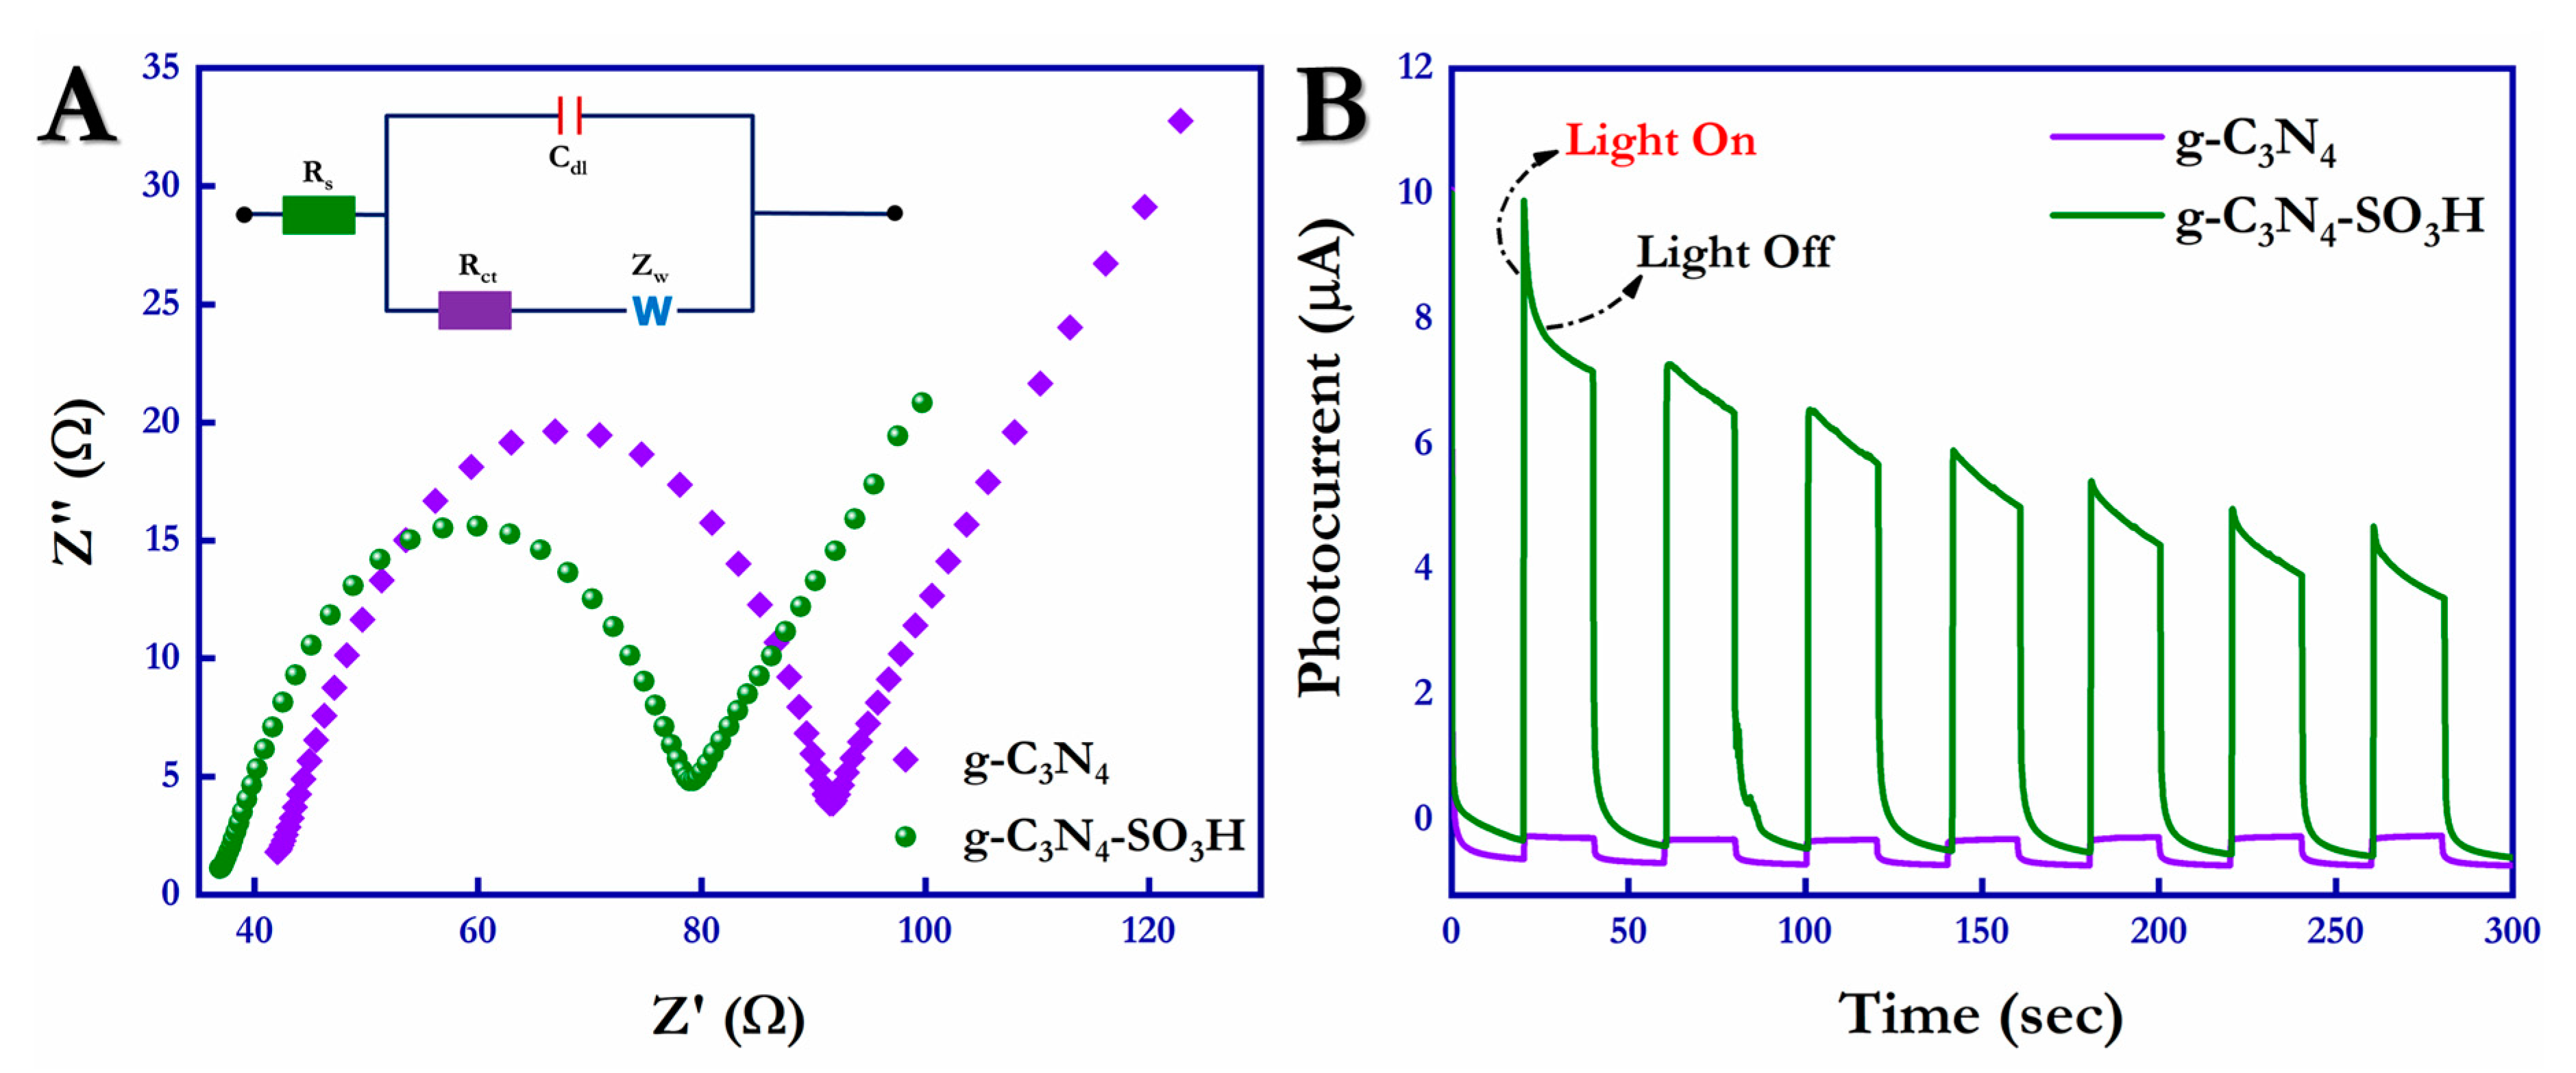
2.5. Photoelectrochemical Measurements
The interfacial charge transfer resistance (R
ct), photoexcitation, and the stability of the photogenerated charge carriers (h
+/e
−) of the g-C
3N
4 and g-C
3N
4–SO
3H semiconductor photocatalysts under visible light irradiation were confirmed by the photo(electro)chemical impedance spectroscopic (EIS) studies and transient-photocurrent (TPC) analysis, respectively, shown in
Figure 14A,B. The charge transferability behavior and the photo-induced charge transfer resistance (R
ct) can be determined from the EIS Nyquist plots of the photoactive catalytic materials shown in
Figure 14A. Based on a comparison of the R
ct values of the unmodified g-C
3N
4 and sulfonic acid group-enriched g-C
3N
4–SO
3H, the functionalized catalytic material (78.35 Ω) had significantly less charge transfer resistance than the pristine g-C
3N
4 material (92.38 Ω). This decrease in the R
ct is due to the presence of sulfonic acid groups, which account for the more electronegative nature of the material. In addition, it aids the catalytic activity by providing induction to the photo-induced e
− and lowering the resistance by the charge carrier density of the sulfonic acid groups in the photoelectrochemical EIS measurements. Furthermore, the equivalent circuit diagram of the EIS-Nyquist plots is provided as the inset of
Figure 14A, where Z
w = Warburg impedance; R
s = electrolyte resistance; R
ct = charge transfer resistance; and C
dl = double layer capacitance.
Furthermore, the transient-photocurrent (TPC) measurements were performed in NaOH electrolyte solution with the applied potential of −0.1 V in the presence (On) and absence (Off) of visible light irradiation, displayed in
Figure 14B. The obtained data showed that the photocurrent response exerted by the surface-functionalized g-C
3N
4–SO
3H (9.8824 µA) was almost ~4000 times the current response of pure g-C
3N
4 (2.4629 nA) under irradiation. Notably, the sulfur effect exercised by the functionalized photocatalytic material on charge separation and carrier density was the reason for the enhanced photocurrent response. This photocurrent response shows the boosted mobility and lifetime of the charge carriers and thus the photocatalytic activity.
3. Materials and Methods
3.1. Materials
Dicyandiamide (C2N4H4), sulfuric acid (H2SO4), Sunset Yellow FCF (C16H10N2Na2O7S2), potassium dichromate (K2Cr2O7), citric acid (C6H8O7), isopropyl alcohol (C3H8O), acrylic acid (C3H8O2), silver nitrate (AgNO3), triethanolamine (C6H15NO3), potassium ferricyanide (K3[Fe(CN)6]), sodium hydroxide (NaOH), potassium chloride (KCl), and potassium ferrocyanide (K4[Fe(CN)6]) were procured from Sigma Aldrich, Darmstadt, Germany, as analytical grade and were used without any further purification for the synthesis. Deionized water (DI) was used as a solvent in all experiments.
3.2. Characterizations
The photoluminescence (PL) studies were performed using a UniRAM Micro-PL spectrometer acquired from UniNanoTech Co., Ltd., Gyeonggi-do, South Korea, that has a 266 nm exciting laser as a source at room temperature. The electronic bandgap energies from the Tauc plots were assessed using a UV–Vis spectrophotometer (Cary 5000 series, Agilent Technologies Inc., CA, USA), and optical absorbance spectra were measured using a UV–Vis-NIR spectrometer coupled with a 150 mm UV–Vis–NIR integrating Sphere, JASCO V-770, Tokyo, Japan. The chemical composition and oxidation states and valence band (VB) spectra of the synthesized materials were scrutinized using a Fourier-transform infrared spectrometer (FT-IR) from PerkinElmer frontiers, Spotlight 200i, Buckinghamshire, UK, and X-ray photoelectron spectrometer (XPS) made by JPS 9030, JEOL Ltd., Tokyo, Japan. The structural and surface morphological characterizations of the synthesized materials were examined utilizing Raman spectroscopy using a Confocal Micro-Raman Spectrum ACRON, UniNano Tech Ltd., Gyeonggi-do, South Korea, and field-emission scanning electron microscopy with an energy-dispersive X-ray spectroscope (FESEM and EDX) made by JSM 7610F, JEOL Ltd., Tokyo, Japan. The crystalline configuration of the prepared materials was examined using X-ray diffraction spectroscopy (XRD) with CuKα radiation (λ = 1.5406 Å; Malvern PANalytical X’pert Pro, EA Almelo, The Netherlands). A 350 W mercury-xenon lamp XE350 made by Prosper Electronics, Yilan, Taiwan, was employed for all photocatalytic degradation applications, which simulated the solar light source with 388 mW cm−2 photonic flux. All of the electrochemical and photoelectrochemical (PEC) experiments were done using an electrochemical workstation (CHI1205B) with a standard three-electrode system made by CH Instruments Inc., USA. A Pt wire, material-coated ITO plate, and Ag/AgCl (sat. KCl) functioned as the counter, working, and reference electrodes, respectively.
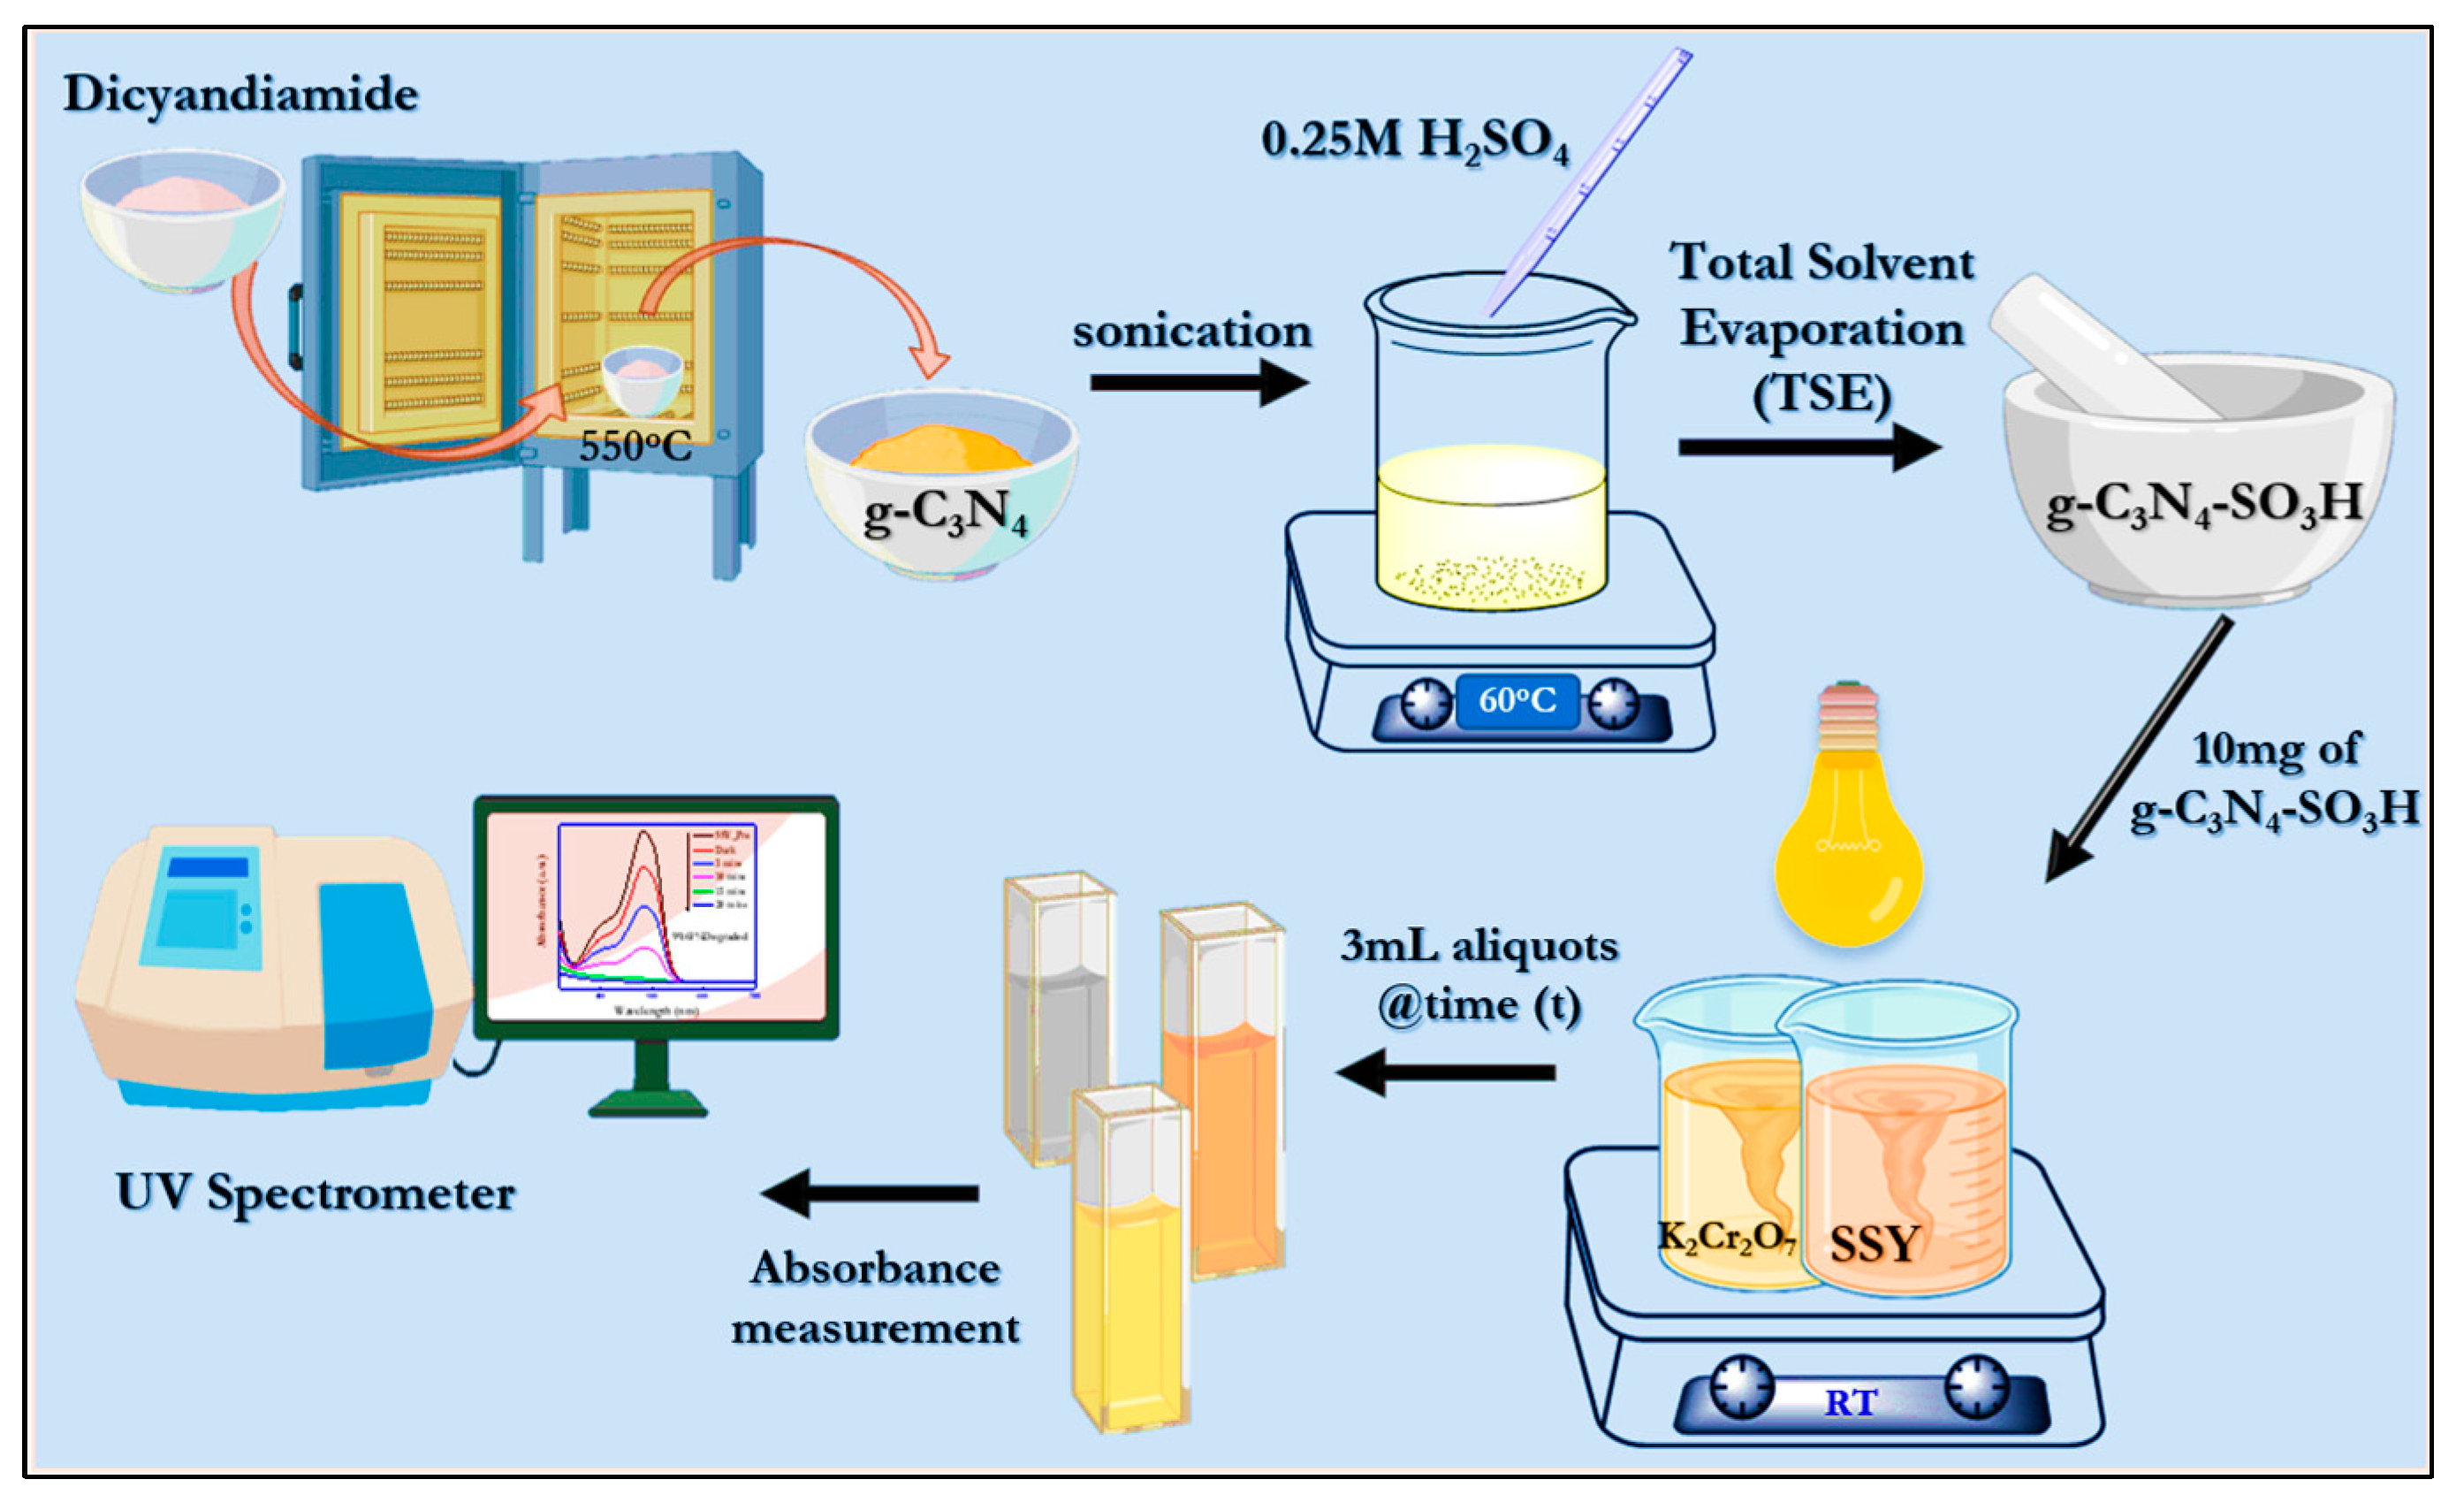
3.3. Synthesis of Pristine g-C3N4
The bulk graphitic carbon nitride (g-C3N4) was synthesized using dicyandiamide as a precursor material by a thermal polycondensation reaction. In short, 5 g of finely ground dicyandiamide was placed in a silica crucible, covered with the lid, placed in a muffle furnace, and heated to 550 °C for 3 h with a heating ramp of 3 °C/min. The obtained pale-yellow g-C3N4 was ground into a fine powder using an agate mortar and stored for further reactions.
3.4. Synthesis of Sulfonic Group-Functionalized g-C3N4
The surface functionalization of pristine g-C3N4 was achieved by the complete solvent evaporation and impregnation method using sulfuric acid. In this process, 500 mg of as-synthesized g-C3N4 was placed in a beaker containing 50 mL of DI water. This mixture was sonicated for 1 hr to obtain a completely dispersed suspension, and 0.25 M of H2SO4 was added to the mixture under stirring conditions at 60 °C. This condition was maintained until all of the solvent evaporated, and the obtained powder was washed with DI water and ethanol and dried for 12 h at 80 °C. Consequently, the obtained sulfonic group-functionalized g-C3N4–SO3H was heated to bond at 200 °C for 2 h using a muffle furnace.
3.5. Photocatalytic Redox Degradation, Electrochemical, and PEC Measurements
In this study, the degradation of potassium dichromate (Cr
6+) and Sunset Yellow FCF was accomplished using photocatalytic reactions in the presence of as-synthesized g-C
3N
4 and g-C
3N
4–SO
3H. For the photocatalytic reduction of hexavalent chromium into trivalent species, 40 mL DI water containing an initial concentration of 100 ppm K
2Cr
2O
7 solution and 10 mg of citric acid equivalent to 10 mg of g-C
3N
4 and g-C
3N
4–SO
3H was sonicated in a bath for 2 min for complete dispersion of the materials. The photocatalytic reactor was made of Pyrex glass and was fitted with a water circulatory system to maintain the room temperature conditions (24 ± 2 °C) and was placed 40 cm from the light source on the top of the reactor. In another part, 50 ppm of SSY in 40 mL of DI water was prepared in the reactor container with 10 mg of as-synthesized catalytic materials and kept under the conditions mentioned above for the photocatalytic oxidation reactions. The reaction mixture was stirred under dark conditions for 15 min before the irradiation of the light source to obtain catalyst–analyte adsorption equilibria. To evaluate the photodegradation of the analyte of interest using a UV spectrophotometer, 3 mL of aliquots was taken from the reaction mixture at designated time intervals. For the brief electrochemical impedance spectroscopy (EIS) and photocurrent evaluations, 5 mM [Fe (CN)
6]
3-/4- mixture dispersed in 100 mM KCl and 0.1 M NaOH were used as electrolyte solutions. The overall synthesis of the catalytic materials and their photocatalytic activity under the solar spectrum is pictorially represented in
Scheme 2.


 ,
, 


