Article

In Situ H2 Reduction of Al2O3-Supported Ni- and Mo-Based Catalysts

by
Sabrina Maria Gericke
1,*,
Jenny Rissler
2,3,4,
Marie Bermeo
3,5,
Harald Wallander
6,
Hanna Karlsson
7,
Linnéa Kollberg
7,
Mattia Scardamaglia
8,
Robert Temperton
8,
Suyun Zhu
8,
Kajsa G. V. Sigfridsson Clauss
8,
Christian Hulteberg
7,
Andrey Shavorskiy
8,
Lindsay Richard Merte
6,
Maria Elise Messing
3,5,
Johan Zetterberg
1 and
Sara Blomberg
7
1
Division of Combustion Physics, Lunds University, P.O. Box 118, 221 00 Lund, Sweden
2
RISE—Research Institutes of Sweden, P.O. Box 857, 501 15 Borås, Sweden
3
NanoLund, Lund University, P.O. Box 188, 221 00 Lund, Sweden
4
Ergonomics and Aerosol Technology, Faculty of Engineering, Lund University, P.O. Box 118, 221 00 Lund, Sweden
5
Solid State Physics, Lund University, 221 00 Lund, Sweden
6
Materials Science and Applied Mathematics, Malmö University, 205 06 Malmö, Sweden
7
Department of Chemical Engineering, Lund University, 221 00 Lund, Sweden
8
MAX IV Laboratory, Lund University, 221 00 Lund, Sweden
*
Author to whom correspondence should be addressed.
Catalysts 2022, 12(7), 755; https://doi.org/10.3390/catal12070755
Submission received: 25 May 2022 / Revised: 2 July 2022 / Accepted: 6 July 2022 / Published: 8 July 2022

Abstract

:
Nickel (Ni)-promoted Molybdenum (Mo)-based catalysts are used for hydrotreatment processes in the chemical industry where the catalysts are exposed to high-pressure H2 at elevated temperature. In this environment, the catalyst transforms into the active phase, which involves the reduction of the oxide. Here, we report on the first in situ study on the reduction of alumina supported Ni- and Mo-based catalysts in 1 mbar H2 using ambient-pressure X-ray photoelectron spectroscopy (APXPS). The study confirms that mixing Ni and Mo lowers the reduction temperature of both Ni- and Mo-oxide as compared to the monometallic catalysts and shows that the MoO3 reduction starts at a lower temperature than the reduction of NiO in NiMo/Al2O3 catalysts. Additionally, the reduction of Ni and Mo foil was directly compared to the reduction of the Al2O3-supported catalysts and it was observed that the reduction of the supported catalysts is more gradual than the reduction of the foils, indicating a strong interaction between the Ni/Mo and the alumina support.

1. Introduction

Mo-based catalysts are widely used in catalytic hydrotreating processes and act as a workhorse in the chemical industry [1]. These catalysts are known to be efficient in the removal of the toxic and environmentally harmful sulfur in petroleum-based feedstock in the production of diesel and gasoline. However, the same type of catalyst has also been shown to be a suitable alternative for the valorization of biomass where the removal of oxygen is an essential reaction via hydrodeoxygenation (HDO) [2]. It has also been shown that the activity of the Mo-based catalysts in the HDO reaction can be improved by adding Ni and Co as promoters [3,4,5]. While Ni/Al2O3 catalysts have a high deoxygenation ability [6], Mo/Al2O3 catalysts showed higher selectivity and higher conversion for the HDO route for various feedstocks [7]. NiMo/Al2O3 catalysts showed enhanced conversion for some feedstocks such as triglyceride compared to the monometallic catalysts.
In the chemical industry, the NiMo catalysts are most often introduced in the catalytic reactor as oxides, where Mo is in the Mo6+ oxidation state and the Ni in the Ni2+ oxidation state. In the presence of the reactants, inactive oxides transform into an active catalyst [8]. The transformation to the high-activity phase partly involves the reduction of the MoO3 to either create vacancies and Mo5+ sites or the transformation into a sulfide if sulfur is present in the feedstock [9]. It has been suggested that Ni may facilitate the reduction of the MoO3 by hydrogen spill over from the Ni to the MoO3 [10,11,12]. Thus, Ni is acting as a promoter for the active site that enhances the formation of an undercoordinated Mo, and due to that, may be more active.
Due to their importance in the petrochemical industry, Mo-based catalysts have been studied in detail for decades [13,14,15,16], but the nature of the active site on an atomistic level in the catalytic HDO reaction of biomass is still under debate. Traditional characterization techniques for supported catalysts such as X-ray diffraction and transmission electron microscopy do not provide chemical information about the catalyst and are often limited to ex situ studies. These ex situ studies rely on the stability of the active phase of the catalyst and that the active site is also preserved outside the chemical process. In many cases, the active sites are not stable outside the reaction conditions of the chemical process and the characterization of the catalysts should therefore be studied operando or in situ.
In situ and operando studies of industrial catalysts are, however, challenging due to the structural complexity of the industrial catalysts, which contain only a few weight percent of the active metal well-dispersed on the oxide support. Simplified model systems, such as metal foils, are therefore often used to achieve information on an atomistic scale of the catalyst. Initially, these model catalysts were primarily studied in ultrahigh vacuum conditions, but the development of experimental techniques allows for in situ experiments under more realistic conditions. One of these experimental techniques is ambient-pressure X-ray photoelectron spectroscopy (APXPS), which is surface-sensitive and provides detailed chemical information about the catalyst. However, it is well-known that XPS studies of insulating materials such as Al2O3 are challenging due to their low electrical conductivity that leads to charging of the sample. The charging can be reduced by performing the measurements at elevated temperatures and in a gas atmosphere instead of vacuum as previously reported [17].
In this study, we characterize the reduction of alumina-supported monometallic Ni and Mo, and two bimetallic alumina-supported catalysts in situ, with the aim of investigating how the interaction of Ni and Mo influences the reduction of the active metals. To investigate how the interaction between the active metals and the support affects the reduction process, the results of the supported catalysts were compared to the reduction of oxidized Ni and Mo foils. The chemical surface properties of the catalyst were studied in situ with APXPS, and X-ray absorption near-edge structure (XANES) of the Ni and Mo K-edges was used as a complementary technique providing additional information on the oxidation state of the catalysts.

2. Results

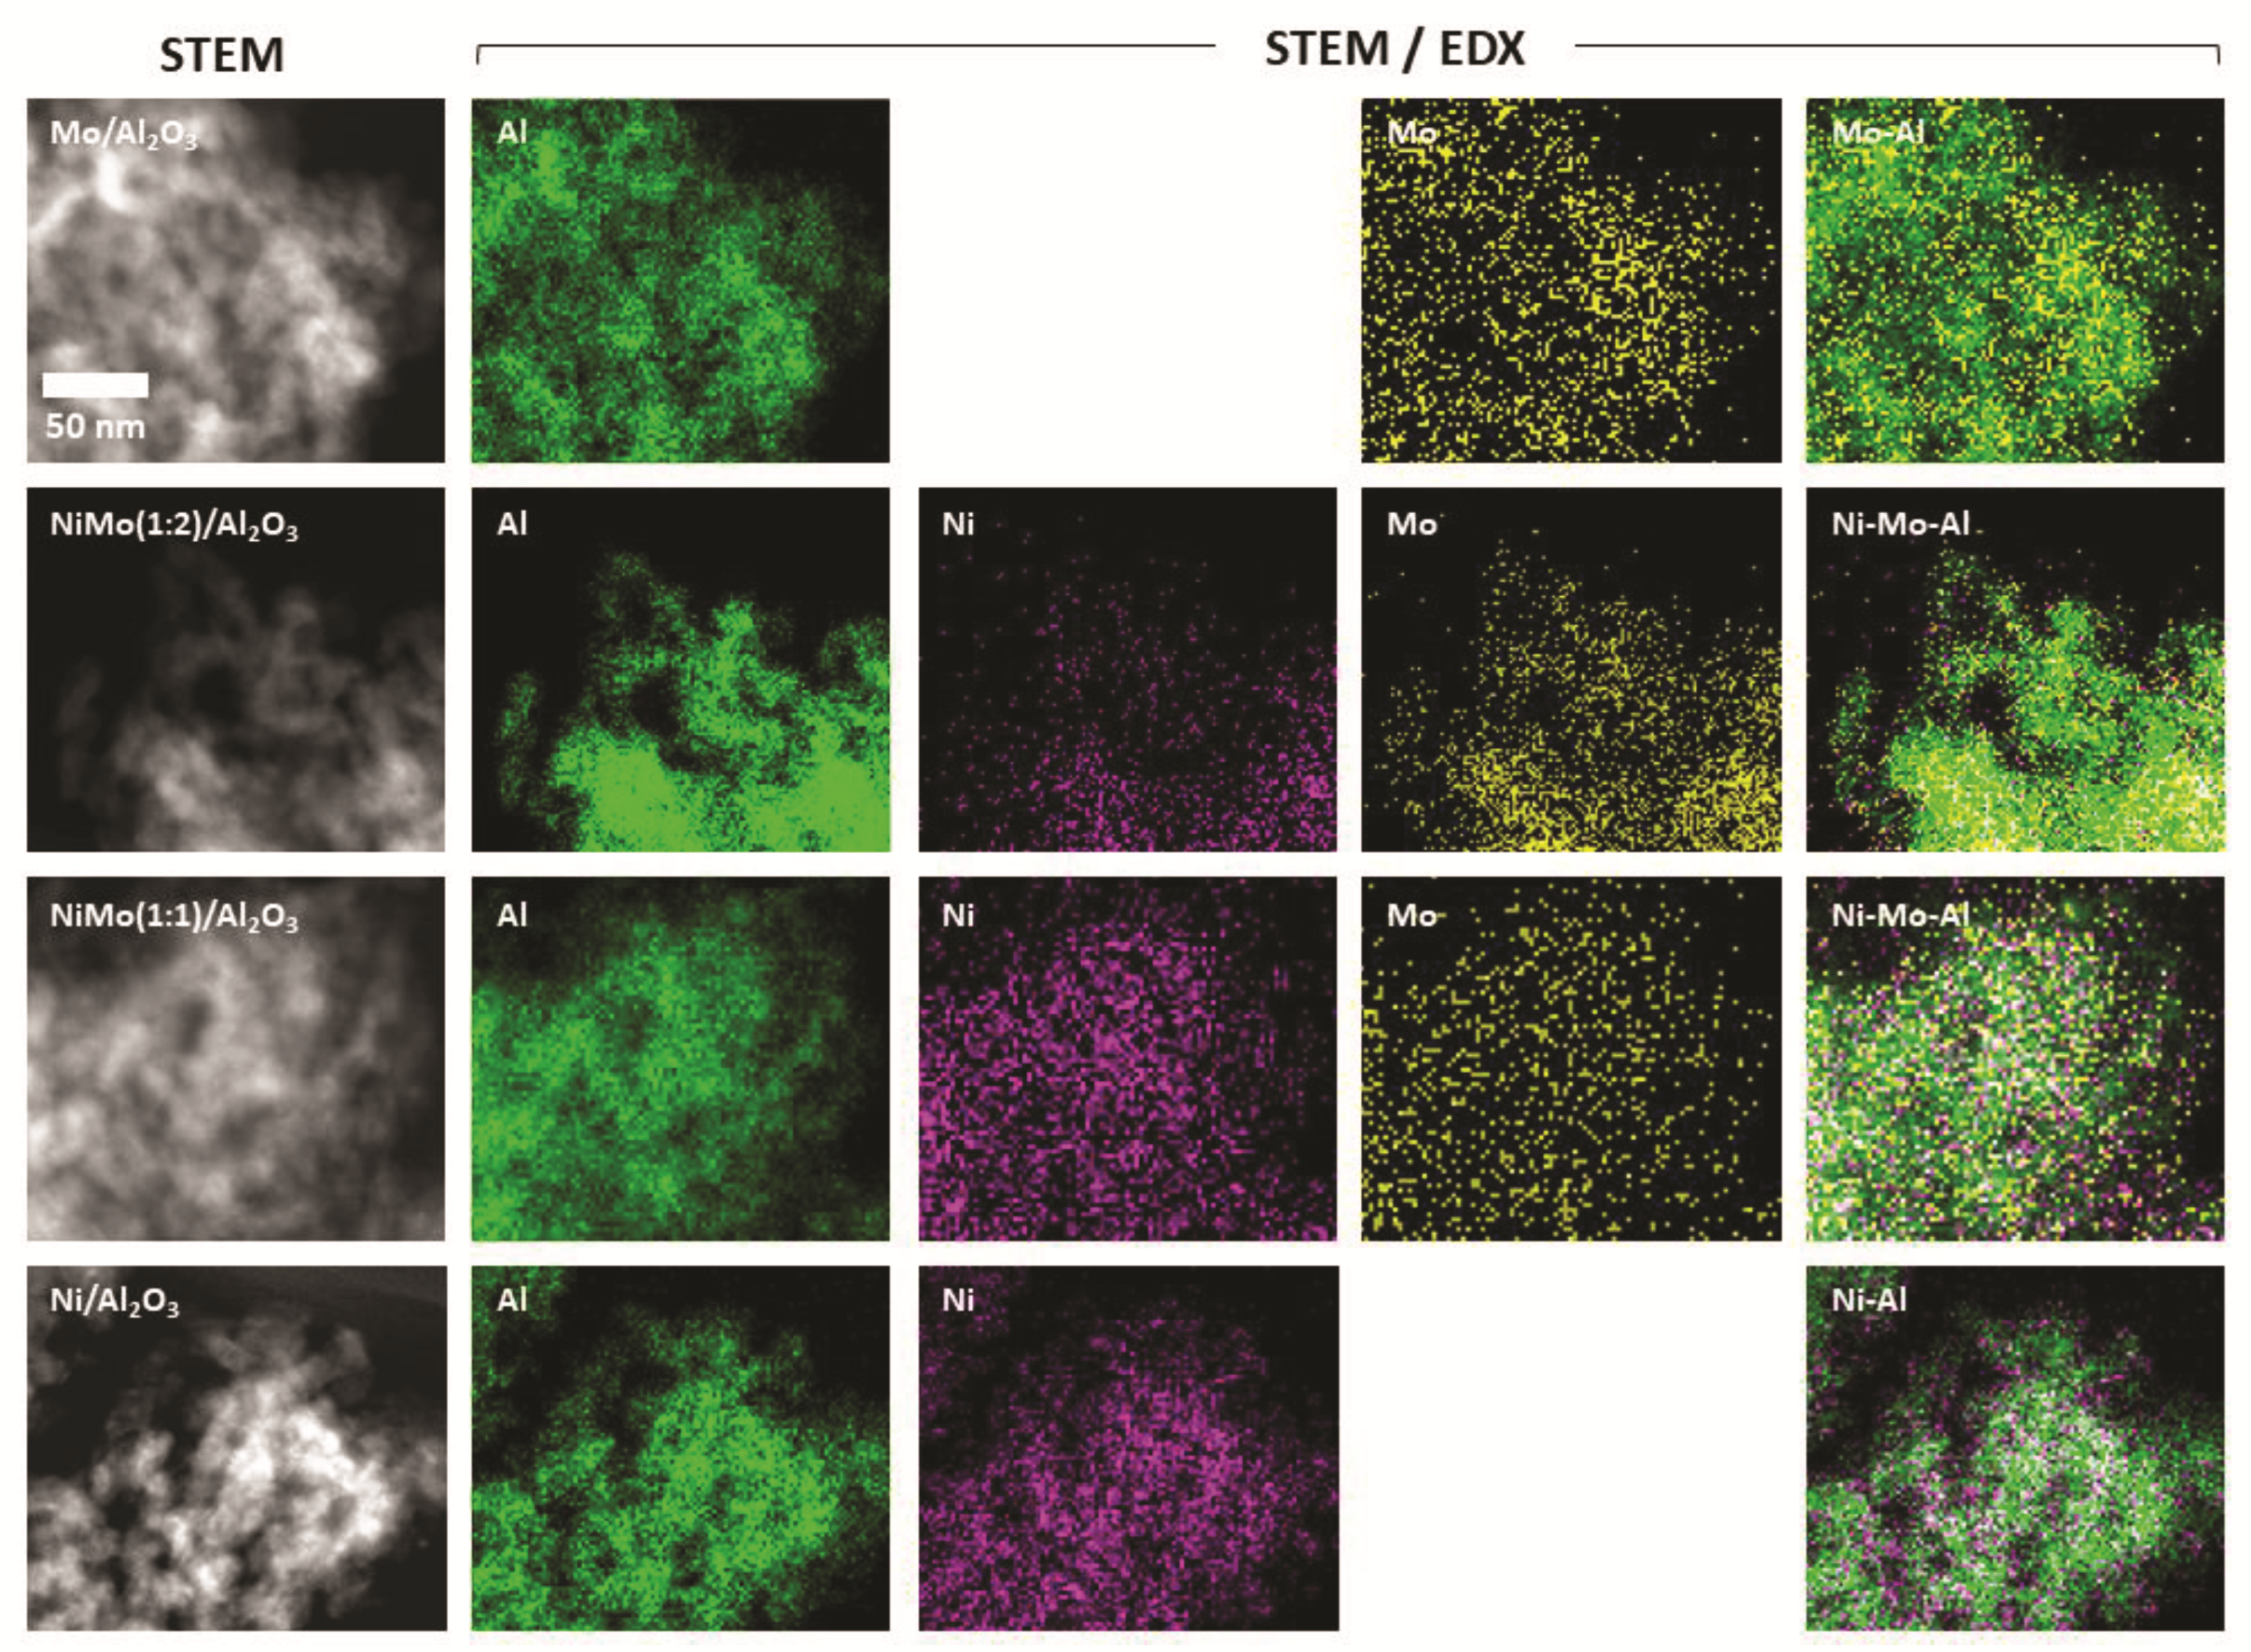
2.1. Characterization of Al2O3-Supported Catalysts before Reduction Experiments

Four alumina-supported catalysts were characterized in this study: one pure Ni/Al2O3, one pure Mo/Al2O3 catalyst, and two bimetallic alumina-supported catalysts containing both Ni and Mo. The bimetallic samples were prepared with different Ni to Mo ratios and were denoted as NiMo(1:1) and NiMo(1:2) based on the measured atomic ratio of the two metals. Prior to the in situ APXPS and XANES reduction experiment, the specific surface area of the alumina-supported catalysts was estimated from nitrogen physisorption using the Brunauer–Emmett–Teller (BET) method [18]. The results presented in Table 1 show that the BET area decreases by approximately 8% after the impregnation of the alumina support. Only a minor variation of the measured BET surface area is observed for the different catalysts.
In addition, energy-dispersive X-ray spectroscopy (EDX) in scanning transmission electron microscopy (STEM) mode was used to achieve spatially resolved information about the metal content and distribution over the alumina support. Representative STEM/EDX images of the catalysts are shown in Figure 1 and the average composition obtained from STEM/EDX mapping is shown in Table 2. The atomic percent (at.%) of Ni in the bimetallic catalysts measured with EDX contains significantly less Ni than expected from the synthesis recipe. However, the pure Ni catalyst shows a Ni at.% in agreement with the expected Ni content, which indicates that the preceding impregnation with Mo hinders the impregnation of Ni. Alternatively, the lower concentrations observed by EDX could possibly be due to the low concentrations of the catalyst in the bulk Al2O3 and the agglomerated particles selected for the analysis.

2.2. In Situ H2 Reduction Followed with Ambient-Pressure X-ray Photoelectron Spectroscopy

The reduction of the Ni and Mo catalysts supported on alumina and Ni and Mo foils were studied in situ using APXPS in 1 mbar of H2. To evaluate the influence of the alumina support, the reduction of the alumina-supported catalysts was compared to the reduction of the metal foils under the same conditions. In addition, the behavior of monometallic-supported catalysts was compared to the bimetallic supported catalysts to investigate the effect of having two active metals impregnated on the support. In the study, the samples were heated stepwise and the Mo 3d, Ni 2p3/2, and Al 2p core level were measured at each temperature. The high thermal stability of Al2O3 [19] allows the use of the Al 2p peak of the Al2O3 for binding-energy calibration to compensate for possible charging of the alumina support, which could otherwise cause unquantifiable shifts of the Mo 3d and Ni 2p3/2. Figures S1 and S2 in the Supplementary Materials show the energy-calibrated Ni 2p3/2 and Mo 3d APXPS spectra of the different catalysts over a temperature range of 100 °C to 600 °C. The spectra in which significant chemical changes were observed are analyzed in more detail and the fitted spectra are shown in Figure 2 and Figure 3. An overview on the binding energies of Ni 2p3/2 and Mo 3d fits for different catalysts in the literature is provided in Table 3 and Table 4. These binding energies were used to constrain the fits of the APXPS spectra.
Figure 2 shows the fits of the Ni 2p3/2 for the Ni foil measured with a photon energy of 1800 eV and the Ni-containing Al2O3-supported catalysts measured with a photon energy of 1000 eV. In Figure 2a, the Ni 2p3/2 spectra of Ni foil at 200 °C are fitted with five peaks with respective binding energies of 853.2 eV, 854.7 eV, 860.3 eV, 863.5 eV, and 865.8 eV. The interpretation of the Ni 2p photoemission line has been widely discussed in literature [20,27,28]. In summary, the five peaks observed in the spectra in Figure 2a can be assigned to different shielding effects of the Ni 2p core-hole after the photoexcitation process. Details on these shielding mechanisms are discussed in the SI. The binding energy of the different peaks indicates that the surface of the Ni foil is oxidized and is predominately composed of NiO, but may also contain some Ni hydroxide.
After heating the Ni foil to 400 °C, the multiplet structure assigned to NiO disappears. Instead, the peak at 852.7 eV with a small satellite component at 858.5 eV originating from the metallic Ni is dominating the Ni 2p3/2 spectrum. For these photoemission peaks, no further changes are observed. The binding energies of the observed peaks are in good agreement with the literature [20].
In general, the fitted Ni components of the supported Al2O3 catalysts are broader than the components observed for the Ni foil. The broadening of the peaks is likely due to non-well-ordered oxides and different oxides, which are all found within a narrow binding energy range and cannot be resolved in the spectra. Therefore, at 200 °C, only two components are used to fit the Ni 2p3/2 spectra for the Al2O3 supported catalysts: one main peak at 856.3 ± 0.1 eV and a satellite signal at 861.9 ± 0.1 eV. The binding energy of the main peak is too high to correspond to pure Ni-oxide or hydroxide and may indicate of a NiMoO4 formation or NiOOH. [20]. Earlier studies of Ni-based Al2O3-supported catalysts observed that the Ni 2p signal shifts due to interaction with the Al2O3 support [29,30]. The findings of these studies indicate that the Ni in the Al2O3-supported catalysts is in the +2 oxidation state corresponding to either NiMoO4 or NiAl2O4 [14,21,23,29]. While the Ni/Al2O3 and the NiMo(1:1)/Al2O3 are still fully oxidized at 200 °C, a small amount of metallic Ni with a binding energy of 852.7 eV can be detected in the NiMo(1:2)/Al2O3 (Figure 2d). At 300 °C, the Ni foil and the Ni/Al2O3 remain fully oxidized while the reduction of both bimetallic catalysts has started. At 400 °C, the Ni foil is fully reduced to metallic Ni and metallic Ni begins to form in the Ni/Al2O3. At this temperature, the bimetallic catalysts are more reduced than the monometallic Ni/Al2O3. While heating the samples to 600 °C, the remaining Ni2+ component reduces further. A small amount of Ni2+ is still detectable in the NiMo(1:1)/Al2O3 and the Ni/Al2O3, while the NiMo(1:2)/Al2O3 appears to have reduced completely. This may, however, be due to the low statistics in the spectrum.
Figure 3 shows the Mo 3d core-level spectra for the alumina-supported catalysts and Mo foil measured at temperatures between 200 °C and 600 °C. At 200 °C, the spectra of all the catalysts are dominated by components with the binding energies 232.5 eV and 235.7 eV, which indicates Mo6+ corresponding to MoO3 oxide or possibly NiMoO4 in the bimetallic catalysts. The Mo/Al2O3 and the Mo foil, however, show a weak shoulder at 234.3 eV and 231.1 eV, which is attributed to a Mo5+ oxidation state.
At 300 °C, additional components with the binding energies 229.5 eV and 231.8 eV are observed for the Mo/Al2O3. These components are attributed to the Mo4+ oxidation state [26,29,30] in a MoO2 oxide and indicate that the reduction process has started. The spectrum at 400 °C is, however, dominated by the Mo5+ component that contributes to 75% of the total Mo 3d signal. This is highly interesting since the partially reduced Mo atoms are believed to be important in the catalysis process [31]. Increasing the temperature of the Mo/Al2O3 to 400 °C reduces the Mo5+ contribution to approximately 50% of the Mo 3d signal intensity and at 500 °C the Mo4+ and Mo6+ components dominate the spectrum. In addition, a new Mo2+ component is observed at binding energies 231.8 eV and 228.6 eV, which may be an indication of the formation of Mo2C [25]. The corresponding C 1s spectra, however, show a peak at 284.0 eV, which is comparatively high for a carbide, which has been reported at binding energies of ~283.1 eV [25]. As the Mo/Al2O3 is heated further, metallic Mo is detected at 600 °C.
If we compare the reduction of the Mo/Al2O3 to the Mo foil, we can see that there is a significant difference in the reduction process. The Mo spectrum of the foil does not change significantly until the sample temperature reaches 600 °C and a distinct reduction of the Mo6+ to Mo4+ is observed. The good statistic in the spectra of the foil makes it possible to detect a clear broadening of the Mo6+ and Mo5+ when the Mo4+ is formed. This broadening could result from a Mo4+ satellite [26] at binding energies of 231.0 eV and 234.2 eV, but is not included in the fit due to the already complex fit of the spectra.
The results of the Mo foil and Mo/Al2O3 are compared to the reduction of the bimetallic catalysts shown in Figure 3c,d. In contrast to the Mo foil and Mo/Al2O3, the Mo4+ component can be identified already at 200 °C in the spectra originating from the bimetallic catalysts. Increasing the temperature further, the MoO3 continues to reduce, and at 300 °C the spectra of the two bimetallic catalysts look very similar, both showing approximately 50% Mo6+ but only 30% Mo5+, which is significantly lower compared to the monometallic Mo/Al2O3.
With increasing temperature, the reduction of the catalysts proceeds, and the Mo4+ component is continuously increasing. The larger amount of Mo4+ in both bimetallic catalysts as compared to Mo/Al2O3 is interpreted as the Ni content facilitating the reduction of Mo. Moreover, at 500 °C, a Mo2+ component is observed for NiMo(1:2)/Al2O3, but this component is surprisingly not observed for the NiMo(1:1)/Al2O3 until the catalyst reaches 600 °C.
To illustrate the temperature dependence of the reduction, the peak areas obtained from the APXPS spectra were plotted in Figure 4 as a function of temperature. Figure 4a shows the peak area of the NiO photoemission peak normalized to the total Ni 2p3/2 signal as a function of the temperature. It can be seen that a temperature of 300 °C is needed to start the reduction of the Ni/Al2O3 and the Ni foil. Further, the slope of the curve indicates that the reduction of the Ni/Al2O3 is more gradual than the reduction of the Ni foil. However, the two bimetallic catalysts (green and dark-cyan line in Figure 4a) start to reduce at a lower temperature than the monometallic catalyst or the Ni foil. The comparison of the two bimetallic catalysts indicates that the reduction of the NiMo(1:2)/Al2O3 begins before the reduction of the NiMo(1:1)/Al2O3, which suggests that a higher Mo content may facilitate the reduction of the NiO in the bimetallic catalysts.
Figure 4b shows the sum of the Mo6+ and Mo5+ peak area normalized by the total peak area of the Mo 3d signal as a function of temperature. At temperatures up to 400 °C, the reduction of the Mo/Al2O3 and the bimetallic catalysts progress at similar speeds, but at a temperature of approximately 400 °C and above, the reduction of the Mo/Al2O3 accelerates and advances faster than the reduction of the bimetallic catalysts. The reduction of the foil differs completely from the supported catalysts and a temperature of 600 °C is needed before a reduction of the Mo foil can be detected. It is, however, important to understand that the fitting of Mo 3d spectra is complex and the overlapping oxide peaks make the interpretation challenging. This may introduce an uncertainty in the quantification of the different oxidation states that are correlated to the fitted peak area in the spectra.

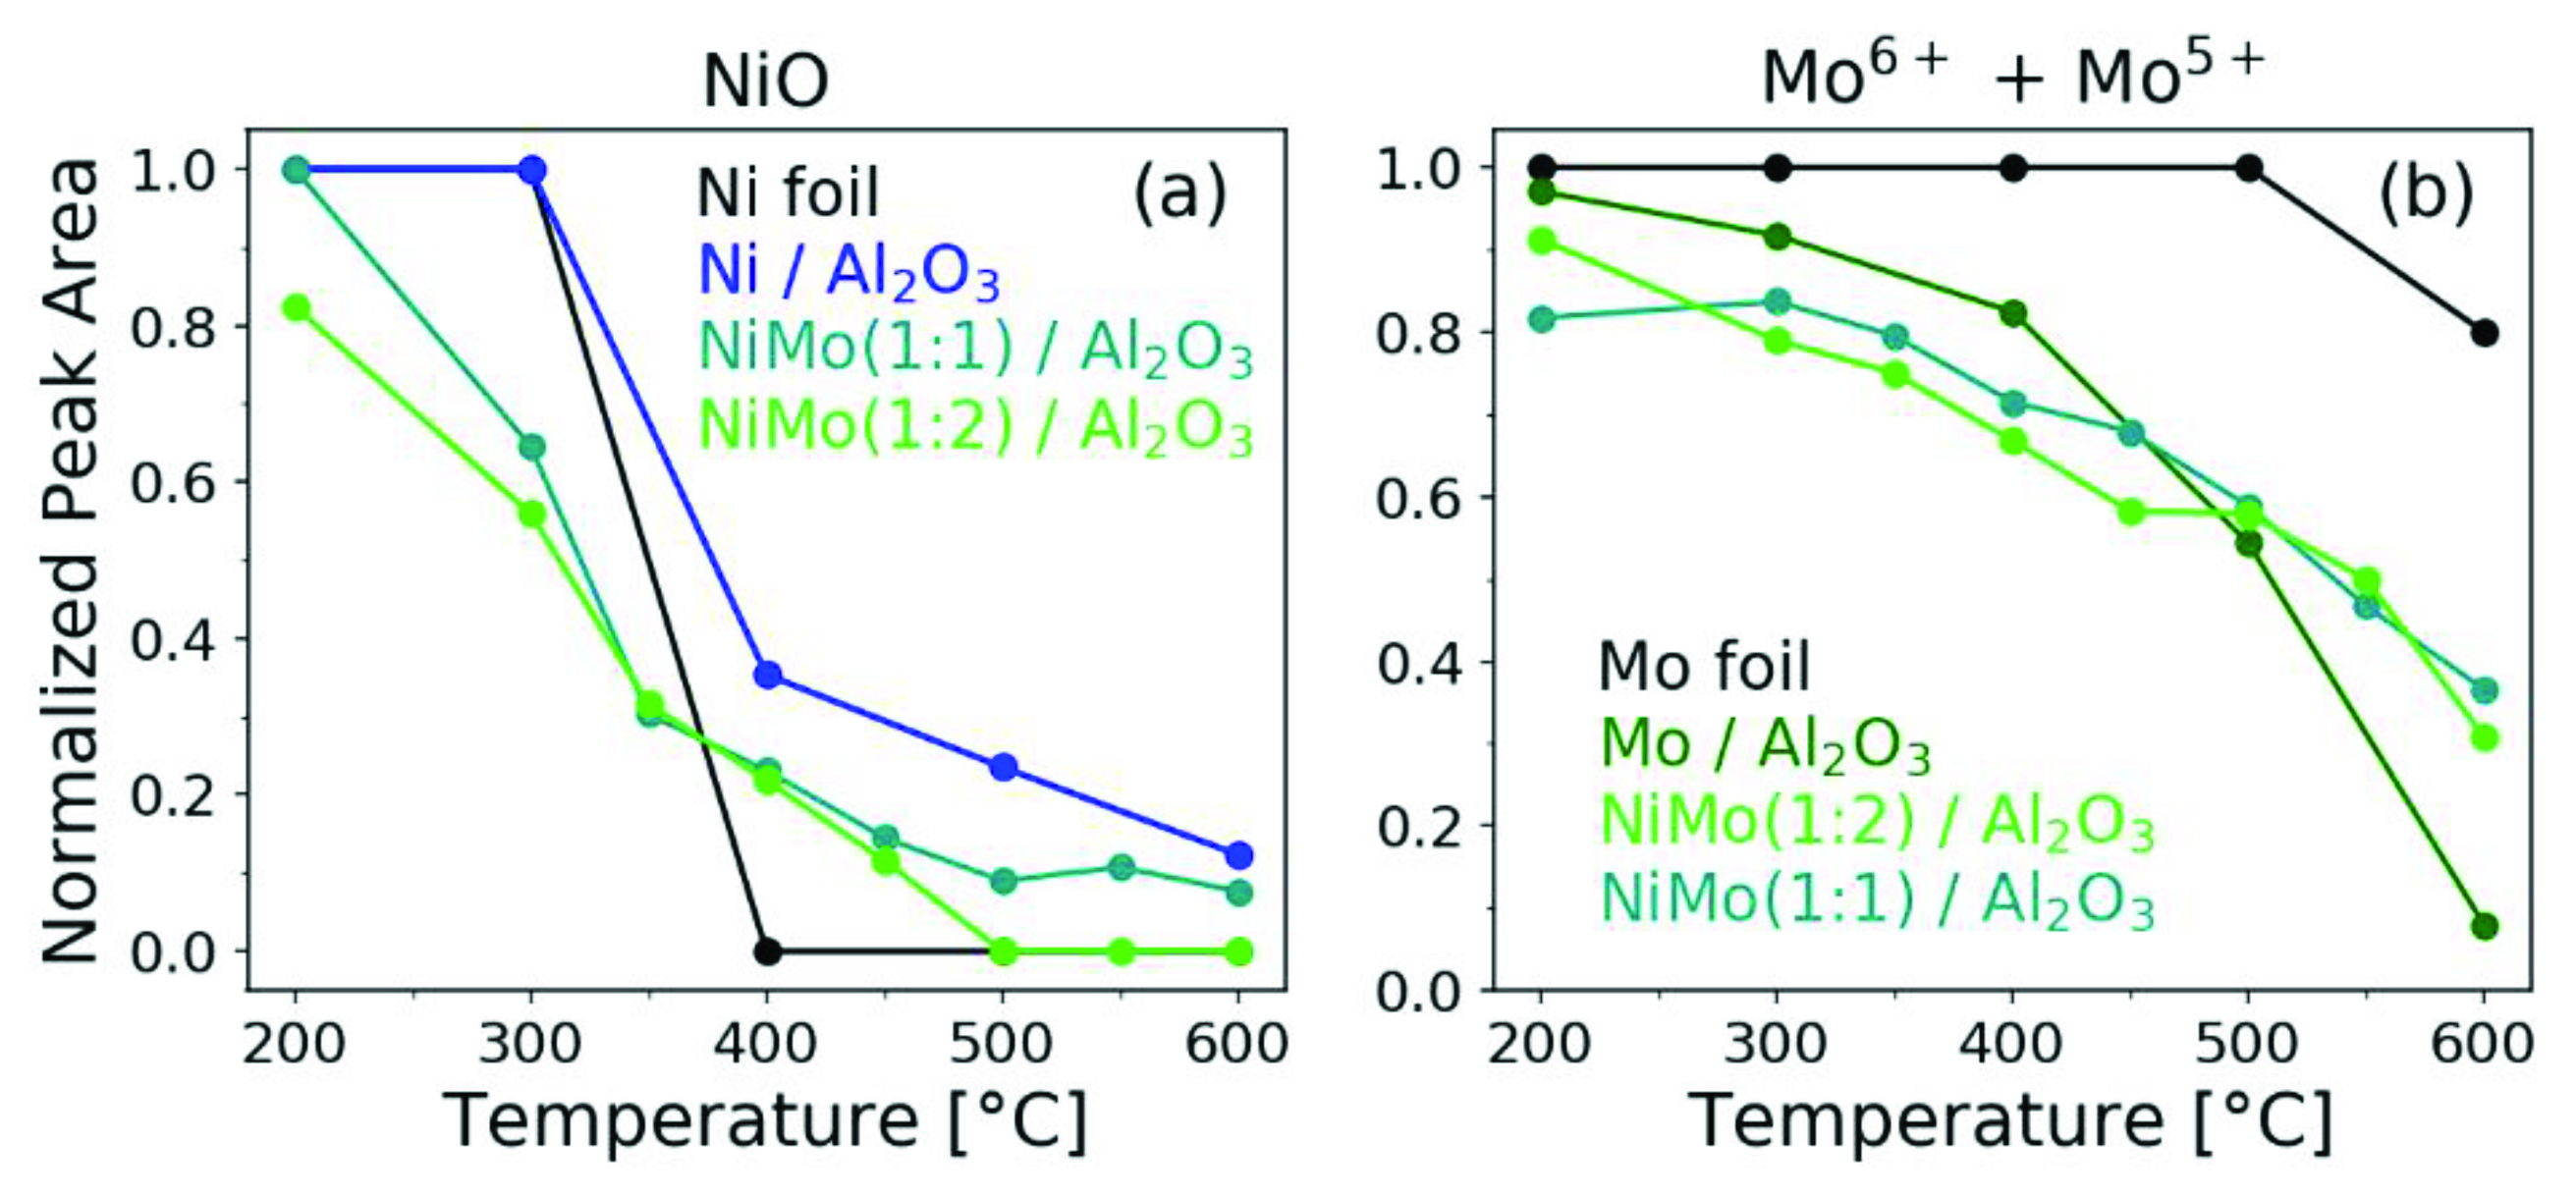
2.3. In Situ H2 Reduction Followed by XANES

The XANES data of the bimetallic NiMo(1:2)/Al2O3 were recorded in situ during heating from room temperature up to 600 °C while flowing of 4% H2 diluted in N2, at atmospheric pressure. The reduction experiment was repeated twice following the Ni K-edge and Mo K-edge, respectively, during the temperature ramp. A new sample was used for each experiment. The XANES of the bimetallic catalyst before and after the reduction was compared to NiO, Ni(OH)2, NiOOH, MoO2, MoO3, and Na2MoO4 reference as well as the references of Ni and Mo metal foils (Figure 5a,b). The in situ measurements of the Ni K-edge and the Mo K-edge are shown in Figure 5c,d.
The initial XANES spectrum of Ni (called “NiMo(1:2)_start”) has an edge energy Eedge of 8344.9 eV, which is very similar to the reference spectra of NiO and NiOOH with an Eedge of 8345.3 eV and 8344.1 eV, respectively (Figure 5a), where Eedge defined as the maximum in the first derivative of the adsorption spectrum. To analyze the composition of the catalyst prior to the reduction, linear combination fitting (LCF) was performed using the NiO, Ni(OH)2, NiOOH, and metallic Ni reference spectra. This resulted in a composition of 65% NiOOH, 28% NiO, and 7% Ni(OH)2 (shown in Figure S4c, in the Supplementary Materials). An alternative interpretation of the initial spectra is that the Ni is in the form of mainly NiO and that the spectra are smeared due to nanosized structures of the Ni on the Al2O3 support, resulting in not well-ordered NiO structures, as reported in [32].
In Figure 5b, the initial Mo K-edge spectrum is shown. The spectrum resembles that of MoO3 (octahedral coordinated Mo6+) and Na2MoO4 (tetrahedral coordinated Mo6+). The prepeak is, however, more pronounced than for the MoO3 XANES spectra, while less so than in the Na2MoO4 reference spectra, and with an energy in between the prepeak of MoO3 and Na2MoO4. A LCF based on the available references resulted in a fitted composition corresponding to 69% MoO4 and 31% MoO3 (fit is shown in Figure S4a, in the Supplementary Materials). The presence of MoO4 could indicate the presence of tetrahedral NiMoO4 corresponding to β-phase NiMoO4 [22].
The changes in the XANES spectra with temperature under a reducing environment is shown in Figure 5c,d. The induced change in chemical form is also illustrated in the inserts in Figure 5, showing the change in features in the Ni and Mo XANES spectra.
When the temperature of the catalyst is increased, small changes in the chemical state are observed for both Ni and Mo already below 200 °C (see inserts in Figure 5c,d). The intensity of the white line at 8343.5 eV decreases in the Ni spectrum, while the pre-edge peak in the Mo spectrum increases initially. We speculate that the increased intensity in the prepeak is a sign of structural changes into a more ordered tetrahedral structure of β-phase NiMoO4. This would likely also affect Ni, but no Ni k-edge reference spectrum of NiMoO4 was available.
A more rapid and pronounced reduction does not start until ~400–450 °C for Mo, and for Ni at slightly higher temperatures.
The end temperature of the XANES experiments was slightly below 600 °C. The final Ni and Mo spectra are plotted in Figure 5 together with selected references. The Ni spectrum shows an edge position of 8332.6 eV, which is slightly lower than metallic Ni. The features in the white line deviate from those of the metallic Ni, which could indicate the formation of an alloy with Mo, or the alumina substrate (the spectra resemble that reported for Ni-doped alumina) [33]. The LCF after the reduction showed ~80% metallic Ni and ~10% NiO and ~10% NiOOH, respectively (fit is shown in Figure S4d, in the Supplementary Materials). However, the edge position of the fitted spectra is too high in energy, indicating that the presence of Ni-oxides is overestimated and that the Ni after reduction is more likely metallic.
At 600 °C the Mo spectrum (Eedge 20,007.6 eV with Eedge defined as the energy at half the edge height of the adsorption [34]) shows that the Mo is still oxidized when compared to the XANES spectra of the Mo-foil (Eedge 20,000 eV). From room temperature to 600 °C the energy of the edge position shifts by ΔE 4.3 eV, initially being +0.6 eV higher than the edge of MoO3. The Eedge after reduction is more similar to that of MoO2 at 20,007.2 eV, the features above the adsorption edge differ from the MoO2 and a small pre-edge peak remains visible. An LCF fitting suggests a composition of 18% MoO3, 55% MoO2, and 27% metallic Mo. The LCF gave the correct edge position, but shows some apparent difference in the structure of the white line (Figure S4b in the Supplementary Materials).

3. Discussion

Before the in situ reduction experiments, the oxidation state of the catalysts was characterized. The measurements indicate that the Ni in the supported catalysts was in the 2+ oxidation state corresponding to NiO or NiMoO4 for the bimetallic catalyst. However, the presence of Ni hydroxides can not be excluded, since the APXPS spectra are challenging to interpret. Based on the APXPS measurements, the Mo was primarily in the 6+ oxidation state, which is related to MoO3 or NiMoO4. The XANES spectra of the initial Ni state could either be interpreted as nanostructure NiO or as NiOOH. For Mo, the XANES shows that as well as MoO3, MoO4 is also present, which supports the formation of β-phase NiMoO4 [22]. For the bimetallic catalyst, both the APXPS and the XANES show the presence of NiMoO4 and MoO3 in the initial state of the catalyst, while it cannot be clearly determined whether there is additional NiO or NiOOH.
Above 400 °C, the APXPS spectra indicate that the majority of Mo is partially reduced and there is a mixture of different oxidation states. At the final reduction temperature at 600 °C, the Mo signal is dominated by Mo4+ and Mo2+. The presence of Mo4+ is supported by the Mo XANES spectrum, which indicates a mixture of Mo oxides at the end of the experiment. The XANES measurements can neither confirm nor exclude the presence of Mo2+ due to a lack of a Mo2+ reference spectrum. According to the literature [35], Mo2+ in Mo2C has a half-step energy of approximately 20,007.5 eV, which is in good agreement with the measured edge position for the NiMo(1:2) and could indicate Mo2+ in the XANES spectra. In summary, we can conclude from the APXPS and the XANES that Mo is not fully reduced to a metallic state, but a mixture of oxides and possibly carbides is present at 600 °C in a reducing atmosphere.
If we analyze the Ni spectra from the two techniques during the reduction, the APXPS results show that Ni is almost completely reduced above 500 °C. The XANES spectra for the NiMo(1:2) show, however, a rapid reduction just above 500 °C, indicating metal bonds with an Eedge similar to that of the Ni foil. However, the shape of the Ni XANES spectrum after reduction deviates from metallic Ni, and shows a similar shape as reported for Ni-doped Al [33]. This could indicate that Ni may have been incorporated in the Al2O3. Additionally, the APXPS showed a binding-energy shift of the Ni by 0.5 eV towards lower binding energies compared to the reference value for Ni0.15 for all alumina-supported catalysts. A temperature of 600 °C is high enough to allow Ni bulk molecules to become mobile [36], which could result in the sintering of the Ni into larger clusters. For the bimetallic catalysts, the formation of a new alloy is possible. However, the observed binding-energy shifts could also be caused by an issue with the binding-energy calibration of the APXPS data.

4. Materials and Methods

The reduction of two bimetallic NiMo catalysts supported by Al2O3 was investigated with APXPS and compared to the reduction of monometallic Al2O3-supported Ni and Mo catalysts and the reduction of oxidized Ni and Mo foils.

4.1. Sample Preparation

4.1.1. Synthesis of Al2O3-Supported Catalysts

Four Al2O3-supported catalysts were characterized in this study. The catalysts were synthesized by incipient wetness impregnation of δ-Al2O3. We prepared two monometallic catalysts that contained only Mo or Ni as the active metal and two bimetallic catalysts with different Ni:Mo ratios. The aimed Ni and Mo composition of the catalysts after production is shown in Table 5.
The synthesis of the Mo/Al2O3, Ni/Al2O3, and NiMo(1:2)/Al2O3 was described in a previous publication [37]. The NiMo(1:1)/Al2O3 was prepared as the NiMo(1:2)/Al2O3 with adjusted concentrations of the impregnation solutions as indicated in Table 5. The loading of the four catalysts ranged between 14.0 wt% and 4.9 wt% of Mo and between 3.4 wt% and 8.4 wt% for the Ni.

4.1.2. Metal Foils

The Ni and Mo foils with a purity of 99.99% (Sigma Aldrich, St. Louis, MO, USA) were used as references for the APXPS measurements where Ni 2p, Mo 3d, and O 1s core levels were probed.

4.2. Experimental Techniques

4.2.1. Nitrogen Physisorption

The nitrogen physisorption experiments were performed with a Micromeritics 3-flex system (Norcross, GA, USA) in dynamic physisorption mode. Prior to the measurement, the catalysts were degassed at 250 °C in high vacuum for 4 h. For the experiments, ~100 mg of the catalysts were probed at liquid nitrogen temperature, and the surface area was estimated using the equations suggested by Brunauer, Emmet, and Teller (BET) [18].

4.2.2. Transmission Electron Microscopy and Energy-Dispersive X-Ray Spectroscopy

Each sample was ground until a homogenous powder was obtained and sonicated in ethanol. Afterwards, a few drops of the solution were deposited on a holey carbon-film-coated Cu transmission electron microscopy (TEM) grid. JEOL 3000F operated at 300 kV was used for TEM and high-resolution transmission electron microscopy (HRTEM) imaging and scanning transmission electron microscopy (STEM) for energy-dispersive X-ray (EDX) spectroscopy. In STEM mode, a high-angle annular dark-field (HAADF) detector coupled with an EDX spectrometer (Oxford Instruments, Abingdon, UK) was used for elemental mapping. The data were processed and analyzed in the INCA software (Oxford Instruments, Abingdon, UK).

4.2.3. Ambient-Pressure X-ray Photoelectron Spectroscopy

The ambient-pressure X-ray photoelectron spectroscopy (APXPS) measurements were made at the HIPPIE beamline, MAX IV Laboratory [38]. The beamline is located at the larger ring of the synchrotron, which operates at 3 GeV with a ring current of 300 mA. The APXPS endstation is equipped with a ScientaOmicron Hipp-3 electron analyzer. The spectra were recorded with normal emission angle with a beam-incidence angle of 55°. The reduction of the oxidized catalysts was followed in situ in 1 mbar of H2 while increasing the temperature of the catalysts stepwise.
The Ni 2p were collected with an excitation energy of 1000 eV and 1800 eV, while the Mo 3d core-level spectra were collected with lower photon energies of 500 eV and 550 eV. For binding-energy calibration, the Al 2p core level was used and the Al2O3 peak was calibrated to 74.6 eV and only minor charging was observed.
The APXPS spectra were fitted using the CasaXPS software package [39]. Details on the chosen line shapes are discussed in Supporting Information.
Finally, we would like to address the issue of beam damage. MoO3 has previously been reported to be sensitive to beam damage, which causes a reduction in the oxides [40]. To minimize this effect, each spectrum of the Mo foil was collected at a fresh spot. For the alumina-supported catalysts, no beam damage was observed at room temperature and thus all spectra were collected at the same spot for the whole measurement series.

4.2.4. X-ray Absorption Near-Edge Structure

The XANES measurements were made using the Balder beamline (BL) at the MAX IV Laboratory. Balder BL is placed at the larger ring operating at 3 GeV and 300 mA [41]. Si111 crystals are used for monochromatizating, and the beam size is ~100 µm × 100 µm.
XANES spectra were measured at the K-edges of Ni (8333 eV) and Mo (20,000 eV). For references and initial state of the samples, spectra were recorded in transmission mode, while for the in situ studies, XANES spectra were recorded in fluorescence mode (the set-up used for heating did not allow transmission model measurements). The fluorescence mode data were collected using a seven-element silicon drift detector. In situ experiments were performed using a gas-flow cell (High Temperature Heating System—TS1500, Linkham Scientific Instruments, Redhill, UK) flowing a gas of 4% H2 in N2 over the sample during heating up to ~580 °C.
Several reference compounds (NiO, MoO3, Mo2O3) were purchased (>99%) and tablets with an optical thickness of ~2.5 were prepared and pressed with BN as binder. The XAS spectra of the references were measured in transmission mode. For energy calibration, foils of Mo and Ni were used, also measured in transmission mode. The catalysts were measured in transmission mode before the in situ experiment to quantify and take into account the effect of self-absorption in fluorescence mode [42].
XANES data were preprocessed (summation, background subtraction, normalization, and correction of self-absorption) and further analyzed using the ATHENA software package [43].

5. Conclusions

The reduction of four Al2O3-supported catalysts, two with different Ni:Mo ratios, one monometallic Mo/Al2O3, and one monometallic Ni/Al2O3 catalysts, were compared to the reduction of Ni and Mo foil, respectively, in 1 mbar H2. Characterization with TEM/EDX and BET showed that the active metals were well-dispersed on the alumina support and the strong interaction with the support was concluded to be the reason for the slow reduction observed for the supported catalysts as compared to the foils. In addition, we found that the Ni foil was completely reduced at 400 °C while the reduction of the alumina-supported Ni was still ongoing. The opposite behavior was found for the Mo, where the Mo-oxide on the foil was reduced at a significantly higher temperature as compared to the alumina-supported Mo. For the bimetallic catalysts, it was observed that the reduction of the MoO3 starts at a lower temperature than the reduction of the NiO. Overall, we could conclude that at 600 °C in 1 mbar of H2, the Ni is completely reduced to metallic Ni for all samples (supported and foils), while Mo was only partially reduced and a mixture of different oxide phases, mainly MoO2, and possibly carbide was observed.
The reduction from Mo6+ to Mo4+ was observed at 200 °C in the bimetallic alumina supported catalysts and at 300 °C in the monometallic Mo/Al2O3, while it was only detected at 600 °C for the Mo foil. In our study, we found that during this reduction step, Mo5+ could be identified in the spectrum, which has been suggested to be the active phase of the Mo-based catalyst. This paves the way for future operando APXPS experiments where the nature of the active site can be explored.

Supplementary Materials

The following supporting information can be downloaded at: https://www.mdpi.com/article/10.3390/catal12070755/s1, Figure S1: Ni 2p3/2 core level; Figure S2: Mo 3d core level; Figure S3: TEM (left) and HRTEM (right) images of (a,b) Mo/Al2O3, (c,d) NiMo(1:2)/Al2O3, (e,f) NiMo(2:1)/Al2O3, and (g,h) Mo/Al2O3; Figure S4: The measured Ni and Mo K-edge spectra measured at the start and end of the reduction of the NiMo(1:2) catalyst plotted together with the result from the Linear Combination Fitting (LCF). The references include the Ni metal, NiO, NiOOH, and Ni(OH)2 as well as MoO2, MoO3, Mo metal and Na2MoO4. In (a) the Mo k-edge at the start temperature, in (b) the end temperature, in (c) the Ni k-edge at the start temperature, and in (d) the end temperature; Figure S5: The fraction of the starting XANES K-edge spectrum of Ni and Mo in the NiMo(1:2) as a function of temperature. Refs [44,45,46,47,48,49] are cited.

Author Contributions

Conceptualization, S.B., S.M.G. and J.R.; formal analysis, S.M.G., J.R. and M.B.; Funding acquisition, L.R.M., M.E.M., J.Z. and S.B.; investigation, S.B., S.M.G., J.R., M.B., H.W., H.K., L.R.M., M.S., R.T., A.S., L.K., S.Z., C.H. and K.G.V.S.C.; resources, A.S., M.S. and R.T.; writing—original draft preparation, S.M.G., J.R. and M.B.; writing—review and editing, S.B., J.Z., S.M.G., M.E.M., L.R.M. and K.G.V.S.C.; visualization, S.M.G., M.B. and J.R.; supervision, S.B.; project administration, S.B. All authors have read and agreed to the published version of the manuscript.

Funding

This research was funded by the Swedish Foundation for Strategic Research, grant number ITM17-0045 and FFL18-0282, by the Knut and Alice Wallenberg foundation (KAW)-funded project “Atomistic design of new catalysts”, grant number KAW 2015.0058 and by the Swedish Research Council, grant number 2018-05374. It is also supported by the Crafoord Foundation, grant number 20201013 and the Carl Trygger Foundation, grant number CTS 20:51.

Data Availability Statement

The datasets generated and analyzed in the presented study are available from the corresponding author on reasonable request.

Acknowledgments

The authors acknowledge the assistance of the researcher Crispin Hetherington from the Centre for Analysis and Synthesis at the Department of Chemistry for the STEM/EDX analysis of the Ni-Mo-based catalysts. We acknowledge MAX IV Laboratory for time on Beamline HIPPIE and Balder under Proposal 20200510 and 20190915. Research conducted at MAX IV, a Swedish national user facility, is supported by the Swedish Research council under contract 2018-07152, the Swedish Governmental Agency for Innovation Systems under contract 2018-04969, and Formas under contract 2019-02496.

Conflicts of Interest

The authors declare no conflict of interest.

References

  1. Grange, P.; Vanhaeren, X. Hydrotreating Catalysts, an Old Story with New Challenges. Catal. Today 1997, 36, 375–391. [Google Scholar] [CrossRef]
  2. Breysse, M.; Afanasiev, P.; Geantet, C.; Vrinat, M. Overview of Support Effects in Hydrotreating Catalysts. Catal. Today 2003, 86, 5–16. [Google Scholar] [CrossRef]
  3. Topsøe, H.; Clausen, B.S.; Topsøe, N.Y.; Zeuthen, P. Progress in the Design of Hydrotreating Catalysts Based on Fundamental Molecular Insight. Stud. Surf. Sci. Catal. 1989, 53, 77–102. [Google Scholar] [CrossRef]
  4. Koklyukhin, A.S.; Mozhaev, A.V.; Sal’nikov, V.A.; Nikul’shin, P.A. Promoter Nature Effect on the Sensitivity of Ni–Mo/Al2O3, Co–Mo/Al2O3, and Ni–Co–Mo/Al2O3 Catalysts to Dodecanoic Acid in the Co-Hydrotreating of Dibenzothiophene and Naphthalene. Kinet. Catal. 2017, 58, 463–470. [Google Scholar] [CrossRef]
  5. Erhan Aksoylu, A.; Önsan, Z.I. Interaction between Nickel and Molybdenum in Ni-Mo/Al2O3 Catalysts: II CO Hydrogenation. Appl. Catal. A Gen. 1998, 168, 399–407. [Google Scholar] [CrossRef]
  6. Kumar, P.; Yenumala, S.R.; Maity, S.K.; Shee, D. Kinetics of Hydrodeoxygenation of Stearic Acid Using Supported Nickel Catalysts: Effects of Supports. Appl. Catal. A Gen. 2014, 471, 28–38. [Google Scholar] [CrossRef]
  7. Sotelo-Boyás, R.; Liu, Y.; Minowa, T. Renewable Diesel Production from the Hydrotreating of Rapeseed Oil with Pt/Zeolite and NiMo/Al2O3 Catalysts. Ind. Eng. Chem. Res. 2011, 50, 2791–2799. [Google Scholar] [CrossRef]
  8. Shetty, M.; Murugappan, K.; Prasomsri, T.; Green, W.H.; Román-Leshkov, Y. Reactivity and Stability Investigation of Supported Molybdenum Oxide Catalysts for the Hydrodeoxygenation (HDO) of m-Cresol. J. Catal. 2015, 331, 86–97. [Google Scholar] [CrossRef]
  9. Dupont, C.; Lemeur, R.; Daudin, A.; Raybaud, P. Hydrodeoxygenation Pathways Catalyzed by MoS2 and NiMoS Active Phases: A DFT Study. J. Catal. 2011, 279, 276–286. [Google Scholar] [CrossRef]
  10. Tsurov, M.A.; Afanasiev, P.V.; Lunin, V.V. Composition and Catalytic Properties of Products from the Reduction of NiMoO4. Appl. Catal. A Gen. 1993, 105, 205–221. [Google Scholar] [CrossRef]
  11. Abdel-Dayem, H.M. Dynamic Phenomena during Reduction of α-NiMoO4 in Different Atmospheres: In-Situ Thermo-Raman Spectroscopy Study. Ind. Eng. Chem. Res. 2007, 46, 2466–2472. [Google Scholar] [CrossRef]
  12. Brito, J.L.; Laine, J.; Pratt, K.C. Temperature-Programmed Reduction of Ni-Mo Oxides. J. Mater. Sci. 1989, 24, 425–431. [Google Scholar] [CrossRef]
  13. Burch, R.; Collins, A. Temperature-Programmed Reduction of Ni/Mo Hydrotreating Catalysts. Appl. Catal. 1985, 18, 389–400. [Google Scholar] [CrossRef]
  14. Dufresne, P.; Payen, E.; Grimbolt, J.; Bonnelle, J.P. Study of Ni-Mo-γ-Al2O3 Catalysts by X-Ray Photoelectron and Raman Spectroscopy. Comparison with Co-Mo-γ-Al2O3. J. Phys. Chem. 1981, 85, 2344–2351. [Google Scholar] [CrossRef]
  15. Brito, J.; Laine, J. Characterization of Supported MoO3 by Temperature-Programmed Reduction. Polyhedron 1986, 5, 179–182. [Google Scholar] [CrossRef]
  16. Brito, J.L.; Laine, J. Reducibility of Ni-Mo/Al2O3-Catalysts: A TPR Study. J. Catal. 1993, 139, 540–550. [Google Scholar] [CrossRef]
  17. Merte, L.R.; Gustafson, J.; Shipilin, M.; Zhang, C.; Lundgren, E. Redox Behavior of Iron at the Surface of an Fe0.01Mg0.99O(100) Single Crystal Studied by Ambient-Pressure Photoelectron Spectroscopy. Catal. Struct. React. 2017, 3, 95–103. [Google Scholar] [CrossRef] [Green Version]
  18. Brunauer, S.; Emmett, P.H.; Teller, E. In Multimolecular. J. Am.Chem.Soc. 1938, 60, 309–319. [Google Scholar] [CrossRef]
  19. Yu, W.; Yang, B.; Chen, X.; Jiang, W.; Yu, Q.; Xu, B. Thermodynamic Calculation and Experimental Investigation on the Products of Carbothermal Reduction of Al2O3 under Vacuum. Vacuum 2012, 86, 2005–2009. [Google Scholar] [CrossRef]
  20. Biesinger, M.C.; Payne, B.P.; Lau, L.W.M.; Gerson, A.; Smart, R.S.C. X-ray Photoelectron Spectroscopic Chemical State Quantification of Mixed Nickel Metal, Oxide and Hydroxide Systems. Surf. Interface Anal. 2009, 41, 324–332. [Google Scholar] [CrossRef]
  21. Salagre, P.; Fierro, J.L.G.; Medina, F.; Sueiras, J.E. Characterization of Nickel Species on Several γ-Alumina Supported Nickel Samples. J. Mol. Catal. A Chem. 1996, 106, 125–134. [Google Scholar] [CrossRef]
  22. Liu, H.; Yin, C.; Li, X.; Chai, Y.; Li, Y.; Liu, C. Effect of NiMo Phases on the Hydrodesulfurization Activities of Dibenzothiophene. Catal. Today 2017, 282, 222–229. [Google Scholar] [CrossRef]
  23. Hernández-Huesca, R.; Mérida-Robles, J.; Maireles-Torres, P.; Rodríguez-Castellón, E.; Jiménez-López, A. Hydrogenation and Ring-Opening of Tetralin on Ni and NiMo Supported on Alumina-Pillared α-Zirconium Phosphate Catalysts. A Thiotolerance Study. J. Catal. 2001, 203, 122–132. [Google Scholar] [CrossRef] [Green Version]
  24. Katrib, A.; Sobczak, J.W.; Krawczyk, M.; Zommer, L.; Benadda, A.; Jablonski, A.; Maire, G. Surface Studies and Catalytic Properties of the Bifunctional Bulk MoO2 System. Surf. Interface Anal. 2002, 34, 225–229. [Google Scholar] [CrossRef]
  25. Murugappan, K.; Anderson, E.M.; Teschner, D.; Jones, T.E.; Skorupska, K.; Román-Leshkov, Y. Operando NAP-XPS Unveils Differences in MoO3 and Mo2C during Hydrodeoxygenation. Nat. Catal. 2018, 1, 960–967. [Google Scholar] [CrossRef] [Green Version]
  26. Scanlon, D.O.; Watson, G.W.; Payne, D.J.; Atkinson, G.R.; Egdell, R.G.; Law, D.S.L. Theoretical and Experimental Study of the Electronic Structures of MoO3 and MoO2. J. Phys. Chem. C 2010, 114, 4636–4645. [Google Scholar] [CrossRef]
  27. van Veenendaal, M.A.; Sawatzky, G.A. Nonlocal Screening Effects in 2p X-Ray Photoemission Spectroscopy Core-Level Line Shapes of Transition Metal Compounds. Phys. Rev. Lett. 1993, 70, 2459–2462. [Google Scholar] [CrossRef]
  28. Grosvenor, A.P.; Biesinger, M.C.; Smart, R.S.C.; McIntyre, N.S. New Interpretations of XPS Spectra of Nickel Metal and Oxides. Surf. Sci. 2006, 600, 1771–1779. [Google Scholar] [CrossRef]
  29. Liu, F.; Xu, S.; Cao, L.; Chi, Y.; Zhang, T.; Xue, D. A Comparison of NiMo/Al2O3 Catalysts Prepared by Impregnation and Coprecipitation Methods for Hydrodesulfurization of Dibenzothiophene. J. Phys. Chem. C 2007, 111, 7396–7402. [Google Scholar] [CrossRef]
  30. Wang, Y.; Xiong, G.; Liu, X.; Yu, X.; Liu, L.; Wang, J.; Feng, Z.; Li, C. Structure and Reducibility of NiO-MoO3/γ-Al2O3 Catalysts: Effects of Loading and Molar Ratio. J. Phys. Chem. C 2008, 112, 17265–17271. [Google Scholar] [CrossRef]
  31. Prasomsri, T.; Shetty, M.; Murugappan, K.; Román-Leshkov, Y. Insights into the Catalytic Activity and Surface Modification of MoO3 during the Hydrodeoxygenation of Lignin-Derived Model Compounds into Aromatic Hydrocarbons under Low Hydrogen Pressures. Energy Environ. Sci. 2014, 7, 2660–2669. [Google Scholar] [CrossRef]
  32. Wu, Z.Y.; Liu, C.M.; Guo, L.; Hu, R.; Abbas, M.I.; Hu, T.D.; Xu, H.B. Structural Characterization of Nickel Oxide Nanowires by X-Ray Absorption near-Edge Structure Spectroscopy. J. Phys. Chem. B 2005, 109, 2512–2515. [Google Scholar] [CrossRef] [PubMed]
  33. Pan, D.; Jian, J.K.; Ablat, A.; Li, J.; Sun, Y.F.; Wu, R. Structure and Magnetic Properties of Ni-Doped AlN Films. J. Appl. Phys. 2012, 112, 053911. [Google Scholar] [CrossRef]
  34. Zhang, R.; Li, P.; Wang, F.; Ye, L.; Gaur, A.; Huang, Z.; Zhao, Z.; Bai, Y.; Zhou, Y. Atomically Dispersed Mo Atoms on Amorphous G-C3N4 Promotes Visible-Light Absorption and Charge Carriers Transfer. Appl. Catal. B Environ. 2019, 250, 273–279. [Google Scholar] [CrossRef]
  35. He, C.; Tao, J. Exploration of the Electrochemical Mechanism of Ultrasmall Multiple Phases Molybdenum Carbides Nanocrystals for Hydrogen Evolution Reaction. RSC Adv. 2016, 6, 9240–9246. [Google Scholar] [CrossRef]
  36. Argyle, M.D.; Bartholomew, C.H. Heterogeneous Catalyst Deactivation and Regeneration: A Review. Catalysts 2015, 5, 145–269. [Google Scholar] [CrossRef] [Green Version]
  37. Blomberg, S.; Johansson, N.; Kokkonen, E.; Rissler, J.; Kollberg, L.; Preger, C.; Franzén, S.M.; Messing, M.E.; Hulteberg, C. Bimetallic Nanoparticles as a Model System for an Industrial NiMo Catalyst. Materials 2019, 12, 3727. [Google Scholar] [CrossRef] [Green Version]
  38. Zhu, S.; Scardamaglia, M.; Kundsen, J.; Sankari, R.; Tarawneh, H.; Temperton, R.; Pickworth, L.; Cavalca, F.; Wang, C.; Tissot, H.; et al. HIPPIE: A New Platform for Ambient-Pressure X-ray Photoelectron Spectroscopy at the MAX IV Laboratory. J. Synchrotron Radiat. 2021, 28, 624–636. [Google Scholar] [CrossRef]
  39. Fairely, N. CasaXPS Manual 2.3. 15 Getting Started with CasaXPS; Casa Software Ltd.: London, UK, 2009; pp. 1–177. [Google Scholar]
  40. Head, A.R.; Tsyshevsky, R.; Trotochaud, L.; Yu, Y.; Karsliolu, O.; Eichhorn, B.; Kuklja, M.M.; Bluhm, H. Dimethyl Methylphosphonate Adsorption and Decomposition on MoO2 as Studied by Ambient Pressure X-Ray Photoelectron Spectroscopy and DFT Calculations. J. Phys. Condens. Matter 2018, 30, 134005. [Google Scholar] [CrossRef] [Green Version]
  41. Klementiev, K.; Norén, K.; Carlson, S.; Sigfridsson Clauss, K.G.V.; Persson, I. The BALDER Beamline at the MAX IV Laboratory. J. Phys. Conf. Ser. 2016, 712, 12023. [Google Scholar] [CrossRef] [Green Version]
  42. Tröger, L.; Arvanitis, D.; Baberschke, K.; Michaelis, H.; Grimm, U.; Zschech, E. Full Correction of the Self-Absorption in Soft-Fluorescence Extended X-ray-Absorption Fine Structure. Phys. Rev. B 1992, 46, 3283–3289. [Google Scholar] [CrossRef] [PubMed]
  43. Ravel, B.; Newville, M. ATHENA, ARTEMIS, HEPHAESTUS: Data Analysis for X-Ray Absorption Spectroscopy Using IFEFFIT. J. Synchrotron Radiat. 2005, 12, 537–541. [Google Scholar] [CrossRef] [PubMed] [Green Version]
  44. Sangaletti, L.; Depero, L.E.; Parmigiani, F. On the Non-Local Screening Mechanisms in the 2p Photoelectron Spectra of NiO and La2NiO4. Solid State Commun. 1997, 103, 421–424. [Google Scholar] [CrossRef]
  45. Carley, A.F.; Jackson, S.D.; O’Shea, J.N.; Roberts, M.W. The Formation and Characterisation of Ni3+—An X-ray Photoelectron Spectroscopic Investigation of Potassium-Doped Ni(1 1 0)-O. Surf. Sci. 1999, 440, L868–L874. [Google Scholar] [CrossRef]
  46. Furstenau, R.P.; McDougall, G.; Langell, M.A. Initial Stages of Hydrogen Reduction of NiO(100). Surf. Sci. 1985, 150, 55–79. [Google Scholar] [CrossRef]
  47. Jiménez, J.A.; Padilla, I.; Lõpez-Delgado, A.; Fillali, L.; Lõpez-Andrés, S. Characterization of the Aluminas Formed during the Thermal Decomposition of Boehmite by the Rietveld Refinement Method. Int. J. Appl. Ceram. Technol. 2015, 12, E178–E186. [Google Scholar] [CrossRef] [Green Version]
  48. Bhatia, S.; Khanna, A.; Jain, R.K. Hirdesh Structure-Property Correlations in Molybdenum Trioxide Thin Films and Nanoparticles. Mater. Res. Express 2019, 6, 186409. [Google Scholar] [CrossRef]
  49. Walls, B.; Mazilkin, A.A.; Mukhamedov, B.O.; Ionov, A.; Smirnova, I.A.; Ponomareva, A.V.; Fleischer, K.; Kozlovskaya, N.A.; Shulyatev, D.A.; Abrikosov, I.A.; et al. Nanodomain Structure of Single Crystalline Nickel Oxide. Sci. Rep. 2021, 11, 1–10. [Google Scholar] [CrossRef] [PubMed]
Figure 1. STEM micrographs and STEM-EDX maps of the alumina-supported catalysts. The first column on the left shows STEM images of the four catalysts. The following columns show the element-specific mapping of the STEM/EDX. The right column shows an overlay of the STEM/EDX mapping of Ni, Mo, and Al. Each row corresponds to one catalyst. The scale bar is 50 nm for all micrographs and maps. The mapping shows that Ni and Mo are homogeneously distributed in low concentrations over the bulk Al2O3.
Catalysts 12 00755 g001
Figure 2. Ni 2p3/2 core-level spectra of (a) Ni foil, (b) Ni/Al2O3, (c) NiMo(1:1)/Al2O3, and (d) NiMo(1:2)/Al2O3 in 1 mbar H2 at 200 °C, 300 °C, 400 °C, 500 °C, and 600 °C. The peak labels in the spectra in a) at 200 °C are a notation for the different final states of NiO resulting from the core-hole shielding mechanisms. These final states are labeled as 3daL−b, where a is the number of electrons in the Ni 3d core level, L refers to the ligand oxygen atoms, and −b is the number of ligand electrons shielding the Ni core-hole by charge transfer to the Ni atom.
Catalysts 12 00755 g002
Figure 3. Mo 3d core-level spectra of (a) Mo foil, (b) Mo/Al2O3, (c) NiMo(1:1)/Al2O3, and (d) NiMo(1:2)/Al2O3 in 1 mbar H2 at 200 °C, 300 °C, 400 °C, 500 °C, and 600 °C. The spectra of the Mo foil, NiMo(1:1)/Al2O3, and NiMo(1:2)/Al2O3 were measured with a photon energy of 500 eV and the spectra of the Mo/Al2O3 were measured with 550 eV.
Catalysts 12 00755 g003
Figure 4. Peak area from XPS fits in Figure 2 and Figure 3 as a function of temperature. In (a) the area of the NiO and (b) the sum of the Mo6+ and Mo5+ peak area normalized by the total peak area of the Ni 2p5/2 and Mo 3d, respectively.
Catalysts 12 00755 g004
Figure 5. The normalized XANES spectra corrected for self-absorption, measured at room temperature and 600 °C, are shown together with XANES reference spectra in (a,b) for the Ni K-edge and the Mo K-edge, respectively. XANES in situ data showing the chemical transformation during the reduction of NiMo(1:2)/Al2O3 in the (a) Ni K-edge and (b) Mo K-edge. The absorption of specific energies marked with an arrow in the XANES spectra, as a function of temperature, is plotted in the inserted plots. In (c), the prepeak at 8328.5 eV is marked with o and at 8343.5 eV the white line marked with + is shown, and in (d) the absorption at 20,003 eV is shown.
Catalysts 12 00755 g005
Table 1. BET area of the Al2O3-supported catalysts.
CatalystBET Area in m2/g
Mo/Al2O3107
NiMo(1:2)/Al2O3109
NiMo(1:1)/Al2O3109
Ni/Al2O3114
Al2O3121
Table 2. The average catalyst composition with standard deviation measured at three to four different locations on each catalyst using STEM/EDX.
CatalystNi [at. %]Mo [at. %]Ni: Mo
Mo/Al2O3-2.95 ± 0.09-
NiMo(1:2)/Al2O30.98 ± 0.172.03 ± 0.390.48 ± 0.17
NiMo(1:1)/Al2O31.37 ± 0.671.42 ± 0.330.96 ± 0.68
Ni/Al2O32.95 ± 1.47 --
Table 3. Binding energies in eV for the Ni 2p3/2 of alumina-supported and -unsupported pure Ni catalysts from the literature.
CatalystPeak 1Peak 2Peak 3Peak 4Peak 5Peak 6Ref.
NiO853.7855.4860.9864.0866.3 [20]
NiOH854.9855.7857.7860.5861.5866.5[20]
Ni852.6856.3858.7 [20]
NiO/Al2O3855.5–855.0~862.2 [21]
Ni/Al2O3853.0–852.856.6–856.0 [21]
NiMoO4/Al2O3858.3864.3 [22]
856.2862.0 [23]
Table 4. Binding energies in eV for the Mo 3d from the literature.
Catalyst3d5/23d3/2Ref.
MoO3 (Mo6+)232.5235.8[24,25]
Mo5O10 (Mo5+)231.2234.4[24,25]
MoO2 (Mo4+)229.3230.6[24,25]
Mo2C (Mo2+)228.9231.9[25]
Mo (Mo0)228.3231.5[26]
Table 5. The at. % of the Ni and Mo of the four Al2O3-supported catalysts from the synthesis solutions.
CatalystNi [at. %] Mo [at. %] Ni [at. %]:Mo [at. %]
Mo/Al2O3-3.3-
NiMo(1:2)/Al2O31.31.80.7
NiMo(1:1)/Al2O32.21.12.2
Ni/Al2O33.1--
Publisher’s Note: MDPI stays neutral with regard to jurisdictional claims in published maps and institutional affiliations.

