Review

Single-Particle Measurements of Nanocatalysis with Dark-Field Microscopy

1
State Key Laboratory of Chemo/Biosensing and Chemometrics, Hunan University, Changsha 410082, China
2
College of Chemistry and Chemical Engineering, Hunan University, Changsha 410082, China
3
Hunan Provincial Key Laboratory of Biomacromolecular Chemical Biology, Hunan University, Changsha 410082, China
4
Zhejiang Provincial Key Laboratory of Biometrology and Inspection & Quarantine, College of Life Sciences, China Jiliang University, Hangzhou 310018, China
*
Authors to whom correspondence should be addressed.
Catalysts 2022, 12(7), 764; https://doi.org/10.3390/catal12070764
Submission received: 10 June 2022 / Revised: 3 July 2022 / Accepted: 8 July 2022 / Published: 10 July 2022

Abstract

:
Due to the complexity of heterogeneous reactions and heterogeneities of individual catalyst particles in size, morphology, and the surrounding medium, it is very important to characterize the structure of nanocatalysts and measure the reaction process of nanocatalysis at the single-particle level. Traditional ensemble measurements, however, only provide averaged results of billions of nanoparticles (NPs), which do not help reveal structure–activity relationships and may overlook a few NPs with high activity. The advent of dark-field microscopy (DFM) combined with plasmonic resonance Rayleigh scattering (PRRS) spectroscopy provides a powerful means for directly recording the localized surface plasmon resonance (LSPR) spectrum of single plasmonic nanoparticles (PNPs), which also enables quantitative measurements. In recent years, DFM has developed rapidly for a series of single-particle catalytic reactions such as redox reactions, electrocatalytic reactions, and DNAzyme catalysis, with the ability to monitor the catalytic reaction process in real time and reveal the catalytic mechanism. This review provides a comprehensive overview of the fundamental principles and practical applications of DFM in measuring various kinds of catalysis (including chemocatalysis, electrocatalysis, photocatalysis, and biocatalysis) at the single-particle level. Perspectives on the remaining challenges and future trends in this field are also proposed.

Graphical Abstract

1. Introduction

Heterogeneous catalysts play a vital role in the development of the modern chemical industry and are essential for catalyzing many chemical reactions [1]. Traditional ensemble measurements usually measure the average results of a large number of molecules or nanoparticles (NPs) while lacking information on the small number of highly active NPs. Additionally, the reaction rate is different for each catalyst particle and depends upon each particle’s morphology, composition, size, and surrounding environment. This heterogeneity hampers the generation of a deeper understanding of how these parameters affect catalytic activity since they, together with electronic and spillover interactions with the support, directly control the catalytic performance. Consequently, investigating nanocatalysts at the single-particle level and in real time is needed to elucidate the catalytic reaction mechanism and design highly effective catalysts [2].
Over the past decade, single-particle catalysis has emerged in the quest to develop experimental methods that overcome the problem of ensemble averaging and even achieve a single-molecule resolution. Traditional ensemble measurement methods are based on the calculated signals acquired from multiple NPs, while single-particle detection generates signals throughout single particles, each of which is considered as an independent signal output [3]. In the field of single-particle catalysis, novel analytical methods have been developed to study local catalytic activities and structure relationships at a single-particle level with high spectral and spatial resolution. Many techniques, such as atomic force microscope (AFM), scanning electron microscope (SEM), transmission electron microscopy (TEM) can characterize the structure of single nanoparticles [4]. Moreover, super-resolution fluorescence microscopy [5], tip-enhanced Raman spectroscopy (TERS) [6,7], and in situ X-ray absorption spectromicroscopy [8], etc., can be used to study the catalytic behaviors of heterogeneous nanocatalysts at the single-particle level. There is no doubt that many efforts have been made to analyze single-particle or single-molecule catalysis for understanding catalytic reaction mechanisms. However, due to the quenching of fluorescence, broad background signal in TERS spectra, and the X-ray damage to the sample, it remains a challenging task to achieve in situ measurement of catalytic reaction at the single-particle level in the field of heterogeneous catalysis.
In the context of single-particle catalysis, single-particle plasmonic sensing based on dark-field microscopy (DFM) and plasmonic resonance Rayleigh scattering (PRRS) spectroscopy [9] have attracted much more attention. It provides the possibility to study individual plasmonic nanoparticles (PNPs) in the 10–100 nm size regime. The basic principle of nanoplasmonic sensing relies on the localized surface plasmon resonance (LSPR) effect. When light from the UV–Vis-NIR spectral range interacts with PNPs, especially Au nanoparticles (Au NPs) and Ag nanoparticles (Ag NPs) of a size comparable to or smaller than the wavelength of light, the LSPR of PNPs originates from the interaction between the collective coherent oscillation of conduction electrons and incident radiation [10]. Since the unique plasmonic properties of PNPs are highly sensitive to their size [11], shape [12], composition [13], and surrounding environment [14], entirely different absorption and scattering spectra of each PNP can be observed through DFM. According to the Mie theory, the extinction (sum of absorption and scattering) spectrum of metal NPs can be calculated according to the equation as follows [15]:
E ( λ ) = 24 π 2 N a 3 ε o u t 3 / 2 λ l n ( 10 ) [ ε i ( λ ) ( ε r ( λ ) + χ ε o u t ) 2 + ε i ( λ ) 2 ]
where a is the radius of the metallic NP, λ is the wavelength of light, εr and εi are the real and imaginary components of the metal-dielectric function respectively, εout is the dielectric constant of the external environment, and χ in front of εout depends on the NP, geometry called the polarization factor that corresponds to the aspect ratio of the NP, which equals 2 for a sphere. The values of χ can be up to 20 when the aspect ratio is high [16]. Of note, as shown in Equation (1), the extinction spectrum can be fine-tuned by changing the NP’s size, shape, composition as well as the local dielectric environment. Therefore, the specific scattering spectrum of individual NPs can be monitored by dark-field scattering microscopy with the advantages of high sensitivity, nonblinking, optical stability, and ease of preparation compared with previously reported methods [17].
Dark-field imaging techniques based on the LSPR of PNPs have provided new insights for real-time monitoring of dynamic catalytic reaction processes at the single-particle level. It was not until 2000 that DFM coupled with a spectrometer to obtain the scattering spectrum of single 80 nm Ag NPs that this technique is widely used for imaging single NPs [18]. Oblique illumination keeps the incident light from entering the objective and only part of the photons are collected by the objective to generate bright dots in the DFM images, causing a dark background and high contrast. As the scattering spectrum is very sensitive to the morphology and electron density of the NP itself, as well as the refractive index of the surface adsorbates and surrounding medium [19], DFM can be used to reveal the precise structure–activity relationship for individual NPs in real time. This review first provides a comprehensive overview of the working principle of DFM, the description of the data analysis methods, as well as DFM-coupled technology combinations. Furthermore, we focus on the single-particle measurements of nanocatalysis in various catalytic fields including chemocatalysis, electrocatalysis, photocatalysis, as well as biocatalysis. It is worth noting that this review does not attempt to cover all the achievements that have been made in single-particle catalysis via DFM, so only those milestones and recent results are presented. Future challenges and perspectives are also discussed at the end of this review.

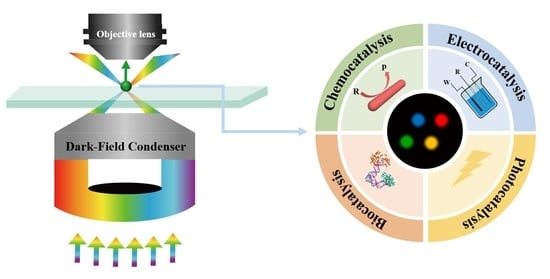
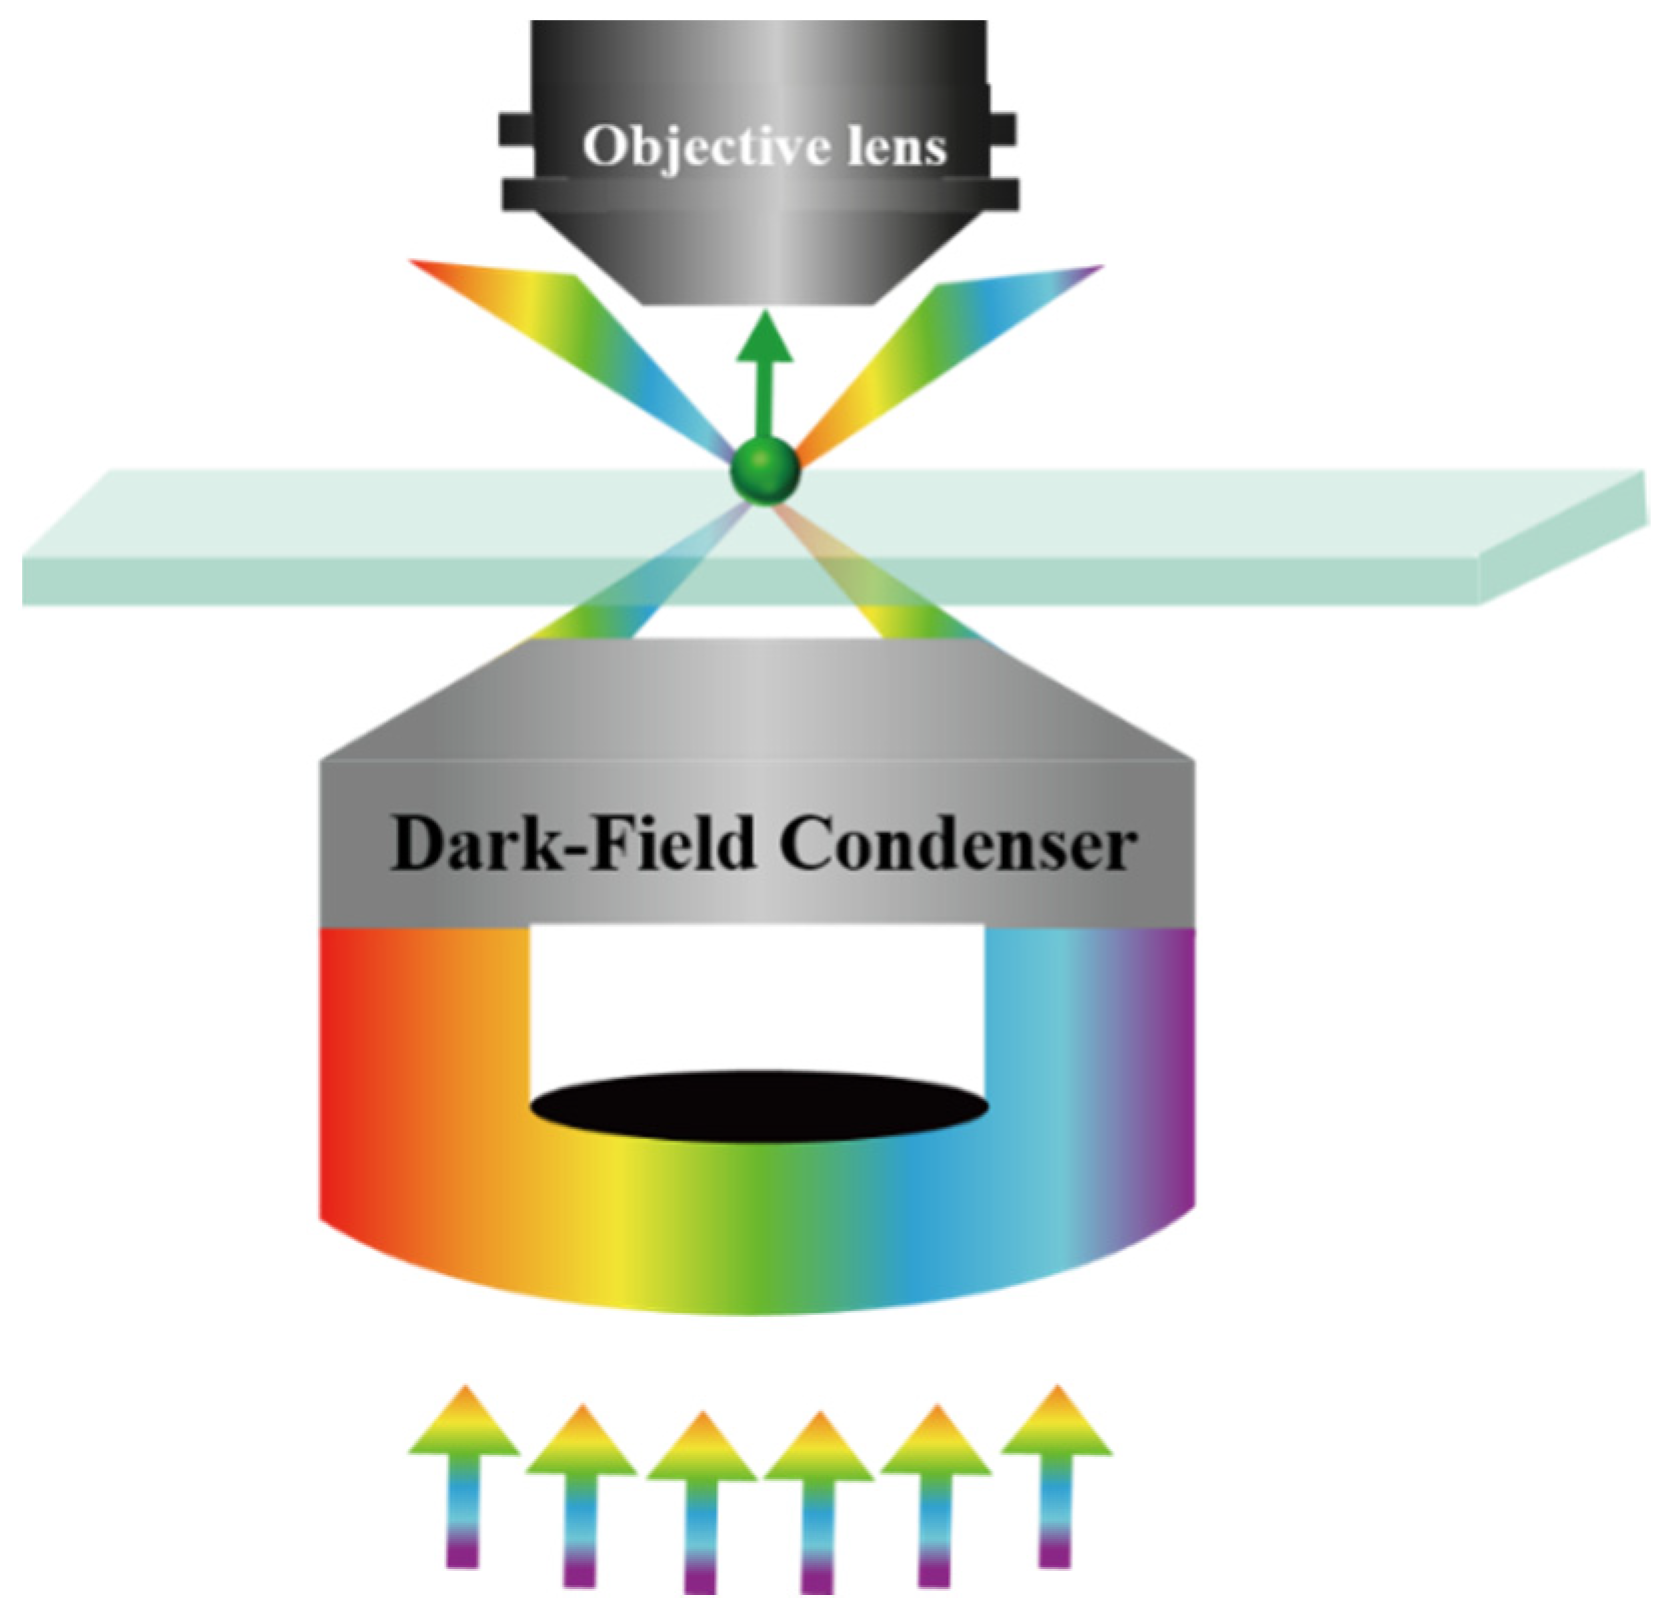
2. Dark-Field Microscopy (DFM)

DFM is a microscopy technique used for both light and electron microscopy in which only the specimen is illuminated by the light or electron beam, while the rest of the specimen field is dark, causing a dark background and high contrast. Since the invention of DFM in 1830, DFM imaging has offered the advantages of high sensitivity, high spatial and temporal resolution, accurate single-particle analysis, and low background compared to bright-field microscopy. Most of the important developments and widespread applications of modern DFM occurred after 2000, marked by the availability of high-quality color photographs and corresponding scattering spectra at the single-particle level [18]. Coupled with a spectrometer to measure the scattering spectra of a single NP, dark-field spectroscopy has become a very important plasmon spectroscopy technique for single-particle measurements. Conventional DFM is suitable for imaging PNPs larger than 30 nm in general experiments, while innovative optical structures are used to achieve direct imaging of Au NPs as small as 10 nm that are bound to a functionalized surface [20]. In recent years, much research has been conducted on DFM techniques to improve the collection performance of scattered spectra.

2.1. Working Principle

The low background signal is an inherent advantage of DFM imaging, which is due to the unique operating principle of the DFM. In the obliquely illuminated focal plane, scattered light from the subject is transferred to the objective lens or charge-coupled device (CCD) camera, while the unscattered incident light is usually excluded from the detection of the probe scattering signal [21].
As shown in Figure 1, when the sample is obliquely illuminated by the white light source, it can be used to excite plasmonic nanoprobes with different wavelengths. The central part of the DFM is the condenser equipped with the dark-field ring. As a critical component of DFM, the condenser ensures that the excitation light is incident at high angles so that only light scattered by the test sample is collected by the microscope objective. In the concentrator, a light baffle is used to cut off the central part of the vertically incident light, in which case no light enters the objective. The incident light from the edge portion is transmitted through the optics in the concentrator into an illumination cone, thereby only illuminating the focal plane of the sample. Subsequently, the incident light follows the original path away from the signal acquisition area. After the above steps, only the scattered light from the probe is detected, producing a background-free imaging effect. One of the most important features of DFM is that the numerical aperture of the objective lens is smaller than the dark-field concentrator, thus, only the scattered light from the sample will be collected by the objective and detected by a CCD camera [22]. In addition, there are two forms of DFM shown in Figure 2, i.e., upright and inverted microscopes [23], which depend on the relative position of the objective and the light source. Due to the above simple working principle, low-cost DFM imaging techniques have been widely used for single-particle measurements.

2.2. Data Analysis

The signal monitoring via DFM is mainly based on LSPR wavelength shifting and scattering intensity changes [24]. This requires distinguishable signal changes, and the spectral analysis or color-coding is conducted for data processing with additional spectrometers and image processing techniques. DFM scattering measurement of PNPs is realized by converting the scattering spots of NPs in the DFM images to digital color information, avoiding the time-consuming process of scanning the spectrum of NPs. Although it is simpler and faster to obtain the color information of individual PNPs than to obtain their scattering spectra, researchers still hope to further develop color-coded methods for high-throughput PNP scattering measurements.
At present, the most widely used color model is based on RGB (red, green, blue) by transferring the scattered light color to digital RGB information. There are 24 bits per pixel, including three 8-bit integers (0–255), which indicates the intensity of the RGB colors in color images. Each color in turn can be decomposed into an RGB value containing chromaticity and intensity information. Consequently, the RGB information of the color images can be transferred into the spectral wavelength of the scattering light. Long and co-workers developed a colorful way to easily estimate the diameter of single Au NPs based on the RGB value of each pixel in the DFM images [25]. A MATLAB program was used to convert RGB chromaticity information from dark-field images directly into the diameters of Au NPs within 1 s, which relied on the relationship between the particle size and the peak wavelength of the scattering light. The calculated diameters were in good agreement with those measured using SEM, while more convenient and less costly, and the optimized calculations were able to measure thousands of NPs using a laptop computer within several minutes.
Although RGB-based methods have been widely used to analyze DFM images, this method still has some limitations. For example, the RGB color model is not close to the human visual system for color observations and requires software to calculate R, G, and B percentages. By using computer programming to code the color of single PNPs, as shown in Figure 3A, Huang and co-workers developed a novel color-coding method, called the HSI analytical method, that greatly eliminates manual error and achieves the automatic analysis of data [26]. The essentials of the HSI color model dictate that every color can be expressed with three components: hue (H), saturation (S), and intensity (I). Each light spot in the DFM image includes many pixels, and each pixel has different hue values in the HSI system. The algorithm of this program includes image segmentation, image tags, and hue calculation of each particle in a pixel. They used computer programming to automatically convert the obtained color points in the scattered light DFM images into digital hue values in the HSI color model. In such a case, the HSI values of the scattered light color of single PNPs could be attained by using common software (e.g., Image-Pro Plus, IPP) or the following equations:
H = a r c t a n ( 3 ( G B ) ( R G ) + ( R B ) )
S = 1 3 R + G + B [ min ( R , G , B ) ]
I   = 1 3 ( R + G + B )
To further verify the possibility of using the HSI model to analyze the scattering light color of single Au NPs, they investigated the scattering light color change of a single Au NP in different refractive index solvents and analyzed the color changes of the scattered light during the attachment of thiolated DNA to Au NPs. Compared with RGB analysis, HSI analysis enables the corresponding hue value of each spot in DFM images to be automatically calculated and obtained by computer programming, which is easier to achieve and closer to the human visual system. In recent years, HSI analysis has served as a better alternative for RGB analysis to analyze the scattered light of PNPs. Chen and co-workers also analyzed the scattering light color of single plasmonic assemblies using the HSI model to reveal the difference in the colorimetric response of different kinds of assemblies [27].
Figure 3. (A) Schematic illustration of the HSI color coding analysis for the attachment of thiolated DNA to Au NPs based on the HSI color-coding of single PNPs, the procedure of image processing through computer programming, and the HSI color model. Reprinted with permission from [26]. Copyright 2016 Royal Society of Chemistry. (B) Schematic illustration of the scattering light analysis process of plasmonic nanoparticles in living cells using deep learning. Reprinted with permission from [28]. Copyright 2021 American Chemical Society.
Catalysts 12 00764 g003
The RGB- and HSI-based methods mentioned above enable the DFM imaging scattering measurements of PNPs by converting the scattering spots of NPs to digital color information, which shows that the color-coded method based on image processing technique is a promising approach for high-throughput LSPR scatterometry of PNPs. However, the visibility and quality of DFM imaging in complex biological samples are limited by background scattering interference, such as in the living cells. To improve the resolution and imaging quality of plasmonic single-particle DFM imaging, researchers have made adjustments and improvements based on DFM imaging modes and plasmonic probe materials, which can eliminate the background interference in DFM. As an important branch of artificial intelligence (AI) field, deep learning has powerful capacity in feature extraction and recognition. It can provide a new approach to recognize and analyze the scattering light of plasmonic nanoparticles obtained from complex biological systems. Huang and co-workers firstly proposed the U-Net neural network deep learning method to analyze the scattering light of PNPs under DFM imaging [28]. Based on training U-Net deep neural network and constructing a DFM image semantic analysis model, the recorded DFM scattered light images were converted into binary images to statistically learn to distinguish between the scattering light of PNPs and background scattering signals in living cells (Figure 3B). The changes of Cytochrome C in live MCF-7 cells under UV light-induced apoptosis were monitored by identifying and monitoring the scattering properties of the Au nanorods (Au NRs) nanoprobes. Compared with traditional methods, this method can achieve higher accuracy, stronger generalizationability, and robustness. In conclusion, the introduction of deep learning techniques for feature extraction and disturbance elimination of scattering light in DFM imaging is of great significance for scattering measurement studies and imaging analysis in chemistry.

2.3. Technology Combination

Combining DFM with other techniques can overcome the inherent shortcomings of a single technique to achieve a high spatial and temporal resolution of imaging, high sensitivity, and excellent penetration depth. So far, the combinations of DFM with fluorescence imaging, surface-enhanced Raman scattering (SERS), AI (mainly based on deep learning), and other technologies have broadened the application ranges of the DFM technique. Although DFM and fluorescence imaging work differently to cut off incident light interference, their combination has the potential to achieve sensitive and high-resolution imaging. Li and co-workers fabricated traceable spherical nucleic acids (SNAs) by modifying 50-nm spherical Au NPs with fluorophore-labeled DNA [29]. The in-situ correlation imaging using DFM and fluorescence microscopy revealed the intracellular distribution of SNAs, whereas DFM combined with SEM allowed semi-quantification of SNA clustering states in solution. In addition, the combination of DFM and SERS can play to the best of both. DFM can play a role in mechanism exploration as well as target detection, while SERS can effectively lead to a low limit of detection. Pradeep and co-workers reported simultaneous observation of plasmonic scattering and Raman spectroscopy on single Ag NPs with citrate capping [30]. Time-lapse observations have shown that the changes in the plasmonic properties of laser-induced Ag NPs led to SERS, opening the possibility of real-time observation of multispectral observations of intermolecular and interparticle reactions at the single-particle level. DFM combined with AI algorithm has been used to process scattered images to eliminate background noise and obtain high-resolution images. Some researchers proposed that AI could be applied to biomedical analysis by using an RGB-based recognition model to convert the color of scattered light into digital RGB information [31]. In a recent study, as shown in Figure 4, Zhou and co-workers proposed an AI-assisted DFM enumeration strategy for the accurate assay of Enterovirus A71(EV71) [32]. They selected two common plasmon resonance nanoparticles probe of an appropriate size that have a strong LSPR effect, but are not excessively large to affect the binding to the target virus EV71 particles. The first probe immobilized on the chip aims to quickly capture the target viruses in the sample. Therefore, a 40 nm commercially available silver nanoparticle that appears bright blue under DFM was used to form dichromatic sandwich structures with the Au NR that is displayed in red under DFM. Subsequently, the DFM images of the capture chip were subjected to a two-step screening, including image processing and the deep learning screening to eliminate false positive results and background noise. Cluster analysis was used for the first screening to eliminate the most irrational images, and then the images were manually labeled as ‘bind’ and ‘no bind’ based on professional judgement (for instance, gap length, size, and regularity) as a training data set for deep learning models. Consequently, the corresponding hue value of each spot in the DFM image was calculated and acquired automatically, which greatly improved the accuracy of the program and eliminated manual errors.

3. Single-Particle Measurements of Catalytic Reactions
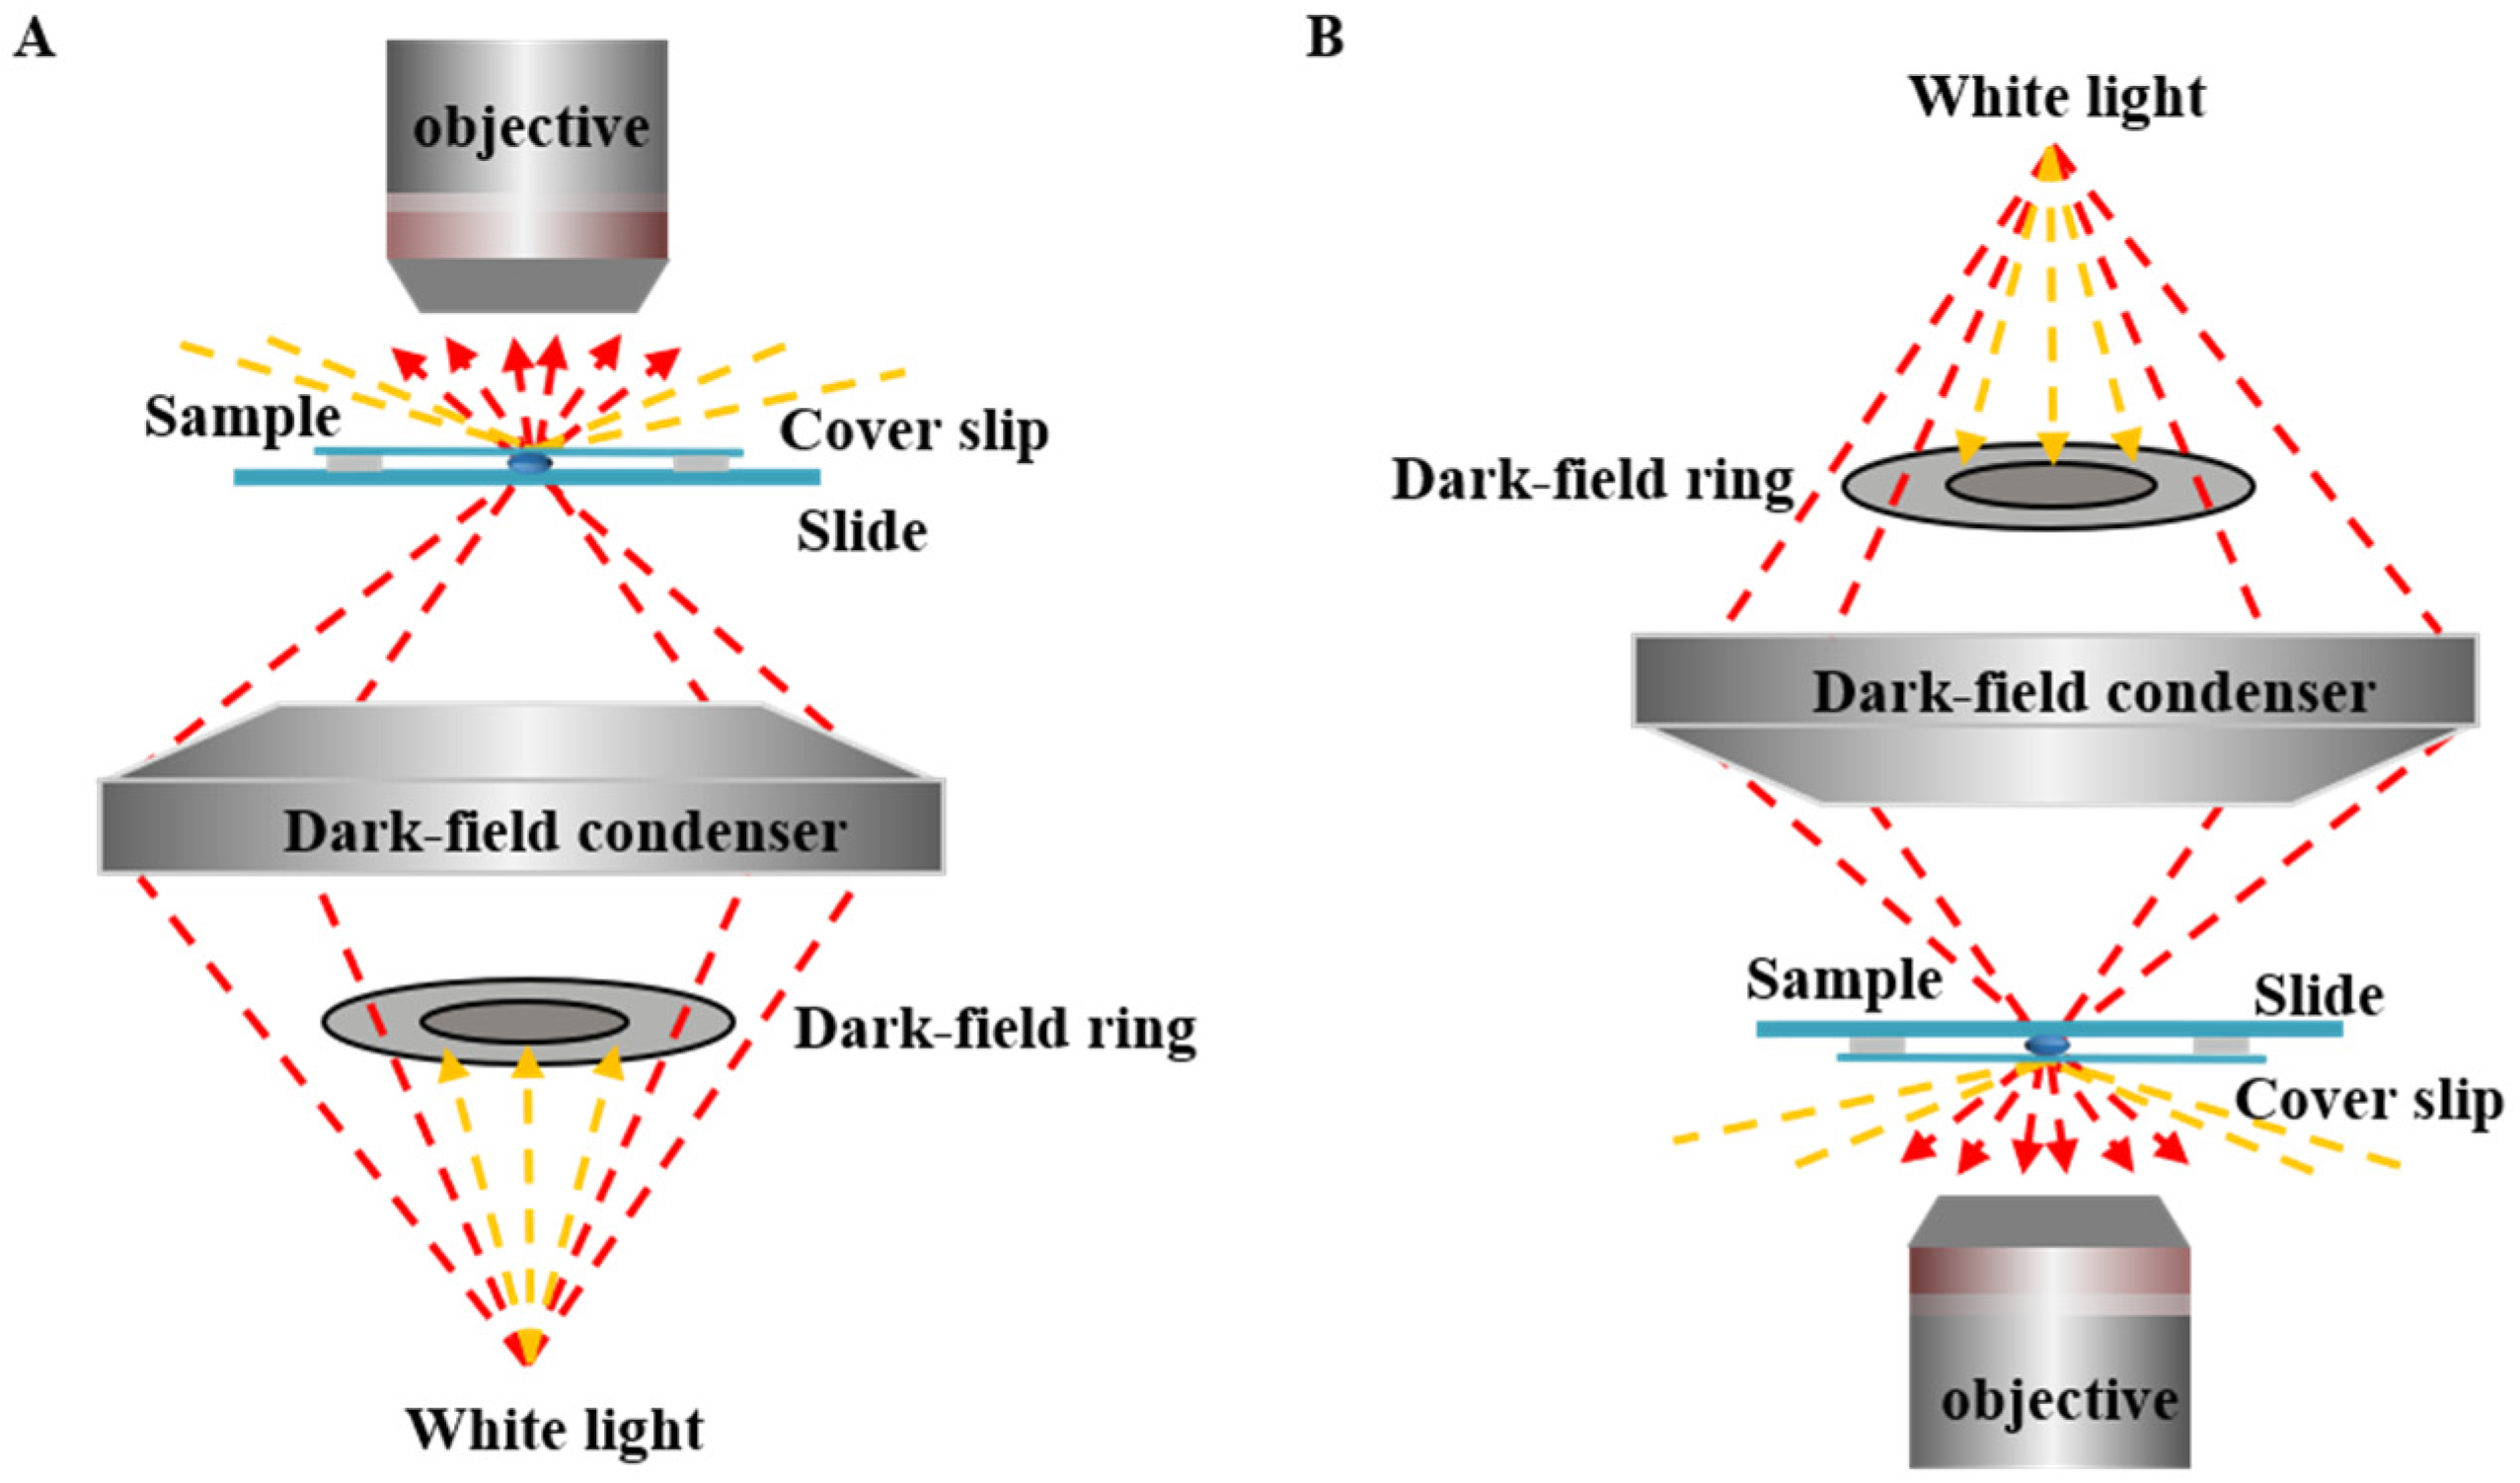
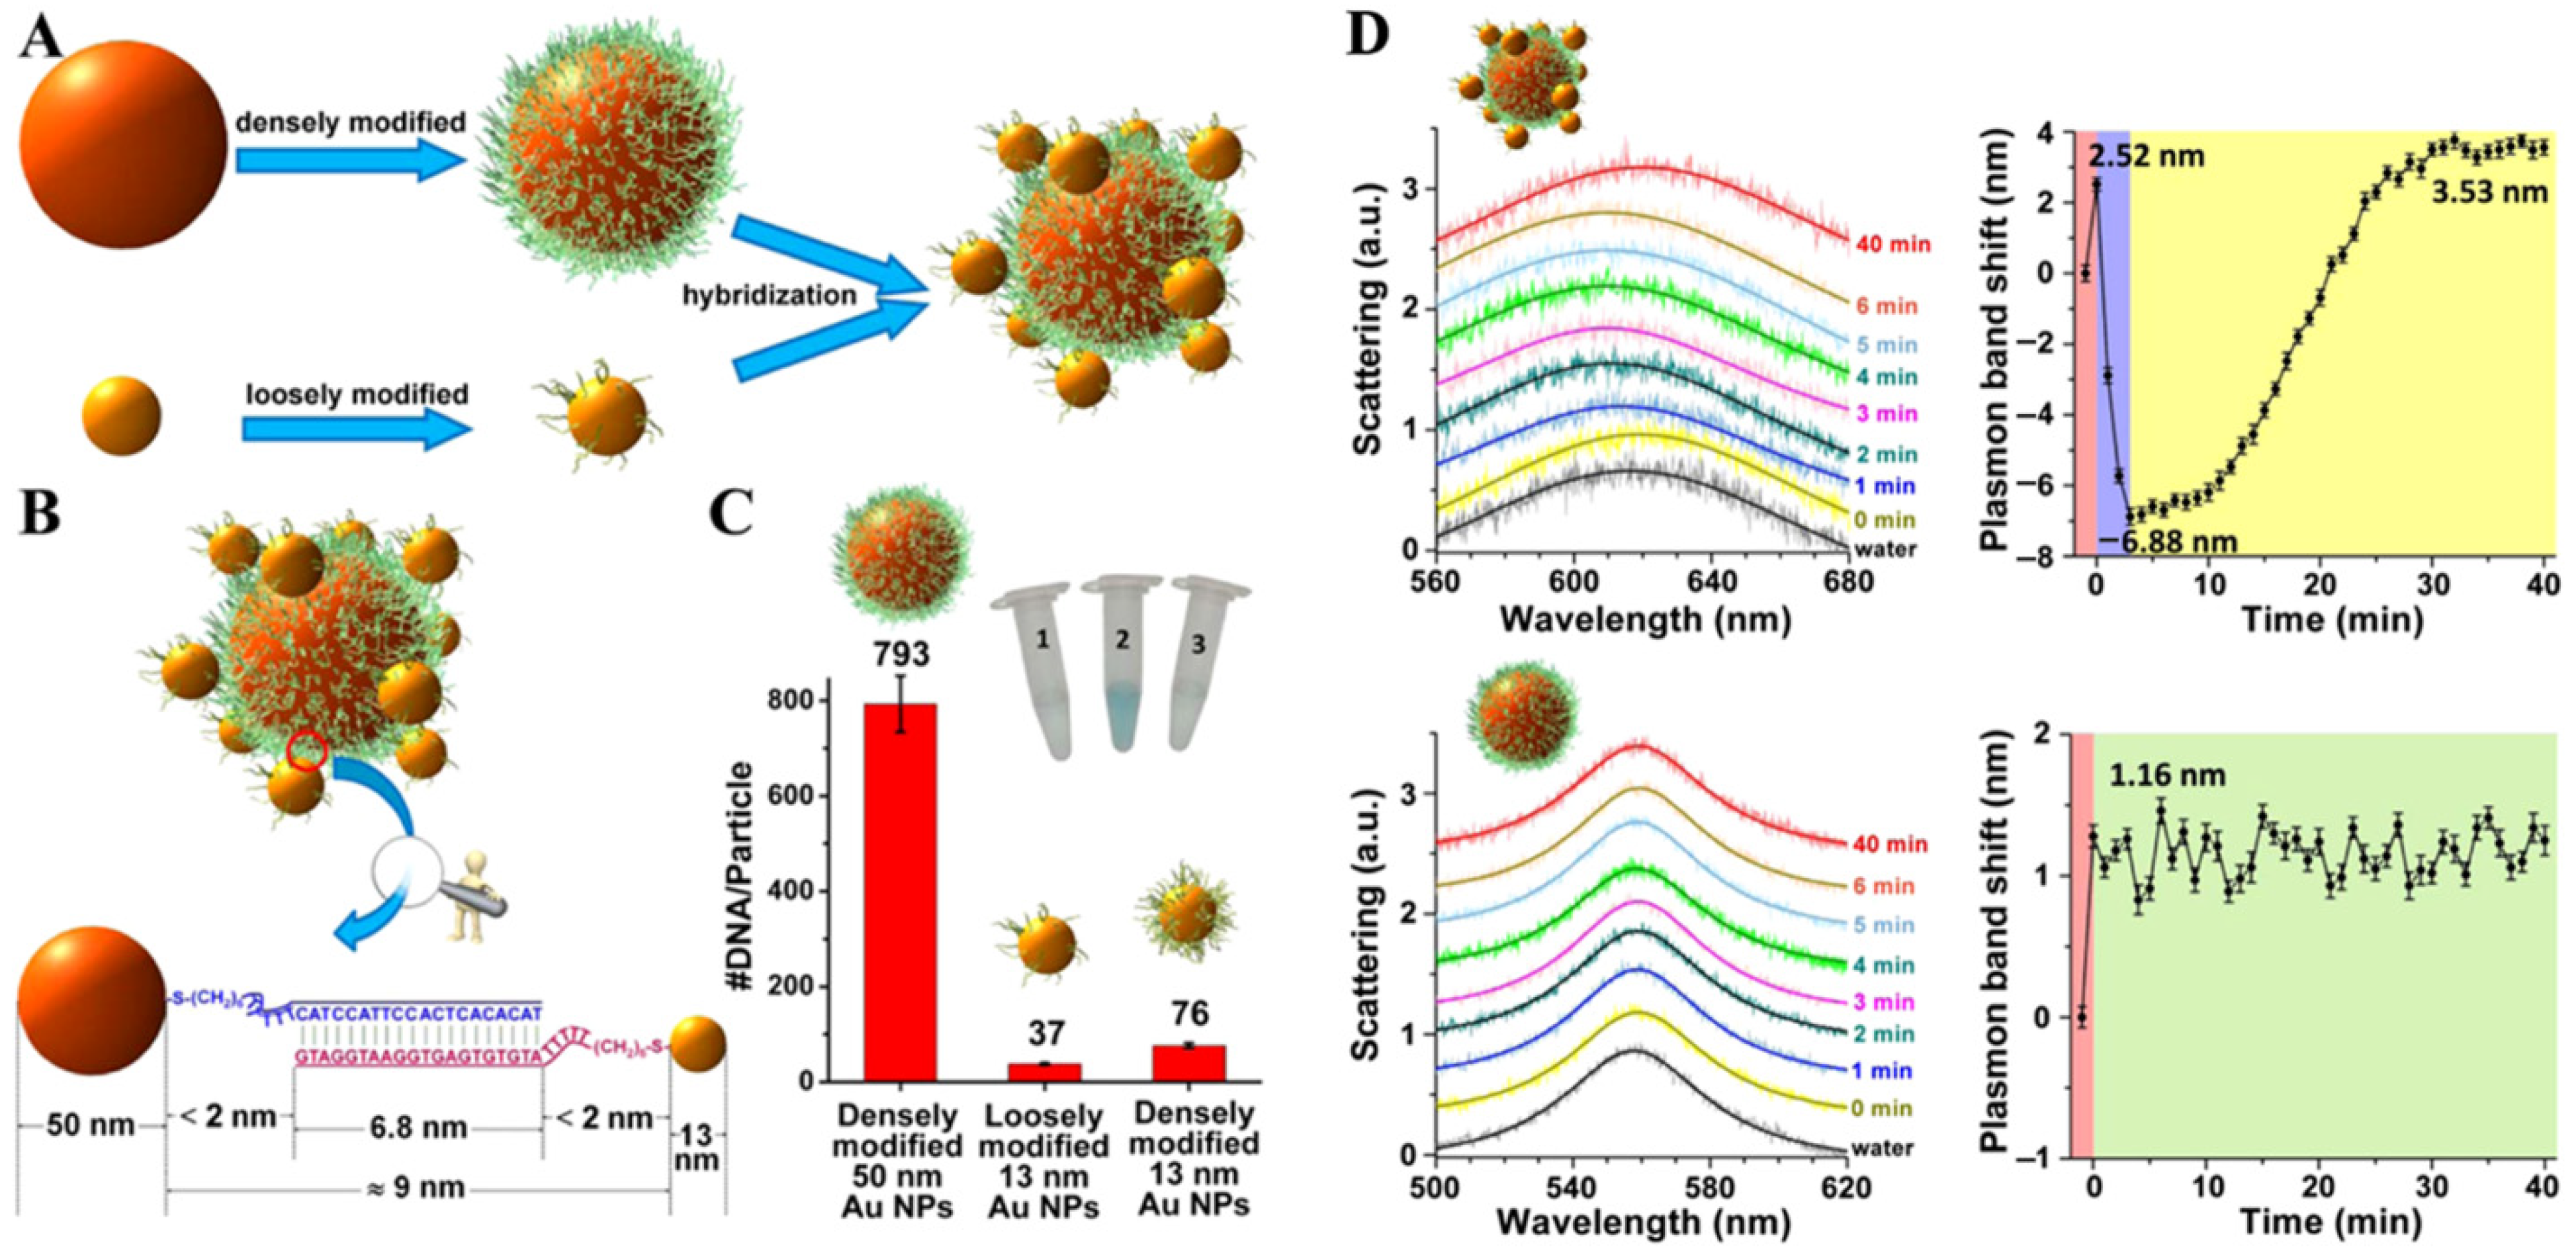
Due to the diversity in composition, size, and morphology of NPs, it is necessary to introduce heterogeneity in catalytic activity within the NP populations [33]. Therefore, it is important to monitor heterogeneous catalytic processes and investigate mechanisms on the surface of individual NPs to avoid ensemble averaging effects in bulk systems. Relying on the sensitive detection of optical signals, approaches in the study of nanocatalysis with single-molecule and single-particle resolution include single-molecule fluorescence microscopy [34], and SERS spectroscopy [7], X-ray microscopy [8], etc. Although these methods allow for the real-time observation of catalytic processes at the single-particle level, there are still many limitations to studying catalytic reactions. For example, single-molecule fluorescence microscopy requires that the fluorescent product or reactant cannot be enhanced or quenched by the catalyst and the fluorescent product must dissociate from the catalyst surface after a short residence time [17].
Dark-field spectroscopy makes it possible to study catalysis on single NPs with higher detection sensitivity, selectivity, and spatial resolution. On the one hand, the changes in physical and chemical properties of plasmonic nanocatalysts result in the LSPR wavelength shifts and scattering intensity changes, which can be directly monitored by DFM. On the other hand, several indirect LSPR sensing strategies have been developed for those who do not support a measurable LSPR signal. As pioneered by Larsson and co-workers, arrays of nanofabricated Au nanodisks were used as an indirect platform, causing shifts in plasmon resonances to measure surface coverages to continuously monitor three well-known catalytic reactions: oxidation of ½rogen (H2 + 1/2O2 → H2O), oxidation of carbon ½oxide (CO + 1/2O2 → CO2), and NOx storage and reduction over Pt/BaO catalysts [35]. The indirect plasmonic antenna mediated strategy also enables LSPR to monitor other catalytic reactions using non-plasmonic NPs. Since palladium (Pd) can strongly adsorb H2 and react with it to form PdH, and Au NPs show excellent plasmonic properties in the visible region, Alivisatos and co-workers placed Pd nanoparticles in the adjacent position of a gold nanostructure to form an Au nanoantenna. As a result, the process of H2 adsorption by Pd nanoparticles could be detected by the scattering spectrum of gold nanostructures, leading to a maximum scattering wavelength shift of 10 nm due to the changes in the dielectric environment of single Au nanostructures [36]. Using the same principle, they further extended this indirect strategy to study catalysis on similar hybrid nanostructures (Au@Pd core-shell) [37].
Single-particle measurements via DFM have been widely applied in various catalytic reactions ranging from electrocatalysis and photocatalysis to chemical sensing and biological sensing. As visualizing a catalytic reaction process is critical for understanding the reaction mechanism and designing high-performance catalysts, dark-field imaging techniques combining with scattering spectroscopy provide new insights for real-time monitoring of dynamic reaction processes at the single-particle level. The wavelength shift and intensity change of the scattering spectrum among single NPs can be modulated easily by changing their size, shape [12], composition [13], dielectric medium [14], and plasmon coupling status [38]. Consequently, DFM can be used to monitor the catalytic process by direct or indirect strategy and reveal the precise structure–activity relationship for NPs.

3.1. Chemocatalysis

Plasmonic metallic NPs are important heterogeneous catalysts for many chemical transformations due to their size-induced high surface-to-volume ratio and high chemical potential [39]. For DFM-based single-particle detection assay, many powerful scattering-based nanoprobes have been developed, such as Au NPs, Au NRs, Ag NPs, silver nanocubes, and so on [40,41,42,43], which are widely used as catalysts in some heterogeneous redox reactions. The changes in physical and chemical properties of plasmonic nanocatalysts will significantly affect the wavelength and intensity of scattering spectra during the catalytic reactions, so the scattering spectrum of individual NPs can be monitored by DFM [44]. Since the signal is not calculated by numerous molecules, the single-particle-based DFM strategy can greatly enhance the sensitivity and avoid the ensemble averaging effect from the sample. This advantage facilitates the real-time monitoring of catalytic reactions by either direct or indirect strategy.
The idea of using DFM to monitor redox catalytic reactions on individual NPs was implemented for the first time about a decade ago. Mulvaney and co-workers firstly achieved direct measurement of the rates of redox catalysis on single Au nanocrystals [45]. Combining DFM and PRRS, they directly observed the kinetics of atomic deposition onto a single Au nanocrystal and electron transfer during the oxidation of ascorbic acid on the Au nanocrystal surface. It is worth noting that the electron transfer rates of 4600 electrons per second could be directly measured, but only about 65 molecules of O2 per second were monitored, which was highly limited by the signal-to-noise collection efficiency of the CCD spectrometer.
Since then, DFM has been widely used to study single-particle catalysis without interference from ensemble averaging effects by observing the scattering spectra of individual NPs [46]. Using inverted dark-field spectroscopy, Long and co-workers monitored the catalytic activity of nanocomposites toward 4-nitrophenol reduction at the single-particle level in real-time, thus providing information about the catalytic process and elucidating its mechanism [47]. Based on the plasmonic signals obtained from individual nanocomposites, the electron charging and discharging rates of these nanocomposites were calculated to quantify the number of electrons transferred during the heterogeneous catalysis at the single-particle level.
Dark-field spectroscopy can be used not only for the direct monitoring reaction process in real time, but also for the indirect monitoring strategy. Due to the limitation of CCD sensitivity, conventional DFM can only capture the scattered light from large Au NPs with diameters over 50 nm, which are usually catalytically inactive. As shown in Figure 5, Li and co-workers designed a DNA-directed programmable assembly strategy to fabricate a halo-like Au nanostructure (nanohalo) for indirect monitoring of the catalytic reaction under DFM [48]. After modification with thiolated oligonucleotides having complementary sequences, they further studied the redox reaction of glucose and dissolved oxygen catalyzed by a single Au nanohalo. Assembling catalytically inert plasmonic 50 nm Au NPs and catalytically active 13 nm Au NPs into a multicomponent nanoarchitecture, the catalytic reaction occurring on the 13 nm nanoparticle changed its permittivity, which led to a significant change in the plasmonic resonance of nanohalo. The above findings made it possible to indirectly monitor the catalytic reactions occurring on the 13 nm Au NPs. Not only did they establish a single-particle analysis method for glucose catalysis using Au nanohalo, but also extended the concept of plasmonic nanoantennas to provide a general method for studying heterogeneous catalysis on nanocatalysts.
As powerful scattering-based nanoprobes for DFM-based assay, Au NPs with size dimensions of around 50 nm are considered a suitable size for dark-field imaging that exhibit uniform green color and excellent scattering signal from individual NPs. Xiao and co-workers designed a color-coded single-particle detection strategy for pyrophosphate (PPi) detection and monitored the reduced nicotinamide adenine dinucleotide (NADH)-dependent catalytic deposition of copper on Au NPs surface in situ with dark-field optical microscopy, which was based on the LSPR shift of individual Au NPs induced by the refractive index changes [49]. Given the fact that PPi had a strong affinity toward Cu2+, the Cu2+ could not be reduced to the Au NP surface and the number of green particles in the solution varied with the PPi concentration. Therefore, the concentration of PPi could be accurately determined by quantitatively counting the fraction of yellow particles with color-coded dark-field optical microscopy. It is worth pointing out that not only was the red-shift of the scattering spectrum from the Au NPs, but the scattering intensity from individual particles also gradually increased, which was in good agreement with the results from the bulk solution measurements. Similarly, Chen and co-workers developed a simple, ultrasensitive, and highly selective single particle-based dark-field method for colorimetric detection of pyrophosphate ions and pyrophosphatase [50].
The reaction process of organic chemistry can also be studied by dark-field spectroscopy. Click chemistry, as a powerful synthetic chemical method, has attracted great attention in diverse fields with simple reaction conditions and high selectivity. Copper-catalyzed azides and alkynes cycloaddition (CuAAC) reaction is one of the most reliable and widespread synthetic transformations in click chemistry with high reaction speed and few by-products. Lin and co-workers constructed an auto-identified sensor at the single-particle level for rapid determination of L-histidine based on the DFM, combining the advantages of the high selectivity of click chemistry and the accuracy of intelligent algorithms [9]. The color of scattering light spots for the aggregation of alkynyl and azide functionalized Au NPs induced by the CuAAC reaction was quite different from that of the monomers under DFM. In the presence of L-histidine, it could bind to Cu2+ and inhibit the production of Cu+, thus preventing the aggregation of Au NPs. Therefore, there was a distinct change of color with the addition of L-histidine and the colors of scattering light spots could be identified accurately and automatically with the Meanshift algorithm.
DFM has been successfully applied to study catalytic processes at the single-particle level under liquid-phase conditions, as introduced by Mulvaney and co-workers in their seminal paper [45]. Studying gas-generating catalysis at the single-particle level is also essential to searching for highly active nanocatalysts and elucidating the reaction mechanism for many energy-related research fields. Zhou and co-workers successfully used nanobubbles to study the gas generating catalysis of formic acid dehydrogenation on individual Pd-Ag nanoplates (Figure 6) [51]. When nanobubbles were produced on single Pd-Ag nanoplates, the scattering intensity increased and the scattering intensity versus time trajectories could be obtained for each nanoplate. In recent years, this research group further used DFM to study the evolution process of single nanobubbles generated from formic acid dehydrogenation on single Pd-Ag nanoplates [52]. They found that some of the nanobubbles in this system could exhibit three distinct states representing different sizes, which transformed among each other indirectly through some intermediate states. It is worth mentioning that monitoring nanobubbles via DFM can be applied to other types of gas generation catalysis, such as water decomposition, water electrolysis, and electro-oxidation in fuel cells.

3.2. Electrocatalysis

Nanocatalysts are structurally heterogeneous in terms of size, morphology, and chemical composition, leading to the dramatically different electrocatalytic activity of individual nanocatalysts [19]. Detection of electrocatalytic activity is one of the key points in the evaluation of catalysts and thus has significant potential to contribute to the development of efficient catalyst materials. Conventional electrochemical techniques are applied to characterize electrocatalytic activity, such as those using the total electrode activity, Tafel plot, cyclic voltammetry, and Faraday efficiency [53,54]. However, these conventional electrochemical measurements are not suitable for monitoring the catalyst state, performance, and distribution, whose results are usually comprehensive functions of many NPs [51]. To eliminate average effects and better understand the factors inducing catalysis containing the surface morphology, composition, and surroundings, it is necessary to develop devices and techniques capable of in situ monitoring electrocatalytic events that take place at single nanocatalysts [55].
Noble metallic NPs, especially plasmonic Au NPs, play an important role in electrocatalysis due to their interesting optical and catalytic properties. Upon LSPR excitation, a strong electromagnetic field and a high concentration of energetic charge carriers are generated at the nanostructured surface [56]. In this context, the surface plasmon resonance (SPR) imaging technique provides an efficient method to monitor the electrochemical reactions on single NPs by recording the electrochemical current on single Pt nanoparticles [57]. Moreover, DFM-integrated electrochemistry, which makes it possible to visualize the electrochemical processes related to charge transfer at the single-particle level and can also acquire quantitative information on NP structure-activity [58,59], has attracted more and more attention.
Since scattering spectra of NRs are more sensitive to the surface changes than nanospheres due to the larger aspect ratio, spectra peak wavelength shifts of single Au NRs can offer information such as electron transfer and substance exchange of the redox process related to the reaction mechanism. Long and co-workers investigated the electrocatalytic oxidation of hydrogen peroxide (H2O2) on the single Au NRs surface and explored the catalytic mechanism for the first time, using a novel developed spectroelectrochemistry technique that combines DFM and electrochemistry (Figure 7) [60]. It is worth noting that Au NR acted as a reagent in this catalysis reaction, rather than conducting wires or substrate as reported in previous literature examples of electrocatalytic processes. As different Au NRs exhibited various catalytic activities, the time-dependent dark-field scattering spectra of the single Au NRs revealed information about the surface of single Au NRs during the cyclic voltammogram scanning process. The electrocatalytic reaction mechanism on single Au NRs was also investigated by the plasmon resonance scattering shift of single Au NRs with the elimination of the bulk effect, showing that the gold atoms on the surface participated in the redox reaction and catalyzed the oxidation of H2O2 via the formation of gold hydroxide/oxide. This method offers a unique way of monitoring electrochemical processes at the single-particle level, and also improves the understanding of the electrochemistry mechanism including electron transfer, substance exchanging, and catalyst poisoning.
The electrocatalytic reaction process can also be directly monitored in real time by simply observing the scattering intensity change under DFM. Lin and co-workers made it possible to visualize the electrocatalytic reactions involving single nanocatalysts by forming hydrogen nanobubbles [61]. Once hydrogen ions were reduced to H2 on the surface of Au NPs@Pt at a specific potential, the formed H2 nanobubbles covered the surface of nanocatalysts and led to a significant increase in the scattering intensity of the NPs. Moreover, the spatial and temporal distribution information on the electrocatalytic activity could also be obtained from the scattering spot brightness that was observed by DFM. Consequently, this method gains the advantage of obtaining more information than conventional electrochemical methods and is vital for electrochemical catalytic mechanism research and catalyst selection.
The electrodeposition process at the single-particle level can be directly detected by DFM through a strong LSPR scattering signal. Zhou and co-workers proposed a highly sensitive and high throughput single-particle coulometry method for studying the electrochemical activity and oscillation of single PtTe nanocatalysts [62]. Based on microbattery reactions, LSPR, and commercial DFM, the formic acid electro-oxidation activity on single PtTe nanocatalysts was detected by monitoring the enhanced scattering intensity signal of deposited Ag NPs. Among these, DFM was used to verify the formation of Ag NPs on the surface of PtTe nanocatalysts. Revealing the distribution of electrocatalytic activity and charge transfer at the single-particle level, this study provides a common method to measure the catalytic activity of the single nanocatalysts for other electrochemical reactions, such as the electro-oxidation of methanol and ethanol. Similarly, Kanoufi and co-workers used DFM to in situ monitor the electrodeposition of single cobalt NPs down to a radius of 65 nm and obtained unique mechanistic insights about electrocatalysis with the analysis of the scattered light, which were not accessible from traditional single-particle electrochemistry [63].

3.3. Photocatalysis

Photocatalysis research has made great progress in the last two decades as UV–visible light photocatalysis can effectively convert solar energy into chemical energy. However, there are still major issues that need to be addressed before photocatalysis becomes a viable, efficient process for a wide range of applications, especially in industrial applications [64]. The key step in photocatalysis is the effective charge separation of electron–hole pairs. To better understand the process and propose appropriate mechanisms, real-time monitoring of the photocatalytic process at the single-particle level is needed. Since surface plasmon resonance is very sensitive to the shape, size, and constituent materials of the nanostructures as well as their surrounding medium, it provides a facile method to record the resonance energy, intensity, and linewidth of the surface plasmon resonance via DFM.
To improve the photoelectric conversion efficiency, it is important to track the path of electron transfer and measure the rates of redox catalysis. Mulvaney and co-workers demonstrated that the electron density of metallic NPs could influence the LSPR scattering band and achieve the quantification of electron exchange [65]. Based on this principle, Huang and co-workers monitored the photoinduced chemical transformation of p-aminothiophenol (p-ATP) to 4,4′-dimercaptoazobenzene (DMAB) on single Ag NPs and proposed the reaction mechanism [66]. DFM was used to effectively analyze the real-time changes of the scattering signals from single Ag NPs. Interestingly, it showed a bidirectional movement of the scattering light of Ag NPs due to the electron-transfer delay of p-ATP. It is worth mentioning that this strategy can also be utilized to study the photoreactions of other sulfhydryl-containing organic molecules containing electron transfer. Similarly, they successfully used DFM to digitize and monitor the energetic charge distributed in time during the plasmon resonance-driven photocatalytic reaction on the Au NPs surface at the single-particle level [67], as shown in Figure 8. In addition, a novel color-coding method was developed to accurately quantify the number of energetic charges in PNPs flowing into the adsorbed p-ATP molecules.
Plasmon-induced hot carriers are of particular importance to realize photocatalysis [68]. Most studies involving hot carriers focus on conventional plasmon materials like Au and Ag whose plasmon resonances are dominated by intraband transitions in the visible range [69]. However, the photocatalytic activity of noble metal NPs has not been acknowledged as significant due to the low productivity of hot carriers [70], the low energy of hot carriers [71], and the high charge-carrier recombination rate [72]. Additionally, plasmon resonances dominated by interband transitions can generate much more electron–hole pairs than intraband plasmon resonances, making the generated hot carriers possess enough energy and lifetime by crossing a band gap [73]. Noble metal NPs combined with semiconductors have been widely studied for improving charge separation of photogenerated electron–hole pairs to suppress the recombination of photogenerated electrons and holes, thus enhancing the overall photocatalysis of semiconductors [64].
Yang and co-workers realized the plasmonic monitoring of single-particle catalysis in doped semiconductor materials via DFM [73]. As a typical example of semiconductor plasmonic materials, heavily doped titanium oxide (TiO2−x) can achieve plasmon resonances dominated by interband transitions, while noble metals were only used to achieve the generation of hot carriers. As the surrounding refractive index significantly influenced the plasmon resonance wavelength, the scattering peak shift of TiO2−x NPs immersed in methyl orange (MO) solution could be recorded in situ. This characterization at the single-particle level by DFM provides a new method to detect the catalytic process and catalytic rate of single particles in a direct way. Through the photodegradation characterization via dark-field scattering spectrum, they demonstrated that the TiO2−x NP dimer possessed a higher photodegradation rate than individual particles with a size of 270 nm in the visible-light photodegradation process because of the “hot-spot” generated in the dimer structure.
Light-induced significant electron transfer can also be demonstrated by single-particle dark-field scattering spectroscopy. Tuan and co-workers fabricated Au@CdSe core-shell heterostructures by pre-growth of Ag2Se as an intermediate layer that favored the formation of a CdSe shell in a subsequent cation-exchange reaction [74]. The broader linewidths and lower intensity of the longitudinal surface plasmon resonance were measured by DFM, suggesting an efficient electron transfer from the Au rod to the CdSe shell in Au@CdSe NRs when exciting the SPR. Compared to the bare Au NRs, the redshift of the plasmon band in Au@CdSe NRs arose from the higher refractive index of the CdSe layer than air and the quartz substrate. Under UV irradiation, they further studied the dependence of the catalytic reactivity on shell thickness in photocatalysis via the reduction of methylene blue (MB) molecules, showing that a thinner shell thickness resulted in higher photocatalytic activity.

3.4. Biocatalysis

Noble metallic NPs have attracted significant attention in the field of biocatalysis and biosensing. Although Ag NPs scatter about 10 times more strongly than Au NPs at their maximum scattering wavelengths, Au NPs are more favorable for biosensing purposes due to their extraordinary surface stability, lower toxicity, and excellent biocompatibility. DFM has provided a powerful means to differentiate morphology and local environment changes of single NPs from large ensembles. Consequently, the ability of DFM to track individual NPs has been widely used to explore the interactions between biomolecules and NPs and measure reaction dynamics during the biocatalytic processes. The scattering spectra will have a dramatic shift when the size or morphology of nanomaterials changes, which is usually related to the biocatalytic growth of single NPs involving a biomolecule-induced redox reaction. Particularly, monitoring the process of biocatalytic reactions at the nanoscale offers detailed information with high sensitivity, which can improve the understanding of reaction mechanisms.
The excellent catalytic activity of Au NPs expands their applications in the construction of sensitive biosensors to monitor biocatalytic processes and detect biomolecules at the single-particle level. Fan and co-workers found that Au NPs with glucose oxidase (GOx)-like catalytic activities could in situ catalyze glucose oxidation [75]. They further indicated that the intrinsic glucose oxidase-like catalytic activity of Au NPs could be finely regulated by DNA hybridization owing to the marked difference in adsorption of single-stranded and double-stranded DNA on its surface [76]. Based on the above findings, a single Au NPs-based nanoplasmonic aptasensor for adenosine triphosphate (ATP) detection was presented by changing the probe DNA to an anti-ATP aptamer [77]. The ATP-induced conformational change of the aptamer resulted in the recovery of self-catalytic growth of Au NPs. DFM could visualize this process in real time and translate it to remarkable PRRS spectra peak shift signal. This single nanoplasmonic assay with catalytic Au NPs as the probe brought out a new method for biomolecular sensing, which could detect ATPs as low as 4 nM. Importantly, since no special chemical modification and sequence engineering of the aptamer is involved in this method, this simple design holds great promise for both in vitro and in vivo parallel detection and real-time imaging of multiple targets by using different aptamers. According to the same principles, conformational changes in guanine-rich DNA could be used to detect DNA-related catalytic reactions on the surface of Au NPs via DFM [78].
Furthermore, The LSPR wavelength of Au NPs is also highly dependent on the dielectric properties of the surrounding environment, and the resulting spectral shift induced by charge changes can be used to sensitively detect the molecular interaction occurring on the NP surface. By the combination of DFM imaging and PRRS spectra, Wang and co-workers achieved the direct observation of the catalytic progress of natural horseradish peroxidase (HRP) in situ on single Au NPs and sensitive detection of H2O2 at the same time [79]. The produced single HRP-Au NPs exhibited a good localized catalytic response toward H2O2–Diaminobenzidine, leading to the oxidative products accumulated around Au NPs. As the surface accumulation of the oxidative products caused a direct change of the dielectric constant within the nanoenvironment around the Au NPs, the biocatalysis-triggered LSPR changes of single Au NPs could be measured. Moreover, this generic strategy has a good perspective for a broader bioanalysis situation by substituting the HRP with another specified biocatalyst.
Core-shell Au nanostructures have been used for single-particle-based spectral shift measurements in the biocatalysis processes because the LSPR wavelength of core-shell structure is also sensitive to morphology changes or the surface refractive index [80]. Using single Au NPs as real-time optical probes, Long and co-workers successfully realized the nicotinamide adenine dinucleotide (NAD+)-dependent biocatalytic deposition of copper on Au NPs to form Au@Cu core-shell nanostructure in the presence of alcohol dehydrogenase (AlcDH) [81]. This work also demonstrated the ability to use DFM and scattering spectra to monitor the NADH-dependent intracellular metabolism enzymatic pathways in HeLa cancer cells, as well as to detect enzymatic activity at the single-particle level inside and outside cells. Notably, functionalized NPs have been designed to resist surface fouling in a range of biosensors. Similar to the detection of biomolecular-induced Au NPs growth, Au core-shell structure etching strategy also contributes to changes in scattering spectra [82].
Recently, Au/Ag nanocages with unique hollowed nanostructure and bimetallic composition were also selected as optical probes to investigate the dynamic biocatalytic process via dark-field imaging with time elapse. Li and co-workers chose Au/Ag nanocages as plasmon probes for microRNA detection based on visualized scattering signal changes [83], as shown in Figure 9. Combined with the recognition, hybridization chain reaction, and nucleic acid signal amplification strategy, the DNAzyme-catalyzed etching of the Ag component of individual Au/Ag nanocages was induced by reactive oxygen species (ROS), which was produced by the decomposition of H2O2 with the catalysis of hemin/G-quadruplex. Since Au/Ag nanocage probes showed great distinguishable and stable optical signals in the DNAzyme-catalyzed etching process, the proposed dark-field scattering biosensing was convenient for visualizing scattering signal changes and accurately judging the end-point during real-time monitoring, especially for ultrasensitive detection at the single-particle level.

4. Perspective and Outlook

Followed by a basic introduction to DFM and DFM-coupled technologies, the applications of DFM in single-particle measurements of catalysis are highlighted in this review. The past decade has witnessed the rapid development of DFM in the field of a series of heterogeneous catalytic reactions, such as redox reactions, electrocatalytic reactions, DNAzyme catalysis, etc. As simpler is better, the high sensitivity, low background, as well as low-cost instrumentation make this technology a good choice in single-particle catalysis. It is elucidated that the scattering spectra of individual NPs during catalytic reactions vary with the structure of single NPs and the environmental permittivity. Benefiting from this superiority, DFM can be used to measure the catalytic reaction process in real time and reveal the catalytic mechanism at the single-particle level. Moreover, DFM is of great significance for the screening of highly active and selective catalysts by determining the relationship between structure and catalytic activity at the single-particle level.
Although many exciting results have been demonstrated, further efforts remain to be developed to improve the performance of dark-field imaging techniques in single-particle studies. Combinations with other technologies and the integration of multiple optical techniques are required to achieve comprehensive measurements in single-particle catalysis [19]. For example, the combination of DFM and fluorescence spectroscopy can achieve dual-channel sensing detection based on light scattering and fluorescence signals from nanoprobes. In addition, DFM cannot realize the automatic analysis of the target at present, so it is necessary to develop intelligent data analysis methods to realize powerful information extraction and rapid readout. It is believed that deep learning can be widely applied to the scatterometry study and imaging analysis in chemistry [84]. With the development of DFM in practical applications, the miniaturization and portability of instruments will become the trend. Some portable DFM devices have been explored to achieve quick on-site testing in actual samples, such as dark-field smartphone microscopy [85] and lab-on-chip dark-field imaging devices using novel substrates [86].
Furthermore, more efforts have to be made to broaden the application range of DFM in single-particle catalysis including high-performance emerging technologies and materials. Traditional plasmonic nanomaterials have excellent optical properties but can only be used under specific conditions, which greatly limits the application of DFM in a variety of catalytic reactions. To overcome this limitation, some alternatives to conventional plasmonic nanomaterials are needed, including non-metallic NPs that exhibit strong Rayleigh scattering, as well as functional plasmonic nanomaterials such as aluminum plasmonics [87], plasmonic molecules [88], plasmonic metasurfaces and arrays [89], and plasmonic chirality [90]. Recently, individual nanobubbles have been used as probes for various catalytic fields by scattering imaging analysis [91]. In addition, the use of DNA self-assembly technology in the synthesis of PNPs can produce ultra-sensitive nanoprobes [92]. The combinations of PNPs with non-plasmonic nanocatalysts also provide the possibility for the detection of non-plasmonic nanocatalysts and catalytic reactions. It is expected that DFM would play an important role in single-particle catalysis by inspiring the development of highly effective catalysts and novel technologies.

Author Contributions

Conceptualization, J.S. and K.L.; investigation, J.S. and J.F.; writing—original draft preparation, J.S.; writing—review and editing, J.S., W.Q. and K.L.; visualization, J.S. and J.F.; supervision, K.L.; project administration, W.Q.; funding acquisition, K.L. All authors have read and agreed to the published version of the manuscript.

Funding

This research was funded by the National Natural Science Foundation of China (grant number 22074038), and the Fundamental Research Funds for the Central Universities.

Institutional Review Board Statement

Not applicable.

Informed Consent Statement

Not applicable.

Data Availability Statement

Not applicable.

Conflicts of Interest

The authors declare no conflict of interest.

References

  1. Vedrine, J.C. Heterogeneous catalysis on metal oxides. Catalysts 2017, 7, 341. [Google Scholar] [CrossRef] [Green Version]
  2. Tachikawa, T.; Yamashita, S.; Majima, T. Evidence for crystal-face-dependent TiO2 photocatalysis from single-molecule imaging and kinetic analysis. J. Am. Chem. Soc. 2011, 133, 7197–7204. [Google Scholar] [CrossRef]
  3. Hu, J.; Wang, Z.; Li, C.; Zhang, C. Advances in single quantum dot-based nanosensors. Chem. Comm. 2017, 53, 13284–13295. [Google Scholar] [CrossRef]
  4. Vendelbo, S.B.; Elkjaer, C.F.; Falsig, H.; Puspitasari, I.; Dona, P.; Mele, L.; Morana, B.; Nelissen, B.J.; van Rijn, R.; Creemer, J.F.; et al. Visualization of oscillatory behaviour of Pt nanoparticles catalysing CO oxidation. Nat. Mater. 2014, 13, 884–890. [Google Scholar] [CrossRef]
  5. Zhou, X.; Andoy, N.M.; Liu, G.; Choudhary, E.; Han, K.; Shen, H.; Chen, P. Quantitative super-resolution imaging uncovers reactivity patterns on single nanocatalysts. Nat. Nanotechnol. 2012, 7, 237–241. [Google Scholar] [CrossRef]
  6. Hartman, T.; Wondergem, C.S.; Kumar, N.; van den Berg, A.; Weckhuysen, B.M. Surface- and Tip-enhanced Raman spectroscopy in catalysis. J. Phys. Chem. Lett. 2016, 7, 1570–1584. [Google Scholar] [CrossRef] [Green Version]
  7. van Schrojenstein Lantman, E.M.; Deckert-Gaudig, T.; Mank, A.J.G.; Deckert, V.; Weckhuysen, B.M. Catalytic processes monitored at the nanoscale with tip-enhanced Raman spectroscopy. Nat. Nanotechnol. 2012, 7, 583–586. [Google Scholar] [CrossRef]
  8. Karim, W.; Spreafico, C.; Kleibert, A.; Gobrecht, J.; VandeVondele, J.; Ekinci, Y.; van Bokhoven, J.A. Catalyst support effects on hydrogen spillover. Nature 2017, 541, 68–71. [Google Scholar] [CrossRef]
  9. Chen, S.; Wang, W.; Xu, S.; Fu, C.; Ji, S.; Luo, F.; Lin, C.; Qiu, B.; Lin, Z. Single nanoparticle identification coupled with auto-identify algorithm for rapid and accurate detection of L-histidine. Anal. Chim. Acta 2021, 1187, 339162. [Google Scholar] [CrossRef]
  10. Garcia, M.A. Surface plasmons in metallic nanoparticles: Fundamentals and applications. J. Phys. D Appl. Phys. 2012, 45, 389501. [Google Scholar] [CrossRef] [Green Version]
  11. Lin, L.; Chen, M.; Qin, H.; Peng, X. Ag nanocrystals with nearly ideal optical quality: Synthesis, growth mechanism, and characterizations. J. Am. Chem. Soc. 2018, 140, 17734–17742. [Google Scholar] [CrossRef]
  12. Ahmed, A.; Pelton, M.; Guest, J.R. Understanding how acoustic vibrations modulate the optical response of plasmonic metal nanoparticles. ACS Nano 2017, 11, 9360–9369. [Google Scholar] [CrossRef]
  13. Guisbiers, G.; Mendoza-Cruz, R.; Bazan-Diaz, L.; Velazquez-Salazar, J.J.; Mendoza-Perez, R.; Robledo-Torres, J.A.; Rodriguez-Lopez, J.L.; Montejano-Carrizales, J.M.; Whetten, R.L.; Jose-Yacaman, M. Electrum, the gold-silver alloy, from the bulk scale to the nanoscale: Synthesis, properties, and segregation Rules. ACS Nano 2016, 10, 188–198. [Google Scholar] [CrossRef]
  14. Ha, J.W. Chemical interface damping of single gold nanorods with low sensitivity to the medium dielectric constant. Chem. Phys. Lett. 2017, 676, 65–69. [Google Scholar] [CrossRef]
  15. Jackman, J.A.; Ferhan, A.R.; Cho, N.J. Nanoplasmonic sensors for biointerfacial science. Chem. Soc. Rev. 2017, 46, 3615–3660. [Google Scholar] [CrossRef]
  16. Li, T.; Wu, X.; Liu, F.; Li, N. Analytical methods based on the light-scattering of plasmonic nanoparticles at the single particle level with dark-field microscopy imaging. Analyst 2017, 142, 248–256. [Google Scholar] [CrossRef]
  17. Li, K.; Qin, W.; Xu, Y.; Peng, T.; Li, D. Optical approaches in study of nanocatalysis with single-molecule and single-particle resolution. Front. Optoelectron. 2014, 8, 379–393. [Google Scholar] [CrossRef]
  18. Schultz, S.; Smith, D.R.; Mock, J.J.; Schultz, D.A. Single-target molecule detection with nonbleaching multicolor optical immunolabels. Proc. Natl. Acad. Sci. USA 2000, 97, 996–1001. [Google Scholar] [CrossRef] [Green Version]
  19. Wang, W. Imaging the chemical activity of single nanoparticles with optical microscopy. Chem. Soc. Rev. 2018, 47, 2485–2508. [Google Scholar] [CrossRef]
  20. Weigel, A.; Sebesta, A.; Kukura, P. Dark field microspectroscopy with single molecule fluorescence sensitivity. ACS Photonics 2014, 1, 848–856. [Google Scholar] [CrossRef]
  21. Gao, P.; Lei, G.; Huang, C. Dark-field microscopy: Recent advances in accurate analysis and emerging applications. Anal. Chem. 2021, 93, 4707–4726. [Google Scholar] [CrossRef]
  22. Peng, Y.; Xiong, B.; Peng, L.; Li, H.; He, Y.; Yeung, E.S. Recent advances in optical imaging with anisotropic plasmonic nanoparticles. Anal. Chem. 2015, 87, 200–215. [Google Scholar] [CrossRef]
  23. Wang, H.; Zhang, T.; Zhou, X. Dark-field spectroscopy: Development, applications and perspectives in single nanoparticle catalysis. J. Phys. Condens. Matter 2019, 31, 473001. [Google Scholar] [CrossRef]
  24. Sriram, M.; Markhali, B.P.; Nicovich, P.R.; Bennett, D.T.; Reece, P.J.; Hibbert, D.B.; Tilley, R.D.; Gaus, K.; Vivekchand, S.R.C.; Gooding, J.J. A rapid readout for many single plasmonic nanoparticles using dark-field microscopy and digital color analysis. Biosens. Bioelectron. 2018, 117, 530–536. [Google Scholar] [CrossRef]
  25. Jing, C.; Gu, Z.; Ying, Y.; Li, D.; Zhang, L.; Long, Y. Chrominance to dimension: A real-time method for measuring the size of single gold nanoparticles. Anal. Chem. 2012, 84, 4284–4291. [Google Scholar] [CrossRef]
  26. Zhou, J.; Lei, G.; Zheng, L.; Gao, P.; Huang, C. HSI colour-coded analysis of scattered light of single plasmonic nanoparticles. Nanoscale 2016, 8, 11467–11471. [Google Scholar] [CrossRef]
  27. Le, N.H.; Cathcart, N.; Kitaev, V.; Chen, J.I.L. Core-satellite assembly of gold nanoshells on solid gold nanoparticles for a color coding plasmonic nanosensor. Analyst 2022, 147, 155–164. [Google Scholar] [CrossRef]
  28. Song, M.; Chen, S.; Hu, P.; Huang, C.; Zhou, J. Automated plasmonic resonance scattering imaging analysis via deep learning. Anal. Chem. 2021, 93, 2619–2626. [Google Scholar] [CrossRef]
  29. Liu, M.; Wang, F.; Zhang, X.; Mao, X.; Wang, L.; Tian, Y.; Fan, C.; Li, Q. Tracking endocytosis and intracellular distribution of spherical nucleic acids with correlative single-cell imaging. Nat. Protoc. 2021, 16, 383–404. [Google Scholar] [CrossRef]
  30. Chaudhari, K.; Ahuja, T.; Murugesan, V.; Subramanian, V.; Ganayee, M.A.; Thundat, T.; Pradeep, T. Appearance of SERS activity in single silver nanoparticles by laser-induced reshaping. Nanoscale 2018, 11, 321–330. [Google Scholar] [CrossRef]
  31. Hao, J.; Xiong, B.; Cheng, X.; He, Y.; Yeung, E.S. High-throughput sulfide sensing with colorimetric analysis of single Au-Ag core-shell nanoparticles. Anal. Chem. 2014, 86, 4663–4667. [Google Scholar] [CrossRef]
  32. Yuan, J.; Shen, J.; Chen, M.; Lou, Z.; Zhang, S.; Song, Z.; Li, W.; Zhou, X. Artificial intelligence-assisted enumeration of ultra-small viruses with dual dark-field plasmon resonance probes. Biosens. Bioelectron. 2022, 199, 113893. [Google Scholar] [CrossRef]
  33. Byers, C.P.; Hoener, B.S.; Chang, W.; Yorulmaz, M.; Link, S.; Landes, C.F. Single-particle spectroscopy reveals heterogeneity in electrochemical tuning of the localized surface plasmon. J. Phys. Chem. B 2014, 118, 14047–14055. [Google Scholar] [CrossRef] [Green Version]
  34. Tachikawa, T.; Yonezawa, T.; Majima, T. Super-resolution mapping of reactive sites on titania-based nanoparticles with water-soluble fluorogenic probes. ACS Nano 2013, 7, 263–275. [Google Scholar] [CrossRef]
  35. Larsson, E.M.; Langhammer, C.; Zoric, I.; Kasemo, B. Nanoplasmonic probes of catalytic reactions. Science 2009, 326, 1091–1094. [Google Scholar] [CrossRef]
  36. Liu, N.; Tang, M.; Hentschel, M.; Giessen, H.; Alivisatos, A.P. Nanoantenna-enhanced gas sensing in a single tailored nanofocus. Nat. Mater. 2011, 10, 631–636. [Google Scholar] [CrossRef]
  37. Tang, M.; Liu, N.; Dionne, J.A.; Alivisatos, A.P. Observations of shape-dependent hydrogen uptake trajectories from single nanocrystals. J. Am. Chem. Soc. 2011, 133, 13220–13223. [Google Scholar] [CrossRef]
  38. Wang, P.; Lin, Z.; Su, X.; Tang, Z. Application of Au based nanomaterials in analytical science. Nano Today 2017, 12, 64–97. [Google Scholar] [CrossRef]
  39. Tao, A.R.; Habas, S.; Yang, P. Shape control of colloidal metal nanocrystals. Small 2008, 4, 310–325. [Google Scholar] [CrossRef]
  40. Huang, J.; Yang, X.; Zeng, Q.; Wang, J. A simple green route to prepare stable silver nanoparticles with pear juice and a new selective colorimetric method for detection of cysteine. Analyst 2013, 138, 5296–5302. [Google Scholar] [CrossRef]
  41. Liz-Marzan, L.M.; Murphy, C.J.; Wang, J.F. Nanoplasmonics. Chem. Soc. Rev. 2014, 43, 3820–3822. [Google Scholar] [CrossRef] [PubMed]
  42. Yan, Y.; Meng, L.; Zhang, W.; Zheng, Y.; Wang, S.; Ren, B.; Yang, Z.; Yan, X. High-throughput single-particle analysis of metal-enhanced fluorescence in free solution using Ag@SiO2 core-shell nanoparticles. ACS Sens. 2017, 2, 1369–1376. [Google Scholar] [CrossRef] [PubMed]
  43. Jiang, N.; Zhuo, X.; Wang, J. Active plasmonics: Principles, structures, and applications. Chem. Rev. 2018, 118, 3054–3099. [Google Scholar] [CrossRef] [PubMed]
  44. Langhammer, C.; Larsson, E.M. Nanoplasmonic in situ spectroscopy for catalysis applications. ACS Catal. 2012, 2, 2036–2045. [Google Scholar] [CrossRef]
  45. Novo, C.; Funston, A.M.; Mulvaney, P. Direct observation of chemical reactions on single gold nanocrystals using surface plasmon spectroscopy. Nat. Nanotechnol. 2008, 3, 598–602. [Google Scholar] [CrossRef]
  46. Wang, J.; Fossey, J.S.; Li, M.; Xie, T.; Long, Y. Real-time plasmonic monitoring of single gold amalgam nanoalloy electrochemical formation and stripping. ACS Appl. Mater. Interfaces 2016, 8, 8305–8314. [Google Scholar] [CrossRef]
  47. Wang, J.; Hua, X.; Li, M.; Long, Y. Mussel-inspired polydopamine functionalized plasmonic nanocomposites for single-particle catalysis. ACS Appl. Mater. Interfaces 2017, 9, 3016–3023. [Google Scholar] [CrossRef]
  48. Li, K.; Wang, K.; Qin, W.; Deng, S.; Li, D.; Shi, J.; Huang, Q.; Fan, C. DNA-directed assembly of gold nanohalo for quantitative plasmonic imaging of single-particle catalysis. J. Am. Chem. Soc. 2015, 137, 4292–4295. [Google Scholar] [CrossRef]
  49. Qi, F.; Han, Y.; Ye, Z.; Liu, H.; Wei, L.; Xiao, L. Color-coded single-particle pyrophosphate assay with dark-field optical microscopy. Anal. Chem. 2018, 90, 11146–11153. [Google Scholar] [CrossRef]
  50. Kong, C.; Liu, Q.; Li, W.; Chen, Z. Single particle-based colorimetric assay of pyrophosphate ions and pyrophosphatase with dark-field microscope. Sens. Actuators B Chem. 2019, 299, 126999. [Google Scholar] [CrossRef]
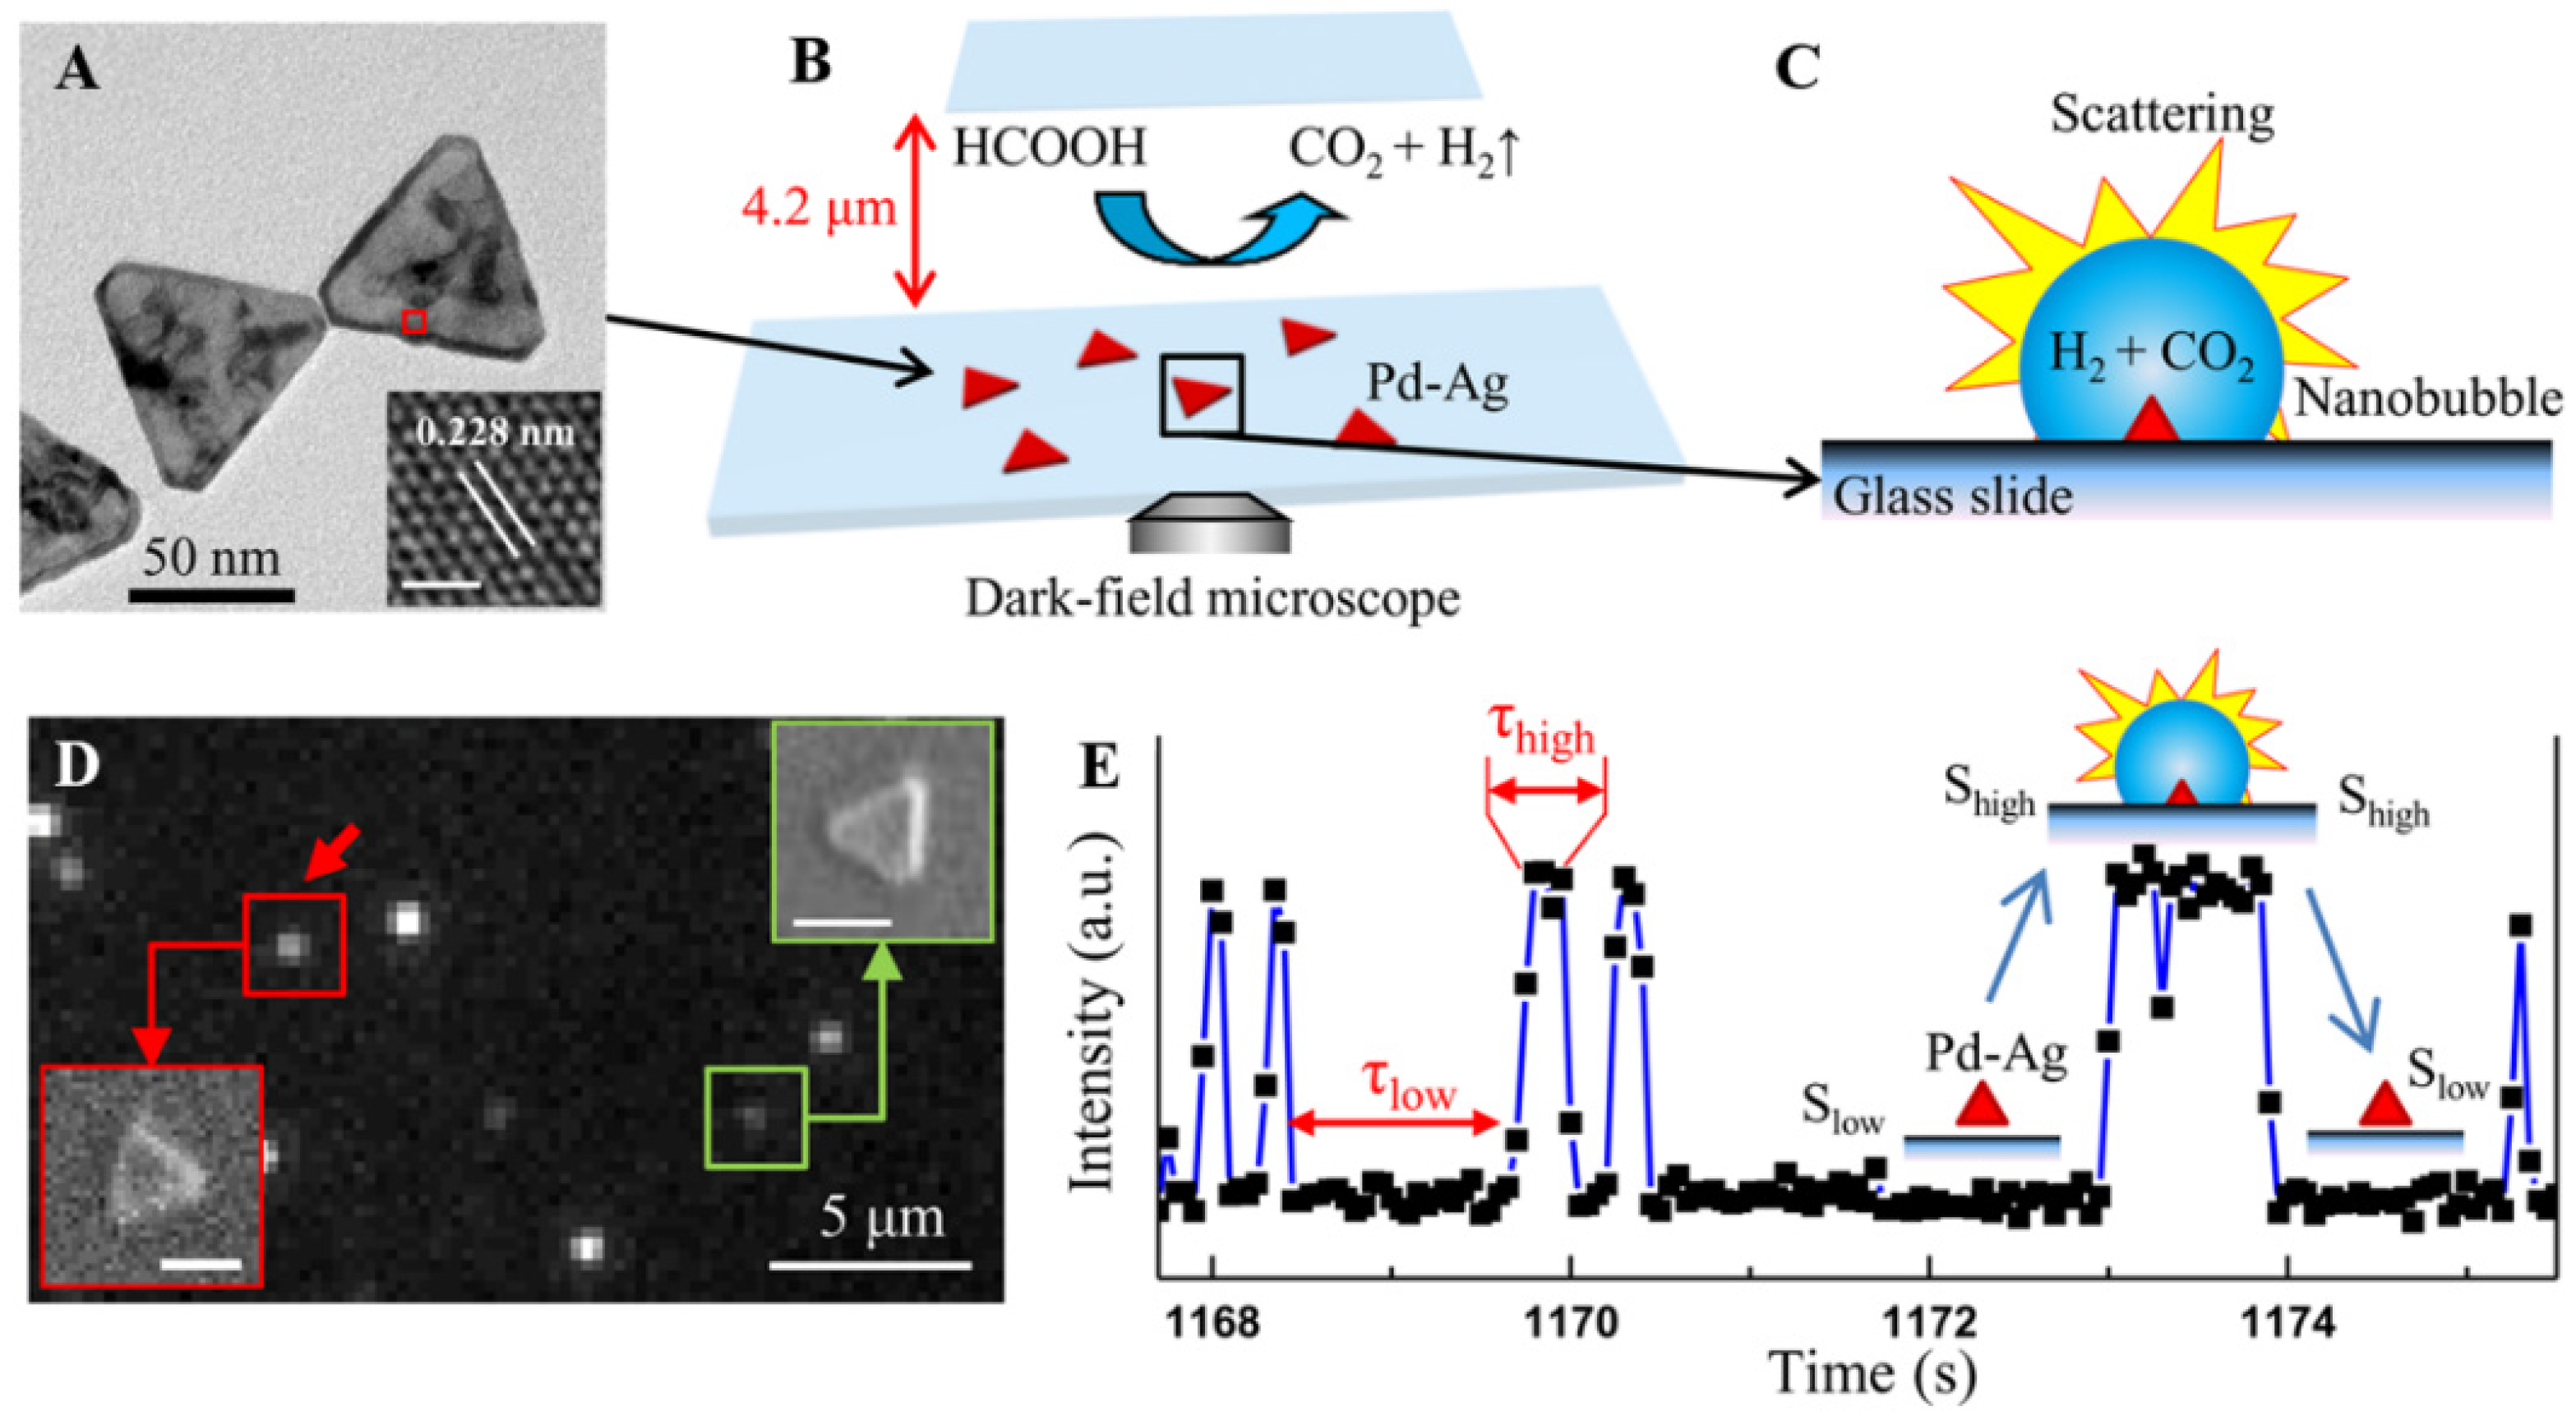
  51. Li, S.; Du, Y.; He, T.; Shen, Y.; Bai, C.; Ning, F.; Hu, X.; Wang, W.; Xi, S.; Zhou, X. Nanobubbles: An effective way to study gas-generating catalysis on a single nanoparticle. J. Am. Chem. Soc. 2017, 139, 14277–14284. [Google Scholar] [CrossRef]
  52. Wang, H.; He, T.; Du, Y.; Wang, W.; Shen, Y.; Li, S.; Zhou, X.; Yang, F. Evolution of single nanobubbles through multi-state dynamics. Chin. Chem. Lett. 2020, 31, 2442–2446. [Google Scholar] [CrossRef]
  53. Zou, X.; Zhang, Y. Noble metal-free hydrogen evolution catalysts for water splitting. Chem. Soc. Rev. 2015, 44, 5148–5180. [Google Scholar] [CrossRef]
  54. Chirea, M.; Collins, S.S.E.; Wei, X.; Mulvaney, P. Spectroelectrochemistry of silver deposition on single gold nanocrystals. J. Phys. Chem. Lett. 2014, 5, 4331–4335. [Google Scholar] [CrossRef]
  55. Chen, P.; Zhou, X.; Andoy, N.M.; Han, K.S.; Choudhary, E.; Zou, N.; Chen, G.; Shen, H. Spatiotemporal catalytic dynamics within single nanocatalysts revealed by single-molecule microscopy. Chem. Soc. Rev. 2014, 43, 1107–1117. [Google Scholar] [CrossRef] [Green Version]
  56. Zhang, H.; Govorov, A.O. Optical generation of hot plasmonic carriers in metal nanocrystals: The effects of shape and field enhancement. J. Phys. Chem. C 2014, 118, 7606–7614. [Google Scholar] [CrossRef]
  57. Wang, W.; Tao, N. Detection, counting, and imaging of single nanoparticles. Anal. Chem. 2014, 86, 2–14. [Google Scholar] [CrossRef] [Green Version]
  58. Brasiliense, V.; Patel, A.N.; Martinez-Marrades, A.; Shi, J.; Chen, Y.; Combellas, C.; Tessier, G.; Kanoufi, F. Correlated electrochemical and optical detection reveals the chemical reactivity of individual silver nanoparticles. J. Am. Chem. Soc. 2016, 138, 3478–3483. [Google Scholar] [CrossRef]
  59. Patrice, F.T.; Qiu, K.; Ying, Y.; Long, Y. Single nanoparticle electrochemistry. Annu. Rev. Anal. Chem. 2019, 12, 347–370. [Google Scholar] [CrossRef] [Green Version]
  60. Jing, C.; Rawson, F.J.; Zhou, H.; Shi, X.; Li, W.; Li, D.; Long, Y. New insights into electrocatalysis based on plasmon resonance for the real-time monitoring of catalytic events on single gold nanorods. Anal. Chem. 2014, 86, 5513–5518. [Google Scholar] [CrossRef]
  61. Xu, S.; Yu, X.; Chen, Z.; Zeng, Y.; Guo, L.; Li, L.; Luo, F.; Wang, J.; Qiu, B.; Lin, Z. Real-time visualization of the single-nanoparticle electrocatalytic hydrogen generation process and activity under dark field microscopy. Anal. Chem. 2020, 92, 9016–9023. [Google Scholar] [CrossRef]
  62. Lin, M.; Zhou, Y.; Bu, L.; Bai, C.; Tariq, M.; Wang, H.; Han, J.L.; Huang, X.; Zhou, X. Single-nanoparticle coulometry method with high sensitivity and high throughput to study the electrochemical activity and oscillation of single nanocatalysts. Small 2021, 17, 2007302. [Google Scholar] [CrossRef]
  63. Brasiliense, V.; Clausmeyer, J.; Dauphin, A.L.; Noel, J.M.; Berto, P.; Tessier, G.; Schuhmann, W.; Kanoufi, F. Opto-electrochemical in situ monitoring of the cathodic formation of single cobalt nanoparticles. Angew. Chem. Int. Ed. 2017, 56, 10598–10601. [Google Scholar] [CrossRef]
  64. Marschall, R. Semiconductor composites: Strategies for enhancing charge carrier separation to improve photocatalytic activity. Adv. Funct. Mater. 2014, 24, 2421–2440. [Google Scholar] [CrossRef]
  65. Mulvaney, P.; Perez-Juste, J.; Giersig, M.; Liz-Marzan, L.M.; Pecharroman, C. Drastic surface plasmon mode shifts in gold nanorods due to electron charging. Plasmonics 2006, 1, 61–66. [Google Scholar] [CrossRef]
  66. Lei, G.; Gao, P.; Yang, T.; Zhou, J.; Zhang, H.; Sun, S.; Gao, M.; Huang, C. Photoinduced electron transfer process visualized on single silver nanoparticles. ACS Nano 2017, 11, 2085–2093. [Google Scholar] [CrossRef]
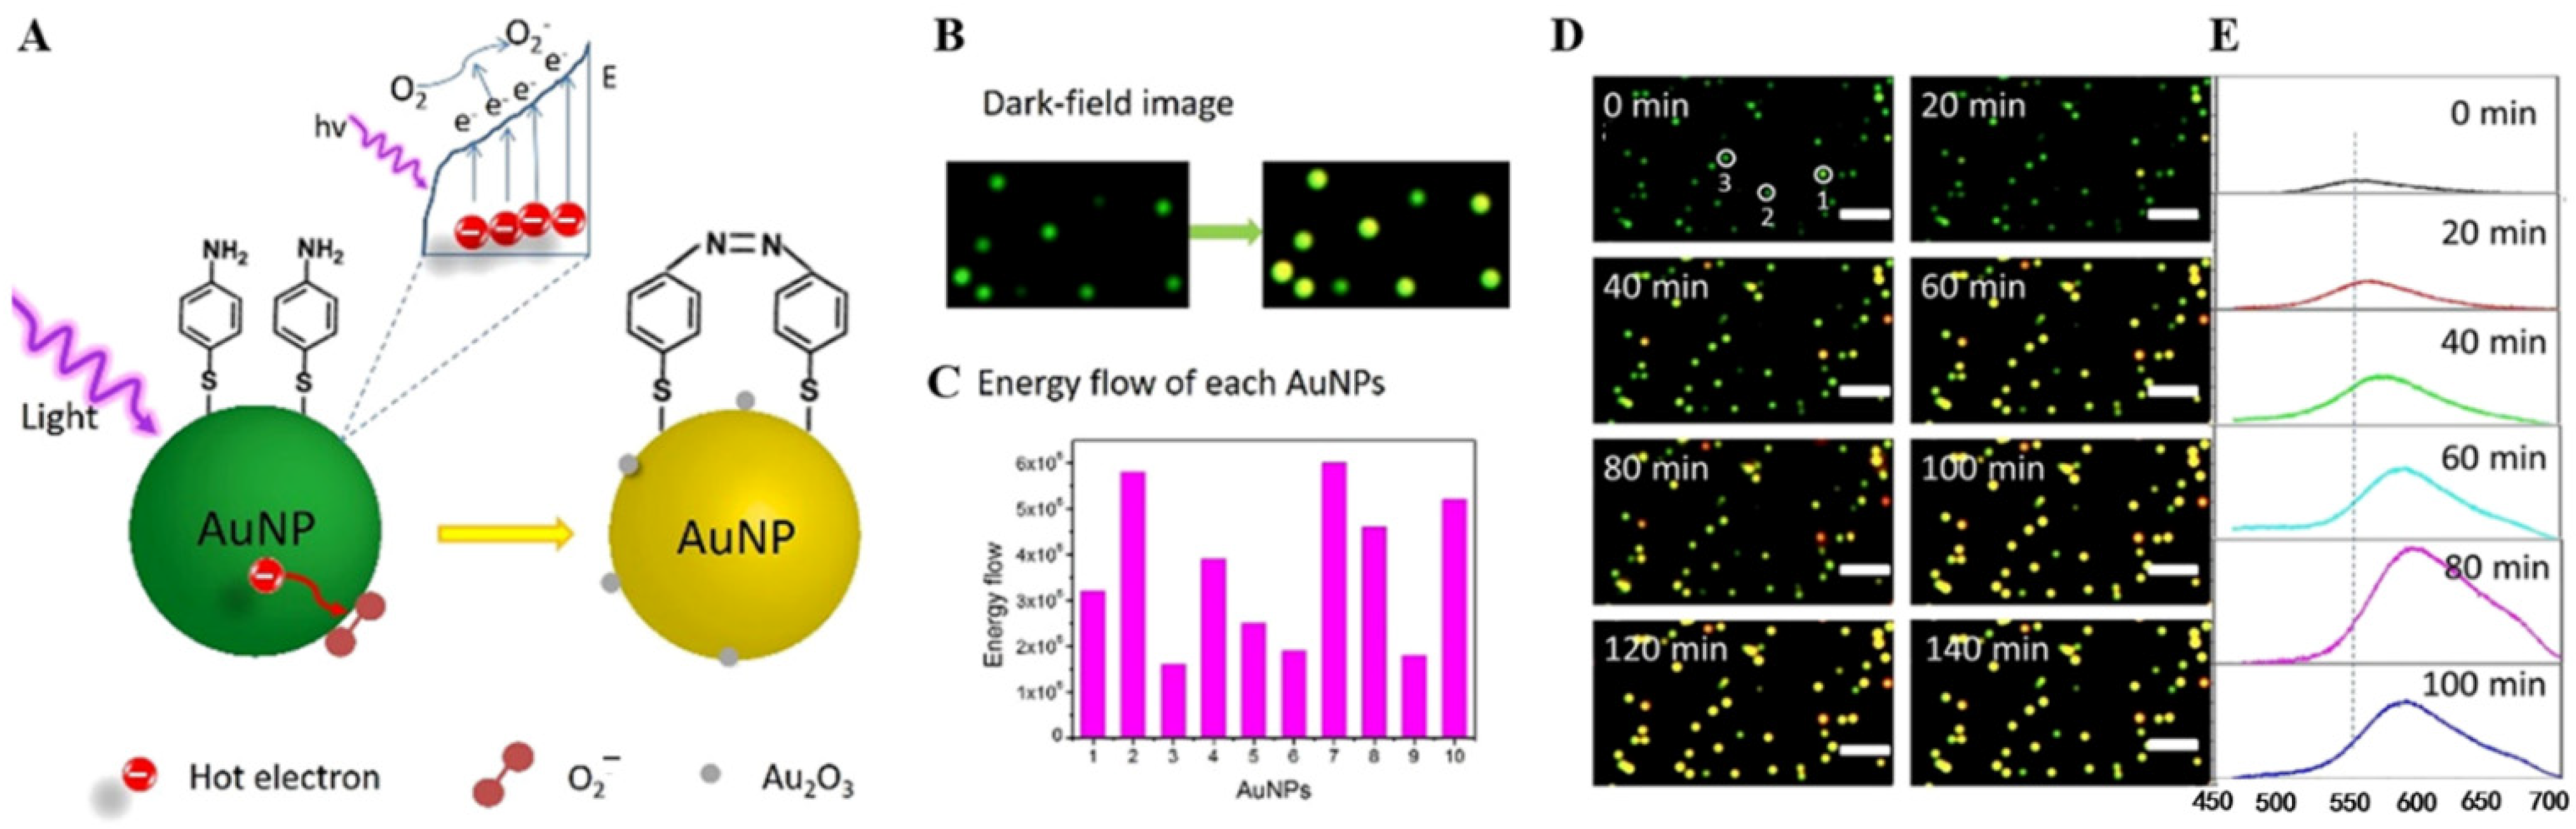
  67. Zhou, J.; He, W.; Liu, H.; Huang, C. Energy flow during the plasmon resonance-driven photocatalytic reactions on single nanoparticles. ACS Catal. 2022, 12, 847–853. [Google Scholar] [CrossRef]
  68. Lee, J.; Mubeen, S.; Ji, X.; Stucky, G.D.; Moskovits, M. Plasmonic photoanodes for solar water splitting with visible light. Nano Lett. 2012, 12, 5014–5019. [Google Scholar] [CrossRef]
  69. Hou, W.; Hung, W.; Pavaskar, P.; Goeppert, A.; Aykol, M.; Cronin, S.B. Photocatalytic conversion of CO2 to hydrocarbon fuels via plasmon-enhanced absorption and metallic interband transitions. ACS Catal. 2011, 1, 929–936. [Google Scholar] [CrossRef]
  70. Govorov, A.O.; Zhang, H.; Gun’ko, Y.K. Theory of photoinjection of hot plasmonic carriers from metal nanostructures into semiconductors and surface molecules. J. Phys. Chem. C 2013, 117, 16616–16631. [Google Scholar] [CrossRef]
  71. Sundararaman, R.; Narang, P.; Jermyn, A.S.; Goddard, W.A.; Atwater, H.A. Theoretical predictions for hot-carrier generation from surface plasmon decay. Nat. Commun. 2014, 5, 5788. [Google Scholar] [CrossRef]
  72. Linic, S.; Christopher, P.; Ingram, D.B. Plasmonic-metal nanostructures for efficient conversion of solar to chemical energy. Nat. Mater. 2011, 10, 911–921. [Google Scholar] [CrossRef]
  73. Yan, J.; Lin, Z.; Ma, C.; Zheng, Z.; Liu, P.; Yang, G. Plasmon resonances in semiconductor materials for detecting photocatalysis at the single-particle level. Nanoscale 2016, 8, 15001–15007. [Google Scholar] [CrossRef]
  74. Lim, S.; Lo, W.; Yang, P.; Lu, S.; Joplin, A.; Link, S.; Chang, W.; Tuan, H. Au@CdSe heteroepitaxial nanorods: An example of metal nanorods fully covered by a semiconductor shell with strong photo-induced interfacial charge transfer effects. Colloid Interface Sci. Commun. 2018, 532, 143–152. [Google Scholar] [CrossRef]
  75. Luo, W.; Zhu, C.; Su, S.; Li, D.; He, Y.; Huang, Q.; Fan, C. Self-catalyzed, self-limiting growth of glucose oxidase-mimicking gold nanoparticles. ACS Nano 2010, 4, 7451–7458. [Google Scholar] [CrossRef]
  76. Zheng, X.; Liu, Q.; Jing, C.; Li, Y.; Li, D.; Luo, W.; Wen, Y.; He, Y.; Huang, Q.; Long, Y.; et al. Catalytic gold nanoparticles for nanoplasmonic detection of DNA hybridization. Angew. Chem. Int. Ed. 2011, 50, 11994–11998. [Google Scholar] [CrossRef]
  77. Liu, Q.; Jing, C.; Zheng, X.; Gu, Z.; Li, D.; Li, D.; Huang, Q.; Long, Y.; Fan, C. Nanoplasmonic detection of adenosine triphosphate by aptamer regulated self-catalytic growth of single gold nanoparticles. Chem. Comm. 2012, 48, 9574–9576. [Google Scholar] [CrossRef]
  78. Zhao, Y.; He, Y.; Zhang, J.; Wang, F.; Wang, K.; Xia, X. Conformational change and biocatalysis-triggered spectral shift of single Au nanoparticles. Chem. Comm. 2014, 50, 5480–5483. [Google Scholar] [CrossRef]
  79. Pang, J.; Zhao, Y.; Liu, H.; Wang, K. A single nanoparticle-based real-time monitoring of biocatalytic progress and detection of hydrogen peroxide. Talanta 2018, 185, 581–585. [Google Scholar] [CrossRef]
  80. Xiong, B.; Zhou, R.; Hao, J.; Jia, Y.; He, Y.; Yeung, E.S. Highly sensitive sulphide mapping in live cells by kinetic spectral analysis of single Au-Ag core-shell nanoparticles. Nat. Commun. 2013, 4, 1708. [Google Scholar] [CrossRef] [Green Version]
  81. Zhang, L.; Li, Y.; Li, D.; Jing, C.; Chen, X.; Lv, M.; Huang, Q.; Long, Y.; Willner, I. Single gold nanoparticles as real-time optical probes for the detection of NADH-dependent intracellular metabolic enzymatic pathways. Angew. Chem. Int. Ed. 2011, 50, 6789–6792. [Google Scholar] [CrossRef]
  82. Chen, Z.; Li, J.; Chen, X.; Cao, J.; Zhang, J.; Min, Q.; Zhu, J. Single gold@silver nanoprobes for real-time tracing the entire autophagy process at single-cell level. J. Am. Chem. Soc. 2015, 137, 1903–1908. [Google Scholar] [CrossRef]
  83. Li, M.; Cheng, J.; Yuan, Z.; Shen, Q.; Fan, Q. DNAzyme-catalyzed etching process of Au/Ag nanocages visualized via dark-field imaging with time elapse for ultrasensitive detection of microRNA. Sens. Actuators B Chem. 2021, 330, 129347. [Google Scholar] [CrossRef]
  84. Banik, S.; Melanthota, S.K.; Arbaaz; Vaz, J.M.; Kadambalithaya, V.M.; Hussain, I.; Dutta, S.; Mazumder, N. Recent trends in smartphone-based detection for biomedical applications: A review. Anal. Bioanal. Chem. 2021, 413, 2389–2406. [Google Scholar] [CrossRef]
  85. Sun, D.; Hu, T. A low cost mobile phone dark-field microscope for nanoparticle-based quantitative studies. Biosens. Bioelectron. 2018, 99, 513–518. [Google Scholar] [CrossRef]
  86. Chazot, C.A.C.; Nagelberg, S.; Rowlands, C.J.; Scherer, M.R.J.; Coropceanu, I.; Broderick, K.; Kim, Y.; Bawendi, M.G.; So, P.T.C.; Kolle, M. Luminescent surfaces with tailored angular emission for compact dark-field imaging devices. Nat. Photonics 2020, 14, 310–315. [Google Scholar] [CrossRef]
  87. Su, M.N.; Dongare, P.D.; Chakraborty, D.; Zhang, Y.; Yi, C.; Wen, F.; Chang, W.; Nordlander, P.; Sader, J.E.; Halas, N.J.; et al. Optomechanics of single aluminum nanodisks. Nano Lett. 2017, 17, 2575–2583. [Google Scholar] [CrossRef]
  88. Kim, M.; Kwon, H.; Lee, S.; Yoon, S. Effect of nanogap morphology on plasmon coupling. ACS Nano 2019, 13, 12100–12108. [Google Scholar] [CrossRef]
  89. Jin, C.M.; Lee, W.; Kim, D.; Kang, T.; Choi, I. Photothermal convection lithography for rapid and direct assembly of colloidal plasmonic nanoparticles on generic substrates. Small 2018, 14, 1803055. [Google Scholar] [CrossRef]
  90. Lee, H.E.; Ahn, H.Y.; Mun, J.; Lee, Y.Y.; Kim, M.; Cho, N.H.; Chang, K.; Kim, W.S.; Rho, J.; Nam, K.T. Amino-acid- and peptide-directed synthesis of chiral plasmonic gold nanoparticles. Nature 2018, 556, 360–365. [Google Scholar] [CrossRef]
  91. Zhou, K.; Yuan, T.; Su, H.; Wang, W. Accessing the spatiotemporal heterogeneities of single nanocatalysts by optically imaging gas nanobubbles. Curr. Opin. Colloid Interface Sci. 2021, 55, 101465. [Google Scholar] [CrossRef]
  92. Peng, T.; Li, X.; Li, K.; Nie, Z.; Tan, W. DNA-modulated plasmon resonance: Methods and optical applications. ACS Appl. Mater. Interfaces 2020, 12, 14741–14760. [Google Scholar] [CrossRef]
Figure 1. Schematic of the typical optical path of the DFM with the dark-field condenser.
Catalysts 12 00764 g001
Figure 2. Upright (A) and inverted (B) types of dark-field microscope.
Catalysts 12 00764 g002
Figure 4. Working principle of the AI-assisted enumeration of ultra-small EV71 virus with two plasmon resonance probes under DFM. Reprinted with permission from [32]. Copyright 2022 Elsevier.
Catalysts 12 00764 g004
Figure 5. (A) Synthetic scheme for the preparation of Au nanohalo through the self-assembly of Au NPs of different diameters modified with complementary oligonucleotides. (B) Schematic demonstration of the distance between L- and S-Au NPs, which is determined by the rationally designed length of oligonucleotides. (C) Number of oligonucleotides per particle of different kinds of L- and S-Au NPs. Inset shows the colored product that is catalyzed by L- and S-Au NPs that loaded different amounts of oligonucleotides. (D) LSPR spectra and the corresponding band peak shifts of one Au nanohalo (up) and one L-NPs (down) during the catalytic reaction under the same experimental condition. Reprinted with permission from [48]. Copyright 2015 American Chemical Society.
Catalysts 12 00764 g005
Figure 6. Track gas-generating catalysis on a single NP by monitoring the nanobubble via DFM. (A) TEM image of Pd–Ag (mole ratio is nPd:nAg = 1:1) nanoplate catalysts. The inset is the high-resolution TEM image. (B) Experimental scheme using DFM and a microfluidic reactor to image the nanobubble containing the gas from the dehydrogenation of formic acid on a single Pd–Ag nanoplate. (C) Schematic of the light scattering of a nanobubble on a single Pd–Ag nanoplate catalyst. (D) Wide-field DFM image of individual Pd–Ag nanoplates undergoing formic acid dehydrogenation. The insets are the SEM images of the single Pd–Ag nanoplates after the reaction. (E) The scattering intensity versus time trajectory for the evolution of nanobubbles on a single Pd–Ag nanoplate. Reprinted with permission from [51]. Copyright 2017 American Chemical Society.
Catalysts 12 00764 g006
Figure 7. (A) Setup of dark-field microscopy integrated with an electrochemical workstation. (B) Electrocatalytic oxidation of H2O2 on the surface of Au NRs in KNO3 and KCl solutions, respectively. (CE): Simultaneous plasmonic scattering spectra peak shift of single NR (C) and electrochemical current of entire samples (D) under the applied triangular wave potential (E) on the Au NRs. (F) Au NR with hydroxide/oxide film was partially reduced into Au atom, and H2O2 was oxidized into O2 after treatment of H2O2 in KNO3 solution (up). Au NR was corroded by the formation of [AuClx], and gold chloride blocked the catalytic activity of Au NR for oxidation of H2O2 in KCl solution. Reprinted with permission from [60]. Copyright 2014 American Chemical Society.
Catalysts 12 00764 g007
Figure 8. The energetic charge flow in the plasmon-driven photocatalytic oxidation reaction at a single NP by DFM; (A) Photocatalytic oxidation mechanism of p-ATP to DMAB on the surface of Au NPs, (B) typical DFM images before and after the photocatalytic reaction as represented in (A,C) flow of energetic charge in each Au NPs to the adsorbed molecules during the photocatalytic reaction. Dynamic changes of DFM imaging and scattered spectra of Au NPs during the oxidation reactions of p-ATP. (D) Dynamic DFM imaging of Au NPs captured at the same position every 20 min. (E) Spectral measurement of the same Au NP at different time points during the reaction. Reprinted with permission from [67]. Copyright 2022 American Chemical Society.
Catalysts 12 00764 g008
Figure 9. (A) DFM sensing principle induced by target recognition and assisted by CHA–HCR amplification. (B) DFM images monitored over time while the pretreated concentration of microRNA-21 was 20 fM. The yellow arrows and cycles mark the points of interest. (C) DFM images of two individual plasmonic probes functionalized with hemin/G-quadruplex in DFM detection buffer. The #1 and #2 yellow arrows mark the points of interest. Reprinted with permission from [83]. Copyright 2021 Elsevier.
Catalysts 12 00764 g009
Publisher’s Note: MDPI stays neutral with regard to jurisdictional claims in published maps and institutional affiliations.

