
Modified Mn/ZSM-5 for Non-Thermal Plasma Mineralization of VOCs and DFT Simulation Using a Novel Y-Type ZSM-5 Model


1
School of Chemistry and Chemical Engineering, Southwest Petroleum University, Chengdu 610500, China
2
Department of Mechanical and Manufacturing Engineering, University of Calgary, Calgary, AB T2N 1N4, Canada
*
Author to whom correspondence should be addressed.
Catalysts 2022, 12(8), 906; https://doi.org/10.3390/catal12080906
Submission received: 27 July 2022
/
Revised: 12 August 2022
/
Accepted: 15 August 2022
/
Published: 17 August 2022
(This article belongs to the Special Issue Recent Progress of Catalysis in “Dual Carbon Targets”)
Abstract
:Using a catalyst to mineralize volatile organic compounds (VOCs) in a Non-thermal Plasma (NTP) reactor is an effective method. In many kinds of catalysts for VOCs degradation, oxygen defect is a crucial factor affecting the catalytic activity. Three different methods (steaming, doping, plasma) were used to introduce possible oxygen defects into the Mn/ZSM-5 to prepare modified catalysts, which were evaluated in VOCs degradation activity using a Double Dielectric Barrier Discharge (DDBD) plasma device. Additionally, a novel Y-type ZSM-5 model was employed in the DFT simulation. The new Y-type ZSM-5 model used in this paper is a more realistic aperiodic model. It showed that introducing possible oxygen defects can substantially enhance degradation efficiency. Taking the catalyst with oxygen defects introduced by plasma as an example, the conversion (CO2 selectivity) of the methanol, acetone, and toluene could reach 100% (100%), 97.7% (99.1%), 91.2% (93.9%), respectively, at an initial concentration of 2000 ppm and specific input energy of 9 kJ/L. The results demonstrated that modification could significantly enhance the activity of the catalyst in decomposing VOCs at room temperature using non-thermal plasma catalysis. Theoretical simulation of density functional theory (DFT) revealed that the adsorption of adsorbate on the catalyst becomes easier after possible oxygen defects are introduced.
1. Introduction
Volatile organic compounds have become a serious environmental issue in recent years [1,2,3,4,5], especially in developing countries. Researchers have used various methods to degrade VOCs, such as adsorption, condensation, membrane separation, ultraviolet oxidation, biofiltration, etc. [6,7,8].
In principle, the Non-thermal Plasma technology is a widely applicable technology. Even complex VOCs’ molecules can be degraded as long as enough high-energy particles are provided [9,10]. Therefore, numerous researchers in many countries paid growing attention to the NTP technology [11,12,13,14]. The role of high-energy electrons is not only to directly attack pollutant molecules but also to ionize carriers and produce active species such as •OH and O• free radicals [15]. The plasma is created by applying a sufficiently electric field to the gas stream. This study employed a Double Dielectric Barrier Discharge reactor, a conventional form applicable for plasma oxidation, used as the apparatus for evaluating the catalysts’ activity.
Scholars have studied many active metals, some of them directly loaded metals on ZSM-5 zeolites for pollutant degradation [16,17], and they all believe that oxygen vacancies in catalysts play a key role in it [18,19,20,21]. In our previous work, Mn/ZSM-5 has been proved to have a good catalytic effect [22]. Three different methods (steaming, doping, plasma) were used to introduce oxygen defects into the Mn/ZSM-5 to improve catalysts for VOCs degradation in this study. Steaming is a method that can be used for silicon aluminum molecular sieve catalysts. Aluminum hydroxyl groups are removed to form oxygen defects in the hydrothermal process. Doping is a common method that increases the oxygen vacancies by adding auxiliary metals into the catalysts. Plasma is a purely physical method that removes part of the surface oxygen of the catalyst by the bombardment of high-energy electrons. Roy et al. [23] prepared oxygen vacancies enriched Fe-ZSM-5 catalysts for the decomposition of N2O with the steaming method. Many researchers [24,25,26] added various metals to HZSM-5 to improve the degradation effect of the catalyst. Other scholars [27,28] modified manganese oxide with plasma to increase the oxygen vacancies of the catalyst.
In this article, the Mn/ZSM-5 samples were prepared via wet impregnation, and a series of improved catalysts were obtained by the above three modification methods. The plasma-catalytic removal of VOCs in the DDBD reactor at room temperature was investigated. Three substances were selected as VOCs models. Methanol is the representative of hydroxyl compounds, acetone represents carbonyl compounds, and toluene is the model compound of aromatic hydrocarbons. For the degradation process, adsorption is the first and critical step of catalytic reaction, so a possible improvement mechanism for the adsorption process was proposed using computational analyses with DFT calculation.
2. Results and Discussion
2.1. Catalytic Evaluation
Figure 1a–c displays the degradation effect of the Mn/ZSM-5 and modified catalysts on methanol, acetone, and toluene at the initial concentration of 2000 ppm and SIE of 9 kJ/L. The degradation rate of simple molecules such as methanol and acetone is significantly higher than that of aromatic hydrocarbons. The effect of modified catalyst Mn/ZSM-5-N is better than other samples, regardless of which index.
The effect of the initial concentration on the conversion of the VOCs is shown in Figure 2a. The evaluation was performed using Mn/ZSM-5-N at a power of 30 W. Initial concentrations ranging from 1000 to 4000 ppm were investigated. At the initial concentration of 1000 ppm, the degradation rate of relatively simple molecular pollutants such as methanol and acetone can reach 100%, and the toluene degradation is 95.5%. When the concentration increased to 2000 ppm, the degradation rate of methanol remained at 100%, while the degradation rate of acetone decreased to 97.7%, and toluene removal decreased to 91.2%. When the concentration increased to 4000 ppm, the degradation rate of methanol, acetone, and toluene remained at a high level (85.8%, 76.3%, and 66.4%, respectively). Figure 2b exhibits the CO2 selectivity as a function of initial concentration. The Mn/ZSM-5-N was the best of the three modified catalysts in CO2 selectivity. This is probably related to its lower redox temperature, as illustrated in H2-TPR characterization. The selectivity of the Mn/ZSM-5-N for methanol, acetone, and toluene are 100%, 99.1%, and 97.5% at the initial concentration 1000 ppm. With the concentration raised to 4000 ppm, the selectivity for methanol, acetone, and toluene decreased to 95%, 91.7%, and 89.2%, respectively. Simultaneously, the number of the active species produced in the DDBD device remained unchanged in unit time, whereas the number of pollutant molecules entering the DDBD increased, leading to an increase in energy efficiency. The energy efficiency of the Mn/ZSM-5-N for methanol, acetone, and toluene raised from 0.43 to 1.50 g/kWh, 0.45 to 1.36 g/kWh, 0.44 to 1.17 g/kWh for the concentration of 1000 ppm to 4000 ppm as shown in Figure 2c. The results demonstrated that the VOCs decomposition is improved due to the increase of oxygen defects. VOCs decomposition is inversely proportional to initial concentration, as mentioned by other scholars [29].
The specific input energy (SIE) is a function of plasma power and gas flow. In this work, the SIE value is adjusted by changing the input power, and the evaluation was accomplished with sample Mn/ZSM-5-N at the initial concentration of 2000 ppm. The influence of SIE on degradation indexes of methanol, acetone, and toluene by Mn/ZSM-5-N catalyst is revealed in Figure 3a–c, respectively. The conversion and CO2 selectivity both increased with SIE increase. That is because high-energy electrons and other reactive particles increased with the enhancement of the SIE [30,31]. Additionally, the reactive particles play a pivotal role in the mineralization of VOCS. However, a downward trend in energy efficiency appeared as SIE raised. When raising the SIE from 7.5 to 10.5 kJ/L, Energy efficiency in the degradation process of methanol, acetone, and toluene declined from 1.013 to 0.754 g/kWh, 0.963 to 0.749 g/kWh, 0.918 to 0.715 g/kWh, respectively. This inverse proportional relationship has been reported in other studies [32].
2.2. Phase Analysis of Catalysts
The XRD patterns of the Mn/ZSM-5, Mn/ZSM-5-S, Mn/ZSM-5-D, and Mn/ZSM-5-N samples were presented in Figure 4. The peak positions of the modified catalysts were quite in accord with that of Mn/ZSM-5. According to the database of the JCPDS, the diffraction line patterns of all the samples were quite similar to powder diffraction file 39-0225. A type MFI framework was observed in all the catalysts, implying that the structure of MFI zeolite is reasonably retained after introducing oxygen defects. The correspondence between diffraction angles and related facets was given in Table S2. No diffraction peaks of metal oxides appeared on the curves, indicating that the distribution of active components on the carrier is quite uniform. The crystallinity of Mn/ZSM-5 is 96.73% according to the fitting estimation of jade software. However, the crystallinity decreased after modification, especially Mn/ZSM-5-S and Mn/ZSM-5-D, which is related to the high temperature treatment in the modification process. The crystallinity of Mn/ZSM-5-S, Mn/ZSM-5-D, and Mn/ZSM-5-S were reduced to 89.97%, 91.39%, and 95.41%, respectively. This may affect the pore structure of the catalysts.
2.3. Pore Structure Study of Samples
The adsorption-desorption plots of samples were identified as type IV isotherms as exhibited in Figure 5, according to the classification of BDDT [33]. MFI (Mobil-Five) is a zeolite with the 10-membered ring skeleton structure. A relative strong adsorption of several catalysts appeared on the plots in low-pressure region, caused by the prosperous development of intracrystalline micropores. The hysteresis loops were observed on the plots in a wide scope of moderate and high-pressure regions. The hysteresis loops belonged to the characteristics of mesoporous materials. This phenomenon revealed that small crystal ZSM-5 simultaneously has a large number of mesoporous structures, which were produced by the accumulation of crystal particles. A mesoporous structure is the place where condensation occurs, and the condensation reaction led to the emergence of the hysteresis loop. On the basis of classification by IUPAC, the hysteresis loop has the typical characteristics of the H4 type, which is commonly seen in the adsorption–desorption curves of mesoporous formed by plate-like particles [34]. Furthermore, the catalyst particles in this paper are exactly plate particles, as displayed by SEM images.
Table 1 exhibited the specific surface areas (SSA) and pore structure of the catalysts. The SSA of the Mn/ZSM-5 is 424 m2g−1, including micropore surface area 268 m2g−1 and external specific surface area 156 m2g−1. The pore volume of the Mn/ZSM-5 is 0.254 cm3g−1, in which the micropore volume and mesoporous volume are 0.111 cm3g−1 and 0.143 cm3g−1, respectively. Both the SSA and pore volumes of the modified catalysts declined after introducing possible oxygen vacancies for the high temperature step of the modification process or parts of channels that may be covered by the doping metals. For the modified samples, the micropore surface area and the micropore volume are less affected, indicating that the microporous structure is not damaged in the process of modification. Mesopores are formed by the accumulation of crystalline grain. While the external specific surface area and mesoporous volume are obviously reduced, suggesting that the mesopores are blocked or collapsed after modification.
In the modified catalysts, Mn/ZSM-5-N showed a more advantageous textural property, indicating that the mild plasma modification process had a limited impact on the structure of the catalysts. Its specific surface area and pore volumes were 402 m2g−1 and 0.247 cm3g−1, respectively. On the contrary, Mn/ZSM-5-D and Mn/ZSM-5-S showed relatively lower SSA (370 m2g−1 and 363 m2g−1) and pore volume (0.231 cm3g−1 and 0.218 cm3g−1). The modification of steaming and doping reduced the SSA and pore volume more seriously due to the high temperature step in the modification process, which has negative effect on the pore properties of catalysts.
The average pore diameter and the pore size distributions of the catalysts are shown in Table 1 and Figure 5. The average pore size is about 2.4 nm. The majority of the pores of catalysts are systematically observed to range from 1.8 to 4.0 nm. Furthermore, the pore size distribution of modified samples changed slightly after modification, which is associated with the partial pore collapse in the modification process.
2.4. Catalyst Morphology
The scanning electron microscopy characterization was carried out to obtain the particle morphology. The SEM images of the Mn/ZSM-5, Mn/ZSM-5-S, Mn/ZSM-5-D, and Mn/ZSM-5-N are shown in Figure 6a–d.
The particles of the samples were rectangle-like, and the particle size was about 200-500 nm. This morphology was in accordance with the characterization of N2 adsorption-desorption. No conspicuous particle morphology changes of Mn/ZSM-5 was observed before and after introducing oxygen defects, suggesting that the MFI framework structure kept its integrality. The compositional distribution of the Mn/ZSM-5-N particles was further studied by EDS mapping as shown in Figure 7. It can be seen that the loading manganese content is expected and the metal distribution is uniform.
2.5. Surface Chemistry Analysis
The X-ray photoelectron spectroscopy operation was used to explore the valence state of metal elements on the carries. The XPS survey spectrum of Mn/ZSM-5 confirmed the existence of Mn, O, Si, and Al, as presented in Figure S1a.
The Mn 2p XPS spectra were performed to analyze the valence distribution of manganese. The 2p orbit splits into two energy levels (Mn 2p1/2 and Mn 2p3/2) because of the Electron-Spin Coupling of Nuclear Magnetic Moments, as displayed in Figure 8a. The Mn 2p curves can be deconvoluted into two asymmetric peaks. One is the Mn3+ signal, and the binding energies of the Mn2p3/2 and Mn2p1/2 are in the scope of 639.9–642.2 eV and 651.8–653.1 eV, respectively. Another one is the Mn4+ signal: the binding energies of its split 2p3/2 and 2p1/2 orbitals are assigned in the range of 642.7–646.5 eV and 654.1–657.0 eV, respectively. The binding energies obtained in this work are slightly different from other results reported by many scholars. In particular, the doping operation caused a noticeable shift in the binding energy for the addition of the auxiliary metal. In fact, the binding energy often shifts slightly due to the influence of the chemical environment [35,36,37,38,39]. Table 2 summarizes the ratio of the Mn3+ and Mn4+ that were calculated based on deconvoluted integral peak area. Simultaneously, Mn 3s spectra were also studied to detect the accurate average oxidation state (AOS) of manganese on the carries, as shown in Figure 8b. The splitting energy ΔE of Mn 3s can be obtained from the spectra, and then the AOS is calculated by the following formula [39,40]: AOS = 8.956 − 1.126 × ΔE. The AOS data are exhibited in Table 2. It can be seen from the spectrum analysis of Mn 2p and Mn 3s that the Mn exists in Mn3+ and Mn4+ two forms. The proportion of Mn3+ in manganese increased slightly after steaming modification, probably due to the growth of metal particles by the steaming process. The characteristic peak of Cu can be observed on the survey spectrum of doping sample Mn/ZSM-5-D in Figure S1b. From Cu 2p photoemission features in Figure S2, most copper existed in the form of Cu2+. Doping modification decreased the Mn4+ ratio of Mn/ZSM-5-D significantly. In the Raman spectrum, the characteristic peaks of 435 cm−1 and 650 cm−1 of Mn/ZSM-5 belong to the manganese oxide [41]. These peaks become lower, broader, and shifted slightly in the plot of Mn/ZSM-5-D, indicating the interaction between doped copper and manganese, which leads to the decrease of AOS of Mn. In contrast, plasma is a relatively mild modification process, which has little effect on the valence form of the active metal of the catalyst.
The O 1s XPS spectra were displayed in Figure 8c, from which we can directly judge the oxygen defects concentration. The O 1s asymmetric signal of the samples was decomposed into two peaks: the peaks in the range of 531.70–532.27 eV were identified as the lattice oxygen (Olatt), and the peaks in the scope of 533.58–534.86 eV were assigned to surface adsorbed oxygen (Oads). The adsorbed oxygen is likely to be adsorbed on oxygen vacancies, so the amount of adsorbed oxygen can represent oxygen vacancy concentration to a large extent. Additionally, based on the study of Venezia et al. [42], the peaks in the scope of 533.58–534.86 eV were probably due to the silica oxygen bond and the others at 531.70–532.27 eV were due to the aluminum oxygen bond. Therefore, the generation of oxygen vacancies is more likely to come from the break of silicon oxygen bonds. This provided guidance for the position of oxygen vacancies created in DFT simulation. According to the ratio of the Oads and Olatt summarized in Table 2, the oxygen vacancy concentrations of the three modified samples increased to varying degrees compared with the original samples Mn/ZSM-5. And Mn/ZSM-5-N possessed the highest concentration of oxygen vacancy, which plays an essential role in the degradation of VOCs [25,26,43].
2.6. Redox Properties of the Materials
Figure 9 presents the H2-TPR profiles of Mn/ZSM-5 and modified catalysts. The reduction process peak included two hydrogen consumption steps: Mn4+ to Mn3+ and, eventually, to Mn2+ [40,44]. In the hydrogen consumption curve of Mn/ZSM-5, there is a hydrogen consumption peak at 250–370 °C that belongs to the reduction process of Mn4+ to Mn3+. The subsequent hydrogen consumption process in the temperature range of 380–520 °C could be attributed to the reduction of Mn3+.
In the modified samples, the Mn/ZSM-5-N had the lowest reduction temperature region, indicating that the metal dispersion on the catalyst is very high, and the metal tends to be reduced easily. Combined with the increase of Mn4+ in XPS results, we can confirm that plasma modification promotes the uniform distribution of metals. For Mn/ZSM-5-D, the reduction peak of Mn4+ to Mn3+ decreased significantly and the hydrogen consumption peak of the Mn3+ to Mn2+ Increased. This is due to the decrease of Mn4+ and the increase of Mn3+ caused by Cu doping. Two weak hydrogen consumption peaks at 254 °C and 562 °C can be observed simultaneously, belonging to the reduction of Cu2+ to Cu+ and Cu+ to Cu, respectively. Part of Cu2+ can be reduced to Cu directly; however, this peak may be submerged in the hydrogen consumption peak of Mn4+. The reduction temperature of Mn/ZSM-5-S has not been improved or even increased slightly, which may be due to the growth of metal particles caused by steaming, and the manganese is not easy to reduce.
This observation implies that NTP modification can improve the distribution of metals on the catalyst surface, and the low-temperature reducibility of Mn/ZSM-5-N is satisfactory. It may be more suitable for use in the ambient temperature system. The VOCs adsorbed on Mn/ZSM-5-N are easier to be oxidized and degraded for the excellent oxidation–reduction properties of catalysts.
2.7. Computational Analyses by DFT
The adsorption is the first step of degradation. Methanol, acetone, and toluene are representative species of VOCs. Adsorption energies of VOCs on catalysts affect the reaction rate. To further explore why oxygen defects can strengthen the degradation effect of VOCs, the DFT calculation is performed for simulating the adsorption process to compare the changes of VOCs adsorption energies on the catalyst before and after introducing possible oxygen vacancies. The MFI structure was modeled with a Y-type Si15AlMnO22H22 cluster (shown in Figure 10a,b) that was generated from four adjacent MFI unit cells with the initial lattice constants of a = 2.0070 nm, b = 1.9920 nm, and c = 3.3280 nm. In the previous model, the 10-membered ring structure was copied in parallel to obtain a double 10-membered ring model, which is not the actual structure in MFI. T5 model is a common real structure that is too simple. The Y cluster in this work is an aperiodic structure that will increase the burden of simulation calculations. However, the model is a real structure that is closer to the actual atomic mechanics and atomic dynamics. The model optimized by the VASP program was calculated via the Materials Studio -CASTEP module based on density functional theory. GGA-PBE functional is hired to approximate the error term-exchange correlation potential. Refer to the Supplementary Materials for specific computational details.
The adsorption energy of VOCs was calculated by the formula ∆EVOCs = E*VOCs − E* − EVOCs, where E*VOCs, E*, and EVOCs denote the energy of the adsorbed system, catalyst surface, and VOCs, respectively [45]. To further obtain the supported catalyst model, a single tetravalent manganese was loaded on the catalyst model for structural optimization. Before modification, the adsorption energies of the methanol, acetone, and toluene on the original model were −0.93, −0.74, and −0.69 eV, respectively. After catalyst modification, new oxygen defects appeared on the catalyst. Thus, an oxygen vacancy was created in the structure to obtain the Ov-introduced catalyst model and optimize the structure again. It can be seen from Figure 10c,d that the partial atomic distances changed after introducing the oxygen vacancy: the oxygen atom on the right side of the oxygen vacancy collapsed, and the length of Mn-O bond became slightly shorter. The adsorption of VOCs by the models before and after the oxygen vacancy introduction was depicted in Figure 11. The adsorption energies of the methanol, acetone, and toluene on the catalyst with oxygen vacancy increased to −1.97, −1.24, and −0.89 eV, implying a significant improvement. Additionally, it can be seen that the improvement of small molecules is more obvious.
2.8. Durability Test
The durability test of the plasma-catalytic was evaluated at the initial concentration of 3000 ppm and SIE of 9 kJ/L. As depicted in Figure 12, the degradation rate and the CO2 selectivity hardly changed, which should be due to the low-temperature reaction environment of plasma. Usually, the factors leading to catalyst deactivation are structure collapse, metal accumulation, the disappearance of oxygen vacancy, etc.
We accomplished the surface chemical analysis of the used-Mn/ZSM-5-N to explore the distribution of metal. If the metal agglomerates and grows into a certain MnOx crystal after being used, the ratio of Mn3+ and Mn4+ will change. On the contrary, the Mn 3s XPS spectrum (Figure 13a) presents that the AOS of manganese is 3.45, with no significant change compared with the fresh catalyst. The proportion of Mn3+ and Mn4+ of catalyst has almost unchanged based on the Mn 2p XPS spectrum (Figure 13b). The test results demonstrated that the manganese maintains a good dispersion on the catalyst surface during test operation. Additionally, no MnOx phase was detected in the XRD of used-Mn/ZSM-5-N (Figure 13d), confirming the XPS result again. The Mn test in energy-dispersive X-ray (EDX) elemental mapping in Figure 13f also verified that the element distribution is quite uniform.
The content of oxygen defects remained stable in the used-MnCe/ZSM-5 compared with fresh catalyst from O 1s XPS spectrum (Figure 13c), implying that the oxygen defects did not disappear due to the adsorption of oxygen. In other words, even if the oxygen vacancy adsorbs oxygen, high-energy electrons can continuously bombard the oxygen adsorbed on the oxygen vacancy and promote the re-separation of adsorbed oxygen in the plasma environment.
The SEM and adsorption–desorption presented that the morphology and adsorption capacity of the used-Mn/ZSM-5-N was very similar to the fresh catalyst in Figure 13e, implying that the pore structure of the catalyst has not collapsed.
In summary, the factors that can usually inactivate the catalysts have not been found. In the mild environment of DDBD, active metals tend to remain dispersed, oxygen defects remain stable, and simultaneously it is easier for the catalysts to keep their structure intact. These factors ensure the long-term and efficient operation of the catalyst.
3. Experimental
3.1. Experimental Setup
The setup consists of a gas generation system, a DDBD plasma reactor with a power source, and a product testing device.
The gas generation system comprises an air cylinder, a gas generator, a mass flow controller (MFC), and a digital hygrometer. The gaseous fluid flows through the MFC and gas generator, forming a gas mixture of VOCs model and air. The model concentration is adjusted by changing the injection rate of the gas generator. The diluted mixed gases are fed into a DDBD device.
The cylindrical DDBD reactor contains two layers of crystalline silica dielectric (exterior dielectric and inner dielectric), causing an effective discharge gap of 4 mm. The lengths of the high voltage electrode (outside the exterior dielectric), the grounded voltage electrode (inside the interior dielectric), and the dielectrics were exhibited in Supplementary Materials (Table S1). The current generated between the high voltage electrode and the grounded electrode passes through the double dielectrics. Plasma is produced in the middle of the two layers of dielectric. A digital μAm meter attached to the plasma source was employed for the current measurement.
A GC-2014C gas chromatograph (Shimadzu, Kyoto, Japan) was hired to analyze the gas samples from the outlet in real time. See Supplementary Materials for the test conditions
3.2. Synthesis of Catalysts
Manganese is the active metal component with a loading of 5% by weight. The Mn supported samples were prepared via wet impregnation strategy with small crystal ZSM-5 zeolite (Catalyst Co. Ltd. of Nankai University, Tianjin, China) as the carrier. The ZSM-5 powders were impregnated in a precursor solution of manganese acetate (99.0%, Chron, Chengdu, China) of the desired concentration. Following impregnation treatment under slow stirring for 24 h, the impregnated samples were dried in vacuum by temperature-programmed heating and gradually reducing the vacuum to remove the solvent. After that, the samples were calcined at a certain temperature for 5 h. The obtained powders were labeled as Mn/ZSM-5.
Next, Mn/ZSM-5 was modified by different methods. The modified sample with a steaming strategy was performed at a vapor pressure of 25 kPa, a temperature of 873 K, for 4 h. This sample is labeled Mn/ZSM-5-S. The doping modified sample was synthesized by second wet impregnation, and the auxiliary metals Cu use copper nitrate (99.0%, Chron, Chengdu, China) as a precursor with a content of 1%. The second impregnation process is similar to that of Mn impregnation. The obtained catalyst is referred to as Mn/ZSM-5-D. Placed Mn/ZSM-5 in a discharge device with nitrogen as the background gas, adjusted the plasma power to 100 W, and handled for 30 min. The resulting sample is referred to as Mn/ZSM-5-E.
3.3. Characterization and Evaluation
Please refer to Supplementary Materials for the characterization details.
Three critical indicators were defined for estimating the catalytic performance in this paper: conversion, CO2 selectivity, and energy efficiency.
where [VOCs]inlet is the initial VOCs concentration (ppm) in the feed, [VOCs]outlet is the steady VOCs concentration (ppm) in the effluent gas after reaction, and [CO2] is the outlet carbon dioxide concentration (ppm), m is the number of carbon atoms in VOCs molecules
In addition, the engineering parameters initial concentration and specific input energy (SIE) were also investigated.
where P is the discharge power (W) of the power supply, Q is the gas flow rate (L/s), and the SIE indicates how much energy is received per liter of fluid.
4. Conclusions
The facile preparation of Mn/ZSM-5 catalysts with varying defects content is an effective strategy for improving catalytic efficiency for VOCs removal in the DDBD reactor at ambient temperature. The conversion and CO2 selectivity can be improved by reducing the initial concentration and increasing the SIE. Still, the corresponding cost is the reduction of energy efficiency. Several methods can increase the concentration of oxygen defects to varying degrees. Steaming has an effect on crystallinity and pore structure, and then affects the adsorption capacity. Although doping can greatly increase the concentration of oxygen defects, it will reduce the average oxidation state of Mn and weaken the redox capacity of the catalyst, which limits the improvement of the catalyst. The modification of NTP is a mild process. It will not adversely affect the properties of the catalyst, but promote the uniform metal distribution and make the catalyst perform well. The modified Mn/ZSM-5-N catalysts exhibiting the highest conversion rate are more favorable toward removing VOCs, especially simple small molecule compounds. Through the durability test in the DDBD device, we confirmed that the plasma environment could stabilize the structure and properties of the catalyst, which have a great significance in prolonging the service life of catalysts.
Supplementary Materials
The following supporting information can be downloaded at: https://www.mdpi.com/article/10.3390/catal12080906/s1, Figure S1: Survey photoemission features from XPS results of samples (a) Mn/ZSM-5 and (b) Mn/ZSM-5-D; Figure S2: Cu 2p photoemission features from XPS results of Mn/ZSM-5-D; Table S1: The size parameters of the DDBD reactor; Table S2: Correspondence between diffraction angles and related facets.
Author Contributions
Conceptualization, J.Z. and S.L.; methodology, S.L.; formal analysis, S.L., D.L. and K.D.; investigation, J.Z. and S.L.; writing-original draft preparation, S.L.; visualization, S.L.; writing-review and editing, J.Z. and S.L.; supervision, project administration and funding acquisition, J.Z. All authors have read and agreed to the published version of the manuscript.
Funding
This work was supported by the Sichuan Science and Technology Program (2020YFS0305) and Chengdu Science and Technology Program (2022-YF05-00159-SN).
Data Availability Statement
Not applicable.
Conflicts of Interest
The authors declare no conflict of interest.
References
- Blasin-Aubé, V.; Belkouch, J.; Monceaux, L. General study of catalytic oxidation of various VOCs over La0.8Sr0.2MnO3+x perovskite catalyst-influence of mixture. Appl. Catal. B Environ. 2003, 43, 175–186. [Google Scholar] [CrossRef]
- Rostami, R.; Moussavi, G.; Jafari, A.J.; Darbari, S. A modeling concept on removal of VOCs in wire-tube non-thermal plasma, considering electrical and structural factors. Environ. Monit. Assess. 2020, 192, 280. [Google Scholar] [CrossRef] [PubMed]
- Padilla, O.; Munera, J.; Gallego, J.; Santamaria, A. Approach to the Characterization of Monolithic Catalysts Based on La Perovskite-like Oxides and Their Application for VOC Oxidation under Simulated Indoor Environment Conditions. Catalysts 2022, 12, 168. [Google Scholar] [CrossRef]
- Odum, J.R.; Jungkamp, T.; Griffin, R.J.; Forstner, H.; Flagan, C.; Seinfeld, J.H. Aromatics, Reformulated Gasoline, and Atmospheric Organic Aerosol Formation. Environ. Sci. Technol. 1997, 31, 1890–1897. [Google Scholar] [CrossRef]
- Yang, K.; Liu, Y.; Deng, J.; Zhao, X.; Yang, J.; Han, Z.; Hou, Z.; Dai, H. Three-dimensionally ordered mesoporous iron oxide-supported single-atom platinum: Highly active catalysts for benzene combustion. Appl. Catal. B. 2018, 244, 650–659. [Google Scholar] [CrossRef]
- Chen, Y.S.; Hsu, Y.C.; Lin, C.C.; Tai, Y.D.; Liu, H.S. Volatile Organic Compounds Absorption in a Cross-Flow Rotating Packed Bed. Environ. Sci. Technol. 2008, 42, 2631–2636. [Google Scholar] [CrossRef]
- Guo, Y.; Wen, M.; Li, G.; An, T. Recent advances in VOC elimination by catalytic oxidation technology onto various nanoparticles catalysts: A critical review. Appl. Catal. B Environ. 2021, 281, 0926–3373. [Google Scholar] [CrossRef]
- Woellner, M.; Hausdorf, S.; Klein, N.; Mueller, P.; Smith, M.W.; Kaskel, S. Adsorption and Detection of Hazardous Trace Gases by Metal-Organic Frameworks. Adv. Mater. 2018, 30, 1704679. [Google Scholar] [CrossRef]
- Xiao, G.; Xu, W.; Wu, R.; Ni, M.; Du, C.; Gao, X.; Luo, Z.; Cen, K. Non-Thermal Plasmas for VOCs Abatement. Plasma Chem. Plasma Process. 2014, 34, 1033–1065. [Google Scholar] [CrossRef]
- Hassan, A.A.; Sorial, G.A. Removal of benzene under acidic conditions in a controlled Trickle Bed Air Biofilter. J. Hazard. Mater. 2010, 184, 345–349. [Google Scholar] [CrossRef]
- Harling, A.M.; Demidyuk, V.; Fischer, S.J.; Whitehead, J.C. Plasma-catalysis destruction of aromatics for environmental clean-up: Effect of temperature and configuration. Appl. Catal. B Environ. 2008, 82, 180–189. [Google Scholar] [CrossRef]
- Kim, H.H.; Oh, S.M.; Ogata, A.; Futamura, S. Decomposition of gas-phase benzene using plasma-driven catalyst (PDC) reactor packed with Ag/TiO2 catalyst. Appl. Catal. B Environ. 2005, 56, 213–220. [Google Scholar] [CrossRef]
- Caroline, N.; Jean-Michel, T.; Catherine, B.; Elodie, F. Non-thermal plasma assisted catalysis of methanol oxidation on Mn, Ce and Cu oxides supported on γ-Al2O3. Chem. Eng. J. 2016, 304, 563–572. [Google Scholar]
- Roland, U.; Holzer, F.; Kopinke, F.D. Combination of non-thermal plasma and heterogeneous catalysis for oxidation of volatile organic compounds: Part 2. Ozone decomposition and deactivation of γ-Al2O3. Appl. Catal. B Environ. 2002, 58, 217–226. [Google Scholar] [CrossRef]
- Yan, K.; Heesch, E.; Pemen, A. A high-voltage pulse generator for corona plasma generation. IEEE Transact. Ind. Appl. 2002, 38, 866–872. [Google Scholar] [CrossRef]
- Dou, B.J.; Li, S.M.; Liu, D.L.; Zhao, R.Z.; Liu, J.G.; Hao, Q.L. Catalytic oxidation of ethyl acetate and toluene over Cu-Ce-Zr supported ZSM-5/TiO2 catalysts. RSC Adv. 2016, 6, 53852–53859. [Google Scholar]
- Shu, Y.; He, M.; Ji, J.; Huang, H.; Liu, S.; Leung, D.Y.C. Synergetic degradation of VOCs by vacuum ultraviolet photolysis and catalytic ozonation over Mn-xCe/ZSM-5. J. Hazard. Mater. 2019, 364, 770–779. [Google Scholar] [CrossRef]
- Cheng, F.; Zhang, T.; Zhang, Y. Enhancing Electrocatalytic Oxygen Reduction on MnO2 with Vacancies. Angew. Chem. Int. Edit. 2013, 52, 2474–2477. [Google Scholar] [CrossRef]
- Zhang, L.; Xie, X.Y.; Wang, H.; Ji, L.; Zhang, Y.; Chen, H.; Li, T.S.; Luo, Y.; Cui, G.; Sun, X. Boosting electrocatalytic N2 reduction by MnO2 with oxygen vacancies. Chem. Commun. 2019, 55, 4627–4630. [Google Scholar] [CrossRef]
- Zhang, Z.Z.; Zhang, Y.Y.; Han, X.X.; Guo, L.; Wang, D.J.; Lv, K.L. Assembly of CaIn2S4 on Defect-Rich BiOCl for Acceleration of Interfacial Charge Separation and Photocatalytic Phenol Degradation via S-Scheme Electron Transfer Mechanism. Catalysts 2021, 11, 1130. [Google Scholar] [CrossRef]
- Hu, Z.; Li, K.; Wu, X.; Wang, N.; Li, X.; Qin, L.; Li, L.; Lv, K.L. Dramatic promotion of visible-light photoreactivity of TiO2 hollow microspheres towards NO oxidation by introduction of oxygen vacancy. Appl. Catal. B Environ. 2019, 256, 117860. [Google Scholar] [CrossRef]
- Liu, S.; Zhou, J.; Liu, W.; Zhang, T. Removal of Toluene in Air by a Non-thermal Plasma-Catalytic Reactor Using MnOx/ZSM-5. Catal. Lett. 2021, 152, 239–253. [Google Scholar] [CrossRef]
- Roy, P.K.; Prins, R.; Pirngruber, G.D. The effect of pretreatment on the reactivity of Fe-ZSM-5 catalysts for N2O decomposition: Dehydroxylation vs. steaming. Appl. Catal. B Environ. 2008, 80, 226–236. [Google Scholar] [CrossRef]
- Li, Y.; Fan, Z.; Shi, J. Modified manganese oxide octahedral molecular sieves M´-OMS-2 (M´ = Co, Ce, Cu) as catalysts in post plasma-catalysis for acetaldehyde degradation. Catal. Today 2015, 256, 178–185. [Google Scholar] [CrossRef]
- Kim, J.; Lee, J.E.; Lee, H.W.; Jeon, J.K.; Park, Y.K. Catalytic ozonation of toluene using Mn-M bimetallic HZSM-5 (M: Fe, Cu, Ru, Ag) catalysts at room temperature. J. Hazard. Mater. 2020, 397, 122577. [Google Scholar] [CrossRef]
- Jiang, N.; Zhao, Y.; Qiu, C.; Shang, K.; Lu, N.; Li, J.; Wu, Y.; Zhang, Y. Enhanced catalytic performance of CoO-CeO2 for synergetic degradation of toluene in multistage sliding plasma system through response surface methodology (RSM). Appl. Catal. B Environ. 2019, 259, 118061. [Google Scholar] [CrossRef]
- Zhao, J.; Lu, G.; Wu, Y.; Zhang, P.; Kang, X. Manganese oxide with rich oxygen vacancies based on Plasma modification for high performance supercapacitors. Colloids Surf. A Phys. Eng. Asp. 2020, 603, 125254. [Google Scholar] [CrossRef]
- Lee, C.J.; Lee, D.H.; Kim, T. Modification of Catalyst Surface from Interaction Between Catalysts and Dielectric Barrier Discharge Plasma. J. Nanosci. Nanotechno. 2017, 17, 2707–2710. [Google Scholar] [CrossRef]
- Zhu, F.; Li, X.; Zhang, H.; Wu, A.; Yan, J. Destruction of toluene by rotating gliding arc discharge. Fuel 2016, 176, 78–85. [Google Scholar] [CrossRef]
- Petitpas, G. A comparative study of non-thermal plasma assisted reforming technologies. Int. J. Hydrogen Energ. 2007, 32, 2848–2867. [Google Scholar] [CrossRef]
- Tu, X.; Verheyde, B.; Corthals, S.; Paulussen, S.; Sels, B.F. Effect of packing solid material on characteristics of helium dielectric barrier discharge at atmospheric pressure. Phys. Plasmas 2011, 18, 1–68. [Google Scholar] [CrossRef]
- Saleem, F.; Zhang, K.; Harvey, A. Role of CO2 in the Conversion of Toluene as a Tar Surrogate in a Nonthermal Plasma Dielectric Barrier Discharge Reactor. Energ. Fuel. 2018, 32, 5164–5170. [Google Scholar] [CrossRef]
- Brunauer, S.; Deming, L.S.; Deming, W.E.; Teller, E. On a Theory of the van der Waals Adsorption of Gases. J. Am. Chem. Soc. 1940, 62, 1723–1732. [Google Scholar] [CrossRef]
- Sing, K.S.W. Reporting physisorption data for gas/solid systems with special reference to the determination of surface area and porosity (Recommendations 1984). Pure Appl. Chem. 1985, 57, 603–619. [Google Scholar] [CrossRef]
- Gillot, B.; Buguet, S.; Kester, E. Cation valencies and distribution in the spinels CoxCuyMnzFeuO4+δ (δ≥0) thin films studied by X-ray photoelectron spectroscopy. Thin Solid Films. 1999, 357, 223–231. [Google Scholar] [CrossRef]
- Wang, F.; Deng, J.; Peng, S.; Shen, Y.; Zhang, D. Unraveling the effects of the coordination number of Mn over α-MnO2 catalysts for toluene oxidation. Chem. Eng. J. 2020, 396, 125192. [Google Scholar] [CrossRef]
- Liu, X.; Zhou, J.; Liu, D.; Li, L.; Feng, C. Construction of Z-scheme CuFe2O4/MnO2 photocatalyst and activating peroxymonosulfate for phenol degradation: Synergistic effect, degradation pathways, and mechanism. Environ. Res. 2021, 200, 111736. [Google Scholar] [CrossRef]
- Li, H.; Lu, G.; Dai, Q.; Wang, Y.; Yun, G.; Guo, Y. Efficient low-temperature catalytic combustion of trichloroethylene over flower-like mesoporous Mn-doped CeO2 microspheres. Appl. Catal. B Environ. 2011, 102, 475–483. [Google Scholar] [CrossRef]
- Yang, S.; Yang, H.; Yang, J.; Qi, H.; Tu, X. Three-dimensional hollow urchin α-MnO2 for enhanced catalytic activity towards toluene decomposition in post-plasma catalysis. Chem. Eng. J. 2020, 402, 126154. [Google Scholar] [CrossRef]
- Yang, W.; Peng, Y.; Wang, Y.; Wang, Y.; Li, J. Controllable Redox-induced In-situ Growth of MnO2 over Mn2O3 for Toluene Oxidation: Active Heterostructure Interfaces. Appl. Catal. B Environ. 2020, 278, 119279. [Google Scholar] [CrossRef]
- Chang, T.; Lu, J.; Shen, Z.; Zhang, B.; Morent, R. Post Plasma Catalysis for the Removal of Acetaldehyde Using Mn-Co/HZSM-5 Catalysts. Ind. Eng. Chem. Res. 2019, 58, 14719–14728. [Google Scholar] [CrossRef]
- Verezia, A.M.; Floriano, M.A.; Deganello, G. The Structure of Pumice: An XPS and 27Al MAS NMR Study. Surf. Interface Anal. 1992, 18, 532–538. [Google Scholar]
- Yang, X.; Yu, X.; Jing, M. Defective MnxZr1-xO2 Solid Solution for the Catalytic Oxidation of Toluene: Insights into the Oxygen Vacancy Contribution. ACS Appl. Mat. Inter. 2019, 11, 730–739. [Google Scholar] [CrossRef]
- Gang, L.; Feng, B.; Song, C.; Wang, K.; Song, J. Promoting effect of zirconium doping on Mn/ZSM-5 for the selective catalytic reduction of NO with NH3. Fuel 2013, 107, 217–224. [Google Scholar]
- Li, H.; Wu, Y.; Li, C.; Gong, Y.; Niu, L.; Liu, X. Design of Pt/t-ZrO2/g-C3N4 efficient photocatalyst for the hydrogen evolution reaction. Appl. Catal. B Environ. 2019, 251, 305–312. [Google Scholar] [CrossRef]
Figure 1.
(a) Conversion, (b) CO2 selectivity, and (c) energy efficiency of various VOCs on catalysts at the initial concentration of 2000 ppm and SIE of 9 kJ/L.
Figure 1.
(a) Conversion, (b) CO2 selectivity, and (c) energy efficiency of various VOCs on catalysts at the initial concentration of 2000 ppm and SIE of 9 kJ/L.
Figure 2.
Effect of initial concentration on (a) conversion, (b) CO2 selectivity, and (c) energy efficiency by sample Mn/ZSM-5-N.
Figure 2.
Effect of initial concentration on (a) conversion, (b) CO2 selectivity, and (c) energy efficiency by sample Mn/ZSM-5-N.
Figure 3.
Influence of SIE on degradation indexes of (a) methanol (b) acetone, and (c) toluene by Mn/ZSM-5-N catalyst.
Figure 3.
Influence of SIE on degradation indexes of (a) methanol (b) acetone, and (c) toluene by Mn/ZSM-5-N catalyst.

Figure 4.
XRD patterns of Mn/ZSM-5 and modified catalysts.

Figure 5.
N2 isotherm adsorption plots and Pore size distribution plots of catalysts: (a) Mn/ZSM-5, (b) Mn/ZSM-5-S, (c) Mn/ZSM-5-D, and (d) Mn/ZSM-5-N.
Figure 5.
N2 isotherm adsorption plots and Pore size distribution plots of catalysts: (a) Mn/ZSM-5, (b) Mn/ZSM-5-S, (c) Mn/ZSM-5-D, and (d) Mn/ZSM-5-N.
Figure 6.
SEM images of samples: (a) Mn/ZSM-5, (b) Mn/ZSM5-S, (c) Mn/ZSM-5-D, and (d) Mn/ZSM-5-N.
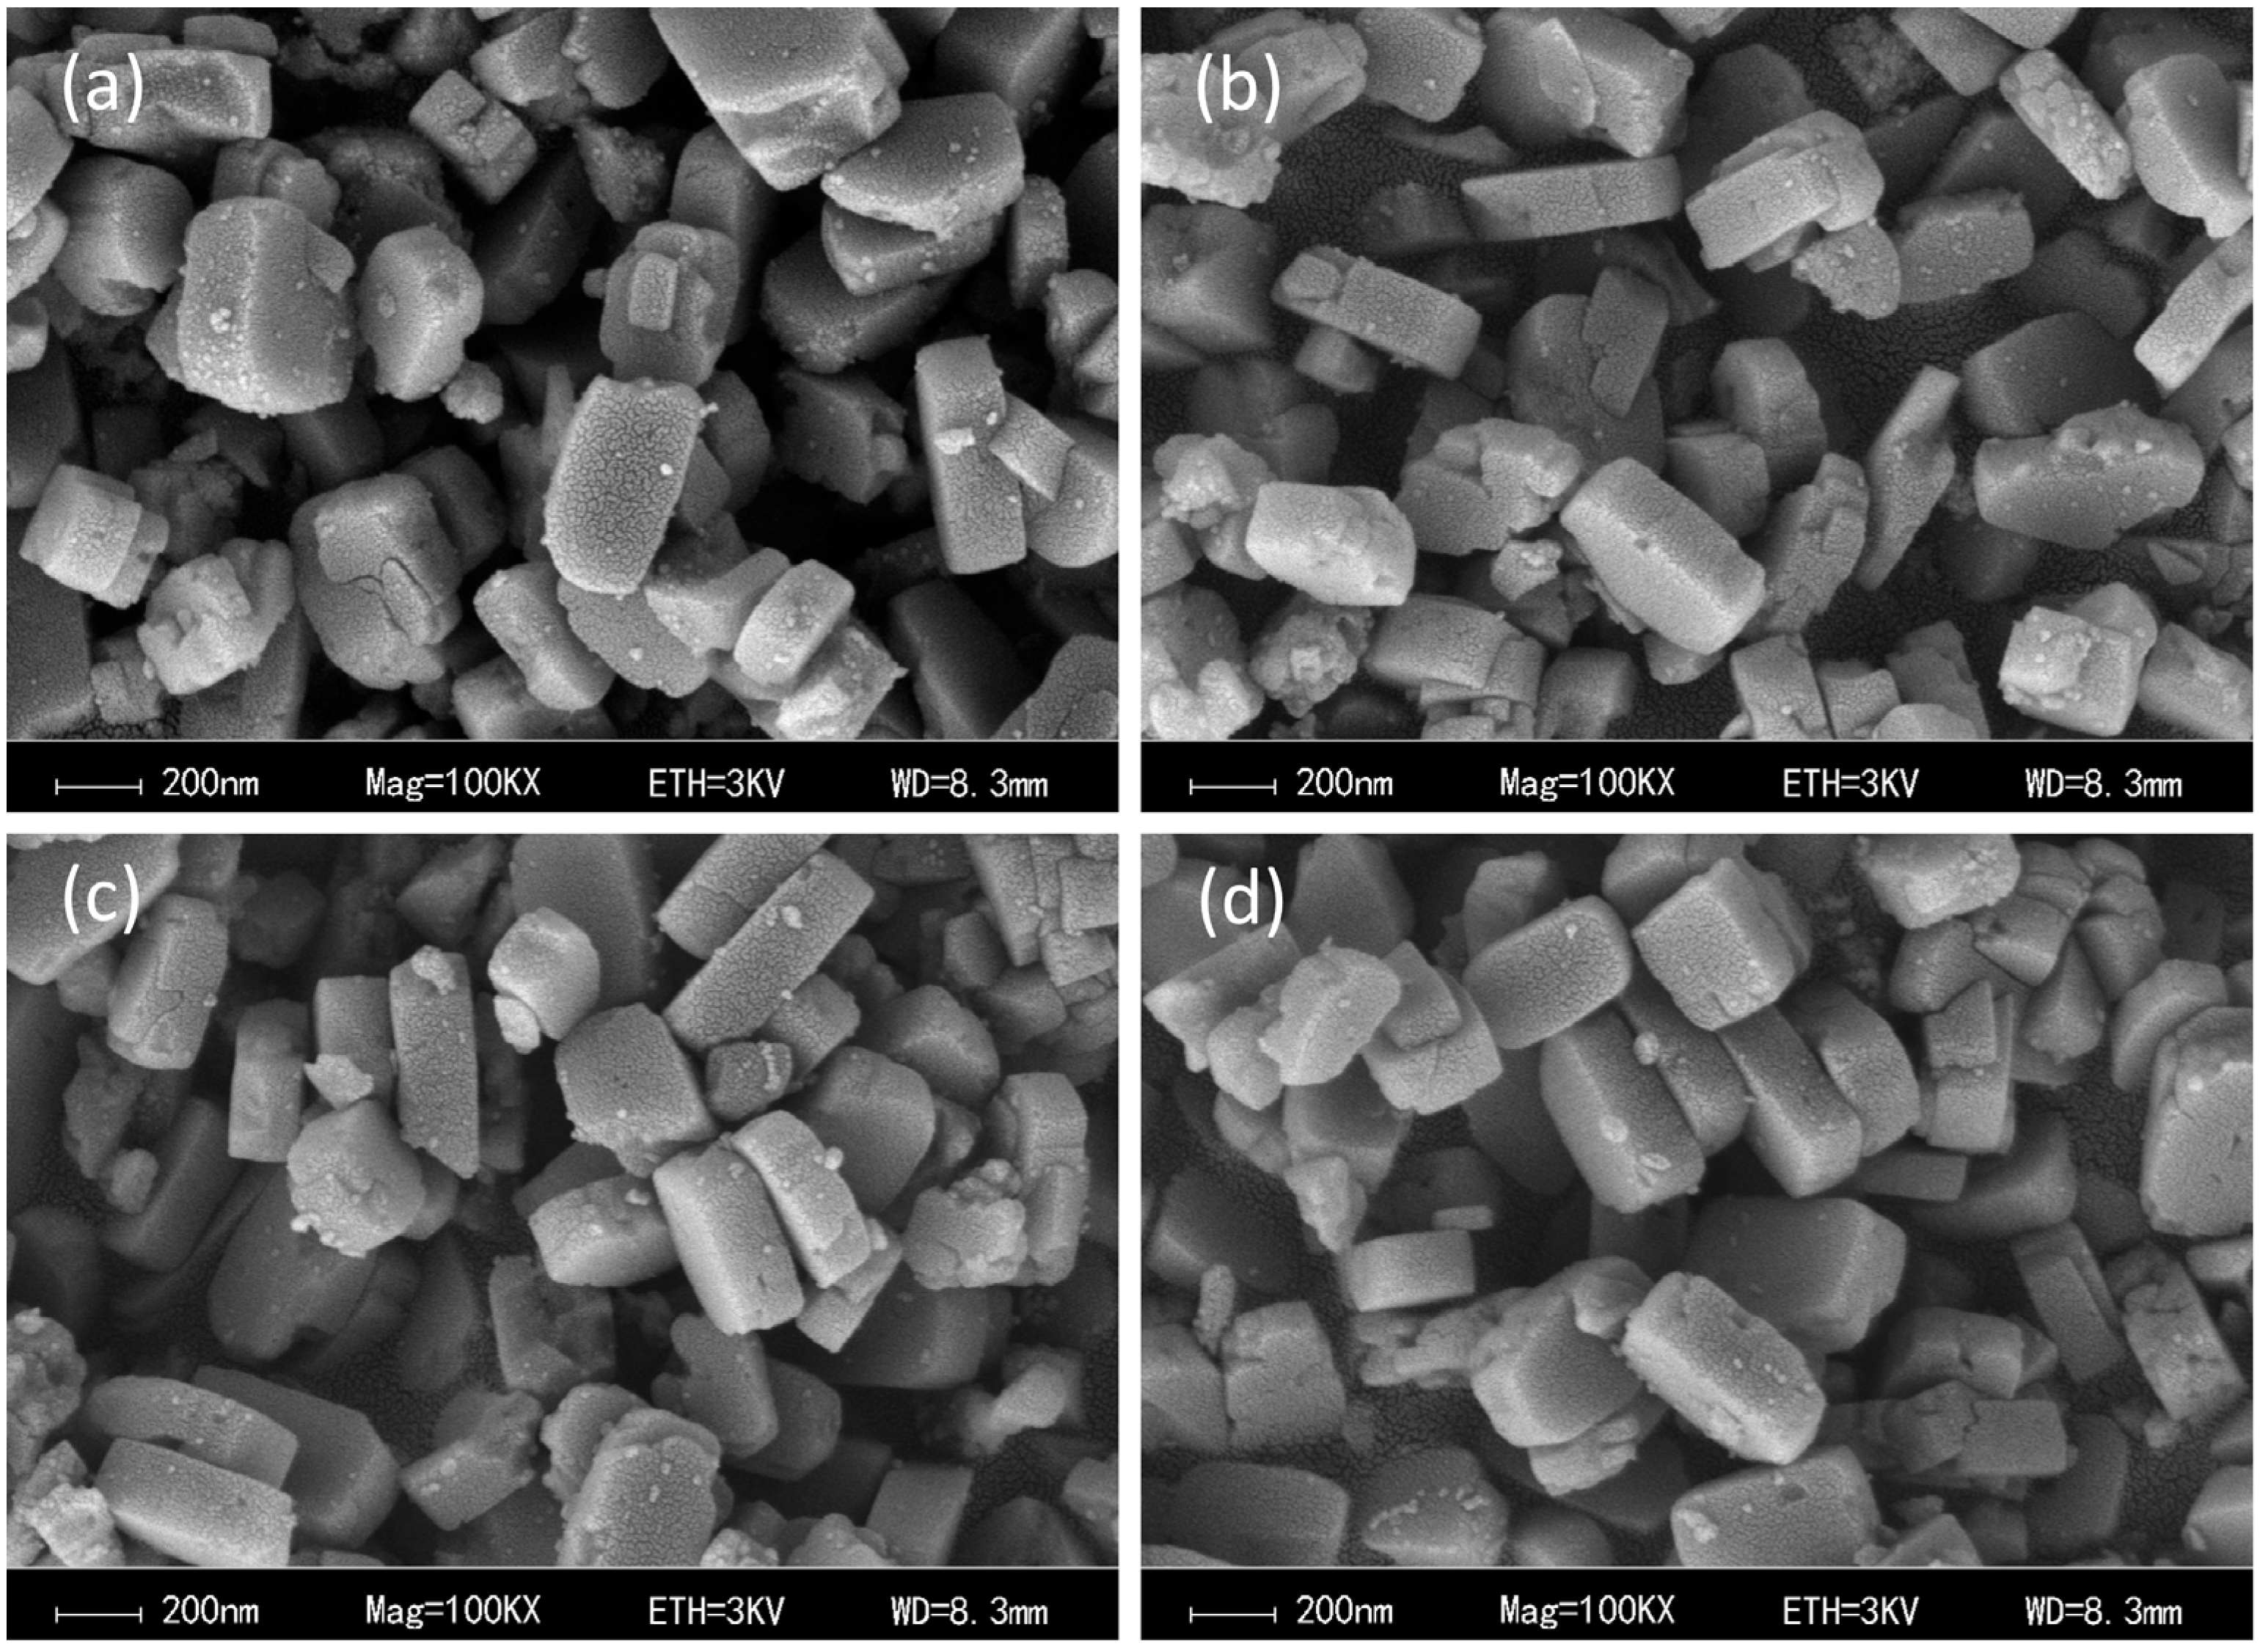
Figure 7.
(a) SEM images, (b) quantitative analyses, and EDS elemental mappings of (c) Si, (d) Al, (e) O, (f) Mn over Mn/ZSM-5-N catalyst.
Figure 7.
(a) SEM images, (b) quantitative analyses, and EDS elemental mappings of (c) Si, (d) Al, (e) O, (f) Mn over Mn/ZSM-5-N catalyst.

Figure 8.
(a) Mn 2p, (b) Mn 3s, and (c) O 1s photoemission features from XPS results of Mn/ZSM-5 and modified catalysts, (d) Raman spectra of the Mn/ZSM-5 and Mn/ZSM-5-D.
Figure 8.
(a) Mn 2p, (b) Mn 3s, and (c) O 1s photoemission features from XPS results of Mn/ZSM-5 and modified catalysts, (d) Raman spectra of the Mn/ZSM-5 and Mn/ZSM-5-D.
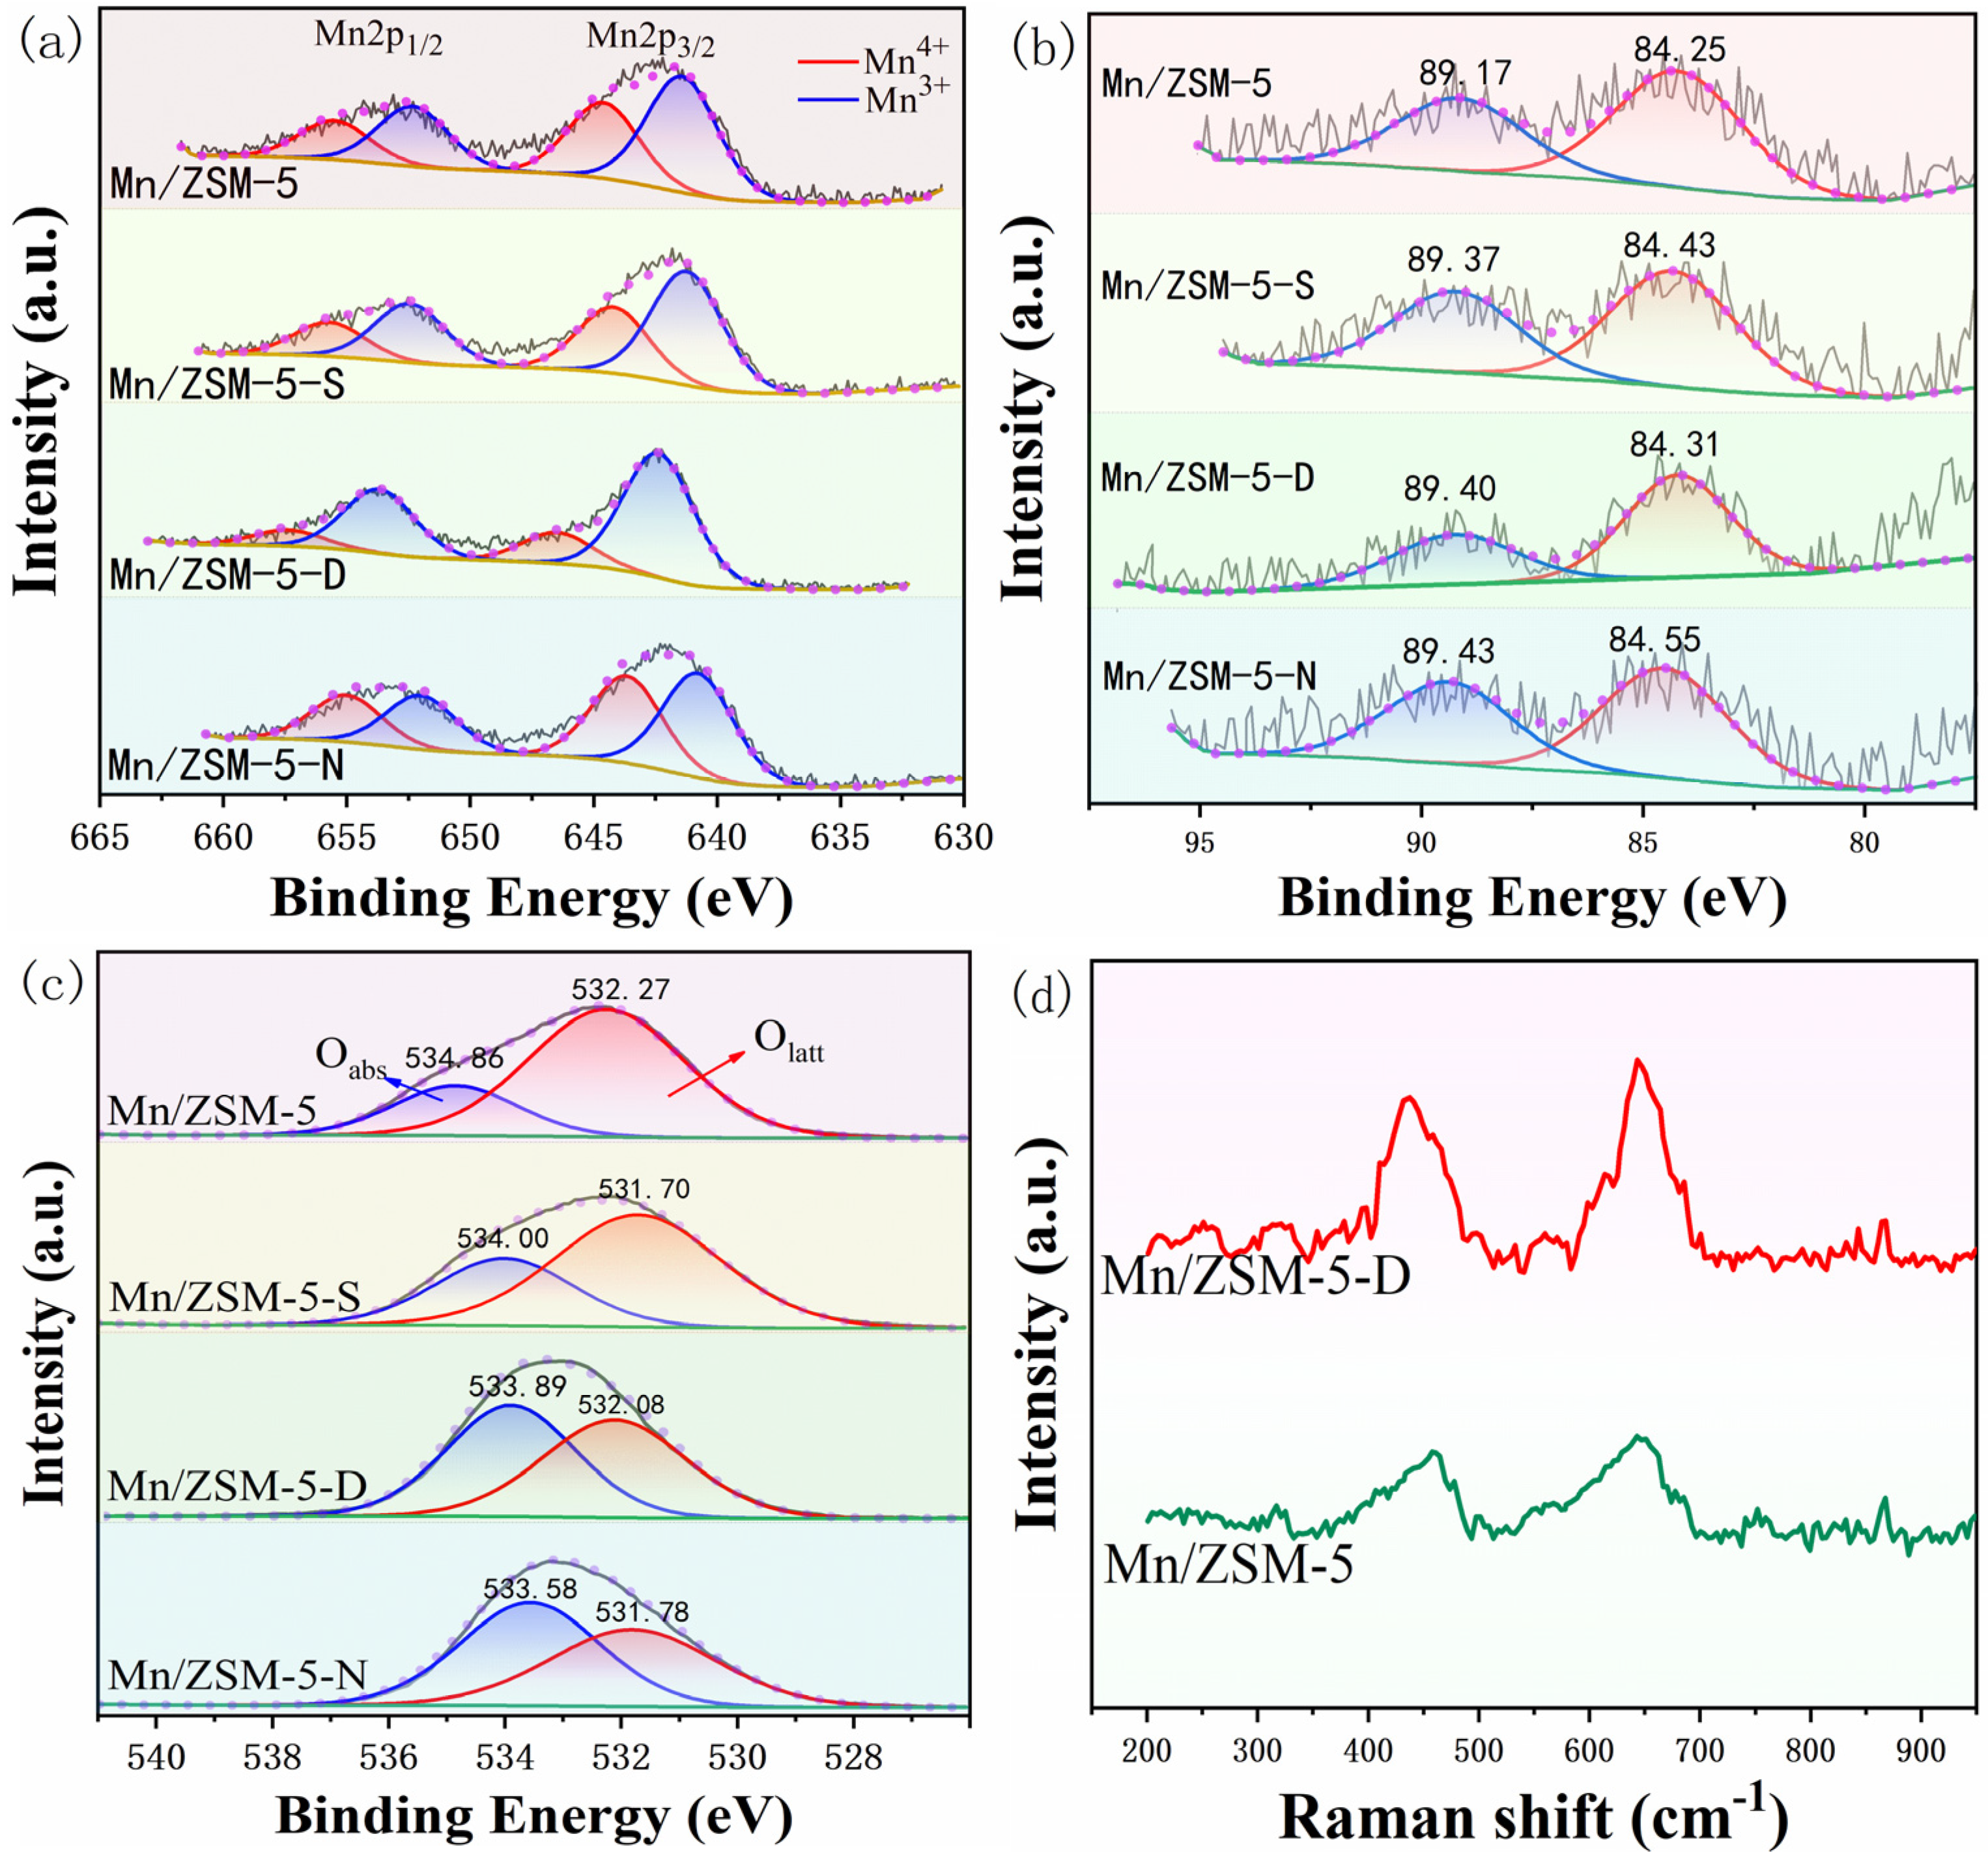
Figure 9.
H2-TPR curves of catalysts.
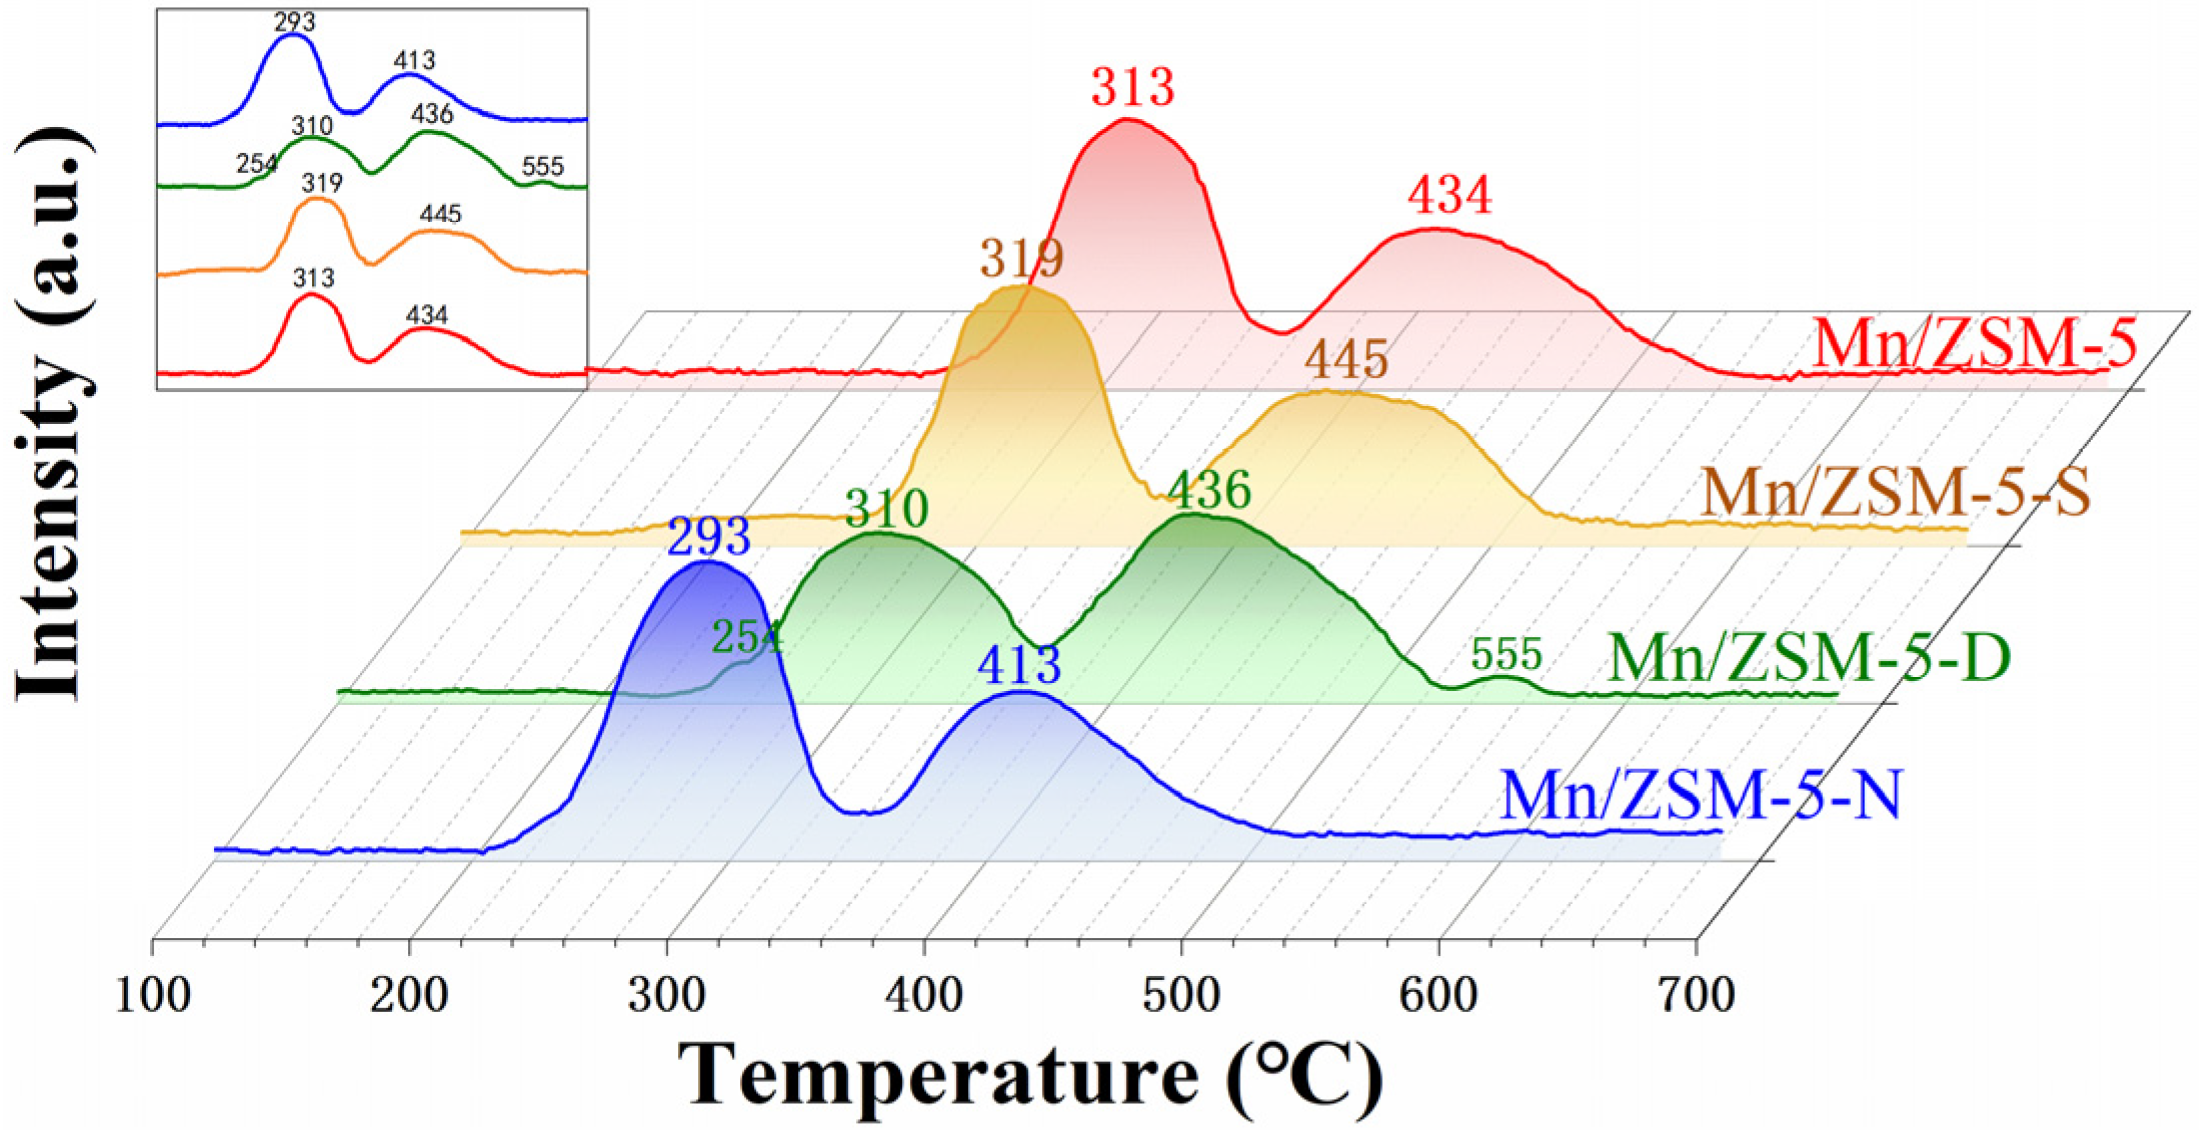
Figure 10.
(a) Channel view and (b) side view of the ball and stick cluster model structure shown in the wire frame representation ZSM-5 cell; the partial atomic distances of the (c) original catalyst and (d) catalyst with the oxygen vacancy (White, red, yellow, pink and dark grey circles denote H, O, Si, Al and Mn atoms, respectively).

Figure 11.
Schematic diagram of intrinsic adsorption before modification and optimized adsorption after introducing oxygen defects for (a) methanol, (b) acetone, and (c) toluene. (Dark gray, white, red, yellow, pink, and purple circles denote C, H, O, Si, Al, and Mn atoms, respectively).
Figure 11.
Schematic diagram of intrinsic adsorption before modification and optimized adsorption after introducing oxygen defects for (a) methanol, (b) acetone, and (c) toluene. (Dark gray, white, red, yellow, pink, and purple circles denote C, H, O, Si, Al, and Mn atoms, respectively).

Figure 12.
Continuous stability test of (a) VOCs conversion and (b) CO2 selectivity on Mn/ZSM-5-N during 72 h at the initial concentration of 3000 ppm and SIE of 9 kJ/L.
Figure 12.
Continuous stability test of (a) VOCs conversion and (b) CO2 selectivity on Mn/ZSM-5-N during 72 h at the initial concentration of 3000 ppm and SIE of 9 kJ/L.
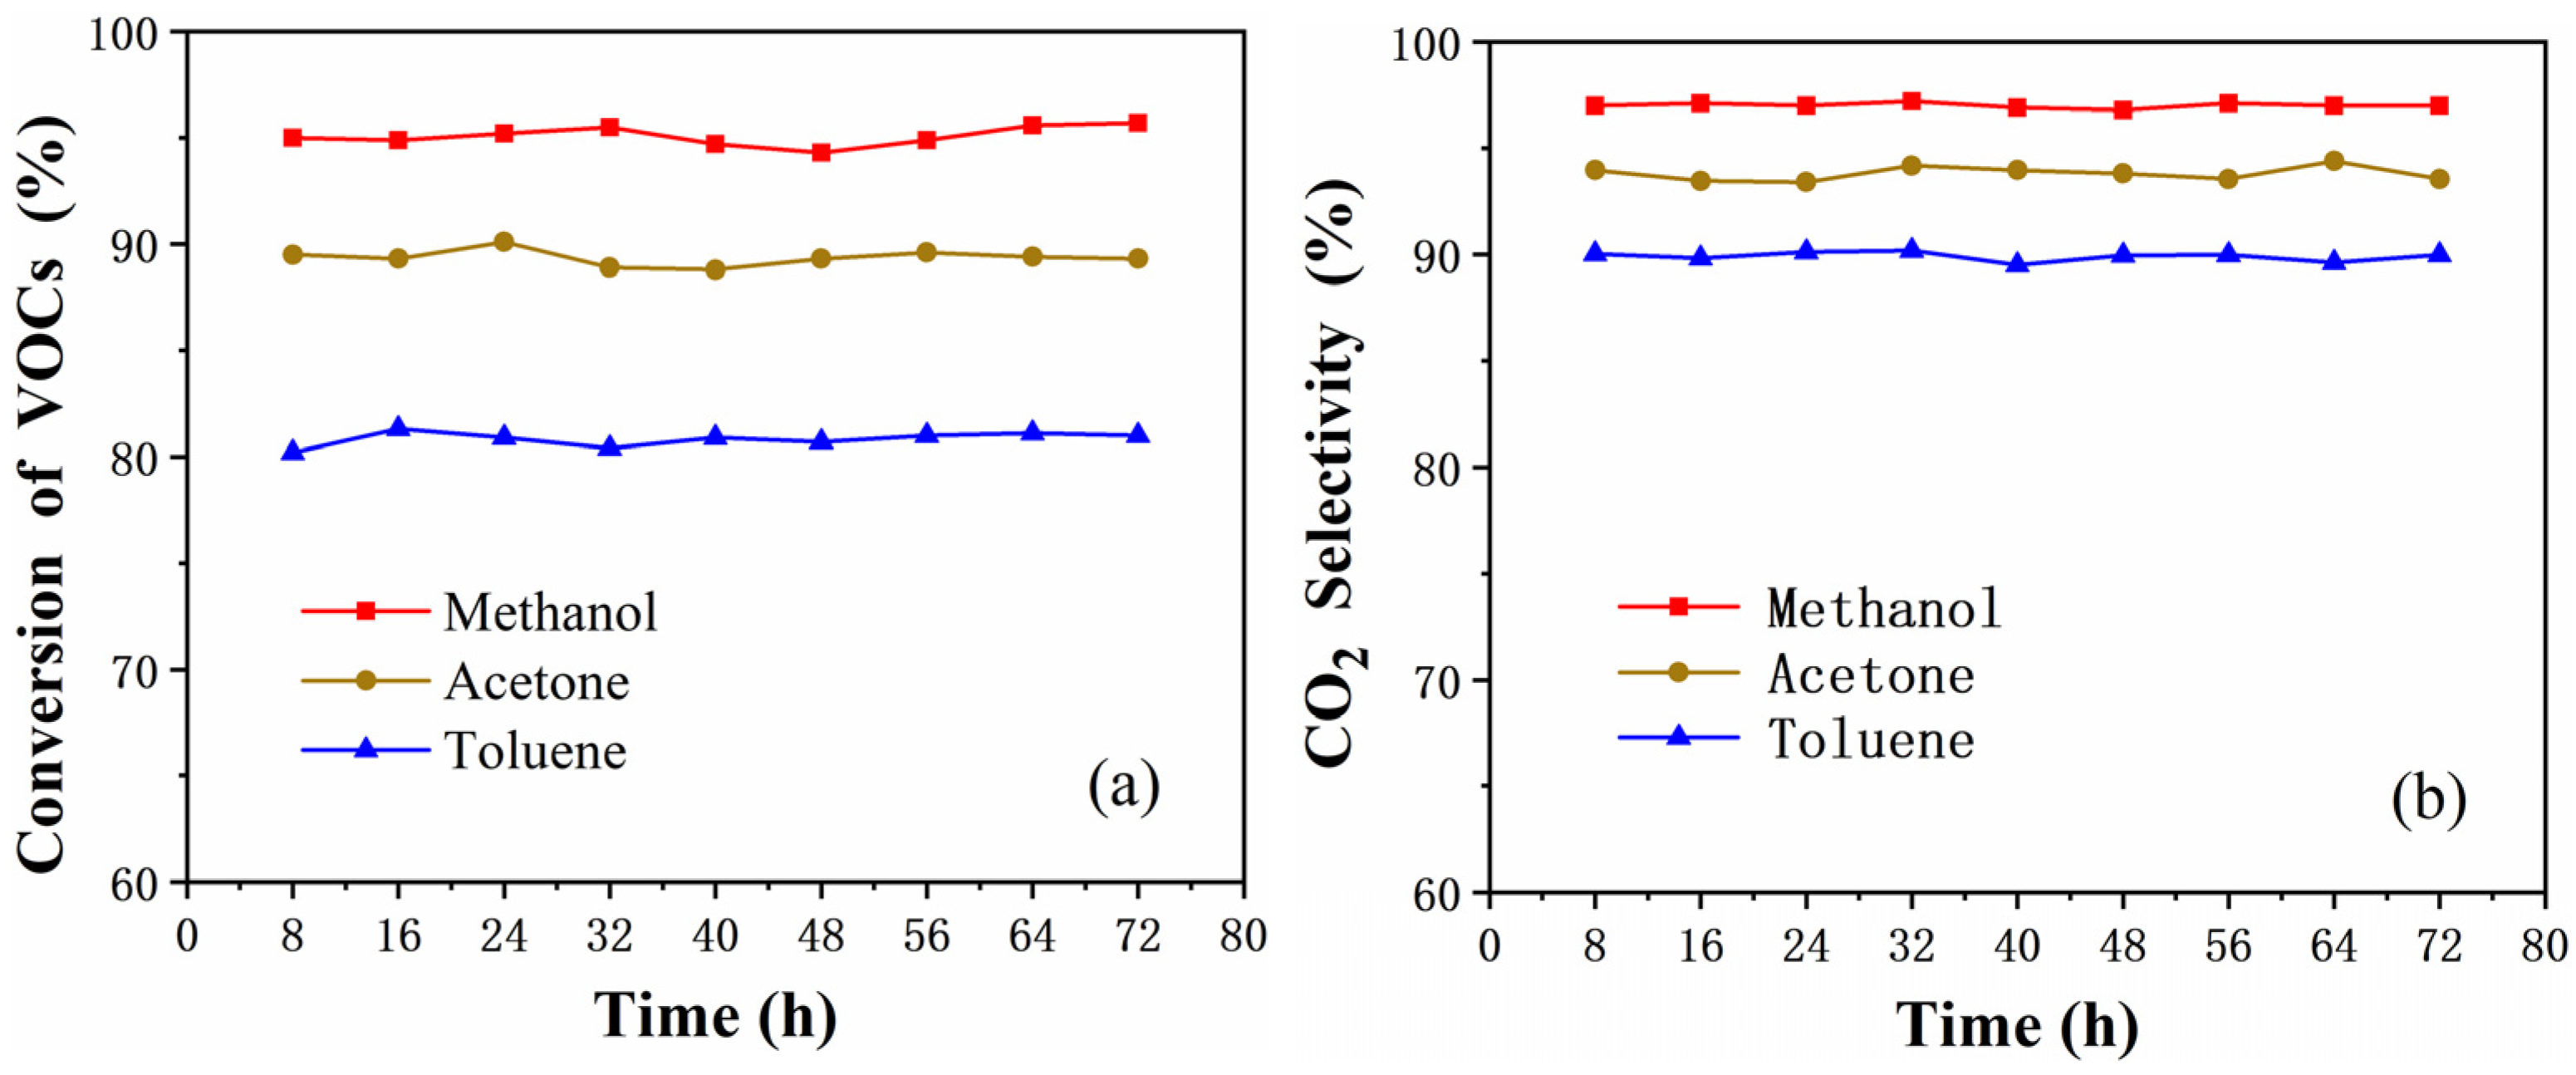
Figure 13.
(a) Mn 3s, (b) Mn 2p, (c) O 1s photoemission features from XPS results of used Mn/ZSM-5-N, (d) XRD pattern, (e) SEM images and N2 adsorption–desorption plot, (f) Mn EDS mapping of used-Mn/ZSM-5-N.
Figure 13.
(a) Mn 3s, (b) Mn 2p, (c) O 1s photoemission features from XPS results of used Mn/ZSM-5-N, (d) XRD pattern, (e) SEM images and N2 adsorption–desorption plot, (f) Mn EDS mapping of used-Mn/ZSM-5-N.


Table 1.
Textural properties of catalysts.
| Catalysts | SBET a (m2g−1) | SMicro b (m2g−1) | SExter b (m2g−1) | Vp c (cm3g−1) | VMicro b (cm3g−1) | VMeso d (cm3g−1) | DP e (nm) |
|---|---|---|---|---|---|---|---|
| Mn/ZSM-5 | 424 | 268 | 156 | 0.254 | 0.111 | 0.143 | 2.39 |
| Mn/ZSM-5-S | 363 | 254 | 109 | 0.218 | 0.109 | 0.109 | 2.41 |
| Mn/ZSM-5-D | 370 | 256 | 114 | 0.231 | 0.110 | 0.121 | 2.39 |
| Mn/ZSM-5-N | 402 | 261 | 141 | 0.247 | 0.111 | 0.136 | 2.40 |
a surface area from Brunner-Emmett-Teller (BET) method; b micropore area, external surface area, and micropore volume based on the t-plot method; c adsorbed total volume at P/P0 = 0.993; d VMeso = VP − VMicro; e Determined by desorption branch according to Barrett-Joyner-Halenda (BJH) method.
Table 2.
Atomic ratio of Mn ions and oxygen species.
| Catalysts | Mn3+ (%) | Mn4+ (%) | ΔE (eV) | AOS of Mn | Ovac (%) | Olat (%) |
|---|---|---|---|---|---|---|
| Mn/ZSM-5 | 60.5 | 39.5 | 4.92 | 3.41 | 23.9 | 76.1 |
| Mn/ZSM-5-S | 63.3 | 36.7 | 4.94 | 3.39 | 33.1 | 66.9 |
| Mn/ZSM-5-D | 79.9 | 20.1 | 5.09 | 3.22 | 51.3 | 48.7 |
| Mn/ZSM-5-N | 54.5 | 45.5 | 4.87 | 3.47 | 53.7 | 46.3 |
Publisher’s Note: MDPI stays neutral with regard to jurisdictional claims in published maps and institutional affiliations. |
© 2022 by the authors. Licensee MDPI, Basel, Switzerland. This article is an open access article distributed under the terms and conditions of the Creative Commons Attribution (CC BY) license (https://creativecommons.org/licenses/by/4.0/).
Share and Cite
MDPI and ACS Style
Liu, S.; Zhou, J.; Liu, D.; Du, K. Modified Mn/ZSM-5 for Non-Thermal Plasma Mineralization of VOCs and DFT Simulation Using a Novel Y-Type ZSM-5 Model. Catalysts 2022, 12, 906. https://doi.org/10.3390/catal12080906
AMA Style
Liu S, Zhou J, Liu D, Du K. Modified Mn/ZSM-5 for Non-Thermal Plasma Mineralization of VOCs and DFT Simulation Using a Novel Y-Type ZSM-5 Model. Catalysts. 2022; 12(8):906. https://doi.org/10.3390/catal12080906
Chicago/Turabian StyleLiu, Su, Jiabin Zhou, Dan Liu, and Ke Du. 2022. "Modified Mn/ZSM-5 for Non-Thermal Plasma Mineralization of VOCs and DFT Simulation Using a Novel Y-Type ZSM-5 Model" Catalysts 12, no. 8: 906. https://doi.org/10.3390/catal12080906
Note that from the first issue of 2016, this journal uses article numbers instead of page numbers. See further details here.