Article

Effect of Morphology-Dependent Oxygen Vacancies of CeO2 on the Catalytic Oxidation of Toluene

1
Key Laboratory of Functional Inorganic Material Chemistry, Ministry of Education of the People’s Republic of China, Heilongjiang University, Harbin 150080, China
2
Institute of Chemical Sciences, University of Peshawar, Peshawar 25120, Pakistan
*
Authors to whom correspondence should be addressed.
Catalysts 2022, 12(9), 1034; https://doi.org/10.3390/catal12091034
Submission received: 15 August 2022 / Revised: 5 September 2022 / Accepted: 8 September 2022 / Published: 11 September 2022
(This article belongs to the Special Issue Exclusive Papers in Environmentally Friendly Catalysis in China)

Abstract

:
Catalytic oxidation is regarded as an effective, economical, and practical approach to remove volatile organic compounds such as important air pollutants. CeO2 catalysts with different morphologies exhibit different oxygen vacancies content, which plays a vital role in oxidation reaction. Herein, three distinct morphologies of CeO2 i.e., shuttle (CeO2 (S)), nanorod (CeO2 (R)), and nanoparticle (CeO2 (P)), were successfully fabricated by the SEM and TEM results, and investigated for toluene catalytic oxidation. The various characterizations showed that the CeO2 (S) catalyst exhibited a larger surface area along with higher surface oxygen vacancies in contrast to CeO2 (R) and CeO2 (P), which is responsible for its excellent toluene catalytic oxidation. The 90% toluene conversion temperature at 225 °C over CeO2 (S) was less than that over CeO2 (R) (283 °C) and CeO2 (P) (360 °C). In addition, CeO2 (S) showed a greater reaction rate (14.37 × 10⁻² μmol∙g−1∙s−1), TOFov (4.8 × 10⁻⁴∙s−1) at 190 °C and lower activation energy value (67.4 kJ/mol). Furthermore, the CeO2 (S) also displayed good recyclability, long-term activity stability, and good tolerance to water. As a result, CeO2 (S) is considered a good candidate to remove toluene.

1. Introduction

VOCs (volatile organic compounds) released from different industries as well as transportations producing photochemical haze, ground-level ozone, photochemical smog and organic aerosol precursors are polluting the air [1,2]. Toluene, used in different industries, is creating a severe danger to both the atmosphere and human life [3]. Today, toluene abatement is the utmost priority due to its high emission and stable nature. Therefore, finding an efficient method to eliminate toluene is very important. Among various methods to remove toluene [4], catalytic oxidation is regarded as an effective, economical, and practical approach [4]. In catalytic oxidation of toluene, catalysts made of precious and non-precious metals have both been broadly examined. Generally, catalysts made of precious metals are chosen because they are highly active in low-temperature VOCs abatement [5]. However, the expensive nature, aggregation and easy sintering limits the practical applications of precious metal-based catalysts [6]. Therefore, catalysts made of non-precious metals are preferred due to their low cost and excellent VOCs oxidation activity [7,8].
Among different non-precious metal catalysts, CeO2 is considered as an effective catalyst due to its excellent reducibility between Ce3+/Ce4+, oxygen storage capacity, and rich oxygen vacancies. [9,10]. Distinct morphologies of CeO2 offer different catalytic activities, indicating a good relation between morphology and catalytic activity [11]. The different morphologies of CeO2 may affect the oxygen storage capacity, reducibility, and oxygen vacancy formation [11]. The previous studies [11,12,13,14,15] revealed that different morphologies of CeO2 catalysts were beneficial for oxidation performance by providing new physiochemical properties, for instance: high Ce3+ concentrations, reducibility and oxygen vacancies, etc. For example, between CeO2 nanoparticles, nanocubes and nanorods, CeO2 nanorods showed the best activity because of abundant oxygen vacancies and higher reducibility [12]. Similarly, the effect of CeO2 nanorods, nanocubes, and hollow sphere morphologies investigation was also conducted on the toluene catalytic oxidation [13], and the CeO2 with hollow sphere morphology showed excellent catalytic oxidation performance owing to the bigger surface area, higher Ce3+ content, and higher oxygen vacancies on its surface. In addition, CeO2 hierarchical microspheres exhibited supreme toluene oxidation activity, because of the higher surface area and plentiful oxygen vacancies compared to non-hierarchical CeO2 microspheres [14]. In the same way, ultrasonic-assisted CeO2 nanorods were fabricated for the abatement of toluene through oxidation. It was concluded that CeO2 with fine shape nanorods showed higher oxidation activity and that critical factors for the formation of CeO2 nanorods are sodium hydroxide concentration, cerium precursors, and ultrasonic employments [15]. Thus, it is essential and important to develop a CeO2 catalyst with distinct morphologies and investigate these morphologies for oxidation of toluene.
Herein, three CeO2 distinct morphology (shuttle, nanorod, and nanoparticle) catalysts were hydrothermally synthesized. The XRD (X-ray diffraction), BET (Brunauer-Emmett-Teller), SEM (scanning electron microscopy) and TEM (transmission electron microscopy) were utilized to examine the crystallinity, surface area, and morphologies of three CeO2 catalysts. Moreover, surface oxygen vacancies concentration was determined by Raman, XPS (X-ray photoelectron spectroscopy), hydrogen reduction and oxygen desorption temperature-programmed (H2-TPR & O2-TPD) analysis. The characterization findings were used to explore the correlation between toluene catalytic oxidation and CeO2 morphologies.

2. Result and Discussion

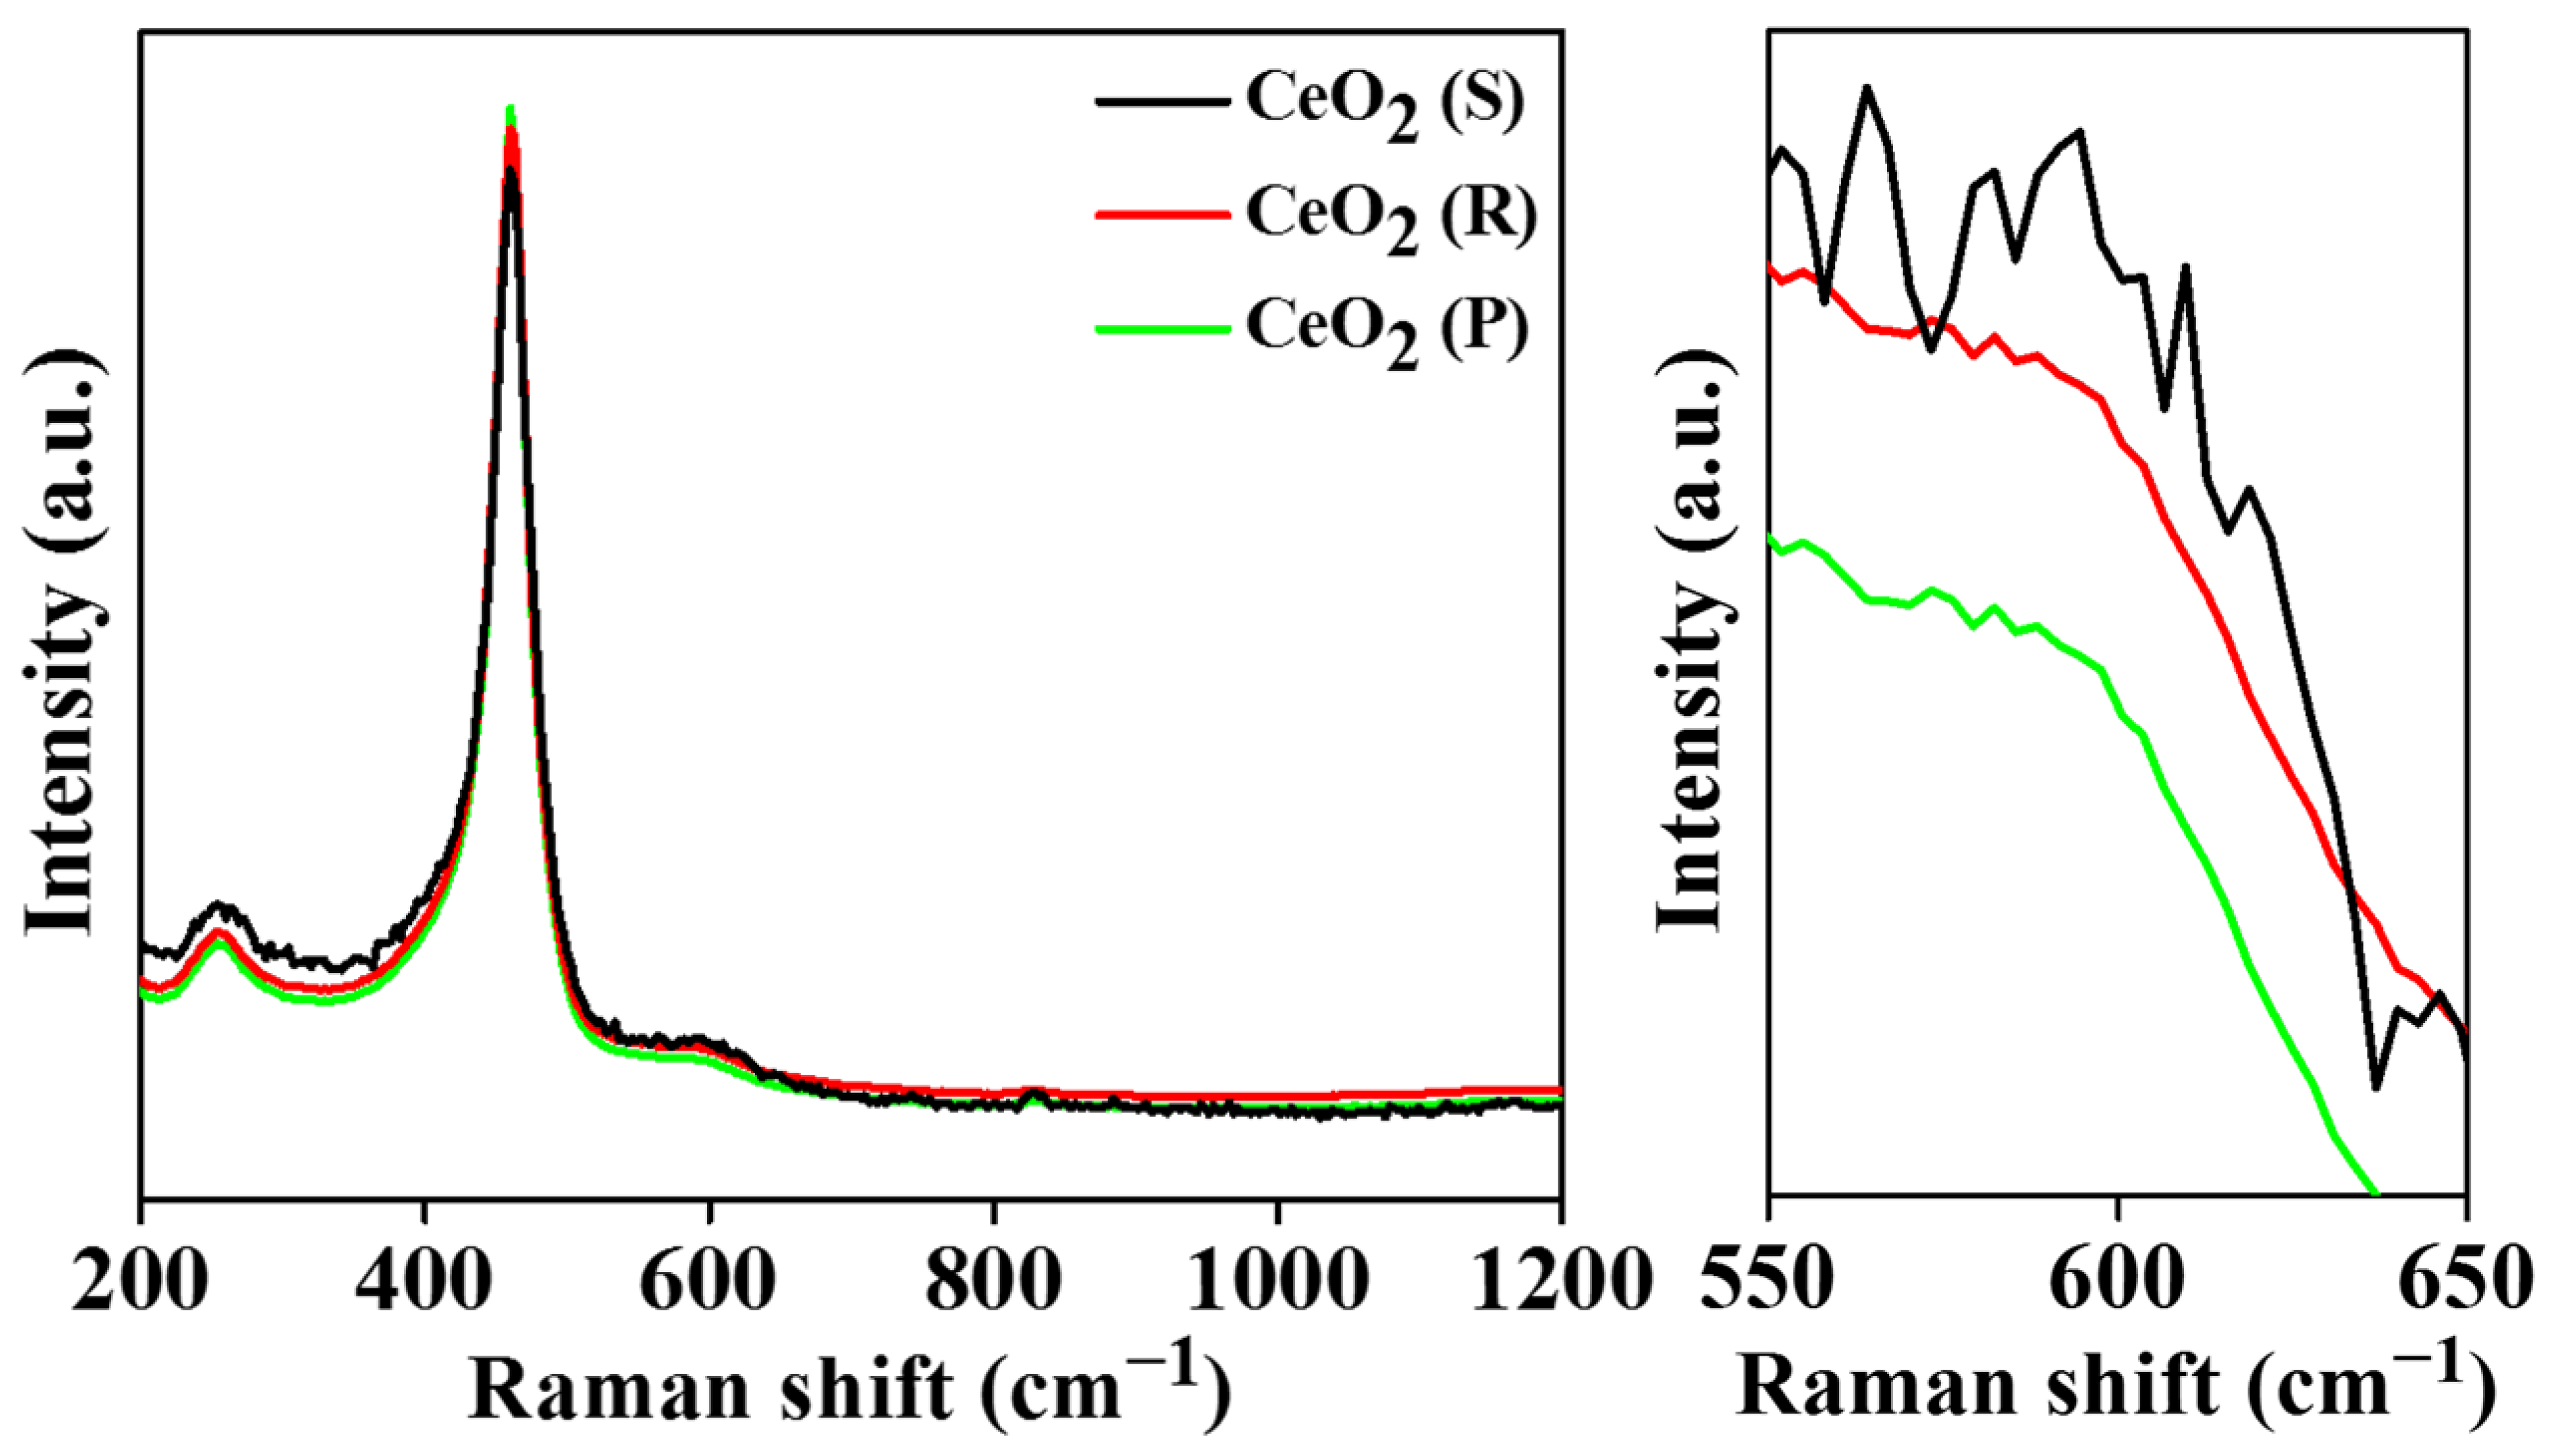
2.1. Bulk Structure Analysis

The structure of the crystal and crystallite size of all three samples were tested thru XRD. As displayed in Figure 1a, all three catalysts exhibit well-defined diffraction planes at 2θ = 28, 33, 47, 56, 59, 69, 77 and 79°, that were attributed to (111), (200), (220), (311), (222), (400), (331), and (420) planes, correspondingly (PDF # 34-0394). The diffraction planes of CeO2 (S) are far broader and weaker as compared to CeO2 (R) and CeO2 (P), suggesting that the lattice is more distorted in CeO2 (S) [16,17]. The crystallite sizes of all three catalysts were measured based on the most prominent plane (111) with the help of the Scherrer formula. The crystal size of CeO2 (S) (9 nm) is less compared to CeO2 (R) (11 nm) and CeO2 (P) (12 nm), listed in Table 1. To evaluate the textural properties (surface area), the isotherms of N2 adsorption–desorption were assessed (Figure 1b). Each catalyst displays isotherms of type IV with definite H3 type hysteresis loops. The pore size distribution (inset of Figure 1b) shows the presence of a number of nanopores (2–5 nm) in CeO2 (S), suggesting its high surface porosity, which is due to loss of polymer molecules and the conversion process into CeO2. The determined surface areas for CeO2 (S), CeO2 (R), and CeO2 (P) are 116, 79 and 60 m2∙g−1, respectively, and the pore volumes are 0.54, 0.49 and 0.09 cm3∙g−1, correspondingly (Table 1), demonstrating that CeO2 (S) has a much higher surface area.
The three CeO2 catalyst structures were probed by using Raman spectroscopy. As displayed in Figure 2, these catalysts show three bands at 256, 461, and 600 cm−1. The band at 256 cm−1 is allocated to CeO2 second-order transverse acoustic (2TO) mode, the strong band at 461 cm−1 belongs to the F2g triply degenerate mode, and the defect-induced (D) band detected at 600 cm−1 is linked with the generation of oxygen vacancies due to Ce3+ presence in CeO2 [18,19,20,21]. The CeO2 (S), CeO2 (R), and CeO2 (P) oxygen vacancies estimation can be interpreted by integrating the band area ratio (A600/A461) of 600 cm−1 to 461 cm−1 [14]. CeO2 (S) has a higher A600/A461 ratio (0.62) compared to CeO2 (R) (0.23), and CeO2 (P) (0.16), suggesting it has more oxygen vacancies than CeO2 (R) and CeO2 (P) (Table 1).

2.2. SEM and TEM Analysis

The catalyst morphologies were analyzed through SEM and TEM (Figure 3). The SEM image (Figure 3a,b) of CeO2 (S) exhibits shuttle-like morphology that is evenly distributed with 1.2 μm average diameter and 6.2 μm average length. The TEM images (Figure S1) indicate that the shuttle-like morphology CeO2 (S) comprises various nanorods which are orientationally attached, resulting in the formation of shuttle morphology; dense nanopores in the orientationally attached nanorods can also be observed (Figure S1b). For the CeO2 (R) sample (Figure 3c,d)), nanorod morphology is observed with 7.7 and 83 nm average diameter and length, respectively. Figure 3e,f) displays the CeO2 (P) nanoparticle morphology with an average particle size of 12 nm. These findings suggest the successful formation of different morphologies derived from different preparation methods. Furthermore, the HRTEM image of CeO2 (S), CeO2 (R), and CeO2 (P), shown in Figure 3h and Figure S2, exposes (111), (200) and (220) crystal planes with 0.31, 0.27 and 0.19 nm interplanar crystal spacing of CeO2. Besides, numerous crystal defects and distortions exist in CeO2 (S) and are marked with a yellow rectangle and white circle (Figure 3h), respectively. This also indicates that there is a great number of surface oxygen vacancies in CeO2 (S) [14,22,23].

2.3. H2-TPR and O2-TPD Analysis
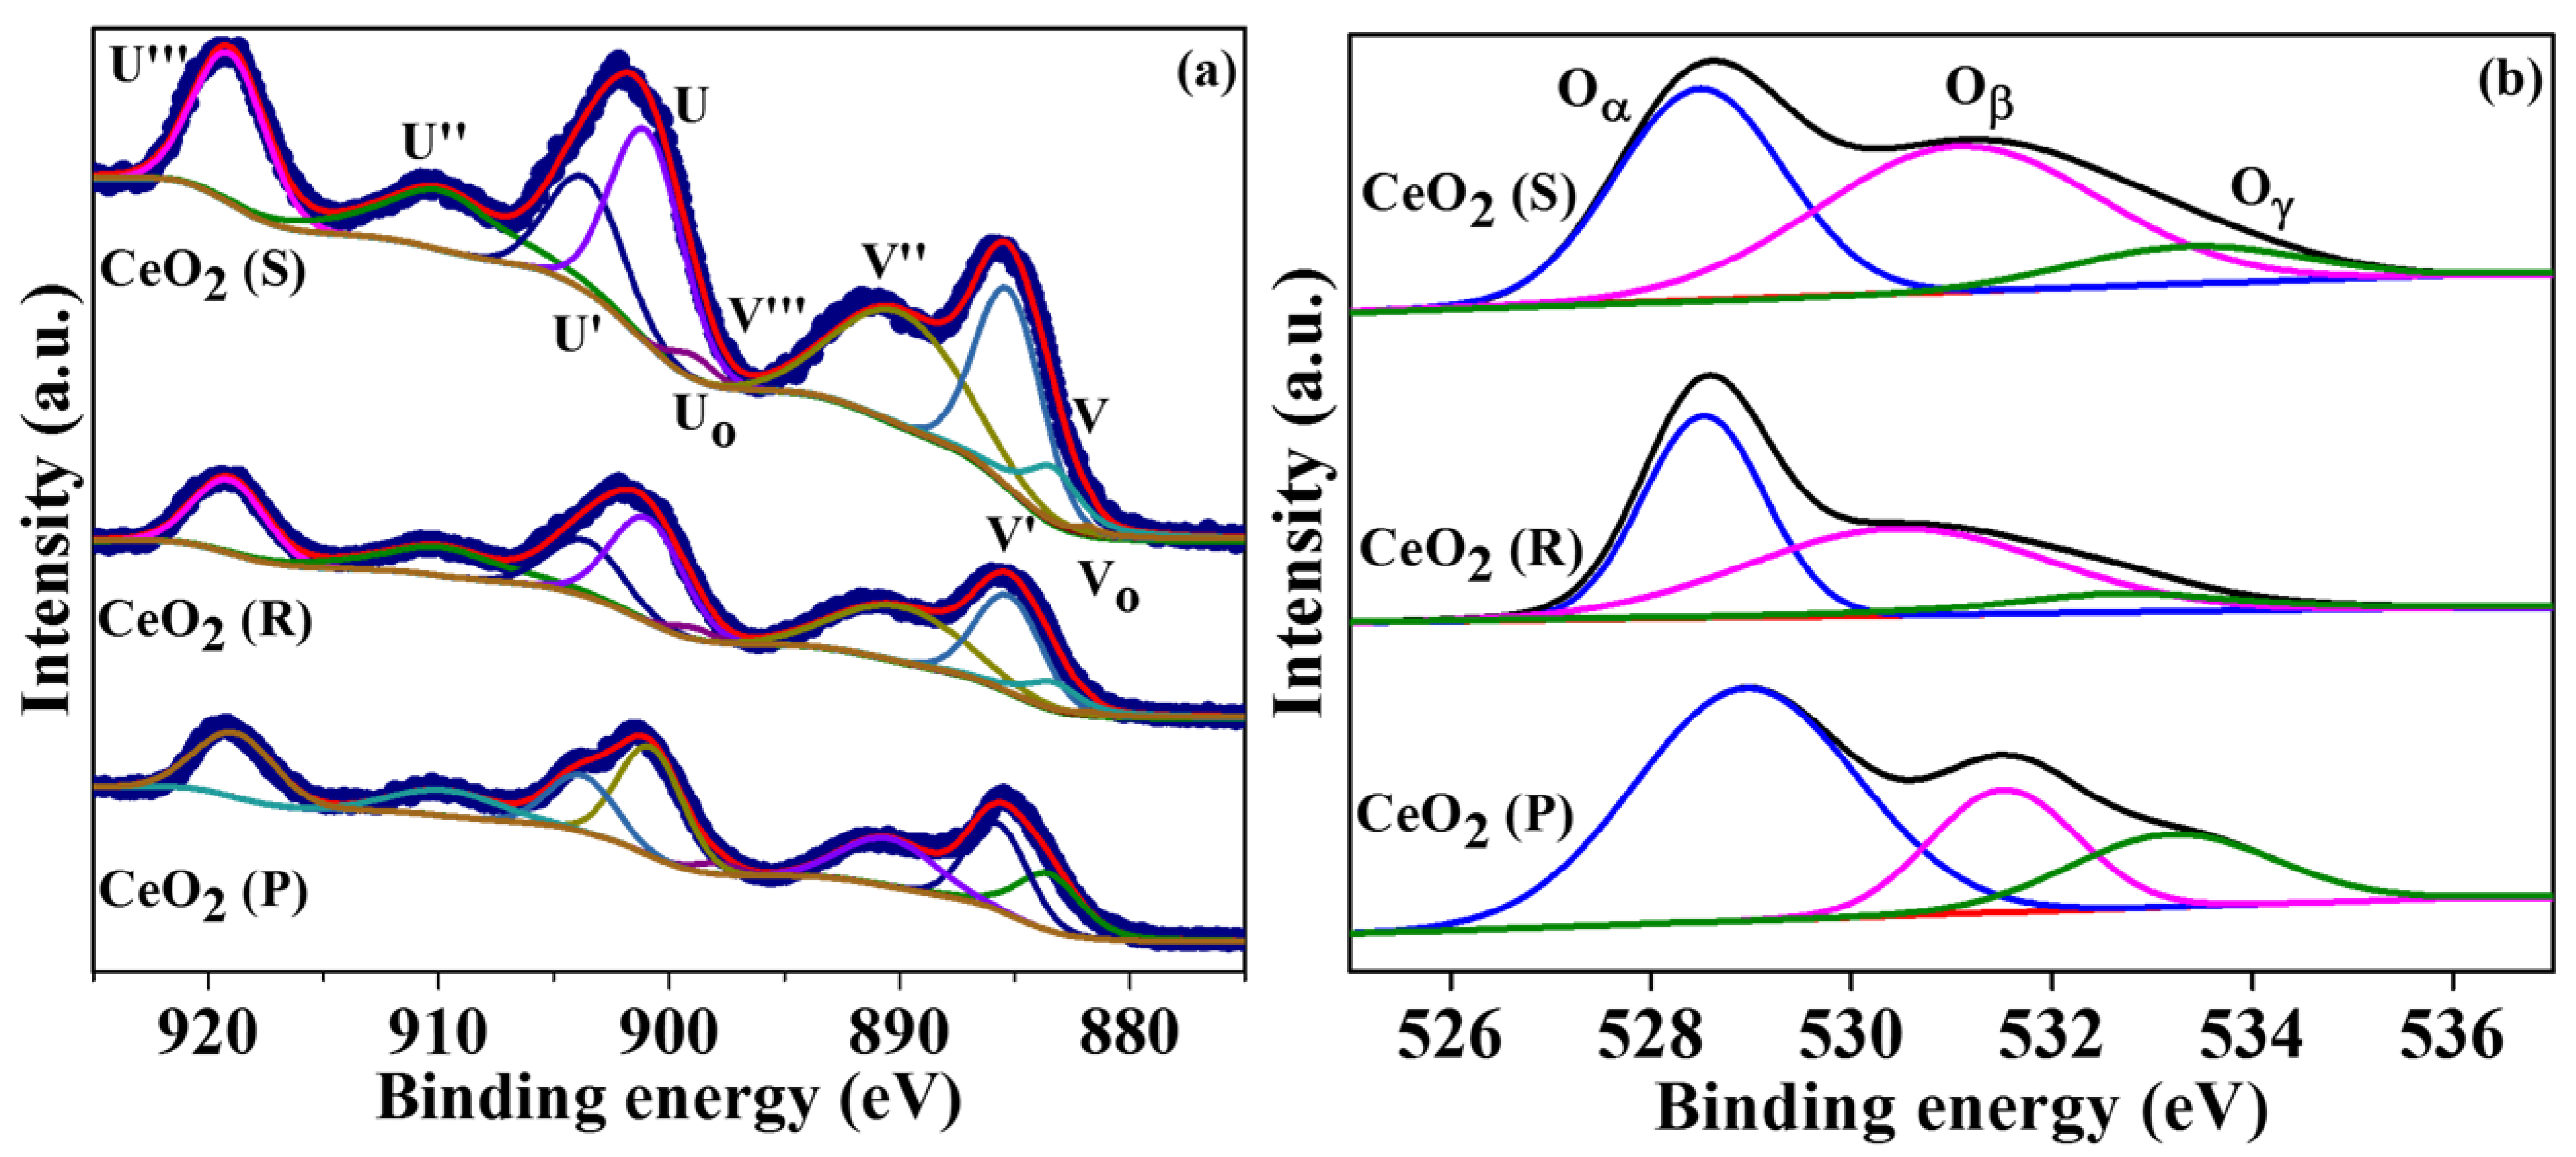
H2-TPR was used to examine the CeO2 (S), CeO2 (R), and CeO2 (P) reducibility. As presented in Figure 4a, three distinct morphology catalysts show two temperature reduction peaks at regions below and above 550 °C designated as regions I and II, which are credited to species of surface and lattice oxygen, correspondingly. The region I reduction peak includes surface adsorbed oxygen and subsurface oxygen [24,25]. For CeO2 (S) and CeO2 (R), there is an obvious shoulder reduction peak at about 370 °C compared with CeO2 (P), which can be attributed to surface adsorbed oxygen reduction upon oxygen vacancy. Moreover, the initial reduction temperature of the peak in region I for CeO2 (S) is at about 230 °C, which is lower compared to CeO2 (R) (~280 °C) and CeO2 (P) (~340 °C). Furthermore, along with low reduction temperature, the CeO2 (S) also presents a wide reduction peak in region I with a consumption value of H2 of 595.4 μmol∙g−1 followed by CeO2 (R) (362.4 μmol∙g−1) and CeO2 (P) (278.3 μmol∙g−1). The above results indicate the reducibility and the quantity of surface adsorbed oxygen decrease as follows: CeO2 (S) > CeO2 (R) > CeO2 (P), signifying the CeO2 (S)’s strongest oxidation ability.
The desorption capacity of oxygen species of catalysts was investigated by O2-TPD. As displayed in Figure 4b, two desorption peaks are observed below 550 °C for the catalysts. Typically, the desorption peak below 280 °C is assigned to the species of surface adsorbed oxygen (O2 and O) and a peak between 280–550 °C is allocated to the surface lattice oxygen species (O2−) [26,27,28]. The area of desorption peak was used to calculate the quantity of surface adsorbed oxygen. The quantity is higher on CeO2 (S) (303.3 μmol∙g−1) than on CeO2 (R) (133.4 μmol∙g−1) and CeO2 (P) (113.4 μmol∙g−1). Hence, it might be concluded that CeO2 (S) has abundant surface oxygen vacancies that allow it to generate more species of surface adsorbed oxygen and is aligned well with the findings of H2-TPR.

2.4. XPS Analysis

The three CeO2 catalysts surface chemical states were investigated by XPS (Figure 5). As presented in Figure 5a, the Ce 3d XPS spectrum was resolved into eight peaks. The six peaks represented as V, V″, V″′, U, U″ and U″′ belong to the Ce4+ species and the remaining peaks denoted as V′ and Uo are considered as Ce3+ species [29,30]. The presence of Ce3+ indicates the surface oxygen vacancies generation; therefore, the ratio of Ce3+/(Ce3+ + Ce4+) was calculated. The percentage of Ce3+ species listed in Table 1 is 39.6%, 31.4%, and 23.8% on CeO2 (S), CeO2 (R), and CeO2 (P), respectively. The higher amount of Ce3+ species on CeO2 (S) reveals that its surface has many oxygen vacancies. O 1s XPS spectrum (Figure 5b) was resolved into three distinct peaks. These three peaks at 529.8, 531.6, and 533.0 eV denoted as Oα, Oβ, and Oγ are attributed to species of surface lattice oxygen, surface adsorbed oxygen, and adsorbed H2O, respectively [8]. The generation of surface adsorbed oxygen points to the existence of oxygen vacancies; therefore, Oβ/(Oα+Oβ) ratio was calculated to find the content of oxygen vacancies [25]. As listed in Table 1, the CeO2 (S) (55.4%) has high oxygen vacancies concentration in contrast to CeO2 (R) (48.3%) and CeO2 (P) (45.2%).

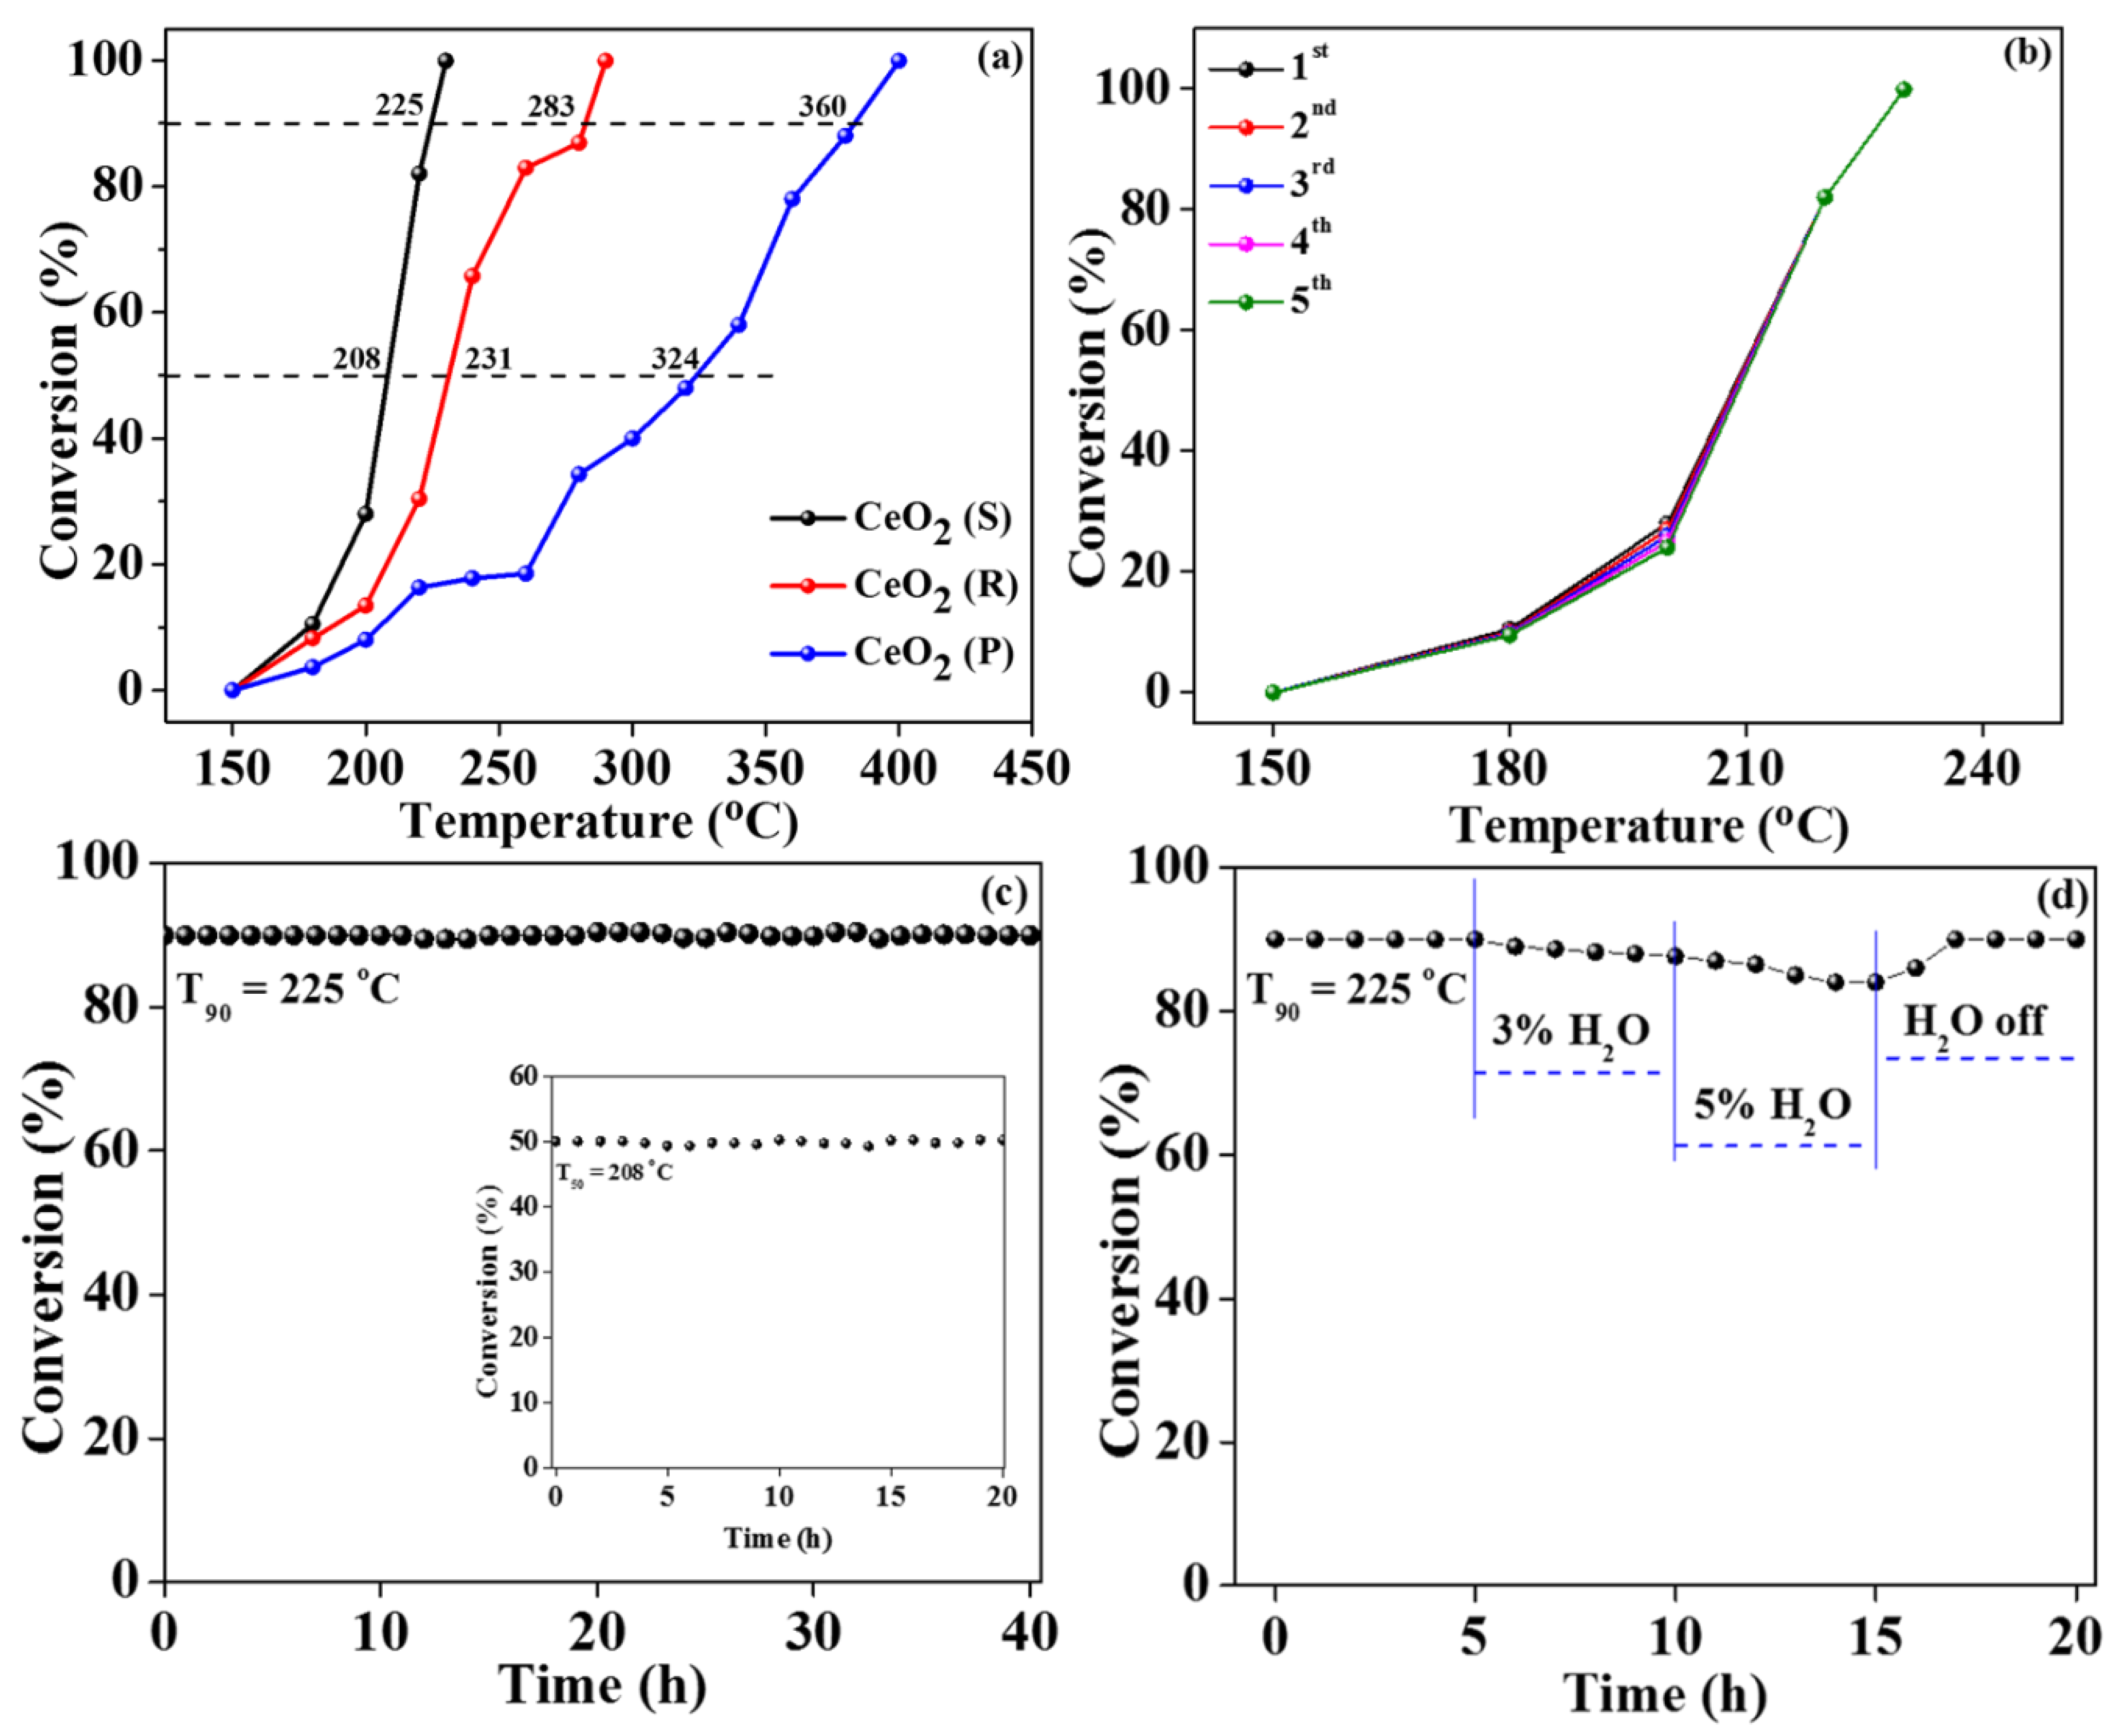
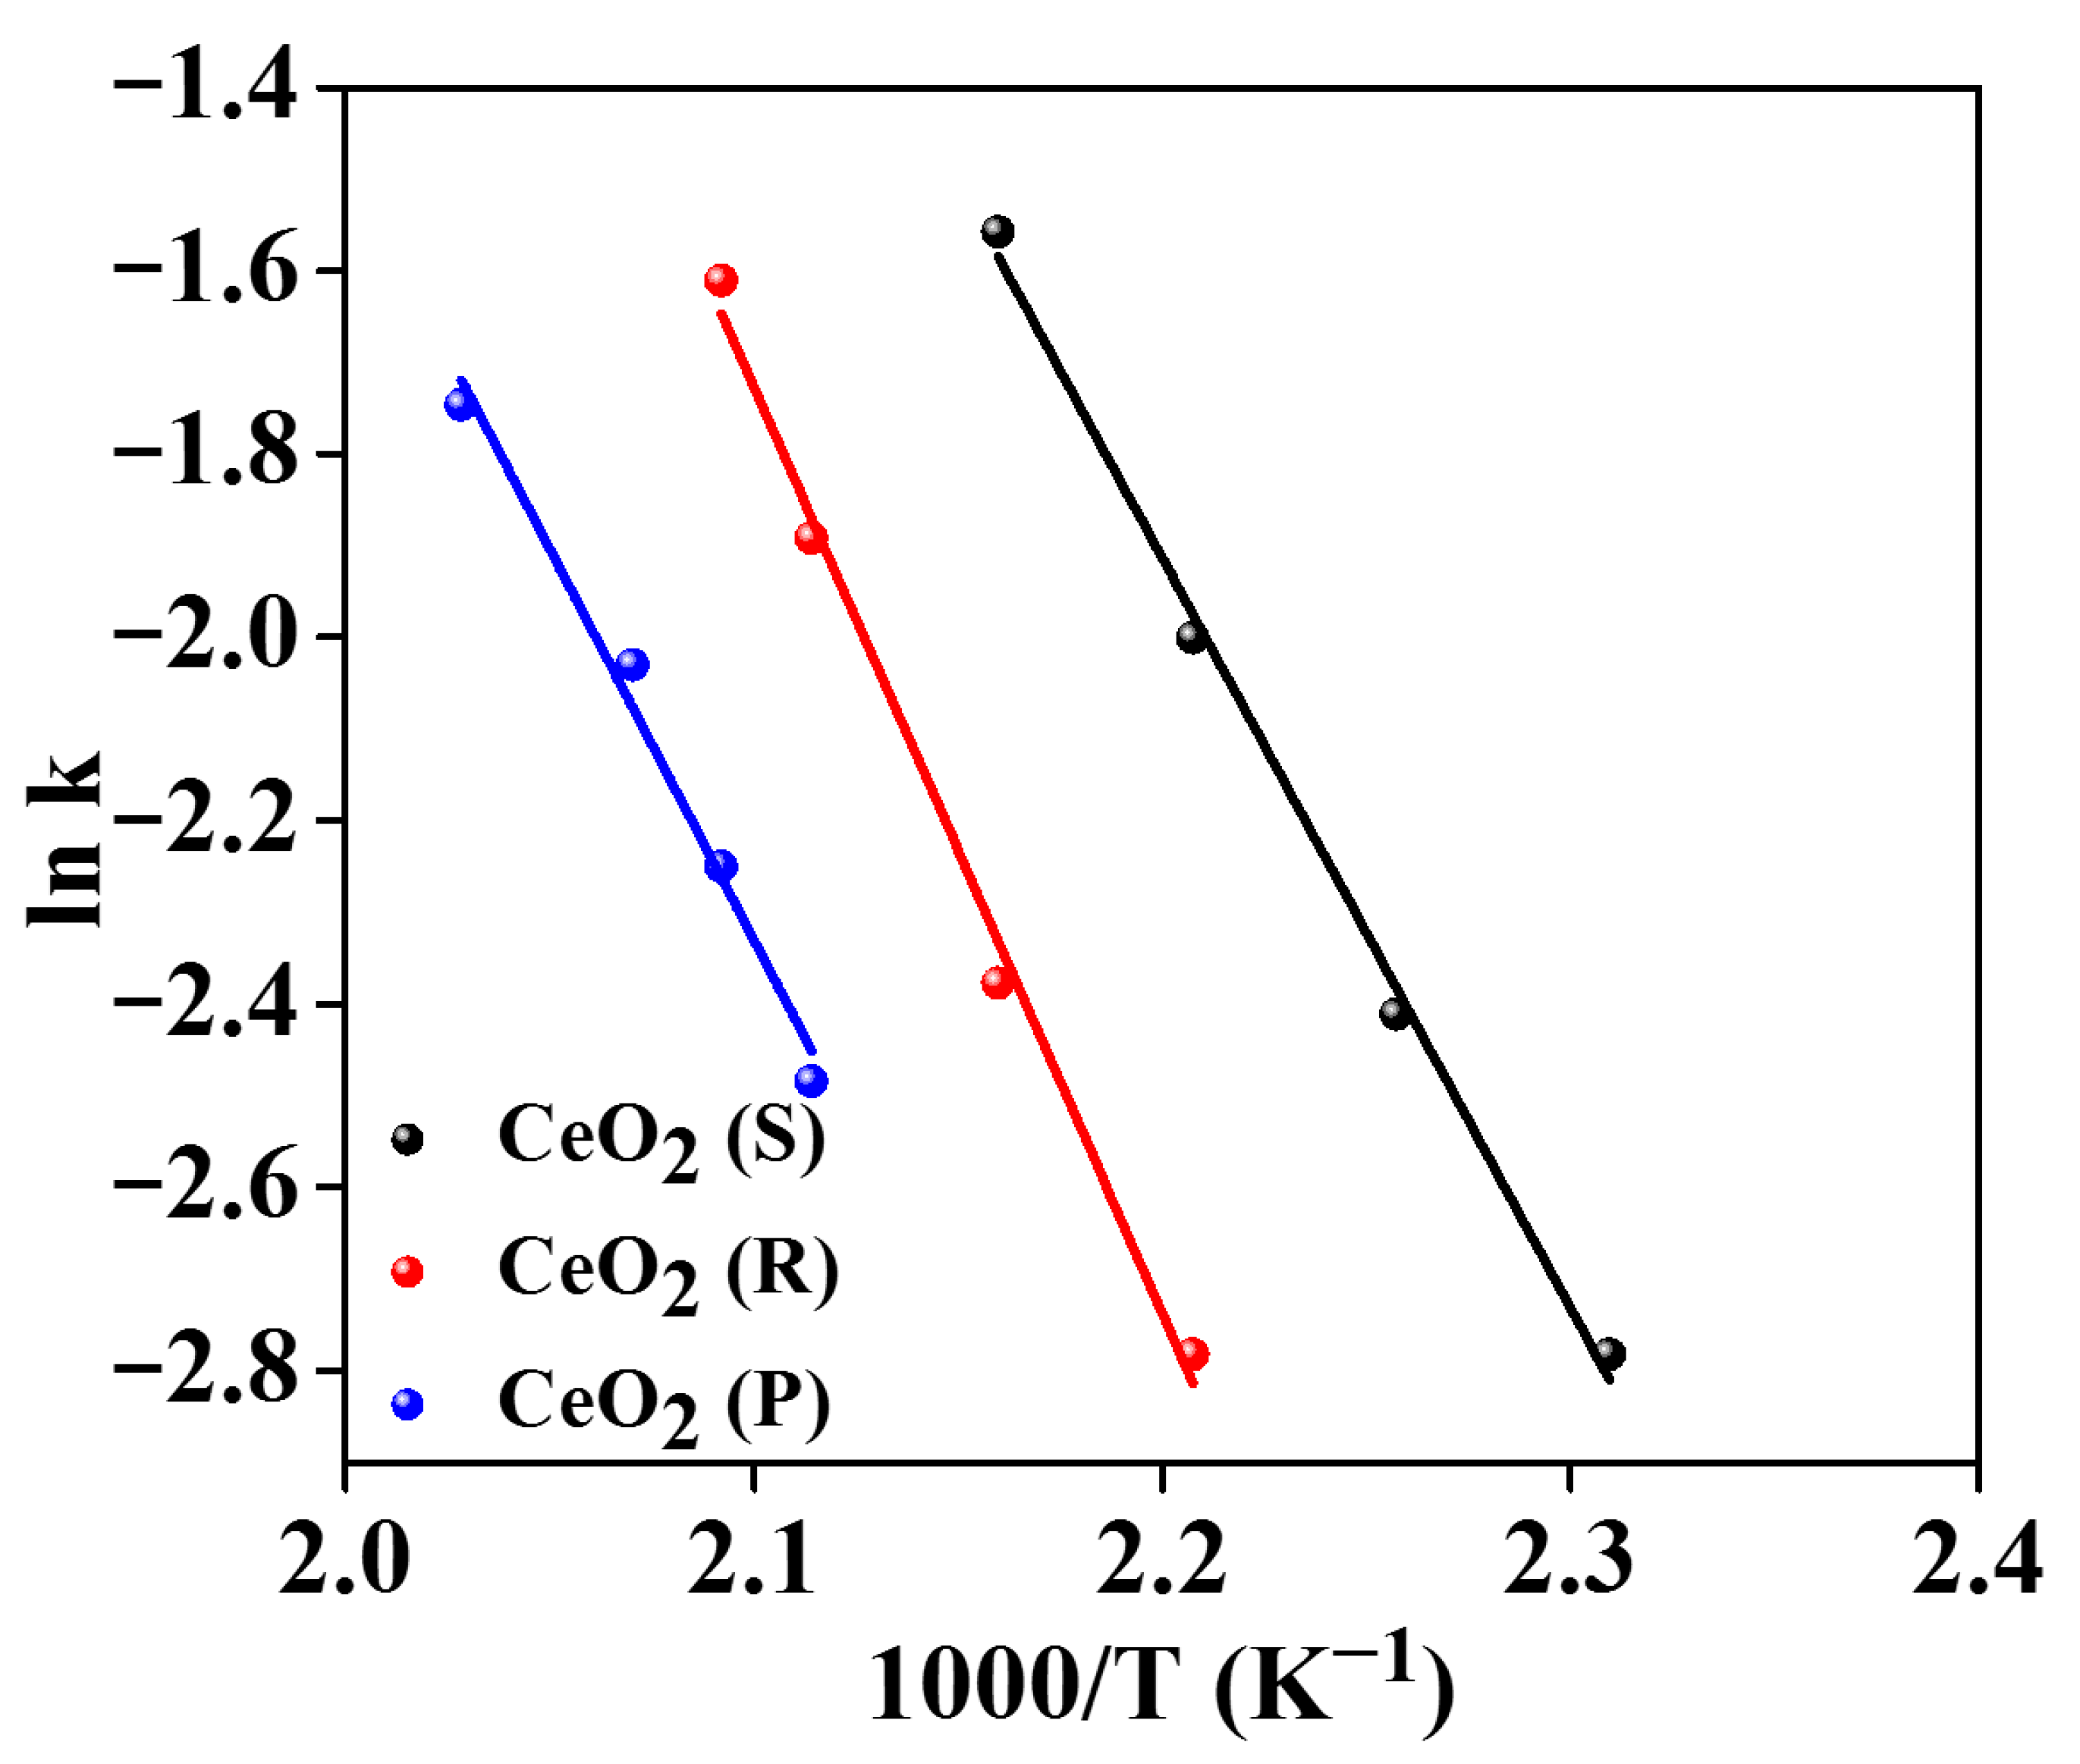
2.5. Catalytic Oxidation Activity

The toluene catalytic oxidation activity was evaluated for CeO2 (S), CeO2 (R), and CeO2 (P) catalysts. Figure 6a reveals that the CeO2 (S) offers excellent activity with 50% and 90% toluene conversion at low temperatures of (T50) 208 and (T90) 225 °C, respectively. The CeO2 (R) and CeO2 (P) show T50 is 231 and 283 °C, respectively, and the corresponding T90 is 324 and 360 °C (Table 2). This indicates that CeO2 with different morphologies can offer different catalytic activity, and shows the excellent activity of CeO2 (S) with special shuttle-like morphology. In addition, as shown in Figure 6b, the toluene oxidation for five consecutive cycles was investigated, and it was found that there is no decrease in catalytic oxidation performance, suggesting its strong recyclability of oxidation activity.
The catalytic activity stability of CeO2 (S) in terms of time was also evaluated under 90% conversion of toluene, and there was no obvious loss in the conversion of toluene after 40 h (Figure 6c). Moreover, no decrease in the lower toluene conversion (50%) was observed over CeO2 (S) in 20 h, as presented in Figure 6c (inset). Therefore, it can be deduced that CeO2 (S) possesses excellent catalytic activity stability under both lower and higher conversion of toluene.
Generally, water imparts a negative effect on the catalyst performance, so investigating the catalytic performance in the presence of water is very necessary. As illustrated in Figure 6d, the toluene conversion (90%) remains unchanged for 5 h at 225 °C in the absence of H2O. After inducing 3 vol% H2O in the feed, the toluene conversion decreases to 87% and decreases further to 84% with the higher H2O amount (5 vol%) in the feed. Interestingly, when the water is removed from the feed, the conversion of toluene can recover to 90%, elucidating a great tolerance to water for the CeO2 (S) catalyst.
The rate of reaction of three CeO2 samples was estimated with the help of Equation (2). The results displayed in Figure 7a and Table 2 suggest that the reaction rate increases as CeO2 (S) > CeO2 (R) > CeO2 (P), which also confirms that in the toluene catalytic oxidation, CeO2 (S) is the most efficient catalyst. Furthermore, the oxygen vacancy concentration-based turnover frequency (TOFov) of CeO2 catalysts was determined by using Equation (3) as shown in Figure 7b. The TOFov value at 170, 180, and 190 °C for the three catalysts increases as follows: CeO2 (S) > CeO2 (R) > CeO2 (P) (Table 2). The TOFov results suggest that CeO2 (S) has a much better toluene oxidation performance than other catalysts due to plentiful surface oxygen vacancies on it.
The CeO2 catalysts’ apparent activation energy was also estimated by using Equation (4) and displayed in Figure 8. The Ea value is 67.4, 85.8 and 103.2 kJ∙mol−1 over CeO2 (S), CeO2 (R), and CeO2 (P), respectively. The difference in Ea values is probably because of different active surface oxygen species content, and a lower value of Ea corresponds to better catalytic activity [13,26]. The aforementioned results suggest that catalytic oxidation of toluene takes place more quickly on CeO2 (S) than on CeO2 (R) and CeO2 (P). Finally, the CeO2 (S) catalytic oxidation activity was also compared with different morphology catalysts presented in the previous literature [8,13,14,15,29] (Table 3), and it can be deduced that CeO2 (S) shuttle morphology catalysts exhibited much better catalytic oxidation activity than the previously reported different morphology catalysts.

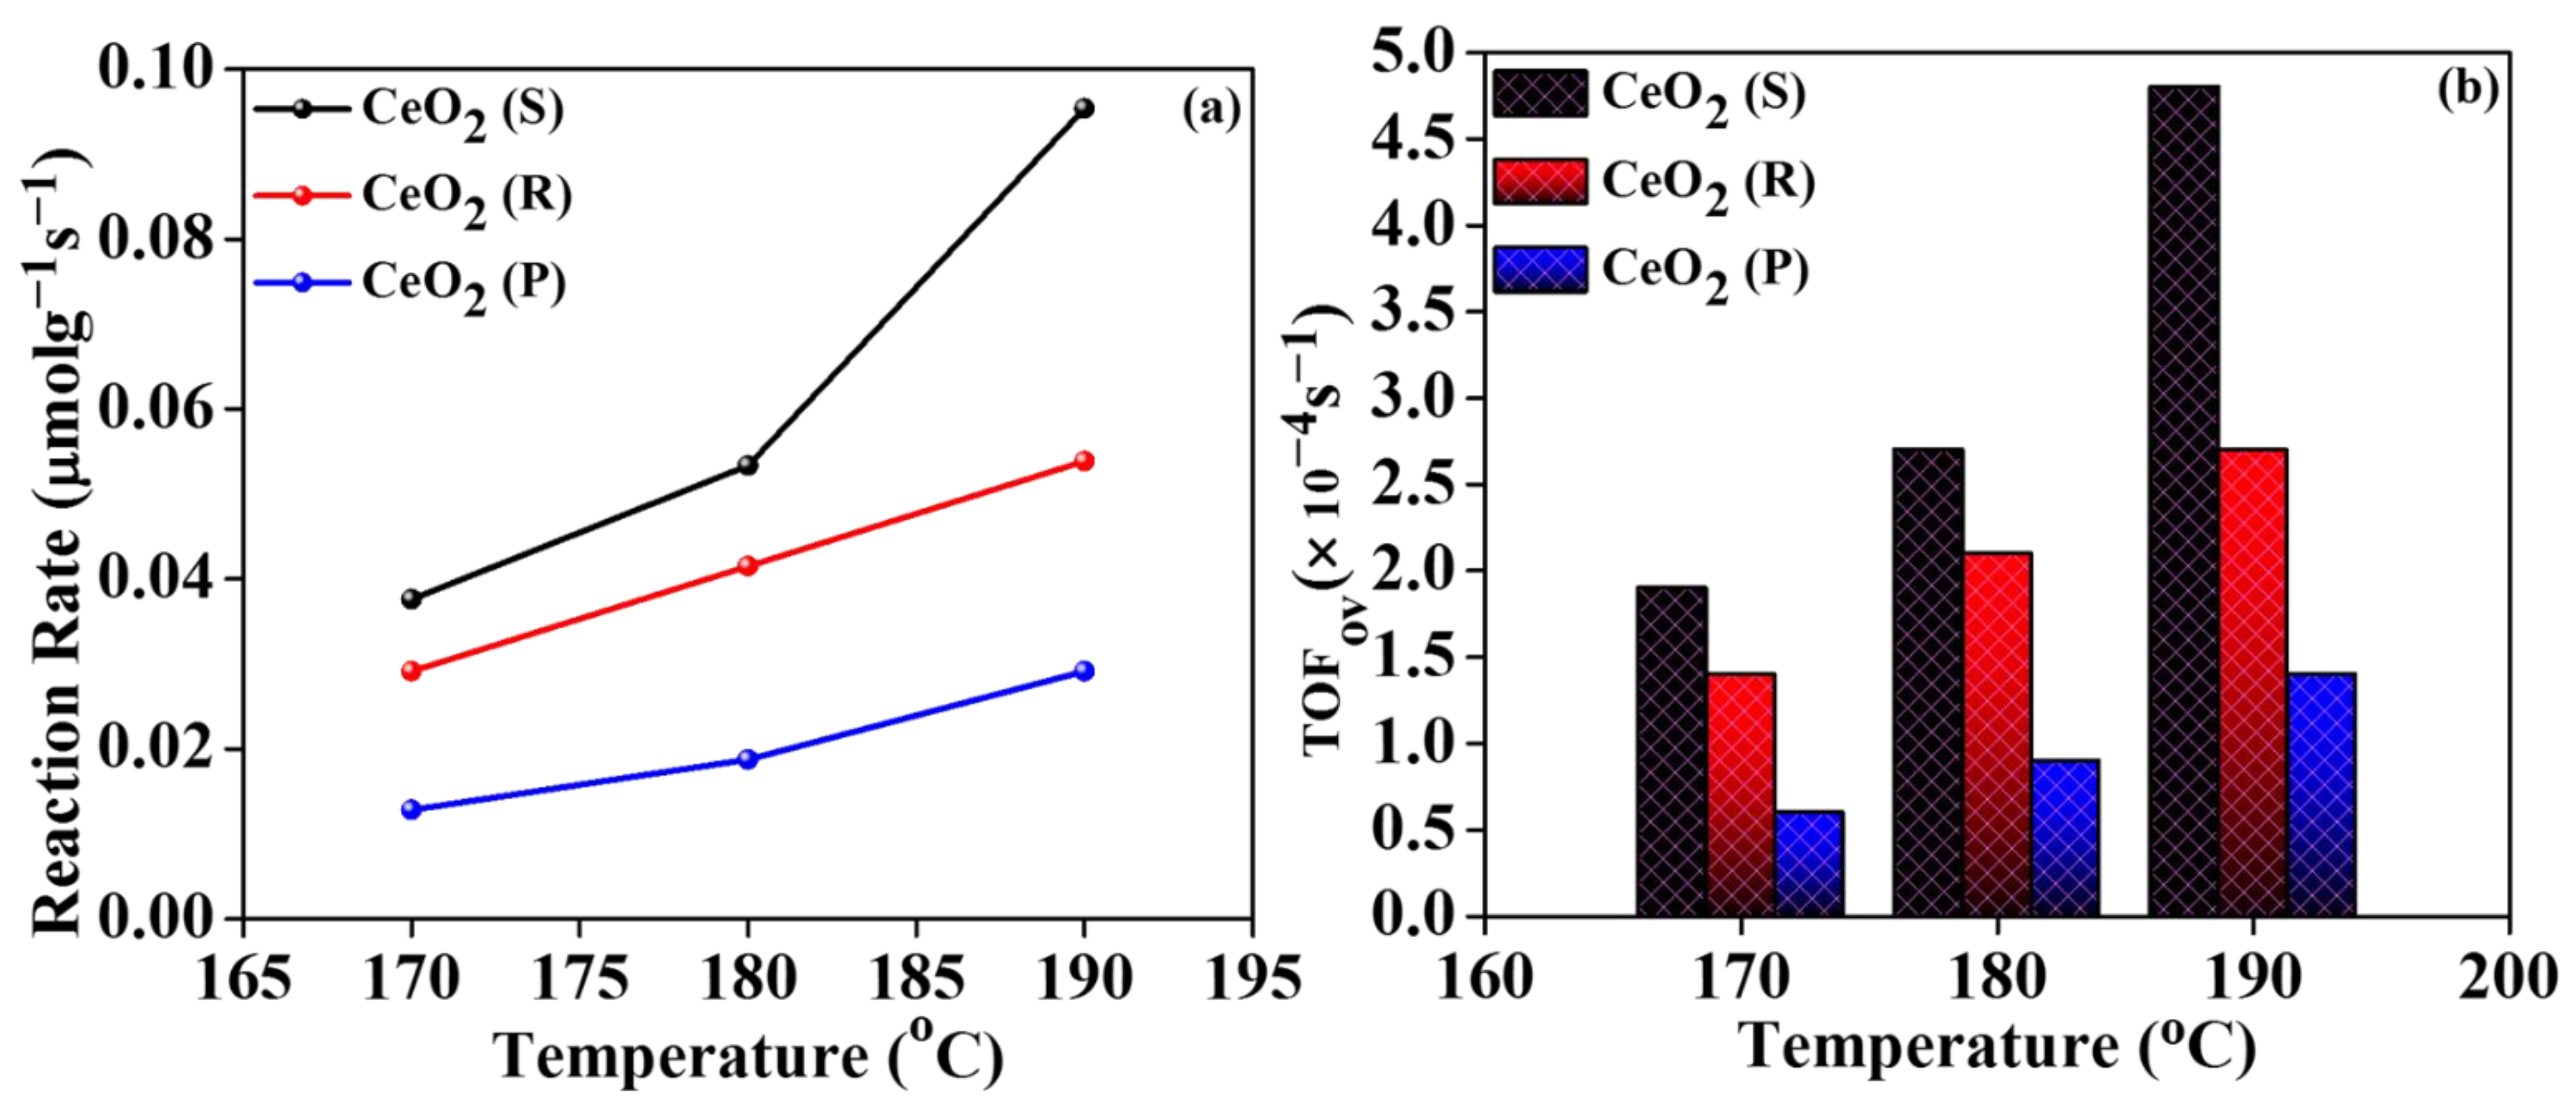
2.6. Influences of Different Morphologies CeO2 Catalysts on Oxidation Activity

The images of SEM reveal the successful formation of CeO2 with distinct morphologies for CeO2 (S), CeO2 (R), and CeO2 (P) catalysts, and they demonstrate different activity for toluene oxidation. Between them, the CeO2 (S) catalysts display outstanding activity, which is owing to its special morphology, higher surface area and numerous oxygen vacancies, verified by the results of different characterizations. The CeO2 (S) BET surface area (116 m2∙g−1) is higher than CeO2 (R) (79 m2∙g−1) and CeO2 (P) (60 m2∙g−1). H2-TPR, Raman spectra and O2-TPD suggest that CeO2 (S) has more oxygen vacancies than CeO2 (R) and CeO2 (P), and the XPS results also express the finding that CeO2 (S) has greater surface adsorbed oxygen species and surface Ce3+ species than CeO2 (R) and CeO2 (P). This is in favor of toluene catalytic oxidation. Hence, it might be deduced that the CeO2 (S) catalyst displays excellent toluene oxidation activity as compared to CeO2 (R) and CeO2 (P) because of the higher surface area and plentiful surface oxygen vacancies. The CeO2 (S)’s larger surface area and surface oxygen vacancy concentration can supply more surface active oxygen species to react with adsorbed toluene molecules, which in turn results in a higher reaction rate of toluene oxidation [31,32]. In short, different morphologies can form special surface properties, resulting in optimum catalytic oxidation activity.

3. Experimental

3.1. Chemicals

CH4N2O (Tianjin Keqi Chemical Reagent Co. Ltd., Tianjin, China), Ce(NO3)3∙6H2O (Aladdin Industrial Corporation, Shanghai, China), NaOH, and PVP (M.W. = 30,000) (Guangdong Candlelight New Energy Technology Co., Ltd., Dongguan, China) were of high quality and used without any further treatment.

3.2. Preparation of Catalysts

The CeO2 catalysts with shuttle, nanorods, and nanoparticle morphologies were hydrothermally synthesized. For shuttle CeO2 (CeO2 (S)): Ce (NO3)3∙6H2O (2 mmol), CH4N2O (15 mmol), and PVP (0.25 g) were poured in 20 mL H2O to get a homogenous solution. In an autoclave (stainless steel), the homogenous solution was heat-treated at 140 °C for 10 h. Afterward, the product was cooled down and rinsed with distilled water and ethanol numerous times, and dehydrated at 80 °C all night. To prepare CeO2 nanorods (CeO2 (R)): Ce (NO3)3∙6H2O (10 mmol) was dispersed in distilled water (20 mL) under constant stirring. During stirring, 30 mL of 7 mol∙L−1 NaOH was poured into it and stirred for another half an hour. The solution was then heated at 120 °C in a stainless-steel autoclave for 24 h. Following the autoclave action, the sample was washed out and dried overnight at 80 °C. CeO2 nanoparticles (CeO2 (P)) were prepared in the same way as CeO2 (R) but with a 2 mol∙L−1 concentration of NaOH. Finally, three distinct morphology samples were calcined for 3 h at 500 °C (1 °C∙min−1). The synthetic procedure scheme of the three distinct morphology catalysts is demonstrated in Scheme 1.

3.3. Characterization

The surface morphology of CeO2 catalysts was examined through SEM via JSM5910, (JEOL, Tokyo, Japan) and TEM through JEM-2100 (JEOL, Tokyo, Japan). The BET surface area was recorded by micromeritics ASAP 2020 plus 1.03 apparatus. The XRD patterns were obtained through JDX-3532 (JEOL, Japan). The Raman spectra were attained by using a Raman spectrometer (RM-2000). The chemical states were determined by XPS (Escalab 250 Xi). The reduction ability of catalysts was investigated with H2-TPR, which was operated in a tubular reactor connected with a micromeritics Autochem 2720 chemisorption analyzer. Before measurement, in an Ar environment (30 mL∙min−1) the sample (100 mg) was pre-heated for 1 h at 300 °C. The samples were then reduced through 10% H2/Ar (30 mL∙min−1) from 30–850 °C (10 °C∙min−1) and continuously measured by TCD (thermal conductivity detector). O2-TPD was run in a self-build apparatus by preheating 50 mg of samples for 30 min at 300 °C in pure He gas to remove any moisture. After the moisture removal, the samples were cooled down to 30 °C under pure He gas and then subjected to O2 for 1 h at 30 °C. The weakly adsorbed O2 was separated by passing pure He gas, and the samples were heated from 30 °C to 700 °C (10 °C∙min−1) in pure He gas.

3.4. Catalytic Oxidation Activity

The catalytic oxidation of toluene was executed in a fixed-bed tube reactor attached to a gas chromatograph (FULI 9790II) coupled with an FID (flame ionization detector). The reactant mixture volumetric composition was 1000 ppm C7H8, N2 (balance gas) and 20% O2. The total gas flow rate was 100 mL∙min−1, corresponding to a weight hourly space velocity of 40,000 mL∙g−1∙h−1 with 0.150 g catalyst. For the water vapor resistance test, 3 vol% and 5 vol% H2O were added with the help of a water saturator in the feed. The toluene conversion (%) was calculated using Equation (1):
T o l u e n e   c o n v e r s i o n = T o l u e n e i n T o l u e n e o u t T o l u e n e i n × 100 %
where, (Toluene)out and (Toluene)in denote the outlet and inlet concentration of toluene, respectively.
The reaction rate, r (μmol∙g−1 s−1) of the toluene conversion was assessed using Equation (2):
r = X t o l u e n e × V g × C f V m × m c a t
where Xtoluene represents the toluene conversion (%), Vg is the gas velocity (mL∙min−1), Cf represents the concentration (ppm) of toluene, Vm represents the gas molar volume (22.4 L∙mol−1) and mcat represents the catalyst mass (g), respectively.
The turnover frequency from the oxygen vacancy concentration, TOFov (s−1), was calculated by using Equation (3) [14]:
T O F o v = X t o l u e n e × C f × V m c a t M C e O 2 × A 600 / A 461
where V denotes the toluene flow rate (mL∙min−1), M C e O 2 denotes CeO2 molecular mass (g∙mol−1), A600/A461 denotes the integral peak areas of Raman at their respective wavenumbers that were applied to evaluate the concentration of oxygen vacancies.
The apparent activation energy (Ea, kJ∙mol−1) was measured by using the Arrhenius Equation (4) at lower toluene conversions (less than 20%):
l n   k = E a R T + l n A
where k represents the rate constant (mol∙s−1), R denotes the universal constant of gas (J∙mol−1∙K−1) and T is the temperature of the reactor (K).

4. Conclusions

In brief, CeO2 catalysts with three distinct morphologies (CeO2 (S), CeO2 (R), and CeO2 (P)) were successfully prepared through a hydrothermal approach. The as-synthesized CeO2 (S) catalyst shows better catalytic oxidation activity than CeO2 (R) and CeO2 (P) catalysts, with 50% and 90% conversion at the lowest temperatures of 208 and 225 °C, correspondingly. Significantly, the optimal activity of the CeO2 (S) catalyst can be assigned to its shuttle morphology, which has a greater surface area and many surface oxygen vacancies, resulting in better oxidation property and additional surface active oxygen species. The CeO2 (S) catalyst also shows outstanding long-time stability, recyclability, and water resistance capability. Therefore, the CeO2 catalyst with shuttle morphology appears as a capable catalyst in the effective control of air pollution. Furthermore, this field can be further prolonged by modifying the structural characteristics of the CeO2 catalyst to make it more effective for VOCs oxidation.

Supplementary Materials

The following supporting information can be downloaded at: https://www.mdpi.com/article/10.3390/catal12091034/s1. Figure S1. HRTEM images of nanorod segment of CeO2 (S) (a and b). Figure S2. HRTEM images of CeO2 (R) (a) and CeO2 (P) (b).

Author Contributions

A.I.: Data curation, Writing—Original draft preparation. M.Z.: Visualization, Investigation, Software. B.H.: Software, Validation. A.K.: Conceptualization, Methodology. N.A.: Writing—Reviewing and Editing. Y.Z.: Writing—Reviewing and Editing, Supervision. All authors have read and agreed to the published version of the manuscript.

Funding

This research received no external funding.

Data Availability Statement

Not applicable.

Acknowledgments

University of Peshawar, Peshawar 25120, Pakistan for facilitation of research work.

Conflicts of Interest

The authors declare no conflict of interest.

References

  1. Li, K.; Li, J.; Tong, S.; Wang, W.; Huang, R.J.; Ge, M. Characteristics of wintertime VOCs in suburban and urban beijing: Concentrations, emission ratios, and festival effects. Atmos. Chem. Phys. 2019, 19, 8021–8036. [Google Scholar] [CrossRef]
  2. Lyu, X.P.; Chen, N.; Guo, H.; Zhang, W.H.; Wang, N.; Wang, Y.; Liu, M. Ambient volatile organic compounds and their effect on ozone production in wuhan, central china. Sci. Total Environ. 2016, 541, 200–209. [Google Scholar] [CrossRef] [PubMed]
  3. Li, M.; Zhang, C.; Fan, L.; Lian, Y.; Niu, X.; Zhu, Y. Enhanced catalytic oxidation of toluene over manganese oxide modified by lanthanum with a coral-like hierarchical structure nanosphere. ACS Appl. Mater. Interfaces 2021, 13, 10089–10100. [Google Scholar] [CrossRef]
  4. Ismail, A.; Li, M.; Zahid, M.; Fan, L.; Zhang, C.; Li, Z.; Zhu, Y. Effect of strong interaction between Co and Ce oxides in CoxCe1−xO2−δ oxides on its catalytic oxidation of toluene. Mol. Catal. 2021, 502, 111356. [Google Scholar] [CrossRef]
  5. Liotta, L.F. Catalytic oxidation of volatile organic compounds on supported noble metals. Appl. Catal. B Environ. 2010, 100, 403–412. [Google Scholar] [CrossRef]
  6. Schick, L.; Sanchis, R.; Gonzalez-Alfaro, V.; Agouram, S.; Lopez, J.M.; Torrente-Murciano, L.; García, T.; Solsona, B. Size-activity relationship of iridium particles supported on silica for the total oxidation of volatile organic compounds (VOCs). Chem. Eng. J. 2019, 366, 100–111. [Google Scholar] [CrossRef]
  7. Feng, Z.; Zhang, M.; Ren, Q.; Mo, S.; Peng, R.; Yan, D.; Fu, M.; Chen, L.; Wu, J.; Ye, D. Design of 3-dimensionally self-assembled CeO2 hierarchical nanosphere as high efficiency catalysts for toluene oxidation. Chem. Eng. J. 2019, 369, 18–25. [Google Scholar] [CrossRef]
  8. Yan, D.; Mo, S.; Sun, Y.; Ren, Q.; Feng, Z.; Chen, P.; Wu, J.; Fu, M.; Ye, D. Morphology-activity correlation of electrospun CeO2 for toluene catalytic combustion. Chemosphere 2020, 247, 125860. [Google Scholar] [CrossRef]
  9. He, C.; Yu, Y.; Yue, L.; Qiao, N.; Li, J.; Shen, Q.; Yu, W.; Chen, J.; Hao, Z. Low-temperature removal of toluene and propanal over highly active mesoporous CuCeOx catalysts synthesized via a simple self-precipitation protocol. Appl. Catal. B Environ. 2014, 147, 156–166. [Google Scholar] [CrossRef]
  10. Saqer, S.M.; Kondarides, D.I.; Verykios, X.E. Catalytic oxidation of toluene over binary mixtures of copper, manganese and cerium oxides supported on γ-Al2O3. Appl. Catal. B Environ. 2011, 103, 275–286. [Google Scholar] [CrossRef]
  11. Montini, T.; Melchionna, M.; Monai, M.; Fornasiero, P. Fundamentals and catalytic applications of CeO2-based materials. Chem. Rev. 2016, 116, 5987–6041. [Google Scholar] [CrossRef] [PubMed]
  12. Peng, R.; Sun, X.; Li, S.; Chen, L.; Fu, M.; Wu, J.; Ye, D. Shape effect of Pt/CeO2 catalysts on the catalytic oxidation of toluene. Chem. Eng. J. 2016, 306, 1234–1246. [Google Scholar] [CrossRef]
  13. Feng, Z.; Ren, Q.; Peng, R.; Mo, S.; Zhang, M.; Fu, M.; Chen, L.; Ye, D. Effect of CeO2 morphologies on toluene catalytic combustion. Catal. Today 2019, 332, 177–182. [Google Scholar] [CrossRef]
  14. Hu, F.; Chen, J.; Peng, Y.; Song, H.; Li, K.; Li, J. Novel nanowire self-assembled hierarchical CeO2 microspheres for low temperature toluene catalytic combustion. Chem. Eng. J. 2018, 331, 425–434. [Google Scholar] [CrossRef]
  15. Liao, Y.; He, L.; Zhao, M.; Ye, D. Ultrasonic-assisted hydrothermal synthesis of ceria nanorods and their catalytic properties for toluene oxidation. J. Environ. Chem. Eng. 2017, 5, 5054–5060. [Google Scholar] [CrossRef]
  16. Meher, S.K.; Rao, G.R. Polymer-assisted hydrothermal synthesis of highly reducible shuttle-shaped CeO2: Microstructural effect on promoting Pt/C for methanol electrooxidation. ACS Catal. 2012, 2, 2795–2809. [Google Scholar] [CrossRef]
  17. Li, H.; Meng, F.; Gong, J.; Fan, Z.; Qin, R. Structural, morphological and optical properties of shuttle-like CeO2 synthesized by a facile hydrothermal method. J. Alloy. Compd. 2017, 722, 489–498. [Google Scholar] [CrossRef]
  18. Chen, X.; Chen, X.; Yu, E.; Cai, S.; Jia, H.; Chen, J.; Liang, P. In situ pyrolysis of Ce-MOF to prepare CeO2 catalyst with obviously improved catalytic performance for toluene combustion. Chem. Eng. J. 2018, 344, 469–479. [Google Scholar] [CrossRef]
  19. Jiang, Y.; Gao, J.; Zhang, Q.; Liu, Z.; Fu, M.; Wu, J.; Hu, Y.; Ye, D. Enhanced oxygen vacancies to improve ethyl acetate oxidation over MnOx-CeO2 catalyst derived from MOF template. Chem. Eng. J. 2019, 371, 78–87. [Google Scholar] [CrossRef]
  20. Hojo, H.; Mizoguchi, T.; Ohta, H.; Findlay, S.D.; Shibata, N.; Yamamoto, T.; Ikuhara, Y. Atomic structure of a CeO2 grain boundary: The role of oxygen vacancies. Nano Lett. 2010, 10, 4668–4672. [Google Scholar] [CrossRef]
  21. Liu, F.; Wang, Z.; Wang, D.; Chen, D.; Chen, F.; Li, X. Morphology and crystal-plane effects of Fe/W-CeO2 for selective catalytic reduction of NO with NH3. Catalysts 2019, 9, 288. [Google Scholar] [CrossRef]
  22. Yao, X.; Xiong, Y.; Zou, W.; Zhang, L.; Wu, S.; Dong, X.; Gao, F.; Deng, Y.; Tang, C.; Chen, Z.; et al. Correlation between the physicochemical properties and catalytic performances of CexSn1−xO2 mixed oxides for NO reduction by CO. Appl. Catal. B Environ. 2014, 144, 152–165. [Google Scholar] [CrossRef]
  23. Torrente-Murciano, L.; Gilbank, A.; Puertolas, B.; Garcia, T.; Solsona, B.; Chadwick, D. Shape-dependency activity of nanostructured CeO2 in the total oxidation of polycyclic aromatic hydrocarbons. Appl. Catal. B Environ. 2013, 132–133, 116–122. [Google Scholar] [CrossRef]
  24. Ali, S.; Chen, L.; Yuan, F.; Li, R.; Zhang, T.; Bakhtiar, S.u.H.; Leng, X.; Niu, X.; Zhu, Y. Synergistic effect between copper and cerium on the performance of Cux-Ce0.5−x-Zr0.5 (x = 0.1–0.5) oxides catalysts for selective catalytic reduction of NO with ammonia. Appl. Catal. B Environ. 2017, 210, 223–234. [Google Scholar] [CrossRef]
  25. Lykaki, M.; Pachatouridou, E.; Carabineiro, S.A.C.; Iliopoulou, E.; Andriopoulou, C.; Kallithrakas-Kontos, N.; Boghosian, S.; Konsolakis, M. Ceria nanoparticles shape effects on the structural defects and surface chemistry: Implications in CO oxidation by Cu/CeO2 catalysts. Appl. Catal. B Environ. 2018, 230, 18–28. [Google Scholar] [CrossRef]
  26. Wang, W.; Zhu, Q.; Dai, Q.; Wang, X. Fe doped CeO2 nanosheets for catalytic oxidation of 1,2-dichloroethane: Effect of preparation method. Chem. Eng. J. 2017, 307, 1037–1046. [Google Scholar] [CrossRef]
  27. Tang, X.; Xu, Y.; Shen, W. Promoting effect of copper on the catalytic activity of MnOx-CeO2 mixed oxide for complete oxidation of benzene. Chem. Eng. J. 2008, 144, 175–180. [Google Scholar] [CrossRef]
  28. Fan, L.; Li, M.; Zhang, C.; Ismail, A.; Hu, B.; Zhu, Y. Effect of Cu/Co ratio in CuaCo1−aOx (a = 0.1, 0.2, 0.4, 0.6) flower structure on its surface properties and catalytic performance for toluene oxidation. J. Colloid Interface Sci. 2021, 599, 404–415. [Google Scholar] [CrossRef]
  29. Liu, W.; Liu, R.; Zhang, H.; Jin, Q.; Song, Z.; Zhang, X. Fabrication of Co3O4 nanospheres and their catalytic performances for toluene oxidation: The distinct effects of morphology and oxygen species. Appl. Catal. A Gen. 2020, 597, 117539. [Google Scholar] [CrossRef]
  30. Li, R.; Zhang, L.; Zhu, S.; Fu, S.; Dong, X.; Ida, S.; Zhang, L.; Guo, L. Layered δ-MnO2 as an active catalyst for toluene catalytic combustion. Appl. Catal. A Gen. 2020, 602, 117715. [Google Scholar] [CrossRef]
  31. Bo, Z.; Zhu, J.; Yang, S.; Yang, H.; Yan, J.; Cen, K. Enhanced plasma-catalytic decomposition of toluene over Co-Ce binary metal oxide catalysts with high energy efficiency. RSC Adv. 2019, 9, 7447–7456. [Google Scholar] [CrossRef] [PubMed]
  32. Bo, Z.; Yang, S.; Kong, J.; Zhu, J.; Wang, Y.; Yang, H.; Li, X.; Yan, J.; Cen, K.; Tu, X. Solar-enhanced plasma-catalytic oxidation of toluene over a bifunctional graphene fin foam decorated with nanofin-like MnO2. ACS Catal. 2020, 10, 4420–4432. [Google Scholar] [CrossRef] [PubMed] [Green Version]
Figure 1. XRD patterns (a) and N2 adsorption–desorption isotherms, BJH pore distribution (inset) (b) of CeO2 (S), CeO2 (R) and CeO2 (P).
Catalysts 12 01034 g001
Figure 2. Raman spectra of CeO2 (S), CeO2 (R) and CeO2 (P).
Catalysts 12 01034 g002
Figure 3. SEM and TEM images of CeO2 (S) (a,b), CeO2 (R) (c,d) CeO2 (P) (e,f) and HRTEM image of CeO2 (S) (g,h).
Catalysts 12 01034 g003
Figure 4. H2-TPR (a) and O2-TPD (b) profiles of CeO2 (S), CeO2 (R) and CeO2 (P).
Catalysts 12 01034 g004
Figure 5. XPS spectra of (a) Ce (3d) and (b) O (1s) of CeO2 (S), CeO2 (R) and CeO2 (P).
Catalysts 12 01034 g005
Figure 6. Catalytic oxidation activity of toluene (a) over CeO2 (S), CeO2 (R), and CeO2 (P); catalytic activity for five consecutive cycles (b); catalytic activity stability as a function of time (c) and resistance to water (d) over CeO2 (S).
Catalysts 12 01034 g006
Figure 7. Reaction rate (a) and TOFov (b) over CeO2 (S) at 170, 180, and 190 °C.
Catalysts 12 01034 g007
Figure 8. Arrhenius plot for toluene oxidation over CeO2 (S), CeO2 (R), and CeO2 (P).
Catalysts 12 01034 g008
Scheme 1. Schematic representation of synthetic procedure of CeO2 (S), CeO2 (R) and CeO2 (P).
Catalysts 12 01034 sch001
Table 1. The XRD, BET, Raman and XPS results of CeO2 (S), CeO2 (R) and CeO2 (P).
SamplesCrystallite Size (nm) aBET Surface Area
(m2∙g−1) b
Pore Size (nm) bPore Volume (cm3∙g−1) bA600/A461 c Ce3+/(Ce) d (%)Oβ/(O) e (%)
CeO2 (S)91163.850.540.6239.655.4
CeO2 (R)11793.720.430.2331.448.3
CeO2 (P)12603.980.090.1623.845.2
a. Crystallite size calculated by XRD using Scherrer equation. b. Measured from N2 adsorption–desorption isotherms. c. Calculated from the integrated peak areas centered at 600 and 461 cm−1 of the Raman spectra. d. Ratio of Ce3+ to (Ce3+ + Ce4+). e. Ratio of Oβ to (Oα + Oβ).
Table 2. The catalytic activity, reaction rate, TOFov at 190 °C and Ea of the CeO2 (S), CeO2 (R), and CeO2 (P).
SamplesT50 (°C)T90 (°C)Reaction Rate (×10−2)
(μmol∙g−1s−1) (190 °C)
TOFov (×10−4 s−1)
(190 °C)
Ea (kJ∙mol−1)
CeO2 (S)20822514.374.867.4
CeO2 (R)2312837.362.785.8
CeO2 (P)3243604.261.4103.2
Table 3. Catalytic oxidation of toluene over different morphologies catalyst.
CatalystMorphologyToluene Concentration (ppm)WHSV mL·g−1·h−1T90%Ref.
CeO2Nanotubes10060,0002558
CeO2Wire in nanotubes10060,0003458
CeO2 Nanocubes100048,00029613
CeO2Non-hierarchical Microspheres100060,00024014
CeO2Nanorods100020,00030015
Co3O4Hydrangea-like microsphere50060,00024829
Co3O4Pompon microsphere50060,00029829
Co3O4Spiky microspheres50060,00026929
CeO2Shuttle100040,000225This work
Publisher’s Note: MDPI stays neutral with regard to jurisdictional claims in published maps and institutional affiliations.

