Abstract
Hydrogen, a clean and renewable energy source, is a promising substitute for fossil fuels. Electricity-driven water electrolysis is an attractive pathway for clean hydrogen production. Accordingly, the development of electrolysis cells has drawn researchers’ attention to capital costs related to noble catalyst reduction and membrane degradation by the contaminations. In the literature, polymer electrolyte membranes (PEMs) have been studied on single cations contamination. In this study, we investigated the performance of a PEM on monovalent and divalent cation contamination by feed water. Artificial river water, called soft water, was used to analyze the effect of impurities on the PEM. The results demonstrated that the operating voltage drastically increased and induced cell failure with increasing Mg2+ and Ca2+ concentrations; however, it did not increase for Na+ and K+ after increase in voltage. Therefore, divalent cations have a stronger affinity than monovalent cations to degrade PEM and should be effectively excluded from the feed water.
1. Introduction
Renewable energy production is regarded as a potential resource for meeting future energy demands. Hydrogen production from water electrolysis is highly promising as an eco-friendly and clean energy source. It can act as a potential energy storage medium for storing energy from intermittent renewable sources. Hydrogen is a sustainable energy carrier because it has a higher energy density than solid fuels [1,2,3]. Pure hydrogen can be extracted by simply applying electricity from renewable sources for water electrolysis. The kind of water electrolysis can be classified depending on the electrolyte, ionic agents, and operating parameters. The most established methods for practical use are alkaline water electrolysis and polymer electrolyte (also known as proton exchange membrane) water electrolysis [4,5,6]. Alkaline electrolysis is suitable for meeting hydrogen demand at a large scale [7,8]; however, it has major drawbacks in terms of the permeability of gases through the diaphragm and low current densities between the electrolyte and diaphragm, requiring enormous corrosive liquid electrolyte [9].
The PEM electrolysis method can be considered as an alternative to hydrogen production. It has advantages over the alkaline electrolysis method, such as high current density, compact system design, and energy efficiency [4,9,10,11,12,13,14,15,16,17,18,19]. In addition, pure hydrogen can be obtained because only deionized water is supplied to the electrolyzer [12,14,15,16]. However, the high investment cost of novel catalysts and the degradation of stack components are challenging issues in establishing a large-scale PEM system. Accordingly, numerous studies have been conducted to optimize the low-cost, non-noble-based metal catalysts [13,20,21,22]. Recently, some research groups reported the proper coupling of a highly efficient catalyst with other materials to reduce the cost and enhance hydrogen production [23,24]. Others studied the degradation aspects of the performance of PEM membranes [25,26,27,28,29,30,31,32]. Furthermore, several studies have focused on single cation contaminations in the circulating water, and these cations may be mainly initiated from the feed-water impurities, water pipes and membranes corrosion, and electro-catalyst dissolution [32,33,34,35,36,37,38,39]. In this regard, Fe3+, Mg2+, Ca2+, Cu2+, and Na+ have gained attention as the most common impurities. Studies have been conducted on the influence of single cations by introducing cation impurities into the feed water [33,36,40,41,42,43,44,45,46,47,48,49,50].
Membrane electrode assembly (MEA) is the pivot of the PEM electrolyzer. Nafion membrane is one of the main components in the MEA. Nafion membranes are widely used for PEM electrolyzers owing to their high adaptability and durability at high current densities. The electrodes (anode and cathode) are bonded to each side of the Nafion membrane. When water is supplied to the electrolyzer, the following equations hold at the anode (Equation (1)) and cathode (Equation (2)).
Anode: H2O (l) → 2H+ + 2e− + 1/2O2 (g),
Cathode: 2H+ + 2e− → H2 (g),
Therefore, the membrane of a PEM serves as an electrolyte and a gas separator for hydrogen and oxygen. Accordingly, its degradation can be affected by the deposition of impurities onto the membrane. In addition, these migrated cations could hinder hydrogen evolution and induce a rise in the operating voltage because of higher affinity than H+ ions for the sulfonic acid group [51,52]. In addition, cation impurities replace protons in the electrolyte membrane, thus decreasing the conductivity of MEA and resulting in high ohmic losses [33,36,50]. The migrated cations reduce the proton transport properties from anode to cathode and severely affect the PEM degradation. Accordingly, the performance of MEA for cation contamination is a challenge to the overall cost.
The degradation of MEA was induced by the presence of cations, which could have migrated from the feed water. Since PEM electrolysis uses only deionized water, several filtration steps to attain purity increase the capital cost for PEM. Pure water can be produced by river water treatment using ultrafiltration and reverse osmosis methods [53,54]. In recent years, various techniques for seawater desalination with the removal of charged ions have been developed [55,56,57,58,59,60,61]. The cations impurities, such as sodium ions, are the common impurities found in the feed water. Sodium cations accumulated at the cathode and anode cause an increase in ohm resistance. It can degrade PEM by inducing cell voltage increases due to anode and cathode overpotential [49]. In addition, it can also result in membrane thinning by sodium cations concentration to the Nafion membrane. However, the cations can be effectively excluded from synthetic water. Initial cost of pure feed water can be minimized if artificially treated water with fewer cations is used. Generally, the most abundant cation impurities observed in river water are calcium (Ca2+), magnesium (Mg2+), sodium (Na+), and potassium (K+).
If treated water is supplied to the PEM, it is necessary to identify the influence of cations in the feed water. The existing studies have investigated how to improve the efficiency of a PEM [62,63,64,65], and several studies have reported single cations contaminations introduced from the feed water [39,40,41,42,43]. In addition, these studies were conducted on deionized or ultrapure water and analyzed the effects of cations by adding impurities to the feed water. At present, there are no literature reviews on the performance of PEM in terms of cations contaminations by treated water. Additionally, the potential foreign cations that could migrate from the treated water have not been studied. Therefore, we fabricated artificial soft water containing the major impurities found in river water to investigate the acceptable cations in the treated stage. In this study, we focused on the effect of impurities from artificial soft water and analyzed the contaminations in MEA. Ca2+, Mg2+, Na+, and K+ cations were considered the impurities induced by the soft water. In addition, the PEM performance was studied on the operating voltage before and after soft-water supply. The cell voltage was analyzed under different soft-water concentrations. The influence of monovalent and divalent cations that can severely degrade the PEM were compared.
2. Results and Discussion
2.1. Effect of Na+, Mg2+, K+, Ca2+ on the Operating Performance
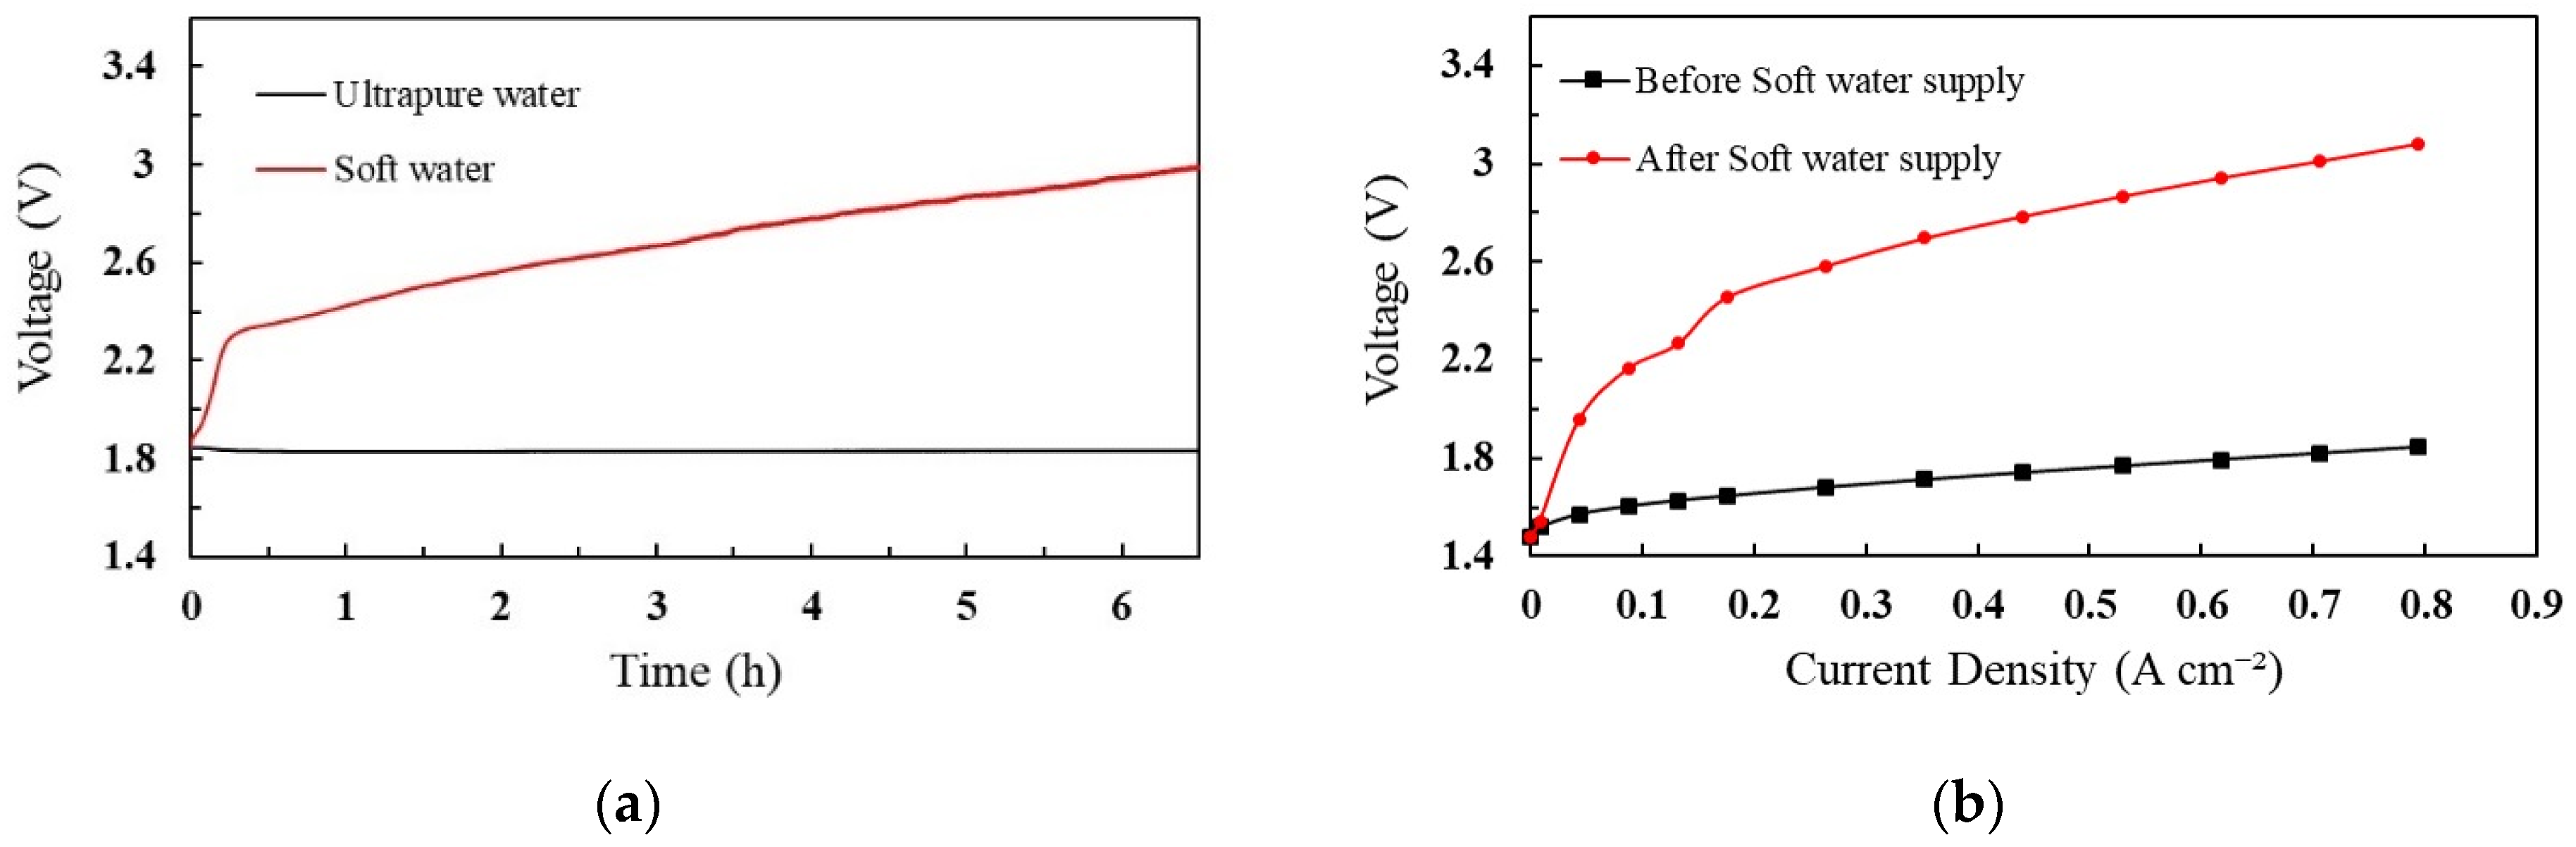
The effect of cation contamination was analyzed in comparison with ultrapure and soft water. The PEM cell was operated for approximately 6.5 h for each test analysis. The operating voltage was measured during the experimental period, and the corresponding results are shown in Figure 1.
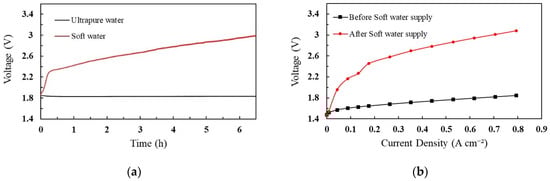
Figure 1.
Performance analysis of PEM with soft water and ultrapure water (a) cell voltage profile, (b) polarization curves of voltage and current density.
Figure 1 shows the voltage profile of the cell when ultrapure water and soft water were provided to the system. To split water molecules, the minimum voltage required to overcome the kinetic barrier is 1.8 V. As shown in Figure 1a, when the soft water was supplied to the system, the cell voltage drastically increased to 2.3 V at a rate of 0.9 V/h, and then, gradually increased to 3.0 V at a rate of 0.1 V/h. The maximum allowable voltage of our PEM cell is 3.0 V. Accordingly, the analysis was performed until the cell voltage reached its maximum. However, the cell voltage was steady when ultrapure water was added to the cell. After the soft water supply, ultrapure water was used to investigate the effects of impurities and degradation of cell performance. The increase in cell voltage was caused by the replacement of protons with Ca2+, Mg2+, Na+, and K+ in the MEA. The Nafion membrane has sulfonic acid groups in which Na+ has a stronger affinity than H+. Therefore, the substituted Na+ becomes a dominant factor that decreases the conductivity of the MEA and increases the cell voltage [49]. Mg2+, K+, and Ca+ were also replaced by the sulfonic acid groups, which caused the cell voltage to increase. Additionally, the rapid increase in cell voltage was influenced by the hydrogen production reaction at the cathode, which proceeds according to Equation (3) instead of Equation (2). The cations passed from the anode to cathode owing to the electric field and replaced the H+ ions. The theoretical cathode potentials of Equations (2) and (3) are 0 V and −0.828 V, respectively [49].
Cathode: 2H2O + 2e− → H2 (g) + 2OH−,
Subsequently, the IV characteristics were monitored in two cases: before and after the soft-water supply, as shown in Figure 1b. According to the IV characteristic graph, the impurities in the feed water increased the ohmic resistance of the cell after the soft water supply. Therefore, the PEM cell was greatly affected by cation impurities.
2.2. ICP Analysis
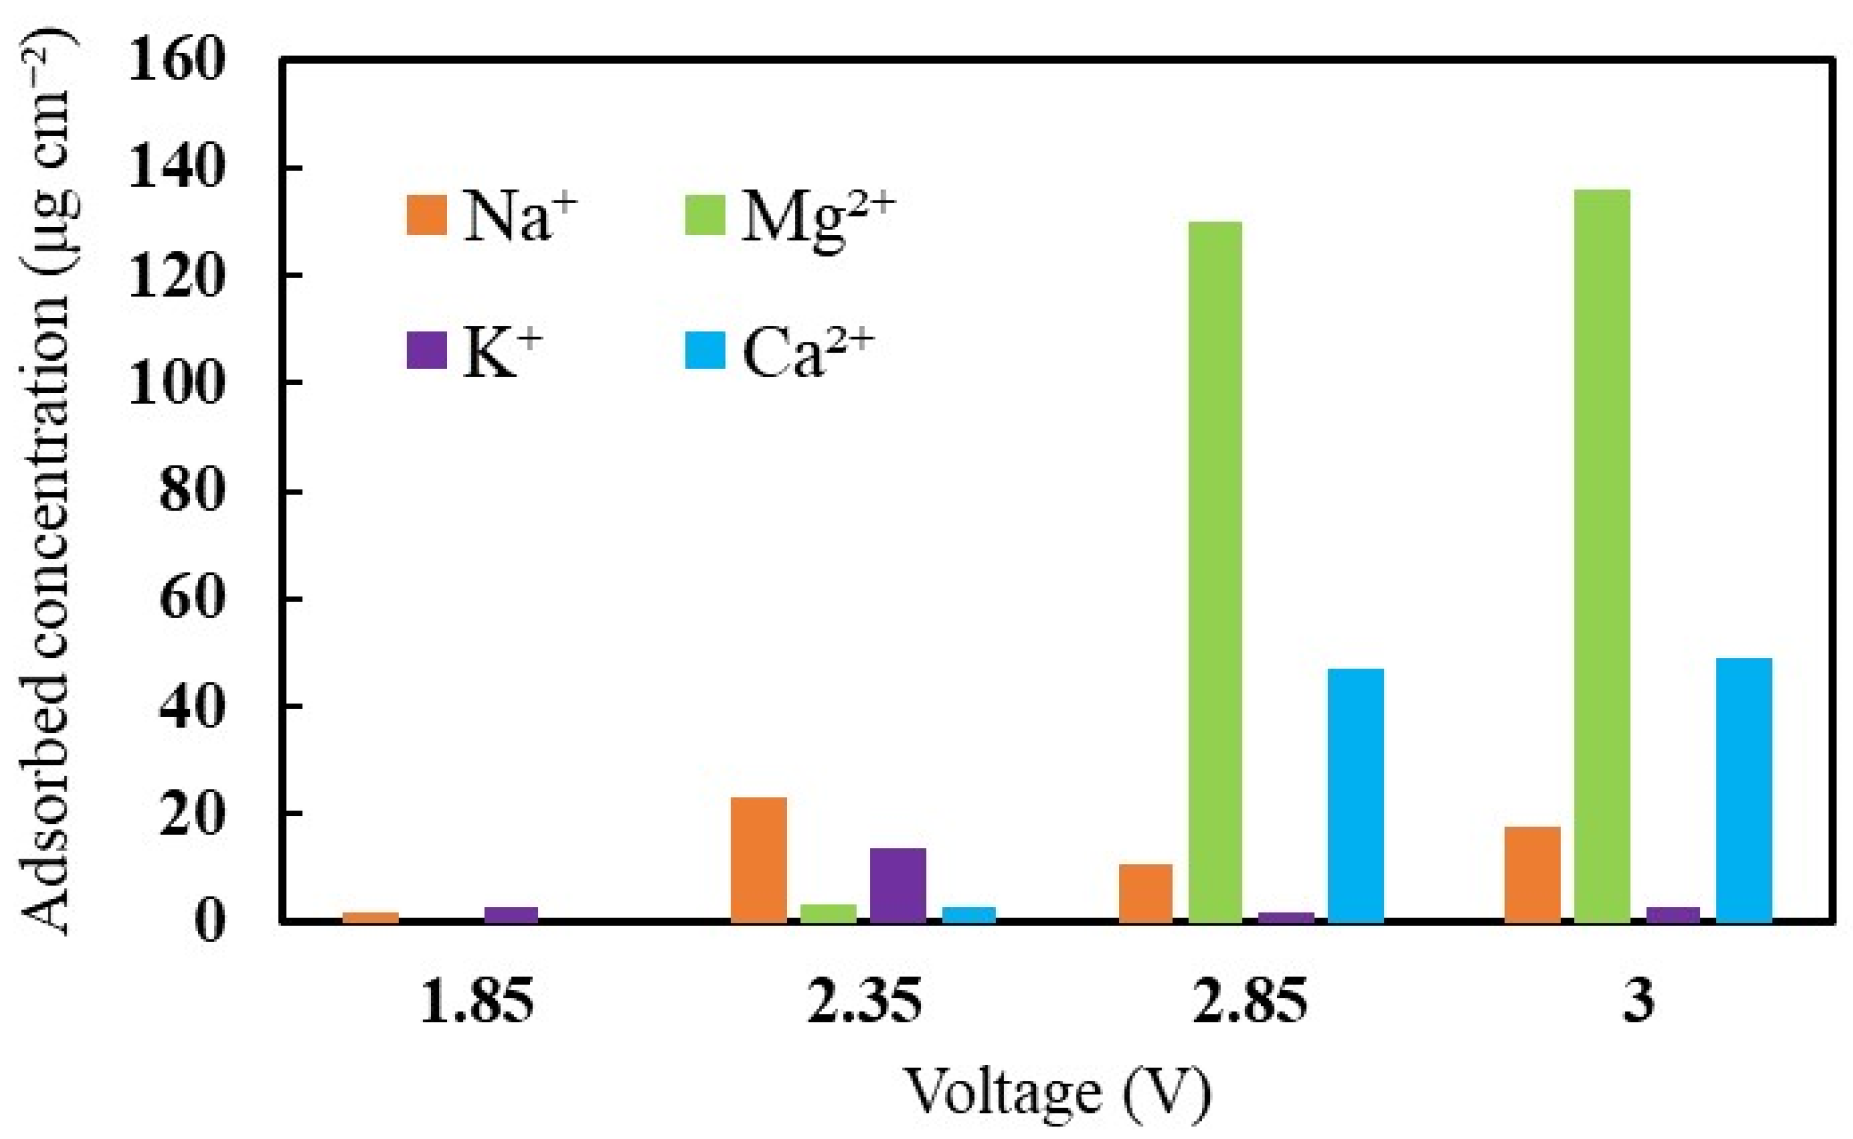
In the soft-water supply, Na+, Mg2+, K+, and Ca2+ cations were contaminated by the MEA. To investigate the effect of cation contamination on the cell, the concentration of cations attached to the MEA and the operating voltage were analyzed. Figure 2 shows the amounts of adhered cations with increasing voltage. At the initial voltage supply, only monovalent ions (Na+ and K+ ions) were present in the MEA. It was due to the stronger affinity of monovalent ions (Na+ and K+ ions) than H+. Among the mixed cations, Na+ and K+ ions were the highest in number when the cell voltage increased to 2.35 V. Protons with affinity lower than Na+ were easily substituted by monovalent ions during the initial period. Subsequently, the accumulation of divalent ions was more intense than Na+ and K+ over a long duration. After that, the amount of Mg2+ and Ca2+ cations drastically increased to 136 μg/cm2 and 49 μg/cm2, respectively; on the other hand, that of Na+ and K+ ions did not increase. Therefore, it can be considered that the divalent cations were concentrated on the cell with a rapid increase in voltage, whereas the monovalent cations were accumulated with a gradual voltage increase.

Figure 2.
The influence of cations on the cell voltage with respect to adhered cations concentration.
2.3. SEM and EDX Analyses
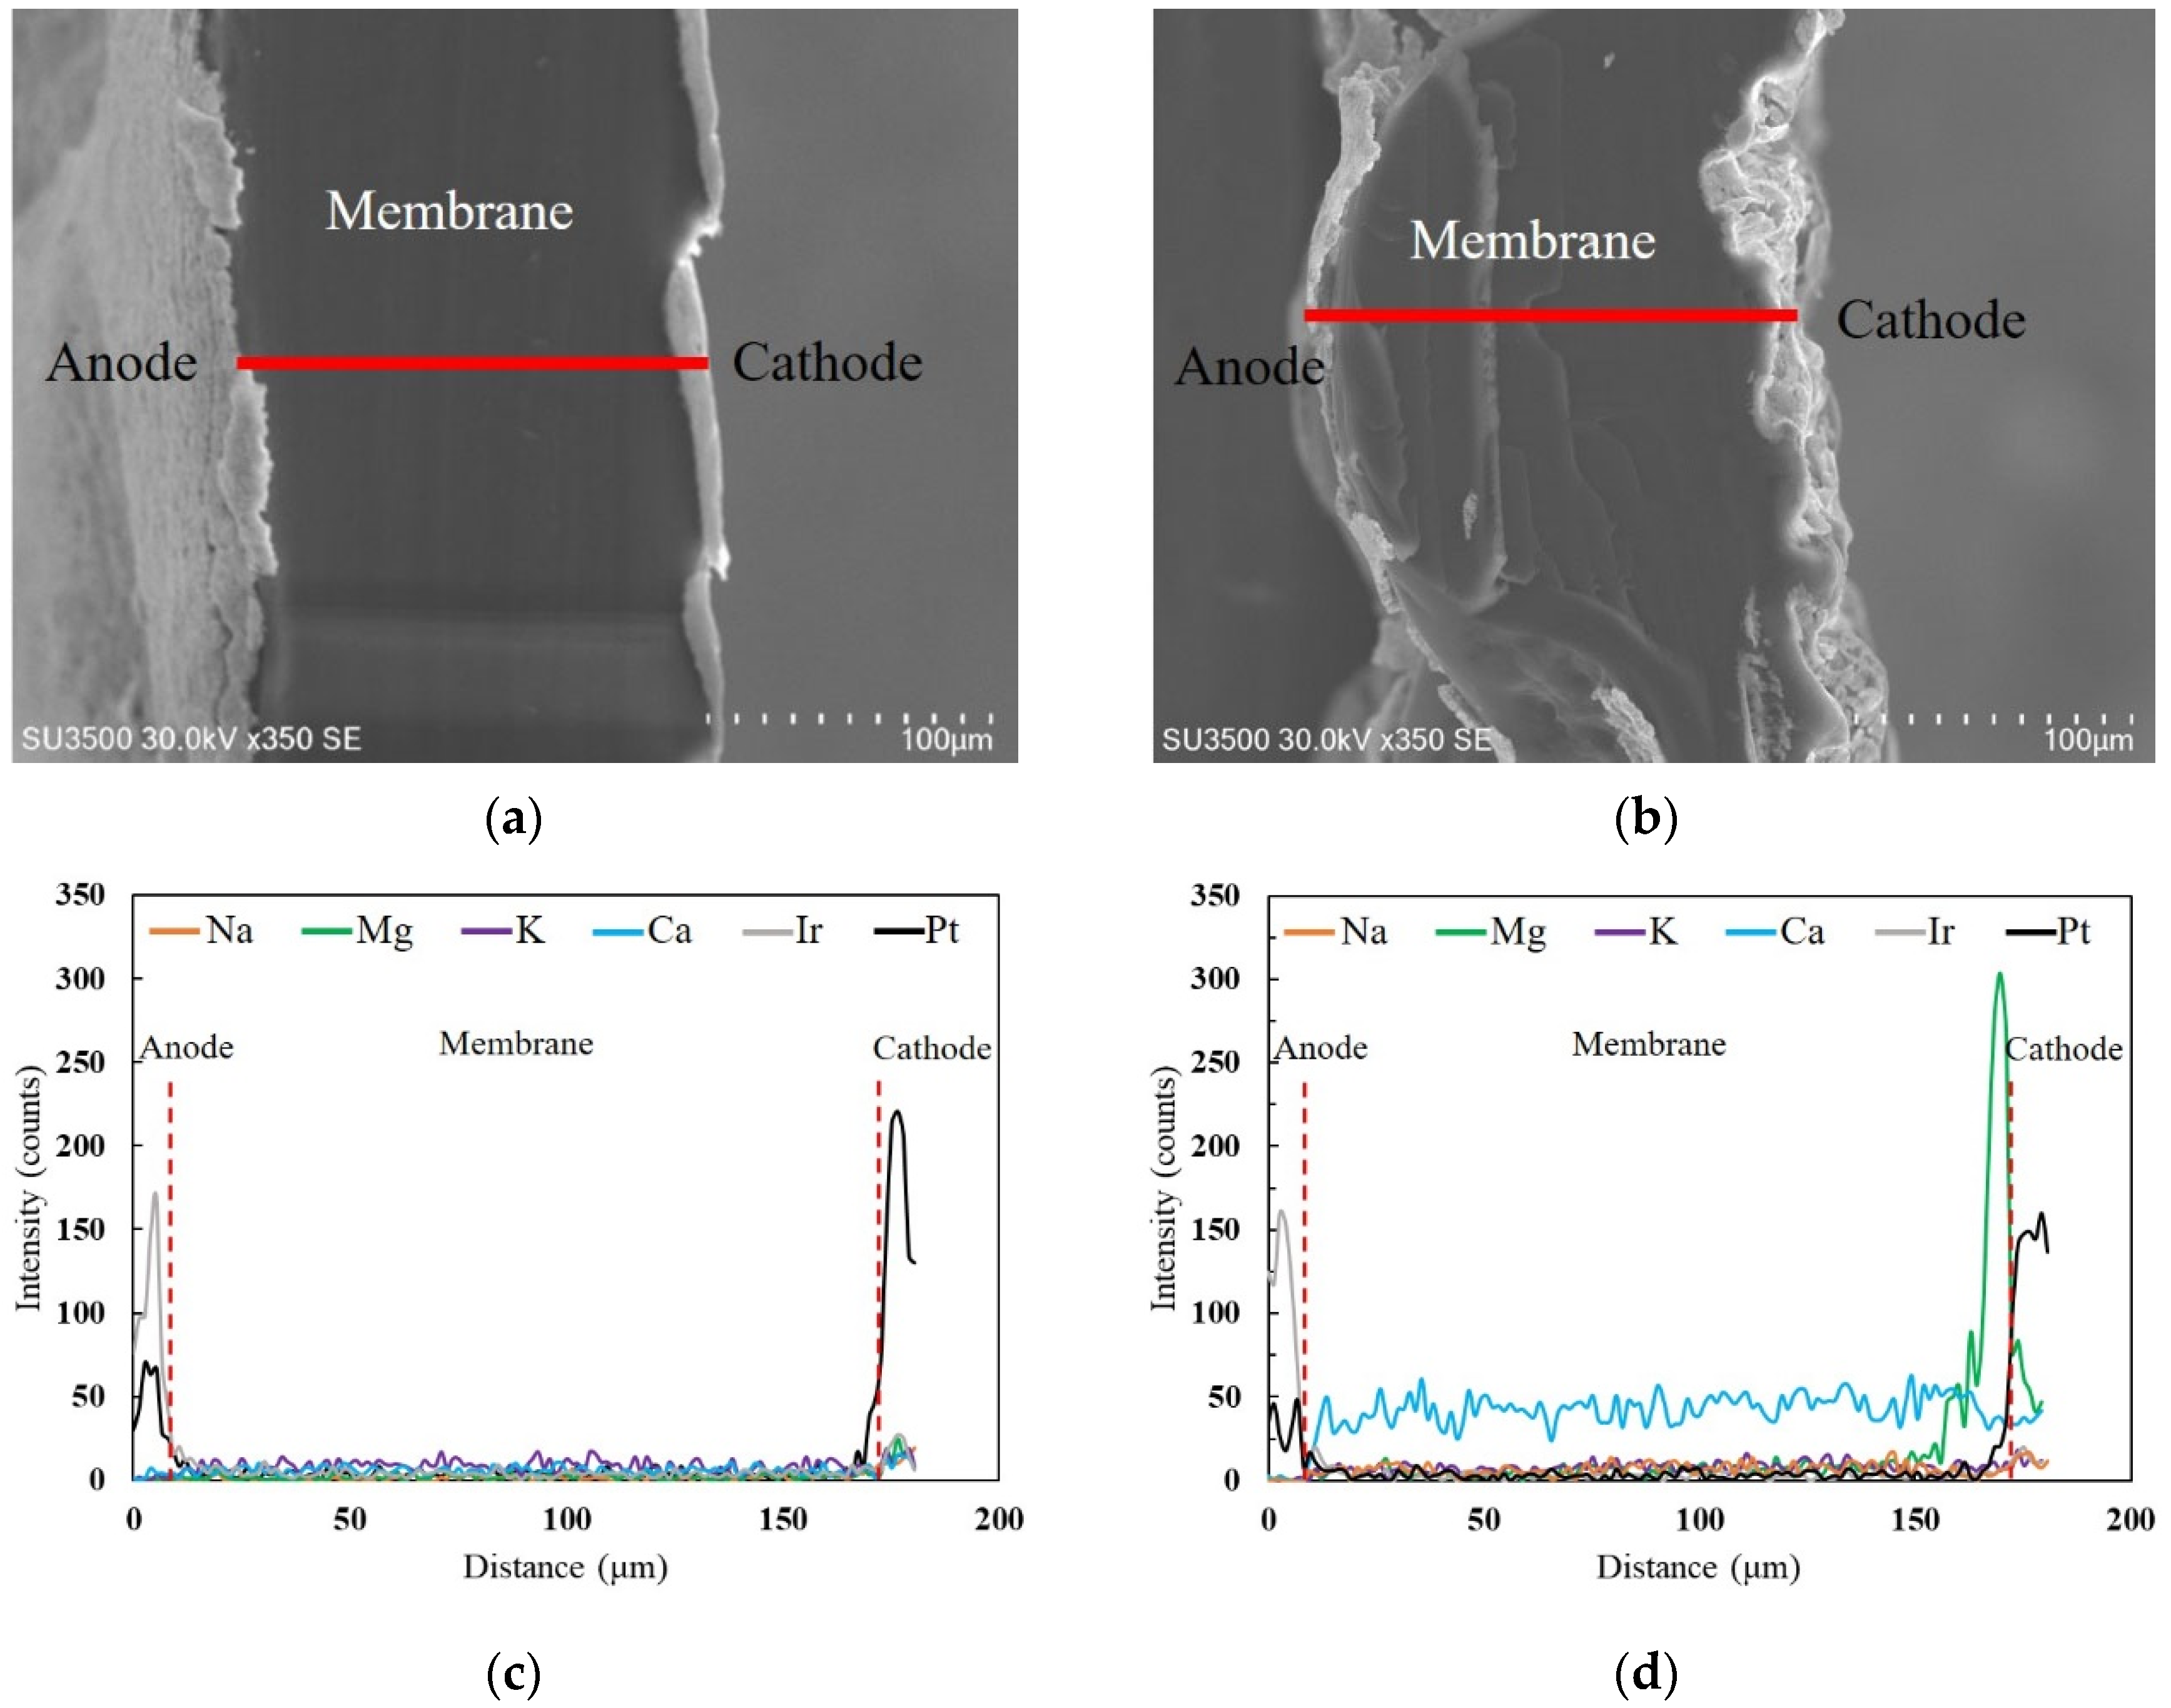
The cross-sectional area of the MEA was analyzed using SEM and EDX for cation distributions within the MEA. Figure 3 displays the SEM and EDX characterization profiles before and after soft water supply. The EDX measurements are shown along the red line in Figure 3a,b. As shown in Figure 3c,d, large amounts of Mg2+ and Ca2+ cations are distributed. However, the distributions of Mg2+ and Ca2+ are different; Mg2+ distribution is biased toward the cathode side with a peak before reaching the catalyst layer. However, Ca2+ is uniformly distributed from the anode to cathode. The difference in the distributions of Mg2+ and Ca2+ is attributed to the selectivity coefficient of the Nafion membrane. In general, the strength of affinity in the Nafion membrane is in the order of Ca2+ > Mg2+ > K+ > Na+ > H+. Therefore, Ca2+, having a stronger affinity is more easily absorbed and uniformly distributed, whereas Mg2+ possessing a weaker affinity than Ca2+ is mainly transferred to the cathode by the electric field. Accordingly, the cathode side is highly alkaline owing to the OH−, as indicated by Equation (3), and possible production of magnesium hydroxide.
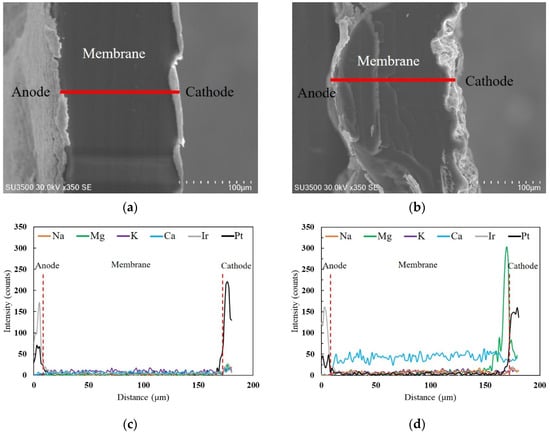
Figure 3.
SEM images of the cross-section of the MEA: (a) before and (b) after soft water supply. Line scanning EDX about the distribution of cations at the cross-section of the MEA: (c) before and (d) after soft water supply.
2.4. Effects of Monovalent and Divalent Cations
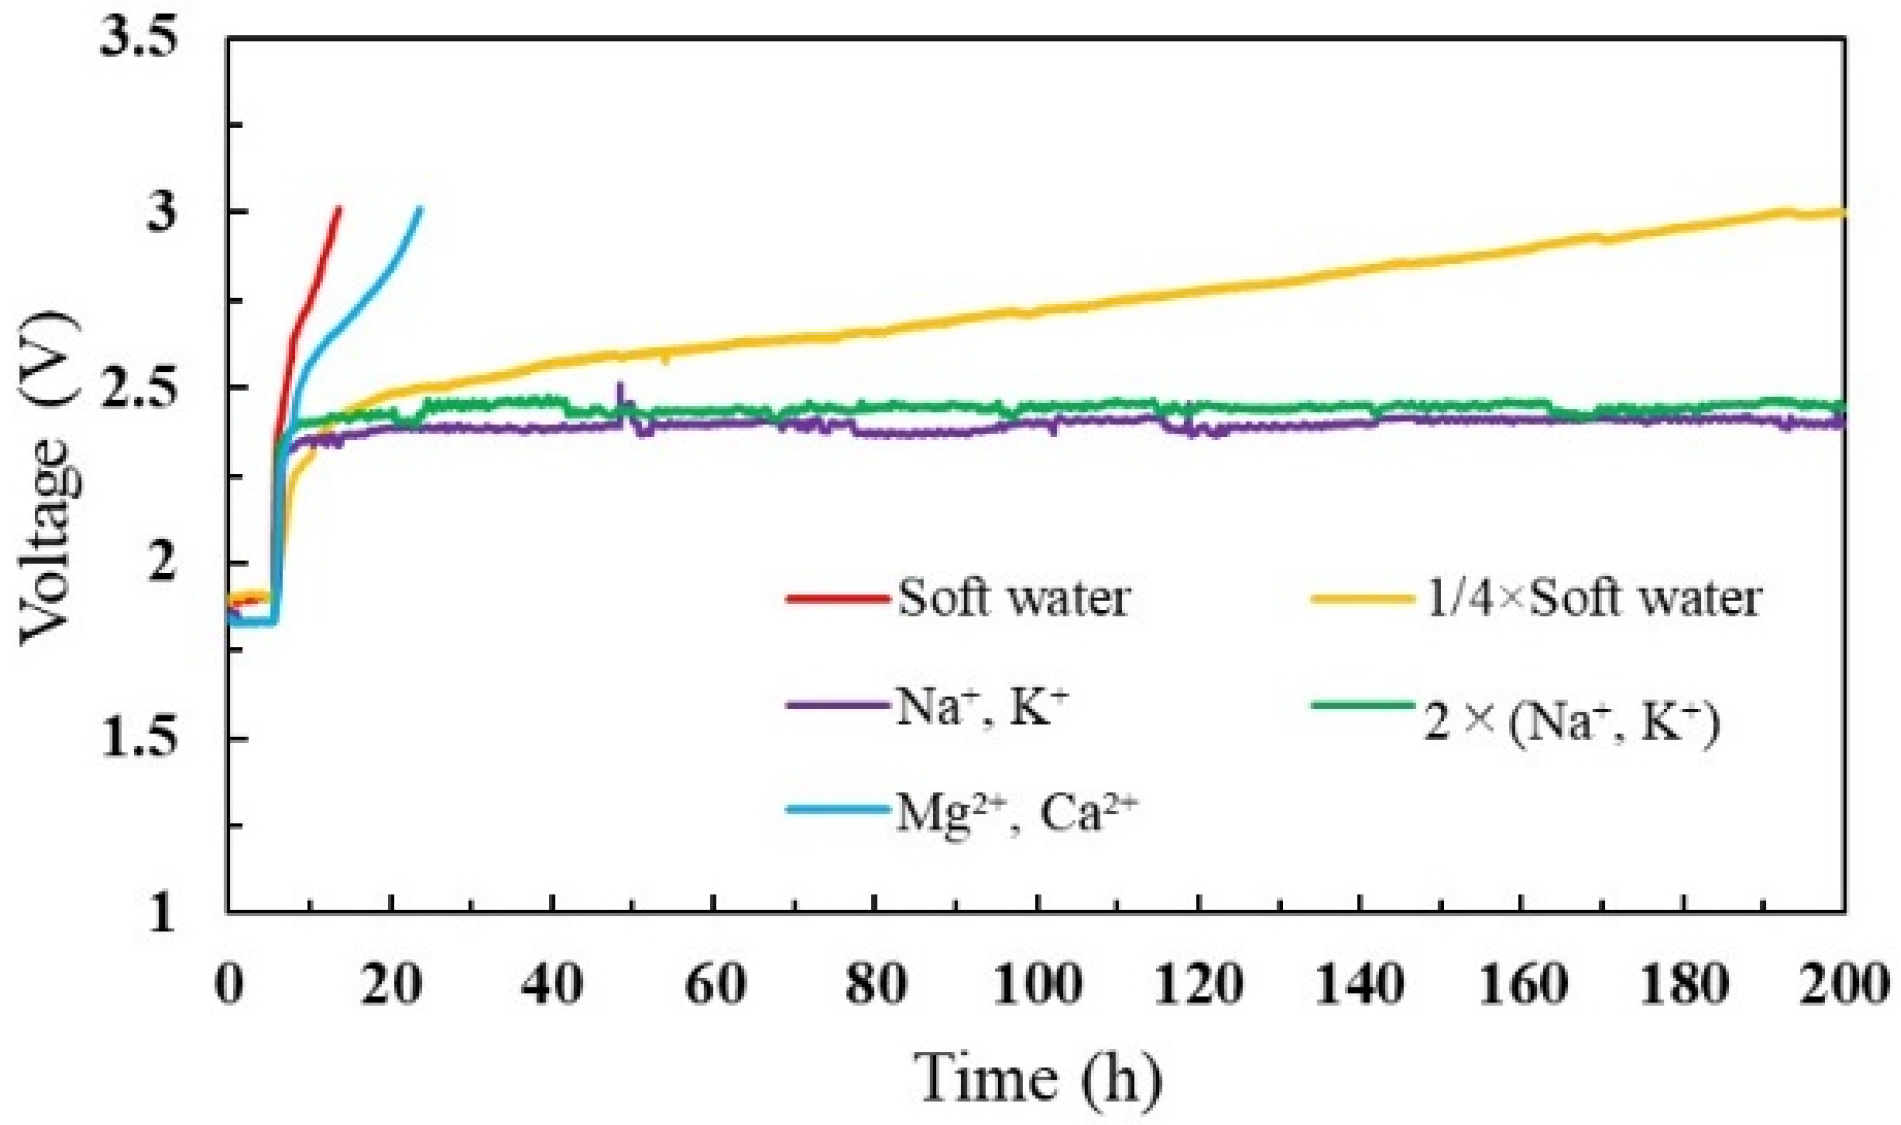
Divalent cations have a strong influence on the cell voltage increase. However, it is necessary to investigate the effects of cations with different concentrations of soft water over a long duration. Therefore, we prepared five kinds of soft water and analyzed their long-term effects on MEA. They are mixed ions (Na+, Mg2+, K+, Ca2+) concentrated soft water, ¼ mixed-ion diluted water, only with divalent cations (Mg2+, Ca2+) water, monovalent cation solution (Na+ and K+), and double concentrated monovalent-cation water. Initially, ultrapure water was supplied to the cell, and the cell voltage was stabilized for approximately 5 h, to confirm no individual differences between the cells before the degradation initialized. Subsequently, the above solutions were provided as the feed water. In this measurement, we supplied only one solution to each PEM electrolyzer.
The cell voltage was monitored for 200 h before it reached 3 V for each test analysis. As shown in Figure 4, both mixed cations (soft water) and divalent ions concentrated water induced a noticeable voltage increase. In addition, a steady voltage increase appeared when a ¼ concentration of mixed cations was introduced. However, the voltage increased up to a certain value and remained constant for monovalent cation concentrations. This may be because a higher affinity of Mg2+ and Ca2+ ions contribute to staying in the membrane and substituting protons (H+ ions), thereby increasing cell resistance and cell voltage. However, monovalent cations have a lower affinity than divalent ions, and ion attachment and removal might be repetitive inside the cell. Table 1 presents the amounts of contaminated cations on the MEA and feed water. When comparing the amount of cation contamination based on the water type, the divalent ions were more concentrated on the membrane. Generally, cations are not included in the ultrapure water. However, monovalent cations can migrate to the membranes during the fabrication process or corrosion of cell components [48,49]. Accordingly, monovalent cations adhered to the membrane, as shown in Table 1.

Figure 4.
Cell voltage profile for different feed-water solutions.

Table 1.
Concentration of cations adhered to the membrane electrodes and feed water based on water type.
We discussed the performance of a PEM cell for cation contamination by treated water. The PEM cell can be greatly affected by the voltage increase because the cell efficiency is inversely proportional to the cell voltage. The efficiency of the PEM electrolyzer can be calculated as follows (Equation (4)) [32]:
where VT is the thermoneutral voltage, ∆H is the enthalpy energy in the electrolysis process, F is the Faraday constant, and Vcell is the cell voltage. Here, we considered the number of hydrogen electrons to be 2 mol. In our system, the cell voltage increased owing to cation contamination on both the cathode and anode. Accordingly, the performance of the PEM electrolyzer decreased with increasing cell voltage. The cell voltage was more affected by the divalent cation contamination than the monovalent cations, leading to cell failure. In water treatment, divalent cations (Mg2+ and Ca2+) are easier to remove than monovalent cations [66]. However, it requires several filtration steps for ultrapure water.
3. Materials and Methods
3.1. PEM Electrolyzer Setup
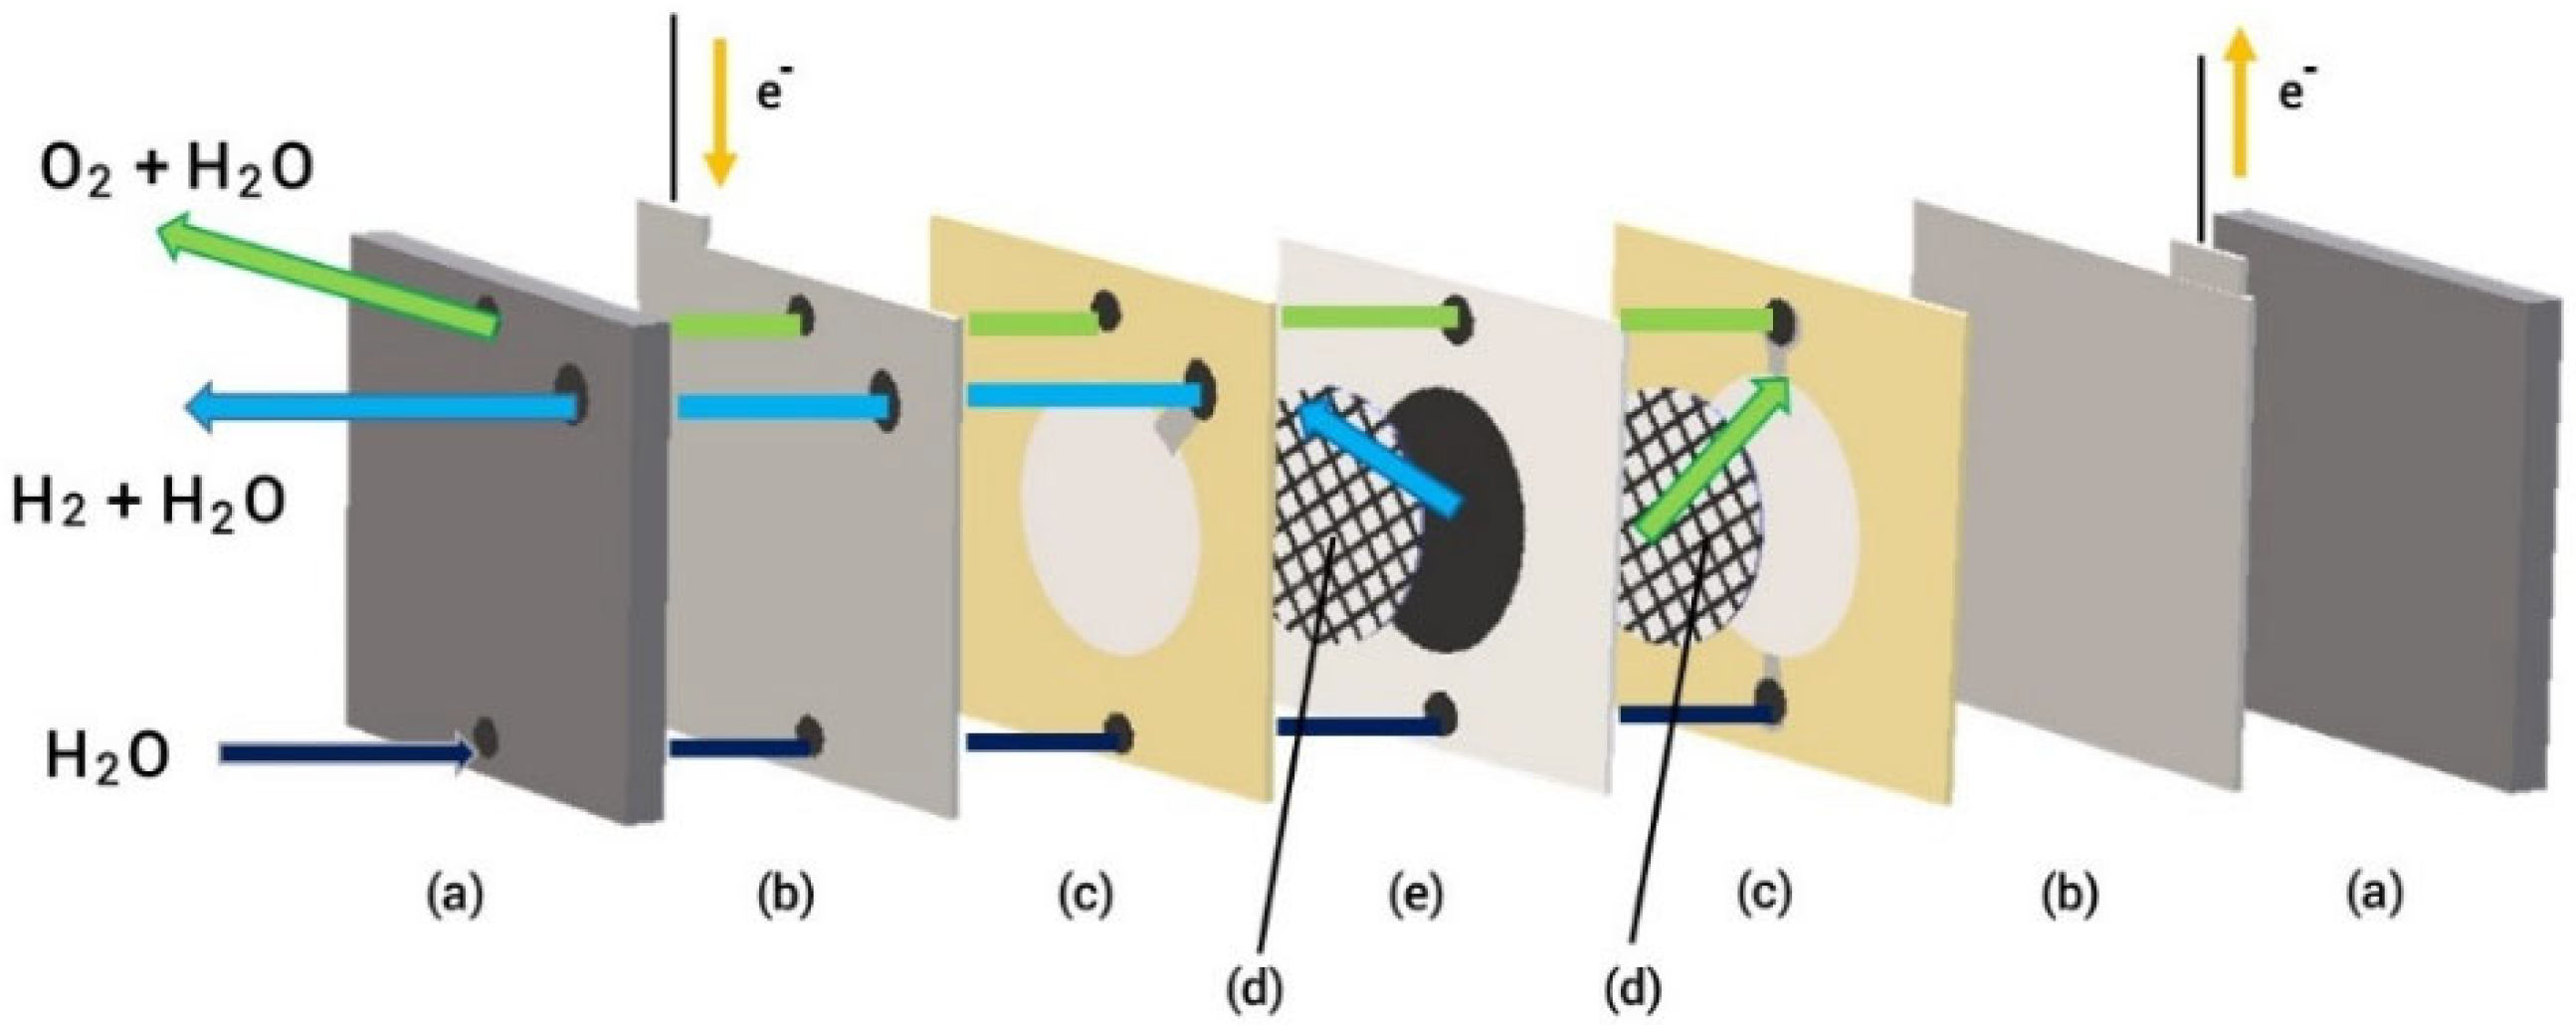
Figure 5 illustrates the configuration of a PEM electrolyzer (Enoah Inc., (Aichi, Japan) EHC 070), which consists of MEA with a Nafion membrane and noble metal catalysts, a gas diffusion layer as a passage for reactant transport, current collectors, and end plates used in our system. The active area of the electrodes was 11.34 cm2, and the allowable current density was 0–0.79 A/cm2). A platinum catalyst was utilized at the cathode for the hydrogen evolution reaction, whereas IrO2 was supported on the anode side. After passing through the electrolyte, H+ ions move from the anode to the cathode through the cation exchange membrane. At the cathode, they combine with electrons to generate hydrogen gas. An oxygen-evolving reaction takes places at the anode.

Figure 5.
Schematic of PEM electrolyzer assembly (a) end plates, (b) current collectors, (c) gaskets, (d) gas diffusion layers, (e) MEA.
3.2. Preparation of Feed Water
Deionized water or pure water was used as feed water for the actual operation of PEM water electrolysis. In general, pure water can be obtained from rivers, ponds, lakes, and groundwater through multiple filtration steps. Such water sources contain salts, which determine the hardness of water, where the hardness may vary depending on the region. In this study, we used artificial soft water as the water source to investigate the performance of the PEM electrolyzer. Artificial soft water was prepared by adding NaHCO3, CaSO4, MgSO4, and KCl solutions to ultrapure water (Fujifilm Wako Pure Chemical (Osaka, Japan), 212-01601) because these are the main minerals present in river water. Table 2 shows the detailed composition of soft water and its properties. These characteristics are recommended for reconstituted freshwater and are modified by the American Public Health Association (Washington, DC, USA, 1992) [54].
Table 2.
Summary of the properties of artificial soft water.
3.3. Experimental Setup and Characterizations
Figure 6 shows the experimental setup for analyzing the PEM performance with feed water. The operation was performed under atmospheric pressure and at room temperature. At the anode side, water was supplied to the lower side of the PEM cell using a pump. The direct current supplied to the cell was 9.0 A (0.79 A/cm2), and the rate of water supply was 1.5 mL/min. Hydrogen was generated at the cathode side, and the circulating water for H+ ion movement in the cell was also discharged. However, the residual water escaped from the anode with the oxygen evolution.
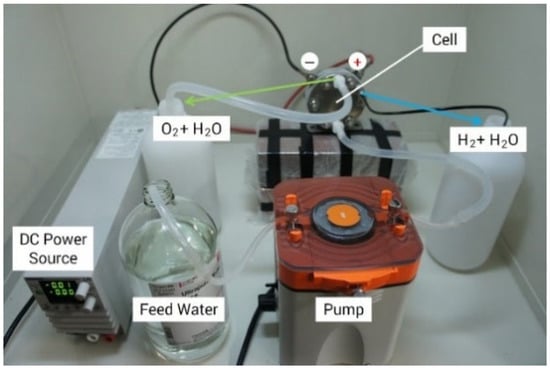
Figure 6.
Experimental setup of PEM electrolysis.
Because the feed water might contain cation impurities, they could adhere inside the cell and severely affect the PEM. Nitric acid (10 mL; Fujifilm Wako Pure Chemical, 141-01425) was prepared to investigate the cation contamination on the MEA. The MEA was immersed in nitric acid for approximately 60 min after each test operation. The extract was analyzed using inductively coupled plasma (ICP) emission analysis (Shimadzu, ICPS8100) to quantify the cations contaminated inside the cell. According to our measurement data, Na+, Mg2+, K+, and Ca2+ cations adhered to the cell.
To further investigate the effects of cation contamination on the MEA, scanning electron microscopy (SEM, HITACHI, SU3500) and energy-dispersive X-ray spectroscopy (EDX, AMETEK, EDAX Genesis APEX2) were performed. After the cell voltage increased to 3.0 V by the soft water, the distributed cations were analyzed along the cross-sectional area of the MEA. The MEAs (before and after soft water supply) were cut into small pieces for the SEM and EDX tests.
4. Conclusions
Low-cost hydrogen production is required to effectively store intermittent renewable sources while replacing fossil fuels. The treatment water could reduce the initial cost of PEM electrolysis. In this study, the effects of cations on the MEA were analyzed and reviewed by introducing treated soft water, including cation impurities. The findings indicated that the contaminated divalent cations induced a rapid cell voltage increase and severely degraded the PEM performance. However, the monovalent cations slightly increased the cell voltage and did not increase after that. The cations were contaminated on both cathode and anode, resulting in a dramatic increase in the voltage. The results of this study indicated that the divalent cation contamination severely affected the cell voltage, and they were more concentrated than the monovalent cations, causing cell failure. Thus, it affected the performance of the PEM cell. The effects of Mg2+ and Ca2+ were more intense than those of monovalent ions; additionally, these cations should be excluded from the feed water. Furthermore, it is possible to effectively remove divalent cations in treated water with a minimum step. An efficient hydrogen production system could be developed if the artificial soft water is supplied to the PEM electrolysis.
Author Contributions
Conceptualization, Y.O. and K.N.; methodology, R.Y., Y.S. and Y.O.; validation, R.Y., S.W. and Y.O.; formal analysis, S.W., R.Y. and Y.O.; data curation, S.W. and Y.O.; writing—original draft preparation, S.W.; writing—review and editing, S.W. and Y.O.; supervision, K.N. All authors have read and agreed to the published version of the manuscript.
Funding
Part of this work was supported by JSPS KAKENHI (Grant Number 19K12401).
Data Availability Statement
The data presented in this study are available on request from the corresponding author.
Conflicts of Interest
The authors declare no conflict of interest.
References
- Acar, C.; Dincer, I. Review and evaluation of hydrogen production options for better environment. J. Clean. Prod. 2019, 218, 835–849. [Google Scholar] [CrossRef]
- Ehteshami, S.M.M.; Chan, S.H. The role of hydrogen and fuel cells to store renewable energy in the future energy network-potentials and challenges. Energy Policy 2014, 73, 103–109. [Google Scholar] [CrossRef]
- Chi, J.; Yu, H. Water electrolysis based on renewable energy for hydrogen production. Chin. J. Catal. 2018, 39, 390–394. [Google Scholar] [CrossRef]
- Guo, Y.; Li, G.; Zhou, J.; Liu, Y. Comparison between hydrogen production by alkaline water electrolysis and hydrogen production by PEM electrolysis. IOP Conf. Ser. Earth Environ. Sci. 2019, 371, 042022. [Google Scholar] [CrossRef]
- Millet, P.; Grigoriev, S. Chapter 2—Water electrolysis technologies. In Renew Hydrogen Technologies: Production, Purification, Storage, Applications and Safety; Gandia, L.M., Arzamendi, G., Dieguez, P.M., Eds.; Elsevier: Amsterdam, The Netherlands, 2013; pp. 19–41. [Google Scholar] [CrossRef]
- Rashid, M.; Al Mesfer, M.; Naseem, H.; Danish, M. Hydrogen production by water electrolysis: A review of alkaline water electrolysis, PEM water electrolysis and high temperature water electrolysis. Int. J. Eng. Adv. Technol. 2015, 4, 80–93. Available online: https://www.academia.edu/25494218/Hydrogen_Production_by_Water_Electrolysis_A_Review_of_Alkaline_Water_Electrolysis_PEM_Water_Electrolysis_and_High_Temperature_Water_Electrolysis (accessed on 20 February 2022).
- Manabe, A.; Kashiwase, M.; Hashimoto, T.; Hayashida, T.; Kato, A.; Hirao, K.; Shimomura, I.; Nagashima, I. Basic study of alkaline water electrolysis. Electrochim. Acta 2013, 100, 249–256. [Google Scholar] [CrossRef]
- Ursua, A.; Gandia, L.M.; Sanchis, P. Hydrogen production from water electrolysis: Current status and future trends. Proc. IEEE 2012, 100, 410–426. [Google Scholar] [CrossRef]
- Carmo, M.; Fritz, D.L.; Mergel, J.; Stolten, D. A comprehensive review on PEM water electrolysis. Int. J. Hydrogen Energy 2013, 38, 4901–4934. [Google Scholar] [CrossRef]
- Zeng, K.; Zhang, D. Recent progress in alkaline water electrolysis for hydrogen production and applications. Prog. Energy Combust. Sci. 2010, 36, 307–326. [Google Scholar] [CrossRef]
- Grigoriev, S.A.; Porembsky, V.I.; Fateev, V.N. Pure hydrogen production by PEM electrolysis for hydrogen production. Int. J. Hydrogen Energy 2006, 31, 171–175. [Google Scholar] [CrossRef]
- Feng, Q.; Yuan, X.Z.; Liu, G.; Wei, B.; Zhang, Z.; Li, H.; Wang, H. A review of proton exchange membrane water electrolysis on degradation mechanisms and mitigation strategies. J. Power Sources 2017, 366, 33–55. [Google Scholar] [CrossRef]
- Marshall, A.; Borresen, B.; Hagen, G.; Tsypkin, M.; Tunold, R. Hydrogen production by advanced proton exchange membrane (PEM) water electrolysers reduced energy consumption by improved electrocatalysis. Energy 2007, 32, 431–436. [Google Scholar] [CrossRef]
- Ayers, K.E.; Capuano, C.B.; Anderson, E.B. Recent advances in cell cost and efficiency for PEM-based water electrolysis. ECS Trans. 2012, 41, 15–22. [Google Scholar] [CrossRef]
- Barbir, F. PEM electrolysis for production of hydrogen from renewable energy sources. Sol. Energy 2005, 78, 661–669. [Google Scholar] [CrossRef]
- Ayers, K.E.; Anderson, E.B.; Capuano, C.B.; Carter, B.; Dalton, L.; Hanlon, G.; Manco, J.; Niedzwiecki, M. Research advances towards low cost, high efficiency, PEM electrolysis. ECS Trans. 2010, 33, 3–15. [Google Scholar] [CrossRef]
- Rakousky, C.; Keeley, G.P.; Wippermann, K.; Carmo, M.; Stolten, D. The stability challenge on the pathway to high-current-density polymer electrolyte membrane water electrolyzers. Electochim. Acta 2018, 278, 324–331. [Google Scholar] [CrossRef]
- Millet, P.; Andolfatto, F.; Durand, R. Design and performance of a solid polymer electrolyte water electrolyzer. Int. J. Hydrogen Energy 1996, 21, 87–93. [Google Scholar] [CrossRef]
- Song, S.; Zhang, H.; Ma, X.; Shao, Z.; Baker, R.T.; Yi, B. Electrochemical investigation of electrocatalysts for the oxygen evolution reaction in PEM water electrolyzers. Int. J. Hydrogen Energy 2008, 33, 4955–4961. [Google Scholar] [CrossRef]
- Tavassoli, A.; Lim, C.; Kolodziej, J.; Lauritzen, M.; Knights, S.; Wang, G.G.; Kjeang, E. Effect of catalyst layer defects on local membrane degradation in polymer electrolyte fuel cells. J. Power Sources 2016, 322, 17–25. [Google Scholar] [CrossRef]
- Siracusano, S.; Baglio, V.; Blasi, A.D.; Briguglio, N.; Stassi, A.; Ornelas, R.; Trifoni, E.; Antonucci, V.; Arico, A.S. Electrochemical characterization of single cell and short stack PEM electolyzers based on a nanosized IrO2 anode electrocatalyst. Int. J. Hydrogen Energy 2010, 35, 5558–5568. [Google Scholar] [CrossRef]
- Marshall, A.T.; Sunde, S.; Tsypkin, M.; Tunold, R. Performance of a PEM water electrolysis using IrxRuyTazO2 electrocatalysts for the oxygen evolution electrode. Int. J. Hydrogen Energy 2007, 32, 2320–2324. [Google Scholar] [CrossRef]
- Iqbal, S. Spatial charge separation and transferr in L-cystenie capped NiCoP/CdS nano-heterojunction activated with intimate covalent bonding for high-quantum-yield photovoltaic hydrogen evolution. Appl. Catal. B Environ. 2020, 274, 119097. [Google Scholar] [CrossRef]
- Irfan, R.M.; Tahir, M.H.; Maqsood, M.; Lin, Y.; Bashir, T.; Iqbal, S.; Zhao, J.; Gao, L.; Haroon, M. CoSe as non-noble-metal cocatalyst integrated with heterojunction photosensitizer for inexpensive H2 production under visible light. J. Catal. 2020, 390, 196–205. [Google Scholar] [CrossRef]
- Millet, P.; Mbemba, N.; Grigoriev, S.A.; Fateev, V.N.; Aukauloo, A.; Etievant, C. Electrochemical performances of PEM water electrolysis cells and perspectives. Int. J. Hydrogen Energy 2011, 36, 4134–4142. [Google Scholar] [CrossRef]
- Immerz, C.; Schweins, M.; Trinke, P.; Bensmann, B.; Paidar, M.; Bystron, T.; Bouzek, K.; Hanke-Rauschenbach, R. Experimental characterization of inhomogeneity in current density and temperature distribution along a single-channel PEM water electrolysis cell. Electrochim. Acta 2018, 260, 582–588. [Google Scholar] [CrossRef]
- Chandesris, M.; Medeau, V.; Guillet, N.; Chelghoum, S.; Thoby, D.; Fouda-Onana, F. Membrane degradation in PEM water electrolyzer: Numerical modeling and experimental evidence of the influence of temperature and current density. Int. J. Hydrogen Energy 2015, 40, 1353–1366. [Google Scholar] [CrossRef]
- AL Shakhshir, S.; Cui, Z.; Frensch, S.; Kær, S.K. In-Stiu experimental characterization of the clamping pressure effects on low temperature polymer electrolyte membrane electrolysis. Int. J. Hydrogen Energy 2017, 42, 21579–21606. [Google Scholar] [CrossRef]
- Suermann, M.; Bensmann, B.; Hanke-Rauschenbach, R. Degradation of proton exchange membrane (PEM) water electrolysis cells: Looking beyond the cell voltage increase. J. Electrochem. Soc. 2019, 166, F645. [Google Scholar] [CrossRef]
- Papakonstantinou, G.; Algara-Siller, G.; Teschner, D.; Vidakovic-Koch, T.; Schlogl, R.; Sundmacher, K. Degradation study of a proton exchange membrane water electrolyzer under dynamic operation conditions. Appl. Energy 2020, 280, 115911. [Google Scholar] [CrossRef]
- Ferreira, R.B.; Falcao, D.D.; Pinto, A.M.F.R. Simulation of membrane chemical degradation in a proton exchange membrane fuel cell by computational fluid dynamics. Int. J. Hydrogen Energy 2021, 46, 1106–1120. [Google Scholar] [CrossRef]
- Sun, S.; Shao, S.; Yu, H.; Li, G.; Yi, B. Investigations on degradation of long-term proton exchange membrane water electrolysis stack. J. Power Source 2014, 267, 515–520. [Google Scholar] [CrossRef]
- Grigoriev, S.A.; Dzhus, K.A.; Bessarabov, D.G.; Millet, P. Failure of PEM water electrolysis cells: Case study involving anode dissolution and membrane thinning. Int. J. Hydrogen Energy 2014, 39, 20440–20446. [Google Scholar] [CrossRef]
- Scherer, G.G.; Momose, T.; Tomiie, K. Membrel-water electrolysis cells with a fluorinated cation exchange membrane. J. Electrochem. Soc. 1988, 135, 3071–3073. [Google Scholar] [CrossRef]
- Sun, S.; Xiao, Y.; Liang, D.; Shao, Z.; Yu, H.; Hou, M.; Yi, B. Behaviors of a proton exchange membrane electrolyzer under water starvation. RSC Adv. 2015, 5, 14506–14513. [Google Scholar] [CrossRef]
- Wang, X.; Zhang, L.; Li, G.; Zhang, G.; Shao, Z.G.; Yi, B. The influence of ferric ion contamination on the solid polymer electrolyte water electrolysis performance. Electrochim. Acta 2015, 158, 253–257. [Google Scholar] [CrossRef]
- Selamet, O.F.; Becerikli, F.; Mat, M.D.; Kaplan, Y. Development and testing of a highly efficient proton exchange membrane (PEM) electrolyzer stack. Int. J. Hydrogen Energy 2011, 36, 11480–11487. [Google Scholar] [CrossRef]
- Cheng, X.; Shi, Z.; Glass, N.; Zhang, L.; Zhang, J.; Song, D.; Liu, Z.-S.; Wang, H.; Shen, J. A review of PEM hydrogen fuel cell contamination: Impacts, mechanisms, and mitigation. J. Power Source 2007, 165, 739–756. [Google Scholar] [CrossRef]
- Pozio, A.; Silva, R.F.; Francesco, M.D.; Giorgi, L. Nafion degradation in PEFCs from end plate iron contamination. Electrochim. Acta 2003, 48, 1543–1549. [Google Scholar] [CrossRef]
- Li, N.; Araya, S.S.; Kær, S.K. Long-term contamination effect of iron ions on cell performance degradation of proton exchange membrane water electrolyser. J. Power Source 2019, 434, 226755. [Google Scholar] [CrossRef]
- Li, N.; Araya, S.S.; Kær, S.K. The effect of Fe3+ contamination in feed water on proton exchange membrane electrolyzer performance. Int. J. Hydrogen Energy 2019, 44, 12952–12957. [Google Scholar] [CrossRef]
- Frensch, S.H.; Serre, G.; Fouda-Onana, F.; Jensen, H.C.; Christensen, M.L.; Araya, S.S.; Kær, S.K. Impact of iron and hydrogen peroxide on membrane degradation for polymer electrolyte membrane water electrolysis: Computational and experimental investigation on fluoride emission. J. Power Source 2019, 420, 54–62. [Google Scholar] [CrossRef]
- Li, N.; Araya, S.S.; Cui, X.; Kær, S.K. The effects of cationic impurities on the performance of proton exchange membrane water electrolyzer. J. Power Source 2020, 473, 228617. [Google Scholar] [CrossRef]
- Zhu, J.; Tan, J.; Pan, Q.; Liu, Z.; Hou, Q. Effects of Mg2+ contamination on the performance of proton exchange membrane fuel cell. Energy 2019, 189, 116135. [Google Scholar] [CrossRef]
- Hongsirikarn, K.; Goodwin, J.G., Jr.; Greenway, S.; Creager, S. Effect of cations (Na+, Ca2+, Fe3+) on the conductivity of a Nafion membrane. J. Power Source 2010, 195, 7213–7220. [Google Scholar] [CrossRef]
- Uddin, M.A.; Wang, X.; Park, J.; Pasaogullari, U.; Bonville, L. Distributed effects of calcium ion contaminant on polymer electrolyte fuel cell performance. J. Power Source 2015, 296, 64–69. [Google Scholar] [CrossRef] [Green Version]
- Okada, T.; Ayato, Y.; Yuasa, M.; Sekine, I. The effect of impurity cations on the transport characteristics of perfluorosulfonated ionomer membranes. J. Phys. Chem. B 1999, 103, 3315–3322. [Google Scholar] [CrossRef]
- Zhang, L.; Jie, X.; Shao, Z.G.; Wang, X.; Yi, B. The dynamic-state effects of sodium ion contamination on the solid polymer electrolyte water electrolysis. J. Power Source 2013, 241, 341–348. [Google Scholar] [CrossRef]
- Zhang, L.; Jie, X.; Shao, Z.G.; Zhou, Z.M.; Xiao, G.; Yi, B. The influence of sodium ion on the solid polymer electrolyte water electrolysis. Int. J. Hydrogen Energy 2012, 37, 1321–1325. [Google Scholar] [CrossRef]
- Kelly, M.J.; Fafilek, G.; Besenhard, J.O.; Kronberger, H.; Nauer, G.E. Contaminant absorption and conductivity in polymer electrolyte membranes. J. Power Source 2005, 145, 249–252. [Google Scholar] [CrossRef]
- Okada, T. Theory for water management in membranes for polymer electrolyte fuel cells: Part 1. The effect of impurity ions at the anode side on the membrane performances. J. Electroanal. Chem. 1999, 465, 1–17. [Google Scholar] [CrossRef]
- Jia, X.; Shao, Z.G.; Yi, B. The effect of different valency cations on DMFC performance. Electrochem. Commun. 2010, 12, 700–702. [Google Scholar] [CrossRef]
- Clever, M.; Jordt, F.; Knauf, R.; Rabiger, N.; Rudebusch, M.; Hilker-Scheibel, R. Process water production from river water by ultrafiltration and reverse osmosis. Desalination 2000, 131, 325–326. [Google Scholar] [CrossRef]
- APHA; AWWA; WEF. 8010 E. Perpetrating Organisms for Toxicity Tests. In Standard Methods for the Examination of Water and Wastewater, 20th ed.; APHA Press: Washington, DC, USA, 1998. [Google Scholar] [CrossRef]
- Elimelech, M.; Phillip, W.A. The future of seawater desalination: Energy, technology, and the environment. Science 2011, 333, 712–717. [Google Scholar] [CrossRef] [PubMed]
- Oren, Y. Capacitive deionization (CDI) for desalination and water treatment—Past, present and future. Desalination 2008, 228, 10–29. [Google Scholar] [CrossRef]
- Al-Amshawee, S.; Yunus, M.Y.B.M.; Azoddein, A.A.M.; Hassell, D.G.; Dakhil, I.H.; Hasan, H.A. Electrodialysis desalination for water and wastewater: A review. Chem. Eng. J. 2020, 380, 122231. [Google Scholar] [CrossRef]
- Li, Y.; Qi, J.; Li, J.; Shen, J.; Liu, Y.; Sun, X.; Shen, J.; Han, W.; Wang, L. Nitrogen-doped hollow mesoporous carbon spheres for efficient water desalination by capacitive deionization. ACS Sustain. Chem. Eng. 2017, 5, 6635–6644. [Google Scholar] [CrossRef]
- Lee, J.; Srimuk, P.; Aristizabal, K.; Kim, C.; Choudhury, S.; Nah, Y.-C.; Mücklich, F.; Presser, V. Pseudocapacitive desalination of brackish water and seawater with vanadium-pentoxide-decorated multiwalled carbon nanotubes. ChemSusChem 2017, 10, 3611–3623. [Google Scholar] [CrossRef]
- Han, B.; Cheng, G.; Wang, Y.; Wang, X. Structure and functionality design of novel carbon and faradaic electrode materials for high-performance capacitive deionization. Chem. Eng. J. 2019, 360, 364–384. [Google Scholar] [CrossRef]
- Anwer, S.; Anjum, D.H.; Luo, S.; Abbas, Y.; Li, B.; Iqbal, S.; Liaoae, K. 2D Ti3C2Tx MXene nanosheets coated cellulose fibers based 3D nanostructures for efficient water desalination. Chem. Eng. J. 2021, 15, 126827. [Google Scholar] [CrossRef]
- Marangio, F.; Santarelli, M.; Cali, M. Theoretical model and experimental analysis of a high pressure PEM water electrolyzer for hydrogen production. Int. J. Hydrogen Energy 2009, 34, 1143–1158. [Google Scholar] [CrossRef]
- Garcia-Valverde, R.; Espinosa, N.; Urbina, A. Simple PEM water electrolyzer model and experimental validation. Int. J. Hydrogen Energy 2012, 37, 1927–1938. [Google Scholar] [CrossRef]
- Awasthi, A.; Scott, K.; Basu, S. Dynamic modeling and simulation of a proton exchange membrane electrolyzer for hydrogen production. Int. J. Hydrogen Energy 2011, 36, 14779–14786. [Google Scholar] [CrossRef]
- Santarelli, M.; Medina, P.; Cali, M. Fitting regression model and experimental validation for a high-pressure PEM electrolyzer. Int. J. Hydrogen Energy 2009, 34, 2519–2530. [Google Scholar] [CrossRef]
- Zeppenfeld, K. Electrochemical removal of calcium and magnesium ions from aqueous solutions. Desalination 2011, 277, 99–105. [Google Scholar] [CrossRef]

Publisher’s Note: MDPI stays neutral with regard to jurisdictional claims in published maps and institutional affiliations. |
© 2022 by the authors. Licensee MDPI, Basel, Switzerland. This article is an open access article distributed under the terms and conditions of the Creative Commons Attribution (CC BY) license (https://creativecommons.org/licenses/by/4.0/).