Abstract
Fuel electrode-supported tubular protonic ceramic cells (FETPCCs) based on the BaZr0.4Ce0.4Y0.15Zn0.05O3−δ (BZCYZ) membrane electrolyte was fabricated through a two-step method, in which the polyporous electrode-support tube was prepared with a traditional slip casting technique in a plaster mold, and the BZCYZ membrane was produced by a dip-coating process on the outside surface of the electrode-support tube. The dense thin-film electrolyte of BZCYZ with a thickness of ~25 μm was achieved by cofiring the fuel electrode support and electrolyte membrane at 1450 °C for 6 h. The electrochemical performances of the FETPCCs were tested under different solid oxide cell modes. In protonic ceramic fuel cell (PCFC) mode, the peak power densities of the cell reached 151–191 mW·cm−2 at 550–700 °C and exhibited relatively stable performance during continuous operation over 100 h at 650 °C. It was found that the major influence on the performance of tubular PCFC was the resistance and cathode current collectors. Additionally, in protonic ceramic electrolysis cell (PCEC) mode, the current densities of 418–654 mA·cm−2 were obtained at 600–700 °C with the applied voltage of 2.0 V when exposed to 20% CO2–80% H2 and 3% H2O/air. Using distribution of relaxation time analysis, the electrolytic rate-limiting step of the PCEC model was determined as the adsorption and dissociation of the gas on the electrode surface.
1. Introduction
Solid oxide fuel cells (SOFCs) have garnered considerable attention because they have high energy conversion efficiency and flexible fuel power generation as well as a pollution-free system [1,2,3,4]. With global warming and rapidly increasing energy demand, the conversion of CO2 to valuable chemicals and fuels is a constant expectation. To date, CO2 conversion via solid oxide electrolysis cells (SOECs) has shown promising practical applications due to low overpotential and high Faradaic efficiency facilitated by high-temperature operation via off-grid solar or wind power. In summary, solid oxide cells (SOCs) can be converted into SOFC or SOEC modes at different functional requirements [5,6,7].
Up to now, two types of SOC stack structures, planar and tubular, have been widely studied. Although planar SOC exhibits high power density in a highly compact configuration via simple tape casting, screen-printing, and dry press methods, only a handful of sealing agents are able to withstand the thermal cycles in operation. Another problem with this design is that it requires a relatively long startup time to avoid the formation of cracks in the thin-plane configuration. Compared with this, the tubular configuration is more reliable without high-temperature sealing, which proves its ability to withstand the rapid heat cycle [8,9]. However, it is more difficult to achieve a high power density with tubular SOC because of its elongated electronic pathways.
Furthermore, depending on the conducting electrolytes, SOCs are classified into oxygen-ion-conducting and proton-conducting cells. Conventional oxygen-ion conduction demands a relatively high operating temperature, which results in higher production and operational costs and lower long term stability, thereby limiting the commercial deployment of SOFCs [10]. As the activation energy of the proton-conducting electrolyte (0.4–0.6 eV [11]) is lower than oxygen-ion conducting electrolyte (0.83–1.05 eV [12,13]), it exhibits higher conductivity at low temperatures [14]. These properties have given rise to a great deal of interest in the application of proton-conducting SOCs at 400~700 °C. Among many proton-conducting electrolyte materials, Y2O3 has unique physical properties and is mainly used as an additive in optical glass and ceramic materials [15,16]. Y2O3-doped BaZrO3 and BaCeO3 and their solid solutions are widely studied and considered to be the most promising electrolytes for proton-conducting SOFCs [4,7,17].
So far, the preparation methods of tubular SOCs (such as extrusion [18], gel-casting, phase conversion [19], and atmospheric plasma-spraying [20]) have attracted much attention. However, one of the major problems is the trade-off between the preparation process, production costs, and product quality. Compared with the above-mentioned methods, slip casting is characterized by simple equipment, easy processing and uniform casting composition, and dense electrolytes are supported by the dip-coating process [7,10,21,22]. Herein, as a proof-of-concept study, electrode-supported tubular protonic ceramic cells were successfully fabricated by using slip-casting and dip-coating methods, and their corresponding SOFC and SOEC modes have also been studied. In the SOFC mode, cell power density was evaluated at different temperatures, and cell stability was also measured for 100 h. Additionally, electrocatalytic CO2 reduction at various temperatures was measured in SOEC mode, and the influence of different protective gas concentrations on the electrolytic process are discussed in this study.
2. Results and Discussion
The XRD of the BZCYZ powders (cubic perovskite structure; the band gap energy is 2.96 eV based on the UV-vis diffuse reflectance spectrum [23], see Figure S1) obtained at room temperature is illustrated in Figure 1a [24], and no secondary phase was discovered. Figure 1b exhibits the XRD spectra of BZCYZ-NiO (1:1 in weight ratio) mixture sintered at 1150 °C for 2 h, and neither additional diffraction peaks nor peak shifts were observed, indicating BZCYZ and NiO are compatible with each other.
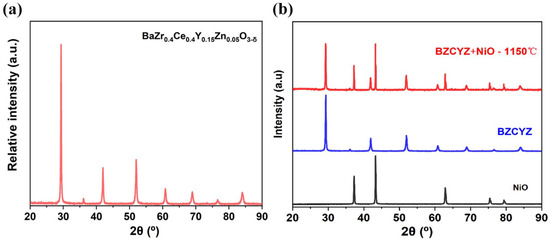
Figure 1.
(a) Powder XRD pattern of the BZCYZ sintered at 1150 °C for 10 h. (b) Chemical compatibility test between BZCYZ and NiO at 1150 °C for 2 h.
Figure 2a shows the overall cross-section of the SOFC with a fuel electrode covering the entire cell thickness. Compared with planar anode-supported fuel cells, the tube fuel cell must be thick enough to enhance the body strength of the anode. The porosity, mechanical performance, and shrinkage of the anode support depend on the thickness of the anode support. In the cofiring process, the fuel electrode tubular support body should be in accordance with the rate of contraction of the electrolyte. If the shrinking speed of the support is faster or slower than that of the electrolyte, then it may result in cell structural damage [25]. Figure 2b shows the cross-sectional microstructure of the assembled cell. The overall thickness of the electrolyte was about 25 μm, and the composite cathode was about 5 μm. Figure 2c shows an enlarged electrolyte layer microstructure sintered for 6 h at 1450 °C, when the electrolyte is sufficiently dense to avoid gas mixing. The electrolyte owns several closed but not interconnected pinholes, which was attributed to the fast heating rate and uncompleted removal of organic matter additives. Figure 2d shows an enlarged anode support view. The observed uniform pores in the anode support were convenient to quickly distribute gas and generate electrochemical catalytic reaction sites. It is evident from observations of the microstructure that the combination of sequential slip casting, dip-coating, and cofiring techniques is applicable to the production of fuel electrode-supported tubular fuel cells.
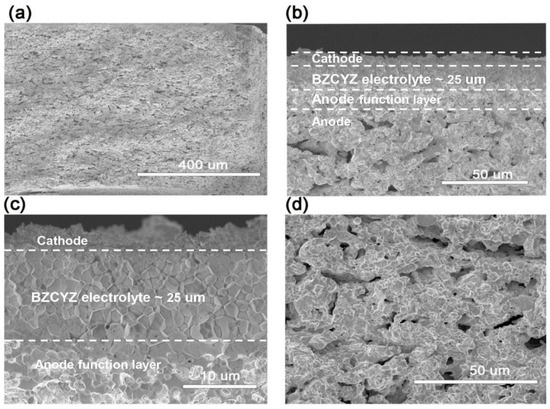
Figure 2.
Cross-sectional SEM images of tubular fuel electrode for SOFC. (a) Overall cross-sectional microstructure. (b) Magnified view of cathode–electrolyte–anode functional layer–anode. (c) Magnified electrolyte microstructure. (d) Anode support microstructure.
Figure 3a represents electrochemical performance conducted at 550–700 °C. The OCVs of the fuel cell mode were 0.96 V, 0.99 V, 1.01 V, and 1.02 V at 700 °C, 650 °C, 600 °C, and 550 °C, respectively. The OCVs were somewhat below the theoretical value of a dense proton-conducting fuel cell [26,27,28]. The OCV deviation from the Nernst potential at various temperatures was mainly due to the reduction of the electrons in the electrolyte and the sealing of the fuel cells and electrodes [29]. This was mainly due to the reduction of Ce3+ from Ce4+ in the electrolyte at low partial oxygen pressures, resulting in unavoidable electronic conductivity in the electrolyte [30,31]. The OCV of the nearly prepared anode support fuel cell was realized by using a 25 μm electrolyte prepared by a dip-coating method, thus showing sufficient density of the electrolyte [32,33,34,35,36,37]. The power densities of our cells were 191 mW·cm−2, 181 mW·cm−2, 152 mW·cm−2, and 111 mW·cm−2 at 700 °C, 650 °C, 600 °C, and 550 °C, respectively. Figure 3b shows the EIS results of the fuel cell mode from 700 °C to 600 °C, and the ohmic resistance and polarization resistance decreased significantly. The total area’s specific resistance was determined by ohmic resistance, which mainly related to the thickness of the fuel electrode and electrolyte. Properly increasing the thickness of the anode support could improve the success probability of the cell during sintering. The resistance to polarization of the electrode increases gradually, which is mainly due to a reduction in the catalytic activity of the surface of the electrode as the temperature drops [38]. Even though 700 °C has shown better SOFC performance, it is not suitable for practical application, and the current collecting ability of silver paste degrades under long-term high-temperature treatment. Therefore, the stability tests over 100 h at 650 °C and 600 °C were conducted. Figure 3c shows the V-I and P-I curves of the fuel cell mode following the 100 h stability test. The power densities of the cell were 153 mW·cm−2 and 112 mW·cm−2 at 650 °C and 600 °C, respectively. Figure 3d shows the EIS of the cell at 650 °C and 600 °C after 100 h of fuel cell stability testing. The ohmic resistance of the cell was 1.25 Ω·cm2 and 1.29 Ω·cm2 at 650 °C and 600 °C, respectively, over 100 h, and its polarization resistance was 0.2 Ω·cm2 and 0.4 Ω·cm2 at 650 °C and 600 °C, respectively. As the NiO reduced to Ni, the ohmic resistance and the polarization resistance decreased significantly.
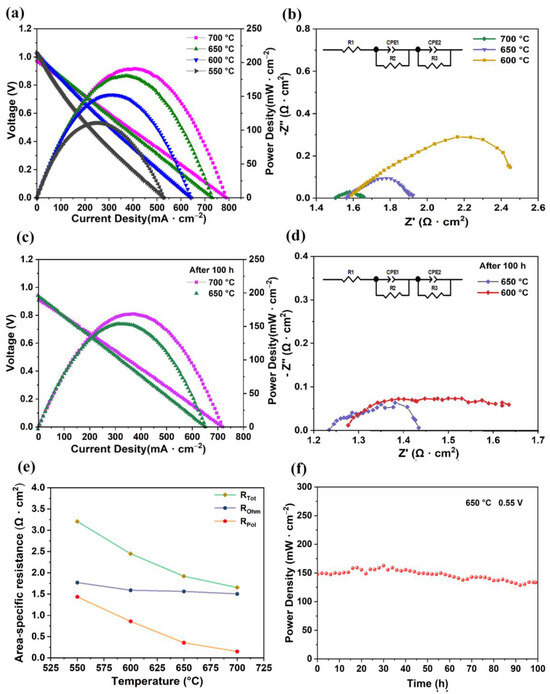
Figure 3.
Electrochemical performance of SOFC mode with LSCF air electrode. (a) V-I and P-I test curves. (b) EIS spectra of cell at 700–600 °C. (c,d) V-I, P-I, and EIS test curves of fuel cell after 100 h stability test. (e) Area-specific resistances derived from Nyquist plots, total cell resistance (RTot), ohmic resistance (ROhm), and interfacial polarization resistance (RPol). (f) Stability test at a voltage of 0.55 V at 650 °C for 100 h.
Figure 3e shows a variation in the area-specific resistance of a fuel cell mode in accordance with different temperatures. The ohmic resistances of the cell were 1.50 Ω·cm2, 1.56 Ω·cm2, and 1.58 Ω·cm2 at 700 °C, 650 °C, and 600 °C, respectively, and the fuel cell’s polarization resistance was 0.15 Ω·cm2, 0.35 Ω·cm2, and 0.85 Ω·cm2, respectively at those temperatures. Cell resistance and polarization resistance increased as temperature decreased due to the decreased protonic conductivity and catalytic activity of the fuel cell electrodes.
The stability test curve of a cell under a stable voltage of 0.55 V at 650 °C is shown in Figure 3f; performance degradation after 100 h was approximately 15.4%. Since the production of an effective area collector for a tubular fuel cell is difficult in comparison with that of a planar fuel cell, there were fluctuations in the first 40 h. After 40 h, the fuel cell’s output performance was relatively smooth, demonstrating that the fuel cell had achieved a steady status. The SEM and EDX after the stability test were analyzed. The cross-section shows that the anode support, electrolyte, and cathode maintained a sandwich structure, and the element distribution presented almost the same as the fresh cell, as shown in Figure S2.
Figure 4a illustrates the V-I curves of the electrolysis cells for the 20% CO2–80% H2 electrolysis reaction measured at various temperatures. As the temperature dropped, the electrolysis current density decreased, which was mainly due to increases in ohmic resistance and polarization. Figure 4b,c illustrate the effect of different concentrations of CO2 on electrolysis performance in SOEC mode. The air electrode was supplied with 3% H2O–97% air, which was not changed in the electrolysis cell test. As the concentration of CO2 increased, the current density gradually decreased. As a result, the current density reached 504 mA·cm−2, 459 mA·cm−2, 465 mA·cm−2, 416 mA·cm−2, and 335 mA·cm−2 as the CO2 concentration gradually changed from 10% to 50% at 1.4 V electrolysis voltage. The adsorption and desorption of both H2 and CO2 occurred on the surface of the nickel. The decrease in H2 concentration caused a decrease in the rate of NiO reduction, thus leading to a decrease in the number of catalytic sites and the subsequent current densities.
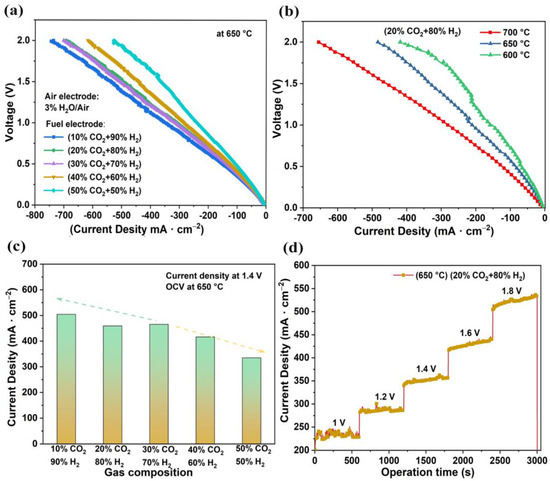
Figure 4.
Electrochemical performances of tubular electrolysis cells. (a) Typical V-I graph of cell tested at different temperatures; wet air was injected into the air electrode, and the fuel electrode was supplied a mixture of H2 and CO2. (b) Typical V-I curves of cell tested at 650 °C. (c) Relationship between electrolytic current density and gas composition at 1.4 V electrolytic voltage. (d) Short-term performance of CO2 reduction at different voltages.
In addition, the electrolysis performance for 20% CO2–80% H2 electrolysis reactions are shown in Figure 4d. The current density of electrolysis was stable within 1.0–1.8 V. The electrolysis current tended to increase when the electrolysis voltage exceeded 1.4 V. As the electrolysis time increased, the nickel oxide was reduced to nickel and the number of catalytic sites increased [39], leading to an increase in the electrolytic current, which is even comparable with the previous electrocatalytic CO2 reduction performance under high temperature, as listed in Table S1.
Figure 5a shows the EIS of the electrolysis cell under 20% CO2–80% H2 in a fuel electrolytic electrode and 3% H2O–97% air in an air electrode. The ohmic resistance and polarization resistance of the electrolysis cell increased continuously as the temperature decreased. The corresponding ohmic resistances at 700 °C, 650 °C, and 600 °C were 2.40 Ω·cm2, 3.13 Ω·cm2, and 3.96 Ω·cm2, respectively, and the polarization resistances were 3.22 Ω·cm2, 6.47 Ω·cm2, and 6.94 Ω·cm2, respectively. In the case of using an LSCF air electrode in wet air, the surface did not have the ability to conduct protons in time, leading to higher polarization resistance [40]. Figure 5b illustrates the EIS results at 650 °C with different CO2:H2 ratios. The impedance of the electrolysis cell increased with the increase of CO2 concentration.
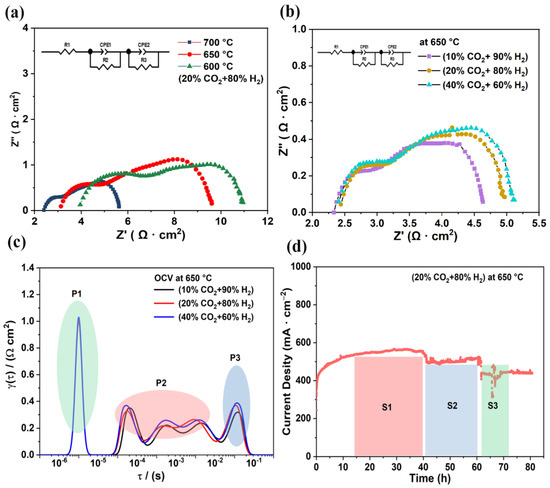
Figure 5.
(a) EIS of electrolysis cell under 20% CO2–80% H2 in fuel electrode and 3% H2O–97% air in air electrode at different temperatures. (b) EIS of cell at an applied voltage of 1.6 V at 650 °C: with 3% H2O–97% air in air electrode, CO2 concentration changed from 10% CO2–90% H2 to 40% CO2–60% H2. (c) DRT curves from the EIS conversion. (d) Stability of cell at 650 °C and 1.6 V for 80 h: 20% CO2–80% H2 in the fuel electrode and 3% H2O–97% air in the air electrode.
Additionally, DRT and EIS curves were used to study the influence of electrolytic current density on the electrode surface [41,42]. There were three peaks from high to low frequencies, namely (from high to low) P1, P2, and P3, and different-peak regions correspond to the polarization resistance of the respective electrode reaction processes. P1 was in the high-frequency range and is probably related to surface charge transport. P2 belonged to the medium frequency range and may be associated with ion surface diffusion, whereas P3, expressed in the low-frequency region, is linked to the adsorption and dissociation of gas molecules on the electrode surface [43,44]. The peak of the P1 region was stable as the concentration of CO2 increased, indicating that the charge transfer was not related to CO2 concentration. When the CO2 concentration was increased, the areas of the P2 and P3 peaks increased, suggesting that the corresponding processes in P2 may be related to surface exchange, dissociation of adsorbed molecules, and ion diffusion processes. As for the P3 region, this change may indicate the competitive adsorption and diffusion of CO2 and H2 gases on the electrode surface. The above DRT results contribute to the understanding of the transfer process of charge and species. Figure 5d demonstrates the electrolytic stability of the cell at 650 °C for 80 h under an applied voltage of 1.6 V. S1 is the stabilization interval of 40 h for electrolysis, during which the current density reached 550 mA·cm−2. After the 40 h test, S2 is the stabilization interval after that took place after electrolysis performance decreased. In the S2 test period, the current density weak drop was attributed to electrode materials cracking from the current collection. During the S3 test period, the current density did not degrade after restart, proving that the BZCY and nickel oxide composite electrode is still a highly competitive electrode for CO2 electrolysis.
3. Materials and Methods
3.1. Synthesis and Characterization
BaZr0.4Ce0.4Y0.15Zn0.05O3−δ powders were prepared from BaCO3 (Aladdin, Shanghai, China, 99%), ZrO2 (Aladdin, China, 99%), CeO2 (Aladdin, China, 99.95%), Y2O3 (Aladdin, China, 99.9%), and ZnO (Sinopharm, Shanghai, China, AR) precursors with conventional solid phase reactions. The stoichiometric amounts of precursors were mixed and ground in ethanol, and then dried in an oven. The dried powders were pressed into a Φ18 mm disk with stainless steel molds at 230 MP, and then sintered for 10 h at 1100 °C. Then, the obtained powders were ground, dried, pressed, and sintered at 1150 °C in air for 10 h to achieve pure-phase perovskite powders. Finally, the pure-phase powders were crushed and ground for another 30 h. Similarly, La0.6Sr0.4Co0.2Fe0.8O3−δ (LSCF), regarded as air electrode, was prepared with a modified sol-gel method [45].
3.2. Fabrication of Tubular SOCs via Slip Casting and Dip-Coating Methods
As shown in Figure 6, the flowchart of preparing the porous tubular fuel electrode support is described as follows.
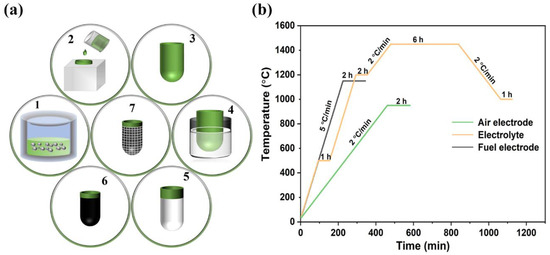
Figure 6.
(a) Flowchart of tubular SOC fabrication: 1. Slurry ball milling; 2. Slip casting; 3. Fettling and sintering; 4. Dip coating; 5. Electrolyte layer sintering; 6. Cathode preparation and sintering; 7. Current collection preparation. (b) Sintering process of fuel electrode support, electrolyte, and air electrode.
- (1)
- Slurry ball milling. NiO/BZCYZ fuel electrode slurry (Table 1) was prepared by ball milling at 200 r/min for 10 min.
 Table 1. Composition of NiO-BZCYZ fuel electrode support slurry.
 - (2)
- Slip casting. NiO/BZCYZ fuel electrode slurry was poured into plaster molds, and the water in the slurry was absorbed by the porous dry plaster mold, forming a solid NiO-BZCYZ on the inner wall of the plaster specimen. Then, during the formation of the tubular structure, the mold remained filled with slurry for about 30 s until the desired shell thickness was reached. The excess slurry was poured out, and the wet plaster mold dried at room temperature.
- (3)
- Fettling and sintering. The NiO-BZCYZ tubular fuel electrode support was separated from the mold during the room-temperature dry process (about 5 h). The fuel electrode support was thoroughly dried at 25 °C and presintered at 1150 °C for 2 h to reinforce the support and decompose organic additives and graphite pore former.
- (4)
- Dip coating. After presintering the porous tubular fuel electrode support, the anode function layer (AFL, Table 2) films were prepared with the dip-coating method. The AFL paste was soaked and coated on the surface of the tube fuel electrode by dipping twice, and the electrolyte (Table 3) was dipped 5 times. The dipping speed, holding time and pulling speed were kept at 6 mm/s, 5 s, and 2 mm/s, respectively.
Table 2. Composition of anode functional layer slurry.
Table 3. Composition of electrolyte dip-coating slurry.
- (5)
- Electrolyte layer sintering. Similarly, the BZCYZ electrolyte thin layer was coated over AFL by the same method as Step (4) and then cofired for 6 h at 1450 °C. The Vickers hardness values of the obtained proton tubular fuel cells at different sintering temperatures are shown in Figure S3.
- (6)
- Cathode preparation and sintering. The cathode slurry paste was prepared by using LSCF (70% by weight), BZCYZ (30% by weight), and a suitable amount of conductive glue (6 wt% ethyl cellulose + 94 wt% terpilenol). The cathode paste was coated on the electrolyte and then sintered at 950 °C for 2 h.
- (7)
- Current collection preparation. The cathode surface was coated with silver grids, and a thin layer of silver paste was applied on the anode to collect the electric current. A silver wire was connected to the anode and cathode of the connecting section, and the current was directed outward.
The NiO provided the reaction site of the fuel electrochemical reaction, and it had the stability to keep the structural framework in the reducing atmosphere. Arabic gum played a major role in maintaining plastic and adhesive properties in the prepared anode support paste, which can release the full tubular anode support once the slurry has been completed.
3.3. Characterization
The crystal structure of obtained powders was analyzed using an X-ray diffractometer (XRD, Smart Lab SE, Tokyo, Japan) at 20–90° with a scanning speed of 5° min−1. The microstructure of the SOC was studied using a scanning electron microscope (SEM, Hitachi Regulus 8100, Tokyo, Japan). Band structure and optical property was surveyed with a UV–Vis spectrophotometer (TU-1900, Beijing, China). The Vickers hardness values of the electrolyte pellets were tested using the HV 1000 micro durometer (Shanghai, China) with a load of 4.9 N, and the load holding time was set to 15 s. The pore volume fraction (porosity) of the porous support layer was 38.4% as measured with a ceramic porosity analyzer (Mayzum: MAY-ENTRIS120, Shenzhen, China). The actual density (ρa) of the proton conductor electrolyte BZCYZ was measured by Archimedes’ method, and the theoretical density (ρt) of the electrolyte BZCYZ was calculated using XRD data. The relative density (ρrel) was 92.6% as calculated with the following formula [46,47].
As illustrated in Figure 7, during the SOC electrochemical test, a compact Al2O3 tube was first sealed with silver paste. The cathode surface was coated with silver grids, and a thin layer of silver paste was applied on the anode to collect the electric current. A silver wire was connected to the anode and cathode of the connecting section, and the current was directed outward. The enclosed tubular SOC was then placed into the quartz tube within a one end-closed furnace.
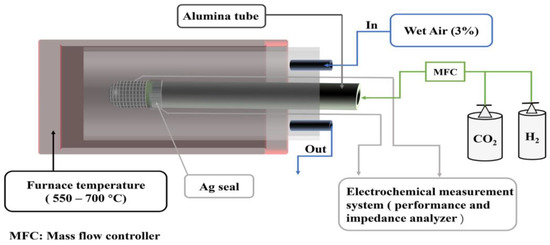
Figure 7.
Schematics of the electrochemical test.
During the SOFC mode test, the temperature increased to 700 °C at a heating rate of 10 °C min−1, and then decreased to 550 °C. Humidified H2 (3% H2O) was fed into the fuel electrode chamber at a flow rate of 50 mL·min−1, and the air electrode was placed in ambient air. During the SOEC mode test, the air electrode was fed wet air (3% H2O–97% Air) at a flow rate of 50 mL·min−1. The different proportions of CO2 and H2 fed into the electrolysis cell through the gas mixer. An Ivium workstation was used to test the current density of the cell at 1.0–1.8 V for 10 min. The stability of the electrolysis cell was studied under a stable voltage of 1.6 V with a rate of flow of 20 mL·min−1 of 20% CO2–80% H2 at 650 °C for 80 h. A Solartron workstation (1260 + 1287) was used to record electrochemical performance and electrochemical impedance spectroscopy (EIS). EIS was measured under open circuit conditions (OCV) in the frequency range of 100 kHz to 0.1 Hz with an amplitude of 10 mV.
4. Conclusions
In this work, we prepared fuel electrode-supported tubular protonic ceramic cells using the conventional ceramic slip-casting and dip-coating methods to produce a protonic ceramic fuel cell (PCFC) and a protonic ceramic electrolysis cell (PCEC). In PCFC mode, a cell output performance of 151–191 mW·cm−2 was achieved at 550–700 °C. The main influence on the current density of PCFC came from the internal resistance of electrolyte itself and cathode current collector. In PCEC mode, the current density of CO2 electrolysis was 418–654 mA·cm−2 at 600–700 °C, which is related to the protective gas concentration and polarization resistance of the air electrode. The electrolytic rate-limiting steps for CO2 electrolysis were determined to be the gas adsorption and dissociation on the electrode surface. We will focus on the effect of air electrodes on the electrolytic performances of PCEC and continue to improve the preparation process of tubular SOCs in the future works.
Supplementary Materials
The following supporting information can be downloaded at: https://www.mdpi.com/article/10.3390/catal13010182/s1, Figure S1: Band structure and optical property of obtained BZCYZ. (a) UV-vis diffuse reflectance spectra. (b) The bandgap energy is 2.96 eV based on the UV-Vis Kubelka-Munk function; Figure S2: The SEM and EDX images of the anode support cross-section after stability test; Figure S3: The Vickers hardness of obtained proton tubular fuel cell at different sintering temperatures; Table S1: The comparison of electrocatalytic CO2 reduction with other single cell configuration.
Author Contributions
Conceptualization, Y.X. and T.H.; methodology, Y.X.; software, Y.X.; validation, Y.X. and T.H.; formal analysis, Y.X.; investigation, Y.X.; resources, T.H.; data curation, Y.X. and Y.X.; writing—original draft preparation, Y.X.; writing—review and editing, M.W., Z.W., D.B., Y.W., F.J. and T.H.; supervision, T.H.; project administration, T.H.; funding acquisition, T.H. and D.B. All authors have read and agreed to the published version of the manuscript.
Funding
This work was financially supported by the National Key R&D Program of China (2022YFE0198500), National Natural Science Foundation of China (No. 91745203, 52072362, 21905269), Youth Innovation Promotion Association CAS (No. 2021223), and the Jilin Province Science and Technology Development Plan Funding Project (No. 20220201112GX, 20200201079JC). This research work was supported by the Open Funds of the State Key Laboratory of Rare Earth Resource Utilization (RERU2022004).
Data Availability Statement
The data presented are available on request from the authors.
Conflicts of Interest
The authors declare that they have no known competing financial interest or personal relationships that could have appeared to influence the work reported in this paper.
Correction Statement
This article has been republished with a minor correction to the Funding statement. This change does not affect the scientific content of the article.
References
- Stambouli, A.; Traversa, E. Solid oxide fuel cells (SOFCs): A review of an environmentally clean and efficient source of energy. Renew. Sust. Energ. Rev. 2002, 6, 433–455. [Google Scholar] [CrossRef]
- Pieta, I.; Epling, W.; Kazmierczuk, A.; Lisowski, P.; Nowakowski, R.; Serwicka, E. Waste into fuel-catalyst and process development for MSW valorisation. Catalysts 2018, 8, 113. [Google Scholar] [CrossRef]
- Khan, M.; Iltaf, A.; Ishfaq, H.; Khan, F.; Tanveer, W.; Song, R.-H.; Mehran, M.; Saleem, M.; Hussain, A.; Masaud, Z. Flat-tubular solid oxide fuel cells and stacks: A review. J. Asian Ceram. Soc. 2021, 9, 754–770. [Google Scholar] [CrossRef]
- Cao, J.; Ji, Y.; Shao, Z. Perovskites for protonic ceramic fuel cells: A review. Energ. Environ. Sci. 2022, 15, 2200–2232. [Google Scholar] [CrossRef]
- Zheng, Y.; Wang, J.; Yu, B.; Zhang, W.; Chen, J.; Qiao, J.; Zhang, J. A review of high temperature co-electrolysis of H2O and CO2 to produce sustainable fuels using solid oxide electrolysis cells (SOECs): Advanced materials and technology. Chem. Soc. Rev. 2017, 46, 1427–1463. [Google Scholar] [CrossRef] [PubMed]
- Chen, B.; Xu, H.; Zhang, Y.; Dong, F.; Tan, P.; Zhao, T.; Ni, M. Combined methane reforming by carbon dioxide and steam in proton conducting solid oxide fuel cells for syngas/power co-generation. Int. J. Hydrogen. Energ. 2019, 44, 15313–15321. [Google Scholar] [CrossRef]
- Ricote, S.; Kee, R.; Coors, W. Slip casting and solid-state reactive sintering of BCZY(BaCexZr0.9−xY0.1O3-δ)-NiO/BCZY half-cells. Membranes 2022, 12, 242. [Google Scholar] [CrossRef]
- Zhou, J.; Ye, X.; Shao, L.; Zhang, X.; Qian, J.; Wang, S. A promising direct carbon fuel cell based on the cathode-supported tubular solid oxide fuel cell technology. Electrochim. Acta 2012, 74, 267–270. [Google Scholar] [CrossRef]
- Panthi, D.; Hedayat, N.; Woodson, T.; Emley, B.; Du, Y. Tubular solid oxide fuel cells fabricated by a novel freeze casting method. J. Am. Ceram. Soc. 2020, 103, 878–888. [Google Scholar] [CrossRef]
- Hodjati-Pugh, O.; Dhir, A.; Steinberger-Wilckens, R. The development of current collection in micro-tubular solid oxide fuel cells-a review. Appl. Sci. 2021, 11, 1077. [Google Scholar] [CrossRef]
- Kreuer, K. Aspects of the formation and mobility of protonic charge carriers.pdf. Solid State Ion. 1999, 125, 285–302. [Google Scholar] [CrossRef]
- Pornprasertsuk, R.; Ramanarayanan, P.; Musgrave, C.; Prinz, F. Predicting ionic conductivity of solid oxide fuel cell electrolyte from first principles. J. Appl. Phys. 2005, 98, 103513. [Google Scholar] [CrossRef]
- Manning, P.; Sirman, J.; De Souza, R.; Kilner, J. The kinetics of oxygen transport in 9.5 mol% single crystal yttria stabilised zirconia. Solid State Ion. 1997, 100, 1–10. [Google Scholar] [CrossRef]
- Xie, K.; Yan, R.; Chen, X.; Dong, D.; Wang, S.; Liu, X.; Meng, G. A new stable BaCeO3-based proton conductor for intermediate-temperature solid oxide fuel cells. J. Alloys Compd. 2009, 472, 551–555. [Google Scholar] [CrossRef]
- Tao, B.; Irvine, J. A stable, easily sintered proton-conducting oxide electrolyte for moder-ate-temperature fuel cells and electrolyze. Adv. Mater. 2006, 18, 1581–1584. [Google Scholar] [CrossRef]
- Azaza, N.; Elleuch, S.; Rasheed, M.; Gindre, D.; Abid, S.; Barille, R.; Abid, Y.; Ammar, H. 3-(p-nitrophenyl)Coumarin derivatives: Synthesis, linear and nonlinear optical properties. Opt. Mater. 2019, 96, 109328. [Google Scholar] [CrossRef]
- Bello, I.; Zhai, S.; He, Q.; Cheng, C.; Dai, Y.; Chen, B.; Zhang, Y.; Ni, M. Materials development and prospective for protonic ceramic fuel cells. Int. J. Energy Res. 2022, 46, 2212–2240. [Google Scholar] [CrossRef]
- Timurkutluk, C.; Timurkutluk, B.; Kaplan, Y. Experimental optimization of the fabrication pa-rameters for anode-supported micro-tubular solid oxide fuel cells. Int. J. Hydrogen Energy 2020, 45, 23294–23309. [Google Scholar] [CrossRef]
- Ren, C.; Xu, P.; Zhang, Y.; Liu, T. Understanding the polymer binder effect on the microstructure and performance of micro-tubular solid oxide fuel cells with continuously graded pores fabricated by the phase inversion method. Appl. Surf. Sci. 2023, 612, 155928. [Google Scholar] [CrossRef]
- Sun, H.; Zhang, S.; Li, C.; Rainwater, B.; Liu, Y.; Zhang, L.; Zhang, Y.; Li, C.; Liu, M. Atmospheric plasma-sprayed BaZr0.1Ce0.7Y0.1Yb0.1O3-δ(BZCYYb) electrolyte membranes for intermediate-temperature solid oxide fuel cells. Ceram. Int. 2016, 42, 19231–19236. [Google Scholar] [CrossRef]
- Zakaria, Z.; Mat, Z.; Hassan, S.; Kar, Y. A review of solid oxide fuel cell component fabrication methods toward lowering temperature. Int. J. Energy Res. 2020, 44, 594–611. [Google Scholar] [CrossRef]
- Sammes, N.M.; Du, Y. Fabrication and characterization of tubular solid oxide fuel cells. Int. J. Appl. Ceram. Technol. 2007, 4, 89–102. [Google Scholar] [CrossRef]
- Tian, J.; Ren, Y.; Liu, L.; Guo, Q.; Sha, N.; Zhao, Z. Photothermal catalysis for CO2 convert into C1-C3 hydrocarbons by proton conductor BZCYMater. Res. Express 2020, 7, 085504. [Google Scholar] [CrossRef]
- Wang, Z.; Ding, L.; Yu, S.; Xu, H.; Hao, X.; Sun, Y.; He, T. Effect of two different ZnO addition strategies on the sinterability and conductivity of the BaZr0.4Ce0.4Y0.2O3−δ proton-conducting ceramic electrolyte. ACS Appl. Energy Mater. 2022, 5, 3369–3379. [Google Scholar] [CrossRef]
- Yoo, Y.; Lim, N. Performance and stability of proton conducting solid oxide fuel cells based on yttrium-doped barium cerate-zirconate thin-film electrolyte. J. Power Sources 2013, 229, 48–57. [Google Scholar] [CrossRef]
- Zuo, C.; Zha, S.; Liu, M.; Hatano, M.; Uchiyama, M. Ba(Zr0.1Ce0.7Y0.2)O3-δ as an electrolyte for low-temperature solid-oxide fuel cells. Adv. Mater. 2006, 18, 3318–3320. [Google Scholar] [CrossRef]
- Ding, Z.; Yang, Z.; Zhao, D.; Deng, X.; Ma, G. A cobalt-free perovskite-type La0.6Sr0.4Fe0.9Cr0.1O3-δ cathode for proton-conducting intermediate temperature solid oxide fuel cells. J. Alloys Compd. 2013, 550, 204–208. [Google Scholar] [CrossRef]
- Yang, L.; Wang, S.; Blinn, K.; Liu, M.; Liu, Z.; Cheng, Z.; Liu, M. Enhanced sulfur and coking tolerance of a mixed ion conductor for SOFCs: BaZr0.1Ce0.7Y0.2-XYbxO3-δ. Science 2009, 326, 126–129. [Google Scholar] [CrossRef]
- Zhao, F.; Jin, C.; Yang, C.; Wang, S.; Chen, F. Fabrication and characterization of anode-supported micro-tubular solid oxide fuel cell based on BaZr0.1Ce0.7Y0.1Yb0.1O3-δ electrolyte. J. Power Sources 2011, 196, 688–691. [Google Scholar] [CrossRef]
- Ren, C.; Wang, S.; Liu, T.; Lin, Y.; Chen, F. Fabrication of micro-tubular solid oxide fuel cells using sulfur-free polymer binder via a phase inversion method. J. Power Sources 2015, 290, 1–7. [Google Scholar] [CrossRef]
- Yang, C.; Jin, C.; Chen, F. Micro-tubular solid oxide fuel cells fabricated by phase-inversion method. Electrochem. Commun. 2010, 12, 657–660. [Google Scholar] [CrossRef]
- Dong, Y.; Chen, C.; Liu, M.; Rainwater, B.H.; Bai, Y. Enhancement of electrochemical properties, impedance and resistances of micro-tubular IT-SOFCs with novel asymmetric structure based on BaZr0.1Ce0.7Y0.1Yb0.1O3-δ proton conducting electrolyte. Fuel Cells 2020, 1, 70–79. [Google Scholar] [CrossRef]
- Wang, Q.; Luo, T.; Tong, Y.; Dai, M.; Miao, X.; Ricote, S.; Zhan, Z.; Chen, M. Large-area protonic ceramic cells for hydrogen purification. Sep. Purif. Technol. 2022, 295, 121301. [Google Scholar] [CrossRef]
- Jaiswal, N.; Tanwar, K.; Suman, R.; Kumar, D.; Uppadhya, S.; Parkash, O. A brief review on ceria based solid electrolytes for solid oxide fuel cells. J. Alloys Compd. 2019, 781, 984–1005. [Google Scholar] [CrossRef]
- Yang, C.; Ren, C.; Yu, L.; Jin, C. High performance intermediate temperature micro-tubular SOFCs with Ba0.9Co0.7Fe0.2Nb0.1O3-δ as cathode. Int. J. Hydrogen Energy 2013, 38, 15348–15353. [Google Scholar] [CrossRef]
- Huang, Q.; Wang, B.; Qu, W.; Hui, R. Impedance diagnosis of metal-supported SOFCs with SDC as electrolyte. J. Power Sources 2009, 191, 297–303. [Google Scholar] [CrossRef]
- Cao, D.; Zhou, M.; Yan, X.; Liu, Z.; Liu, J. High performance low-temperature tubular protonic ceramic fuel cells based on barium cerate-zirconate electrolyte. Electrochem. Commun. 2021, 125, 106986. [Google Scholar] [CrossRef]
- Gan, L.; Ye, L.; Wang, S.; Liu, M.; Tao, S.; Xie, K. Demonstration of direct conversion of CO2/H2O into syngas in a symmetrical proton-conducting solid oxide electrolyze. Int. J. Hydrogen Energy 2016, 41, 1170–1175. [Google Scholar] [CrossRef]
- Zhang, X.; Ye, L.; Xie, K. Electrochemical reduction of CO2 with exsolved metal-oxide interfaces in a proton-conducting solid oxide electrolyze. Energ. Fuel. 2022, 36, 11576–11583. [Google Scholar] [CrossRef]
- Sun, S.; Cheng, Z. Electrochemical behaviors for Ag, LSCF and BSCF as oxygen electrodes for proton conducting IT-SOFC. J. Electrochem. Soc. 2017, 164, F3104–F3113. [Google Scholar] [CrossRef]
- Clematis, D.; Presto, S.; Carpanese, M.; Barbucci, A.; Deganello, F.; Liotta, L.F.; Aliotta, C.; Viviani, M. Distribution of relaxation times and equivalent circuits analysis of Ba0.5Sr0.5Co0.8Fe0.2O3−δ. Catalysts 2019, 9, 441. [Google Scholar] [CrossRef]
- Kadri, E.; Dhahri, K.; Zaafouri, A.; Krichen, M.; Rasheed, M.; Khirouni, K.; Moltech-Anjo, R. Ac conductivity and dielectric behavior of a−Si: H/c−Si1−y Gey/p−Si thin films synthesized by molecular beam epitaxial method. J. Alloys Compd. 2017, 705, 708–713. [Google Scholar] [CrossRef]
- Zhang, L.; Sun, W.; Xu, C.; Ren, R.; Yang, X.; Qiao, J.; Wang, Z.; Sun, K. Attenuating a metal-oxygen bond of a double perovskite oxide: Via anion doping to enhance its catalytic activity for the oxygen reduction reaction. J. Mater. Chem. A 2020, 8, 14091–14098. [Google Scholar] [CrossRef]
- Xia, W.; Liu, X.; Jin, F.; Jia, X.; Shen, Y.; Li, J. Evaluation of calcium co-doping in double perovskite PrBaCo2O5+δ as cathode material for IT-SOFCs. Electrochim. Acta. 2020, 364, 137274. [Google Scholar] [CrossRef]
- Mirzababaei, J.; Chuang, S. La0.6Sr0.4Co0.2Fe0.8O3 perovskite: A stable anode catalyst for direct methane solid oxide fuel cells. Catalysts 2014, 4, 146–161. [Google Scholar] [CrossRef]
- Pan, Y.; Zhang, H.; Xu, K.; Zhou, Y.; Zhao, B.; Yuan, W.; Sasaki, K.; Choi, Y.; Chen, Y.; Liu, M. A high-performance and durable direct NH3 tubular protonic ceramic fuel cell integrated with an internal catalyst layer. Appl. Catal. B-Environ. 2022, 306, 121071. [Google Scholar] [CrossRef]
- Vøllestad, E.; Strandbakke, R.; Tarach, M.; Catalán-Martínez, D.; Fontaine, M.; Beeaff, D.; Clark, D.; Serra, J.; Norby, T. Mixed proton and electron conducting double perovskite anodes for stable and efficient tubular proton ceramic electrolysers. Nat. Mater. 2019, 18, 752–759. [Google Scholar] [CrossRef]


Disclaimer/Publisher’s Note: The statements, opinions and data contained in all publications are solely those of the individual author(s) and contributor(s) and not of MDPI and/or the editor(s). MDPI and/or the editor(s) disclaim responsibility for any injury to people or property resulting from any ideas, methods, instructions or products referred to in the content. |
© 2023 by the authors. Licensee MDPI, Basel, Switzerland. This article is an open access article distributed under the terms and conditions of the Creative Commons Attribution (CC BY) license (https://creativecommons.org/licenses/by/4.0/).