Article

Pyrolyzed POMs@ZIF-67 Exhibiting High Performance as Direct Glucose Fuel Cell Anode Catalysts

1
School of Environmental Science and Engineering, Tianjin University, Tianjin 300354, China
2
College of Food Science and Engineering, Tianjin Agricultural University, Tianjin 300384, China
*
Authors to whom correspondence should be addressed.
These authors contributed equally to this work.
Catalysts 2023, 13(10), 1339; https://doi.org/10.3390/catal13101339
Submission received: 27 August 2023 / Revised: 22 September 2023 / Accepted: 2 October 2023 / Published: 4 October 2023
(This article belongs to the Special Issue Polyoxometalates (POMs) as Catalysts for Biomass Conversion)

Abstract

:
Polyoxometalates (POMs) are three-dimensional materials with unique, exceptional physical and chemical characteristics. The performance of POM-derived materials is anticipated to be enhanced by the combination of POM and metal–organic frameworks (MOFs) due to the high surface areas of MOF materials. In this study, three kinds of T-POMs@ZIF-67 (T-PMo@ZIF-67, T-SiW@ZIF-67, and T-PW@ZIF-67) were prepared by doping a cobalt-based MOF (ZIF-67) with three POMs (phosphomolybdic acid, silicotungstic acid, and phosphotungstic acid). The results show that the power density of the T-PMo@ZIF-67 catalyst anode is 3.08 times that of the blank control anode and 1.34 times that of the CoMoO4 catalyst. These findings suggest that the synthesis of MOF derivatives by doping MOFs with POM will have significant potential for use in the fuel cell industry.

Graphical Abstract

1. Introduction

Metal–organic frameworks (MOFs) have gained popularity as inorganic and functional material precursors in recent years and have found extensive usage in the catalytic degradation of pollutants and the storage and conversion of electrochemical energy [1,2]. MOFs offer exceptional flammability, a high surface area, and a crystalline crystal structure, making them ideal for practical applications, particularly in the catalysis industry [3,4,5]. The diversity of MOFs’ composition and structure serves as the foundation for the variety and functional adaptability of the materials that emerge through them. Using MOFs as a template/precursor, carbon/metal-based porous materials that are more stable and conductive than the original MOFs can be prepared. In addition, considering that most MOFs are composed of transition metals (Mn, Fe, Co, Ni, Cu, etc.), while C, H, O, N, S, and other elements are organic ligands essential to the catalytic system, the derivatives derived from them have the same basic composition as the parent MOFs and have great catalytic potential [6,7].
Polyoxometalates (POMs) are negatively charged aggregates of transition metal ions formed in a high oxygen state [8,9]. Researchers have recently used self-assembly and crystal engineering techniques to modify the heteroatom and ligand composition and oxidation states in the center of POMs, making it much easier for organic groups and metal–organic groups to modify POMs. This has greatly enriched the structural chemistry of POMs [10]. POMs are frequently employed in catalysis, nanotechnology, and medicine because of their distinctive properties, including their controlled and customizable structure [11,12]. Liu et al. designed a solar-induced hybrid fuel cell powered by cellulose using polymetallic oxides as photocatalysts and charge carriers [13]. Xu et al. obtained a maximum power density of 2.59 mW cm−2 for a glucose fuel cell using phosphomolybdic acid as a catalyst [14]. On this basis, Li et al. introduced Lewis acidic cations (Ni2+, Co2+, Fe3+) into POMs, which significantly improved the catalytic activity of POMs for glucose oxidation [15].
However, POMs have the disadvantage of a low specific surface area, and a large number of active sites cannot be utilized, so the catalytic efficiency is not high [16]. To increase catalytic activity, researchers attempted to spread POMs in an inert carrier. Because POMs are readily soluble in polar solvents, their employment in catalysis is constrained because the active center of the load on the carrier surface can be simply shifted away. Finding an appropriate carrier to lessen the loss of active center POMs through the localized impact is therefore crucial. MOFs can be utilized as a carrier to encapsulate polyoxomethanates into metal–organic frames because of their customizable pore size, large pore volume, and high specific surface area. This prevents the loss of POMs and lengthens their lifespan [17,18].
With the decrease in fossil fuels and the gradual deterioration of the environment, fuel cells have become a research hotspot in the environmental field [19,20,21,22]. A glucose fuel cell is a kind of green power generation device that uses glucose as fuel and O2 as an oxidant to convert chemical energy directly into electric energy through an electrochemical reaction [23]. Glucose fuel cells have great potential in practical application due to their characteristics of simple assembly, easy availability of fuel, and environmental protection [24,25,26]. However, glucose fuel cells suffer from low electron transfer efficiency, low fuel utilization, and poor cell stability during electrocatalysis. Therefore, the preparation of high-performance and stable anode catalysts is the key to improving the performance of glucose fuel cells [23,27]. POM/MOF composites can provide suitable hydrophobic and hydrophilic microenvironments and mass transfer channels, accelerate the catalytic organic reaction between the active site and the substrate, and improve the catalytic efficiency by promoting the diffusion of reactants and products [28,29]. MOF-derived materials have the compensations of a simple synthesis, high surface area, stable morphology and controllable active site and have been widely used in anode catalysis in recent years [30,31,32]. In this study, a series of T-POMs@ZIF-67 catalysts were fabricated by pyrolysis of POM-MOF nanocomposites. Their electrochemical performance in the catalytic oxidation of glucose was characterized. This research advances the comprehension of the processes underlying high-efficiency POM-derived catalysts for glucose oxidation.

2. Results and Discussion

2.1. Electrochemical Performance Test of Catalyst Anodes

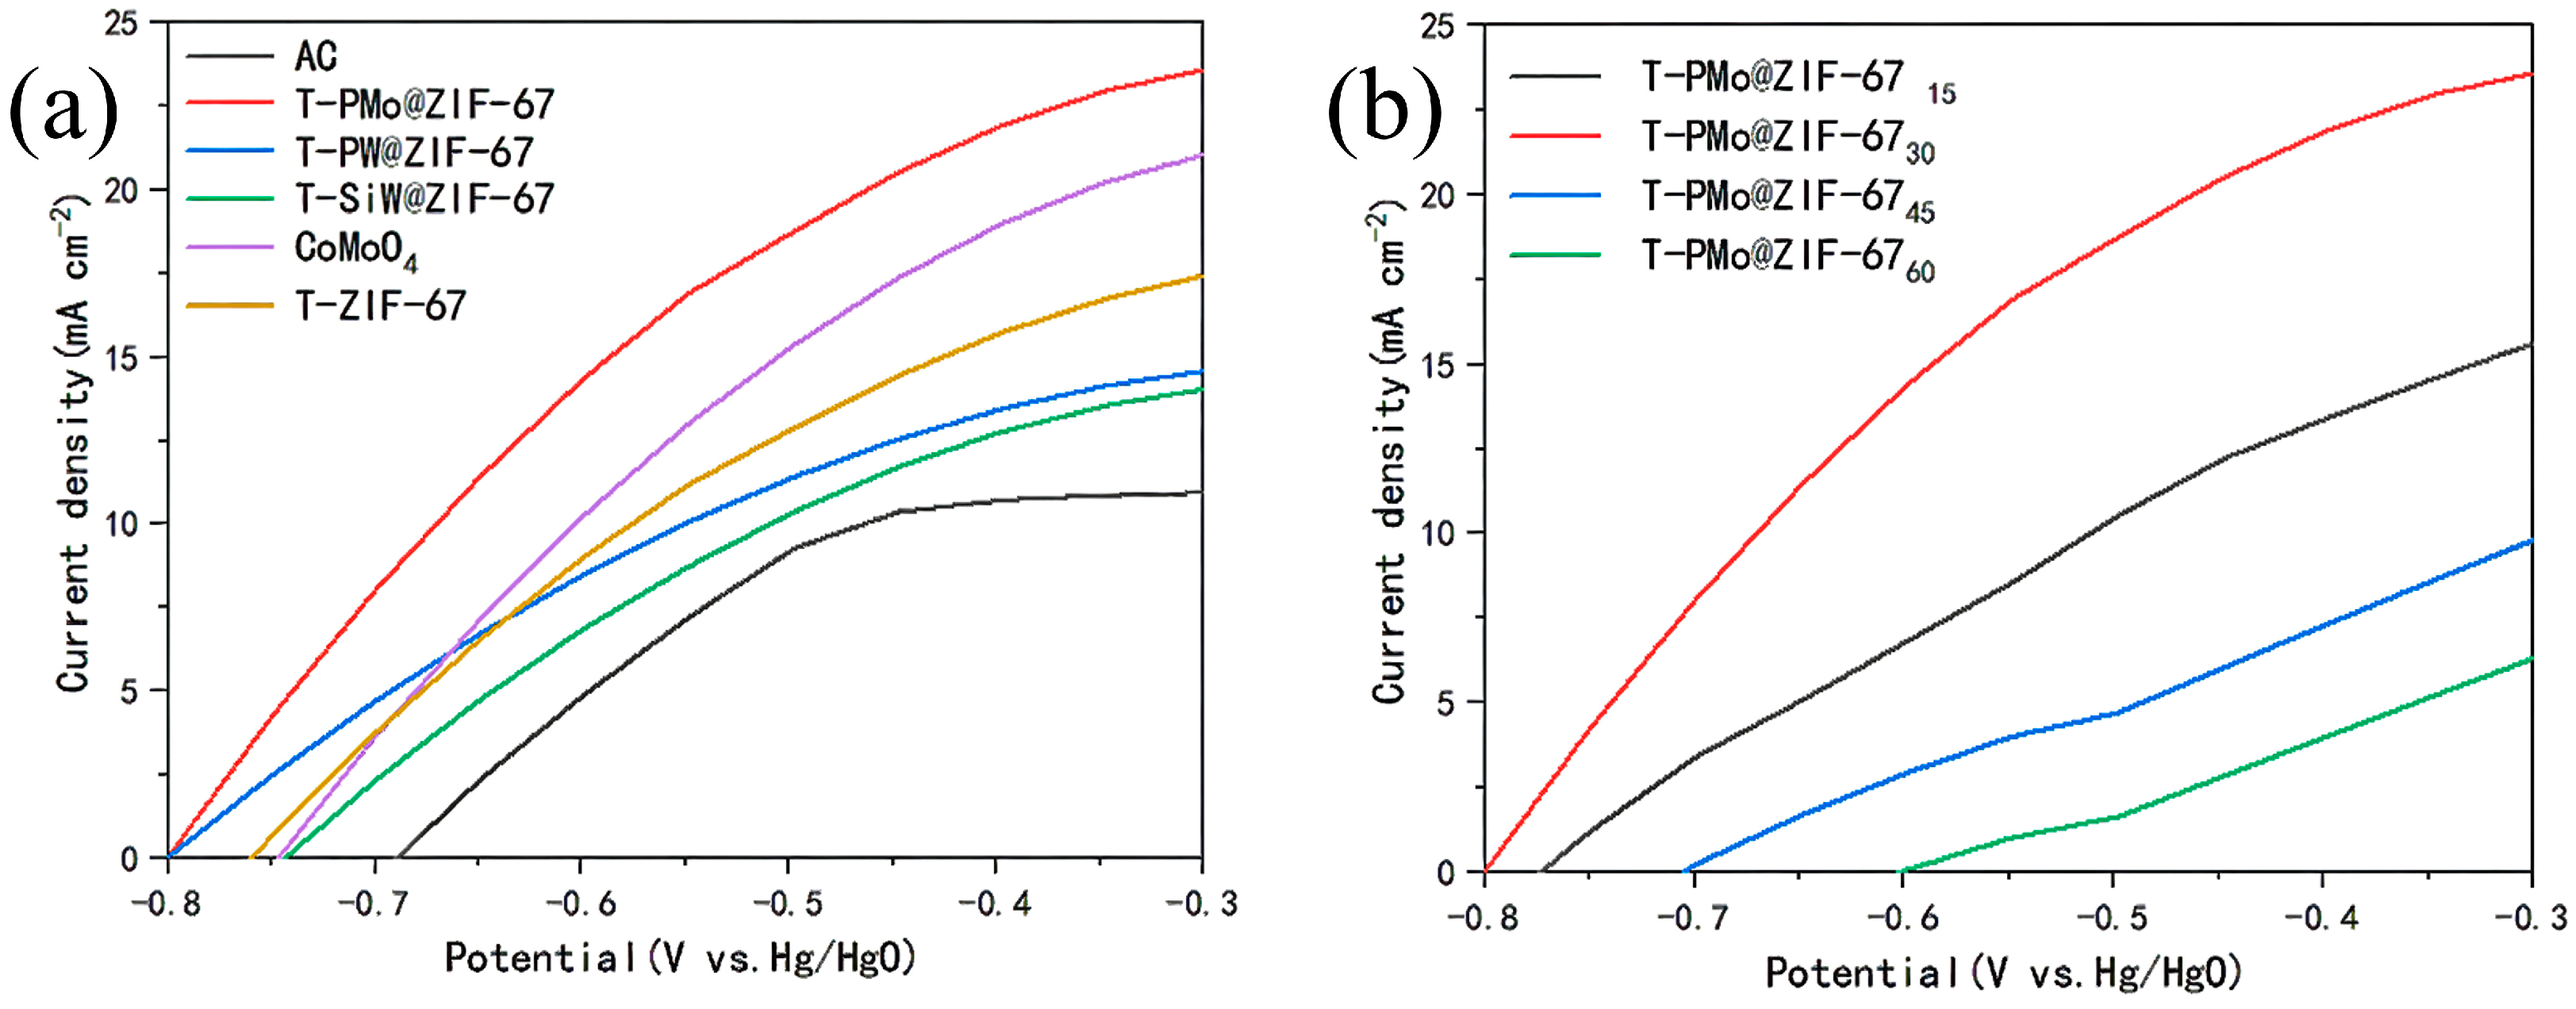
2.1.1. Linear Sweep Voltammetry Test for Anodes

The LSV test results for different T-POMs@ZIF-67-doped anodes are shown in Figure 1a. This figure shows that the curves of five modified anodes were all above the curve of the blank anode, and the current density of T-PMo@ZIF-67-modified anodes was always higher than that of other anodes at the same potential. The maximum current relationship of each anode was as follows: AC < T-PW@ZIF-67 < T-SiW@ZIF-67 < T-ZIF < CoMoO4 < T-PMo@ZIF-67, which indicated that the addition of anode catalysis could significantly promote the oxidation of glucose and accelerate the reaction rate and chemical activity. The current density of the anode cell doped with T-PMo@ZIF-67 catalyst increased the most and was higher than that of CoMoO4, indicating that the T-PMo@ZIF-67 structure effectively increased the reactive site, increased the active substances involved in the reaction, and accelerated the glucose oxidation reaction rate.
In order to further improve the catalytic performance of T-PMo@ZIF-67, different contents of phosphomolybdic acid were added in the synthesis process to explore the effects of different doping amounts of phosphomolybdic acid on the catalytic glucose oxidation performance of T-PMo@ZIF-67. During the preparation of the catalyst, 10 mL phosphomolybdate solutions of 15, 30, 45, and 60 mM were added to a mixed solution of cobalt nitrate–methanol to obtain T-PMo@ZIF-67 catalysts with different doping amounts of phosphomolybdate. Then, the fuel cell anode was prepared and the LSV test was carried out, as shown in Figure 1b. It was found that only two of the three modified anode curves were above the blank anode, and the maximum current density relationship was T-PMo@ZIF-6760 < T-PMo@ZIF-6745 < T-PMo@ZIF-6715 < T-PMo@ZIF-6730. The results showed that doping with phosphomolybdate could promote the oxidation of glucose, but when the concentration was too large, it inhibited the catalytic performance of the material. The reason was that the excess phosphomolybdate occupied the original active site, leading to a decline in the catalytic performance.

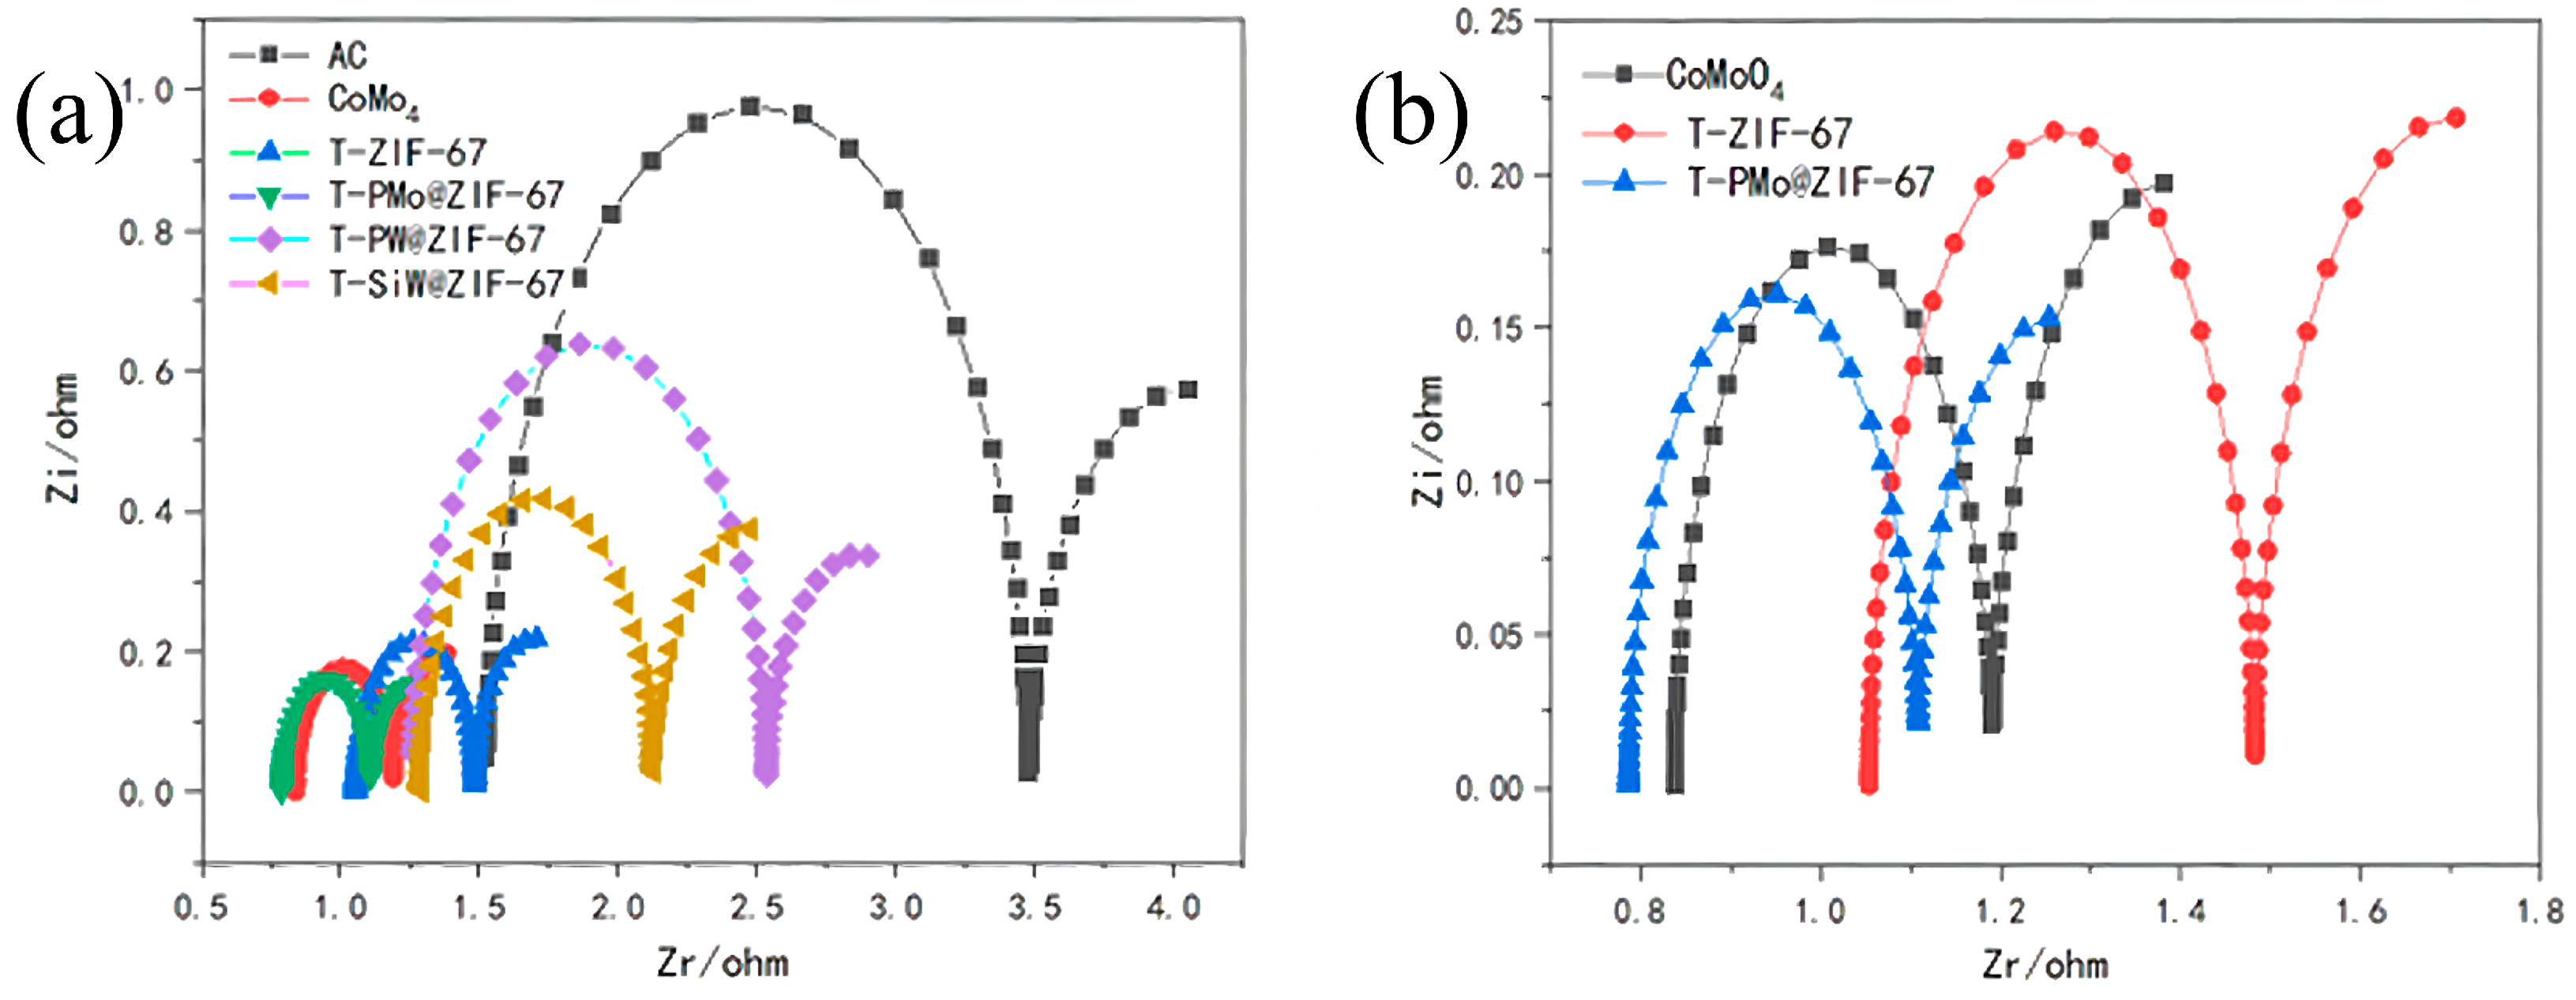
2.1.2. Electrochemical Impedance Testing of Anodes

In order to further analyze the effect of the T-POMs@ZIF-67 catalyst on the anode of a fuel cell, an AC impedance test was carried out to analyze the anode impedance information. The test result is shown in Figure 2a. The curve was fitted by equivalent circuit R(CR)(CR). The intersection point between the curve in the high-frequency region and the left side of the X-axis represents the ohmic resistance, the curve diameter represents the charge transfer resistance of the anode, and the short line in the low-frequency region represents the diffusion resistance.
Figure 2a shows the fitting curves of the electrochemical AC impedance corresponding to different anodes. The radius of the curves was T-PMo@ZIF-67 < CoMo < T-ZIF-67 < T-SiW@ZIF-67 < T-PW@ZIF-67 < AC. It was obvious from Figure 2b that T-PMo@ZIF-67 had the leftmost curve and the smallest radius, which proved that it had the smallest ohmic resistance and charge transfer resistance. In order to analyze the impedance values of different anode catalysts, the results were fitted.
Table 1 shows that the ohmic resistance of T-PMo@ZIF-67-modified anode was 0.7869 Ω, which was 48.16% lower than that of the blank anode (1.518 Ω), and the charge transfer resistance was 0.3063 Ω, which was 73.39% lower than that of the blank anode (1.151 Ω). This result explains why the T-PMo@ZIF-67-modified anode fuel cell performs better than a blank anode fuel cell in terms of charge transfer resistance and total resistance.

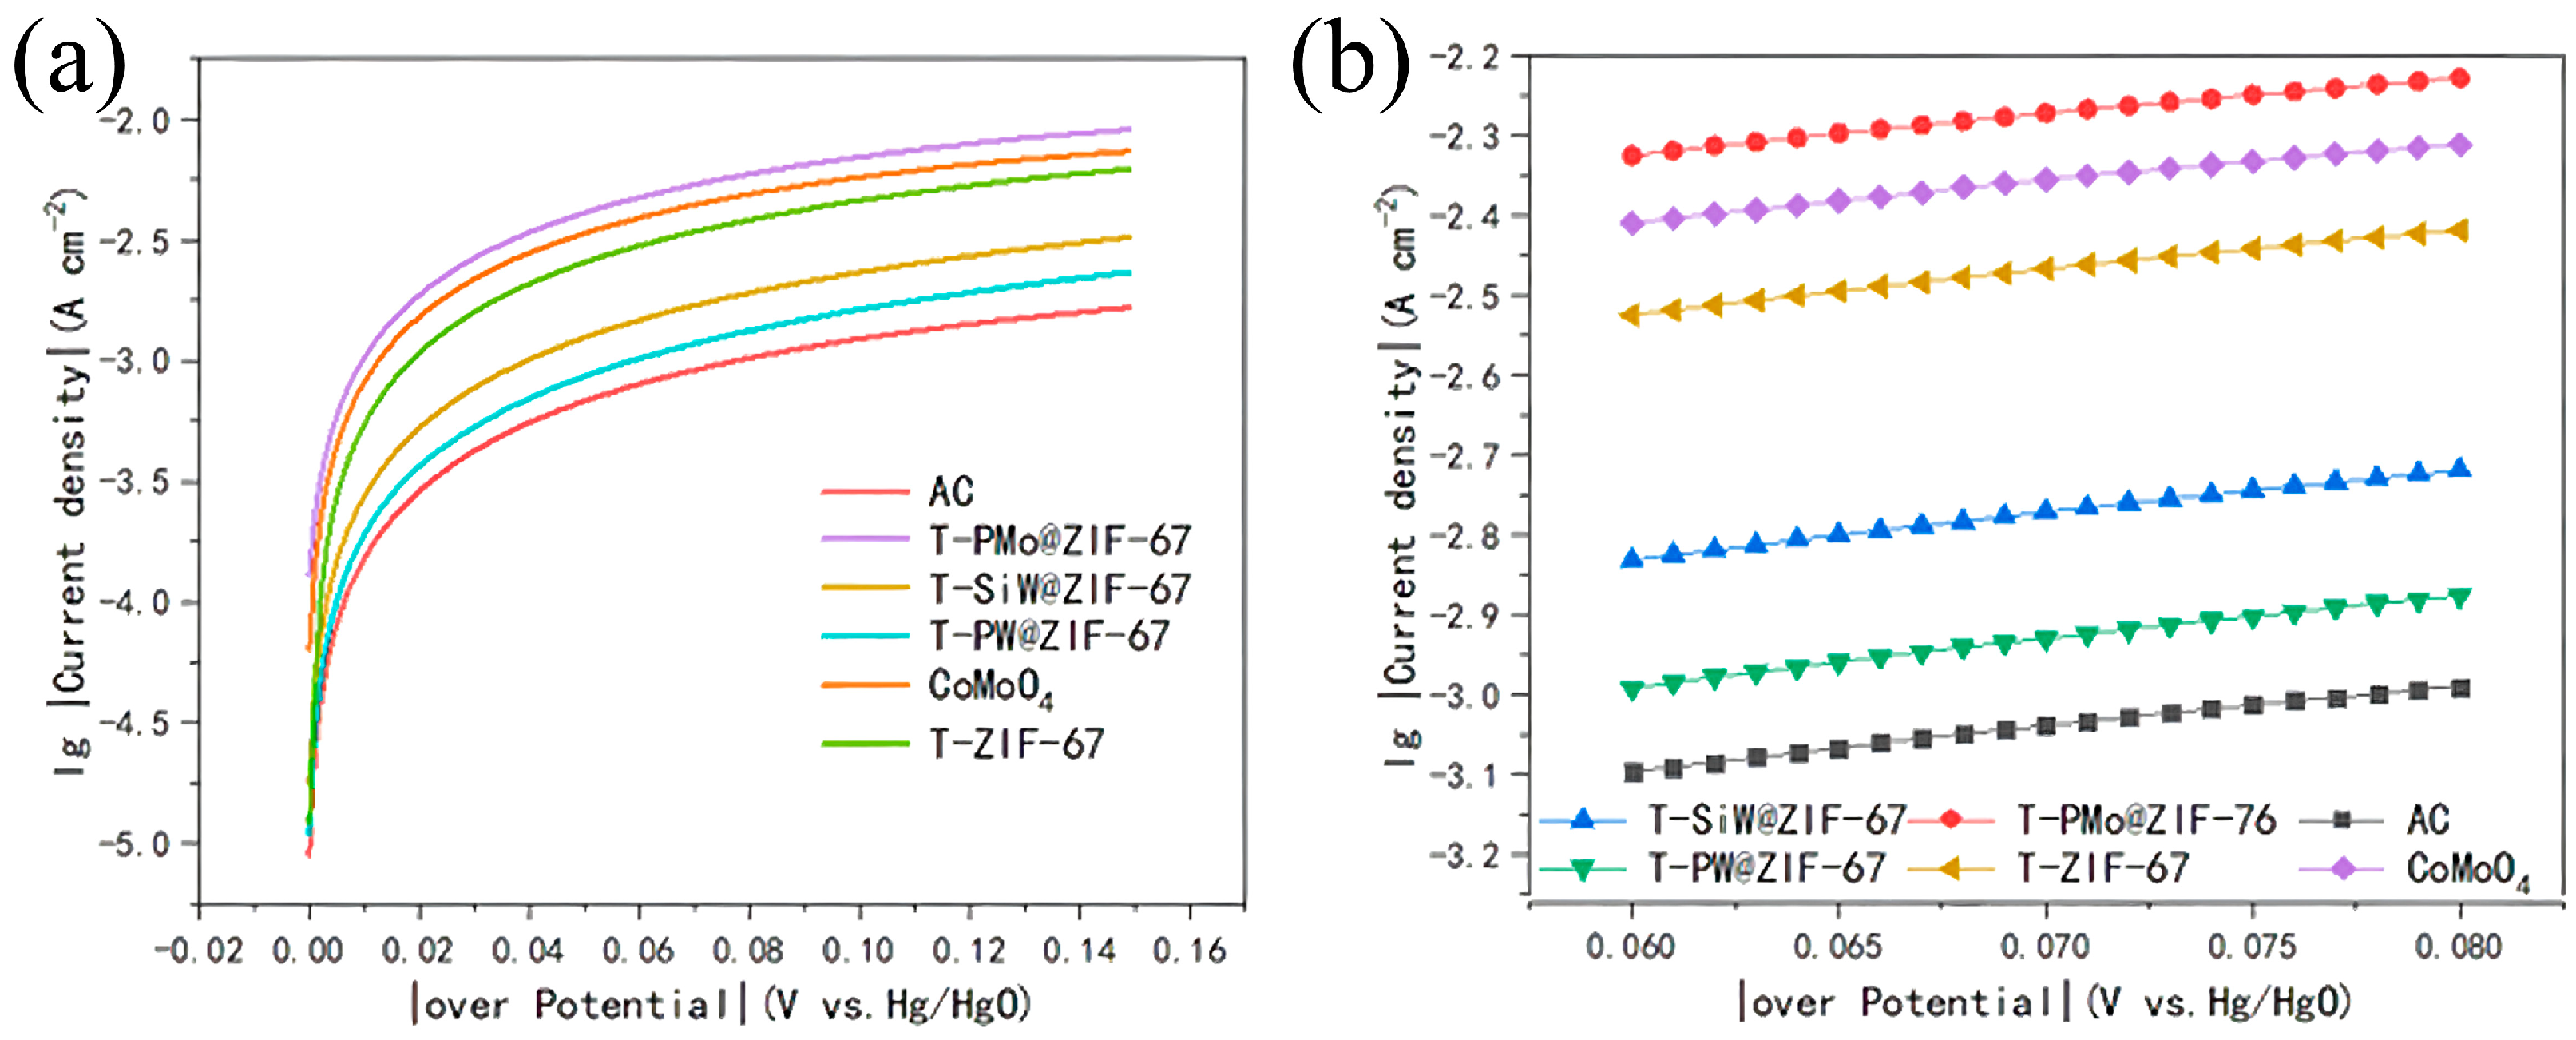
2.1.3. The Tafel Curve of Anodes

The fitting results in Figure 3a are shown in Figure 3b and Table 2. The Tafel slope and exchange current density are two important parameters for catalyst performance. The Tafel slope represents the relationship between current change and overpotential within a certain range, and exchange current density (I0) reflects the ability of an electrode to react to gain or lose electrons. It can be used to determine the complexity of the corresponding electrode reaction. The lower the exchange current density, the larger the driving power required, and the more unfavorable the reaction. The order of the anodes was as follows: blank anode (3.831) < T-PW@ZIF-67 (4.625) < T-SiW@ZIF-67 (6.821) < T-ZIF-67 (14.440) < CoMoO4 (19.762) < T-PMo@ZIF-67 (21.527). The exchange current density and Tafel slope of the T-PMo@ZIF-67-doped material were both higher. The exchange current density of the T-PMo@ZIF-67-doped material was 5.62 times that of the blank anode and 1.49 times that of the T-ZIF-67-doped material. This indicated that the addition of T-PMo@ZIF-67 could effectively reduce the activation energy barrier of the anode reaction, enable it to oxidize glucose at a lower potential, effectively improve the reaction rate, reduce the activation loss, and significantly increase the output current. This conclusion was consistent with the LSV and EIS test results, which proved that doping the anode of an alkaline glucose fuel cell with T-PMo@ZIF-67 material could greatly promote the electron transfer, increase the reaction rate, promote the oxidation of glucose near the anode, and improve the fuel cell performance.

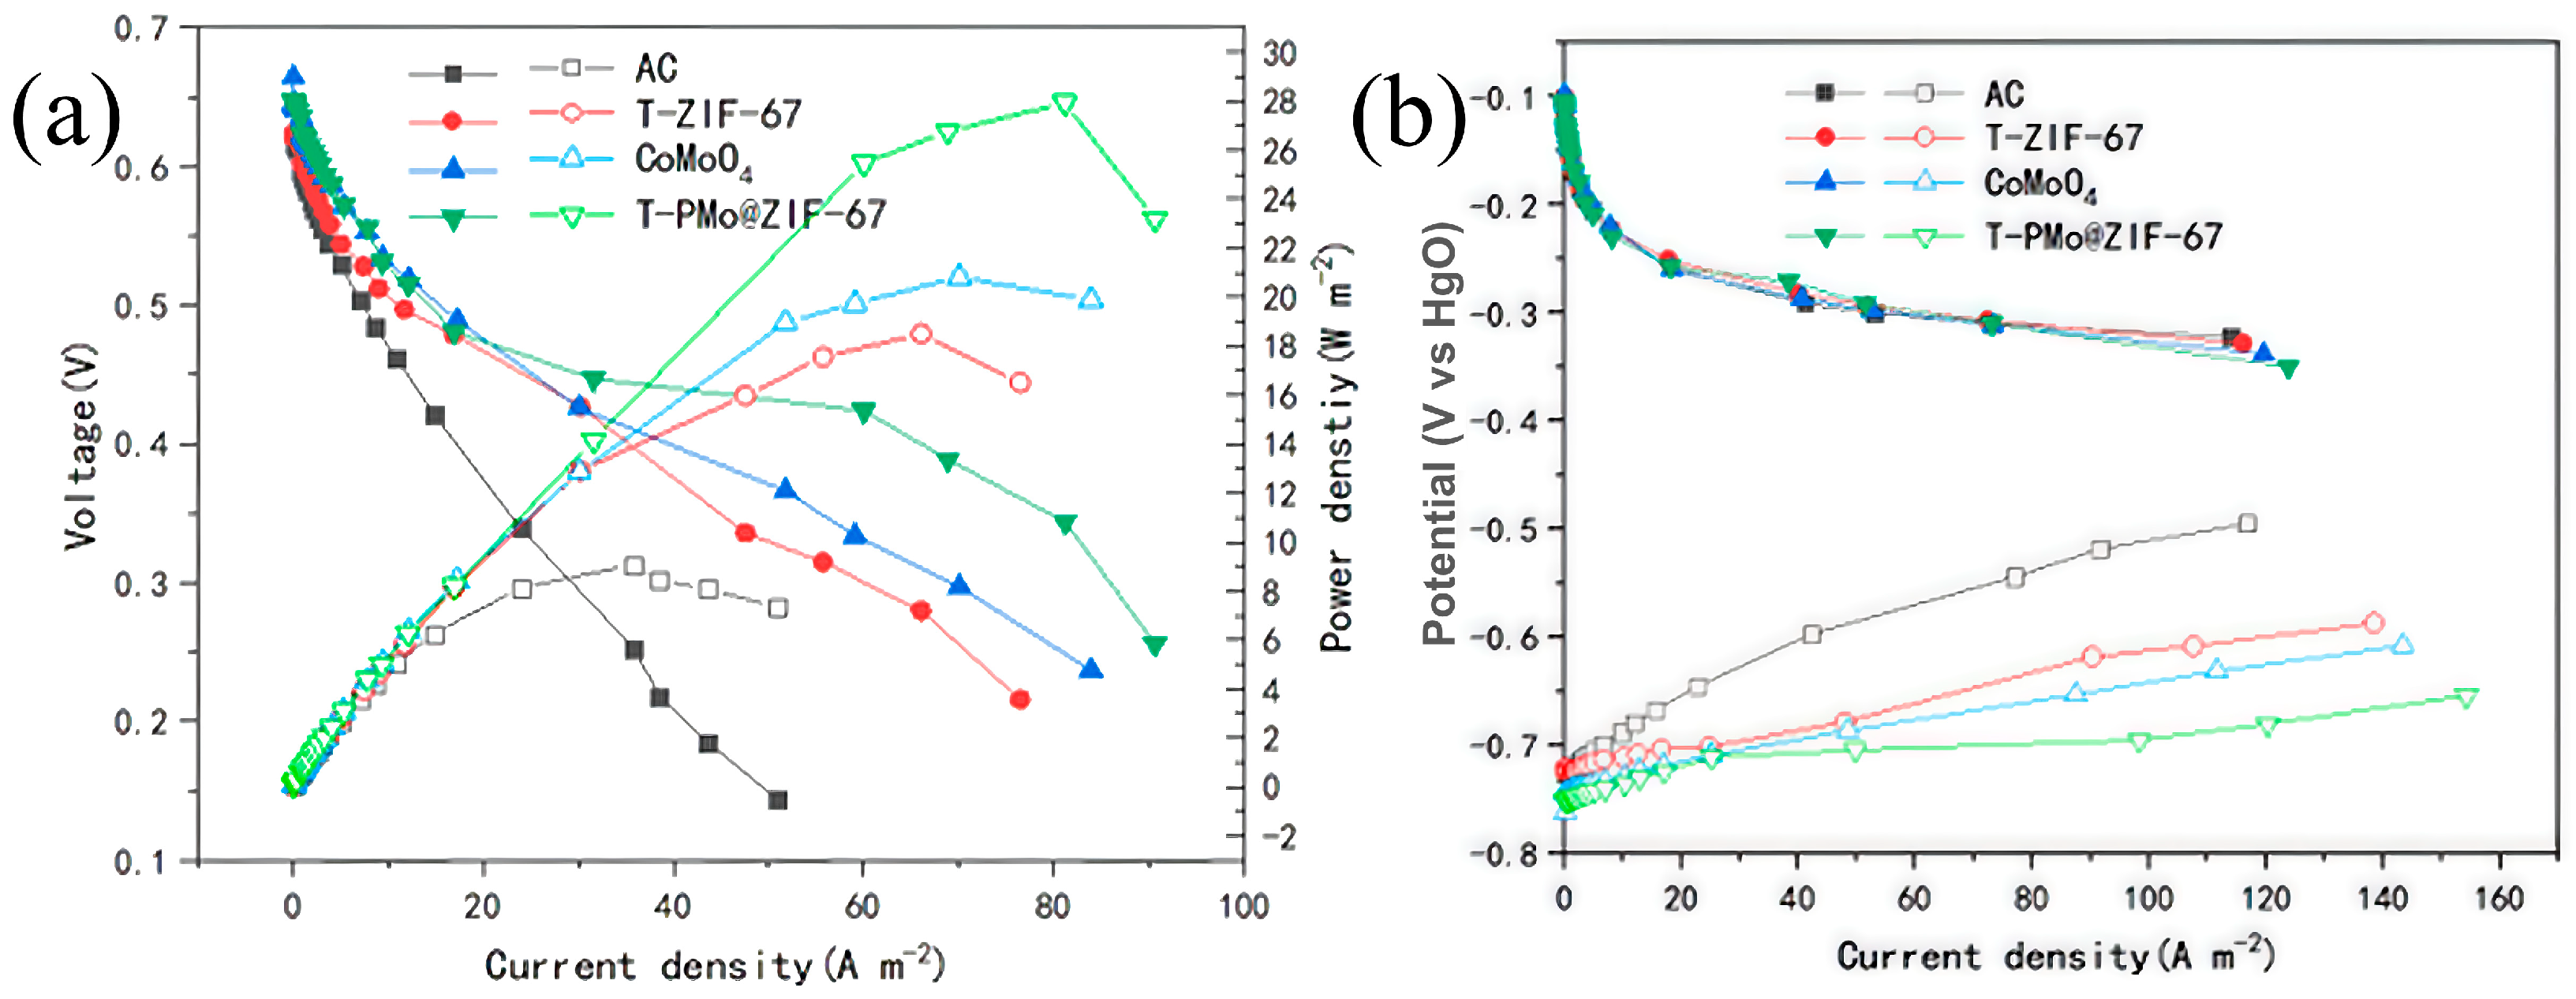
2.1.4. Power Density and Polarization Curves of Different Anodes in Fuel Cells

In the above electrochemical test results, compared with T-ZIF-67 without POM doping and a conventional CoMoO4 anode fuel cell, the T-PMo@ZIF-67 anode fuel cell had the best performance, which proved that the T-PMo@ZIF-67 catalyst could better promote anode glucose oxidation and electron transfer. In order to further study the comprehensive performance of T-PMo@ZIF-67-doped anodes in alkaline fuel cells, a complete alkaline glucose fuel cell was constructed by using carbon cloth as an air cathode and an active carbon–nickel foam anode doped with a catalyst. After glucose and a KOH solution were added, the fuel cell was left to stand at room temperature (25 °C) until the open circuit voltage of the cell became stable. The power density and polarization curves were measured.
Figure 4a illustrates the power density curve of the alkaline glucose fuel cell constructed with an air cathode and an active carbon–nickel foam anode doped with a catalyst, and Figure 4b demonstrates the anode and cathode polarization curves of each group of fuel cells. In order to control the experimental variables, the same carbon cloth was used as the air cathode for experimental testing. It could be seen that the power density curve of the fuel cell had the same change trend, showing a trend of first rising and then decreasing. The maximum power density of the fuel cell was in the following sequence: T-PMo@ZIF-67 (27.916 W m−2) > CoMoO4 (20.809 W m−2) > T-ZIF-67 (18.495 W m−2) > AC (9.060 W m−2). The power density curve of the anode fuel cell pack doped with T-PMo@ZIF-67 was always higher than that of the other three curves, and its maximum power density reached 27.916. It was 1.34 times that of the CoMoO4-doped anode fuel cell, 1.51 times that of the T-ZIF-67-doped anode fuel cell, and 3.08 times that of the blank anode fuel cell pack.
The reason for the change in fuel cell power density can be determined by analyzing the anode and cathode polarization curves. Because carbon cloth was used as the air cathode for all fuel cell systems, the downward trend and degree of the cathode polarization curves were basically the same. The changes in the total voltage and power density were mainly affected by the anode. Figure 4b clearly reflects the changes in the anode potential of the fuel cell: Among the four anodes, the decline rate of the blank anode was the fastest, and that of the T-ZIF-67-doped anode was lower than that of the blank anode. The potential decline of the CoMoO4 anode was slower than that of the T-ZIF-67 anode, while that of the T-PMo@ZIF-67-doped anode was the slowest. It was proven that the anode potential doped with T-PMo@ZIF-67 was the most stable and could continuously promote the oxidation of glucose, and its fuel cell performance was the best, which was in agreement with the LSV, EIS, and Tafel electrochemical test results.

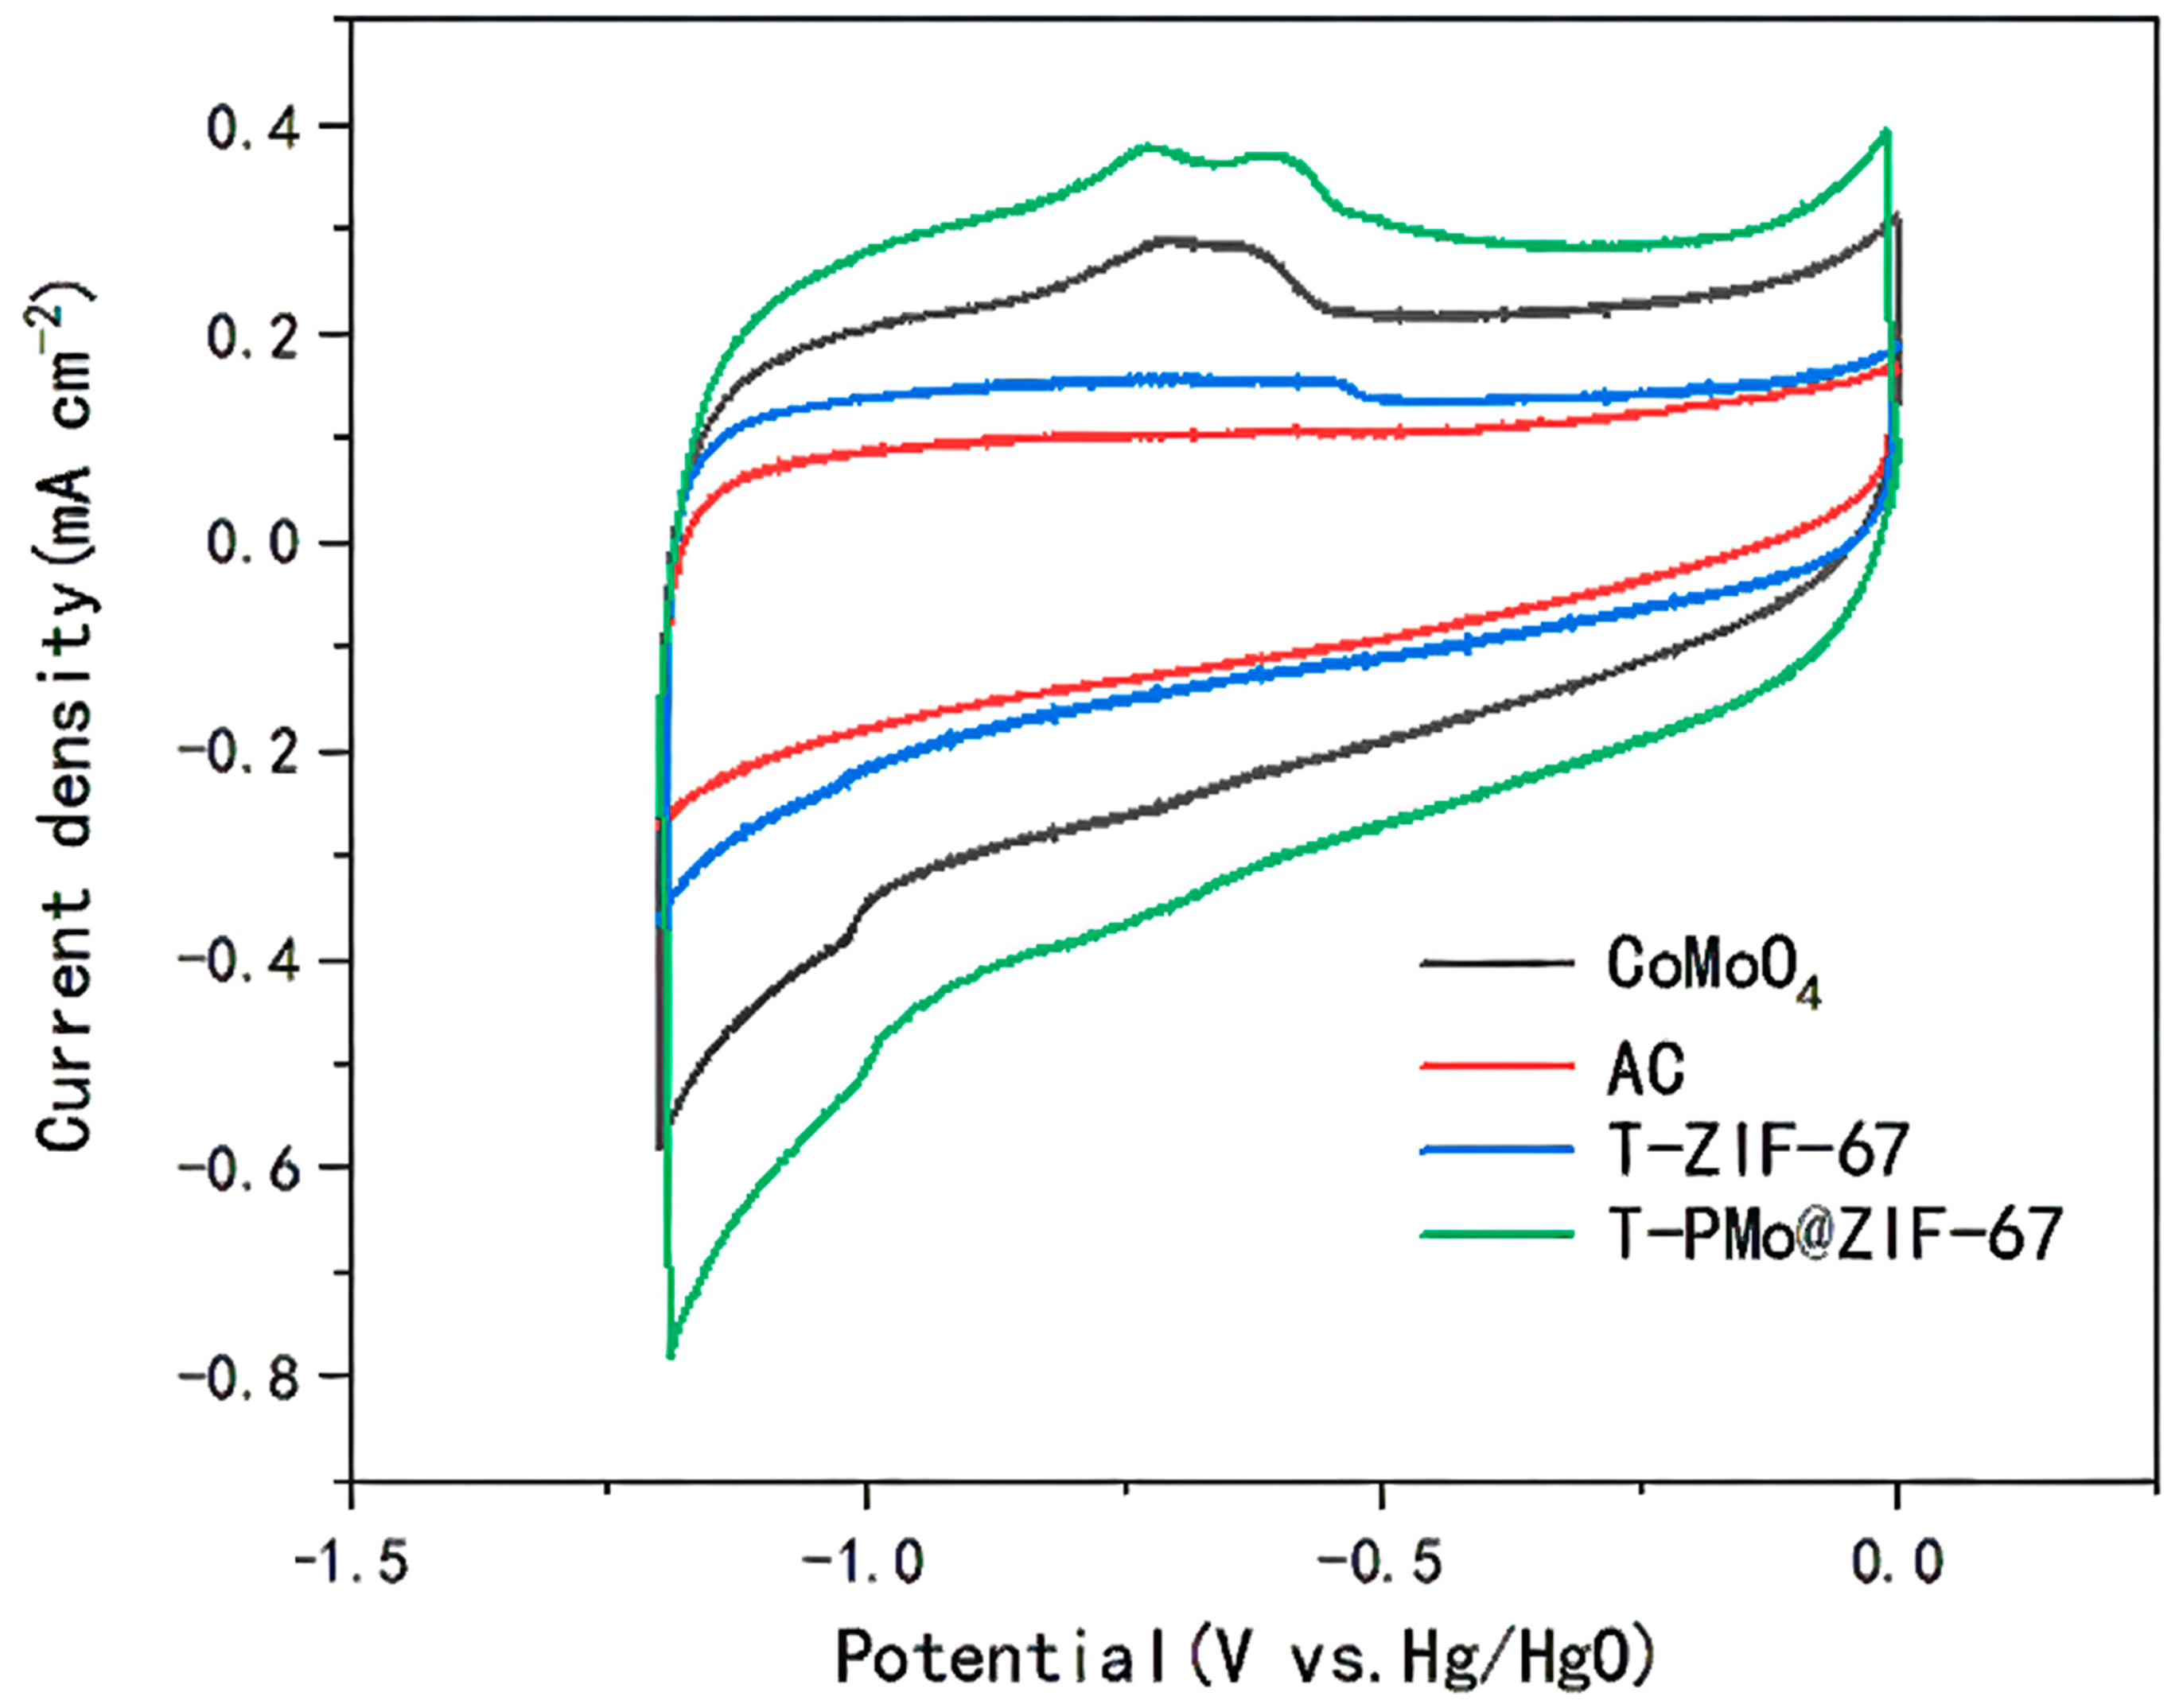
2.1.5. Cyclic Voltammetry Test of Anodes

In order to better explore the catalytic performance of the anode, a three-electrode system was used to perform a CV test on the anode. A glassy carbon electrode with a diameter of 4 mm was used as the working electrode, a carbon rod was used as the counter electrode, and a standard mercury oxide electrode (Hg/HgO) was used as the reference electrode. The measured sample (5 mg) was evenly dispersed in 8 mL of a mixed solution of ethanol and water (the volume ratio of ethanol and water was 1:1) by ultrasound, and then 50 μL of Nafion (5%) solution was added dropwise to the mixed solution. After ultrasonic treatment for 30 min, a catalytic ink with a uniform texture was obtained. The glassy carbon electrode needed to be polished with aluminum powder before use and treated with distilled water and anhydrous ethanol to clean it. After air drying, the ink was evenly coated on the surface of the glassy carbon electrode, the catalyst load reached 0.25 mg cm−2, and the working electrode attached to the catalyst was obtained. At the beginning of the test, it was necessary to test two cycles to make the system reach stability, and the third cycle data were drawn.
As can be seen from Figure 5, in the range of −1.2 V~0 V, the curves for anodes doped with T-PMo@ZIF-67 and CoMoO4 have two oxidation peaks, which are located at −0.59 V (−0.61 V) and −0.73 V (−0.71 V), respectively. The cyclic voltammetric curve corresponding to the T-ZIF-67-doped anode has only one redox peak, located at −0.54 V, indicating that peak (a) corresponds to the oxidation process of Co2+ and peak (b) corresponds to the oxidation process of Mo2+. Under the same redox potential, the current density of the electrodes doped with Co2+ and Mo2+ catalysts is significantly higher than that of the electrodes containing Co2+ alone. The current density of the anode doped with that of T-PMo@ZIF-67 is higher than that of the anode doped with CoMoO4 because of its more three-dimensional structure, larger porosity, and more active sites, which enable better contact between the catalyst and glucose solution, accelerate the redox process of the anode, and result in greater current density. The CV test results also prove the excellent catalytic performance of the T-PMo@ZIF-67 catalyst in alkaline glucose fuel cells.

2.2. Characterization of T-PMo@ZIF-67

2.2.1. Scanning Electron Microscope Analysis

In order to observe the microstructure of the prepared T-PMo@ZIF-67, it was characterized by scanning electron microscopy. As shown in Figure 6a,b, the appearance of PMo@ZIF-67 after calcination was similar to that of ZIF-67 after calcination, both of which are square. However, the surface of the original ZIF-67 after calcination was smooth. After doping with phosphomolybdate, the surface was rough, and its diameter was reduced. The reason for this phenomenon may be due to the electrostatic interaction between the anions in POMs and Co2+ resulting in a slow reaction rate of PMo@ZIF-67 formation, thus forming a small square structure with an unsmooth surface. T-PMo@ZIF-67 particles were about 500 nm in diameter, and their rough surface increased the number of active sites involved in the catalytic oxidation of glucose, facilitating the storage of large amounts of charge. Figure 6c was obtained by plotting the elements in T-PMo@ZIF-67. After calcination, carbon, cobalt, molybdenum, oxygen, and phosphorus were uniformly distributed in the entire structure, indicating that H3[P(Mo3O10)]4 is uniformly distributed in the pores of ZIF-67 without obvious agglomeration during the preparation process, and elements are uniformly distributed in the sample after calcination and pyrolysis. This unique hollow structure of T-PMo@ZIF-67 is likely related to the inside-out Ostwald ripening mechanism due to the regulation of H3[P(Mo3O10)]4 during preparation and anisotropic corrosion during hybrid self-assembly. In addition, energy dispersion spectra (EDS) of calcined cobalt–molybdenum oxides were characterized (Figure S1). In this catalyst, the molar mass ratio of Co and Mo is 3.86:1, so it can be calculated that the molar mass ratio of Co3O4 and CoMoO4 is 1:1.

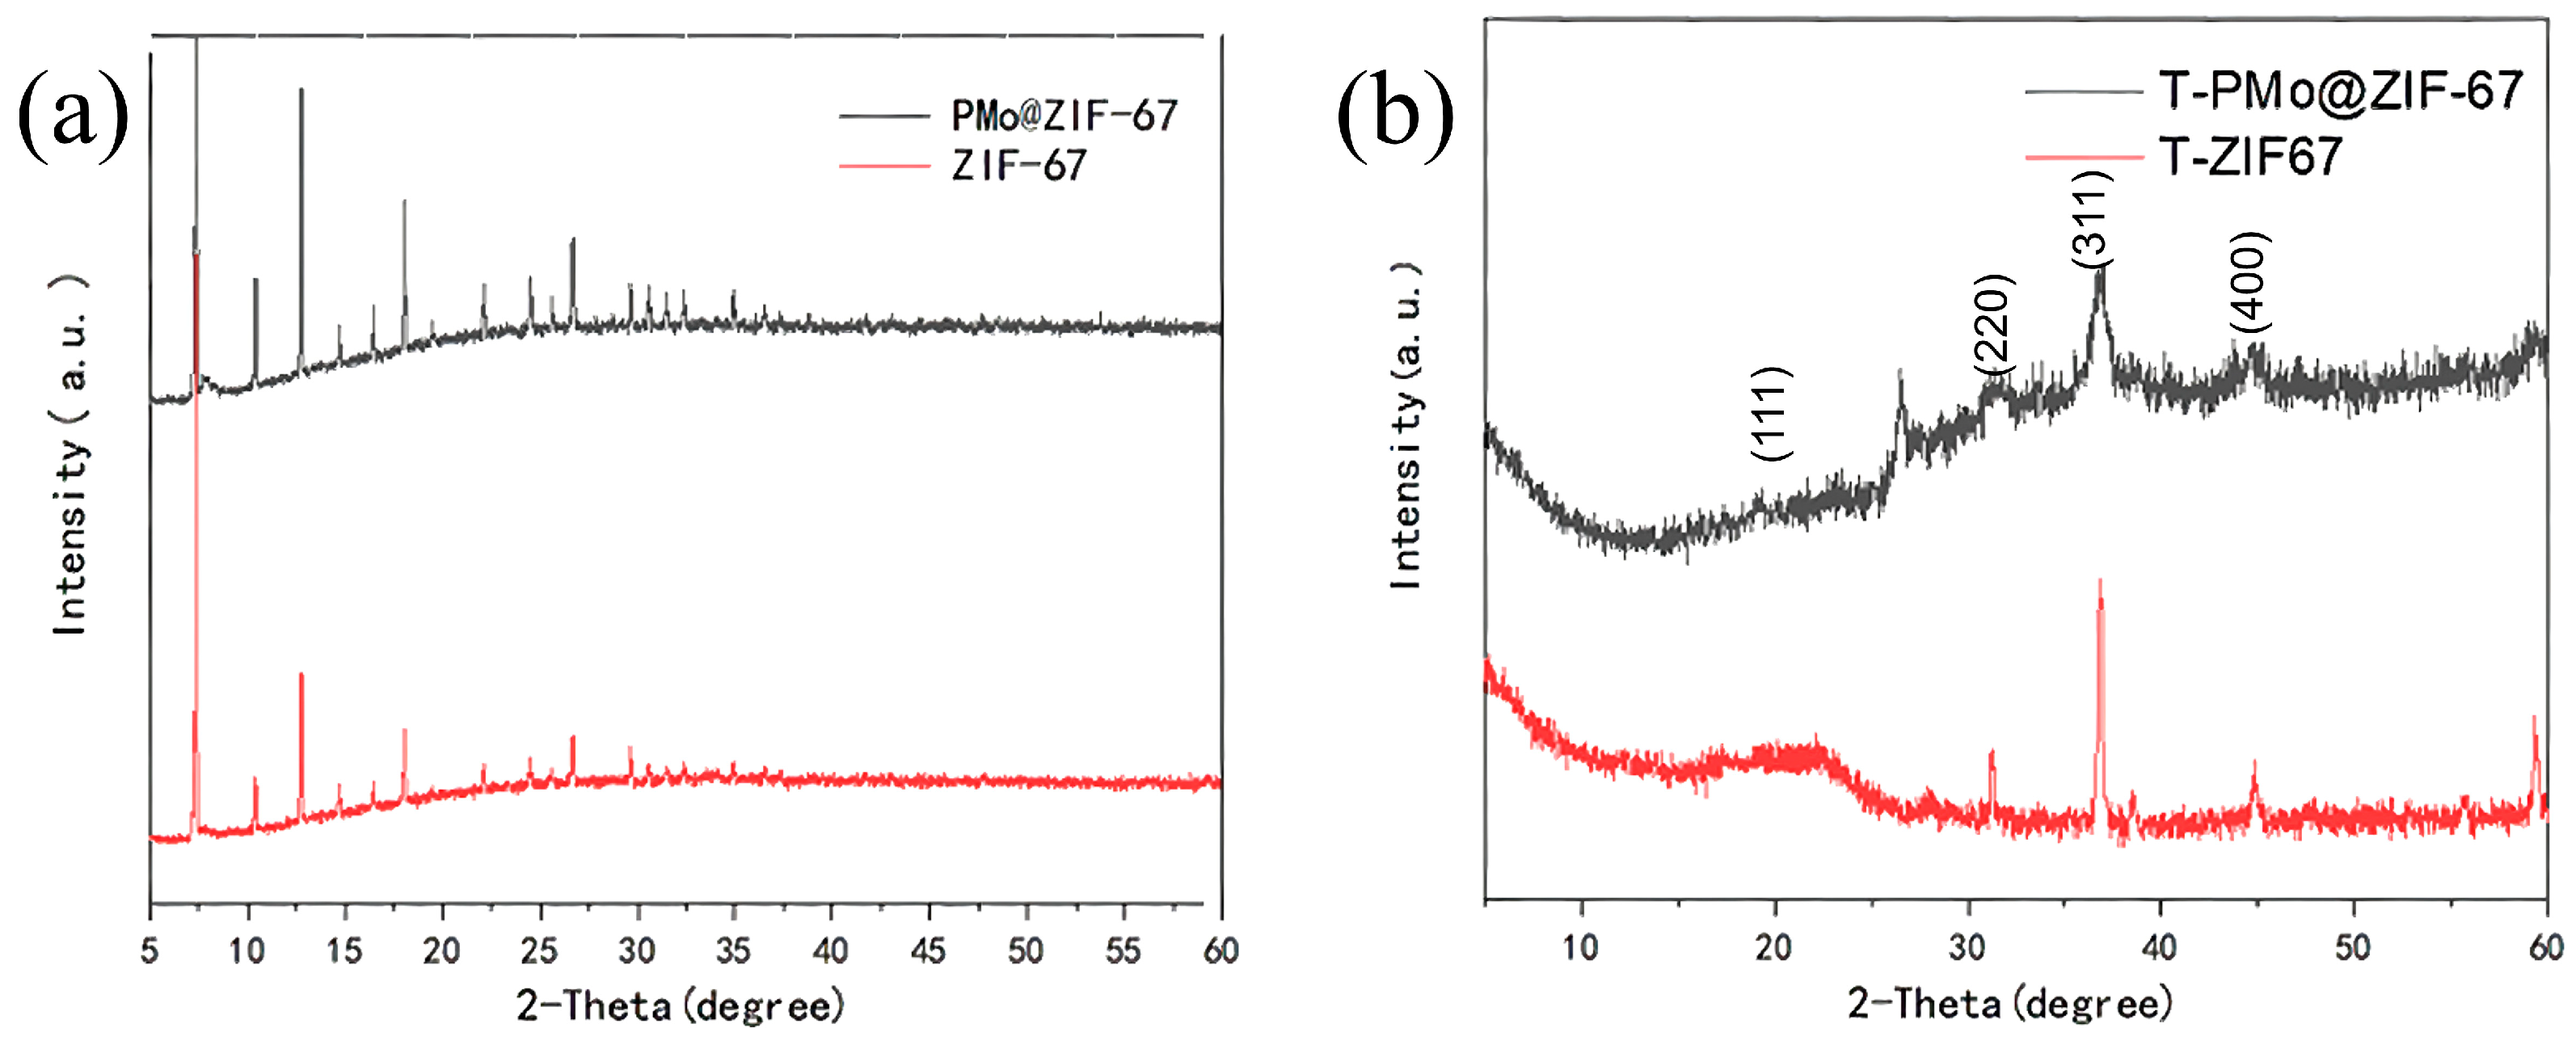
2.2.2. X-ray Diffraction Analysis

In order to facilitate the analysis of the phase and crystalline structure of T-PMo@ZIF-67, X-ray diffraction characterization was performed. Figure 7a shows the X-ray diffraction (XRD) curves of ZIF-67 and ZIF-67 (PMo@ZIF-67) prepared based on POMs. As shown in Figure 7a, the diffraction peaks of the two samples were in the same position, confirming that the target product was successfully obtained. In order to better analyze the structure of the catalyst, the raw ZIF-67 and PMo@ZIF-67 calcined materials were characterized. As shown in Figure 7b, it was found that the prepared crystals only showed a decrease in peak strength, indicating that the polyhedral structure was still mainly a ZIF-67-like structure. However, compared with the narrow and sharp diffraction peak of Co3O4 obtained in the original ZIF-67 calcination, the peak width of Co3O4 in the obtained Co3O4/CoMoO4 sample was larger, indicating that the grain size of Co3O4 decreased significantly. The XRD results showed that T-PMo@ZIF-67 catalyst Co3O4 and CoMoO4 exist simultaneously. Diffraction peaks of 19.2°, 31.7°, 36.8°, and 44.6° with 2θ were associated with peaks of (111), (220), (311), and (400) Co3O4 (JCPDS No. 42-1467). The presence of diffraction peaks with 2θ of 23.1°, 25.5°, 26.3°, 28.5°, and 29.5° indicated the formation of CoMoO4 (JCPDS NO. 21-0868). The XRD results show that the Co3O4/CoMoO4 hybrid was successfully prepared by calcining PMo@ZIF-67.

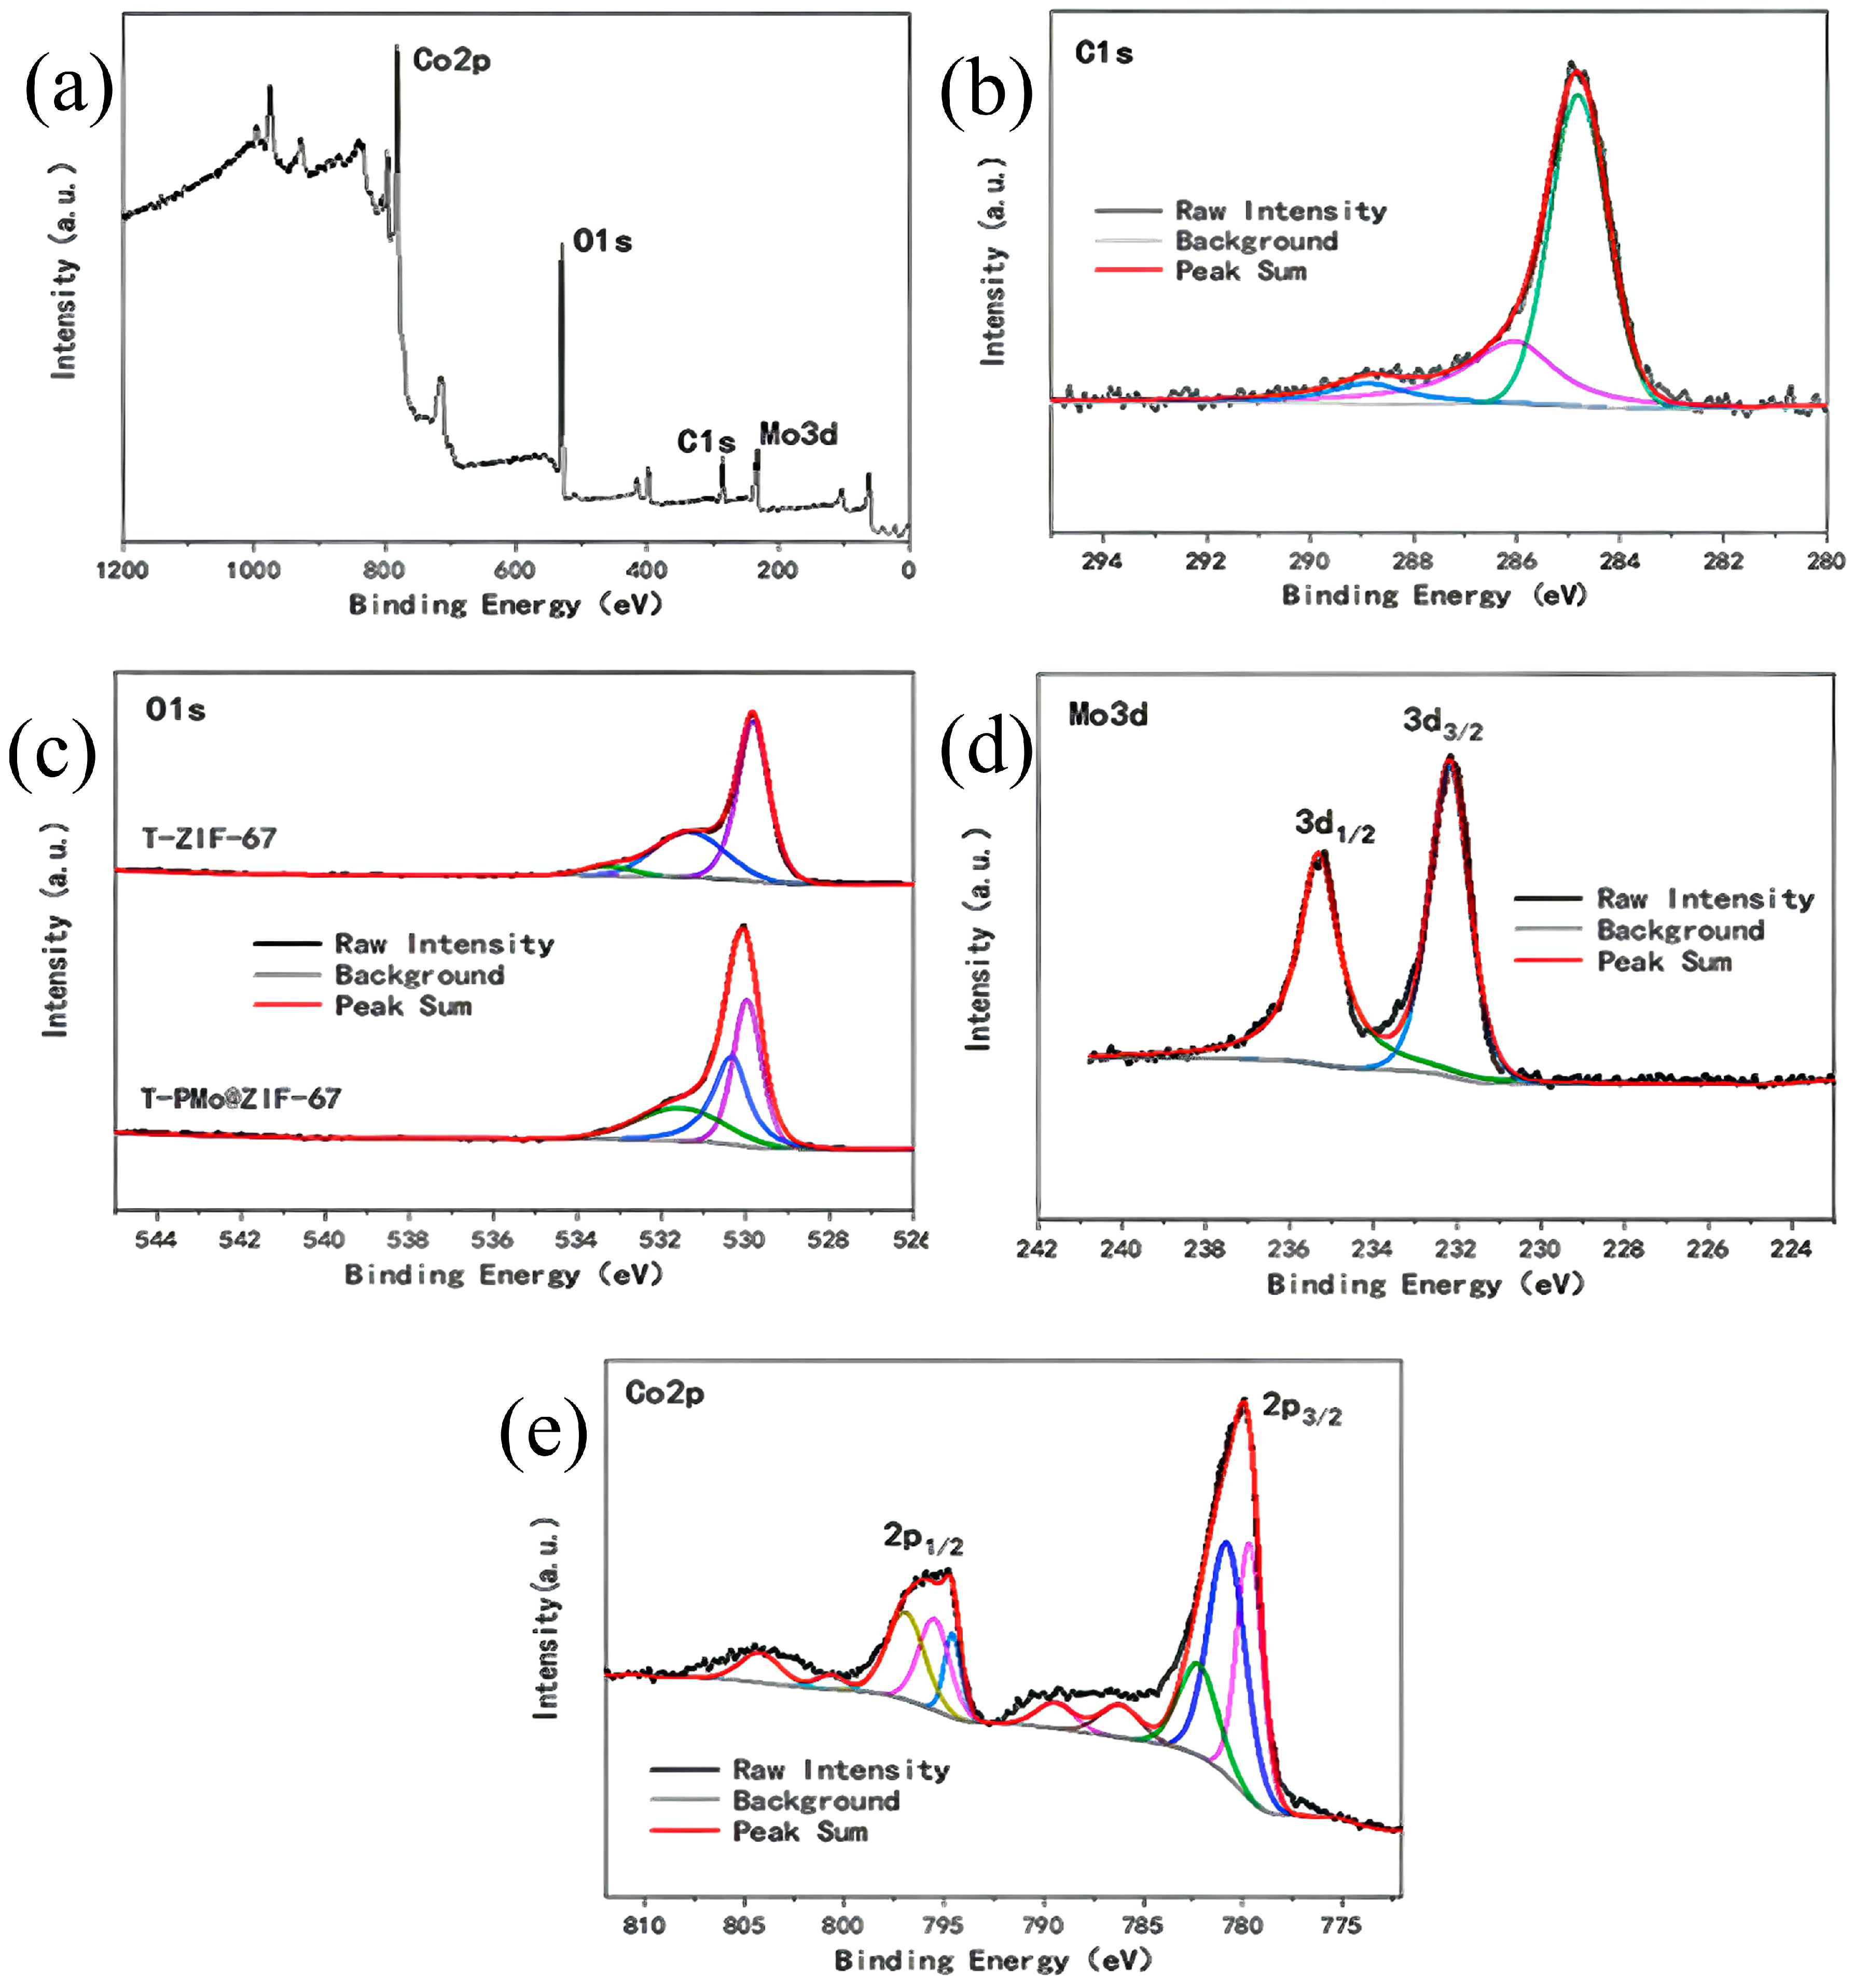
2.2.3. X-ray Photoelectron Spectroscopy Analysis

In order to analyze the elemental composition and valence distribution of the catalyst and facilitate the later analysis of the reaction mechanism of T-PMo@ZIF-67 catalyzing glucose oxidation, the material was characterized by XPS, and the XPS spectra of the catalyst were obtained by using Advantage fitting. Figure 8a shows the XPS spectra of various elements of the T-PMo@ZIF-67 catalyst. The peaks of Co2p, O1s, C1s, and Mo3d are found at 780.41 eV, 530.26 eV, 284.97 eV, and 232.49 eV. The peaks centered on 284.76 eV, 285.98 eV, and 288.81 eV as shown in Figure 8b represent C=C/C-C, C=C/C-C, and C=O and were the peak signals of C1s. In the O1s spectrum of Figure 8c, the three peaks at the binding energies of 529.96 eV, 530.31 eV, and 531.55 eV represent lattice oxygen, oxygen vacancy, and adsorbed oxygen, respectively. By comparison with the XPS diagram of the T-ZIF-67 catalyst, it was found that the lattice oxygen peak shifted by 0.1 eV after the addition of phosphomolybdate. In Figure 8d, it can be seen that there are two split cracks at 235.30 eV and 232.18 eV in the XPS diagram of Mo3d, and the column width is 3.17 eV, which is similar to that seen in the literature and could be judged as Mo6+. In Figure 8e, the spectrum of Co2p is shown to consist mainly of two orbital splits of about 15 eV spin-orbital double peaks and multiple signal peaks. The double peaks of the spin orbits at 780 eV and 795 eV represent the Co2p3/2 and Co2p1/2 levels of the Co ion, respectively. The main peak, which could be divided into three pairs of double peaks, and the signal peak at the high binding energy distance of 6 eV and 8 eV from the main peak show that Co2+ and Co3+ exist in the material at the same time. Furthermore, based on the calculated area of the fitting peak, it was found that the relative atomic ratio of Co2+/Co3+ in T-PMo@ZIF-67 (0.82) was higher than that of T-ZIF-67 (0.60). The proportion of Co3+ decreased significantly after Mo doping, indicating that Co3+ was replaced by Mo6+ due to its similar ionic radius to Mo6+. Moreover, the peak binding energy potential of the catalyst doped with phosphomolybdate had a positive shift of 0.1 eV, which indicated that the doping with the Mo ion led to a decrease in the electron density of the Co ion, which made the Co ion more electrophilic, promoted the adsorption and reaction of hydroxide, and enhanced the catalyst’s catalytic activity in an alkaline environment.

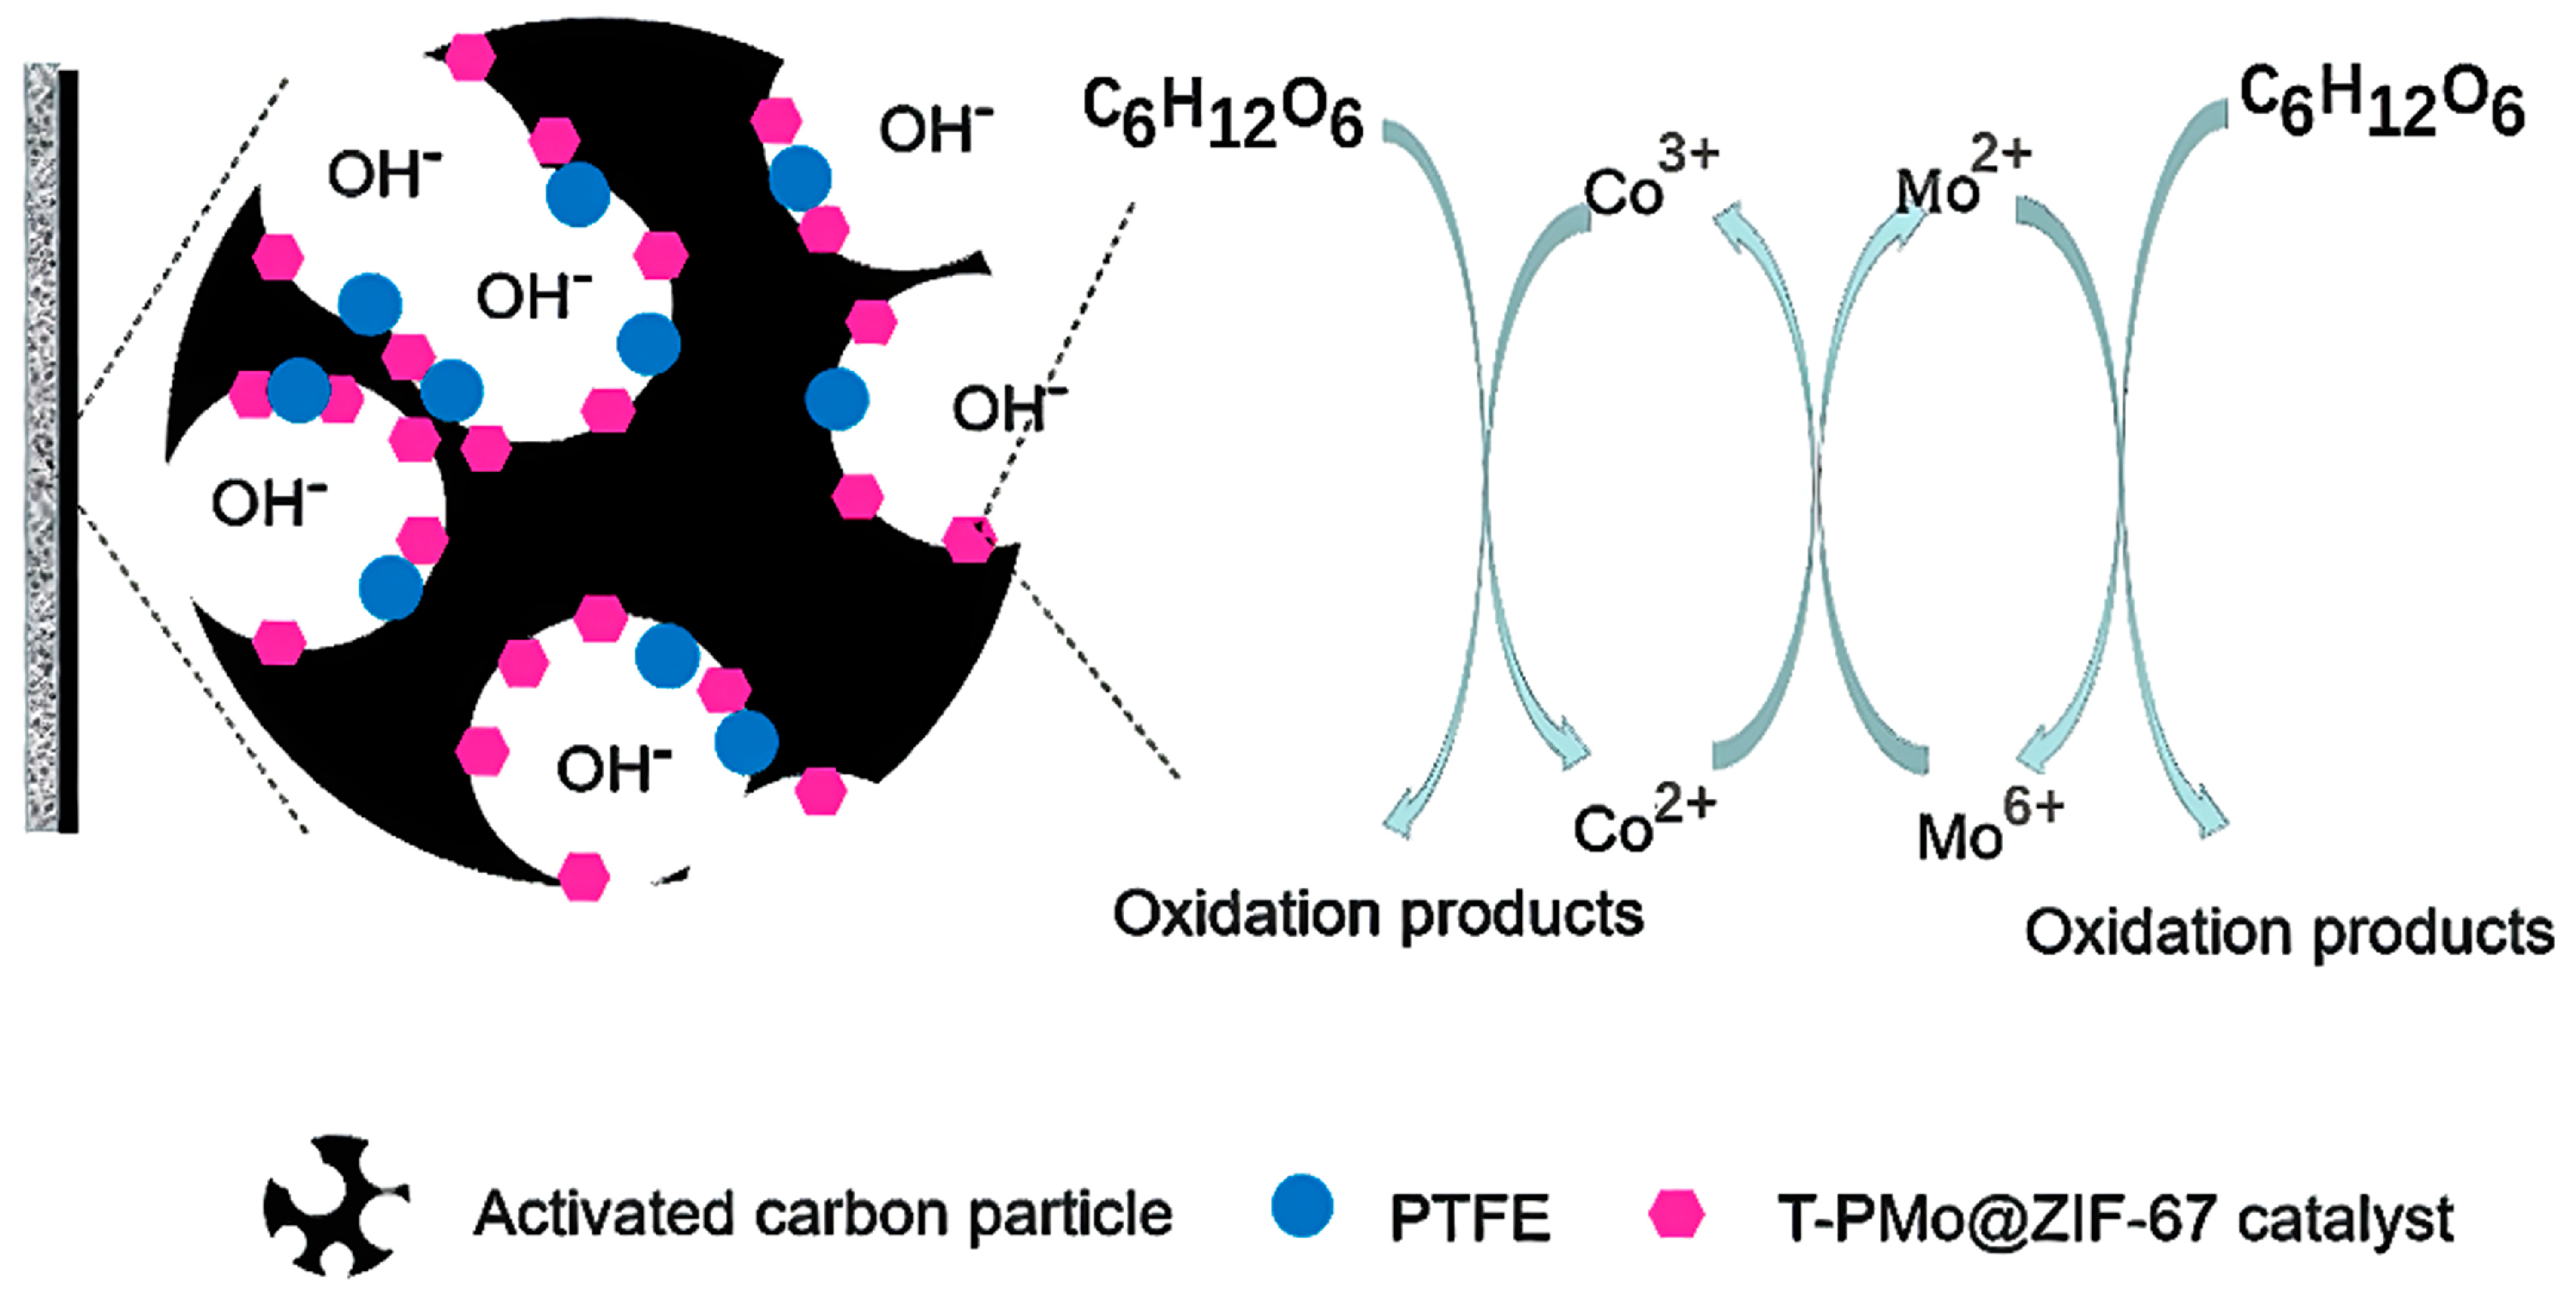
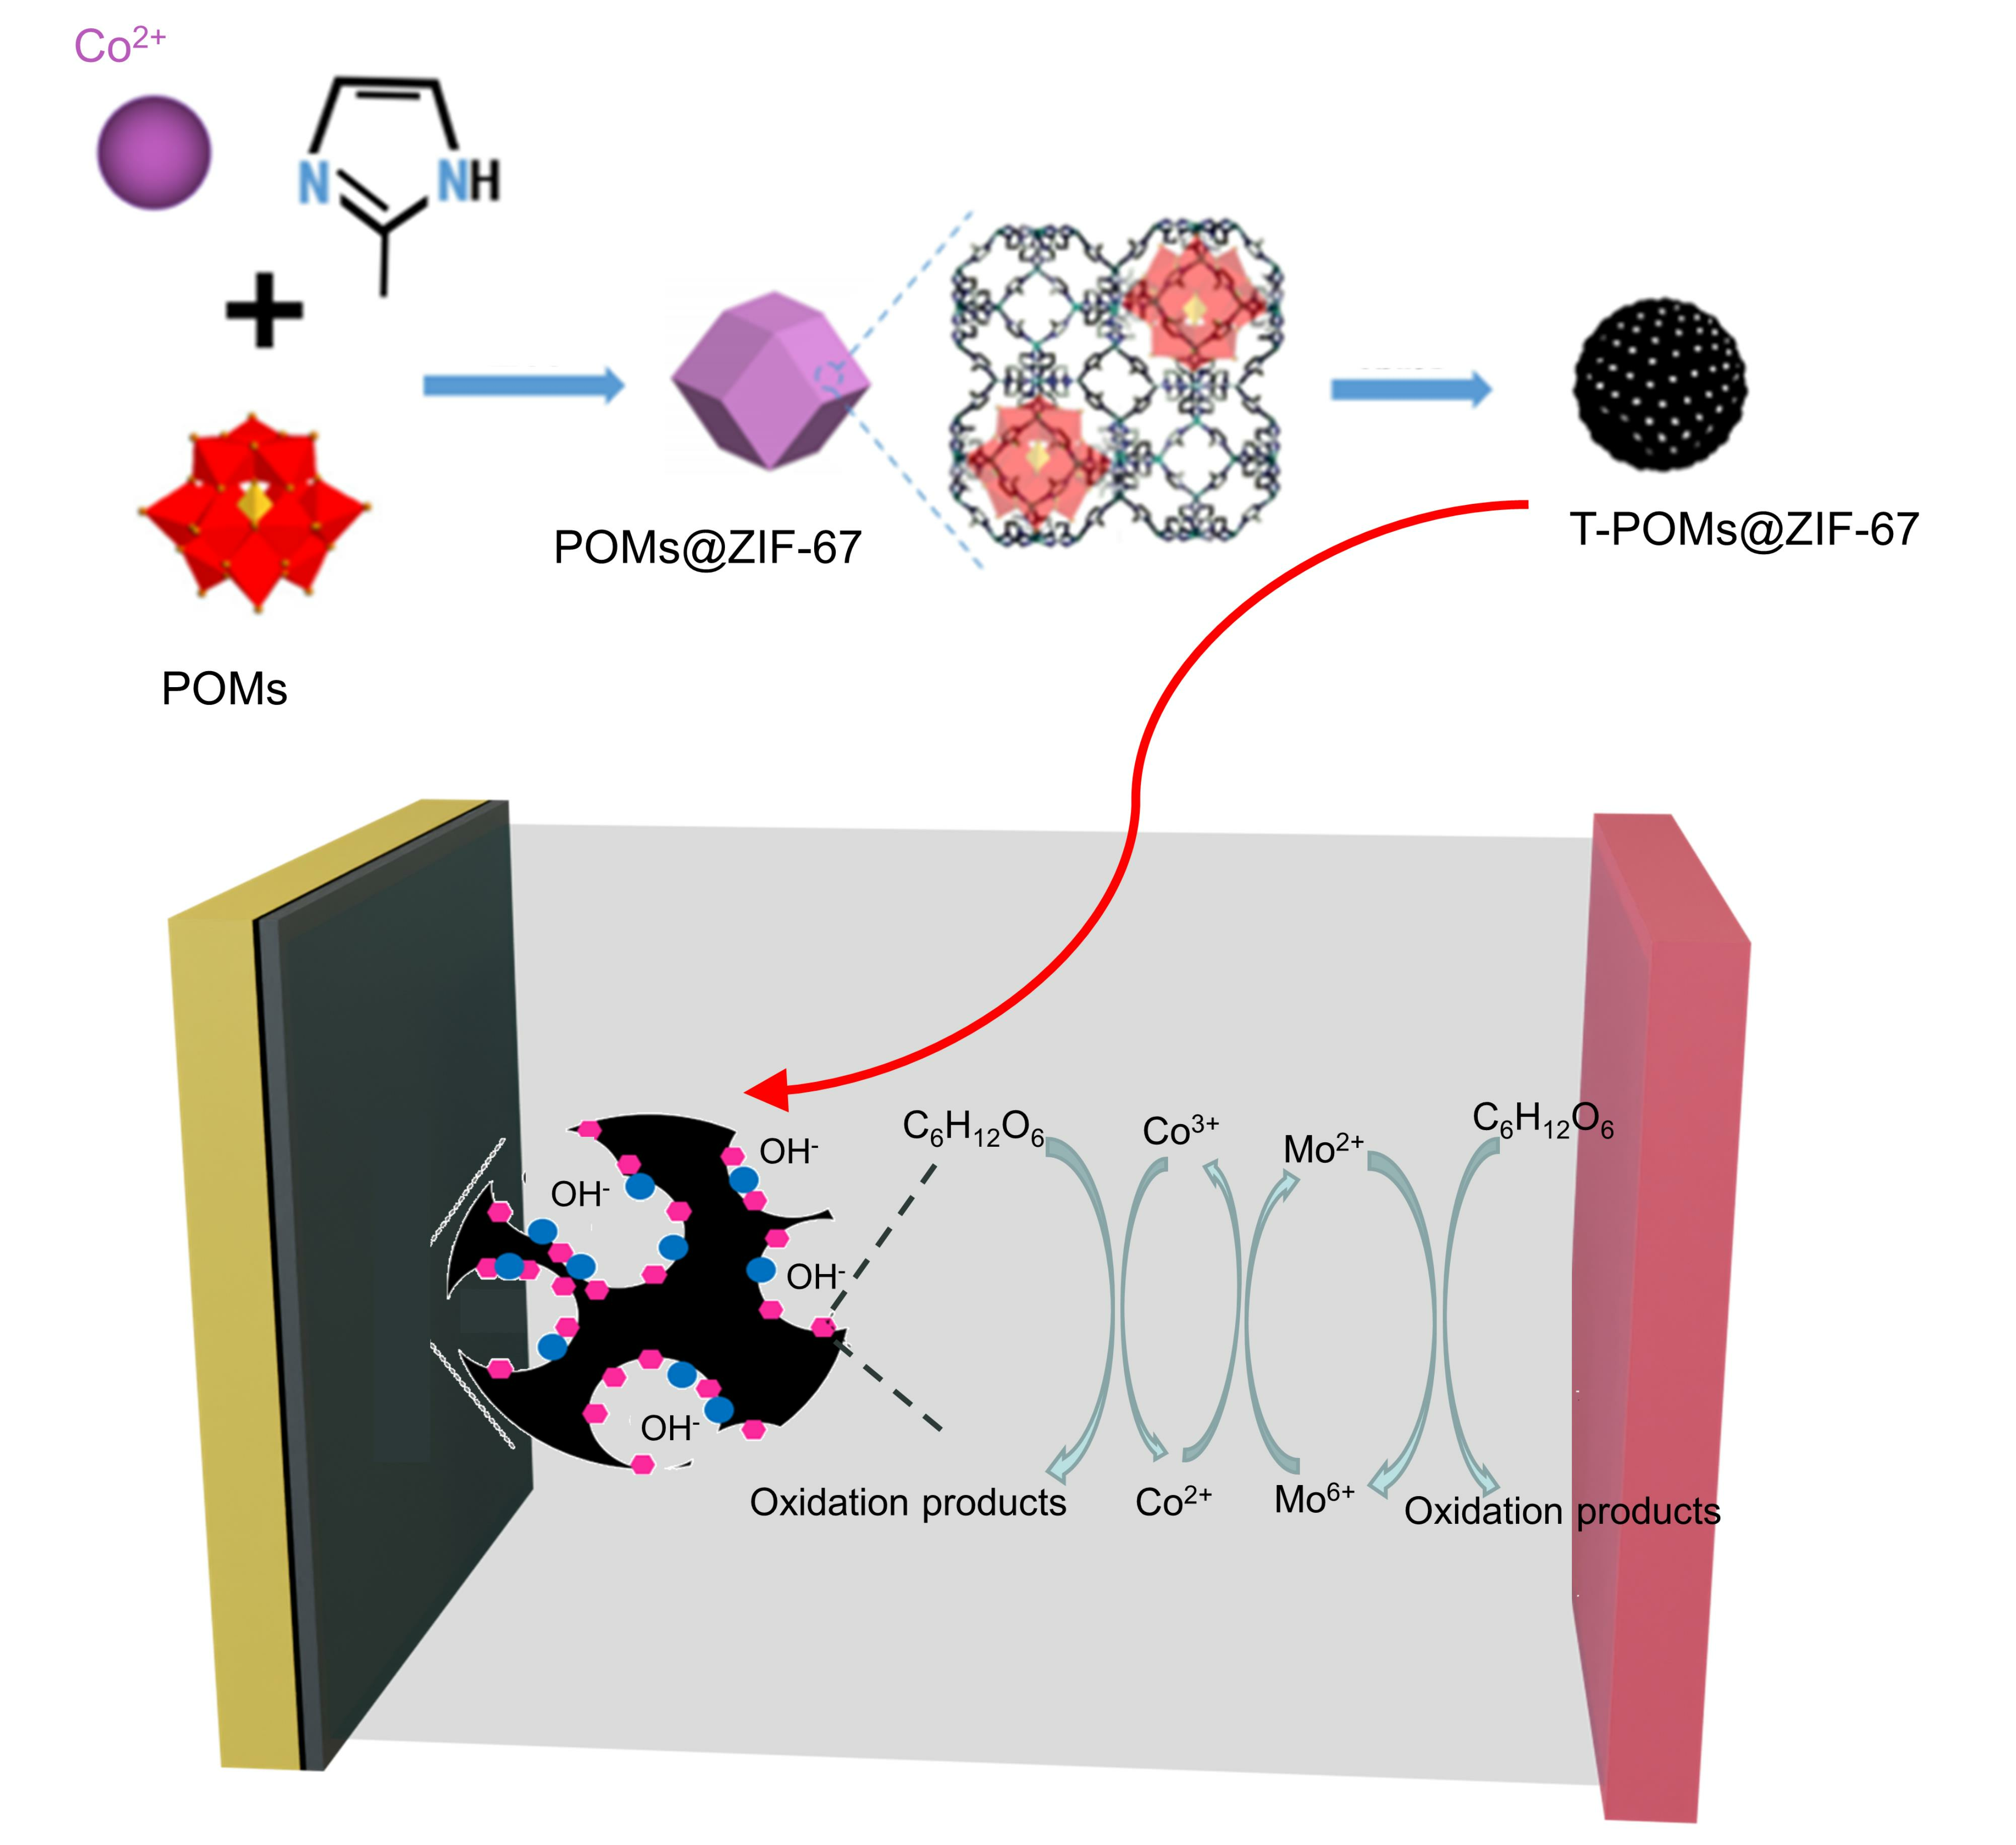
2.3. Discussion of Catalytic Mechanism

Combining the TEM, XPS, and XRD characterization and the electrochemical experiment results, the mechanism of T-PMo@ZIF-67 catalyzing glucose oxidation in an alkaline environment is shown in Figure 9. The process of T-PMo@ZIF-67 catalyzing glucose oxidation can be summarized as the following reaction:
24   Co 2 +     24   e     24   Co 3 +
C 6 H 12 O 6 + 36   OH   +   24   Co 3 +   6   CO 3 2 + 24   Co 2 + + 24   H 2 O
6   Mo 6 +   +   12   e       6   Mo 4 +
6   Mo 4 +   +   12   e       6   Mo 2 +
C 6 H 12 O 6   +   36   OH   +   6   Mo 6 +   6   CO 3 2 + 6   Mo 2 + + 24   H 2 O
Mo 6 +   + 2   Co 2 +         Mo 4 +   +   2   Co 3 +
In the whole reaction process, we found that the Co3+ produced by Co2+ was oxidizing, which helped to accelerate the oxidation process of glucose in the alkaline environment. At the same time, it was very easy for Mo6+ to obtain electrons from the environment. On the one hand, it could react with Co2+ to generate oxidizing Co3+; on the other hand, in an alkaline environment, it could directly react with glucose, directly accelerate the oxidation rate of glucose, and generate the reduction product Co2+. T-PMo@ZIF-67 participated in the oxidation of glucose on the fuel cell anode through this series of reactions.
The performance and current of the fuel cell are determined by the quality of the catalyst. In T-PMo@ZIF-67, Co2+ and Mo6+ had a synergistic effect. Co3+ could be easily obtained by virtue of the good oxidation of Mo6+, and Co3+ could be reduced to Co2+ by oxidizing glucose. The generated Mo2+ was oxidized to Mo6+ through the cathode, and the electrons were transferred from the cathode to the external circuit, thus realizing the recycling of the catalyst and ensuring the stability of the catalyst.

3. Materials and Methods

3.1. Characterization

The electrochemical performance of the catalyst anodes was tested using an electrochemical workstation (CHI-660E, Chenhua Instrument Co., Ltd., Shanghai, China). SEM images were obtained using a scanning electron microscope (S4800, Hitachi High-tech Corporation, Tokyo, Japan). TEM analysis was performed using a transmission electron microscope (Tecnai G2 F20, IKA, Königswinter, Germany). XRD analysis was performed using an X-ray diffractometer (D/MX-IIIA, Hitachi High-tech Corporation, Japan). XPS analysis was performed using an X-ray photoelectron spectrometer (Escalab 250Xi, Thermo Fisher Scientific, Waltham, MA, USA).

3.2. Preparation of Electrodes

3.2.1. Preparation of POMs@ZIF-67

First, 2.5 mM Co(NO3)2·6H2O was dissolved in 25 mL of a methanol solution and then mixed with 10 mL of a POM aqueous solution (30 mM), denoted as solution A. In this study, three heteropoly acids, namely phosphomolybdic acid (H3[P(Mo3O10)4], PMo12), silicotungstic acid (H3[Si(W3O10)4], SiW12) and phosphotungstic acid (H3[P(W3O10)4], PW12), were used to prepare POMs@ZIF-67. Then, 20 mM 2-methylimidazole was added to 25 mL of a methanol solution, denoted as solution B. Solution B was quickly added to solution A and mixed evenly to obtain solution C. Solution C was moved to a hydrothermal reactor and heated at 120 °C for 10 h to obtain a purple precipitate. The precipitates were filtered and washed with ethanol and then dried at 60 °C overnight to obtain POMs@ZIF-67 materials (PMo@ZIF-67, SiW@ZIF-67, PW@ZIF-67).

3.2.2. Preparation of T-POMs@ZIF-67

The prepared POMs@ZIF-67 materials were placed in a muffle furnace (SKX-8-16) and slowly heated to 500 °C for 2 h. After cooling, the materials were washed with ethanol and dried at 60 °C overnight. The POMs@ZIF-67 oxides (T-PMo@ZIF-67, T-SiW@ZIF-67, T-PW@ZIF-67) were obtained.

3.2.3. Synthesis of CoMoO4 Nanomaterials

Co(NO3)2·6H2O and NaMoO4 (Co/Mo molar mass ratio = 1:1) were dissolved in deionized water and stirred vigorously for 30 min. The mixture was transferred to a hydrothermal reactor and heated to 120 °C for 10 h. After cooling, the resulting powder was washed 6 times using a mixture of deionized water and ethanol (1:1 volume ratio). Finally, the solid was dried overnight at 70 °C and calcined at 500 °C for 2 h to obtain CoMoO4 nanomaterials.

3.2.4. Preparation of T-POMs@ZIF-67-Modified Anode

The T-POMs@ZIF-67-modified anode was prepared using the doping method, as shown in Figure S2:
① First, 0.5 g of activated carbon powder and an appropriate amount of T-POMs@ZIF-67 were mixed in anhydrous ethanol solution at the ratio of 1:0.01~1:0.05, and the mixture was put into ultrasonic cleaner (SK5200HP, Kudos Ultrasonic Instrument Co., Ltd., Shanghai, China) for ultrasonic shock and continuous agitation for 40 min.
② Then, 0.25 g of PTFE emulsion (wt%: 60%) was slowly added and stirred continuously for 40 min.
③ The mixture was placed in a constant-temperature water bath at 70 °C, stirred continuously, and removed when it was pureed.
④ The sludge mixture was rolled on a nickel foam disc with a radius of 18 mm using a roller press to obtain a T-POMs@ZIF-67-modified anode with a thickness of 2~4 mm.
The preparation method for the blank anode was the same as the above steps; 0.5 g of activated carbon powder was evenly mixed in anhydrous ethanol, 0.25 g of PTFE emulsion was slowly added, and then the mixture was heated to a pureed shape at 70 °C and rolled on a nickel foam disc.

3.3. Experimental Methods

The fuel cell constructed in this experiment was mainly made of polymethyl methylbenzoate (PMMA) material, which had good acid and alkali corrosion resistance and high transparency allowing the observation of the internal situation of the fuel cell. The fuel cell was tightened with four screws and was sealed using carbon cloth and nickel foam with an area of about 7 square centimeters at both ends to serve as the cathode and anode. A cylindrical cavity was formed, and 10 mL of a 3 M KOH and 1 M glucose solution was added as a substrate. Nickel wires were protruded at the cathode and anode to help connect external circuits (Figure S3).
A three-electrode system with a saturated HgO electrode as the reference electrode, hydrophobic carbon cloth as the electrode, and activated carbon–nickel foam doped with catalyst as the anode was used for electrochemical experiments. The test environment was room temperature. After the open circuit voltage of the fuel cell filled with the KOH and glucose mixture solution was stabilized, the electrochemical data of the catalyst anode were obtained.

3.3.1. Linear Sweep Voltammetry (LSV)

During the test, the open circuit voltage was tested first. When the open circuit voltage was stable, the LSV test was carried out with its initial voltage, and the scan was started at a rate of 0.1 mV. The current density was calculated by dividing the measured current by the geometric surface area of the electrode.

3.3.2. Electrochemical Impedance Spectroscopy (EIS)

The open circuit voltage with an amplitude of 5 mV and a frequency of 0.001~100,000 Hz was used as the test voltage for testing. The equivalent circuit was R(CR)(CR) according to the results obtained by ZSIMPWIN (V 3.61) fitting. Ohmic resistance (Rs), layer capacitance (Cdl), charge transfer resistance (Rct), void adsorption capacitance (Cad), and diffusion resistance (Rt) could be calculated by fitting, and the total resistance of the fuel cell could be calculated.

3.3.3. Tafel Test (Tafel)

The Tafel curve test option in the electrochemical workstation (CHI-660E, CHI instruments, Shanghai, China) was selected for testing, the sweep speed was set to 1 mV, and the initial and termination voltages were set to open circuit voltage ±0.1 V.

3.3.4. Cyclic Volt Ampere Curve (CV)

The test was carried out by setting the starting and low voltages to −1.2 V, the stopping and high voltages to 0 V, the scanning to three turns, and the sweep speed to 0.05 V.

3.3.5. Power Density Curve and Polarization Curve

The power density curve and polarization curve are two important indicators of fuel cell performance. In this experiment, a three-electrode system with a saturated HgO electrode as the reference electrode, hydrophobic carbon cloth as the electrode, and activated carbon–nickel foam doped with catalyst as the anode was tested. The electrode was connected to a multimeter. When the open circuit voltage was stable, the resistance box was connected to the resistor in parallel, and the resistance size of the resistance box was adjusted from 9000 Ω to 3 Ω. After the resistance was adjusted using the resistance box, the multimeter data were recorded after the voltage was stable. The power density of the fuel cell and the polarization data of the anode and cathode were calculated according to Formulas (7) and (8), and then the results were visualized using Origin 2021 (9.8.5.200).
I = U/RS
P = U × I
where I is the current density (A m−2), U is the voltage (V), R is the resistance box resistance (Ω), S is the electrode area, and P is the power density (W m−2).

4. Conclusions

In this research, a series of T-POMs@ZIF-67 materials (T-PW@ZIF-67, T-SiW@ZIF-67, and T-PMo@ZIF-67) were prepared by pyrolysis of POM-MOF nanocomposites. Their electrochemical performance in the catalytic oxidation of glucose was investigated. T-PMo@ZIF-67 demonstrated the highest catalytic performance in an alkaline glucose fuel cell anode. To investigate the influence of the phosphomolybdic acid doping amount on catalytic performance, phosphomolybdic acid solutions of varied molar mass were added during the preparation process. The addition of 30 mM phosphomolybdic acid solution increased the material’s catalytic performance the most. The maximal power density of the glucose fuel cell with an anode doped with the T-PMo@ZIF-67 catalyst was 27.916 W m−2, which was much higher than that of the typical cobalt–molybdenum oxide. The high electrocatalytic performance of T-PMo@ZIF-67 can be attributed to the three-dimensional structure of cobalt–molybdenum oxide generated by anchoring phosphomolybdic acid to the hollow structure of ZIF-67. These findings suggest that MOF derivatives produced by doping MOFs with POM have great potential for fuel cell applications.

Supplementary Materials

The following supporting information can be downloaded at: https://www.mdpi.com/article/10.3390/catal13101339/s1, Figure S1: EDS chart for T-PMo@ZIF-67; Figure S2: preparation process of T-PMo@ZIF-67 modified anode; Figure S3: schematic diagram of the glucose battery.

Author Contributions

Writing—original draft preparation S.J. and N.K.; methodology, Y.Z. and Y.L.; data curation, B.M.; conceptualization, N.K., X.Z. and X.L.; writing—review and editing, P.Z. and X.L. All authors have read and agreed to the published version of the manuscript.

Funding

This work was partially supported by the National Key R&D Program of China (Grant No. 2019YFC1407800) and the Tianjin Science and Technology Program (Grant No. 21YFSNSN00180).

Data Availability Statement

Not applicable.

Conflicts of Interest

The authors declare that they have no known competing financial interests or personal relationships that could have appeared to influence the work reported in this paper.

References

  1. Mehtab, T.; Yasin, G.; Arif, M.; Shakeel, M.; Korai, R.M.; Nadeem, M.; Muhammad, N.; Lu, X. Metal-organic frameworks for energy storage devices: Fuel cells and supercapacitors. J. Energy Storage 2019, 21, 632–646. [Google Scholar] [CrossRef]
  2. Jacobs, R.; Patki, P.; Lynch, M.J.; Chen, S.; Morgan, D.; Field, K.G. Materials swelling revealed through automated semantic segmentation of cavities in electron microscopy images. Sci. Rep. 2023, 13, 5178. [Google Scholar] [CrossRef] [PubMed]
  3. Barbour, L.J. An introduction to the virtual issue on Coordination polymers. Acta Crystallogr. Sect. C Struct. Chem. 2014, 70, 638–639. [Google Scholar] [CrossRef] [PubMed]
  4. Liang, J.; Liang, Z.; Zou, R.; Zhao, Y. Heterogeneous Catalysis in Zeolites, Mesoporous Silica, and Metal-Organic Frameworks. Adv. Mater. 2017, 29, 1701139. [Google Scholar] [CrossRef]
  5. Zhang, H.; Nai, J.; Yu, L.; Lou, X.W. Metal-Organic-Framework-Based Materials as Platforms for Renewable Energy and Environmental Applications. Joule 2017, 1, 77–107. [Google Scholar] [CrossRef]
  6. Sun, J.-K.; Xu, Q. Functional materials derived from open framework templates/precursors: Synthesis and applications. Energy Environ. Sci. 2014, 7, 2071–2100. [Google Scholar] [CrossRef]
  7. Cao, X.; Tan, C.; Sindoro, M.; Zhang, H. Hybrid micro-/nano-structures derived from metal-organic frameworks: Preparation and applications in energy storage and conversion. Chem. Soc. Rev. 2018, 47, 5997. [Google Scholar] [CrossRef]
  8. Ma, P.; Hu, F.; Wang, J.; Niu, J. Carboxylate covalently modified polyoxometalates: From synthesis, structural diversity to applications. Coord. Chem. Rev. 2019, 378, 281–309. [Google Scholar] [CrossRef]
  9. Liu, J.-X.; Zhang, X.-B.; Li, Y.-L.; Huang, S.-L.; Yang, G.-Y. Polyoxometalate functionalized architectures. Coord. Chem. Rev. 2020, 414, 213260. [Google Scholar] [CrossRef]
  10. Wang, D.; Liu, L.; Jiang, J.; Chen, L.; Zhao, J. Polyoxometalate-based composite materials in electrochemistry: State-of-the-art progress and future outlook. Nanoscale 2020, 12, 5705–5718. [Google Scholar] [CrossRef]
  11. Bijelic, A.; Aureliano, M.; Rompel, A. Polyoxometalates as Potential Next-Generation Metallodrugs in the Combat against Cancer. Angew. Chem. Int. Ed. 2019, 58, 2980–2999. [Google Scholar] [CrossRef]
  12. Zhong, J.; Perez-Ramirez, J.; Yan, N. Biomass valorisation over polyoxometalate-based catalysts. Green Chem. 2021, 23, 18–36. [Google Scholar] [CrossRef]
  13. Liu, W.; Mu, W.; Liu, M.; Zhang, X.; Cai, H.; Deng, Y. Solar-induced direct biomass-to-electricity hybrid fuel cell using polyoxometalates as photocatalyst and charge carrier. Nat. Commun. 2014, 5, 3208. [Google Scholar] [CrossRef] [PubMed]
  14. Xu, F.; Li, H.; Liu, Y.; Jing, Q. Advanced redox flow fuel cell using ferric chloride as main catalyst for complete conversion from carbohydrates to electricity. Sci. Rep. 2017, 7, 5142. [Google Scholar] [CrossRef] [PubMed]
  15. Li, Y.; Dong, F.; Jiao, S.; Wang, J.; Dai, Y.; Irfan, M.; Liu, X. Co2+-P(W3O10)43− modified activated carbon as an efficient anode catalyst for direct glucose alkaline fuel cell. Int. J. Hydrogen Energy 2022, 47, 22952–22962. [Google Scholar] [CrossRef]
  16. Xia, K.; Yamaguchi, K.; Suzuki, K. Recent Advances in Hybrid Materials of Metal Nanoparticles and Polyoxometalates. Angew. Chem. Int. Ed. 2023, 62, e202214506. [Google Scholar] [CrossRef]
  17. Samaniyan, M.; Mirzaei, M.; Khajavian, R.; Eshtiagh-Hosseini, H.; Streb, C. Heterogeneous Catalysis by Polyoxometalates in Metal-Organic Frameworks. ACS Catal. 2019, 9, 10174–10191. [Google Scholar] [CrossRef]
  18. Ho, W.H.; Chen, T.-Y.; Otake, K.-I.; Chen, Y.-C.; Wang, Y.-S.; Li, J.-H.; Chen, H.-Y.; Kung, C.-W. Polyoxometalate adsorbed in a metal-organic framework for electrocatalytic dopamine oxidation. Chem. Commun. 2020, 56, 11763–11766. [Google Scholar] [CrossRef]
  19. Sajid, A.; Pervaiz, E.; Ali, H.; Noor, T.; Baig, M.M. A perspective on development of fuel cell materials: Electrodes and electrolyte. Int. J. Energy Res. 2022, 46, 6953–6988. [Google Scholar] [CrossRef]
  20. Pei, P.; Chen, H. Main factors affecting the lifetime of Proton Exchange Membrane fuel cells in vehicle applications: A review. Appl. Energy 2014, 125, 60–75. [Google Scholar] [CrossRef]
  21. Duan, C.; Kee, R.J.; Zhu, H.; Karakaya, C.; Chen, Y.; Ricote, S.; Jarry, A.; Crumlin, E.J.; Hook, D.; Braun, R.; et al. Highly durable, coking and sulfur tolerant, fuel-flexible protonic ceramic fuel cells. Nature 2018, 557, 217–222. [Google Scholar] [CrossRef] [PubMed]
  22. Lim, K.H.; Lee, A.S.; Atanasov, V.; Kerres, J.; Park, E.J.; Adhikari, S.; Maurya, S.; Manriquez, L.D.; Jung, J.; Fujimoto, C.; et al. Protonated phosphonic acid electrodes for high power heavy-duty vehicle fuel cells. Nat. Energy 2022, 7, 248–259. [Google Scholar] [CrossRef]
  23. Mano, N.; de Poulpiquet, A. O2 Reduction in Enzymatic Biofuel Cells. Chem. Rev. 2018, 118, 2392–2468. [Google Scholar] [CrossRef] [PubMed]
  24. Antolini, E. External abiotic glucose fuel cells. Sustain. Energy Fuels 2021, 5, 5038–5060. [Google Scholar] [CrossRef]
  25. Kerzenmacher, S.; Ducree, J.; Zengerle, R.; von Stetten, F. Energy harvesting by implantable abiotically catalyzed glucose fuel cells. J. Power Sources 2008, 182, 1–17. [Google Scholar] [CrossRef]
  26. Liu, T. Glucose Fuel Cells and Membranes: A Brief Overview and Literature Analysis. Sustainability 2022, 14, 8376. [Google Scholar] [CrossRef]
  27. Zhao, C.-E.; Gai, P.; Song, R.; Chen, Y.; Zhang, J.; Zhu, J.-J. Nanostructured material-based biofuel cells: Recent advances and future prospects. Chem. Soc. Rev. 2017, 46, 1545–1564. [Google Scholar] [CrossRef]
  28. Maru, K.; Kalla, S.; Jangir, R. MOF/POM hybrids as catalysts for organic transformations. Dalton Trans. 2022, 51, 11952–11986. [Google Scholar] [CrossRef]
  29. Freire, C.; Fernandes, D.M.; Nunes, M.; Abdelkader, V.K. POM & MOF-based Electrocatalysts for Energy-related Reactions. ChemCatChem 2018, 10, 1703–1730. [Google Scholar]
  30. Yang, L.; Zeng, X.; Wang, W.; Cao, D. Recent Progress in MOF-Derived, Heteroatom-Doped Porous Carbons as Highly Efficient Electrocatalysts for Oxygen Reduction Reaction in Fuel Cells. Adv. Funct. Mater. 2018, 28, 1704537. [Google Scholar] [CrossRef]
  31. Wang, X.; Zhang, H.; Lin, H.; Gupta, S.; Wang, C.; Tao, Z.; Fu, H.; Wang, T.; Zheng, J.; Wu, G.; et al. Directly converting Fe-doped metal organic frameworks into highly active and stable Fe-N-C catalysts for oxygen reduction in acid. Nano Energy 2016, 25, 110–119. [Google Scholar] [CrossRef]
  32. Xia, W.; Zou, R.; An, L.; Xia, D.; Guo, S. A metal-organic framework route to in situ encapsulation of Co@Co3O4@C core@bishell nanoparticles into a highly ordered porous carbon matrix for oxygen reduction. Energy Environ. Sci. 2015, 8, 568–576. [Google Scholar] [CrossRef]
Figure 1. (a) LSV diagram of different T-POMs@ZIF-67-doped anodes; (b) LSV diagram of T-PMo@ZIF-67-doped anodes with different contents of phosphomolybdate.
Catalysts 13 01339 g001
Figure 2. (a) EIS diagram of different T-POMs@ZIF-67-doped anodes; (b) EIS diagram of CoMoO4-, T-ZIF-67-, and T-POMs@ZIF-67-doped anodes.
Catalysts 13 01339 g002
Figure 3. (a) Tafel curves of different T-POMs@ZIF-67-doped anodes; (b) Tafel curve fitting results for different T-POMs@ZIF-67-doped anodes.
Catalysts 13 01339 g003
Figure 4. (a) Power density and polarization curves of different T-POMs@ZIF-67-doped anodes; (b) cathode and anode polarization curves.
Catalysts 13 01339 g004
Figure 5. CV curves of different T-POMs@ZIF-67-doped anodes.
Catalysts 13 01339 g005
Figure 6. (a) SEM image of T-ZIF-67. (b) SEM image of T-PMo@ZIF-67. (c) Element diagram for T-PMo@ZIF-67.
Catalysts 13 01339 g006
Figure 7. (a) XRD pattern of ZIF-67 and PMo@ZIF-67; (b) XRD pattern of T-PMo@ZIF-67.
Catalysts 13 01339 g007
Figure 8. (a) Full spectrum of XPS for T-PMo@ZIF-67; (b) C1s spectra; (c) O1s spectra; (d) Mo3d spectra; (e) Co2p spectra.
Catalysts 13 01339 g008
Figure 9. Mechanism diagram of T-PMo@ZIF-67-catalyzed glucose oxidation.
Catalysts 13 01339 g009
Table 1. Impedance values of different T-POMs@ZIF-67-doped anodes.
BlankCoMoO4T-ZIF-67T-PMo@ZIF-67T-PW@ZIF-67T-SiW@ZIF-67
Rs (Ω)1.5180.83691.0540.78691.2551.289
Rct (Ω)1.1510.39440.43680.30631.2770.8368
Rd (Ω)1.9570.35290.42840.32120.67630.7524
Rt (Ω)4.6261.58421.91921.41443.20832.8782
Table 2. Tafel curve fitting results.
Fitting EquationR2Tafel10−4 I0
ACy = 5.37143 × −3.416730.9983186.17023.831
T-ZIF-67y = 5.31818 × −2.840430.99776188.034314.44
T-PMo@ZIF-67y = 4.87273 × −2.667010.99636205.223821.527
CoMoO4y = 4.96623 × −2.704180.99684201.3619.762
T-SiW@ZIF-67y = 5.61818 × −3.166150.99829177.99366.821
T-PW@ZIF-67y = 5.76753 × −3.334930.99828173.38444.625
Disclaimer/Publisher’s Note: The statements, opinions and data contained in all publications are solely those of the individual author(s) and contributor(s) and not of MDPI and/or the editor(s). MDPI and/or the editor(s) disclaim responsibility for any injury to people or property resulting from any ideas, methods, instructions or products referred to in the content.

