Article

Controlling Magnesium Silicates Coprecipitation Conditions: A Tool to Tune Their Surface Acid–Base Reactivity

1
Laboratoire de Réactivité de Surface (LRS), Sorbonne Université, CNRS, F-75005 Paris, France
2
Laboratoire de Chimie de la Matière Condensée de Paris (LCMCP), Collège de France, Sorbonne Université, CNRS, F-75005 Paris, France
3
Unité de Chimie et Procédés (UCP), Ecole Nationale Supérieure de Techniques Avancées (ENSTA), Institut Polytechnique de Paris, 828 Boulevard des Maréchaux, F-91120 Palaiseau, France
4
MINES ParisTech, PSL Université Centre des Matériaux (CMAT), CNRS UMR 7633, BP 87, F-91003 Evry, France
*
Authors to whom correspondence should be addressed.
Catalysts 2023, 13(11), 1393; https://doi.org/10.3390/catal13111393
Submission received: 6 October 2023 / Revised: 20 October 2023 / Accepted: 21 October 2023 / Published: 25 October 2023
(This article belongs to the Section Catalytic Materials)

Abstract

:
Magnesium silicates combining acidic and basic surface properties are known to be interesting as heterogeneous catalysts. Nevertheless, their catalytic performances are highly dependent on the synthesis method used. In this study, a series of magnesium silicates was synthesized for the first time using a coprecipitation method with a micromixer. It is first shown that changes in synthesis/precipitation pH led to magnesium silicates with different Mg/Si ratios: the higher the synthesis pH, the higher the Mg/Si ratio. Moreover, prepared silicates with a final Mg/Si ratio greater than 0.7, thus prepared at high pH, exhibit negligible specific surface area, whereas relatively high values (>180 m2/g) have been obtained for lower Mg/Si ratios. A set of experimental characterization data obtained by N2 physisorption, SEM, XRD, TGA-DTA as well as Raman and 29Si NMR spectroscopies are presented and discussed. They show the existence of two distinct families with a similar Magnesium Silicate Hydrate (MSH) phase, but they reveal different aggregation states and textural properties. Finally, the surface acid–base reactivity of the co-precipitated magnesium silicates was determined using the model reaction of 2-methylbut-3-yn-2-ol (MBOH) conversion. The results obtained suggest that it is possible to prepare silicates with a wide range of surface acid–base properties, from purely basic solids to those with both acidic and basic properties, by adjusting the final Mg/Si ratio via the control of the synthesis parameters.

Graphical Abstract

1. Introduction

In addition to geological materials, the term “magnesium silicate” also covers synthetic materials, amorphous or with low crystallinity, obtained by mixing magnesium and silicon precursors in aqueous or hydro-alcoholic media [1,2]. A variety of synthesis processes can be used to obtain these magnesium silicates (Mg silicates), including sol–gel [3,4] and coprecipitation [5,6] methods, incipient wetness impregnation [7], or mechanochemical synthesis techniques [8].
These amorphous materials find application in the field of Mg-based cements for the encapsulation and storage of radioactive waste [9,10] as they have been identified as promising alternatives to conventional calcium oxide (Portland) cement [11,12]. Usually obtained by hydration of MgO in the presence of a silica source, they are claimed to be mainly composed of a Magnesium Silicate Hydrate (MSH) phase [13,14]. The synthesis route involves long ageing times ranging from a few days [15,16] to a few months [13] or even a few years [17]. The exact structure of MSH is still debated in the literature [13,18], but recent FT-IR and 29Si MAS NMR studies have highlighted a relative similarity with a poorly ordered lamellar structure of Mg phyllosilicate [19]. Based on the Mg/Si ratio, the structure of MSH was therefore compared both to phyllosilicates with a TOT structure such as sepiolite [20] (Mg/Si = 0.66) or talc [21] (Mg/Si = 0.75) and to phyllosilicates with a TO structure such as minerals in the serpentine group, including antigorite [17], chrysotile or lizardite [22] (Mg/Si = 1.5).
In the field of catalysis, the work performed by Weckhuysen and coll. Refs. [23,24,25] on the ethanol-to-butadiene process catalyzed by SiO2-MgO materials highlighted the influence of the acid–base properties of layered hydrous Mg silicate formation [25] on the catalytic performances. The exact nature of this Mg silicate phase and its role in this reaction are still under debate, as underlined in a recent review [26].
Nevertheless, the catalytic role of MSH phase has been evidenced by Lauron-Pernot and coll. Refs. [27,28,29] in a model transesterification reaction (methanolysis of ethyl acetate). It was indeed shown, by comparing different synthesis routes, that the coprecipitation method in an aqueous medium at ambient temperature produced the MSH phase leading to the highest catalytic activity [29]. In addition, during these studies, the surface acid–-base properties of Mg silicates were evaluated by their reactivity in the model gas-phase reaction of 2-methylbut-3-yn-2-ol (MBOH) conversion. The results revealed that the Mg silicates exhibit both an acidic and basic character. Moreover, the ratio of products from the acidic and basic routes differs upon the silicate preparation route.
The aim of the present study was to identify whether it is possible to tune the surface acid–base reactivity of Mg silicates by controlling the coprecipitation conditions by means of a micromixer. Indeed, the choice of such a coprecipitation process [30,31,32] will enable the MSH phase to be prepared rapidly under gentle and reproducible conditions.
To this purpose, Mg silicates are synthesized by coprecipitation, using a micromixer, and the influence of different synthesis parameters on the chemical and structural properties of the material obtained is investigated. The first synthesis parameter studied is the relative proportion of magnesium and silicon precursors in solution initially injected into the micromixer. The second parameter is the synthesis pH, which is modified by adding acid and/or base to the initial solutions of the two precursors in order to study its specific influence on the final composition and structural characteristics of the silicate obtained. In addition, on the basis of the magnesium and silicon content of the solutions after precipitation, the solubility constants of the materials are determined by a thermodynamic approach.
The influence of these different synthesis parameters on the structural and textural properties of the material is then highlighted using a multitechnique characterization approach (nitrogen physisorption, SEM, thermogravimetric analysis, X-ray diffraction, Raman and 29Si NMR spectroscopies).
Finally, the surface acid–base properties of the prepared Mg silicates are determined by means of MBOH conversion. This model reaction gives access to the acid–base reactivity of the surface and is thus well representative of its kinetic behavior [33]. Moreover, concerning base sites characterization, this reaction is initiated by a deprotonation step like in the majority of base-catalyzed reactions. It has thus been recognized in the literature for over 30 years now [33] as a very relevant tool complementary to the use of Lewis acid probe molecules like CO2 [34].

2. Results and Discussion

2.1. Synthesis of Magnesium Silicates

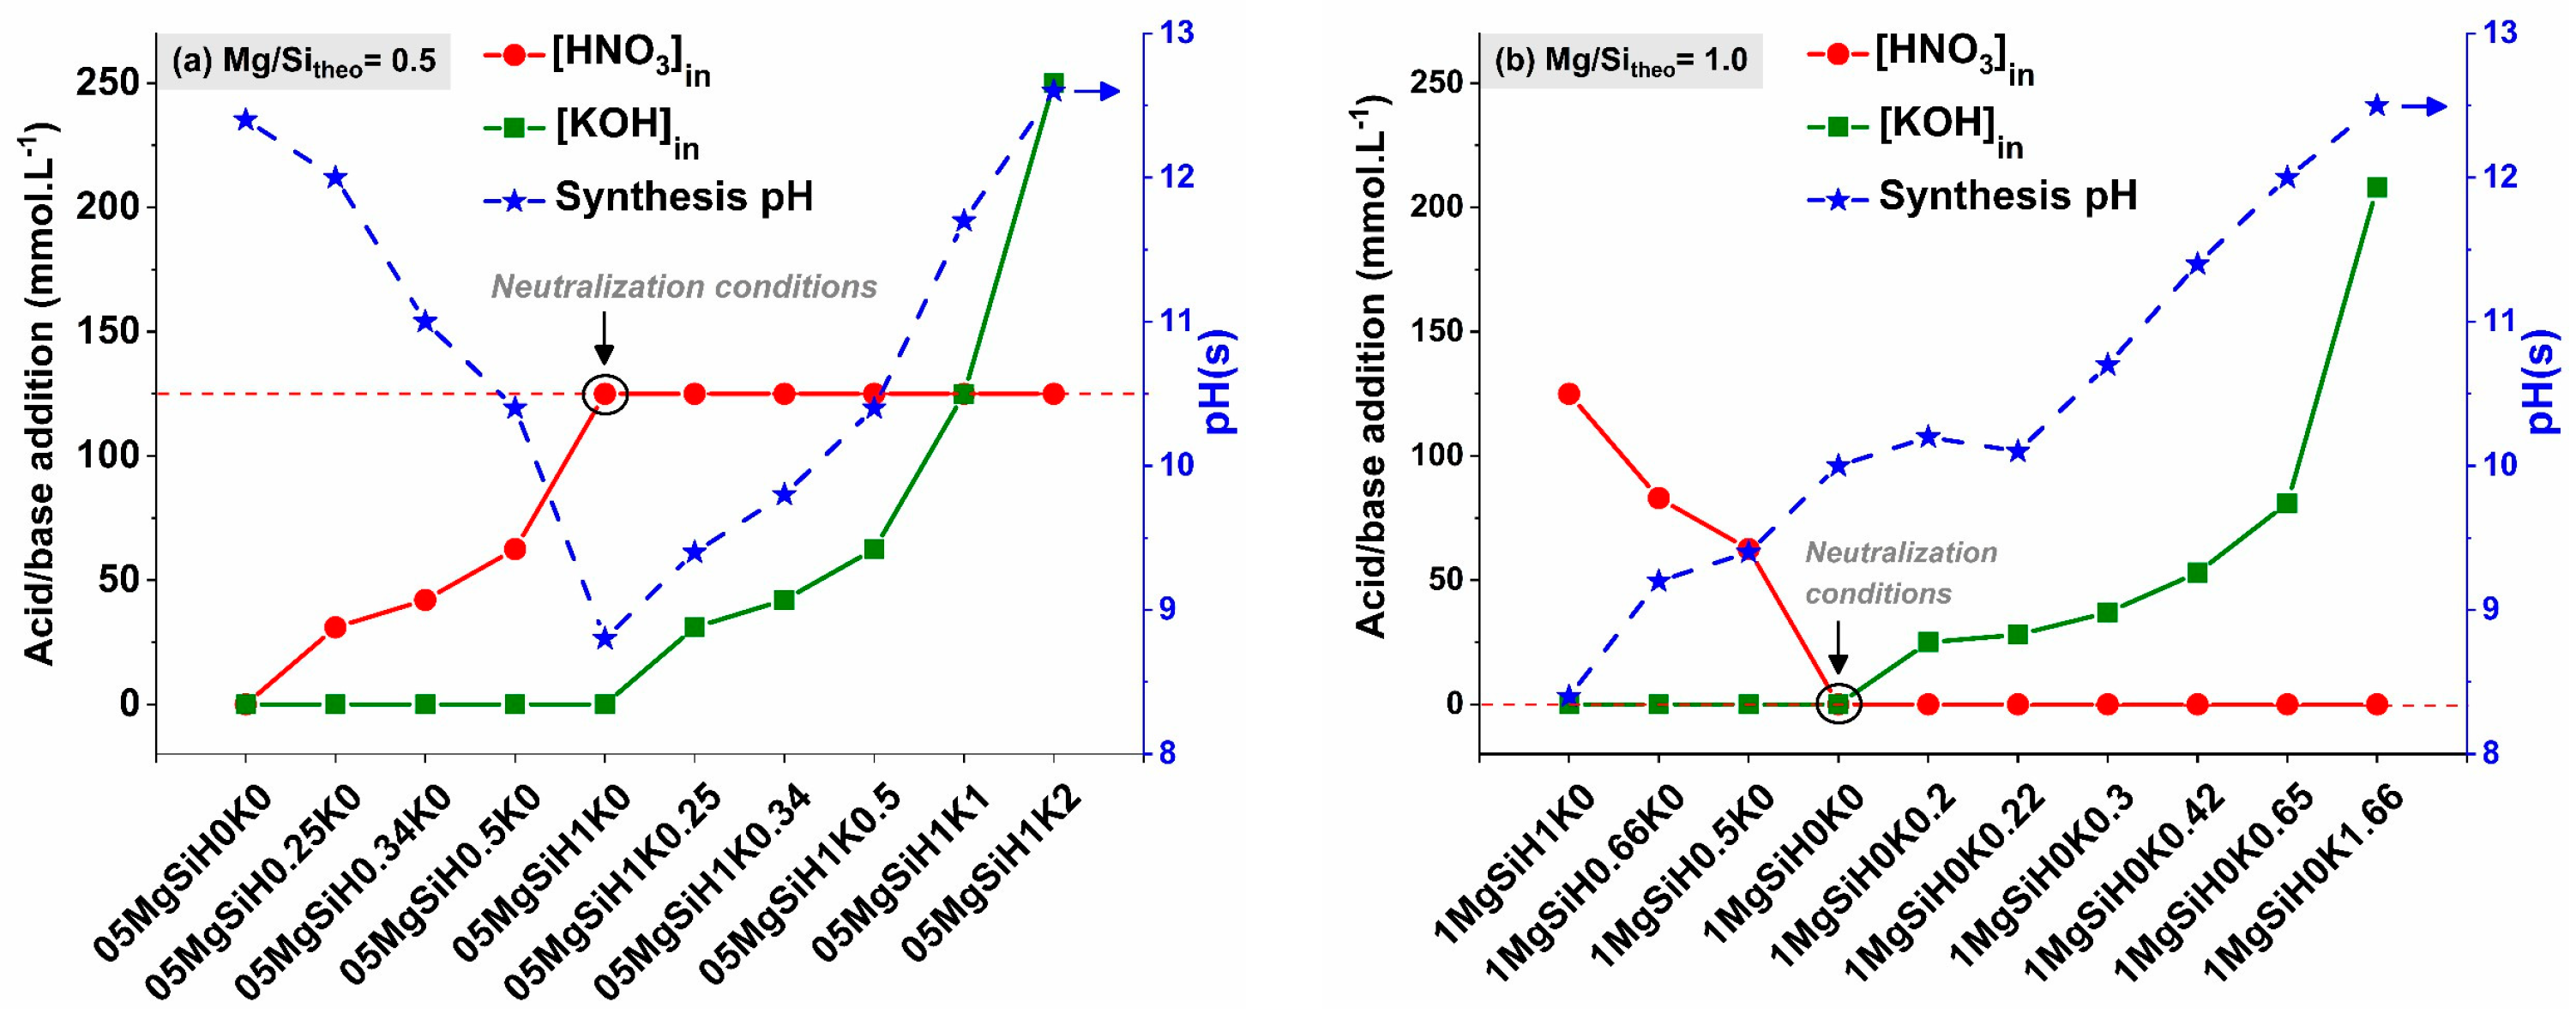
2.1.1. Synthesis pH Evolution

As described in the “Materials and Methods” Section 3.2 related to the synthesis of Mg silicates, for each experimental condition given in Table S1, the precipitation protocol was repeated at least six times to collect enough sample for catalytic tests. It was checked that the pH obtained after a given precipitation run does not evolve before the regrouping of the six suspensions. In addition, synthesis repeatability tests were carried out and consisted in preparing three different samples from independently prepared precursor solutions. In these tests, it was shown that the maximum pH difference was less than 0.4.
The synthesis pH (pH(s)), given for each material in Table S1 and Figure 1, evolves as a function of [KOH]in and [HNO3]in added, respectively, to the silicate and magnesium stock solutions. Figure 1a concerns the samples with a (Mg/Si)theo ratio of 0.5, while Figure 1b focuses on the samples with a ratio of 1.
For synthesis carried out with a (Mg/Si)theo = 0.5 (Figure 1a), the neutralization conditions, defined in the “Materials and Methods” Section 3.2.3, impose the addition of HNO3 to precipitate the silicate species in excess. According to Figure 1a, the pH(s) can thus be increased, either by decreasing this quantity of acid compared to the neutralization conditions (i.e., [HNO3]in = 125 mmol·L−1 for sample 05MgSiH1K0), or by adding variable quantities of KOH while keeping [HNO3]in constant at 125 mmol·L−1. It can be observed that, in the case of simultaneous addition of acid and base, the fast acid–base reaction HNO3 + KOH leads as expected to the same pH(s) as the one obtained by the direct addition of [HNO3] = [HNO3]in − [KOH]in or [KOH] = [KOH]in − [HNO3]in. For example, for the sample 05MgSiH1K0.5, the simultaneous addition of acid and base leads to a pH of 10.4, the same as for 05MgSiH0.5K0 for which only acid is added.
For the samples with (Mg/Si)theo of 1.0 (Figure 1b), the neutralization conditions were obtained without any addition of HNO3 or KOH (1MgSiH0K0), and the measured synthesis pH is 10.0. Thus, the evolution of the synthesis pH was studied only by adding either HNO3 to the magnesium stock solution or KOH to the silicate stock solution.
It appears from Figure 1 that, for a given (Mg/Si)theo, the pH(s) can be tuned in an approximate range from 8.5 to 12.5 by controlled addition of HNO3 or KOH to the precursors stock solutions.

2.1.2. Chemical Composition of the Precipitated Solid

The Mg/Si ratios of the precipitated solids are determined by X-ray fluorescence (XRF) analysis and the obtained values are given in Table S1.
Figure 2 shows the Mg/Si ratios evolution as a function of synthesis pH. For the theoretical Mg/Si ratio of 0.5 (Figure 2a), it is observed that sweeping the pH(s) from 8.8 to 12.6 leads to an increase of the experimental Mg/Si ratios from 0.34 to 1.00. It should also be noted that the theoretical ratio is reached for a pH between 9.4 and 9.8. Finally, the two samples obtained at pH(s) = 10.4 (05MgSiH0.5K0 and 05MgSiH1K0.5) have nearly identical Mg/Si ratios of 0.56 and 0.58, respectively. These two samples were prepared under different experimental conditions in terms of acid and base addition, showing that the way the pH(s) is controlled has limited influence on the final Mg/Si ratio, since acid–base reactions are much faster than precipitation.
The evolution of the Mg/Si ratio as a function of pH(s) for theoretical Mg/Si ratios of 1 is presented in Figure 2b. As previously observed for (Mg/Si)theo = 0.5, tuning the pH(s) values allows a wide range of experimental Mg/Si ratios. Indeed, by increasing pH(s) from 8.4 to 12.5, solids with Mg/Si ratios ranging from 0.38 to slightly above 1.06 are obtained. Moreover, from pH(s) = 10.2, the theoretical Mg/Si ratio is reached, and the Mg/Si values obtained remain very close to 1 until pH(s) = 12.6.
It should be noted that the Mg/Si ratios of the prepared silicates are also calculated from a quantitative analysis of the concentration of magnesium and silicon in the solutions recovered at different steps of the synthesis. The magnesium concentration is determined by EDTA titration and the silicon concentration by the Alexander method [35] (see Section 3.2.5). These calculated Mg/Si ratios, noted Mg/Si(exp), are compared with those obtained by XRF analysis in the case of samples of theoretical ratio 0.5 and 1 (Figure S1). The results obtained indicate a good agreement, which tends to validate the different titrations and calculations performed.

2.2. Thermodynamic Approach of the Precipitation

In an attempt to see if the precipitation process of magnesium silicates can be described by a thermodynamic approach, the concentrations of magnesium and silicon in solution at equilibrium with the solid were considered. They were determined by titration methods as mentioned above.
For silicon, we considered the soluble species H4SiO4, H3SiO4 and H2SiO42−. Although simplified by not considering polymeric silicate species, this description is realistic in our conditions according to other publications [31]. For magnesium, the species in solution considered here are Mg2+ and MgOH+. Thus, in this simple model we only consider monomeric species for both magnesium and silicon, which excludes, in addition to the polynuclear species of silicates, possible mixed polynuclear species, for which there are no data to our knowledge. The activity coefficients were calculated according to the empirical Davies law. As far as the solid is concerned, the well-crystallized phases of the talc, sepiolite or chrysotile type do not form under our conditions for kinetic reasons. In addition, the measured concentrations of species in solution after precipitation are much lower than those expected in the case of coprecipitation of brucite and silica, not to mention that brucite was never observed in XRD. Thus, we introduce into the model a single solid phase (MgxSiO2+x)s whose composition comes from experimental titrations.
H4SiO4 = H3SiO4 + H+       logKH4-3 = −9.91
H4SiO4 = H2SiO4 + 2H+       logKH4-2 = −23.22
Mg2+ + H2O = MgOH+ + H+      logKMgOH+ = −11.44
(MgxSiO2+x)s + 2xH+ + (2 − x)H2O = xMg2+ + H4SiO4      logK(x)
Considering that each precipitate is a single-phase solid whose composition is given by x (Mg/Si ratio of the post-precipitated solid), assuming that at the end of the precipitation the system is at solubility equilibrium and knowing the pH and the concentrations of the species in solution, it is then possible to determine the solubility constant of the various precipitates. This approach neglects the silicates amounts that are evacuated upon washing, especially those obtained at high pH.
In a first step, we consider that activity coefficients of soluble species are equal to 1. Considering isovolumic mixing of the 2 solutions with initial total concentrations [Si]in and [Mg]in = r[Si]in, we can write the equation (Equation (1)):
M g + x S i i n 2 S i = r S i i n 2
This equation is used to express [Mg] (total Mg species concentration in the supernatant) as a function of [Si] (total Si species concentration in the supernatant) or, respectively, [Si] as a function of [Mg], depending on the more reliable measured value. Then, thanks to the relations (with h = [H3O+]):
S i = H 4 S i O 4 × 1 + K H 4 3 h + K H 4 2 h 2
M g = M g 2 + × 1 + K M g O H + h
one may compute K(x).
Interestingly, the values obtained for the two series (r = 0.5 and r = 1) are consistent (Table S2). We find a linear relation logK(x) = 20.1x − 4.47 for r = 0.5 family (8 points) (Figure S2a) and logK(x) = 23.2x − 6.79 for y = 1 family but with only 4 points (Figure S2b). If we mix both families, we obtain logK(x) = 21.0x − 5.10 (Figure S2c). Theoretically, one does not rigorously expect a linear relation as a function of x for ideal solid solutions because of the mixing term. Writing the precipitate as an ideal solid solution (MgSiO3)x(SiO2)1−x, we obtain:
logK(x) = x(logK(1) − logK(0)) + logK(0) + xlogx + (1 − x)log(1 − x)
We checked that xlogx + (1 − x)log(1 − x) << logK(x) in our conditions and considering the experimental errors on the determination of x. Thus, the precipitation of this solid solution must be fitted by a linear relationship: logK(x) ≈ x(logK(1) − logK(0)) + logK(0).
Since the ionic strength is quite high (I = 0.25), it is relevant to introduce a correction due to activity coefficients. To relate activities and concentrations, we used the empirical equation of Davies for an ion with charge z (Equation (4)):
l o g γ z = 0.509 z 2 I 1 + I 0.3 I
This correction shifts the calculated constants to slightly lower values. The corrected values (logK’s) are given in Table S2 and it is found that logK’s(x) = 20.4x − 5.02 (Figure S2c). As a conclusion, this linear relationship is consistent with the precipitation of a homogenous solid solution, with composition (x) continuously tuned from 0.3 to 1 in our conditions.

2.3. Characterization Results

2.3.1. Nitrogen Sorption Isotherms

All the synthesized Mg silicates were characterized by nitrogen physisorption measurements. Firstly, it is noteworthy that prepared materials with Mg/Si ratio ≤ 0.65 display nitrogen physisorption isotherms. For the prepared samples with higher ratios (Mg/Si ≥ 0.74), the volume of nitrogen adsorbed on the surface is not sufficient to obtain a reliable measurement (Table S1). From the isotherms recovered for samples of Mg/Si ≤ 0.65, it is possible to obtain the values of specific surface area (SBET), pore volume (Vp) and pore size diameter (Dp) obtained by the BJH method (Table 1). For the sake of clarity, in the following of the manuscript, two families of samples have been defined: Mg/Si < 0.7 for prepared silicates with Mg/Si ratio ≤ 0.65 and Mg/Si > 0.7 for the others.
These results show specific surface areas between 187 and 358 m2·g−1. The pore volumes range from 0.40 to 0.88 cm3·g−1, with average pore diameters varying from around 6 to 14 nm. It should also be underlined that it is possible to obtain Mg silicates with almost identical Mg/Si ratios and prepared at similar pH(s) but exhibiting very different specific surfaces. Thus, for example, the specific surface of sample 05MgSiH1K0 (Mg/Si = 0.34; pH(s) = 8.8) is 187 m2·g−1, whereas the SBET reaches 358 m2·g−1 for sample 1MgSiH1K0 (Mg/Si = 0.38; pH(s) = 8.4).
Then, the study of nitrogen physisorption isotherms allows to bring additional information regarding the type of pore encountered in our silicates. For the sake of clarity in the presentation of the results, only the isotherms of representative samples are given in Figure S3. Materials with Mg/Si ratio = 0.34 and 0.38 exhibit a type II isotherm supplemented by an H3-type hysteresis loop in the relative pressure (P/P0) between 0.8 and 1.0, which is generally observed with aggregates of plate-like particles resulting in nonhomogeneous slit-shaped pores [36]. It is noteworthy that this kind of pores network is also encountered in the case of amorphous silica [37].
An increasing Mg/Si ratio leads to the transition to type IV isotherms accompanied by an H2-type hysteresis loop characteristic of a narrow distribution of pore bodies combined by a wide distribution of neck sizes. These observations are consistent with the presence of mesopores and the data reported by Bernard et al. [19] in a study of the structure of Mg silicate, with a Mg/Si ratio between 0.7 and 1.4, prepared by solid-state reaction.
In conclusion, the synthesized Mg silicates can be separated into two families: those which have a measurable specific surface area (Mg/Si < 0.7) and those whose SBET is not measurable (Mg/Si > 0.7). Furthermore, among the materials with a specific surface area, those with a Mg/Si ratio < 0.4 are constituted by aggregates of nonporous particles (type II isotherm), while those with a higher ratio are composed of particles with mesopores (type IV isotherm). Finally, our coprecipitation method can provide silicates with a similar Mg/Si ratio but with very different SBET values.

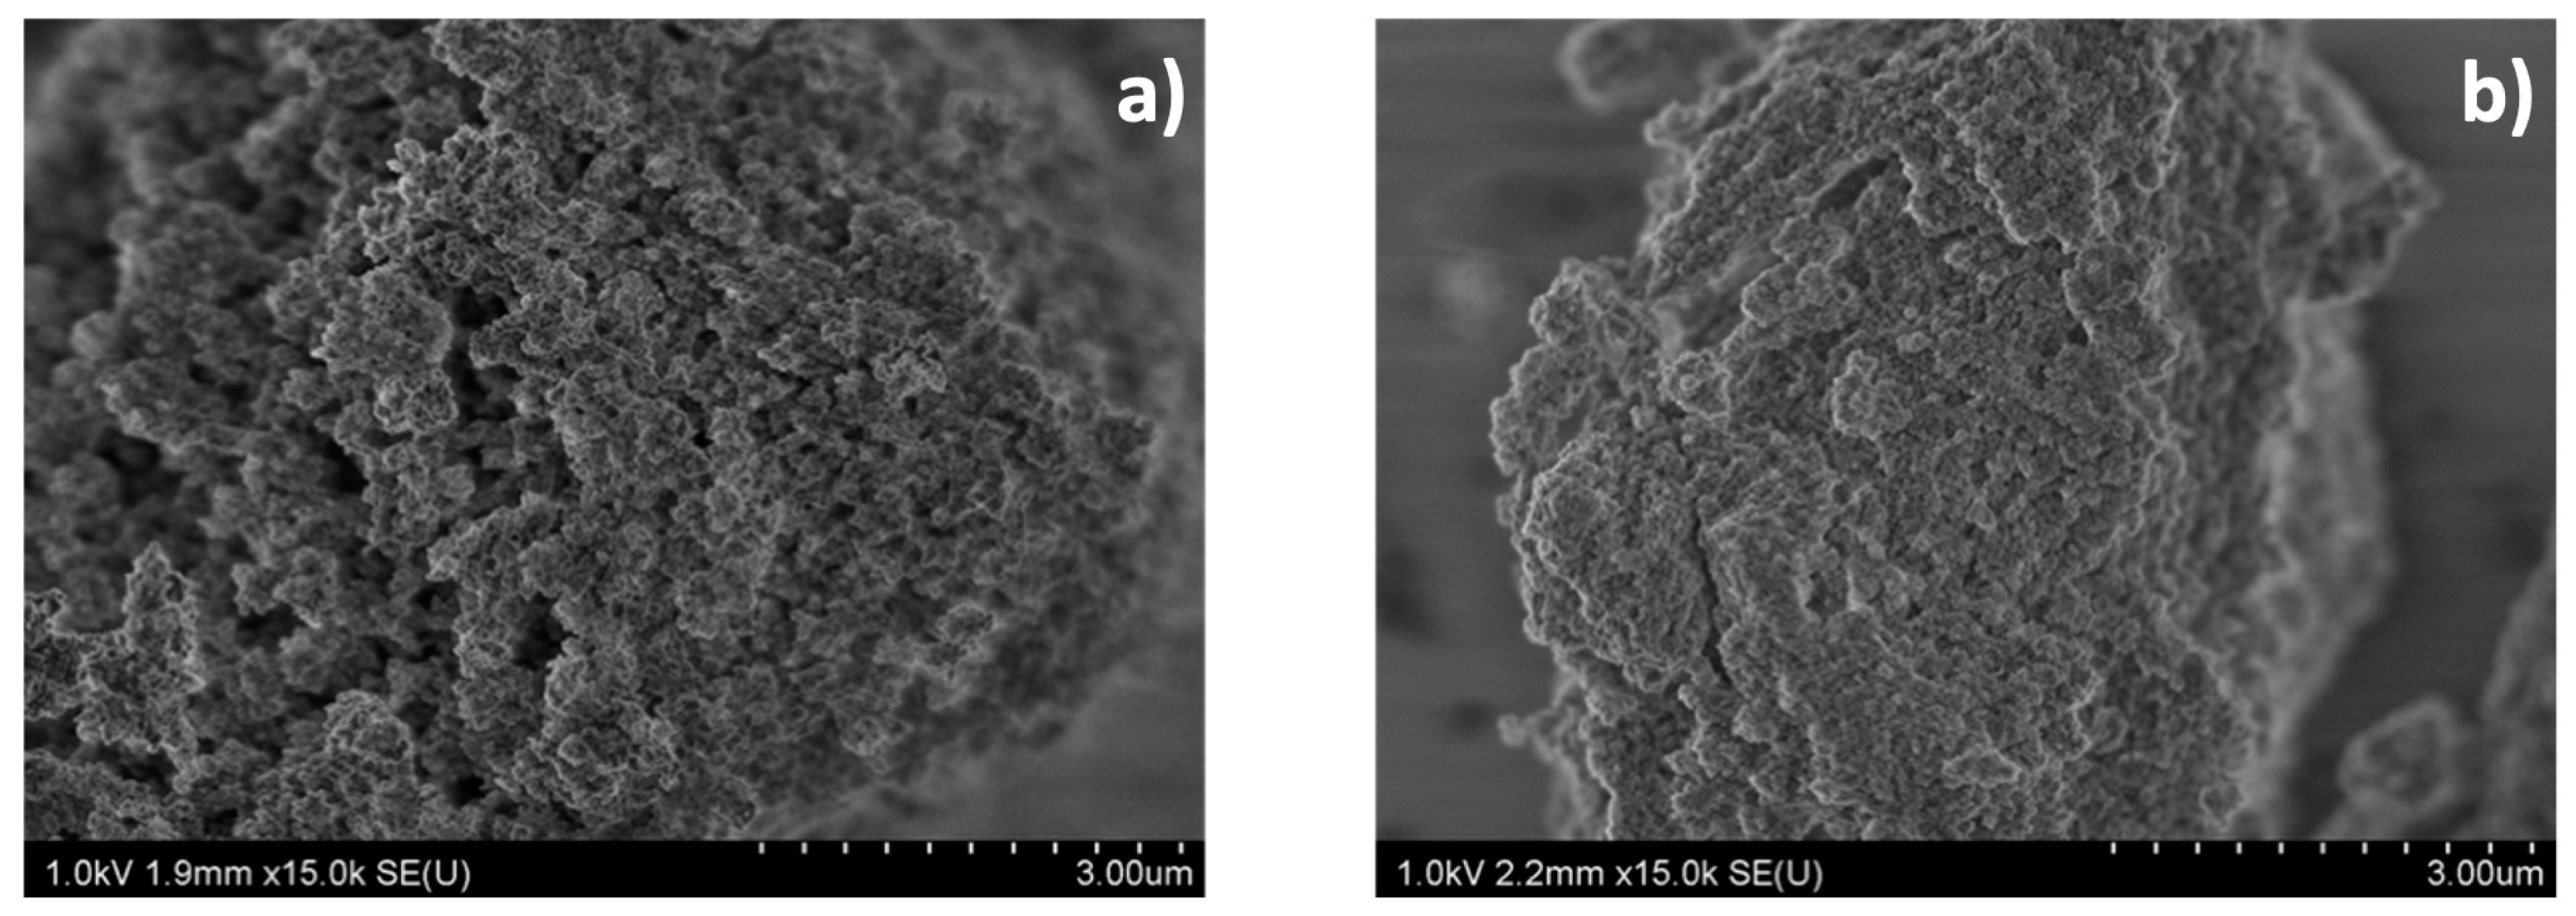
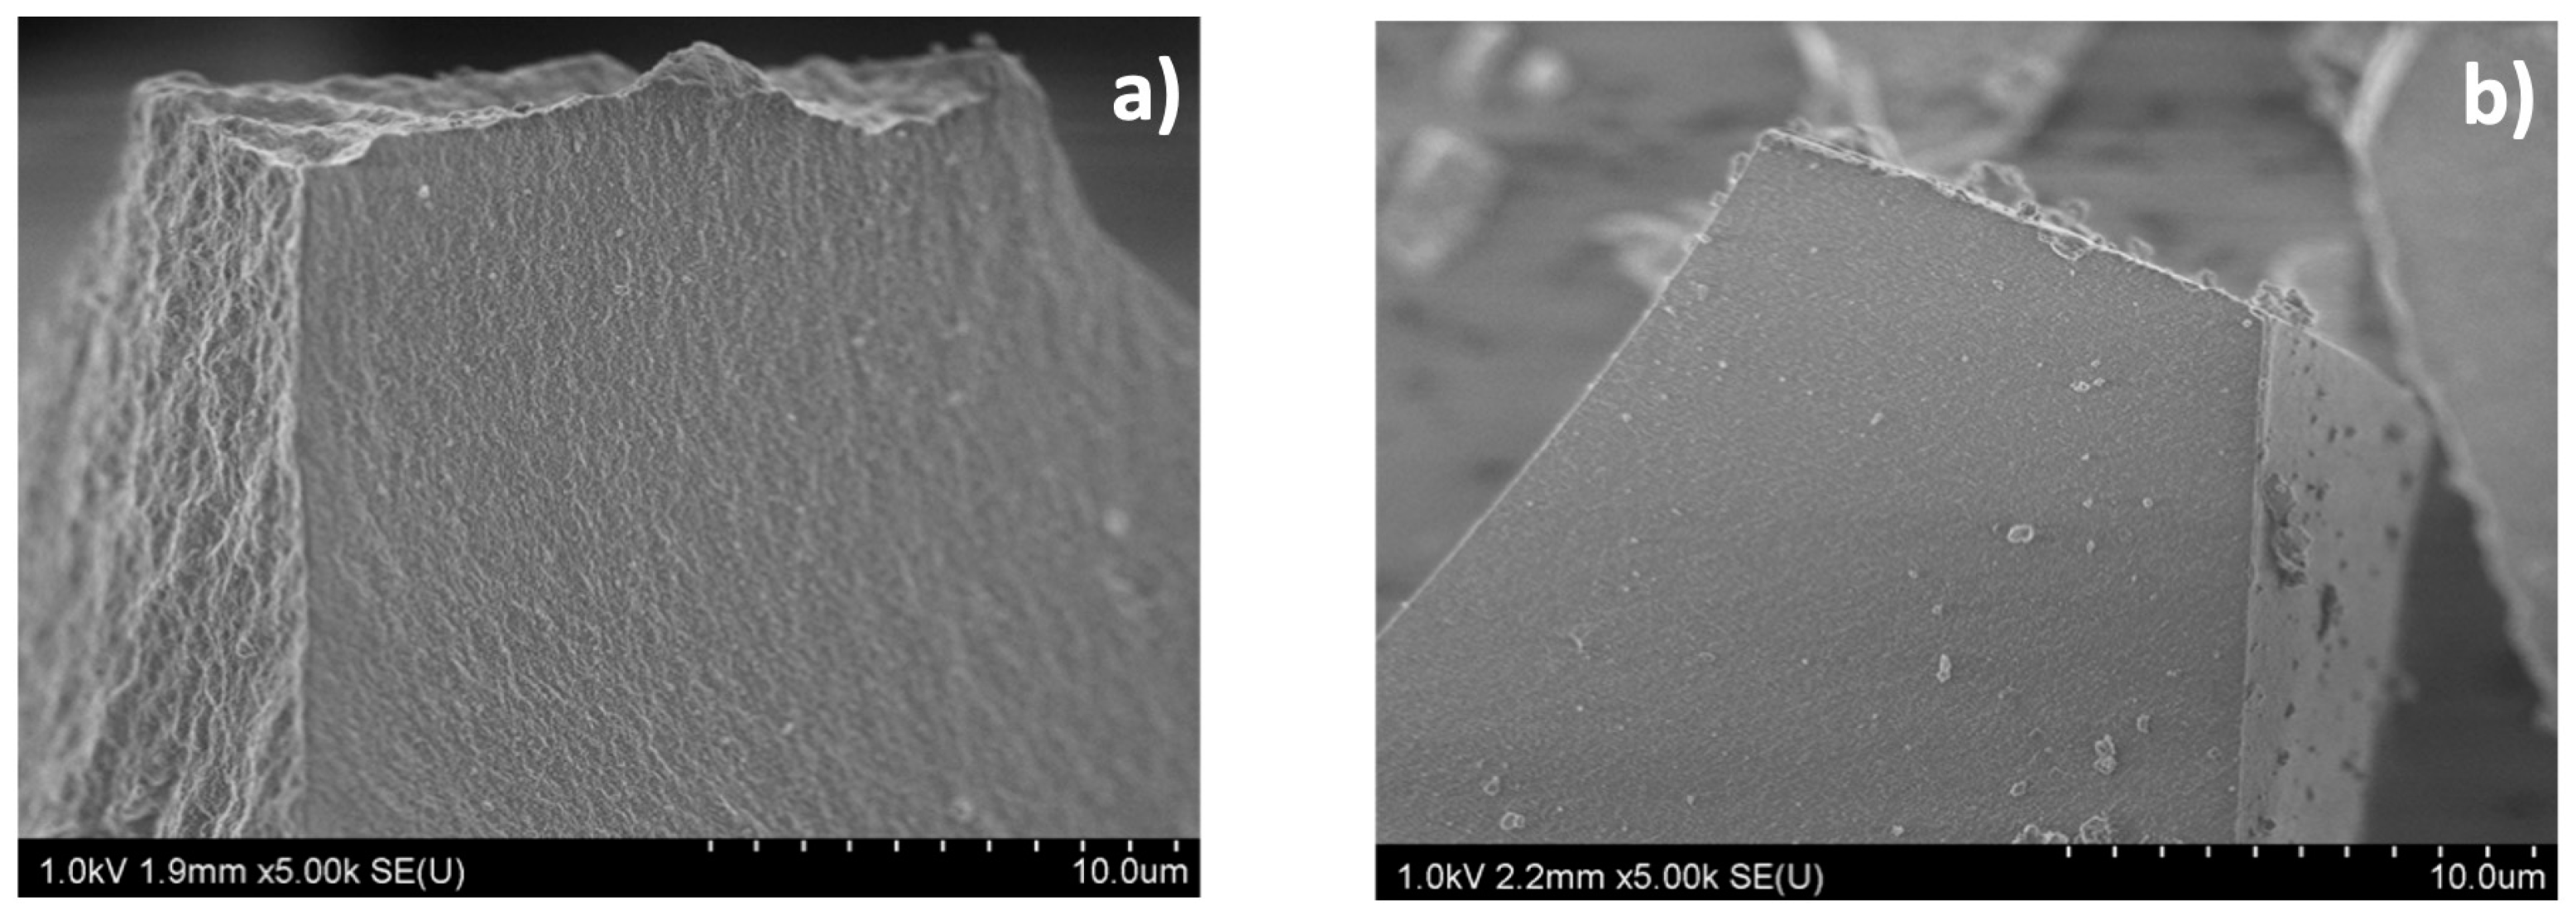
2.3.2. Scanning Electron Microscopy (SEM)

To try to better characterize the two families of materials, with or without measurable SBET, highlighted by N2-physisorption, SEM has been performed in order to reveal the morphology and the texture of the samples.
SEM images obtained for two samples (05MgSiH1K0 and 1MgSiH0.66K0) representing the family of solids possessing specific surface area (so with Mg/Si < 0.7) are shown in Figure 3. At the same time, two other samples (05MgSiH0.25K0 and 1MgSiH0K0.2) belonging to the family of materials whose specific surface areas cannot be determined by N2-physisorption measurements are presented in Figure 4.
These SEM images seem to broadly confirm the conclusions reached during the N2-physisorption study. Indeed, on one hand the two samples with Mg/Si < 0.7 are constituted of small particles that are gathered in the form of clusters giving a rather sponge-like texture (Figure 3). This particular morphology can be correlated with the observation of a type II isotherms nitrogen physisorption measurements. Furthermore, the SEM images of the samples of Mg/Si < 0.7 exhibit a relatively more organized porosity for the sample of Mg/Si = 0.55. The presence of mesopores revealed by the study of N2-physisorption type IV isotherms could explain this relative gain of organization in the porosity of the sample.
On the other hand, the SEM images of the other two samples with Mg/Si > 0.7 highlight a relatively monolithic structure (Figure 4). This absence of porosity, even observed at the highest magnification, is in agreement with the non-measurable specific surface area.

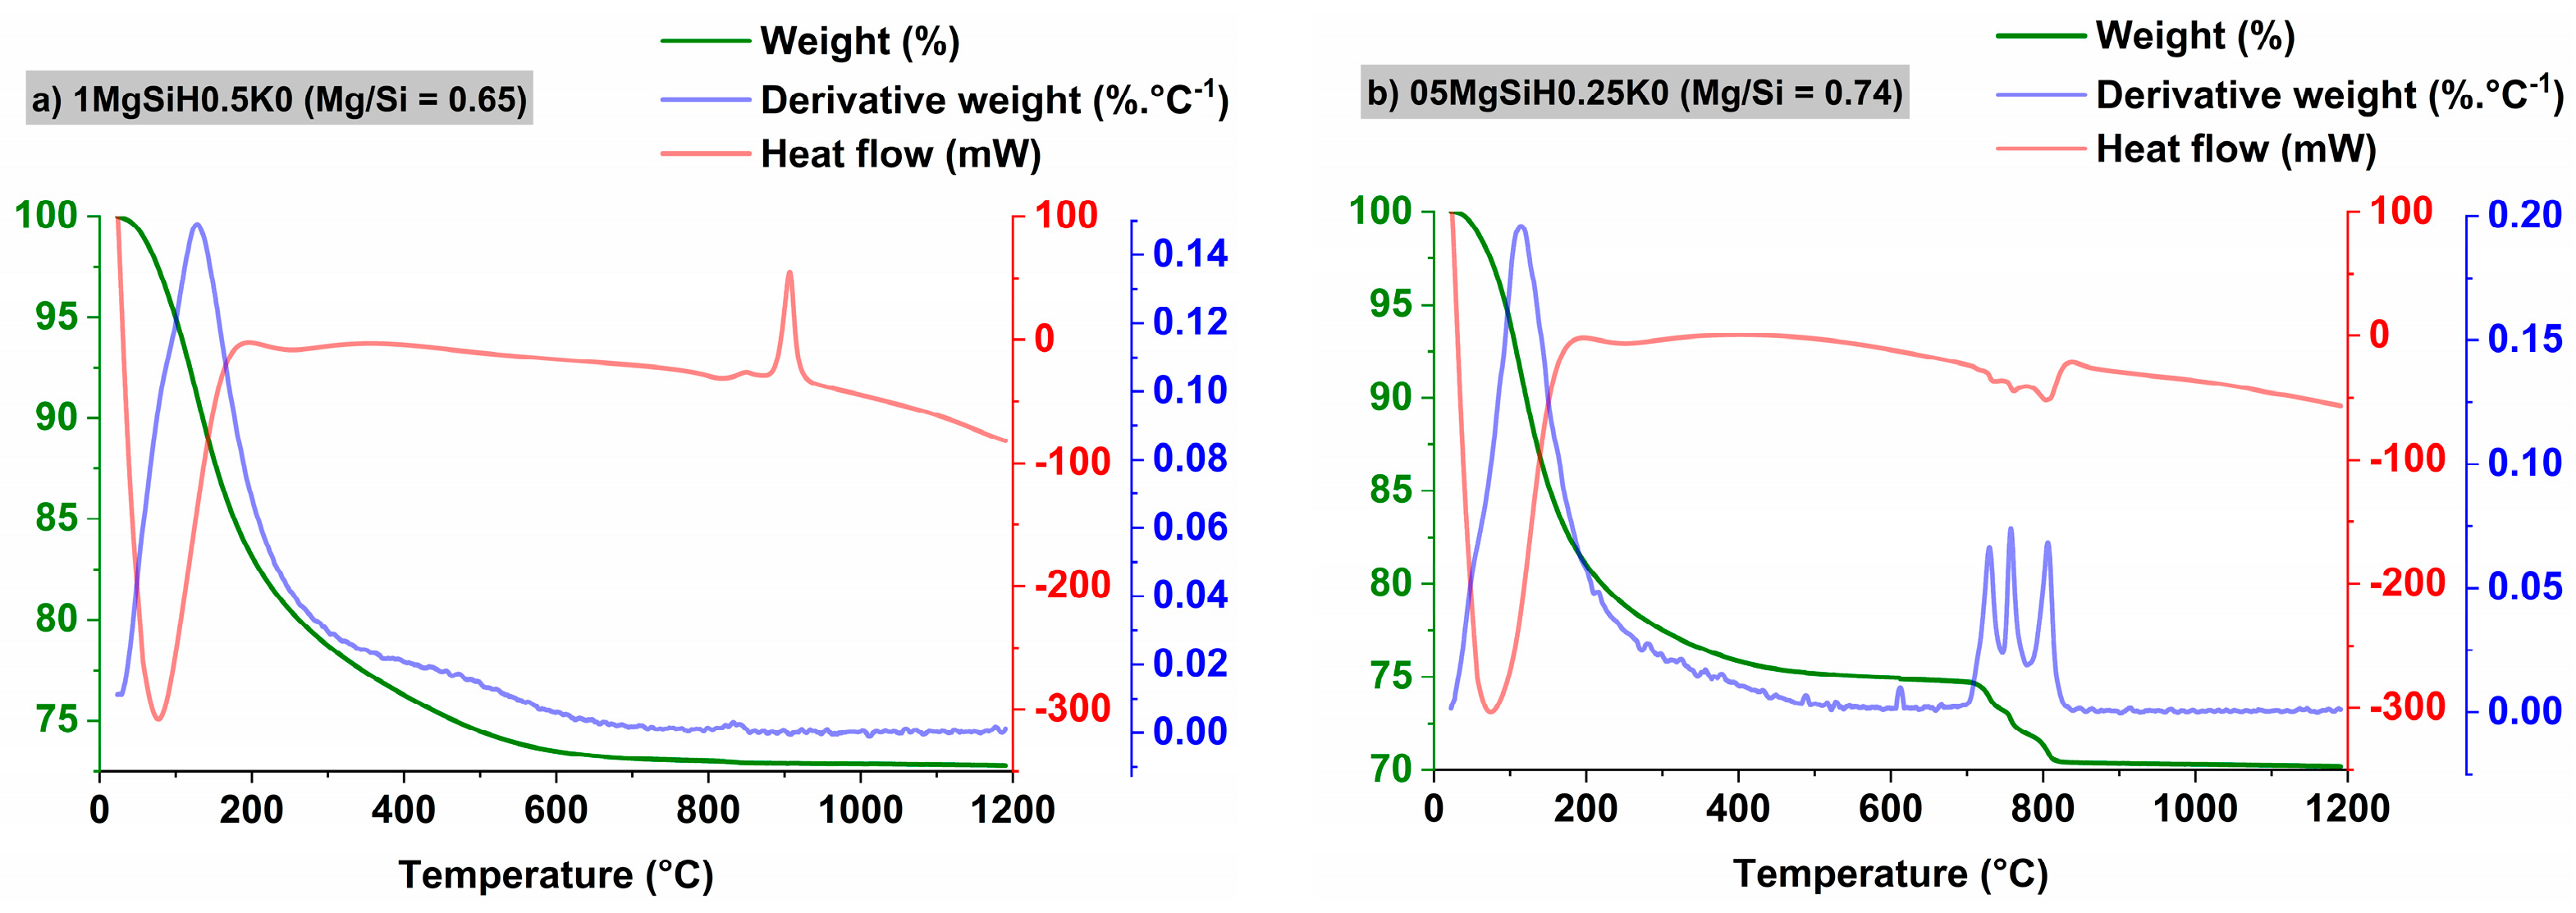
2.3.3. Thermogravimetric Analysis (TGA–DTA)

To confirm the existence and precise characteristics of the two families of Mg silicates previously highlighted by the measurements of N2 isotherms and by microscopy, a thermogravimetric analysis of the samples was conducted. First of all, it must be underlined that all the samples have been analyzed with this technique and that two main profiles are obtained, each one being characteristic of one family. For the sake of clarity, only the TGA–DTA results obtained for two Mg silicates representative of the two families of samples, with high or negligible specific surface area, will be discussed in this paragraph. Thus, Figure 5 shows the mass loss and the mass loss derivative curves as well as DTA (Differential Thermal Analysis) curves for samples 1MgSiH0.5K0 (Mg/Si = 0.65, SBET = 238 m2·g−1) and 05MgSiH0.25K0 (Mg/Si = 0.74, SBET ≈ 0). According to Figure 5, for both samples the general profile of the mass loss curves is similar until reaching quite high temperatures of about 700 °C. Above 700 °C, the behavior of the samples is very different. For the sample 1MgSiH0.5K0 (Mg/Si = 0.65), as well as for all the samples with a Mg/Si ratio < 0.7, an exothermic phenomenon without mass loss is observed between 850 °C and 950 °C (Figure 5a), whereas, in the case of samples with negligible specific surface (05MgSiH0.25K0 for example), an endothermic peak between 700 and 900 °C is associated to an important mass loss (Figure 5b). This phenomenon is related to the departure of water and carbon dioxide detected using a mass spectrometer coupled to the TGA–DTA apparatus.
To allow a better understanding of the phenomena involved in the thermal decomposition of our Mg silicates, the results can be compared to those obtained in the literature for Magnesium Silicate Hydrate (MSH) [13,19] and phyllosilicate materials [10,17,20,21,22], as mentioned in the Introduction.
According to Figure 5, the thermal decomposition of the samples can be divided into three main stages. The first one corresponds to an endothermic mass loss between 20 °C and about 250 °C. Referring to work on MSH or on phyllosilicate, this mass loss can be attributed to weakly physisorbed water on the surface [38,39,40].
This dehydration step is then followed by a second stage, i.e., the progressive loss of mass up to relatively high temperatures of about 700 °C. In this temperature range, successive departures of water are described in the literature, in the case of MSH. Indeed, these losses of water are generally associated to silanol (Si-OH) and/or magnesium (Mg-OH) hydroxyl groups [17,21,40]. More especially, according to Bernard et al. [19], in the temperature range 250–650 °C a first mass loss, centered at 390 °C, is observed and corresponds to the dehydroxylation of the silanol groups, while the dehydroxylation of the magnesium hydroxyl groups occurs at higher temperature (500 °C). On the contrary, for phyllosilicates with lamellar structures, such as talc, the hydroxyl groups are located inside the structure, and the dehydroxylation leads to the formation of water, which is then trapped in and between the sheets [41], and cannot be evacuated at temperature inferior to 700 °C.
Finally, at high temperature (>750 °C) [10,14,21,39,42,43], the MSH structure can be decomposed into several crystalline phases [14,44,45], giving rise to an exothermic event. This phenomenon would occur when the dehydroxylation is complete, hence without mass loss [21], as it is observed on sample 1MgSiH0.5K0. On the reverse, for phyllosilicates, an endothermic phenomenon is reported in the literature, but this time it is accompanied by a strong loss in mass [46,47,48]. This behavior is obtained on the sample 05MgSiH0.25K0, which belongs to the family with negligible surface area.
To conclude, the thermogravimetric analysis confirms the existence of two distinct families of Mg silicates. One with Mg/Si ratio < 0.7 presents at high temperature (>700 °C) a crystallization without mass loss similarly to MSH-type materials. On the contrary, at high temperature, a crystallization with mass loss is observed for materials with Mg/Si ratio > 0.7, as is the case for phyllosilicates.

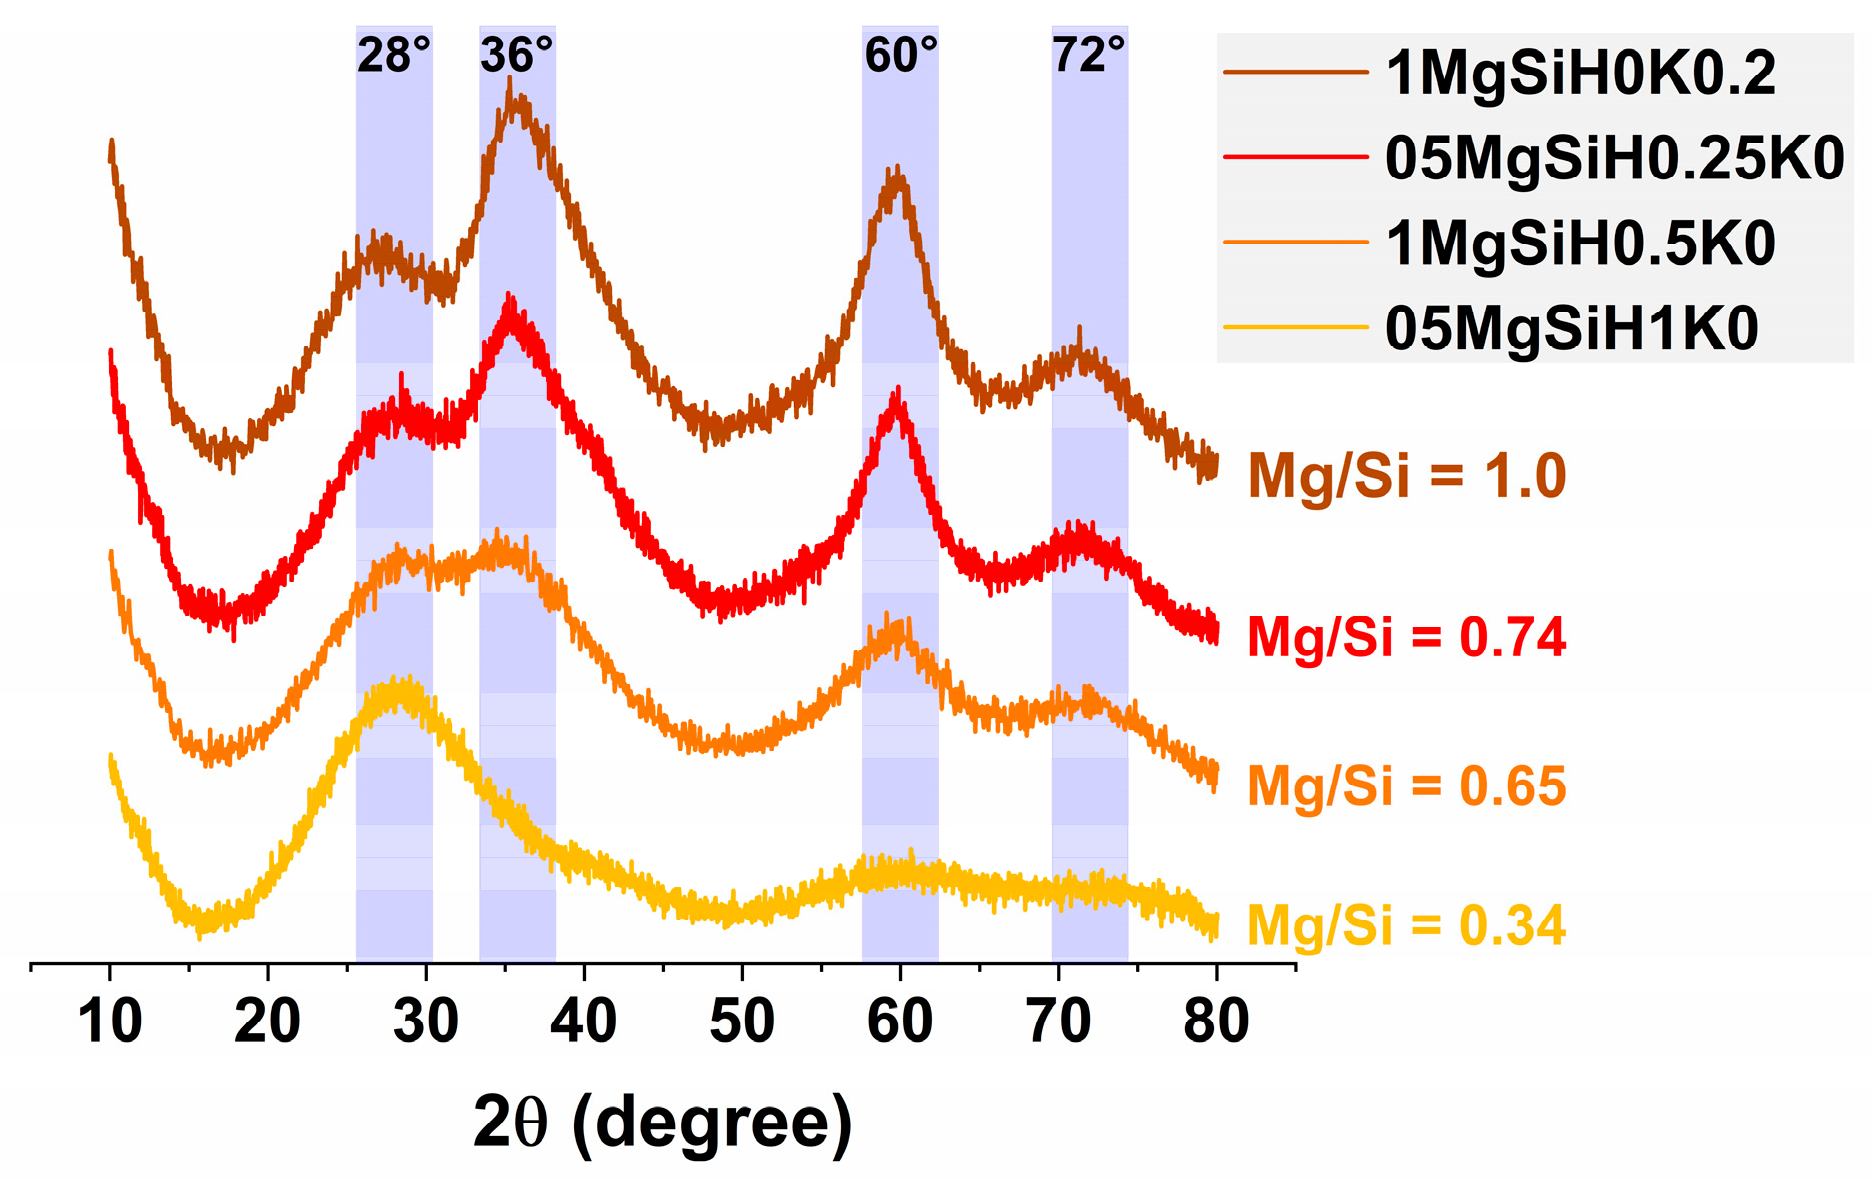
2.3.4. X-ray Diffraction

To investigate the fine structure of the synthesized silicates, an XRD study has been carried out. In this paragraph, four representative samples of all the synthesized Mg silicates have been selected: 05MgSiH1K0 (Mg/Si = 0.34); 1MgSiH0.5K0 (Mg/Si = 0.65); 05MgSiH0.25K0 (Mg/Si = 0.74); and 1MgSiH0K0.2 (Mg/Si = 1.0). All these selected samples show the same poorly crystallized profile with broad diffuse peaks at 2θ ≈ 28°, 36°, 60° and 72°, respectively (Figure 6). Based on the relative decrease in peak width, a slight gain in crystallinity is observed with increasing Mg/Si ratio.
At first, the X-ray diffractograms of these samples can be compared to that established for MSH materials whether synthesized by solid–solid reaction [13,14,17,49,50,51] or by coprecipitation [10,16,20,52]. It appears that the three last peaks (36°, 60° and 72°) are classically assigned to MSH, but the nature of the first one is more discussed. Some studies concerning MSH show the existence of a peak at 2θ = 20° [10,13], or at least of a broad peak also overlapping the peak at 2θ = 28°, giving a resulting contribution ranging from 2θ ≈ 17° to ≈28° [17], but this broad feature can also be attributed to amorphous silica. Indeed, for some authors, ill-crystallized silica has a characteristic peak in the 2θ area centered at 2θ = 20° [10,13,14], while others place it at larger angles (from 2θ = 21° to 24°) [53,54]. In our case, the predominance of this peak in the silicon-rich samples (like 05MgSiH1K0, Figure 6) could indeed be due to the presence of ill-crystallized silica in these materials. It is also noteworthy that the XRD patterns do not reveal the presence of an MgO-type crystalline phase. Indeed, based on JCPDS card 89-7746, the diffraction planes of magnesium oxide (111), (200), (220) and (311) correspond to 2θ = 37.4°, 43.6°, 63.2° and 78.4°, respectively.
Relying now on the similarity between the structure of MSH and that of phyllosilicates, the peak observed at around 2θ ≈ 28° can thus often be attributed to the (002) reflection of sepiolite [55,56], and the diffraction peak at 2θ ≈ 35° can be compared to the characteristic (003) reflection of lizardite [57]. Similarities also exist with the diffraction patterns of talc [58,59,60]. For example, the (003) reflection of talc at 28°, but also the (004) at 39° and the (060) at 61°, are close to the peaks observed on MSH, thus on our samples at 2θ = 28°, 35° and 60°.
From XRD analysis, it can be concluded that all samples give a similar pattern of ill-crystallized Mg silicates in agreement with the common description of MSH as being defective phyllosilicates.
To proceed further, a pair distribution function (PDF) analysis was performed. The PDF function represents the probability of finding pairs of atoms separated by a distance r [61,62,63,64,65,66]. Experimentally, it can be extracted from an X-ray total scattering pattern.
One of the first pieces of information obtained by PDF analysis is the crystal coherence length (Figure S4). For all samples, the PDF peaks are damped until disappearing at relatively low r distances (between 9 and 20 Å), showing low order and crystallinity. Furthermore, two behaviors are observed on either side of the Mg/Si ratio of 0.7: first, an increase of the coherence length with Mg/Si ratio from 9 to 12 Å for 05MgSiH1K0 (Mg/Si = 0.34) and 1MgSiH0.5K0 (Mg/Si = 0.65); second, a stabilization of the coherence length for Mg/Si ratio > 0.7 at 20 Å for both 05MgSiH0.25K0 (Mg/Si = 0.74) and 1MgSiH0K0.2 (Mg/Si = 1.0). For Mg/Si ratio below 0.7, the crystallinity is low and increases with Mg/Si, and above Mg/Si = 0.7, the crystallinity does not evolve anymore.
Apart from the coherence length effect, peaks appear at the same positions (distances) for all samples, meaning that their local structure are strongly related. Structural investigations using PDF analysis have been performed by Bernard et al. [19] on MSH synthesized with Mg/Si ratio between 0.8 and 1.3 by solid–solid reaction. Peaks were not that much damped and still recognizable at 20 Å, meaning that the prepared MSH were more crystalline than our co-precipitated samples. In this study, the authors attempted to fit their experimental PDF with the structures of phyllosilicates such as talc, sepiolite and those relating to the serpentine group (antigorite, chrysotile or lizardite). The sample with a Mg/Si ratio of 1.3 had the best fit with the antigorite-type structure, whereas the sample with a Mg/Si ratio of 0.8 was inconclusive between antigorite and talc. Overall, the author concluded about the need for complementary techniques.
Even if in our case the structural model is not entirely known (based on SiO2 and MgO sheets with small coherent region), we can analyze the first peaks that correspond to the Si and Mg first coordination sphere: the first peak at 1.6Å corresponds to Si-O and the second one at 2-2.1Å to Mg-O (Figure S5). The intensity of the Si-O peak decreases whereas the intensity of the Mg-O peak increases with the Mg/Si ratio, which is consistent with the solid composition (Figure S5). The position of the Si-O peaks remains constant, whereas the Mg-O peaks tend to appear at decreasing distances (from 2.1 Å for 05MgSiH1K0; Mg/Si = 0.34 to 2.0 Å for 1MgSiH0K0.2; Mg/Si = 1.0). These slight continuous variations in peak positions can be seen for further peaks and suggest slight evolution between each structurally close sample.
To conclude this section, the XRD patterns suggest a continuity in the structure of the silicates and a small gain in crystallinity with the increase in the Mg/Si ratio. Thus, it cannot explain the abrupt drop of SBET. However, the existence of the two families of Mg silicates can be revealed by coherence size evolution obtained by PDF analysis. At a Mg/Si ratio below 0.7, the coherence size increases with the increase in Mg/Si ratio; above 0.7, the coherence size does not seem to evolve.

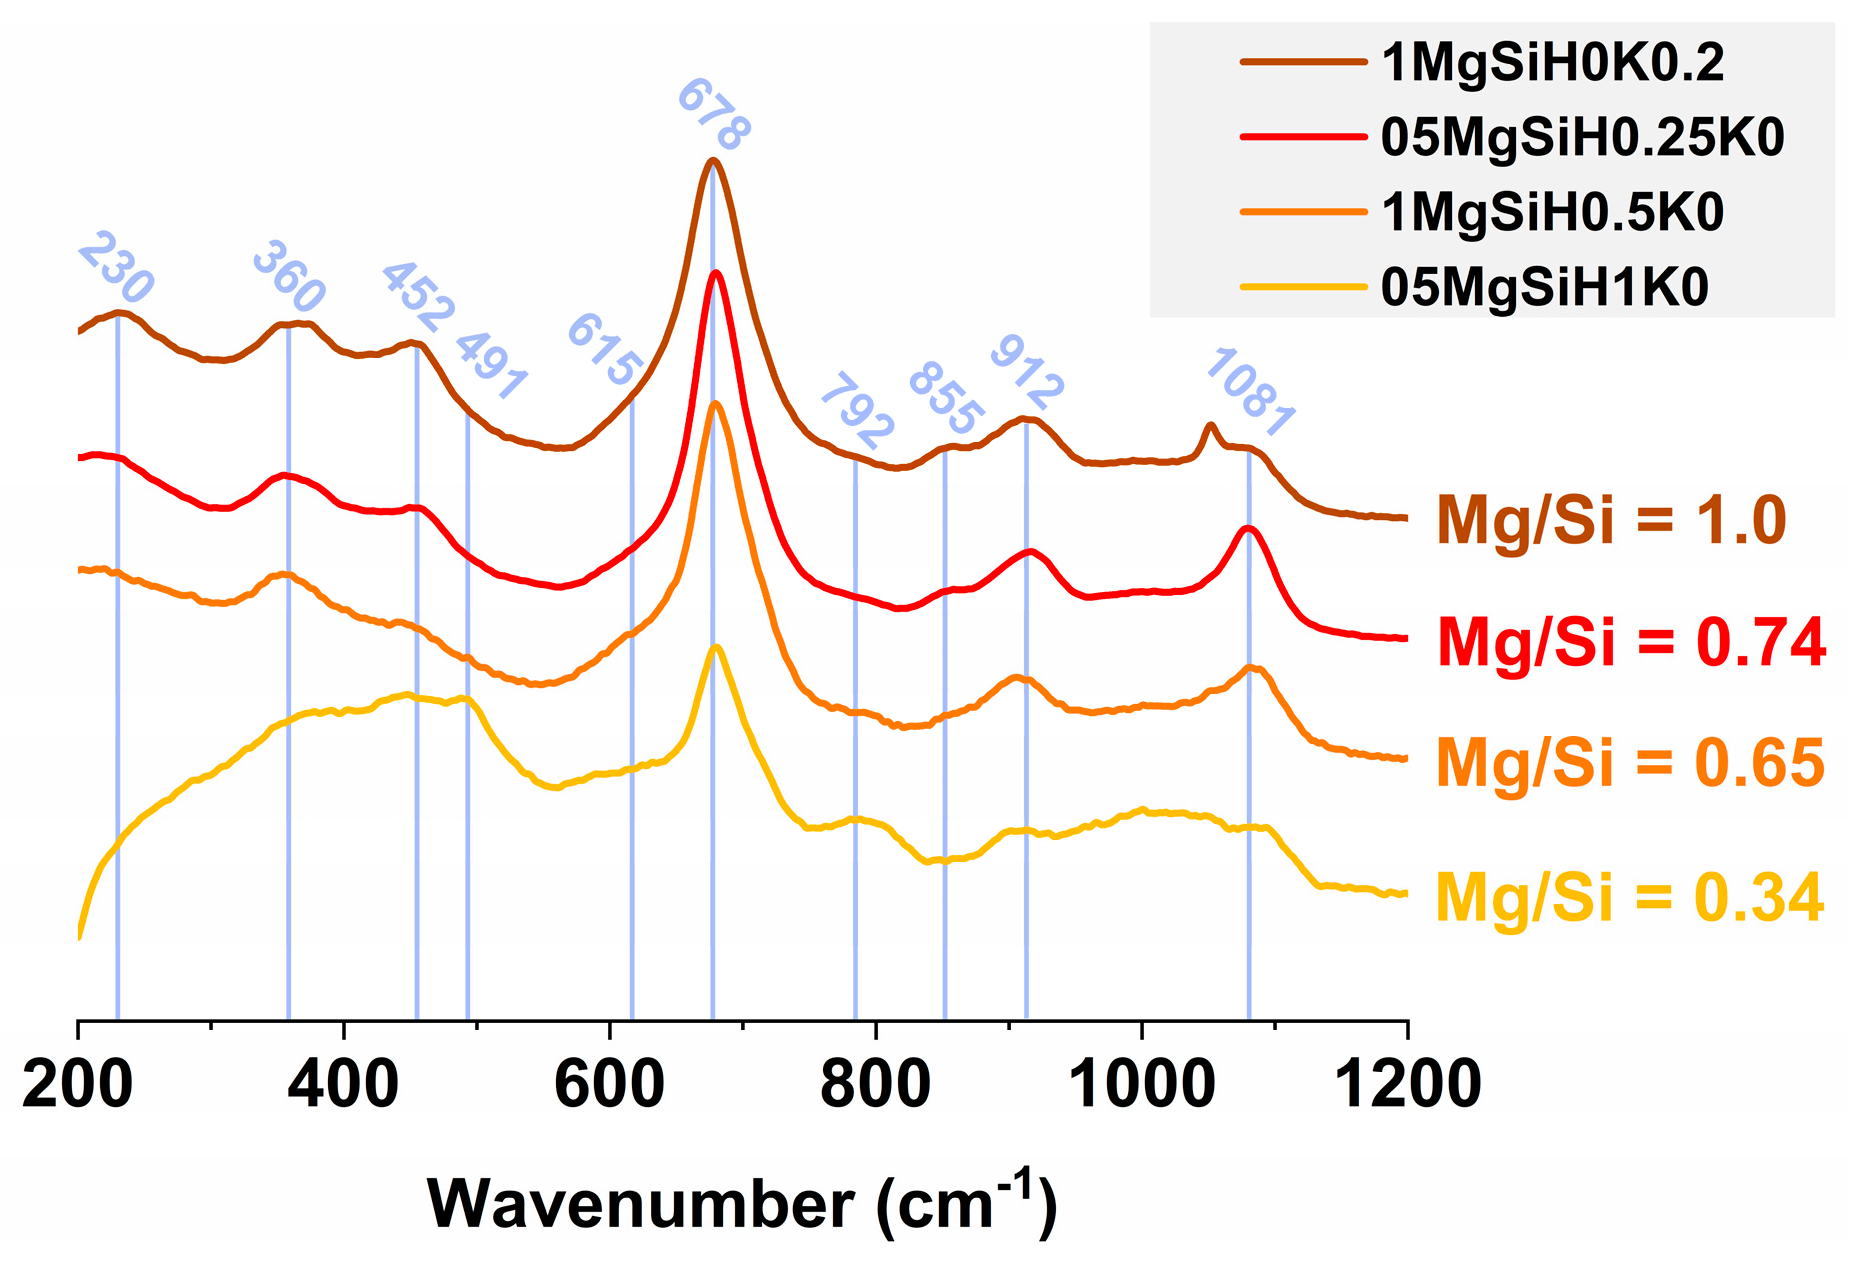
2.3.5. Raman Spectroscopy

The XRD study was completed by Raman spectroscopy analysis, which allows the identification of structures at a smaller scale. Figure 7 shows the Raman spectra, in the region between 200 and 1200 cm−1, of the samples previously analyzed by XRD.
The spectra of Mg silicates with a Mg/Si ratio > 0.34 show globally the same Raman bands located at 230, 360, 452, 678, 855, 912 and 1081 cm−1. It should be noted that the band located at 1081 cm−1 is split in the case of the sample with the highest Mg/Si ratio (1MgSiH0K0.2). All the observed bands can be reasonably assigned to an MSH structure, as shown by the Nied et al. [17] study on the synthesis by solid–solid reaction of this type of material with a Mg/Si ratio ranging from 0.4 to 1.7. It must be noted that, as mentioned for the analysis by XRD, the contributions obtained are also very similar to those found in the field of phyllosilicates for talc [67,68], lizardite and antigorite [68,69].
The sample 05MgSiH1K0, with the lowest Mg/Si ratio (0.34), exhibits significant differences. A first band at 491 cm−1 can be assigned to the presence of amorphous silica [70,71]. Furthermore, the relatively broad bands centered at 440 cm−1, 600 cm−1, 800 cm−1 and 1050 cm−1 can also be attributed to spectroscopic signatures identified in both silica nanoparticle [72,73] and amorphous silica [70,71].
In conclusion, the results of this study are in line with those obtained by XRD analysis. The silicates exhibit an ill-defined MSH structure with a Raman fingerprint similar to the local phyllosilicate environment. For the sample with a low Mg/Si ratio (0.34), an additional amorphous silica phase is observed. Thus, as XRD analysis, Raman spectroscopy does not provide specific characteristics for samples belonging to the two different families.

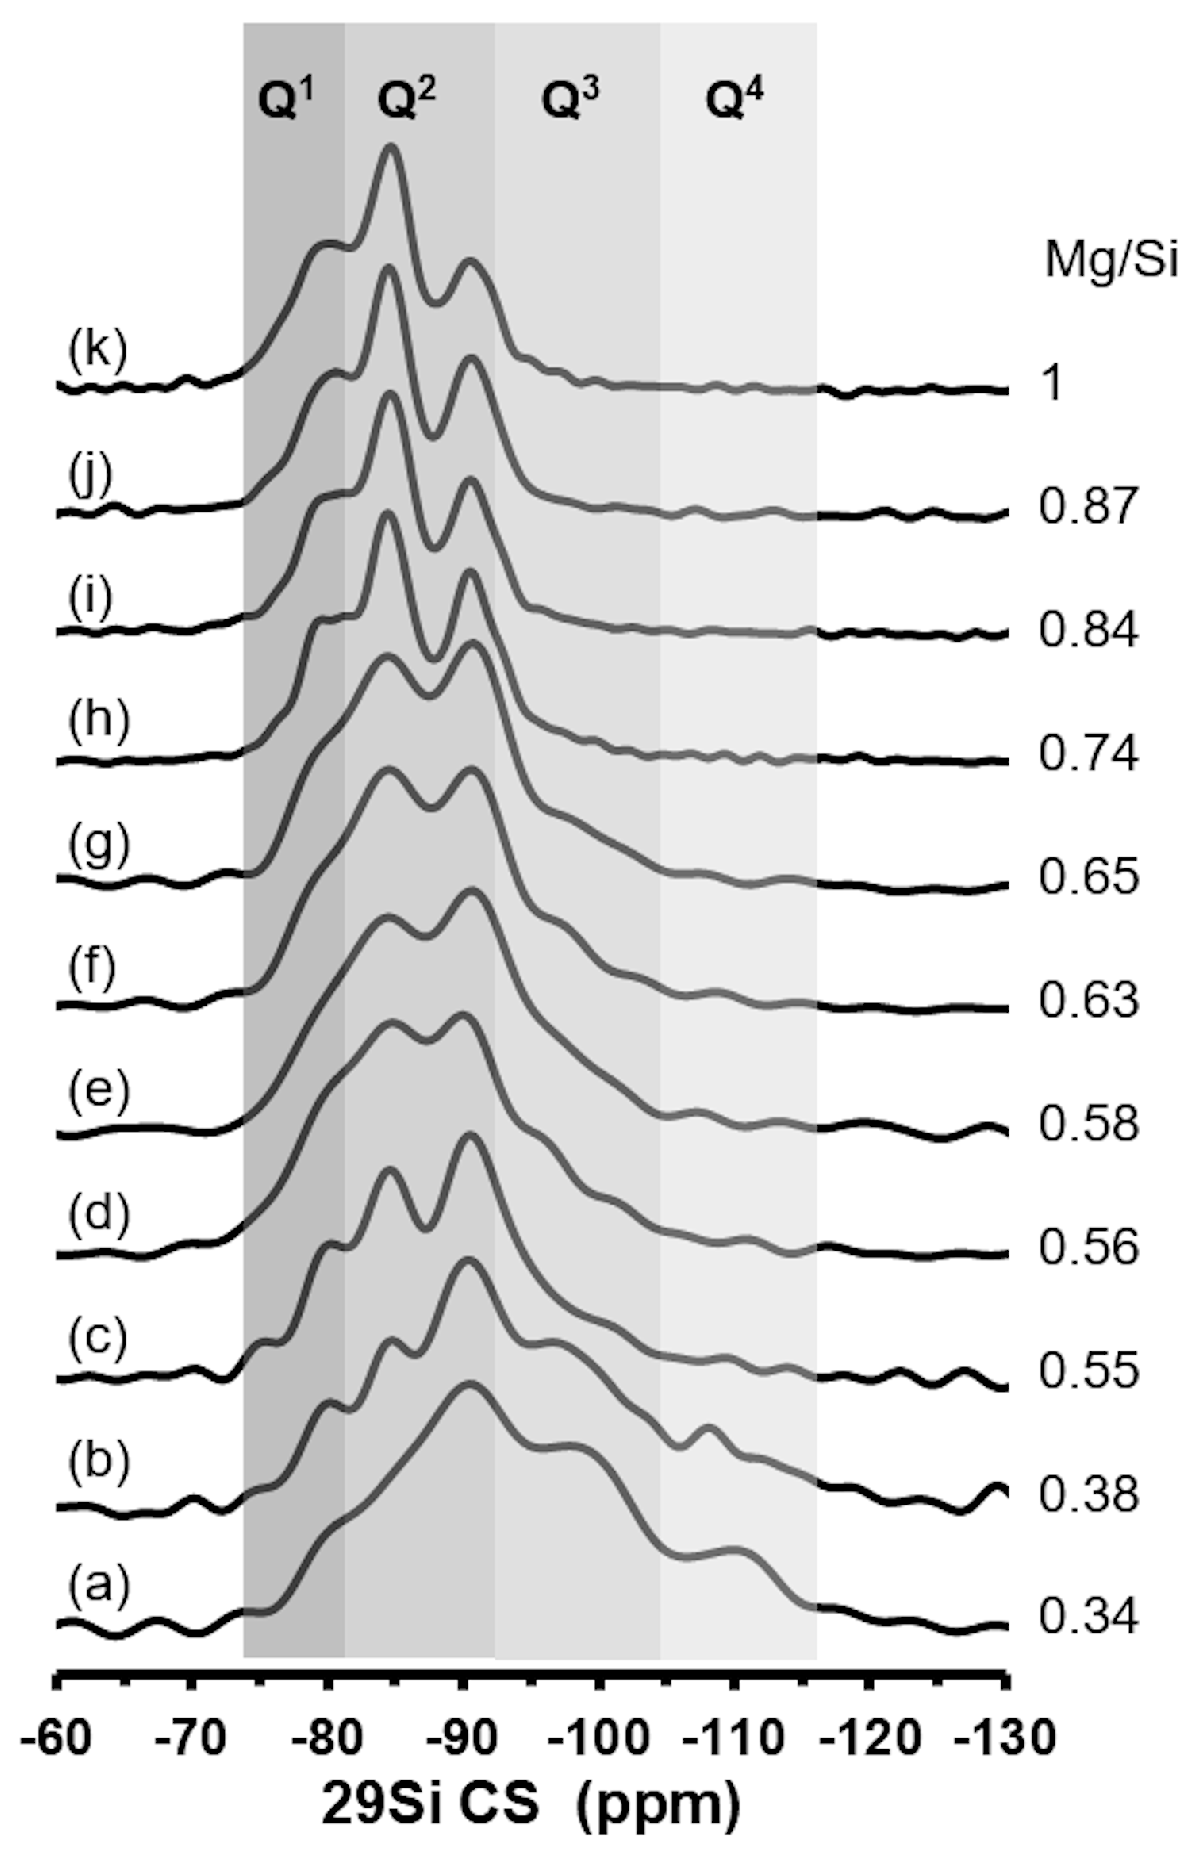
2.3.6. 29Si NMR Analysis

Figure 8 presents the 29Si MAS NMR spectra of the samples classified by increasing the Mg/Si ratio. The spectra show broad signals with a low resolution, characteristic of low-crystalline solids. The complexity of silicon NMR on this type of sample makes it difficult to decompose the various overlapping contributions. It has been established that the chemical shift of 29Si in solid silicates is closely related to the chemical environment of the silicon atom and is, in particular, correlated with the degree of polymerization of SiO4 [74,75]. Generally, the different kinds of silicon atoms were named according to the Qn notation, where Q indicates that the Si atom is bonded to four oxygen atoms, and n corresponds to the number of Si–O–Si siloxane bonds. According to the literature [13,14,17,19,21,51,76,77,78,79,80], four areas in the chemical shift range of silicon can be defined: −115/−105 ppm for Q4 species (Si(OSi)4), −105/−91 ppm for Q3 species (Si(OSi)3(OX) with X = H and/or Mg), −91/−80 ppm for Q2 species (Si(OSi)2(OX)(OY) with X and Y = H and/or Mg), and −80/−74 ppm for Q1 species(Si(OSi)(OX)2(OY) with X and Y = H and/or Mg). The sample with the lowest Mg/Si ratio (05MgSiH1K0, Figure 8a) shows signals in all four environment types for silicon atoms, with a majority of Q3 and Q2. As the Mg/Si ratio increases (Figure 8b–k), the contributions of Q4 and Q3 species disappear, while those of Q2 and Q1 species become predominant. For the highest Mg/Si ratios (>0.7), the spectra seem to be better resolved with less broadening. In order to obtain more quantitative data, the 29Si MAS spectra were decomposed, and the relative intensities of the different contributions are listed in Table S3. 29Si CPMAS spectra (not shown) were used to help validate the position of the different signals observed. The chemical shift and half-width at half-maximum were kept constant for all samples. The evolution of the Q3/Q2 ratio as a function of the Mg/Si ratio, obtained by fitting, is presented in Figure 9. We observe a discontinuity in the evolution of the Q3/Q2 ratio for values of the Mg/Si ratio higher than 0.7. While, at first, the Q3/Q2 ratio decreases rapidly, it stabilizes for the highest Mg/Si ratio. It is noteworthy that an identical phenomenon could be highlighted by the PDF analysis which reveals that, for samples with a Mg/Si ratio > 0.7, the crystal coherence length no longer evolves (Figure S4). In fact, for samples with a Mg/Si ratio > 0.7, the Q3/Q2 ratios stabilize at around 0.2. In can be noted that this value is very low compared to those reported in the literature for phyllosilicates such as antigorite (Q3/Q2 = 2) [81] or talc (Q3/Q2 = 4) [17] which, nevertheless, have a Mg/Si ratio close to those of our Mg silicates (i.e., Mg/Si = 1.5 for antigorite and 0.75 for talc).
In conclusion, this study is consistent with XRD and Raman analysis showing a continuity in the structure of the silicates and a small gain in crystallinity with the increase in the Mg/Si ratio. Nevertheless, like with PDF results, a discontinuity in the Q3/Q2 ratio evolution is shown by NMR, corresponding to the existence of two families of materials.

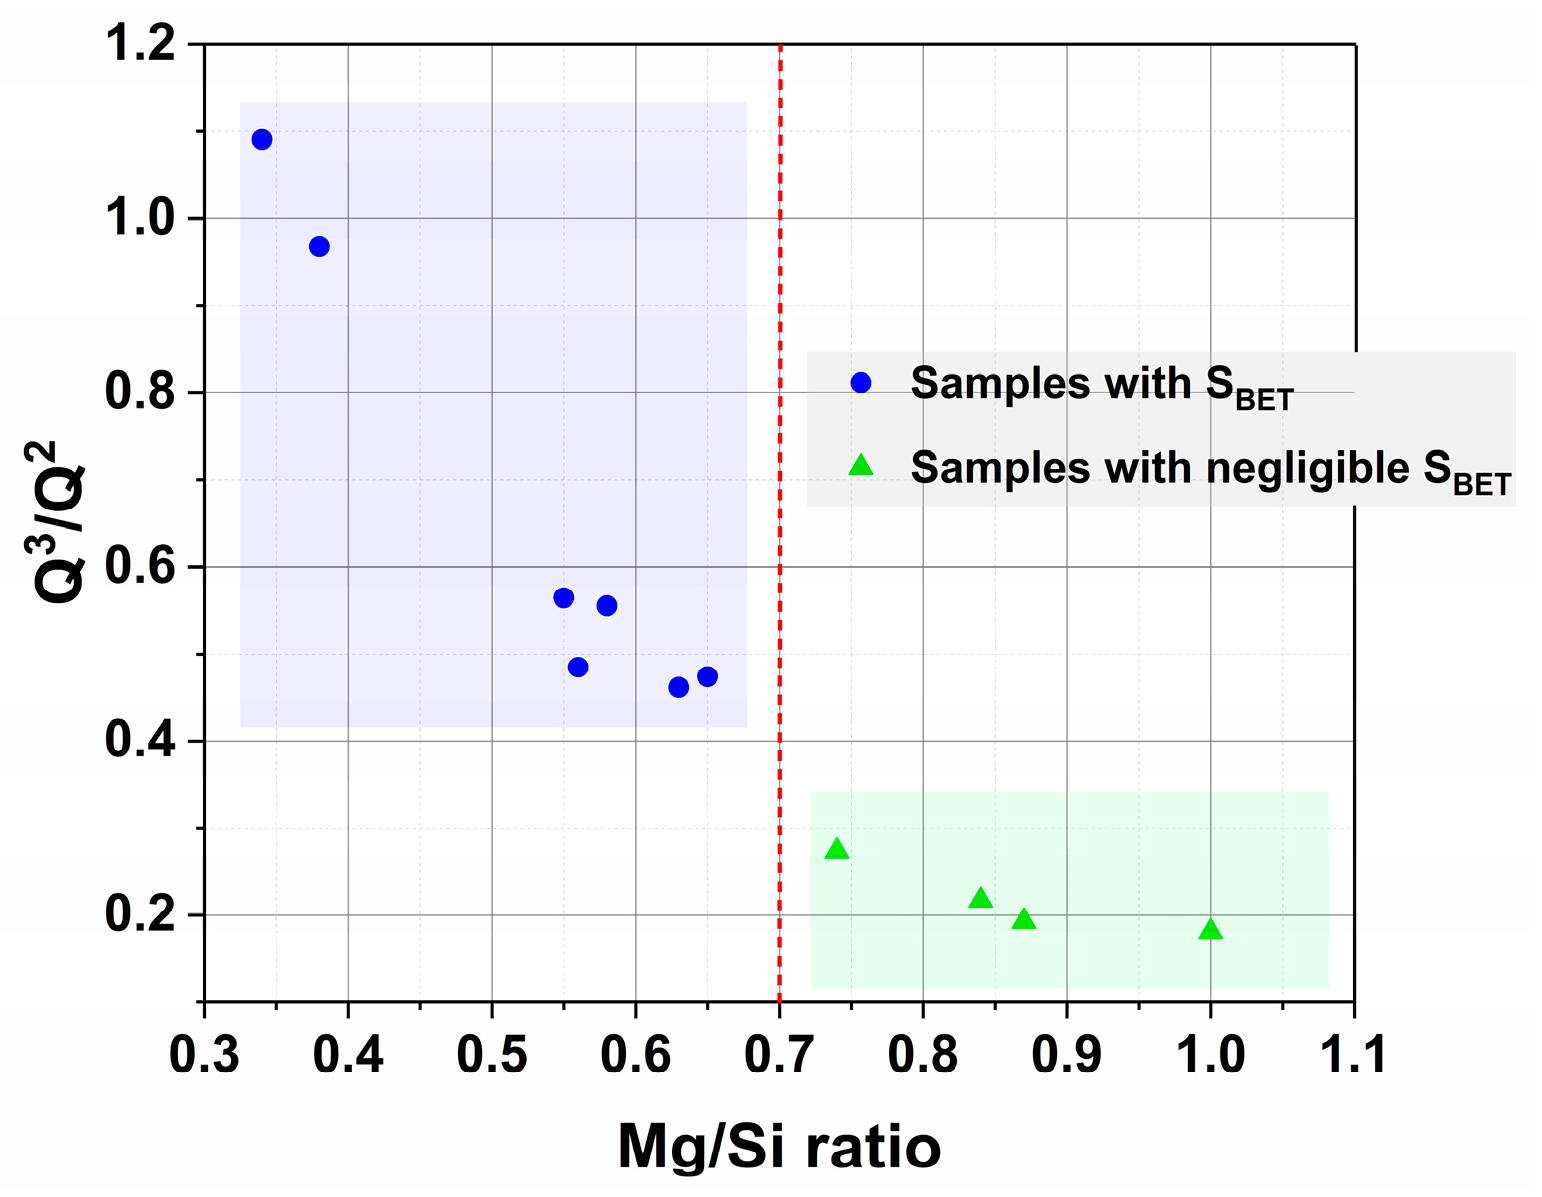
2.4. Discussion on the Existence of the Two Magnesium Silicates Families

First, it should be pointed out that no study in the literature on the preparation and characterization of Mg silicates reveals a sudden loss of specific surface area from a particular Mg/Si ratio. Nevertheless, our synthesis process (i.e., coprecipitation using a micromixer) necessarily leads to synthesis conditions very different from those described in the literature. Indeed, as mentioned in the previous paragraphs, a large number of studies in the field of Mg silicate synthesis concern materials obtained by following solid–solid reactions between MgO or Mg(OH)2 and amorphous silica as precursors [13,16,17,19].
The experimental data obtained by N2 physisorption, SEM, thermogravimetric analysis and 29Si NMR spectroscopy thus suggest the possibility of dividing our samples into two families. Therefore, silicates with a Mg/Si ratio < 0.7 have a specific surface area larger than 180 m2·g−1, while for solids with a higher Mg/Si ratio, the SBET is not measurable. This observation is confirmed by the microscopy images which reveal, in one case, silicates composed of small particles which are gathered in agglomerates and, in the other, a monolithic structure. Thermogravimetric analysis also indicates a large difference between the two silicate families. Samples with a Mg/Si ratio < 0.7 show crystallization at high temperature (> 700 °C) without loss of mass, whereas in the case of silicates with a Mg/Si ratio > 0.7, this crystallization is accompanied by a loss of mass.
On the reverse, the analysis of Mg silicates by XRD and Raman spectroscopy suggests a relative continuity in the structure of the prepared materials, exhibiting MSH or defective phyllosilicate structure, increasingly ordered as the Mg/Si ratio increases. The conclusions of these two techniques are thus consistent with the thermodynamic approach which suggests a precipitation of a homogeneous solid solution without any discontinuity in the structure of the silicates when the ratio Mg/Si = 0.7 is reached.
Finally, the 29Si NMR and PDF results also show a continuous evolution of, respectively, the Q3/Q2 ratio and the crystal coherence length as a function of Mg/Si ratio. But a discontinuity of these evolutions is evidenced with a stabilization for Mg/Si > 0.7, in agreement with the existence of two distinct families.
Based on these results, it is possible to propose some hypotheses concerning the existence of the two families of silicates. In our study, the sudden loss of SBET occurs at relatively high pH(s), i.e., 10.0 and 11.7 for samples with a ratio of (Mg/Si)theo = 1.0 and 0.5, respectively. It is noteworthy that the pH is the key factor in the composition of the solids. Indeed, it has been pointed out in the previous paragraphs that, for a given (Mg/Si)theo, the higher the synthesis pH, the higher the magnesium content incorporated in the silicate. At these high pH values, the defective silicon sheets are globally negatively charged in solution due to the deprotonation of the hydroxyl groups. In addition, 29Si NMR analysis indicates that in the case of silicates with negligible SBET, the Q3/Q2 ratio does not significantly evolve and is globally lower than the one obtained for the samples with SBET (Figure 9). This decrease in the Q3/Q2 ratio could indicate a depolymerization of the silica, and the presence of a majority of Q2 species may also imply that more Mg is present in the Si environment. As previously mentioned, the very low value of the Q3/Q2 ratio (about 0.2) reached for the high Mg/Si ratio is not compatible with the formation of phyllosilicate structures [17,81]. Thus, the gain in the local structure order observed by XRD, PDF and NMR spectroscopy can only be related to a better organization of MSH phase. The phenomenon of sudden loss of mass at high temperature during the thermogravimetric analysis, observed for solids with a high Mg/Si ratio, can thus be assigned to trapped water from dehydroxylation in the porosity, as in the case of phyllosilicates, but must be due to an aggregation state of MSH particles different from the formation of a layered structure.
In the solid, the compensation of negative charges can be achieved in at least two ways: either by the presence of monovalent alkaline cations (K+ here) in solution or by Mg2+ ions which would not be inserted in the octahedral layers. In both cases, the presence of these charge-compensating ions could act as a binding agent between the silicon sheets and lead to monolithic structures, devoid of SBET. This phenomenon of particle aggregation via monovalent or divalent cations is well known and documented in the literature in the field of amorphous silica studies [82,83]. It should also be mentioned that the supposed aggregation mechanism of the particles does not seem to be similar for the samples of ratio (Mg/Si)theo = 0.5 compared to those of ratio 1.0. Indeed, in the first case, a non-negligible amount of potassium, i.e., K/Si > 0.1, is contained in the final composition of the samples with a ratio Mg/Si > 0.7 (Table S1). On the other hand, in the case of silicates of (Mg/Si)theo = 1.0 the K+ ions must have been eliminated during washing. The charge compensation must therefore be provided by the Mg2+ ions.
Other mechanisms of coagulation/coalescence of silica particles are proposed in the literature. For instance, Liu et al. [84] demonstrated that the growth of silica particles in a basic solution is achieved by a reaction between neutral surface silanol groups with H3SiO4 or between Si-O surface groups with monosilicic acid molecules (H4SiO4). The presence of these silicic species enhances the interparticle bonds and leads to the formation of more dense silica gel. In the context of our study, the presence of monosilicic acid cannot be excluded in view of the Si concentrations remaining in the supernatant after precipitation at high pH. Indeed, at pH(s) = 9.9, the Si concentration is of the order of 0.3 mmol·L−1 for samples with a ratio (Mg/Si)theo = 1 (Table S2). For samples with a lower theoretical ratio, the concentration increases from 2.3 mmol·L−1 (pH(s) = 10.4) to 25.4 mmol·L−1 (pH(s) = 12.6) (Table S2).
It is also noteworthy that the critical Mg/Si ratio corresponds to a value from which there can exist (in terms of crystallography) infinite continuous 2D layers of MgO6 octahedra (as in talc), whereas for lower ratios these assemblies of octahedra remain discrete. So, at low Mg/Si and low pH in our precipitation conditions, the octahedral 2D assemblies of Mg are coated with silicate, and these coated units aggregate, cemented by the processes discussed in the two previous paragraphs, to form nanoparticles. The further agglomeration of these nanoparticles leads to significant porosity and large specific surface area of the powders. On the other hand, in the conditions of higher Mg/Si and at sufficiently basic pH, the 2D layers of Mg can extend significantly (because silicates are not in sufficient quantity to coat them completely and prevent them from expanding), the silicates then rather serve as a cement to stack the Mg layers in dense and large-scale structures.

2.5. Reactivity towards 2-Methylbut-3-yn-2-ol (MBOH)

As discussed in the introduction, the surface acid–base properties of Mg silicates, exhibiting a measurable specific surface area, are determined via the model reaction of 2-methylbut-3-yn-2-ol (MBOH) conversion. On acidic sites, MBOH dehydrates mainly to 3-methylbut-3-en-1-yne (Mbyne) and decomposes to acetone and acetylene on basic sites [34] (Scheme 1).
Table 2 presents a typical example of the MBOH conversion results obtained with the sample 1MgSiH1K0. The results achieved with the other Mg silicates are given in Tables S4a to S4i in the supporting information.
In Table 2 are reported the conversion (Conv), the carbon balance (C balance), the selectivities in Mbyne, in acetylene, as well as in acetone, respectively named S(Mbyne), S(C2H2), and S(acetone). In addition, as the prepared Mg silicates exhibit very different SBET values ranging from 187 to 358 m2·g−1 (Table 1), it is useful to calculate a conversion that takes into account the specific surface area of the sample (Conv(BET)) in order to allow comparison between samples. Finally, from this conversion calculated in relation to the specific surface area, it was possible to determine the yields of the acidic route, Y(acidic), and the basic route, Y(basic). All the data presented in Table 2 are obtained from Equations (7) to (12) described in the “Materials and Methods” Section 3.4.
Structural data of the sample, such as the specific surface area (SBET) as well as the ratios Mg/Si and K/Si, which gives the residual amount of potassium remaining after the washing step, are also given in the legend.
The results concerning the 1MgSiH1K0 sample indicate first that a non-negligible deactivation phenomenon occurs during the reaction, leading to a decrease in the conversion from 13% after 2 min under MBOH flow to 6% at the end of the test, i.e., after 54 min under reaction flow. This tendency was observed on all the samples tested and is, in most cases, very pronounced between the first acquisition point, i.e., after 2 min under MBOH flow, and the second point (15 min). Deactivation is a very common phenomenon in this reaction and has been mainly attributed to secondary reactions, involving acid sites or acid–base pairs in which the acid site is not weak enough. Hence, condensation of acetone have been proposed to explain the formation of more or less heavy products that poison the catalyst [34].
To explain the deactivation in the case of sample 1MgSiH1K0, it is noteworthy that the carbon balance is lower after 2 min under flow (92%) compared to that calculated at the following time on stream (99%), which would tend to demonstrate the existence of heavy products retained on the surface or not detected by chromatography. Moreover, these products formed certainly come from acetone polymerization given the low selectivity in acetone (8%) compared to that in acetylene (51%) at the first point. The same observations can be established on all the samples tested (Table S4a–i). This phenomenon is largely reduced on samples with a very low Mbyne selectivity at the first point, confirming the role played by acidic sites in acetone condensation side reactions.
In order to efficiently compare the surface acid–base properties of the different samples, only the results in terms of selectivity and yield in acidic route at 2 min time on stream will be discussed in the following part. It should be noted that for the comparison of the catalytic performances of the Mg silicates, the shorter measurable time on stream (2 min) was chosen in order to compare, as much as possible, the materials as prepared, i.e., free of potential heavy products linked to deactivation.
Table 3 presents the Conv(BET), S(Mbyne) and Y(acidic) obtained after 2 min under MBOH flow as well as the Mg/Si and K/Si ratios.
The results obtained for samples with (Mg/Si)theo of 0.5 indicate firstly that the Conv(BET) increases in the same trend as the Mg/Si ratio. The sample 05MgSiH1K0 with Mg/Si ratio = 0.34 exhibits a Conv(BET) = 7%, whereas for a sample with a higher Mg/Si ratio equal to 0.63 (05MgSiH0.34K0), the Conv(BET) value reaches a value of 13%. Moreover, the increase in conversion, and therefore in the Mg/Si ratio, is accompanied by a very significant decrease in terms of selectivity in the acidic route, which decreases from 17% for the 05MgSiH1K0 sample to 1% for 05MgSiH0.34K0. This evolution is confirmed by the calculation of the acid yield (Y(acidic)), which evolves in the same route as S(Mbyne). It should also be underlined that the residual presence of potassium cation, given by the K/Si ratio, follows the same evolution. Indeed, the silicates with the lowest potassium content correspond to those with the highest Mbyne selectivity, as demonstrated by the comparison between the sample 05MgSiH1K0 (S(Mbyne) = 17% and K/Si = 0.03) and 05MgSiH0.5K0 (S(Mbyne) = 0% and K/Si = 0.1). This observation can be correlated with literature results obtained in the MBOH conversion reaction carried out on Na-doped alumina-type catalysts which suggest that this reaction reveals very well the impact of alkaline ions, even in a small amount, on the acid–base properties of a material [33].
In the case of the three samples with a ratio (Mg/Si)theo = 1.0, the same tendencies in terms of conversion, selectivity and yield in the acidic route emerge. It should be noted that the samples with a (Mg/Si)theo ratio of 1.0 present a much higher selectivity in Mbyne, and therefore a much higher surface acidity, than the silicates with a lower (Mg/Si)theo ratio.
To conclude this section on catalysis, for both series of samples with a theoretical Mg/Si ratio of 0.5 and those with a ratio of 1.0, the selectivity and yield in the acidic route are dependent on the magnesium content. The higher the Mg/Si ratio and a fortiori the synthesis pH, the lower the selectivity and yield in the acidic route, confirming that the incorporation of magnesium does induce basicity. Our coprecipitation method therefore allows us to modify the surface acid–base properties of the prepared Mg silicates, in particular by adjusting the synthesis pH.

3. Materials and Methods

3.1. Materials

For the magnesium silicate syntheses, the precursor solutions were prepared with ultrapure water (MilliQ) which was produced through a Millipore device (Millipore, France). Fumed silica (0.2–0.3 µm; Sigma Aldrich, St. Louis, MO, USA) and potassium hydroxide (Sigma Aldrich) were used to prepare the silicate solutions. Magnesium nitrate hexahydrate (BioUltra ≥ 99%; Sigma Aldrich) and nitric acid (HNO3) (Alfa Aesar, Haverhill, MA, USA, 68%) were used for the preparation of magnesium solution.

3.2. Synthesis of Magnesium Silicate

3.2.1. Experimental Device

A micromixer was implemented to mix the magnesium and silicate solutions. This mixer was described by Di Patrizio et al. [85] and consists of two inlets made of flexible tubing, leading to two square cross-section channels of a 1 mm side that enter in a mixing chamber where the two solutions are mixed in a vortex then exit through a 2 mm diameter pipe.
The introduction of the silicate and magnesium precursor solutions in the micromixer was performed thanks to a syringe pump composed of two 60 mL syringes. For each syringe, a three-way valve was used to load them with precursor solutions (aspiration mode) or to inject the precursor solutions into the micromixer (push mode). This device allows the injection of both solutions at the same, and therefore a perfect isovolumic mixing is obtained.
This vortex micromixer allows a mixing time of the order of 2 ms to be achieved at the maximum flow rate allowed by the syringe pump, i.e., 6 L·h−1. Several concentrations were tested, and the solution with a silica precursor concentration of 125 mmol·L−1 appeared to avoid clogging problems while providing a sufficient amount of solid for the study.

3.2.2. Coprecipitation Experiments

For each operating condition, the capacity of the syringes (60 mL) and the concentrations used required several repetitions of the precipitation protocol (depending on the pH conditions) to obtain enough material for characterizations (at least 2 g). For all the syntheses presented, the synthesis pH (pH(s)) is defined by the pH resulting from the grouping of the different precipitation runs carried out under the same conditions, after checking that the pH of each run is the same (±0.2). The mixture thus obtained was then centrifuged at 2400× g for 20 min. The supernatant was then collected for further analysis, and a translucent and whitish gel was obtained at the bottom of the centrifuge tubes.
This resulting gel was then recovered and washed to eliminate nitrate salts. For the first wash, the gel was washed in 300 mL of KOH solution at a pH equal to the synthesis pH and stirred vigorously for 20 min. The mixture was centrifuged at 2400× g for 20 min. This operation was then repeated two times with distilled water. Just after the fourth centrifugation, the gel was collected and freeze-dried.

3.2.3. Preparation of Magnesium and Silicate Precursor Solutions in the “Neutralization” Conditions

The silicate solutions were obtained by dissolving the micrometric silica in a potassium hydroxide solution in molar ratio KOH:SiO2 = 2:1 in a closed bottle. The dissolution process being long, the solutions were left for 24 h under stirring at room temperature, until transparent solutions were obtained.
For all the syntheses, a silicate stock solution at 1.25 mol·L−1 was prepared according to the above protocol. Similarly, Mg2+ stock solution was prepared by dissolving magnesium nitrate in pure water until a concentration of 312.5 mmol·L−1 was obtained.
The solutions introduced in the micromixer were then obtained by dilution of the two stock solutions, allowing to control the theoretical Mg/Si (Mg/Sitheo) ratio and the pH of each solution.
The concentration of the silicate solution injected ([Si]in) was fixed at 125 mmol·L−1 to be adapted to the use of the micromixer. Thus, the concentration of the magnesium injected in the micromixer ([Mg]in) is fixed by Equation (5), since the mixing is obtained by introducing identical volumes of the two precursor solutions. It is noteworthy that the theoretical Mg/Si ratio (Mg/Sitheo) targeted in this study is 0.5 and 1.
r = M g S i t h e o = M g i n S i i n = 0.5   o r   1
The “neutralization” conditions were defined as the stoichiometric proportions according to the following equation (Equation (6)) used to model the coprecipitation of Mg silicate:
S i O 3 2 + r M g 2 + + 2 1 r H + = M g r S i O 2 + r + 1 r H 2 O   with   r = ( Mg / Si ) theo
To achieve these “neutralization” conditions, the silica stock solution is diluted in pure water, and the magnesium stock solution is diluted to give the appropriate magnesium concentration either in pure water (if r = 1) or in nitric acid (if r = 0.5), so that [H+]in = [Si]in.

3.2.4. Adjustment of the Synthesis pH

With a micromixer, the synthesis pH, as previously defined, can be modulated by addition of KOH to the silicate stock solution or HNO3 to the magnesium stock solution. These additions are performed during the dilution of the stock solutions of the two precursors and allow to adjust the final pH of the mixture without changing the concentration of silicate and magnesium injected ([Si]in and [Mg]in).
The synthesis parameters of all the prepared Mg silicates are given in Table S1. The concentrations reported in this table are those of the solutions injected in the micromixer. The measured synthesis pH (i.e., pH(s)) for each condition are also given in Table S1.
In the following, the synthesized samples will be named as follows: rMgSiHAKB with:
r: (Mg/Si)theo molar ratio
A: [HNO3]in/[Si]in ratio
B: [KOH]in/[Si]in ratio

3.2.5. Quantitative Analysis for the Chemical Composition of the Supernatant

For each supernatant, the concentration of Mg2+ in the solution was determined by ethylenediaminetetraacetic acid (EDTA) titration with Eriochrome Black T (NET) as a color indicator, whereas the silicon species concentration was obtained following the Alexander method [35] using ammonium heptamolybdate.
Titration of magnesium content. 2 mL of supernatant was mixed with 5 mL of commercial buffer solution at pH = 10 (Buffer Solution; Certipur®; Merck) before adding a few drops of an aqueous NET solution (VWR), which creates a purple coloration in the presence of magnesium. The titration was achieved with a 10−2 mol·L−1 solution of the disodium salt of EDTA prepared from a 0.1 mol·L−1 commercial solution (AVS TITRINORM; VWR). The change to blue color occurs at the equivalence obtained for equimolarity of Mg2+ and EDTA.
Titration of silicon content. Silicon concentrations were determined by the Alexander method [35]. A first solution (A) of 0.57 mol·L−1 of ammonium heptamolybdate tetrahydrate (>99.3%; PANREAC) was prepared in ammonical medium by dissolving 10 g of ammonium heptamolybdate ((NH4)6Mo7O24.4H2O) in 4.7 mL of ammonia (28%) (GPR RECTAPUR; VWR) and diluted with distilled water up to a volume of 100 mL. This obtained solution was mixed with a 1.5 mol·L−1 H2SO4 solution and with distilled water [12.5 vol% (A) + 25 vol% (H2SO4 solution) + 62.5 vol% H2O] to form the color indicator solution (B). Finally, the test solution was prepared from 2 mL of supernatant and 8 mL of solution (B). The mixture was left to react for 5 min, and the solution turned yellow. The absorbance at the wavelength of 410 nm was measured, and the concentration was deduced from the calibration curve of the intensity at 410 nm as a function of the concentration of the standard solutions which concentrations were 6.26, 3.13, 1.57, 0.78 and 0.39 mmol·L−1.

3.3. Characterization

X-ray fluorescence. The determination of the solid compositions was carried out on an Epsilon 3XL X-ray fluorometer (Malvern-Panalytical) equipped with a silver X-ray generating tube operating under a helium atmosphere. The instrument was used under 2 different conditions:
  • 120 s analysis at 5 kV-60 µA without filter for the analysis of Mg, Na and Si;
  • 120 s analysis at 12 kV-25 µA with a 50 µm aluminum filter for the analysis of K.
In order to avoid the effect of particle size and matrix effects in general, the samples were beaded. For this purpose, a mixture containing 0.1136 g of sample, 1.2312 g of a fluidizing agent (LiBO2/Li2B4O7) and 0.0187 g of LiBr was made. The whole was transferred to a platinum crucible and heated to 1050 °C for 25 min in a melting instrument (LeNeo fluxer, Claisse). Calibration curves were obtained using beads of 14 geological reference materials (ACE, ANG, BCR-2, BEN, BHVO-2, BIR-1, BXN, DTN, FKN, GSN, MAN, Mica-Fe, Osh BO, UBN and BR24). The curves obtained remain linear throughout the concentration range.
N2 physisorption. N2 physisorption was performed at 77 K on a BEL Instrument BELSORP MAX. Prior to measurement, the samples were degassed at 120 °C under vacuum overnight. The specific surface area (SBET) of the sample was calculated using the Brunauer–Emmett–-Teller (BET) equation for P/P0 values between 5 × 10⁻² and 0.3. The pore volume was calculated from the total amount of nitrogen adsorbed at P/P0 = 0.975.
SEM. The high-resolution scanning electron microscope (SEM-FEG) used was a Hitachi SU-70 Field Emission Gun with a Secondary Electron Detector Lens (SE-Upper). The powdered samples were directly fixed on alumina SEM holders with a carbon adhesive. No metallization was performed. A low accelerating voltage (1 kV) and a working distance of about 2 mm were used.
Thermal analysis. The thermogravimetric analyses were carried out with an SDT Q600 from TA Instruments®. Samples (between 15 mg and 30 mg), after a light crushing with a mortar, were placed in an alumina crucible. The analyses were carried out under a nitrogen flow (Nitrogen U, Air Liquide) of 20 mL·min−1 with a ramp of 10 °C·min−1 from room temperature to 1200 °C. This apparatus is coupled to a Thermostar GDS 301T mass spectrometer.
XRD. The diffractograms were obtained using a Bruker D8 diffractometer equipped with a Cu-Kα anode (1.5406 Å). The analysis was performed between an angle 2θ ranging from 5° to 90° with a step size of 0.021°. The sample holder used is a Pyrex disc.
PDF analysis. X-ray total scattering data were measured for Pair Distribution Function analysis with a Bruker D8 ADVANCE diffractometer equipped with a Göbel mirror and a LYNXEYE high-energy detector, with Mo Kα radiation (mean λ(Kα1α2) = 0.71073 Å) at room temperature. A few tens of milligrams of powder were placed in a thin-walled (0.01 mm) borosilicate glass capillary of 1.0 mm diameter. Measurements were performed from Qmin = 0.12 Å−1 to Qmax = 17.0 Å−1 (Q = (4πsinθ)/λ) on rotating capillaries with evolving counting parameters as a function of Q-range in order to optimize the counting rate at high Q. The final XRD diagram was thus obtained from the combination of 7 patterns, converted in counts per second, with the following parameters 2θi(°)-2θf(°)-step size(°)- step time(s): 0.8-31-0.02-2, 29-61-0.04-6, 59-91-0.06-15, 89 121 0.1 40 (twice) and 119-150-0.1 100 (twice), for a total measuring time of 34 h. Additional scattering measurements from empty capillary were performed in the same conditions for background subtraction. Raw data were treated using the PDFgetX3 program [86] to obtain the experimental Gexp(r) function, using the following parameters: Qmin = 0.15 Å−1, Qmax = 16.6 Å−1, rpoly = 1.24.
Raman spectroscopy. Raman spectra were collected using a Kaiser Optical System Raman Analyzer RXN1 microprobe spectrometer equipped with a 785 nm laser diode and a 1024 × 256 pixel CCD detector. The instrument is coupled with a LEICA microscope with an X50 long-working-distance lens. The spectra of the samples were recorded with a laser power of 10 mW, a 30 sec exposure of the sample to the laser and an accumulation of 60 spectra.
29Si MAS NMR. The NMR spectra were recorded on a Bruker AVANCEIII 500 spectrometer operating at 11.4 T. The Larmor frequency of silicon-29 (29Si) is 99.5 MHz. Chemical shifts were referenced to TetraMethylSilane (TMS). The experiments were performed with a 7 mm probe and a 7 kHz magic angle rotation speed (MAS). For the 29Si direct polarization experiments with high-power proton decoupling (HPDEC), we used a 3 μs pulse, a repetition time of 10 s and an accumulation number between 1024 and 5120. The decoupling sequence used was SPINAL64 with a proton decoupling power of 60 kHz. For the cross-polarization experiments (CPMAS), we used 3-(trimethylsilyl)-1-propanosulphonic sodium salt to define the Hartmann–Hahn conditions. The proton pulse duration π/2, contact time and recycling delay are 4.2 μs, 2 ms and 5 s, respectively. The decoupling sequence used is SPINAL64 with a proton decoupling power of 60 kHz. The simulation of the NMR spectra was performed using the Dmfit program [87].

3.4. Conversion of 2-Methylbut-3-yn-2-ol (MBOH)

For each experiment, 50 mg of Mg silicate was introduced in a reactor, thus deposited on porous glass, in the center of a 10 mm i.d. U quartz tube and pretreated at 443 K over 2 h under nitrogen flow (20 mL·min−1, Air Liquide, 99.99%). The reactant feed was composed of MBOH diluted by bubbling nitrogen (50 mL·min−1 through a Brooks gas mass flow controller) in liquid MBOH (Fluka, 99.9%) maintained at 293 K. The diluted MBOH flow (partial pressure of 1.73 kPa) was then allowed to pass through the reactor. Reaction temperatures were kept at 443 K.
The first analysis was carried out 2 min after the introduction of the mixture into the sample, and then reaction products were analyzed every 13 min using a Perichrom PR2100 gas chromatograph (GC) equipped with a flame ionization detector. A packed column (2 m; 2.2 mm i.d.) containing 15% tetracyanoethylated pentaerythritol (TCEPE) supported on a Chromosorb PAW (60/80 Mesh) as stationary phase was chosen to separate all the components.
Results are expressed in terms of conversion, selectivity and yield. For an “i” species (either MBOH, Mbyne, acetone or acetylene), (Ai)t is the chromatographic area of the GC peak corrected by the appropriate response coefficients obtained for a time on stream t. (Ai)0 is the corresponding area for t = 0.
The conversion (Conv%) is thus obtained using Equation (7):
C o n v % = A M B O H 0 A M B O H t A M B O H 0 × 100
The normalized conversion per 10 m2 surface area (arbitrary value), named Conv(BET), was calculated using Equation (8) where m(cat) represents the mass of the sample introduced into the reactor and S(cat) the reference surface area. here set to 10 m2. A preliminary study checked that under these experimental conditions the reaction proceeds in the kinetic regime.
C o n v ( B E T ) = C o n v m ( c a t ) × S ( c a t ) S B E T
The selectivity for product i (Si%) can be defined as follows:
S i % = α i ( A i ) t α i A i t × 100
with αi = 1 for Mbyne, whereas αi = 1/2 for acetone and acetylene as these 2 molecules come from the decomposition of 1 MBOH molecule.
The yields of the acidic route, Y(acidic), and the basic route, Y(basic), are obtained using Equations (10) and (11):
Y a c i d i c = S M b y n e × C o n v B E T
Y b a s i c = S b a s i c × C o n v B E T
Finally, the carbon balance (C balance) can be expressed as follows:
C   b a l a n c e = n i A i t n i A i 0 × 100
with ni corresponding to the number of carbon atoms contained in the compound i.

4. Conclusions

A series of Mg silicates with theoretical Mg/Si ratios of 0.5 and 1.0 were synthesized by a coprecipitation process using a micromixer. During these syntheses, the pH was tuned by adding either potassium hydroxide to the silicon precursor solution or nitric acid to the magnesium nitrate solution. The modification of the synthesis pH allowed to obtain silicates covering a wide range of final Mg/Si ratio from 0.34 to 1.07. Based on the chemical composition of the post-precipitation supernatants, a thermodynamic simulation of our synthesis process is in agreement with the precipitation of a magnesium silicate solid solution and thus whatever the Mg/Si ratio in the range of 0.34 to 1.07.
The structure of the synthesized Mg silicates was then characterized using a wide panel of techniques (N2 physisorption, SEM, thermogravimetric analysis, XRD as well as Raman and 29Si NMR spectroscopies). The experimental data obtained enabled the identification of two Magnesium Silicate Hydrate (MSH) families that can be distinguished according to their Mg/Si ratio. For a Mg/Si ratio below 0.7, samples are mostly characterized by high specific surface area, whereas for a Mg/Si ratio above 0.7, the surface area becomes negligible. Based on all the characterization results, and on the conclusion of our thermodynamic simulation, the most probable hypothesis to explain the existence of two distinct families is the intervention of coagulation/coalescence of the particles.
Finally, the modification of the final Mg/Si ratio of the Mg silicates, by adjusting the synthesis pH, influences greatly the acid–base reactivity of the solid surfaces. In particular, the results obtained from the model reaction of 2-methylbut-3-yn-2-ol (MBOH) conversion show that it is possible to obtain silicates with purely basic properties at high Mg/Si ratios (i.e., at high pH) and that decreasing the Mg/Si ratio provides solids with both acid and basic properties.

Supplementary Materials

The following supporting information can be downloaded at: https://www.mdpi.com/article/10.3390/catal13111393/s1. Figure S1: Comparison of the Mg/Si ratio calculated from titration of solutions (Mg/Si(exp)) and obtained by X-ray fluorescence (Mg/Si), Figure S2: Logarithm of the solubility constant K(x) and corrected K’s(x) as a function of the single-phase composition (x) for (Mg/Si)theo = 0.5 (a); (Mg/Si)theo = 1.0 (b) and both (c), Figure S3: N2 adsorption-desorption isotherms, Figure S4: Crystal coherence length obtained by PDF analysis for the selected samples 05MgSiH1K0 (Mg/Si = 0.34); 1MgSiH0.5K0 (Mg/Si = 0.64); 05MgSiH0.25K0 (Mg/Si = 0.74) and 1MgSiH0K0.2 (Mg/Si = 1.0), Figure S5: PDF contribution from the 1 to 5 Å area of the samples 05MgSiH1K0 (Mg/Si = 0.34), 1MgSiH0.5K0 (Mg/Si = 0.65), 05MgSiH0.25K0 (Mg/Si = 0.74) and 1MgSiH0K0.2 (Mg/Si = 1.0); Table S1: Synthesis parameters of different magnesium silicates, Table S2: Data for the thermodynamic approach of the precipitation, Table S3: 29Si NMR chemical shift (CS, ppm), half width at half maximum (W, Hz) and relative fraction (%) of Qn species from deconvolution of the 29Si HPDEC MAS NMR spectra, Table S4a to S4i. MBOH results.

Author Contributions

F.P.: data curation, formal analysis, funding acquisition, investigation, methodology, visualization. A.I.: data curation, formal analysis, investigation, validation. J.-M.K.: formal analysis, investigation, visualization, IR experiments. Y.M.: formal analysis, investigation, visualization, NMR experiments. T.O.: formal analysis, investigation, visualization, writing—review and editing. C.S.: formal analysis, investigation, visualization, PDF experiments. J.-F.H.: conceptualization, methodology, project administration, resources, supervision, visualization, writing—review and editing. G.L.: conceptualization, project administration, supervision, visualization, writing—original draft, writing—review and editing and H.L.-P.: conceptualization, project administration, resources, supervision, writing—review and editing. All authors have read and agreed to the published version of the manuscript.

Funding

The authors thank IMPC (Institut des Matériaux de Paris Centre, FR2482) and the C′Nano projects of the Region Ile-de-France, for the SEM-FEG and NMR apparatus funding. Sandra Casale is deeply acknowledged for her important help in acquiring the SEM images.

Data Availability Statement

Raw data are available on demand.

Conflicts of Interest

The authors declare no conflict of interest.

References

  1. Mackenzie, R.C. The Classification and Nomenclature of Clay Minerals. Clay Miner. 1959, 4, 52–66. [Google Scholar] [CrossRef]
  2. Spinthaki, A.; Petratos, G.; Matheis, J.; Hater, W.; Demadis, K.D. The Precipitation of “Magnesium Silicate” under Geothermal Stresses. Formation and Characterization. Geothermics 2018, 74, 172–180. [Google Scholar] [CrossRef]
  3. Jones, S.A.; Wong, S.; Burlitch, J.M.; Viswanathan, S.; Kohlstedt, D.L. Sol−Gel Synthesis and Characterization of Magnesium Silicate Thin Films. Chem. Mater. 1997, 9, 2567–2576. [Google Scholar] [CrossRef]
  4. Ochoa, J.V.; Bandinelli, C.; Vozniuk, O.; Chieregato, A.; Malmusi, A.; Recchi, C.; Cavani, F. An Analysis of the Chemical, Physical and Reactivity Features of MgO–SiO2 Catalysts for Butadiene Synthesis with the Lebedev Process. Green Chem. 2016, 18, 1653–1663. [Google Scholar] [CrossRef]
  5. Da Ros, S.; Jones, M.D.; Mattia, D.; Schwaab, M.; Barbosa-Coutinho, E.; Rabelo-Neto, R.C.; Noronha, F.B.; Pinto, J.C. Microkinetic Analysis of Ethanol to 1,3-Butadiene Reactions over MgO-SiO2 Catalysts Based on Characterization of Experimental Fluctuations. Chem. Eng. J. 2017, 308, 988–1000. [Google Scholar] [CrossRef]
  6. Da Ros, S.; Jones, M.D.; Mattia, D.; Schwaab, M.; Noronha, F.B.; Pinto, J.C. Modelling the Effects of Reaction Temperature and Flow Rate on the Conversion of Ethanol to 1,3-Butadiene. Appl. Catal. A Gen. 2017, 530, 37–47. [Google Scholar] [CrossRef]
  7. Zhu, Q.; Wang, B.; Tan, T. Conversion of Ethanol and Acetaldehyde to Butadiene over MgO–SiO2 Catalysts: Effect of Reaction Parameters and Interaction between MgO and SiO2 on Catalytic Performance. ACS Sustain. Chem. Eng. 2017, 5, 722–733. [Google Scholar] [CrossRef]
  8. Larina, O.V.; Kyriienko, P.I.; Trachevskii, V.V.; Vlasenko, N.V.; Soloviev, S.O. Effect of Mechanochemical Treatment on Acidic and Catalytic Properties of MgO-SiO2 Composition in the Conversion of Ethanol To 1,3-Butadiene. Theor. Exp. Chem. 2016, 51, 387–393. [Google Scholar] [CrossRef]
  9. Zhang, T.; Vandeperre, L.J.; Cheeseman, C.R. Magnesium-Silicate-Hydrate Cements for Encapsulating Problematic Aluminium Containing Wastes. J. Sustain. Cem. Based Mater. 2012, 1, 34–45. [Google Scholar] [CrossRef]
  10. Walling, S.A.; Kinoshita, H.; Bernal, S.A.; Collier, N.C.; Provis, J.L. Structure and Properties of Binder Gels Formed in the System Mg(OH)2–SiO2–H2O for Immobilisation of Magnox Sludge. Dalton Trans. 2015, 44, 8126–8137. [Google Scholar] [CrossRef]
  11. Zhang, T.; Cheeseman, C.R.; Vandeperre, L.J. Development of Low pH Cement Systems Forming Magnesium Silicate Hydrate (M-S-H). Cem. Concr. Res. 2011, 41, 439–442. [Google Scholar] [CrossRef]
  12. Ridi, F.; Fratini, E.; Baglioni, P. Cement: A Two Thousand Year Old Nano-Colloid. J. Colloid. Interface Sci. 2011, 357, 255–264. [Google Scholar] [CrossRef] [PubMed]
  13. Bernard, E.; Lothenbach, B.; Rentsch, D.; Pochard, I.; Dauzères, A. Formation of Magnesium Silicate Hydrates (M-S-H). Phys. Chem. Earth 2017, 99, 142–157. [Google Scholar] [CrossRef]
  14. Tonelli, M.; Martini, F.; Calucci, L.; Fratini, E.; Geppi, M.; Ridi, F.; Borsacchi, S.; Baglioni, P. Structural Characterization of Magnesium Silicate Hydrate: Towards the Design of Eco-Sustainable Cements. Dalton Trans. 2016, 45, 3294–3304. [Google Scholar] [CrossRef] [PubMed]
  15. Chen, J.; Li, T.; Li, X.; Chou, K.-C.; Hou, X. Some New Perspective on the Reaction Mechanism of MgO-SiO2 -H2O System. Int. J. Appl. Ceram. Technol. 2016, 13, 1164–1172. [Google Scholar] [CrossRef]
  16. Li, Z.; Zhang, T.; Hu, J.; Tang, Y.; Niu, Y.; Wei, J.; Yu, Q. Characterization of Reaction Products and Reaction Process of MgO–SiO2–H2O System at Room Temperature. Constr. Build Mater. 2014, 61, 252–259. [Google Scholar] [CrossRef]
  17. Nied, D.; Enemark-Rasmussen, K.; L’Hopital, E.; Skibsted, J.; Lothenbach, B. Properties of Magnesium Silicate Hydrates (M-S-H). Cem. Concr. Res. 2016, 79, 323–332. [Google Scholar] [CrossRef]
  18. Marsiske, M.R.; Köser, R.; Bäumle, B.; Ruiz-Agudo, C. Uncovering the Early Stages of Magnesium Silicate Hydrate Formation: A Nonclassical Multistep Pathway. ACS Appl. Eng. Mater. 2023, 1, 696–707. [Google Scholar] [CrossRef]
  19. Bernard, E.; Lothenbach, B.; Chlique, C.; Wyrzykowski, M.; Dauzères, A.; Pochard, I.; Cau-Dit-Coumes, C. Characterization of Magnesium Silicate Hydrate (M-S-H). Cem. Concr. Res. 2019, 116, 309–330. [Google Scholar] [CrossRef]
  20. Brew, D.R.M.; Glasser, F.P. Synthesis and Characterisation of Magnesium Silicate Hydrate Gels. Cem. Concr. Res. 2005, 35, 85–98. [Google Scholar] [CrossRef]
  21. Roosz, C.; Grangeon, S.; Blanc, P.; Montouillout, V.; Lothenbach, B.; Henocq, P.; Giffaut, E.; Vieillard, P.; Gaboreau, S. Crystal Structure of Magnesium Silicate Hydrates (M-S-H): The Relation with 2:1 Mg–Si Phyllosilicates. Cem. Concr. Res. 2015, 73, 228–237. [Google Scholar] [CrossRef]
  22. Pedone, A.; Palazzetti, F.; Barone, V. Models of Aged Magnesium–Silicate–Hydrate Cements Based on the Lizardite and Talc Crystals: A Periodic DFT-GIPAW Investigation. J. Phys. Chem. C 2017, 121, 7319–7330. [Google Scholar] [CrossRef]
  23. Angelici, C.; Velthoen, M.E.Z.; Weckhuysen, B.M.; Bruijnincx, P.C.A. Effect of Preparation Method and CuO Promotion in the Conversion of Ethanol into 1,3-Butadiene over SiO2–MgO Catalysts. ChemSusChem 2014, 7, 2505–2515. [Google Scholar] [CrossRef] [PubMed]
  24. Angelici, C.; Velthoen, M.E.Z.; Weckhuysen, B.M.; Bruijnincx, P.C.A. Influence of Acid–Base Properties on the Lebedev Ethanol-to-Butadiene Process Catalyzed by SiO2–MgO Materials. Catal. Sci. Technol. 2015, 5, 2869–2879. [Google Scholar] [CrossRef]
  25. Chung, S.-H.; Angelici, C.; Hinterding, S.O.M.; Weingarth, M.; Baldus, M.; Houben, K.; Weckhuysen, B.M.; Bruijnincx, P.C.A. Role of Magnesium Silicates in Wet-Kneaded Silica–Magnesia Catalysts for the Lebedev Ethanol-to-Butadiene Process. ACS Catal. 2016, 6, 4034–4045. [Google Scholar] [CrossRef]
  26. Pomalaza, G.; Arango Ponton, P.; Capron, M.; Dumeignil, F. Ethanol-to-Butadiene: The Reaction and Its Catalysts. Catal. Sci. Technol. 2020, 10, 4860–4911. [Google Scholar] [CrossRef]
  27. Lin, L.; Cornu, D.; Mounir Daou, M.; Domingos, C.; Herledan, V.; Krafft, J.-M.; Laugel, G.; Millot, Y.; Lauron-Pernot, H. Role of Water on the Activity of Magnesium Silicate for Transesterification Reactions. ChemCatChem 2017, 9, 2399–2407. [Google Scholar] [CrossRef]
  28. Lin, L.; Silva Gomes, E.; Payan, F.; Jaber, M.; Krafft, J.-M.; Laugel, G.; Lauron-Pernot, H. How the Acido-Basic Properties of Mg Silicates and Clays Govern the Catalytic Mechanism of Transesterification Reactions. Catal. Sci. Technol. 2019, 9, 6072–6084. [Google Scholar] [CrossRef]
  29. Cornu, D.; Lin, L.; Daou, M.M.; Jaber, M.; Krafft, J.-M.; Herledan, V.; Laugel, G.; Millot, Y.; Lauron-Pernot, H. Influence of Acid–Base Properties of Mg-Based Catalysts on Transesterification: Role of Magnesium Silicate Hydrate Formation. Catal. Sci. Technol. 2017, 7, 1701–1712. [Google Scholar] [CrossRef]
  30. Wolf, A.; Michele, V.; Schlüter, O.F.-K.; Herbstritt, F.; Heck, J.; Mleczko, L. Precipitation in a Micromixer—From Laboratory to Industrial Scale. Chem. Eng. Technol. 2015, 38, 2017–2024. [Google Scholar] [CrossRef]
  31. Dietemann, M.; Baillon, F.; Espitalier, F.; Calvet, R.; Greenhill-Hooper, M. Amorphous Magnesium Silicate Ultrasound-Assisted Precipitation in a Mixing System: Population Balance Modelling and Crystallization Rates Identification. Powder Technol. 2019, 356, 83–96. [Google Scholar] [CrossRef]
  32. Dietemann, M.; Baillon, F.; Espitalier, F.; Calvet, R.; Accart, P.; Confetto, S.D.; Greenhill-Hooper, M. Evaluation of the Physico-Chemical Properties of an Amorphous Magnesium Silicate Synthesized by an Ultrasound-Assisted Precipitation. Chem. Eng. J. 2013, 215–216, 658–670. [Google Scholar] [CrossRef]
  33. Lauron-Pernot, H.; Luck, F.; Popa, J.M. Methylbutynol: A New and Simple Diagnostic Tool for Acidic and Basic Sites of Solids. Appl. Catal. 1991, 78, 213–225. [Google Scholar] [CrossRef]
  34. Lauron-Pernot, H. Evaluation of Surface Acido-Basic Properties of Inorganic-Based Solids by Model Catalytic Alcohol Reaction Networks. Catal. Rev. Sci. Eng. 2006, 48, 315–361. [Google Scholar] [CrossRef]
  35. Alexander, G.B. The Reaction of Low Molecular Weight Silicic Acids with Molybdic Acid. J. Am. Chem. Soc. 1953, 75, 5655–5657. [Google Scholar] [CrossRef]
  36. Sing, K.S.W.; Everett, D.H.; Haul, R.A.W.; Moscou, L.; Pierotti, R.A.; Rouquerol, J.; Siemieniewska, T. Prepared for Publication by the Subcommittee on Reporting Gas Adsorption Data Consisting. Pure Appl. Chem. 1985, 57, 603–619. [Google Scholar] [CrossRef]
  37. Li, C.; Wang, X.; Yang, A.; Chen, P.; Zhao, T.; Liu, F. Polyethyleneimine-Modified Amorphous Silica for the Selective Adsorption of CO2/N2 at High Temperatures. ACS Omega 2021, 6, 35389–35397. [Google Scholar] [CrossRef] [PubMed]
  38. Wei, J.; Yu, Q.; Zhang, W.; Zhang, H. Reaction Products of MgO and Microsilica Cementitious Materials at Different Temperatures. J. Wuhan Univ. Technol. Mater. Sci. Ed. 2011, 26, 745–748. [Google Scholar] [CrossRef]
  39. Zhang, T.; Vandeperre, L.J.; Cheeseman, C.R. Formation of Magnesium Silicate Hydrate (M-S-H) Cement Pastes Using Sodium Hexametaphosphate. Cem. Concr. Res. 2014, 65, 8–14. [Google Scholar] [CrossRef]
  40. Jin, F.; Al-Tabbaa, A. Thermogravimetric Study on the Hydration of Reactive Magnesia and Silica Mixture at Room Temperature. Thermochim. Acta 2013, 566, 162–168. [Google Scholar] [CrossRef]
  41. Liu, X.; Liu, X.; Hu, Y. Investigation of the Thermal Decomposition of Talc. Clays Clay Miner. 2014, 62, 137–144. [Google Scholar] [CrossRef]
  42. Zhang, Y.; Li, Y.; Xu, Y.; Sang, S.; Jin, S. Enhanced Formation of Magnesium Silica Hydrates (M-S-H) Using Sodium Metasilicate and Caustic Magnesia in Magnesia Castables. Ceram. Int. 2017, 43, 9110–9116. [Google Scholar] [CrossRef]
  43. Mitsuda, T.; Taguchi, H. Formation of Magnesium Silicate Hydrate and Its Crystallization to Talc. Cem. Concr. Res. 1977, 7, 223–230. [Google Scholar] [CrossRef]
  44. MacKenzie, K.J.D.; Meinhold, R.H. The Thermal Reactions of Talc Studied by 29Si and 25Mg MAS NMR. Thermochim. Acta 1994, 244, 195–203. [Google Scholar] [CrossRef]
  45. Sabatier, G. Recherches sur la cristallisation par chauffage de mélanges amorphes de silice et des oxydes de magnésium, zinc et cuivre. Bull. Minéralogie 1952, 75, 506–526. [Google Scholar] [CrossRef]
  46. Tang, Q.; Wang, F.; Tang, M.; Liang, J.; Ren, C. Study on Pore Distribution and Formation Rule of Sepiolite Mineral Nanomaterials. J. Nanomater. 2012, 2012, 382603. [Google Scholar] [CrossRef]
  47. Mora, M.; Isabel López, M.; Ángeles Carmona, M.; Jiménez-Sanchidrián, C.; Rafael Ruiz, J. Study of the Thermal Decomposition of a Sepiolite by Mid- and near-Infrared Spectroscopies. Polyhedron 2010, 29, 3046–3051. [Google Scholar] [CrossRef]
  48. Viti, C. Serpentine Minerals Discrimination by Thermal Analysis. Am. Mineral. 2010, 95, 631–638. [Google Scholar] [CrossRef]
  49. Liao, J.; Senna, M. Thermal Behavior of Mechanically Amorphized Talc. Thermochim. Acta 1992, 197, 295–306. [Google Scholar] [CrossRef]
  50. Aglietti, E.F. The Effect of Dry Grinding on the Structure of Talc. Appl. Clay Sci. 1994, 9, 139–147. [Google Scholar] [CrossRef]
  51. Martini, F.; Tonelli, M.; Geppi, M.; Ridi, F.; Borsacchi, S.; Calucci, L. Hydration of MgO/SiO2 and Portland Cement Mixtures: A Structural Investigation of the Hydrated Phases by Means of X-ray Diffraction and Solid State NMR Spectroscopy. Cem. Concr. Res. 2017, 102, 60–67. [Google Scholar] [CrossRef]
  52. Zhang, Y.; Li, Y.; Dai, Y. Formation of Magnesium Silicate Hydrate in the Mg(OH)2-SiO2 Suspensions and Its Influence on the Properties of Magnesia Castables. Ceram. Int. 2018, 44, 21365–21373. [Google Scholar] [CrossRef]
  53. Musić, S.; Filipović-Vinceković, N.; Sekovanić, L. Precipitation of Amorphous SiO2 Particles and Their Properties. Braz. J. Chem. Eng. 2011, 28, 89–94. [Google Scholar] [CrossRef]
  54. Maddalena, R.; Hall, C.; Hamilton, A. Effect of Silica Particle Size on the Formation of Calcium Silicate Hydrate [C-S-H] Using Thermal Analysis. Thermochim. Acta 2019, 672, 142–149. [Google Scholar] [CrossRef]
  55. Chen, H.; Geng, J.; Zhang, Z.; Jiang, R.; Zhai, J.; Zhang, J. The Structure and Properties of Sepiolite with Partial Lattice Ions Substituted by Aluminum Ions. Front. Chem. 2021, 9, 721225. [Google Scholar] [CrossRef] [PubMed]
  56. Suárez, M.; García-Romero, E. Variability of the Surface Properties of Sepiolite. Appl. Clay Sci. 2012, 67–68, 72–82. [Google Scholar] [CrossRef]
  57. Rivero Crespo, M.A.; Pereira Gómez, D.; Villa García, M.V.; Gallardo Amores, J.M.; Sánchez Escribano, V. Characterization of Serpentines from Different Regions by Transmission Electron Microscopy, X-ray Diffraction, BET Specific Surface Area and Vibrational and Electronic Spectroscopy. Fibers 2019, 7, 47. [Google Scholar] [CrossRef]
  58. Dumas, A.; Martin, F.; Le Roux, C.; Micoud, P.; Petit, S.; Ferrage, E.; Brendlé, J.; Grauby, O.; Greenhill-Hooper, M. Phyllosilicates Synthesis: A Way of Accessing Edges Contributions in NMR and FTIR Spectroscopies. Example of Synthetic Talc. Phys. Chem. Miner. 2013, 40, 361–373. [Google Scholar] [CrossRef]
  59. Kogure, T.; Kameda, J.; Matsui, T.; Miyawaki, R. Stacking Structure in Disordered Talc: Interpretation of Its X-ray Diffraction Pattern by Using Pattern Simulation and High-Resolution Transmission Electron Microscopy. Am. Mineral. 2006, 91, 1363–1370. [Google Scholar] [CrossRef]
  60. Balek, V.; Šubrt, J.; Pérez-Maqueda, L.A.; Beneš, M.; Bountseva, I.M.; Beckman, I.N.; Pérez-Rodríguez, J.L. Thermal Behavior of Ground Talc Mineral. J. Min. Metall. B 2008, 44, 7–17. [Google Scholar] [CrossRef]
  61. Takeshi, E.; Billinge, S.J.L. Chapter 3—The Method of Total Scattering and Atomic Pair Distribution Function Analysis. In Pergamon Materials Series; Egami, T., Billinge, S.J.L., Eds.; Elsevier: Pergamon, Turkey, 2012; Volume 16, pp. 55–111. ISBN 1470-1804. [Google Scholar]
  62. Masson, O.; Thomas, P. Exact and Explicit Expression of the Atomic Pair Distribution Function as Obtained from X-ray Total Scattering Experiments. J. Appl. Crystallogr. 2013, 46, 461–465. [Google Scholar] [CrossRef]
  63. Billinge, S.J.L.; Kanatzidis, M.G. Beyond Crystallography: The Study of Disorder, Nanocrystallinity and Crystallographically Challenged Materials with Pair Distribution Functions. Chem. Commun. 2004, 7, 749–760. [Google Scholar] [CrossRef] [PubMed]
  64. Petkov, V. Nanostructure by High-Energy X-ray Diffraction. Mat. Today 2008, 11, 28–38. [Google Scholar] [CrossRef]
  65. Farrow, C.L.; Billinge, S.J.L. Relationship between the Atomic Pair Distribution Function and Small-Angle Scattering: Implications for Modeling of Nanoparticles. Acta Crystallogr. A Found. Adv. 2009, 65, 232–239. [Google Scholar] [CrossRef]
  66. Terban, M.W.; Billinge, S.J.L. Structural Analysis of Molecular Materials Using the Pair Distribution Function. Chem. Rev. 2022, 122, 1208–1272. [Google Scholar] [CrossRef]
  67. Rosasco, G.J.; Blaha, J.J. Raman Microprobe Spectra and Vibrational Mode Assignments of Talc. Appl. Spectrosc. 1980, 34, 140–144. [Google Scholar] [CrossRef]
  68. Wang, A.; Freeman, J.J.; Jolliff, B.L. Understanding the Raman Spectral Features of Phyllosilicates. J. Raman Spectrosc. 2015, 46, 829–845. [Google Scholar] [CrossRef]
  69. Rinaudo, C.; Gastaldi, D.; Belluso, E. Characterization of Chrysotile, Antigorite and Lizardite by FT-Raman Spectroscopy. Can. Mineral. 2003, 41, 883–890. [Google Scholar] [CrossRef]
  70. Biswas, R.K.; Khan, P.; Mukherjee, S.; Mukhopadhyay, A.K.; Ghosh, J.; Muraleedharan, K. Study of Short Range Structure of Amorphous Silica from PDF Using Ag Radiation in Laboratory XRD System, RAMAN and NEXAFS. J. Non Cryst. Solids 2018, 488, 1–9. [Google Scholar] [CrossRef]
  71. Hong, W.-E.; Ro, J.-S. Kinetics of Solid Phase Crystallization of Amorphous Silicon Analyzed by Raman Spectroscopy. J. Appl. Phys. 2013, 114, 073511. [Google Scholar] [CrossRef]
  72. Alessi, A.; Agnello, S.; Buscarino, G.; Gelardi, F.M. Raman and IR Investigation of Silica Nanoparticles Structure. J. Non Cryst. Solids 2013, 362, 20–24. [Google Scholar] [CrossRef]
  73. Alessi, A.; Agnello, S.; Buscarino, G.; Gelardi, F.M. Structural Properties of Core and Surface of Silica Nanoparticles Investigated by Raman Spectroscopy. J. Raman Spectrosc. 2013, 44, 810–816. [Google Scholar] [CrossRef]
  74. Lippmaa, E.; Maegi, M.; Samoson, A.; Engelhardt, G.; Grimmer, A.R. Structural Studies of Silicates by Solid-State High-Resolution Silicon-29 NMR. J. Am. Chem. Soc. 1980, 102, 4889–4893. [Google Scholar] [CrossRef]
  75. Magi, M.; Lippmaa, E.; Samoson, A.; Engelhardt, G.; Grimmer, A.R. Solid-State High-Resolution Silicon-29 Chemical Shifts in Silicates. J. Phys. Chem. 1984, 88, 1518–1522. [Google Scholar] [CrossRef]
  76. Temuujin, J.; Okada, K.; MacKenzie, K.J.D. Role of Water in the Mechanochemical Reactions of MgO–SiO2 Systems. J. Solid State Chem. 1998, 138, 169–177. [Google Scholar] [CrossRef]
  77. Bernard, E.; Lothenbach, B.; Le Goff, F.; Pochard, I.; Dauzères, A. Effect of Magnesium on Calcium Silicate Hydrate (C-S-H). Cem. Concr. Res. 2017, 97, 61–72. [Google Scholar] [CrossRef]
  78. Zhang, T.; Zou, J.; Wang, B.; Wu, Z.; Jia, Y.; Cheeseman, C. Characterization of Magnesium Silicate Hydrate (MSH) Gel Formed by Reacting MgO and Silica Fume. Materials 2018, 11, 909. [Google Scholar] [CrossRef]
  79. Janssens, W.; Makshina, E.V.; Vanelderen, P.; De Clippel, F.; Houthoofd, K.; Kerkhofs, S.; Martens, J.A.; Jacobs, P.A.; Sels, B.F. Ternary Ag/MgO-SiO2 Catalysts for the Conversion of Ethanol into Butadiene. ChemSusChem 2015, 8, 994–1008. [Google Scholar] [CrossRef]
  80. d’Espinose de la Caillerie, J.-B.; Kermarec, M.; Clause, O. 29Si NMR Observation of an Amorphous Magnesium Silicate Formed during Impregnation of Silica with Mg(II) in Aqueous Solution. J. Phys. Chem. 1995, 99, 17273–17281. [Google Scholar] [CrossRef]
  81. Holland, T.J.B.; Powell, R. An Internally Consistent Thermodynamic Data Set for Phases of Petrological Interest. J. Metamorph. Geol. 1998, 16, 309–343. [Google Scholar] [CrossRef]
  82. Iler, R.K. The Chemistry of Silica; John Wiley and Sons: New York, NY, USA, 1979; ISBN 978-0-471-02404-0. [Google Scholar]
  83. Bergna, H.E. Colloid Chemistry of Silica. In The Colloid Chemistry of Silica; Advances in Chemistry; American Chemical Society: Washington, DC, USA, 1994; Volume 234, pp. 1–47. ISBN 978-0-8412-2103-1. [Google Scholar]
  84. Liu, H.C.; Wang, J.X.; Mao, Y.; Chen, R.S. The Preparation and Growth of Colloidal Particles of Concentrated Silica Sols. Colloids Surf. A Physicochem. Eng. Asp. 1993, 74, 7–13. [Google Scholar] [CrossRef]
  85. Di Patrizio, N.; Bagnaro, M.; Gaunand, A.; Hochepied, J.-F.; Horbez, D.; Pitiot, P. Hydrodynamics and Mixing Performance of Hartridge Roughton Mixers: Influence of the Mixing Chamber Design. Chem. Eng. J. 2016, 283, 375–387. [Google Scholar] [CrossRef]
  86. Juhás, P.; Davis, T.; Farrow, C.L.; Billinge, S.J.L. PDFgetX3: A Rapid and Highly Automatable Program for Processing Powder Diffraction Data into Total Scattering Pair Distribution Functions. J. Appl. Crystallogr. 2013, 46, 560–566. [Google Scholar] [CrossRef]
  87. Massiot, D.; Fayon, F.; Capron, M.; King, I.; Le Calvé, S.; Alonso, B.; Durand, J.-O.; Bujoli, B.; Gan, Z.; Hoatson, G. Modelling One- and Two-Dimensional Solid-State NMR Spectra: Modelling 1D and 2D Solid-State NMR Spectra. Magn. Reson. Chem. 2002, 40, 70–76. [Google Scholar] [CrossRef]
Figure 1. Influence on the synthesis pH of additions of HNO3 and KOH for (Mg/Si)theo ratio of 0.5 (a) and 1.0 (b).
Catalysts 13 01393 g001
Figure 2. Mg/Si ratio of the precipitated solids for (Mg/Si)theo ratio of 0.5 (a) and 1.0 (b). Points highlighted in orange exhibit Mg/Si ratio values close to the theoretical values indicated by the blue dashed lines.
Catalysts 13 01393 g002
Figure 3. SEM images for samples representing the family with high SBET: 05MgSiH1K0 (Mg/Si = 0.34) (a) and 1MgSiH0.66K0 (Mg/Si = 0.55) (b).
Catalysts 13 01393 g003
Figure 4. SEM images for samples representing the family with high SBET: 05MgSiH0.25K0 (Mg/Si = 0.74) (a) and 1MgSiH0K0.2 (Mg/Si = 1.0) (b).
Catalysts 13 01393 g004
Figure 5. TGA–DTA curves for a sample with SBET (1MgSiH0.5K0) (a) and with negligible SBET (05MgSiH0.25K0) (b).
Catalysts 13 01393 g005
Figure 6. XRD patterns for selected samples: 05MgSiH1K0 (Mg/Si = 0.34); 1MgSiH0.5K0 (Mg/Si = 0.65); 05MgSiH0.25K0 (Mg/Si = 0.74); and 1MgSiH0K0.2 (Mg/Si = 1.0).
Catalysts 13 01393 g006
Figure 7. Raman spectra in the region between 200 and 1200 cm−1 of 05MgSiH1K0 (Mg/Si = 0.34); 1MgSiH0.5K0 (Mg/Si = 0.65); 05MgSiH0.25K0 (Mg/Si = 0.74); and 1MgSiH0K0.2 (Mg/Si = 1.0).
Catalysts 13 01393 g007
Figure 8. 29Si HPDEC MAS NMR spectra of the samples: (a) 05MgSiH1K0, (b) 1MgSiH1K0, (c) 1MgSiH0.66K0, (d) 05MgSiH0.5K0, (e) 05MgSiH1K0.5, (f) 05MgSiH0.34K0, (g) 1MgSiH0.5K0, (h) 05MgSiH0K0, (i) 05MgSiH0.25K0, (j) 1MgSiH0K0 and (k) 1MgSiH0K0.2.
Catalysts 13 01393 g008
Figure 9. Ratio Q3/Q2 of samples 05MgSiH1K0, 1MgSiH1K0, 1MgSiH0.66K0, 05MgSiH0.5K0, 05MgSiH1K0.5, 05MgSiH0.34K0, 1MgSiH0.5K0, 05MgSiH0K0 05MgSiH0.25K0, 1MgSiH0K0 and 1MgSiH0K0.2.
Catalysts 13 01393 g009
Scheme 1. Reactivity of MBOH on acidic and basic sites.
Catalysts 13 01393 sch001
Table 1. Main structural characteristics of the samples presenting a measurable specific surface area. As described in the “Materials and Methods” section, the samples are labelled rMgSiHAKB, with r: (Mg/Si)theo molar ratio; A: [HNO3]in/[Si]in ratio; B: [KOH]in/[Si]in ratio.
ID SamplespH(s)Mg/SiSBET
(m2·g−1)
VP
(cm3·g−1)
DP
(nm)
05MgSiH0.34K011.00.632200.7914.3
05MgSiH0.5K010.40.562020.438.6
05MgSiH1K08.80.341870.408.8
05MgSiH1K0.259.40.483250.8011.4
05MgSiH1K0.349.80.522670.8212.6
05MgSiH1K0.510.40.582720.669.6
1MgSiH1K08.40.383580.568.7
1MgSiH0.66K09.20.553160.8811.7
1MgSiH0.5K09.40.652380.526.5
Table 2. Catalytic activity in MBOH conversion for 1MgSiH1K0 (SBET = 358 m2·g−1; Mg/Si = 0.38; K/Si = 0.02).
Time on
Stream (min)
Conv
(%)
C Balance
(%)
S(Mbyne)
(%)
S(C2H2)
(%)
S(acetone)
(%)
Conv(BET)
(%)
Y(acidic)
(%)
Y(basic)
(%)
2139241518734
15999134146514
28899104149404
4179894150404
5469994051303
Table 3. Catalytic activity in MBOH conversion for all Mg silicates in terms of selectivity and yield in acidic route. The catalytic results are obtained after 2 min of time on stream. Mg/Si and K/Si ratios are also given. As described in the “Materials and Methods” section, samples are labelled rMgSiHAKB, with r: (Mg/Si)theo molar ratio; A: [HNO3]in/[Si]in ratio; B: [KOH]in/[Si]in ratio.
SampleConv(BET)
(%)
S(Mbyne)
(%)
Y(acidic)
(%)
Mg/SiK/Si
05MgSiH1K071720.340.03
05MgSiH1K0.2581210.480.05
05MgSiH1K0.3412410.520.06
05MgSiH0.5K012000.560.10
05MgSiH1K0.512100.580.09
05MgSiH0.34K013100.630.08
1MgSiH1K074140.380.02
1MgSiH0.66K0122740.550.01
1MgSiH0.5K0131320.650.00
Disclaimer/Publisher’s Note: The statements, opinions and data contained in all publications are solely those of the individual author(s) and contributor(s) and not of MDPI and/or the editor(s). MDPI and/or the editor(s) disclaim responsibility for any injury to people or property resulting from any ideas, methods, instructions or products referred to in the content.

