Article

Partially Reduced Ni-NiO-TiO2 Photocatalysts for Hydrogen Production from Methanol–Water Solution

1
Department of Physical Chemistry, Faculty of Chemical Technology, University of Pardubice, Studentská 573, 53210 Pardubice, Czech Republic
2
Institute of Environmental Technology, CEET, VŠB-Technical University of Ostrava, 17. Listopadu 2172/15, 70800 Ostrava, Czech Republic
*
Author to whom correspondence should be addressed.
Catalysts 2023, 13(2), 293; https://doi.org/10.3390/catal13020293
Submission received: 5 January 2023 / Revised: 19 January 2023 / Accepted: 27 January 2023 / Published: 28 January 2023
(This article belongs to the Section Photocatalysis)

Abstract

:
The study compares the photocatalytic behavior of TiO2, NiO-TiO2, and Ni-NiO-TiO2 photocatalysts in photocatalytic hydrogen production from methanol–water solution. TiO2 and NiO-TiO2 photocatalysts with theoretical NiO loading of 0.5, 1.0, and 3.0 wt. % of NiO were prepared by the sol–gel method. The Ni-NiO-TiO2 photocatalysts were prepared by partial reduction of NiO-TiO2 in hydrogen at 450 °C. The Ni-NiO-TiO2 photocatalysts showed significantly higher hydrogen production than the NiO-TiO2 photocatalysts. The structural, textural, redox, and optical properties of all of the prepared photocatalysts were studied by using XRD, SEM, N2- adsorption, XPS, H2-TPR, and DRS. Attention is focused on the contribution of Ni loading, the surface composition (Ni2+, the lattice O2− species, and OH groups), the distribution of Ni species (dispersed NiO species, crystalline NiO phase, and the metallic Ni0 species), oxygen vacancies, TiO2 modification, the TiO2 crystallite size, and the specific surface area.

Graphical Abstract

1. Introduction

The energy crisis caused by the negative economic and environmental impacts of the currently used energy technologies (using fossil fuel combustion) accelerates the need to develop new sustainable technologies. Energy technologies using hydrogen as a fuel (fuel cells and direct combustion) are gaining significant support and space. However, their practical use is severely limited by the costly production of hydrogen (electrolysis and oil reforming). Therefore, new alternative hydrogen production processes are being explored. The photocatalytic decomposition of water and aqueous alcohol solutions is among the most promising ones.
Since the 1970s, when Fujishima and Honda published their revolutionary article [1], many reviews have been published on photocatalytic water splitting [2,3,4,5,6,7] and hydrogen production from alcohol–water solution [8,9,10]. This revolutionary technology of hydrogen production has attracted enormous attention from all over the world. However, even 50 years after the success of Fujishima and Honda, the technology is nowhere near industrial application. The current state-of-the-art solar to hydrogen efficiency is around 10% [9]. Research is mainly focused on TiO2-based photocatalysts. There are countless ways to modify the properties of TiO2 to increase its efficiency toward hydrogen production. Transition metals serving as cocatalysts seem to be the most effective ones. It is widely accepted that noble metals can serve as electron traps resulting in a reduced recombination rate of charge carriers [11]. The disadvantage of noble metals is their cost. However, there are other, much cheaper, and at the same time effective transition metals. For example, doping TiO2 with various forms of nickel particles is one of the options [12,13,14,15,16,17,18,19,20,21,22,23]. More recently, high hydrogen production has been reported for many different photocatalysts, e.g., two-dimensional (2D) few-layered MoSe2 deposited on CdS nanorods [24], porous Ni-Co-Fe ternary metal phosphides nanobricks (denoted as Ni-Co-Fe-P NBs) [25], biochar-supported photocatalytic systems [26], bi-functional photocatalysts, e.g., hetero-phase Mo2C-CoO@N-CNFs film [27], Ni/NiFe2O4 core–shell nanospheres [28], or plasmon coupled inside 2D-like TiB2 flakes [29].
In general, the presence of Ni, like all other transition metals, stabilizes the anatase against phase transformation, reduces the particle size and thus increases the total area of the external surface of the photocatalyst (m2.g−1), prolongs the lifetime of the electrons and holes pairs, and enhances the absorption of visible light [30]. The authors explain the increased efficiency of the photocatalytic reactions of nickel-doped TiO2 by extending the band structure of TiO2 by additional energy and potential levels and their application in charge transfer [23]. The benefit of combining TiO2 with NiO lies in the creation of p-n heterojunction type II [31,32] which leads to the formation of the internal electric field, better charge separation and thus increases the concentration of charge carriers [17,33,34]. TiO2 is an n-type semiconductor and NiO is a p-type semiconductor and their connection leads to a significantly improved separation of charge carriers. The higher photocatalytic performance of NiO-TiO2 materials compared to pristine TiO2 has been observed not only for the water splitting reaction [18,35,36,37], but also for the photocatalytic decomposition of organic compounds [22,31,38]. Nevertheless, a high surface charge concentration is associated with the formation of undesirable charge traps and recombination centers, which can reduce of the yield of surface redox reactions [39].
When TiO2 is doped with metallic Ni (most often metallic Ni on the surface of TiO2 is formed by a certain treatment of the oxidized form [18,40]), the formation of a Schottky barrier was observed [21]. This conductive connection of metallic Ni with TiO2 leads to efficient charge separation, which significantly improves the photocatalytic activity of these materials [11]. Recently, TiO2 photocatalysts modified with both NiO and metallic Ni where a Ni-NiO-TiO2 heterojunction is formed were presented [15,16,21]. The band structure of these materials fundamentally affects the photocatalytic properties [40], especially when used for the water splitting reaction. The authors explain the improvement of the photocatalytic behavior of the NiO-Ni-TiO2 heterostructures by forming a conductive connection between TiO2 and NiO via metallic nickel and by suppressing oxygen generation. However, direct evidence of the existence of such structures has not yet been published. As indirect evidence, the authors report the increased photocatalytic activity of Ni-NiO-TiO2, the formation of core–shell structure observed by SEM or the presence of Ni and NiO surface particles observed by XPS. In addition, these materials are presented as active in the visible region of the light spectrum [15,16,21].
In this manuscript, attention is focused on NiO-TiO2 and Ni-NiO-TiO2 photocatalysts. The NiO-TiO2 photocatalysts were reduced to Ni-NiO-TiO2 photocatalysts, containing both metallic Ni particles and NiO species. Such preparation enables a defined comparison of the photocatalytic behavior of these materials, as well as their key properties. This is because NiO-TiO2 and Ni-NiO-TiO2 prepared by reduction of the original NiO-TiO2 forms pairs with the same Ni loading. In detail, the contribution of total Ni loading, the distribution of NiO and metallic Ni0 species, oxygen vacancies, surface oxygen species, phase modification, TiO2 crystallite size, and specific surface area to the photocatalytic behavior of NiO-TiO2 photocatalysts and Ni-NiO-TiO2 photocatalysts is analyzed.

2. Results and Discussion

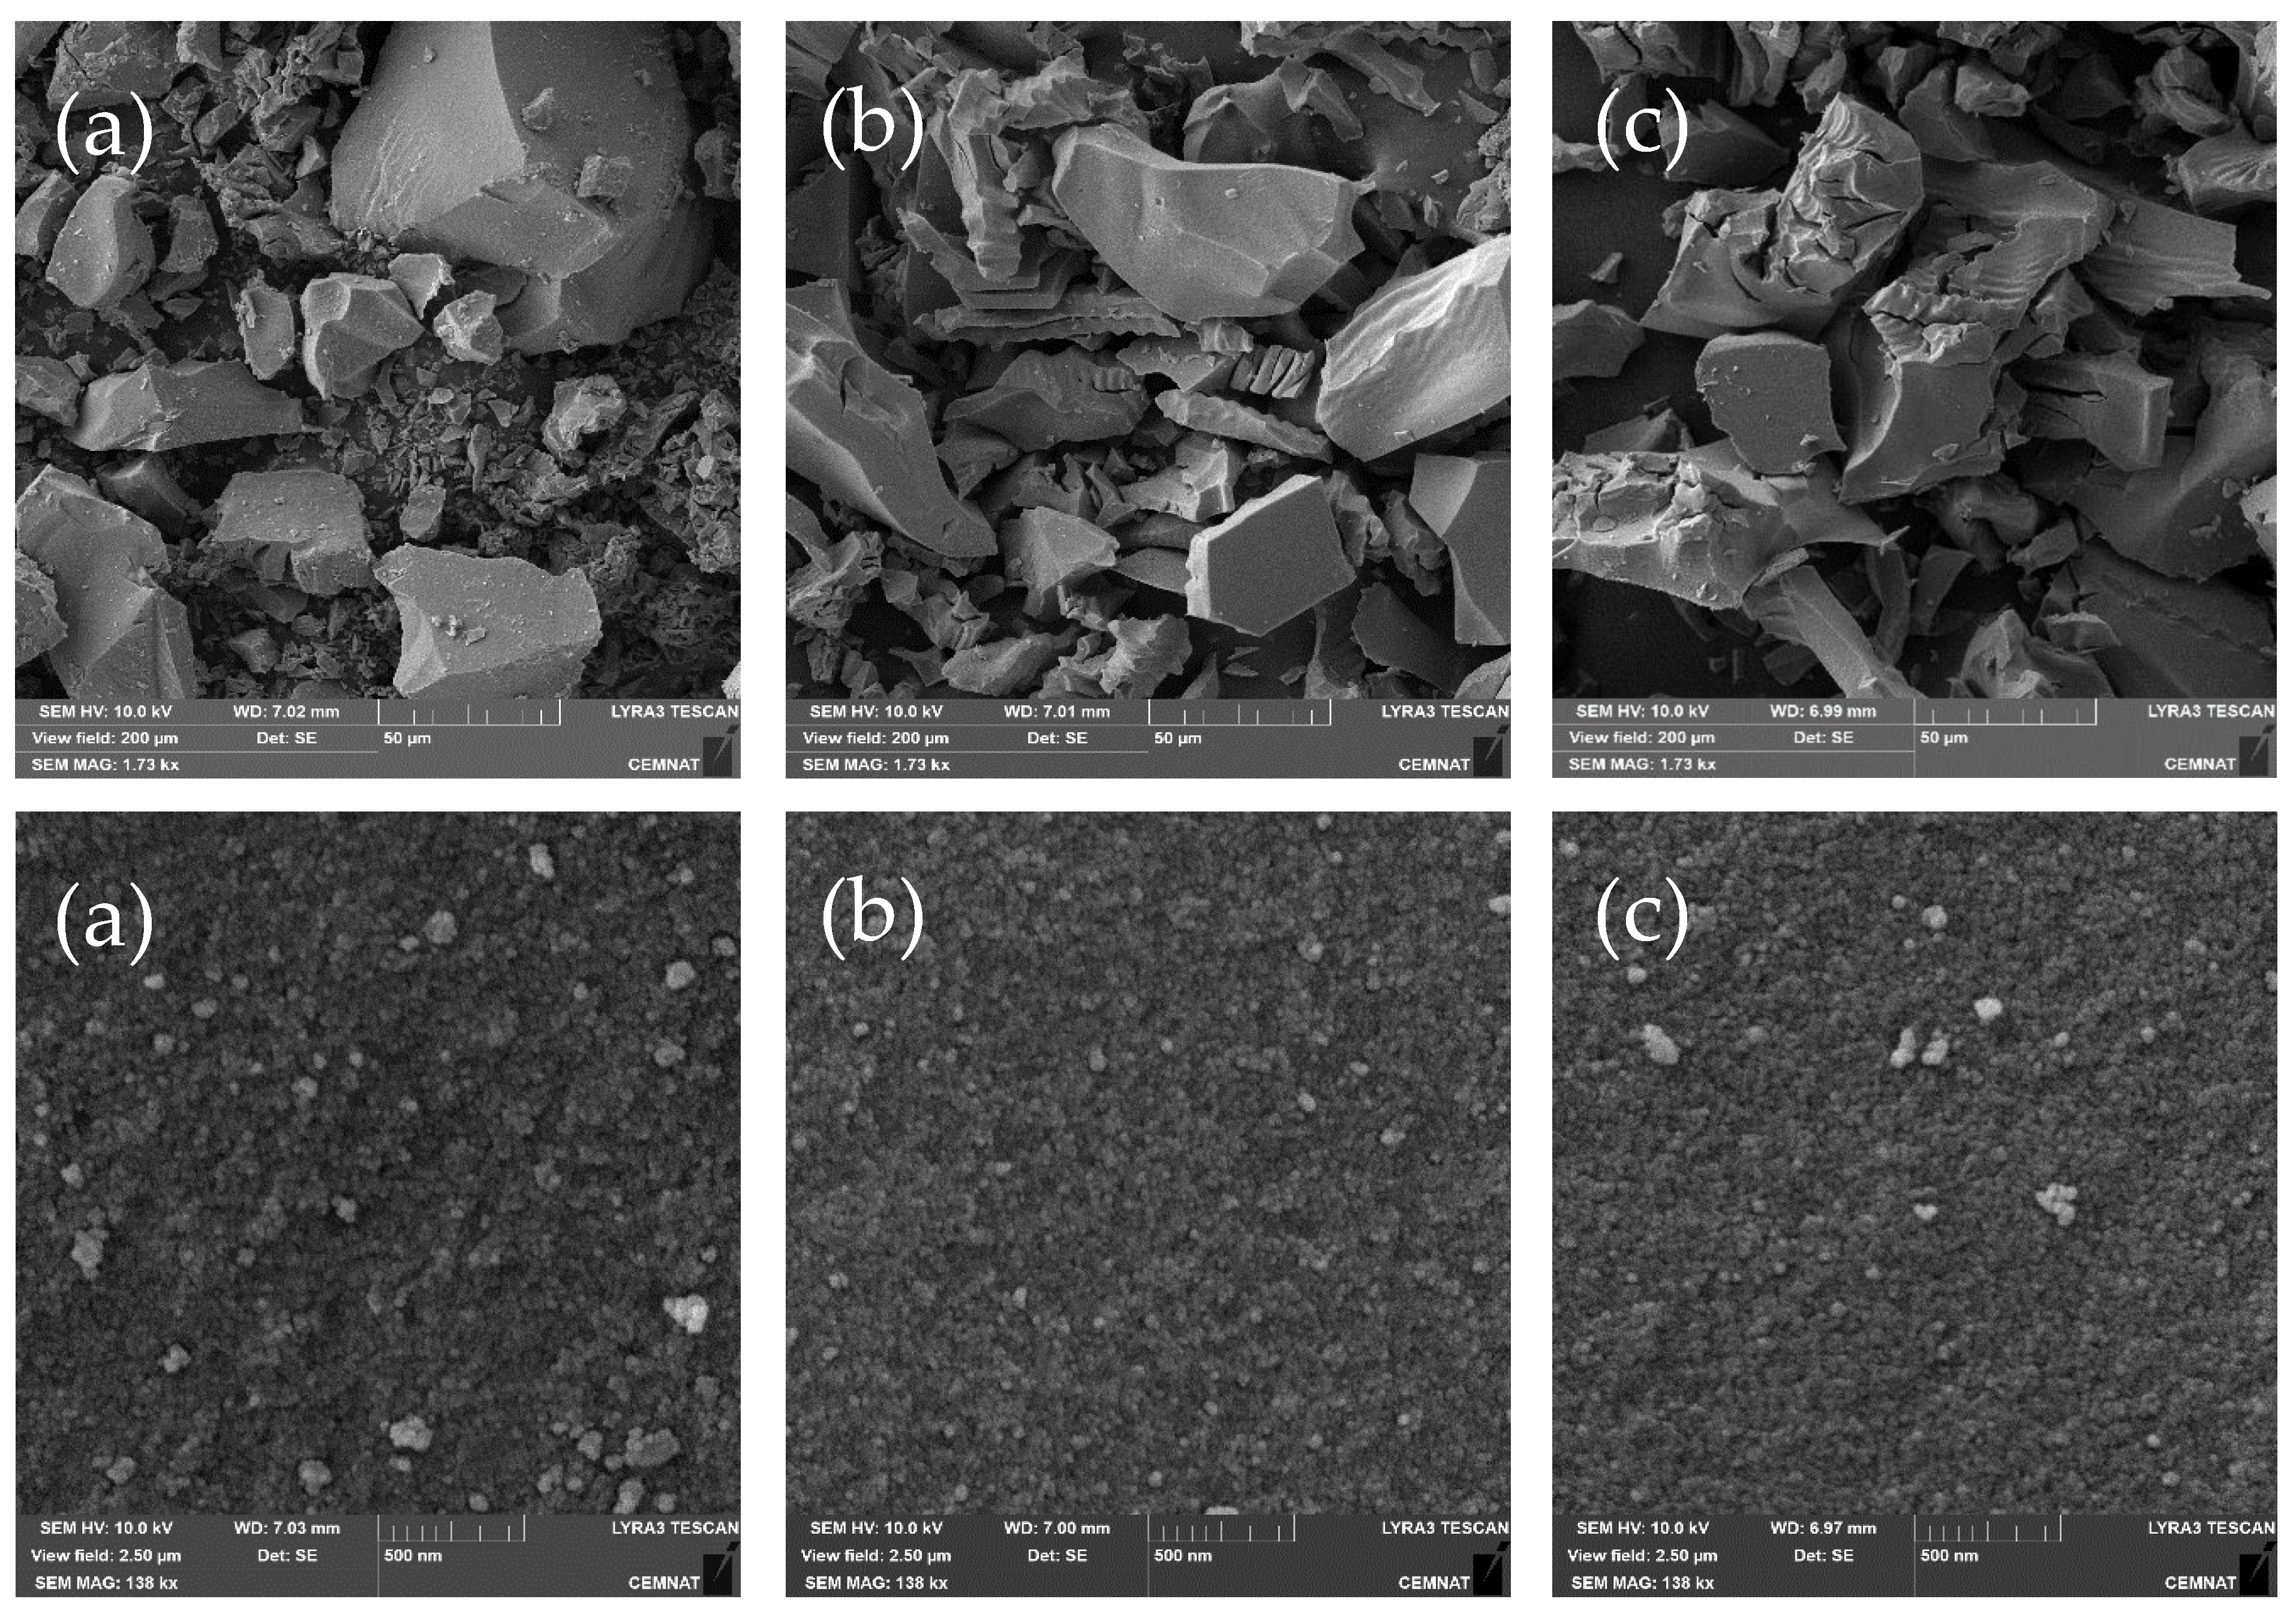
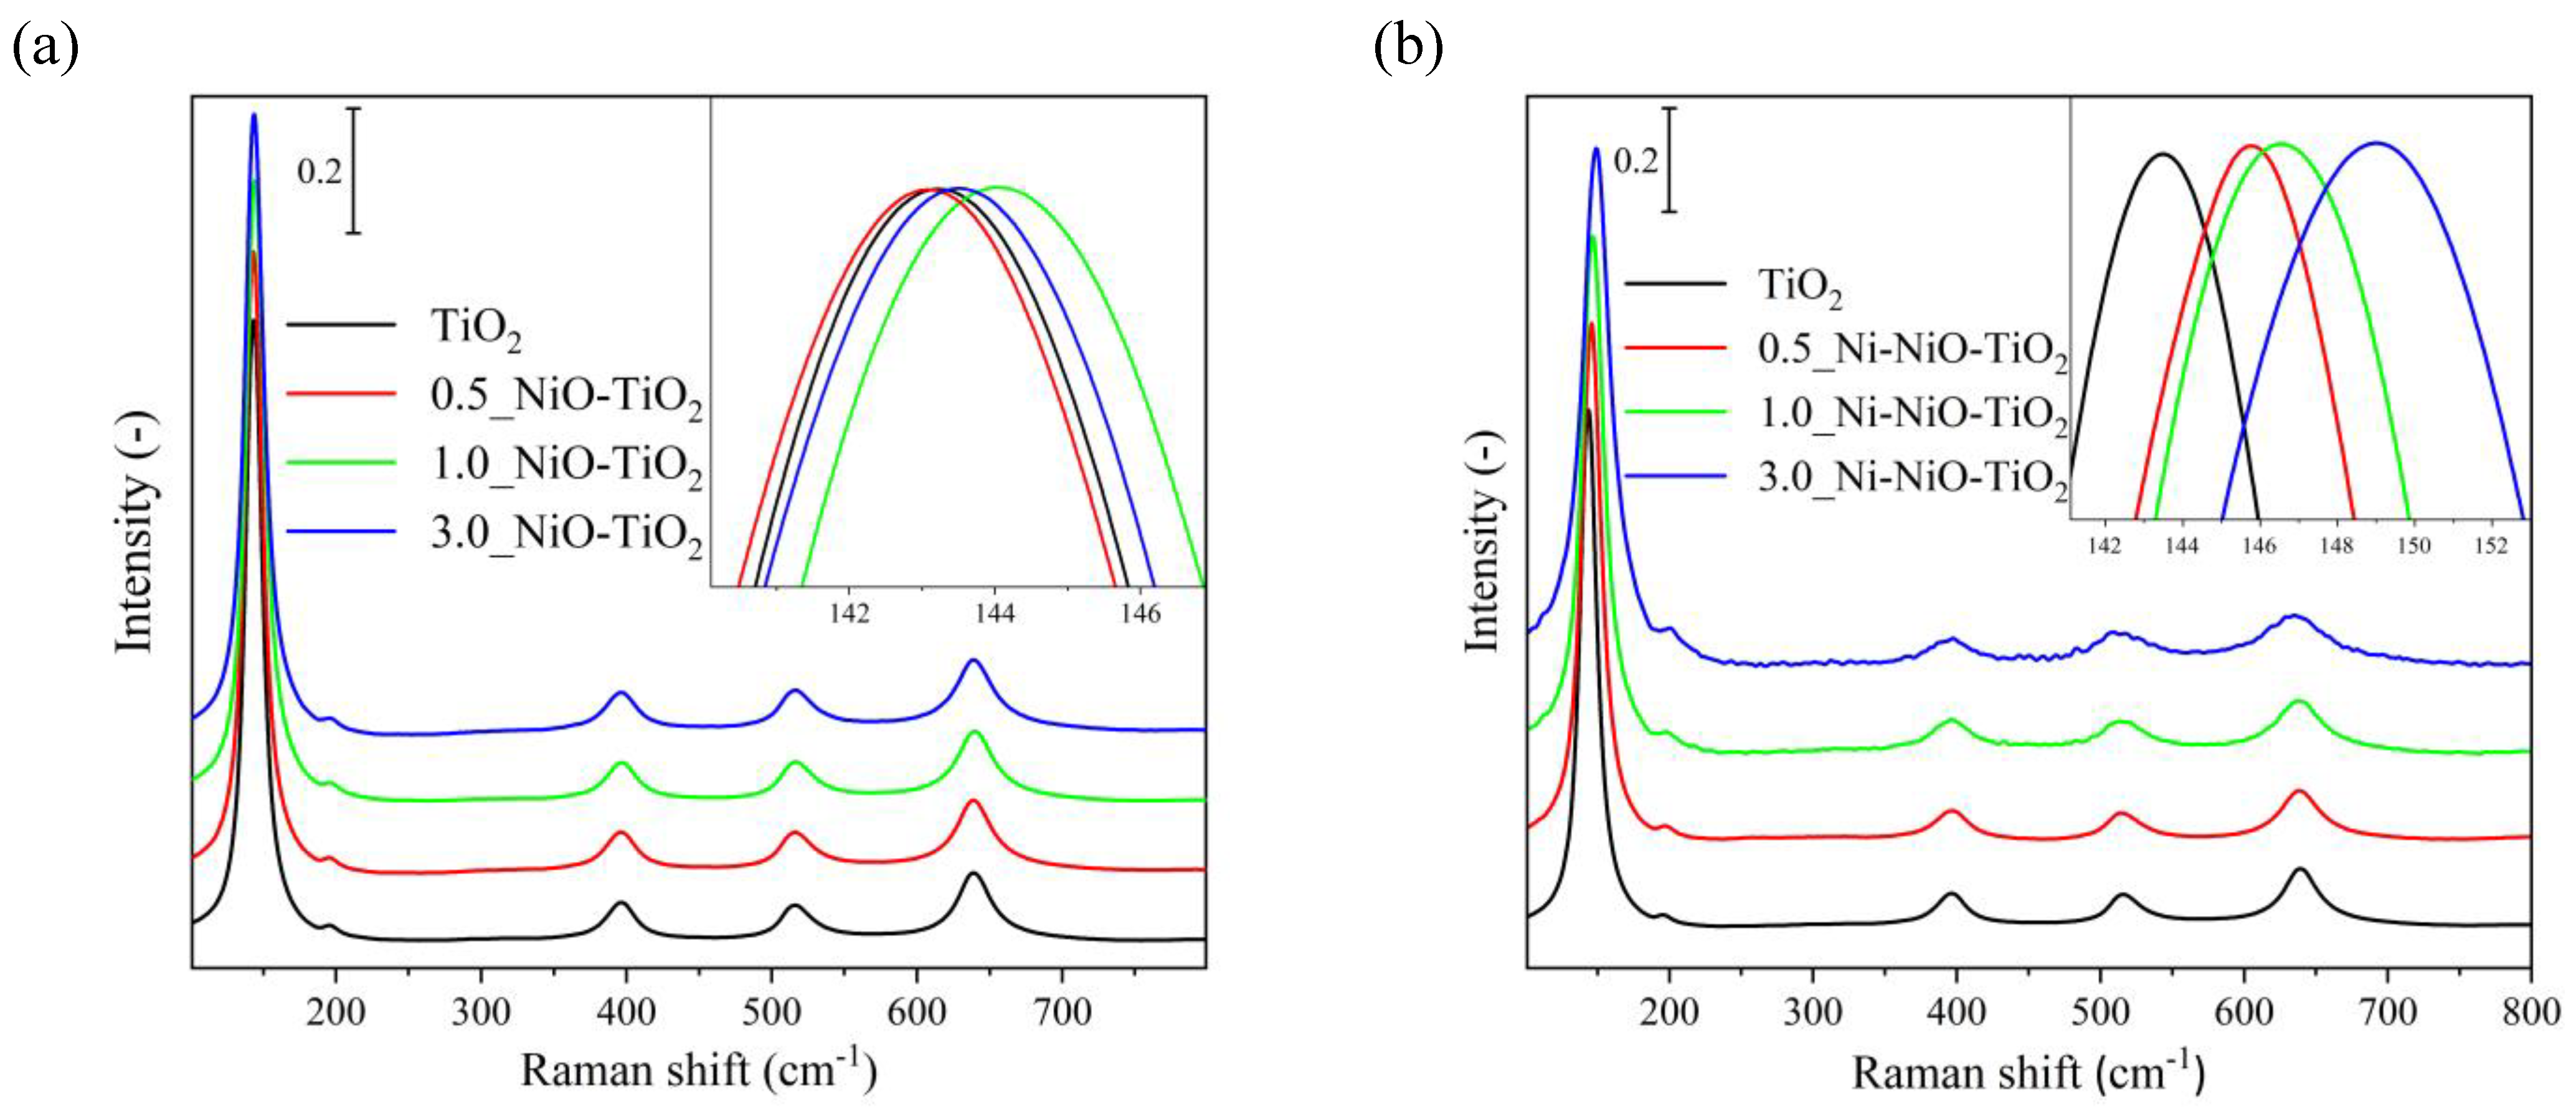
2.1. Photocatalysts’ Characterization

The surface phase composition and crystallite size of all of the prepared photocatalysts were determined by XRD spectroscopy (Figure 1). The XRD patterns of all of the presented photocatalysts contain dominant diffraction lines with 2θ at 25.3, 38.1, 48.1, 53.9, 55.1, 62.7, 69.2, 70.1, and 75.2°, which are typical for anatase phase modification of TiO2 (PDF-2 card No. 00-064-0863). No other crystalline TiO2 phase was detected in any of the studied samples as summarized in Table 1. The exclusive formation of anatase is consistent with the use of precursors in a sol–gel method of TiO2 synthesis.
The XRD pattern of the 3.0_NiO-TiO2 photocatalyst (Figure 1a) contains a diffraction line at 2θ 43.1° assigned to NiO (PDF-2 card No. 01-089-7130). The rest of the characteristic diffraction lines of NiO (at 38 and 62°) are overlapped by intensive diffraction lines of anatase TiO2. 3.0_NiO-TiO2 contained a mass fraction of the crystalline NiO phase 1.0 wt. %, which shows the presence of well-dispersed and/or amorphous NiO species not detected by XRD. The XRD pattern of the partially reduced 3.0_Ni-NiO-TiO2 material shows diffraction lines at 2θ at 44, 52, and 76°, which can be assigned to the metallic Ni0 species (PDF-2 card No. 01-071-4653). After partial NiO reduction, 3.0_Ni-NiO-TiO2 contained a mass fraction of metallic Ni0 of 2.1 wt. %. The mass fraction of 2.1 wt. % Ni0 is after recalculation equal to the mass fraction of NiO 2.7 wt. % which was reduced. This confirms the statement that not all NiO species were detectable by XRD in 3.0_NiO-TiO2. It means that approximately 90 % of the NiO in 3.0_NiO-TiO2 was reduced to the metallic Ni0 during its reduction to 3.0_Ni-NiO-TiO2 (assuming the actual NiO content in 3.0_NiO-TiO2 corresponds to the theoretical amount of NiO and the crystalline Ni0 phase detected by XRD corresponds to the total amount of Ni0 particles presented in 3.0_Ni-NiO-TiO2).
The detection limits of the XRD technique for crystalline NiO and Ni phases, the presence of amorphous phases, and/or the assumed high dispersion of NiO and Ni0 species on the surface of TiO2 [34] can be reasons for the fact that the diffraction lines for NiO and Ni species are not determined in the diffractograms of 0.5_ NiO-TiO2, 0.5_Ni-NiO-TiO2, 1.0 NiO-TiO2, and 1.0 Ni-NiO-TiO2 photocatalysts.
As evident from Table 1, the TiO2 crystallite sizes of all of the NiO-TiO2 and Ni-NiO-TiO2 materials are lower compared to pure TiO2. This is in agreement with the literature statements that the addition of Ni species decreases the value of the crystal size of TiO2 [30]; however, no systematic trend with an additional increase in the Ni amount in the material is observed.
BET adsorption isotherms were measured for TiO2, 1.0_NiO-TiO2, and 1.0_Ni-NiO-TiO2 materials. The specific surface areas of these materials were 64 m2.g−1 for TiO2, 84 m2.g−1 for 1.0_NiO-TiO2 and 79 m2.g−1 for 1.0_Ni-NiO-TiO2. The results show that the presence of nickel species caused a slight increase in the specific surface area in contrast to pure TiO2, but the H2/Ar reduction of the 1.0_NiO-TiO2 material does not affect the specific surface area of 1.0_Ni-NiO-TiO2. Figure 2 shows SEM images of TiO2, 1.0_NiO-TiO2 and 1.0_Ni-NiO-TiO2 materials. The morphology of 1.0_NiO-TiO2 and 1.0_Ni-NiO-TiO2 seems to be similar. No significant agglomerates of NiO or Ni0 were observed.
Figure 3 shows the DR spectra of NiO-TiO2 materials. The spectra of all of the studied NiO-TiO2 materials showed the absorption edge at around 3.0 eV, typical for TiO2 materials prepared by the sol–gel method in a reverse micellar environment [41]. Firstly, it is evident that the increasing amount of NiO in the NiO-TiO2 materials leads to a slight decrease in the band gap energy. However, with an increasing amount of Ni loading, it is no longer possible to determine the value of the band gap energy as the shape of the spectra of NiO-TiO2 photocatalysts is affected by the presence of other bands belonging to Ni-based species and overlapping the absorption edge, as is evident from the spectra of pure NiO (see upper graph in Figure 3). It distorts the precise band gap energy determination for NiO-TiO2 materials. The band at 1.7 eV could be attributed to the octahedral nickel species in NiO [42,43,44]. Other bands characteristic of the presence of NiO at 3.0 eV and 3.2 eV are overlapped by the band of TiO2. The DR spectra of Ni-NiO-TiO2 materials were not possible to obtain due to the dark color of the resulting materials.
The Raman spectra of all of the photocatalysts contain absorption bands around 144, 195, 396, 517, and 639 cm−1 (Figure 4) that can be ascribed to the anatase phase of TiO2 [45]. Raman bands typical for other phase modifications of TiO2 (rutile or brookite) were not detected, which is in agreement with the XRD results. No Raman bands that could be assigned to NiO or other Ni species were observed even for the 3.0_NiO-TiO2 and 3.0_Ni-NiO-TiO2 materials with the highest amount of Ni. This observation is in contrast to the XRD results, but it can be explained by the low sensitivity of Raman spectroscopy for NiO species. It could also be explained by the high dispersion of NiO species on the TiO2 surface [17]. Based on XRD, 3.0_NiO-TiO2 contained the mass fraction of well-crystalline NiO species of 1.0 wt. %, so the rest of the NiO should be in the form of amorphous or well-dispersed NiO species.
The inlet pictures in Figure 4a,b show detailed information about the position of the band at around 144 cm−1. It has been published that the position of the maxima of this band is related to the amount of defects or impurities in titania breaking the long-range translation crystal symmetry in the TiO2 lattice and to the particle size of the material [17,46,47]. More specifically, the presence of the maxima of this band can be shifted to higher wavenumber values by increased amounts of oxygen vacancies and/or the decreased crystallite size of TiO2 [39,47]. While in the case of NiO-TiO2 photocatalysts (Figure 4a) the position of this dominant band in Raman spectra changes slightly with increasing Ni content, a significant shift to a higher wavenumbers is observed in the case of reduced Ni-NiO-TiO2 photocatalysts (Figure 4b). As all NiO-TiO2 and Ni-NiO-TiO2 photocatalysts possess approximately similar crystallite sizes of TiO2 (Table 1), the shift of the maxima of this band could reflect only the content of oxygen vacancies. From that point of view, all of the NiO-TiO2 photocatalysts possessed approximately the same amount of oxygen vacancies. On the other hand, the amount of oxygen vacancies increased significantly in Ni-NiO-TiO2 materials with increasing Ni loading. Thus, the coexistence of Ni0 and NiO species in Ni-NiO-TiO2 resulted in the formation of oxygen vacancies. For details, see Refs. [47,48] describing the role of the particle size and the amount of oxygen vacancies on the shift of the maxima of this Raman band.
The H2-TPR profiles of the TiO2 and NiO-TiO2 photocatalysts are presented in Figure 5a. The low-intensity reduction peak with a maximum at around 570 °C (peak III) in the TPR profile of the pure TiO2 corresponds to the reduction of residual organic species from the synthesis process (both the temperature of the calcination and the reduction were 450 °C). This peak is presented in the profiles of all of the photocatalysts, but with increasing nickel content, the background intensity becomes more marginal because it is overlapped by significant reduction peaks of NiO. The position of the reduction peak reflects the strength of the interaction between NiO and TiO2. The stronger the interactions between TiO2 and NiO, the greater the shift of the reduction peak to higher temperatures [49]. As shown in Figure 5a, there are two thermal regions where reduction peaks of NiO are located. The higher thermal peaks are located between 400–600 °C and the lower thermal peaks are in the range of 300–400 °C of the TPR profiles. This observation points to the heterogeneity of NiO particles on the surface of TiO2 [49]. Simultaneously, higher thermal peaks are of a broad shape, and their maxima shift to lower temperatures with increasing Ni content in the material. The low thermal peaks are sharp in shape and the position of the maxima is slightly shifting to a lower temperature with increasing Ni content in the material.
Based on this observation and according to the literature [50], it can be assumed that at low concentrations of NiO in the 0.5_NiO-TiO2 material, highly dispersed and strongly interacting NiO is formed. This is evident from the dominant reduction peak at the high thermal region (peak II). Its reducibility increases with the increasing amount of NiO as evident from the shift of this reduction (peak II) to the lower temperature, i.e., from 520 °C for 0.5_NiO-TiO2 to 430 °C for 3.0_NiO-TiO2 (Figure 5a). Another reduction peak is formed at the low thermal region (peak I), which can be attributed to the presence of the NiO aggregates, which only weakly interact with the TiO2 surface and are therefore easily reducible at low temperatures in a narrow thermal range (peak I). The reduction peak I corresponds to the presence of NiO, i.e., both the amorphous and crystalline NiO phase detected diffraction lines at 2θ = 38 and 62 ° (Figure 1a) and the absorption band at 1.7 eV (Figure 3) for 3.0_NiO-TiO2. It can be concluded that the dispersed fraction of NiO on TiO2 (peak II) and NiO aggregates (peak I) are detectable by H2-TPR. This also explains why only 1.0 wt. % of crystalline NiO phase was observed in 3.0_NiO-TiO2.
Figure 5b presents the reduction profiles of Ni-NiO-TiO2 photocatalysts obtained from NiO-TiO2 by their partial reduction at 450 °C. The change in the TPR profiles of NiO-TiO2 and the appropriate Ni-NiO-TiO2 materials shows a change in the distribution of nickel particles present in these materials. Although it is difficult to quantify the amount of NiO reduced to the metallic Ni0, the proportion of reduced NiO to Ni0 differs with increasing nickel content in the material, as is evident from the different areas of the reduction peak of NiO-TiO2 materials up to the 450 °C. It is evident that the dominant higher thermal peak (peak II) for NiO-TiO2 materials is suppressed in the profiles of reduced Ni-NiO-TiO2 photocatalysts. However, it is surprising that the TPR profiles of the reduced Ni-NiO-TiO2 materials possessed some reduction peaks below 450 °C, i.e., below the temperature at which the NiO-TiO2 photocatalysts were partially reduced to the Ni-NiO-TiO2 photocatalysts. The reduction peak at the low thermal region (peak I) could be attributed to the presence of NiO aggregates. Its presence could be explained by the reorganization of the surface NiO species and the formation of new NiO aggregates during the partial reduction of NiO-TiO2 materials.
Table 2 shows the surface composition of NiO-TiO2 and Ni-NiO-TiO2 photocatalysts determined by XPS. The Ti, O, Ni, and C species on the surface of the NiO-TiO2 and Ni-NiO-TiO2 photocatalysts were evidenced. Firstly, it should be mentioned that the XPS proves the presence of surface carbon species (atomic concentration in the range of 12.77–16.02 %), residuals of organic molecules used in synthesis which were not decomposed at the treatment temperature of 450 °C and whose presence was also proven by the reduction (peak III) in the TPR profiles of all of the studied materials. Secondly, all of the materials show two photoelectron peaks at 458.1 and 463.8 eV, which correspond to Ti 2p3/2 and Ti 2p1/2 levels and confirm the existence of Ti4+. Thirdly, three surface oxygen species can be distinguished (C=O, Ti-O, and OH groups). While the atomic concentration of lattice O2− species (the peak at 529.3–529.7 eV) decreased with increasing Ni loading in NiO-TiO2 materials, its concentration was approximately the same in Ni-NiO-TiO2 photocatalysts (with the exception of 0.5_Ni-NiO-TiO2). No clear correlation was observed between the concentration of hydroxyl groups (peak at 531.5 ± 0.3 eV) and the Ni loading in the samples. Finally, the surface composition of Ni2+ could reflect the presence of NiO species. If we recalculate the atomic concentration of Ni2+ to the mass fraction of NiO (see Table 2, the last column), we obtain the values 0.32, 2.35, and 5.16 of wt. % of NiO in 0.5_NiO-TiO2, 1.0_NiO-TiO2, and 3.0_NiO-TiO2 materials, respectively. Therefore, the surface concentration of NiO species is higher than the amount of NiO expected based on the amount of used precursors during material synthesis. It reflects a higher location of NiO species on the surface of materials than in the bulk.
The relative change in the concentration of NiO species in NiO-TiO2 and the appropriate Ni-NiO-TiO2 species (before and after partial reduction, last column in Table 2) was calculated. The calculated reduction efficiency was approximately 25% of NiO to the metallic Ni0 during the partial reduction of 0.5_NiO-TiO2 to 0.5_Ni-NiO-TiO2, approximately 14% of NiO to the metallic Ni0 during the partial reduction of 1.0_NiO-TiO2 to 1.0_Ni-NiO-TiO2 and approximately 67% of NiO to the metallic Ni0 during the partial reduction of 3.0_NiO-TiO2 to 3.0_Ni-NiO-TiO2. For comparison, XRD (crystalline phase composition) proved the reduction of at least 90% of NiO to the metallic Ni0 during the reduction of 3.0_NiO-TiO2 to 3.0_Ni-NiO-TiO2. In principle, NiO-TiO2 photocatalysts were reduced by the same process as previously used for the reduction of NiO-Al2O3 materials. In that case, Ni-NiO- Al2O3 with the mixed structure of Ni and NiO was obtained. Since the same reduction procedure was used in the case of NiO-TiO2 reduction, it could be assumed that both forms, i.e., Ni and NiO are in contact with the TiO2 support. This mixed structure significantly enhances the photoactivity of the studied materials. Both the Schottky barrier and the generated internal electric field between the p-n semiconductors are exploited here. This process effectively refrains the abundant electron-hole pairs from recombining and provides more active electrons.

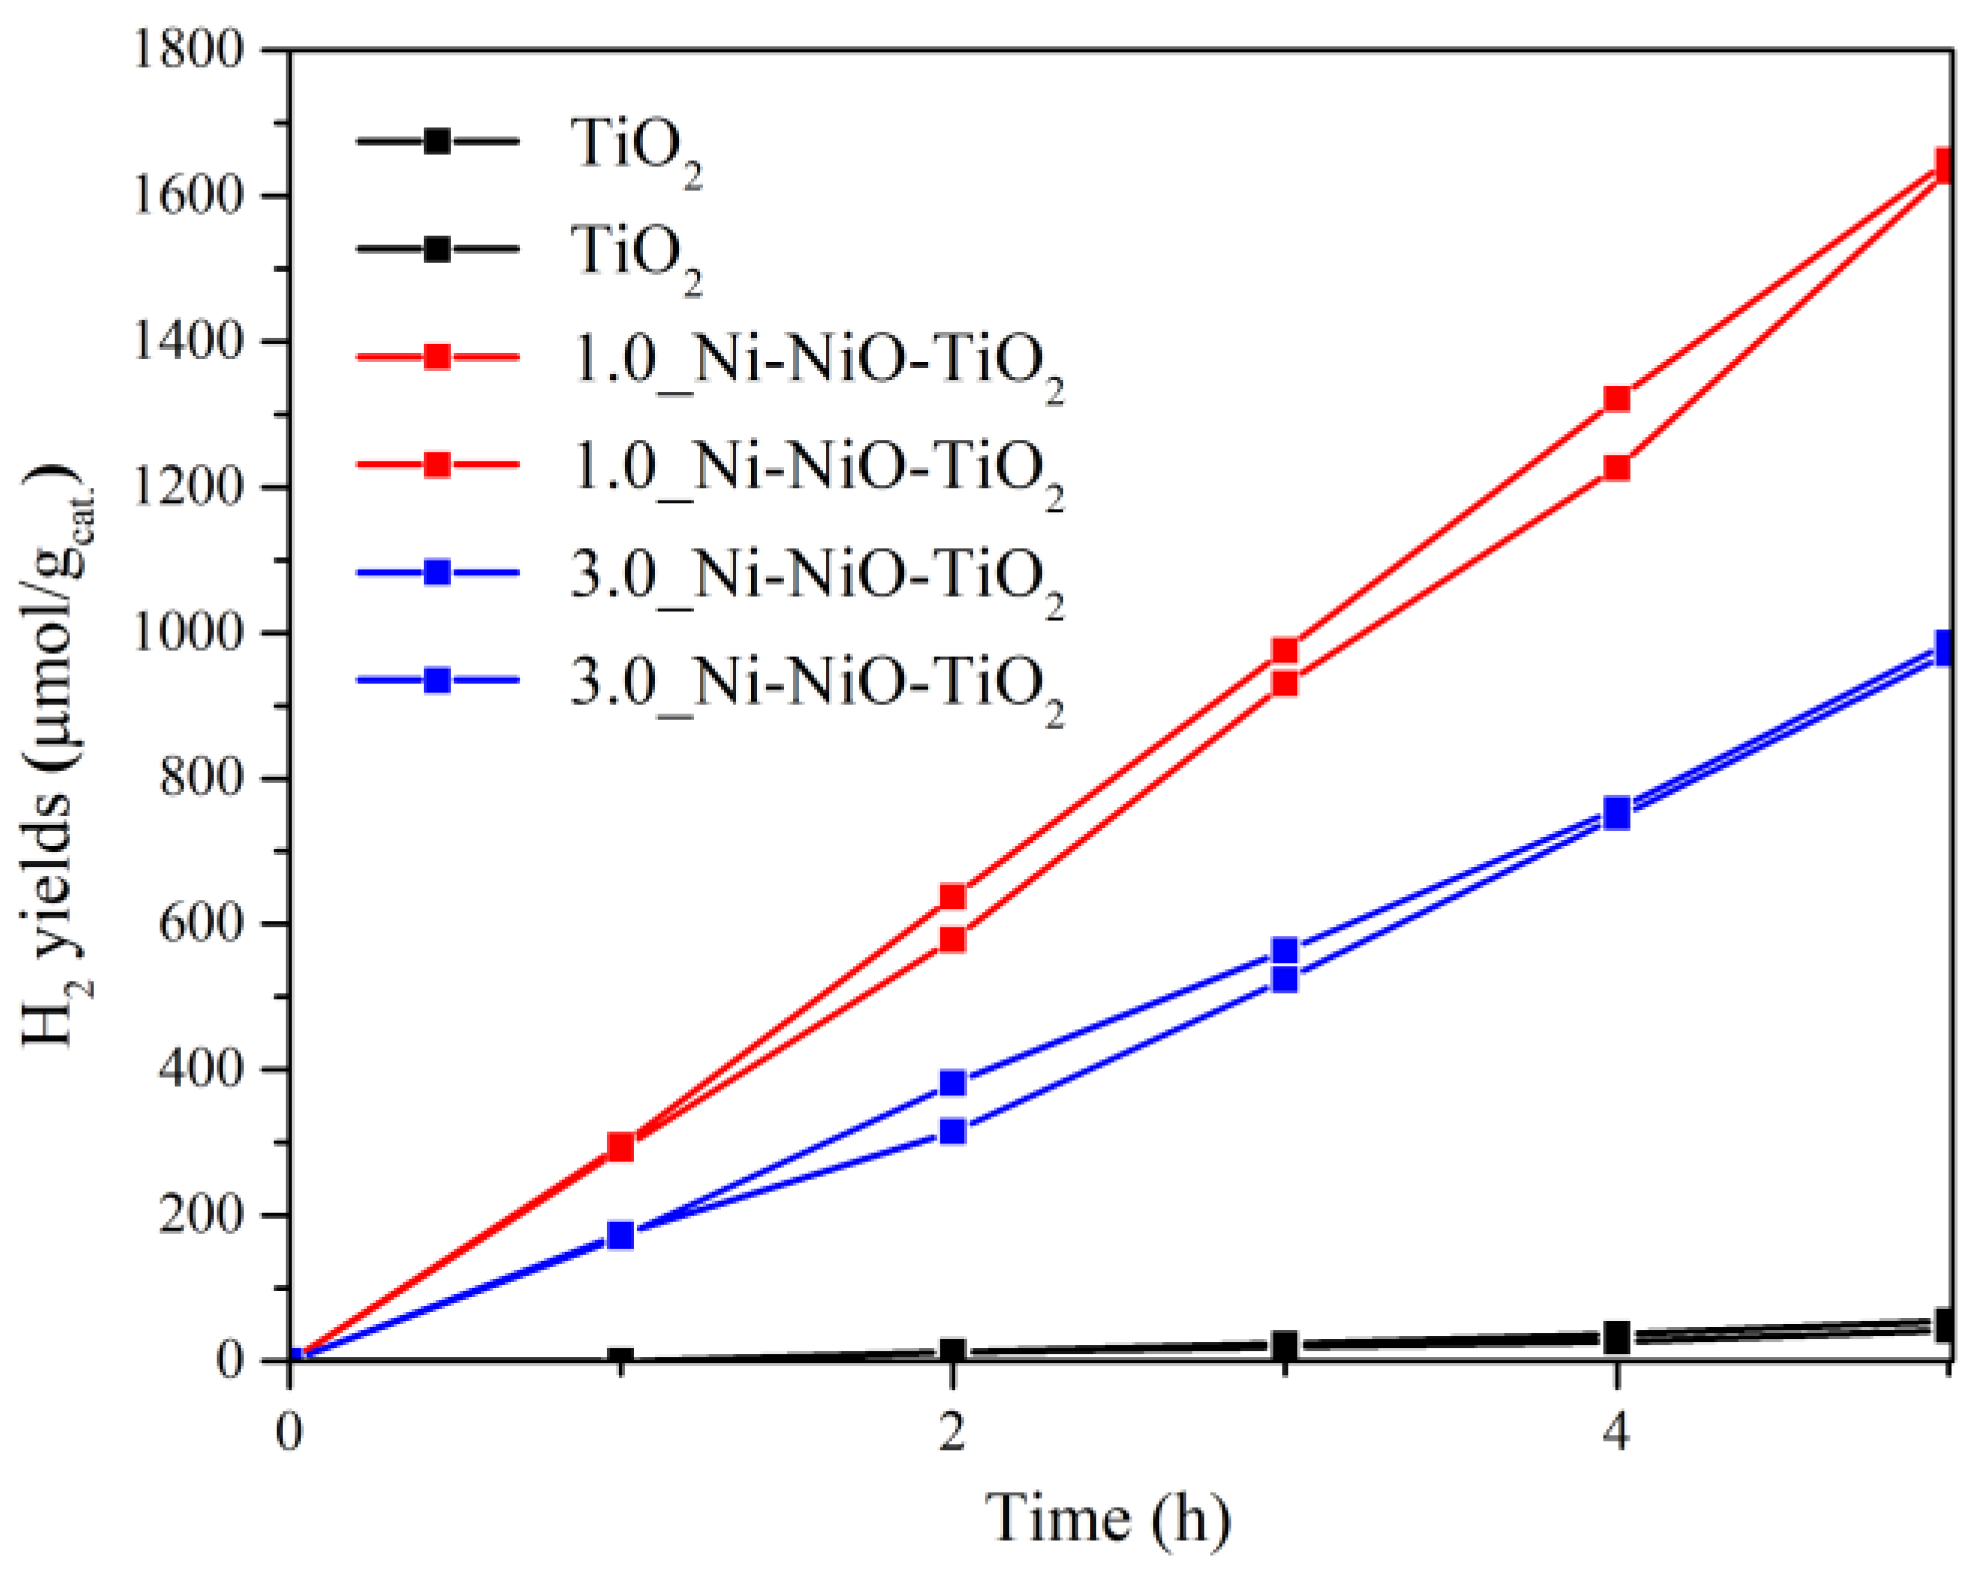
2.2. Photocatalytic Hydrogen Production

Figure 6 shows the amount of hydrogen produced from the methanol–water solution in the presence of the TiO2, NiO-TiO2 (Figure 6a), and Ni-NiO-TiO2 (Figure 6b) photocatalysts. As can be seen, the lowest production of H2 was detected with pure TiO2 (42 µmol.gcat−1). The addition of NiO to TiO2 significantly promotes the production of hydrogen in the presence of NiO-TiO2 photocatalysts compared to TiO2. However, the amount of produced hydrogen only slightly increased with the increasing NiO content in the NiO-TiO2 photocatalysts.
The partial reduction of NiO-TiO2 to Ni-NiO-TiO2 resulted in a significant increase in the production of hydrogen during photocatalytic tests with Ni-NiO-TiO2 in comparison to NiO-TiO2, as shown in Figure 6b. The significant increase in H2 production can be connected to the co-presence of NiO and metallic Ni0 species on the surface of TiO2. While the amount of produced H2 increased five times in the case of 0.5_Ni-NiO-TiO2 and 3.0_Ni-NiO-TiO2 photocatalysts, in the case of 1.0_Ni-NiO-TiO2, the H2 production increased even nearly ten times (Figure 6) compared to the oxidized NiO-TiO2 material. A slight increase in H2 production was also observed with pure calcined TiO2 (42 µmol.gcat−1) after its reduction (56 µmol.gcat−1).
To verify the reproducibility of the measured results, the photocatalytic test was repeated twice for each photocatalyst. Figure 7 demonstrates the excellent agreement of both measurements on selected photocatalysts (pure TiO2 and 1.0_Ni-NiO-TiO2 and 3.0_Ni-NiO-TiO2).

2.3. The Contribution of Photocatalysts Properties to Its Photocatalytic Behaviour

The photocatalytic behavior of the NiO-TiO2 and Ni-NiO-TiO2 materials is a complex system reflecting their optical and electrochemical properties. In this manuscript, the studied materials differ in Ni loading, the amount of dispersed NiO species (H2-TPR: peak II), the amount of crystalline NiO phase (XRD and H2-TPR: peak I), oxygen vacancies (Raman), and atomic concentration of lattice O2− species (XPS). On the other hand, the studied materials possessed approximately the same phase modification of TiO2 (anatase), TiO2 crystallite size, and SBET. It should be noted that the absence of a clear correlation between hydrogen production and any of the abovementioned parameters indicates the influence of multiple properties of these materials.
For 3.0_NiO-TiO2, the amount of produced hydrogen slightly increased compared to the other NiO-TiO2 samples (Figure 8). It can be attributed to an increased surface concentration of NiO species determined by XPS (Table 2). On the other hand, in the case of the partially reduced samples, 1.0_Ni-NiO-TiO2 led to the formation of a higher hydrogen amount than 3.0_Ni-NiO-TiO2 (Figure 8), although 3.0_Ni-NiO-TiO2 possessed a higher amount of the sum of NiO and Ni0 species. This indicates that the main role is not the total Ni content (NiO species + metallic Ni0 species), but the mutual ratio of both types of these particles. For 1.0_Ni-NiO-TiO2, the reduction of 16% of NiO to the metallic Ni0 was determined based on XPS. For 3.0_Ni-NiO-TiO2, it was determined that there was a reduction of 67% of NiO to the metallic Ni0 based on XPS and 90% of NiO to the metallic Ni0 based on XRD.
Nevertheless, the exact mechanism would be very hard to determine. However, a few assumptions can be made. First of all, there is a p-n heterojunction between TiO2 and NiO. The NiO is a p-type semiconductor (the Fermi level is closer to the valence band) and the TiO2 is an n-type semiconductor (the Fermi level is closer to the conduction band). Their Fermi levels equalize when in contact and a heterojunction is created, which promotes the separation of electrons and holes [35]. Second of all, the Schottky barrier between TiO2 and Ni [21], where electrons migrate to Ni particles present on the TiO2 surface and increase the amount of electrons available for reduction half reaction, cannot be neglected. It is clear that both of these connections (the heterojunction and Schottky barrier) are present in the Ni-NiO-TiO2 samples and are responsible for significantly higher activity compared to the NiO-TiO2 samples. However, the higher activity of 1.0_Ni-NiO-TiO2 compared to 3.0_Ni-NiO-TiO2 can be explained differently. Even though both connections are present in both samples, the sample with a higher Ni content shows lower activity. Based on the characterization results, almost 90% of NiO was reduced to Ni0 in the 3.0_Ni-NiO-TiO2 sample. It is clear that the ratio of Ni0/Ni2+ plays a very important role in the photocatalytic activity of these complex materials [15].
It is also widely accepted that oxygen vacancies strongly influence photocatalytic activity and while all of the NiO-TiO2 exhibited marginal differences in their oxygen vacancies, the number of oxygen vacancies increased with increasing Ni-loading in Ni-NiO-TiO2 and it was higher in Ni-NiO-TiO2 than in the NiO-TiO2 materials (see Figure 4). Thus, it might be concluded that the oxygen vacancies present in Ni-NiO-TiO2 contribute to higher hydrogen formation in contrast to NiO-TiO2. It is a correct statement without any doubt, but since the 3.0_Ni-NiO-TiO2 sample contains the highest amount of oxygen vacancies, but has lower activity, it can be assumed that oxygen vacancies play a marginal role in these complex materials and the main reason behind the high photocatalytic activity is in the Schottky barrier, heterojunction, and the ratio of Ni0/Ni2+ species.

3. Conclusions

The Ni-NiO-TiO2 photocatalysts produced a significantly higher amount of hydrogen in contrast to the NiO-TiO2 photocatalysts.
For the NiO-TiO2 photocatalysts, the amount of evolved hydrogen increased with the increasing surface concentration of NiO species (XPS). The increase in NiO loading also resulted in a decrease in the total amount of surface oxygen species (the sum of lattice O2− species and the hydroxyl groups) or, more specifically, a decrease in the amount of the lattice O2− species. However, it should be mentioned that such a decrease in surface oxygen species was not observed for the Ni-NiO-TiO2 photocatalysts.
For the Ni-NiO-TiO2 photocatalysts, the amount of hydrogen increased with the increasing surface concentration of NiO species (XPS) and not with the total amount of Ni-species in the Ni-NiO-TiO2 photocatalysts (the sum of NiO and metallic Ni0 species). This indicates the significant role of the mutual ratio of NiO and the metallic Ni0 species in Ni-NiO-TiO2 on its photocatalytic behavior. In addition, the coexistence of NiO and Ni0 species results in the formation of a higher amount of oxygen defects in the Ni-NiO-TiO2 photocatalysts than in the NiO-TiO2 photocatalysts.
While the studied NiO-TiO2 and Ni-NiO-TiO2 materials differ in Ni loading, the amount of dispersed NiO species, the amount of crystalline NiO phase, oxygen vacancies, and the atomic concentration of surface oxygen species, approximately the same phase modification of TiO2, TiO2 crystallite size, and specific surface area was observed.

4. Materials and Methods

4.1. Photocatalysts’ Preparation

Two series of photocatalysts were studied in this work. The first one contained NiO-TiO2 (calcined series) and the second one was composed of Ni-NiO-TiO2 (partially reduced series). Both series contained pristine TiO2 (calcined and partially reduced). Pure TiO2 and NiO-TiO2 and Ni-NiO-TiO2 materials with theoretical concentrations of 0.5, 1.0, and 3.0 wt. % of NiO were prepared by the sol–gel method in a reverse micellar environment according to Kočí et al. [41]. They were prepared from cyclohexane, TritonTM X-114, water, and ethanol solution of nickel (II) nitrate hexahydrate. Both solutions were stirred separately for 15 min at room temperature and then mixed together and stirred for an additional 15 min. Then, titanium (IV) isopropoxide was injected into the mixture and the final solution was stirred for 15 min at room temperature. The mixture was poured onto Petri dishes of approximately 1–2 mm layer thickness and dried for 48 h in a fume hood. The resulting sol–gel was calcined at 450 °C in air. These calcined (oxidized form) photocatalysts were labelled as X wt. % NiO-TiO2, where X is the mass fraction of NiO calculated from the amount of used precursors during synthesis. The partially reduced X wt. % Ni-NiO-TiO2 photocatalysts (X is the mass fraction of NiO in appropriate NiO-TiO2 photocatalysts) were prepared by the reduction of NiO-TiO2 photocatalysts at 450 °C for 1 h in 5 vol.% H2/Ar. All of the materials were ground to a grain size of 0.16–0.25 mm.

4.2. Photocatalysts’ Characterization

The prepared samples were measured using a MiniFlex600 diffractometer (Rigaku Co., Tokyo, Japan) for powder X-ray diffraction. The instrument was equipped with a D/teX Ultra detector and the X-ray source was a CuKα tube operating at 40 kV and 15 mA. The slit width was set at 10 nm. Individual samples were scanned at a speed of 10 deg.min−1 and a step size of 0.02° in the range of the angle 2θ from 20 to 80°. The measured diffractograms were analyzed using PDXL2 software containing the ICDD-PDF-2 library to obtain the crystallite size, lattice parameters, and phase composition.
Nitrogen sorption isotherms were measured using a Micromeritics TriStar II 3020 static volumetric apparatus at −196 °C. The surface area, SBET, was calculated using adsorption data in the range of relative pressures p/p0 = 0.01–0.3.
All of the prepared samples were measured by Raman spectroscopy to determine the structure and presence of individual TiO2 phases. The spectra were measured on a Nicolet DXR SmartRaman spectrometer (Thermo Fisher Scientific, Waltham, MA, USA). The device included a Nd:YAG excitation laser with a wavelength of 532 nm. The laser power was used in the range of 0.3–8 mW.
The TiO2 and NiO-TiO2 samples were measured in 5 mm quartz cuvettes on a GBS CINTRA 303 spectrometer (GBC Scientific Equipment, Braeside, Australia) equipped with an integrating sphere. The spectra were recorded in the range of 190–900 nm wavelength with a scanning speed of 100 nm.min−1, with a selected monochromator slit width of 2 nm.
Temperature-programmed hydrogen reduction of all of the samples was measured on an AutoChem II 2920 Micrometritics equipped with a TCD detector. One hundred mg of the samples were placed into a quartz reactor, and H2-TPR profiles were measured with a temperature increase 10 °C.min−1 from 30 to 900 °C in 25 ml.min−1 gas flow of 5 vol.% H2/Ar.
The morphology of all of the materials was characterized by a field-emission scanning electron microscope (FE-SEM JEOL JSM 7500F). The cross-sectional views were obtained from fractured samples subjected to mechanical bending. The EDX analysis was carried out on AZtec X-Max 20 from Oxford Instruments; measurements were performed at a 20 kV acceleration voltage.
The surface chemical composition of all of the photocatalysts was determined by X-ray photoelectron spectroscopy (XPS) (ESCA 2SR, Scienta-Omicron, Taunusstein, Germany) using a monochromatic Al Kα (1486.7 eV) X-ray source. The binding energy scale was corrected using Ti4+ species corresponding to TiO2 (458.5 eV). The quantitative analysis was performed using the elemental sensitivity factors provided by the manufacturer.

4.3. Photocatalytic Test

The photocatalytic tests were performed in a batch photoreactor (from stainless steel) with a total volume of 347.8 mL. The reaction liquid mixture (50 vol.% of methanol in water) was continuously stirred (350 rpm). A 100 mg powder sample was placed in a cylindrical stainless sieve beam with a diameter of 3.2 cm, a height of 4.5 cm, and a porosity of 0.075 mm. The height of the liquid phase in the cylinder was 1 cm. The radiation source (UV-LED solo P lamp with parallel beam optics, λ = 365 nm, 5 W) was placed externally on top of the reactor, which was equipped with a quartz window. The distance between the radiation source and the level of the reaction mixture in the basket was 6.5 cm. The photoreactor was saturated with argon to purge unwanted air. The batch photoreactor was also equipped with a barometer and a septum for gaseous sampling. One mL of gas phase was taken every one hour (the total reaction time was 5 h) using a gas-tight syringe. The gas sample was also taken before starting the reaction (before irradiation) to confirm the absence of hydrogen. The gaseous products were analyzed on a gas chromatograph (7890B GC System, Agilent Technologies, Santa Clara, CA, USA) equipped with a TCD (thermal conductivity detector) and using argon as the carrier gas. Blank tests were conducted before the experiments. All of the experiments were repeated reproducibly at least two times.

Author Contributions

Conceptualization, H.D., L.Č. and K.K. (Kamila Kočí); investigation, K.K. (Kateřina Kozumplíková), V.M., L.D. and H.D.; writing—original draft preparation, H.D. and V.M.; writing—review and editing, L.Č. and K.K. (Kamila Kočí) and M.R.; project administration, L.Č. and K.K. (Kamila Kočí). All authors have read and agreed to the published version of the manuscript.

Funding

Czech Science Foundation of the Czech Republic Project No. 20-09914S; infrastructures project No. LM2018103 and project No. LM2018098.

Data Availability Statement

Data is contained within the article.

Acknowledgments

The authors gratefully thank the Czech Science Foundation of the Czech Republic (Project No. 20-09914S). Infrastructures project No. LM2018103 and project No. LM2018098 were used.

Conflicts of Interest

The authors declare no conflict of interest.

References

  1. Fujishima, A.; Honda, K. Electrochemical photolysis of water at a semiconductor electrode. Nature 1972, 238, 37–38. [Google Scholar] [CrossRef]
  2. Lin, L.; Hisatomi, T.; Chen, S.; Takata, T.; Domen, K. Visible-Light-Driven Photocatalytic Water Splitting: Recent Progress and Challenges. Trends Chem. 2020, 2, 813–824. [Google Scholar] [CrossRef]
  3. Wang, Z.; Li, C.; Domen, K. Recent developments in heterogeneous photocatalysts for solar-driven overall water splitting. Chem. Soc. Rev. 2019, 48, 2109–2125. [Google Scholar] [CrossRef]
  4. Singla, S.; Sharma, S.; Basu, S.; Shetti, N.P.; Aminabhavi, T.M. Photocatalytic water splitting hydrogen production via environmental benign carbon based nanomaterials. Int. J. Hydrog. Energy 2021, 46, 33696–33717. [Google Scholar] [CrossRef]
  5. Ng, K.H.; Lai, S.Y.; Cheng, C.K.; Cheng, Y.W.; Chong, C.C. Photocatalytic water splitting for solving energy crisis: Myth, Fact or Busted? Chem. Eng. J. (Lausanne) 2021, 417, 128847. [Google Scholar] [CrossRef]
  6. Ismael, M. A review and recent advances in solar-to-hydrogen energy conversion based on photocatalytic water splitting over doped-TiO2 nanoparticles. Sol. Energy 2020, 211, 522–546. [Google Scholar] [CrossRef]
  7. Fajrina, N.; Tahir, M. A critical review in strategies to improve photocatalytic water splitting towards hydrogen production. Int. J. Hydrog. Energy 2019, 44, 540–577. [Google Scholar] [CrossRef]
  8. Clarizia, L.; Di Somma, I.; Onotri, L.; Andreozzi, R.; Marotta, R. Kinetic modeling of hydrogen generation over nano-Cu(s)/TiO2 catalyst through photoreforming of alcohols. Catal. Today 2017, 281, 117–123. [Google Scholar] [CrossRef]
  9. Liu, Y.; Sun, Z.; Hu, Y.H. Bimetallic cocatalysts for photocatalytic hydrogen production from water. Chem. Eng. J. (Lausanne) 2021, 409, 128250. [Google Scholar] [CrossRef]
  10. Hasija, V.; Raizada, P.; Sudhaik, A.; Sharma, K.; Kumar, A.; Singh, P.; Jonnalagadda, S.B.; Thakur, V.K. Recent advances in noble metal free doped graphitic carbon nitride based nanohybrids for photocatalysis of organic contaminants in water: A review. Appl. Mater. Today 2019, 15, 494–524. [Google Scholar] [CrossRef]
  11. Yang, J.; Wang, D.; Han, H.; Li, C. Roles of cocatalysts in photocatalysis and photoelectrocatalysis. Acc. Chem. Res. 2013, 46, 1900–1909. [Google Scholar] [CrossRef] [PubMed]
  12. Prahov, L.; Disdier, J.; Herrmann, J.-M.; Pichat, P. Room temperature hydrogen production from aliphatic alcohols over uv-illuminated powder Ni/TiO2 catalysts. Int. J. Hydrog. Energy 1984, 9, 397–403. [Google Scholar] [CrossRef]
  13. Jing, D.; Zhang, Y.; Guo, L. Study on the synthesis of Ni doped mesoporous TiO2 and its photocatalytic activity for hydrogen evolution in aqueous methanol solution. Chem. Phys. Lett. 2005, 415, 74–78. [Google Scholar] [CrossRef]
  14. Wang, W.; Liu, S.; Nie, L.; Cheng, B.; Yu, J. Enhanced photocatalytic H2-production activity of TiO2 using Ni (NO3)2 as an additive. Phys. Chem. Chem. Phys. 2013, 15, 12033–12039. [Google Scholar] [CrossRef]
  15. Hu, S.; Li, F.; Fan, Z.; Gui, J. Improved photocatalytic hydrogen production property over Ni/NiO/N–TiO2−x heterojunction nanocomposite prepared by NH3 plasma treatment. J. Power Sources 2014, 250, 30–39. [Google Scholar] [CrossRef]
  16. Zhang, L.; Liu, Q.; Aoki, T.; Crozier, P.A. Structural evolution during photocorrosion of Ni/NiO core/shell cocatalyst on TiO2. J. Phys. Chem. C 2015, 119, 7207–7214. [Google Scholar] [CrossRef]
  17. Uddin, M.T.; Nicolas, Y.; Olivier, C.; Jaegermann, W.; Rockstroh, N.; Junge, H.; Toupance, T. Band alignment investigations of heterostructure NiO/TiO2 nanomaterials used as efficient heterojunction earth-abundant metal oxide photocatalysts for hydrogen production. Phys. Chem. Chem. Phys. 2017, 19, 19279–19288. [Google Scholar] [CrossRef] [PubMed]
  18. Chen, W.-T.; Chan, A.; Sun-Waterhouse, D.; Moriga, T.; Idriss, H.; Waterhouse, G.I. Ni/TiO2: A promising low-cost photocatalytic system for solar H2 production from ethanol–water mixtures. J. Catal. 2015, 326, 43–53. [Google Scholar] [CrossRef]
  19. Chen, W.-T.; Chan, A.; Sun-Waterhouse, D.; Llorca, J.; Idriss, H.; Waterhouse, G.I. Performance comparison of Ni/TiO2 and Au/TiO2 photocatalysts for H2 production in different alcohol-water mixtures. J. Catal. 2018, 367, 27–42. [Google Scholar] [CrossRef]
  20. Wang, P.; Xu, S.; Chen, F.; Yu, H. Ni nanoparticles as electron-transfer mediators and NiSx as interfacial active sites for coordinative enhancement of H2-evolution performance of TiO2. Chin. J. Catal. 2019, 40, 343–351. [Google Scholar] [CrossRef]
  21. Ren, X.; Gao, P.; Kong, X.; Jiang, R.; Yang, P.; Chen, Y.; Chi, Q.; Li, B. NiO/Ni/TiO2 nanocables with Schottky/p-n heterojunctions and the improved photocatalytic performance in water splitting under visible light. J. Colloid Interface Sci. 2018, 530, 1–8. [Google Scholar] [CrossRef]
  22. Ganesh, I.; Gupta, A.; Kumar, P.; Sekhar, P.; Radha, K.; Padmanabham, G.; Sundararajan, G. Preparation and Characterization of Ni-Doped TiO2 Materials for Photocurrent and Photocatalytic Applications. Sci. World J. 2012, 2012, 127326. [Google Scholar] [CrossRef] [PubMed] [Green Version]
  23. Chen, X.; Xiong, J.; Shi, J.; Xia, S.; Gui, S.; Shangguan, W. Roles of various Ni species on TiO2 in enhancing photocatalytic H2 evolution. Front. Energy 2019, 13, 684–690. [Google Scholar] [CrossRef]
  24. Bhavani, P.; Kumar, D.P.; Hussain, M.; Chen, W.-H.; Lam, S.S.; Park, Y.-K. Surface ligand functionalized Few-layered MoSe2 nanosheets decorated CdS nanorods for spectacular rate of H2 production. Fuel 2023, 334, 126551. [Google Scholar] [CrossRef]
  25. Li, A.; Zhang, L.; Wang, F.; Zhang, L.; Li, L.; Chen, H.; Wei, Z. Rational design of porous Ni-Co-Fe ternary metal phosphides nanobricks as bifunctional electrocatalysts for efficient overall water splitting. Appl. Catal. B Environ. 2022, 310, 121353. [Google Scholar] [CrossRef]
  26. Bhavani, P.; Hussain, M.; Park, Y.-K. Recent advancements on the sustainable biochar based semiconducting materials for photocatalytic applications: A state of the art review. J. Clean. Prod. 2022, 330, 129899. [Google Scholar] [CrossRef]
  27. Gong, T.; Zhang, J.; Liu, Y.; Hou, L.; Deng, J.; Yuan, C. Construction of hetero-phase Mo2C-CoO@N-CNFs film as a self-supported Bi-functional catalyst towards overall water splitting. Chem. Eng. J. 2023, 451, 139025. [Google Scholar] [CrossRef]
  28. Jia, L.; Du, G.; Han, D.; Wang, Y.; Zhao, W.; Su, Q.; Ding, S.; Xu, B. Magnetic electrode configuration with polypyrrole-wrapped Ni/NiFe2O4 core–shell nanospheres to boost electrocatalytic water splitting. Chem. Eng. J. 2023, 454, 140278. [Google Scholar] [CrossRef]
  29. Zabelina, A.; Miliutina, E.; Zabelin, D.; Burtsev, V.; Buravets, V.; Elashnikov, R.; Neubertova, V.; Šťastný, M.; Popelková, D.; Lancok, J. Plasmon coupling inside 2D-like TiB2 flakes for water splitting half reactions enhancement in acidic and alkaline conditions. Chem. Eng. J. 2023, 454, 140441. [Google Scholar] [CrossRef]
  30. Alijani, M.; Ilkhechi, N.N. Effect of Ni Doping on the Structural and Optical Properties of TiO2 Nanoparticles at Various Concentration and Temperature. Silicon 2018, 10, 2569–2575. [Google Scholar] [CrossRef]
  31. Deng, X.; Zhang, H.; Ma, Q.; Cui, Y.; Cheng, X.; Li, X.; Xie, M.; Cheng, Q. Fabrication of p-NiO/n-TiO2 nano-tube arrays photoelectrode and its enhanced photocatalytic performance for degradation of 4-chlorphenol. Sep. Purif. Technol. 2017, 186, 1–9. [Google Scholar] [CrossRef]
  32. Dai, L.; Sun, F.; Fan, Q.; Li, H.; Yang, K.; Guo, T.; Zheng, L.; Fu, P. Carbon-based titanium dioxide materials for hydrogen production in water-methanol reforming: A review. J. Environ. Chem. Eng. 2022, 107326. [Google Scholar] [CrossRef]
  33. Chen, J.; Wang, M.; Han, J.; Guo, R. TiO2 nanosheet/NiO nanorod hierarchical nanostructures: P–n heterojunctions towards efficient photocatalysis. J. Colloid Interface Sci. 2020, 562, 313–321. [Google Scholar] [CrossRef] [PubMed]
  34. Faisal, M.; Harraz, F.A.; Ismail, A.A.; El-Toni, A.M.; Al-Sayari, S.; Al-Hajry, A.; Al-Assiri, M. Novel mesoporous NiO/TiO2 nanocomposites with enhanced photocatalytic activity under visible light illumination. Ceram. Int. 2018, 44, 7047–7056. [Google Scholar] [CrossRef]
  35. Zheng, D.; Zhao, H.; Wang, S.; Hu, J.; Chen, Z. NiO-TiO2 p-n Heterojunction for Solar Hydrogen Generation. Catalysts 2021, 11, 1427. [Google Scholar] [CrossRef]
  36. Yu, C.; Li, M.; Yang, D.; Pan, K.; Yang, F.; Xu, Y.; Yuan, L.; Qu, Y.; Zhou, W. NiO nanoparticles dotted TiO2 nanosheets assembled nanotubes P-N heterojunctions for efficient interface charge separation and photocatalytic hydrogen evolution. Appl. Surf. Sci. 2021, 568, 150981. [Google Scholar] [CrossRef]
  37. Jasim, M.M.; Dakhil, O.A.A.; Abdullah, H.I. Synthesis of NiO/TNTs p-n junction for highly photocatalysis activity under sunlight irradiation. Solid State Sci. 2020, 107, 106342. [Google Scholar] [CrossRef]
  38. Sreethawong, T.; Ngamsinlapasathian, S.; Yoshikawa, S. Surfactant-aided sol–gel synthesis of mesoporous-assembled TiO2–NiO mixed oxide nanocrystals and their photocatalytic azo dye degradation activity. Chem. Eng. J. (Lausanne) 2012, 192, 292–300. [Google Scholar] [CrossRef]
  39. Pan, X.; Yang, M.-Q.; Fu, X.; Zhang, N.; Xu, Y.-J. Defective TiO2 with oxygen vacancies: Synthesis, properties and photocatalytic applications. Nanoscale 2013, 5, 3601–3614. [Google Scholar] [CrossRef]
  40. Chen, S.; Qian, T.T.; Ling, L.L.; Zhang, W.; Gong, B.B.; Jiang, H. Hydrogenation of Furfural to Cyclopentanone under Mild Conditions by a Structure-Optimized Ni− NiO/TiO2 Heterojunction Catalyst. ChemSusChem 2020, 13, 5507–5515. [Google Scholar] [CrossRef]
  41. Kočí, K.; Troppová, I.; Edelmannová, M.; Starostka, J.; Matějová, L.; Lang, J.; Reli, M.; Drobná, H.; Rokicińska, A.; Kuśtrowski, P. Photocatalytic decomposition of methanol over La/TiO2 materials. Environ. Sci. Pollut. Res. 2018, 25, 34818–34825. [Google Scholar] [CrossRef] [PubMed]
  42. Jitianu, M.; Jitianu, A.; Zaharescu, M.; Crisan, D.; Marchidan, R. IR structural evidence of hydrotalcites derived oxidic forms. Vib. Spectrosc. 2000, 22, 75–86. [Google Scholar] [CrossRef]
  43. Kim, P.; Kim, Y.; Kim, H.; Song, I.K.; Yi, J. Synthesis and characterization of mesoporous alumina with nickel incorporated for use in the partial oxidation of methane into synthesis gas. Appl. Catal. A: Gen. 2004, 272, 157–166. [Google Scholar] [CrossRef]
  44. Shibiao, R.; Jinheng, Q.; Chunyan, W.; Bolian, X.; Yining, F.; Yi, C. Influence of nickel salt precursors on the hydrogenation activity of Ni/γ-Al2O3 catalyst. Chin. J. Catal. 2007, 28, 651–656. [Google Scholar]
  45. Ohsaka, T.; Izumi, F.; Fujiki, Y. Raman spectrum of anatase, TiO2. J. Raman Spectrosc. 1978, 7, 321–324. [Google Scholar] [CrossRef]
  46. Alagarasi, A.; Rajalakshmi, P.; Shanthi, K.; Selvam, P. Ordered mesoporous nanocrystalline titania: A promising new class of photocatalytic materials. Catal. Today 2018, 309, 202–211. [Google Scholar] [CrossRef]
  47. Sahoo, S.; Arora, A.; Sridharan, V. Raman line shapes of optical phonons of different symmetries in anatase TiO2 nanocrystals. J. Phys. Chem. C 2009, 113, 16927–16933. [Google Scholar] [CrossRef]
  48. Pal, M.; Pal, U.; Jiménez, J.M.G.Y.; Pérez-Rodríguez, F. Effects of crystallization and dopant concentration on the emission behavior of TiO2: Eu nanophosphors. Nanoscale Res. Lett. 2012, 7, 1–12. [Google Scholar] [CrossRef] [Green Version]
  49. Sanchis, R.; Delgado, D.; Agouram, S.; Soriano, M.; Vázquez, M.; Rodríguez-Castellón, E.; Solsona, B.; Nieto, J.L. NiO diluted in high surface area TiO2 as an efficient catalyst for the oxidative dehydrogenation of ethane. Appl. Catal. A Gen. 2017, 536, 18–26. [Google Scholar] [CrossRef]
  50. Varkolu, M.; Velpula, V.; Pochamoni, R.; Muppala, A.R.; Burri, D.R.; Kamaraju, S.R.R. Nitrobenzene hydrogenation over Ni/TiO2 catalyst in vapour phase at atmospheric pressure: Influence of preparation method. Appl. Petrochem. Res. 2016, 6, 15–23. [Google Scholar] [CrossRef]
Figure 1. XRD patterns of TiO2 and NiO-TiO2 photocatalysts calcined at 450 °C in the air (a) and Ni-NiO-TiO2 photocatalysts reduced at 450 °C in H2/Ar (b).
Catalysts 13 00293 g001
Figure 2. SEM images of pure TiO2 (a), 1.0_NiO-TiO2 (b), and 1.0_Ni-NiO-TiO2 (c).
Catalysts 13 00293 g002
Figure 3. UV-vis DRS spectra of TiO2 and NiO-TiO2 photocatalysts calcined at 450 °C in the air (bottom graph). UV-vis DRS spectra of NiO (upper graph).
Catalysts 13 00293 g003
Figure 4. Raman spectra of TiO2 and NiO-TiO2 photocatalysts calcined at 450 °C in the air (a) and Ni-NiO-TiO2 photocatalysts reduced at 450 °C in H2/Ar (b).
Catalysts 13 00293 g004
Figure 5. H2-TPR profiles of TiO2 and NiO-TiO2 photocatalysts calcined at 450 °C in the air (a) and Ni-NiO-TiO2 photocatalysts reduced at 450 °C in H2/Ar (b).
Catalysts 13 00293 g005
Figure 6. Photocatalytic hydrogen production over TiO2 and NiO-TiO2 photocatalysts calcined at 450 °C in the air (a) and Ni-NiO-TiO2 photocatalysts reduced at 450 °C in H2/Ar (b).
Catalysts 13 00293 g006
Figure 7. Measurement of reproducibility of photocatalytic hydrogen production over the TiO2, 1.0_Ni-NiO-TiO2, and 3.0_Ni-NiO-TiO2 photocatalysts reduced at 450 °C in H2/Ar.
Catalysts 13 00293 g007
Figure 8. Comparison of photocatalytic hydrogen production over the TiO2 and NiO-TiO2 photocatalysts calcined at 450 °C in the air (black color columns) and the Ni-NiO-TiO2 photocatalysts reduced at 450 °C in H2/Ar (red color columns).
Catalysts 13 00293 g008
Table 1. Crystallite sizes and surface phase composition of TiO2 and NiO-TiO2 photocatalysts calcined at 450 °C in air and Ni-NiO-TiO2 photocatalysts reduced at 450 °C in H2/Ar obtained from XRD spectroscopy.
Calcined SamplesReduced Samples
SampleCrystallite Size (nm)Phase Content (%)SampleCrystallite Size (nm)Phase Content (%)
AnataseNiOAnataseNi0
TiO212.9100 n.d. 1TiO210.0100 n.d. 1
0.5_NiO-TiO27.0100n.d. 10.5_Ni-NiO-TiO29.9100n.d. 1
1.0_NiO-TiO210.3100n.d. 11.0_Ni-NiO-TiO27.3100n.d. 1
3.0_NiO-TiO26.699 1.03.0_Ni-NiO-TiO26.997.9 2.1
1 n.d.—not detected (inconclusive).
Table 2. Surface composition of Ti, O, Ni, and C (at. %) determined by XPS for TiO2 and NiO-TiO2 photocatalysts calcined at 450 °C in air and Ni-NiO-TiO2 photocatalysts reduced at 450 °C in H2/Ar.
Calcined SamplesAtomic Concentration (mol. %)NiO
CarbonTi-OC=O-OHO TotalTitaniumNi2+Ni0(wt. %)
TiO213.9853.884.942.1960.9125.02---
0.5_NiO-TiO213.0054.245.021.9760.9625.770.10n.d. 10.32
1.0_NiO-TiO214.9051.955.541.9059.1724.910.74l.d. 22.35
3.0_NiO-TiO215.7045.829.682.8958.3324.191.63l.d. 25.16
Reduced SamplesAtomic Concentration [%]NiO
CarbonTi-OC=O-OHO TotalTitaniumNi2+Ni0(wt. %)
TiO216.0252.214.972.1659.2924.64---
0.5_Ni-NiO-TiO217.4349.053.842.4455.4023.590.07n.d. 10.24
1.0_Ni-NiO-TiO212.7752.456.262.1960.7725.650.65l.d. 22.03
3.0_Ni-NiO-TiO214.0252.935.071.7259.4925.660.54l.d. 21.70
1 n.d.—not detected (inconclusive). 2 l.d.—limit of detection (insufficiently conclusive).
Disclaimer/Publisher’s Note: The statements, opinions and data contained in all publications are solely those of the individual author(s) and contributor(s) and not of MDPI and/or the editor(s). MDPI and/or the editor(s) disclaim responsibility for any injury to people or property resulting from any ideas, methods, instructions or products referred to in the content.

