Article

Photocatalytic Decomposition of Azo Dyes and Phenols Using Polymer Composites Containing Nanostructured Poly(Titanium Oxide) Doped with Gold or Silver Nanoparticles under Light Irradiation in a Wide Wavelength Range

by
Evgeniia Salomatina
1,*,
Pavel Shelud’ko
1,
Vsevolod Kuz’michev
2 and
Larisa Smirnova
1
1
Department of Polymers and Colloidal Chemistry, Chemistry Faculty, N.I. Lobachevsky State University of Nizhny Novgorod, Gagarin Avenue 23, bld. 5, 603022 Nizhny Novgorod, Russia
2
Collective Use Center “New Materials and Resource-Saving Technologies”, N.I. Lobachevsky Research Institute of Chemistry, Gagarin Avenue 23, bld. 5, 603022 Nizhny Novgorod, Russia
*
Author to whom correspondence should be addressed.
Catalysts 2023, 13(2), 423; https://doi.org/10.3390/catal13020423
Submission received: 31 December 2022 / Revised: 4 February 2023 / Accepted: 10 February 2023 / Published: 16 February 2023

Abstract

:
The photocatalytic properties of poly(titanium oxide) (PTO) dispersed in optically transparent polymeric matrices of different natures under the action of both UV and visible light on aqueous solutions of azo dyes and phenols were investigated. PTO in materials forms clusters of mixed polymorphic modification—anatase and rutile—with an average size ~12 nm. With a one-electron transition Ti4+ + e → Ti3+ accompanied by a reversible break of the Ti-O bond, the formation of electron-hole pairs and, consequently, active oxygen species occurs in PTO under UV irradiation. The PTO band gap in nanocomposites is 3.11–3.35 eV. Its doping with gold and silver nanoparticles with sizes from ~10 to ~30 nm reduces the PTO band gap by up to 2.11 eV, which leads to the operating wavelength range extension of the materials. It provides the enhancement of nanocomposites’ photocatalytic properties under UV irradiation and is the reason for their high activity under visible light action. It was found that azo dyes decompose by ~90% in this case. A phenol and para-nitrophenol conversion of 80–90% was proven at ~60 min upon their aqueous solutions’ visible-light irradiation at the nanocomposite concentration in a solution of 0.5 g/L.

1. Introduction

Nowadays, titanium dioxide attracts special attention from researchers working on the creation of new photocatalytic materials. The interest in titanium dioxide first appeared in the 1970s, when a group of Japanese scientists [1] discovered the phenomenon of water splitting on an anode made of TiO2 under UV irradiation that provoked an avalanche of research into its catalytic properties. It is thought [2,3,4,5] that the photocatalytic properties of TiO2 is a result of the processing of the UV-induced one-electron transition of Ti4+ + e ⇄ Ti3+, accompanied by the reversible bond break of Ti-O and the formation of charge carriers—the holes and electrons on its surface [1,2,3,4,5,6,7]. The photogenerated holes from the valence band TiO2 diffuse to its surface and react with adsorbed water molecules, forming hydroxyl radicals [6,7]. Electrons from the conduction band generally react with molecular oxygen in the air, forming superoxide anion radicals. These radicals provide for the strong oxidative capacity of titanium dioxide in light irradiation. The possible mechanism of the photocatalytic action of TiO2 and its application fields are reflected in reviews [8,9,10]. It was found that titanium dioxide causes the decomposition of organic pollutants in water and air, including bacteria, and differs in terms of superhydrophilic properties, chemical stability, long service life, non-toxicity and low cost [11,12]. TiO2 can be applied to various surfaces, such as glass, stainless steel fiber, inorganic materials, sand and activated carbon, allowing for its continuous and repeated use [1,2,3,8,9,10].
The photocatalytic activity of metal oxides is determined by a combination of factors, including particle size and crystal structure, photocatalyst surface area, its acidity, porosity, concentration of surface hydroxyl groups, the number and nature of surface charge traps, etc. [11,12,13]. The increase in the catalytic activity of materials containing TiO2 can be achieved by increasing the dispersity of the oxide particles. It is known [14] that the TiO2 particles of anatase structures with a size less than 50 nm have the highest photocatalytic activity due to their specifically developed surface area. At the same time, there are some studies showing that materials containing not only anatase TiO2 but also its mix with rutile in proportion of 80–85% and 20–15%, respectively, show high photocatalytic activity [11,12,13,14]. Unfortunately, modern methods for the synthesis of TiO2 particles do not allow for the full control of their size.
It should be noted that even increasing the dispersity of TiO2 does not remove it from drawbacks such as a wide band gap of 3.2 eV [15,16], which limits the wavelength range to UV light only, causing charge separation and the generation of active oxygen forms and a high recombination rate of electrons and “holes”, which in general reduces its efficiency as a photocatalyst. A consequence of these disadvantages is the relatively low quantum yield of the reaction Ti4+ + e ⇄ Ti3+, which is ~17–20% [17]. Systems with higher charge separation efficiencies of ~50% are poly(titanium oxide) (PTO) gels in alcoholic media [18,19]. It is proven that in alcoholic media, PTO forms cluster nanostructures [20,21]; however, gels are unstable in the air. With this connection, when creating photocatalytic materials with high activity based on titanium dioxide, it is necessary to eliminate the problems of the latter’s narrow absorption spectrum and enhance the efficiency of the charge carrier formation and separation.
To a certain extent, the way to solve this problem was found in the 1990s, when the catalytic properties of gold and silver nanoparticles (NPs) were discovered. It was found that doping TiO2 with gold and silver NPs leads to an increase in the flux of electrons and holes generated on its surface when exposed to visible light [22,23,24]. As a result, such materials enable a more efficient use of the full spectrum of solar radiation and significantly reduce the energy consumption of the photocatalytic process. The reason that the photocatalytic properties are strengthened is closely connected to the reduction of the band gap width of titanium dioxide. The authors of papers [25,26,27,28,29] believe that, firstly, there is an excitation of the collective vibration of electrons on Au or Ag NPs’ surface, possessing plasmon resonance in the visible spectral region. This is because the Fermi levels of titanium dioxide and Au or Ag particles are close, and these electrons are transferred to the conduction band of TiO2 that then leads to the generation of reactive oxygen species on its surface. These discoveries have stimulated a new wave of research into the photocatalytic properties of TiO2 doped with NP metals and their oxides [30,31]. It has been shown [32,33,34,35,36] that the high photocatalytic activity of Au/TiO2 powders, films or coatings already appears in the action of visible light when purifying polluted water (for example, catalytic oxidation of phenols, antibiotic residues, oil refining products, herbicides, insecticides, inhibition of bacterial growth, etc.).
Despite the success achieved, the task of developing new accessible and controllable methods of producing nanocomposite materials containing highly dispersed particles of TiO2 with anatase (anatase and rutile) polymorphic modification doped with noble metal NPs remains relevant.
The aim of this work was to study the photocatalytic properties of composites containing nanostructured PTO doped with gold or silver NPs in optically transparent polymer matrices in the decomposition reactions of azo dyes and phenols in aqueous media under the action of both UV and visible light.

2. Results and Discussions

Polymeric nanocomposites are solid and optically transparent materials containing PTO chemically bonded to the organic polymer matrix. From the point of view of the practical application of materials, the structure of the PTO in them and its size is crucially important because the anatase form of TiO2 exhibits the greatest charge separation ability in the reaction Ti4+ + e → Ti3+, and hence the photocatalytic activity. In this regard, in order to clearly understand the PTO organization in nanocomposites, they were exposed to thermolysis to exclude the effect of the polymer matrix on the inorganic component. XRD analysis showed that the ash left after the degradation of the organic part of the composites at 350 °C was a crystalline TiO2 with an anatase polymorphic modification (space group I41/amd, code 94566), regardless of the nature of the polymer matrix (Figure 1, curves 4–6). The diffractograms of the powders left after the degradation of the composites containing Au or Ag NPs show maximums at angles characteristic of two allotropic modifications of TiO2—anatase (75–95%) and rutile (5–25%) (Figure 1, curves 7–12, Table 1).
The character of the peaks in the diffractograms (their width from 2° to 5°) indicates the small size of TiO2 particles in powders. The application of the Scherrer equation allowed for the calculating of the approximate diameter of the TiO2 particles in the ash, which did not exceed 12 nm, regardless of the nanocomposite composition in all cases (Table 1). There can be noted only a slight increase in particle diameter during the transition from materials of binary composition to materials containing, in addition to PTO and HEMA, AN and BMA units. It is also seen that in ternary composites containing AN or BMA units, larger NPs form in comparison with the materials with binary composition—from ~20 to ~30 nm versus 10–12 nm (Table 1). Apparently, this effect is related to the formation of closer-packing macromolecules in the nanocomposites of ternary compositions, which facilitates the assembly processes of gold or silver atoms in NPs.
Thus, on the basis of obtaining results, it can be assumed that during the synthesis of amorphous polymer composites, PTO chains self-organize into nanocluster structures similar to photocatalytically active anatase with particle size ~10–12 nm. We have studied the structure of nanocomposites in detail in [37,38]. It should be noted that PTO clusters are cross-linking centers of organic (co)polymer macromolecules, so the composites are not soluble in organic solvents (dimethylformamide, tetrahydrofuran, ethyl alcohol, acetone and benzene) and water—they only swell in them.
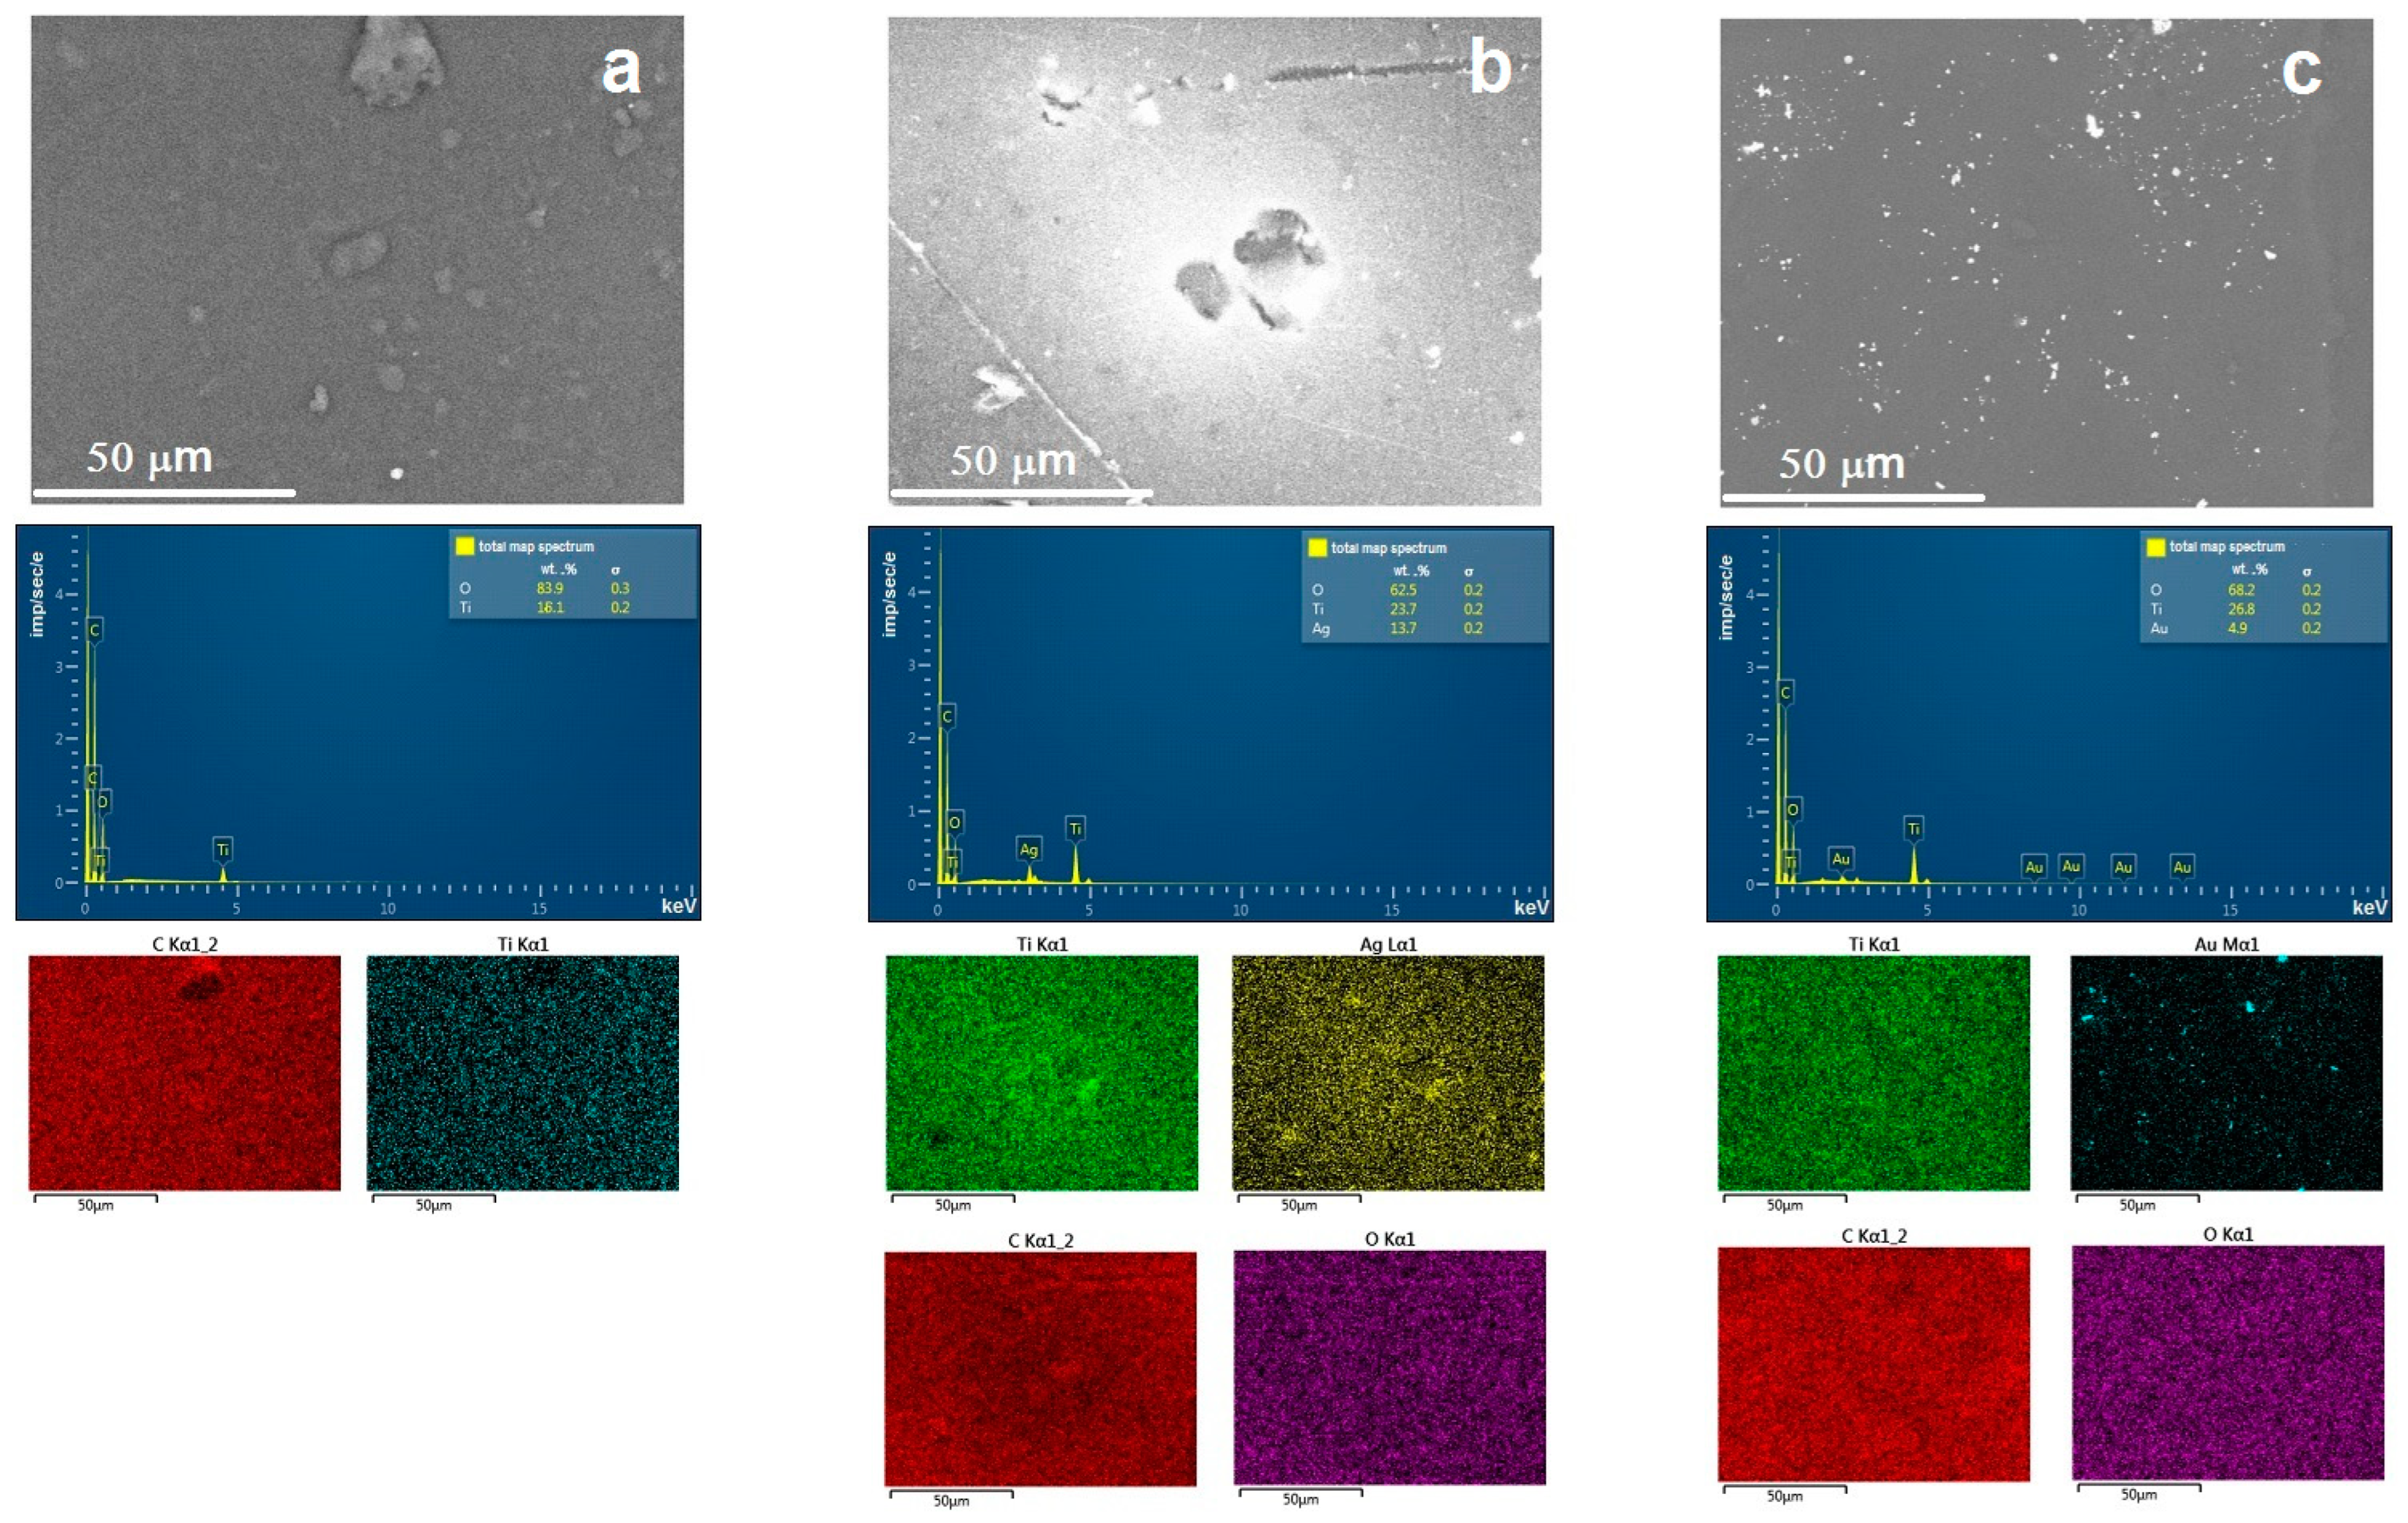
Scanning electron microscopy with X-ray fluorescence analysis helped to answer the question of whether the metal particles are located in the volume of polymer matrix or near the PTO (Figure 2).
It was found that the surface of the composites, regardless of polymer matrix nature, consists of many small objects of sizes ~5 µm, with a uniform distribution of Ti, O and C atoms on it (Figure 2a). The titanium content on the surface was ~15–17%, which corresponds to the calculated value based on the composition of the charging mixture. A different picture can be observed in the study of nanocomposites with Au and Ag nanoparticles. In this case, finer inhomogeneities with sizes ranging from 0.5 to 1 micron were observed on the surface. It was found that the atoms of all the elements in the nanocomposites were also uniformly distributed on their surface. Moreover, the share of titanium on it increased to 23–27%. The content of gold and silver on the nanocomposite’s surface was ~5 and 14%, respectively. The elemental analysis of the nanocomposite’s surface confirmed the arrangement of metal particles on the surface of PTO. It, apparently, is caused by the assembling of metal atoms during NP synthesis near PTO clusters with high specific surface area. By computer simulation using DFT and TD-DFT (B3LYP) in previous works, there has been shown the coordination of gold nanoparticles (Au8) on oxygen atoms in the PTO cluster and carbonyl groups of oxoethyl methacryate fragments chemically bound to PTO [39].
During UV- irradiation of composites, in their spectra in the region of 600–700 nm, an absorption band appears and grows, which is accompanied by a reversible darkening of the samples (Figure 3a). This phenomenon provides evidence for the occurrence of the one-electron transition Ti4+ + e → Ti3+ in composites, wherein in order to happen, as in TiO2, there must occur the generation of reactive oxygen species on the material surfaces. The speed and depth of the process depend on the nature of the organic polymer matrix (Figure 3b). Binary materials are characterized by the greatest depth of obscuration to 70% in 180 min.
The question of how the Ti4+ + e → Ti3+ transition occurs in the obtained copolymers under UV irradiation is the subject of a separate study and is not considered in this work. Previously, using EPR spectroscopy, the authors [40,41,42,43] showed the formation of paramagnetic ions Ti3+ both on the surface and inside the TiO2 particles in its colloidal solutions under UV irradiation. These ions are responsible for the dark blue coloration of the samples. The appearance of Ti3+ ions in photo-irradiated samples of PTO gels in alcoholic media has also been confirmed by EPR experiments [19]. In the gel samples, the strong resonance due to Ti3+ leads to the following values of the g-factor: g = 1.924 and gII = 1.878. All this allowed the authors [18] to write the following mechanism of formation of Ti3+ centers in PTO gels in alcoholic media:
g e l + h ν σ 1 e C B + h V B +
.. O 2 + h V B + O 2 + r a d i c a l s
T i 4 + + e C B T i 3 +
T i 3 + + h ν σ 2 T i 4 + + e C B
The EPR spectra of the organic–inorganic copolymer based on titanium isopropoxide and HEMA was considered in [44,45]. It demonstrates the characteristic magnetic parameters of the paramagnetic Ti3+ centers in the distorted rhombic field of the oxygen ligand: gx = 1.973, gy = 1.919 and gz = 1.855. The EPR spectra of organic–inorganic copolymers of ternary composition that contain AN or BMA units, in addition to PTO and HEMA, have a similar appearance (Figure 3c). It can be assumed that the formation of Ti3+ centers (“electrons”) and “holes” in the hybrid organic–inorganic copolymers under UV irradiation occurs along a path similar to that of PTO gels in alcoholic media (Figure 3d) [46] and has a multistep character. The authors suggest that in the first step, Ti3+ centers (“electrons”) are formed during photon absorption as a result of the electron transfer from the valence band with 2p-orbitals of the oxygen atom O2− (“hole”) to the conduction band to the 3d-orbital of Ti4+. The photogenerated “holes” then rapidly transfer to the organic polymer matrix (poly(HEMA) or poly(HEMA-co-AN), poly(HEMA-co-BMA)), and the electrons remain “trapped” in the conduction band in the PTO (Figure 3d, quantum efficiency of the process is ηa). The maximum concentration of Ti3+ centers is limited by the internal photoeffect, which is associated with the excitation of electrons “trapped” in the conduction band in the PTO particle (Figure 3d). Secondarily excited electrons can leave the inorganic component and recombine with “holes” localized in the organic component of the copolymer (Figure 3d, this process is characterized by quantum efficiency ηb).
Thus, the combination of obtained results on the structure of polymer nanocomposites and the PTO in them, its doping with metal nanoparticles, and the optical properties of materials are prerequisites for nanocomposites that exhibit high photocatalytic activity under the action of both UV and visible radiation.
The photocatalytic properties of nanocomposites were studied in the decomposition reactions of azo dyes—methylene orange (MO) and congo red (CR)—and phenols in aqueous solutions. The choice of objects was due to the fact that they are widespread pollutants in wastewater in respective industries and are non-biodegradable substances. Their disposal is very important from the point of view of environmental protection, and the photocatalytic decomposition method in aqueous solutions seems to be the most cost effective on an industrial scale. MO and CR are widely used in the textile industry [47]. In addition, azo dyes are popular model substances for assessing the photocatalytic activity of solution discoloration materials recommended by ISO 10678:2010 [48]. According to the World Environment Organization, phenol and para-nitrophenol (p-NP) are two of 114 dangerous biologically and chemically persistent pollutants in wastewater, forming during the production of dyes, pharmaceuticals, fungicides, insecticides and herbicides [49]. The maximum permissible concentration of p-NP in water is 20 µg/L. Studies on animals have shown that p-NP is capable of producing various toxic effects on the body, such as irritation and inflammation of the eyes, skin and respiratory tract, which may lead to cyanosis, confusion and loss of consciousness; stomach pain and vomiting; blood diseases; and destruction of the endocrine system [50]. Thus, the obtaining of new materials to develop an effective technology for purifying water from these pollutants attracts considerable attention from the scientific community.
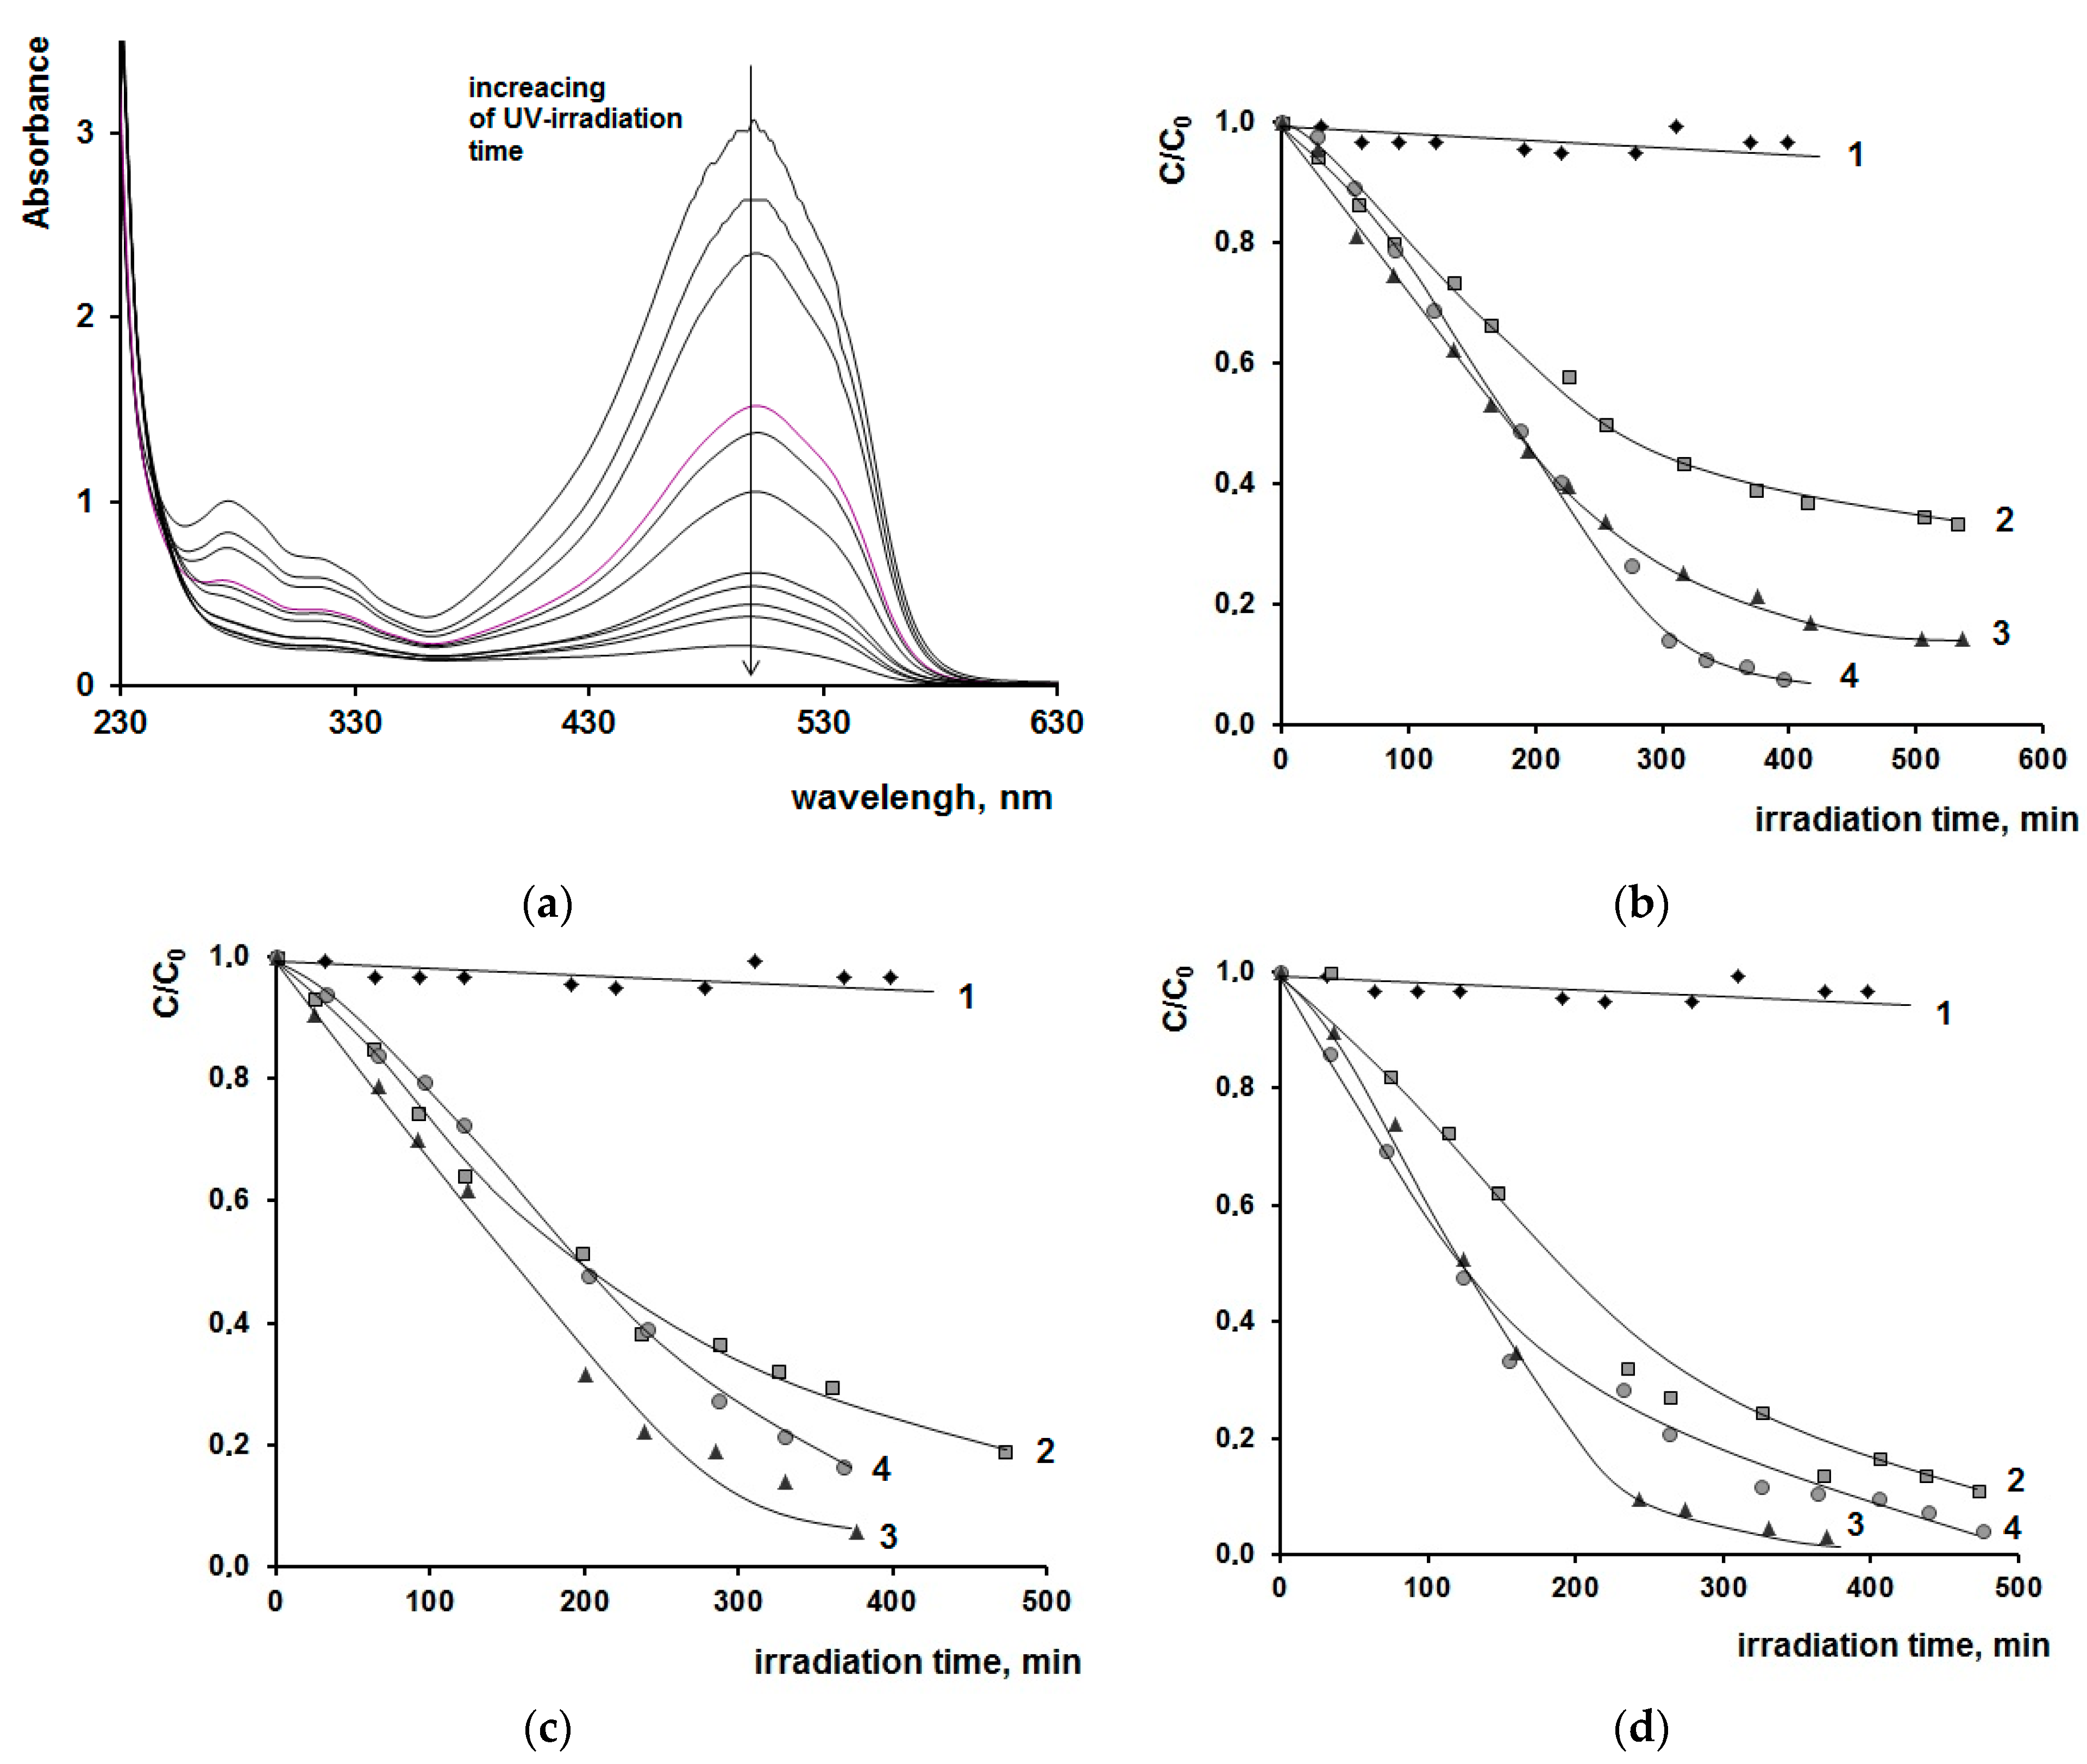
Let us consider the photocatalytic activity of polymer composites in powder form in the reaction of MO decomposition in aqueous solution under the action of UV light. There have been proposed several schemes of MO decomposition on TiO2 under UV irradiation, one of which suggests a deep decomposition of MO to CO2 and water [51,52,53]; at the same time, the spectrum of dye solutions shows a change of the absorption band intensity at 470 nm, which is typical for basic forms of MO (relating to the presence of -N=N- bonds in MO) [54]. Also, during the first few stages, they can decompose without discoloration by the N-demethylation mechanism [55,56], according to the scheme below (Scheme 1).
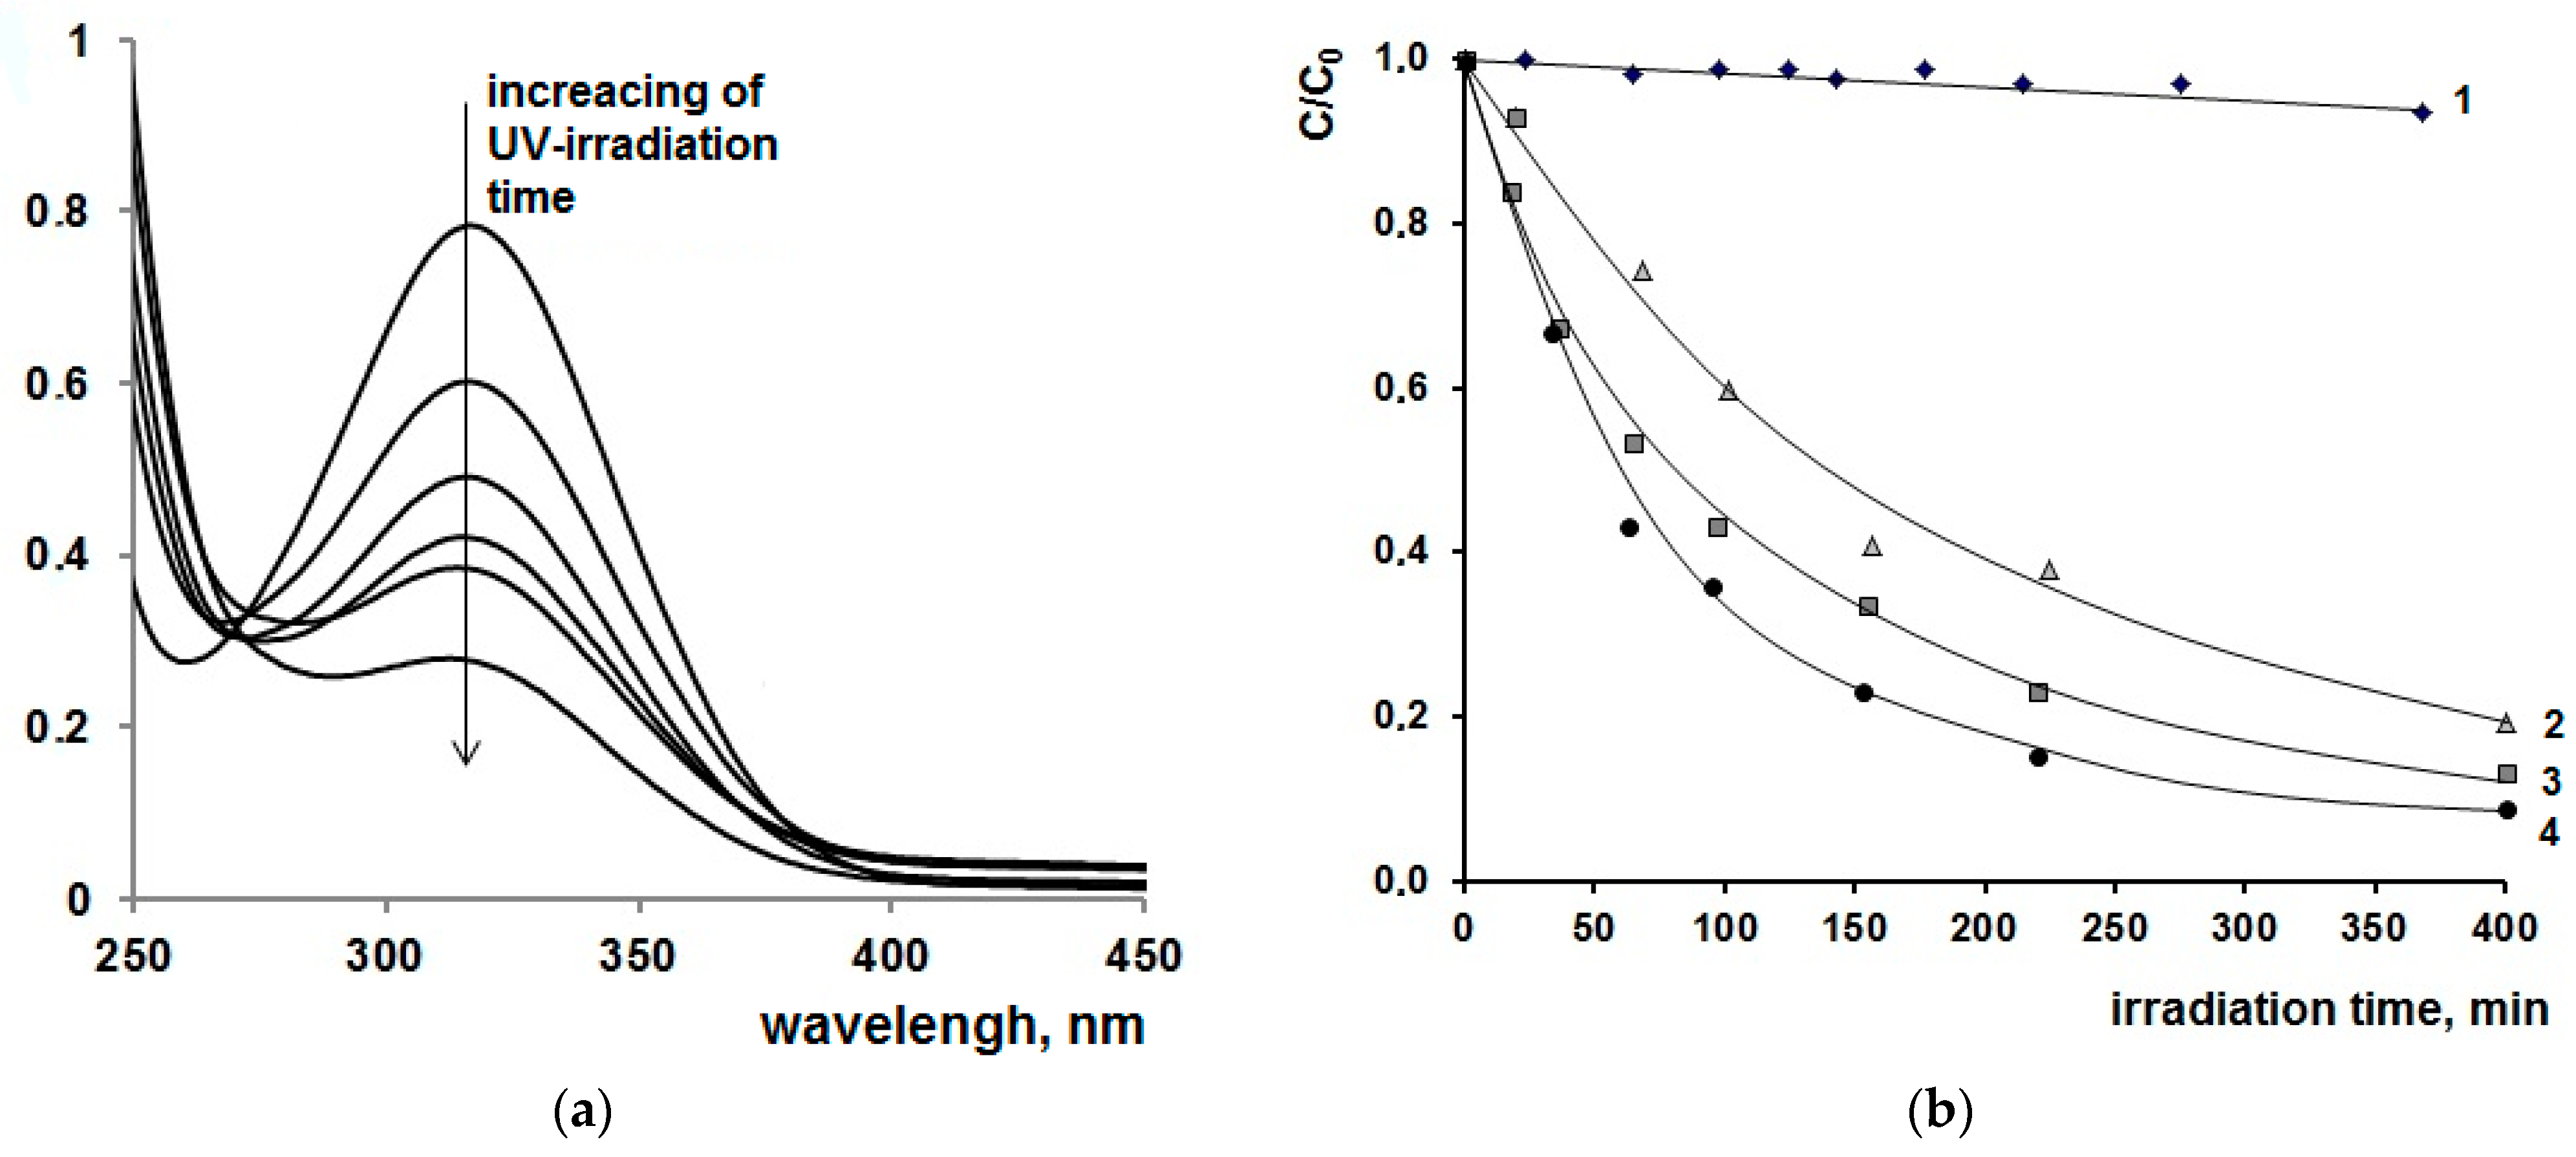
It was the wavelength at 470 nm that was chosen to control the depth of MO decomposition in the solution. Figure 4a shows the change in the spectra of MO solutions containing nanocomposites as heterogeneous photocatalysts during the UV irradiation of the purified system. It is seen that when the MO solution is UV-irradiated in the absence of a catalyst, the dye concentration remains practically unchanged for 10 h («empty» experiment). With the use of composites as photocatalysts, discoloration of the MO solution occurs from the first minutes of light irradiation. A comparison of the conversion depth of dye for 400 min of UV irradiation showed that the use of a binary composite reduces the MO concentration in the solution by ~60% (Figure 4b, curve 2), the material with BMA units by ~75% (Figure 4c, curve 2), and AN by ~80% (Figure 4d, curve 2). The doping of the PTO with Au or Ag nanoparticles provides a deeper MO decomposition—up to 90–95%. The best results are demonstrated by the material of composition [(≡TiO)n]:[HEMA]:[AN] = 1:5:1, doped with silver NPs (Figure 4d, curve 4).
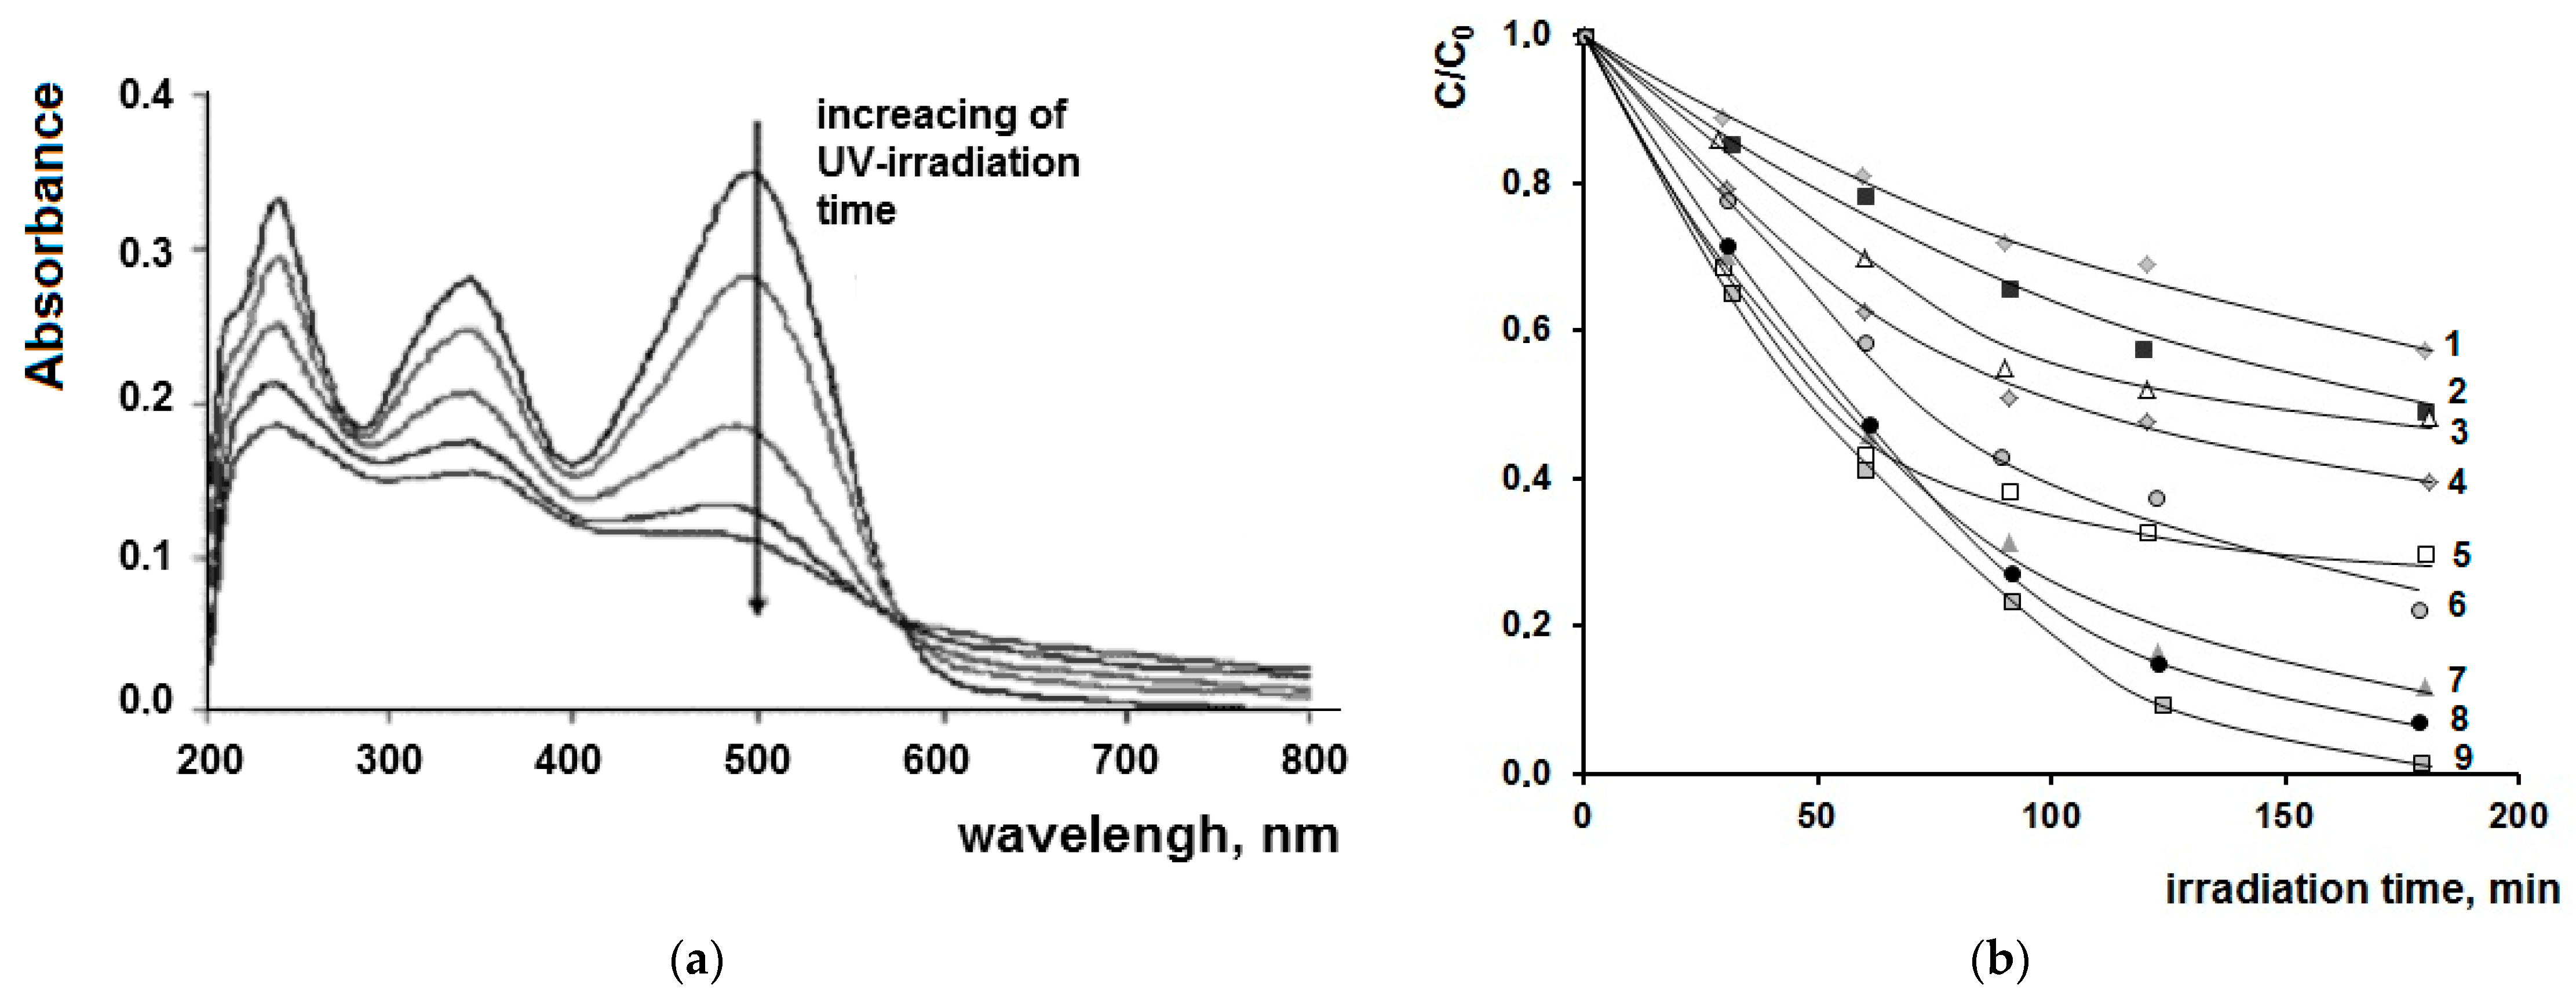
In contrast to MO, solutions of CR at UV irradiation start to decolorize already in the absence of catalysts, as evidenced by the reduced intensity of its characteristic absorption band at 500 nm (also related to the chromophoric azo group). However, the CR concentration decreases only by 25% during 3 h of UV irradiation in the absence of nanocomposite; the nanocomposites used lead to CR decomposition by 75% during the same period of time (Figure 5). The nanocomposite containing AN units and PTO doped with silver NPs (Figure 5b, curve 9) demonstrates the highest results. It is reported in [57,58] that the degradation of CR can be related both to the destruction of the chromophore azo group and to the detachment of the auxochrome NH2 group. In addition, the nitro and hydroxyl groups of biphenyl and naphthalene intermediates formed during the destruction of the azo group can also be oxidized by reactive oxygen species generated on the composite surface with the formation of aromatic products.
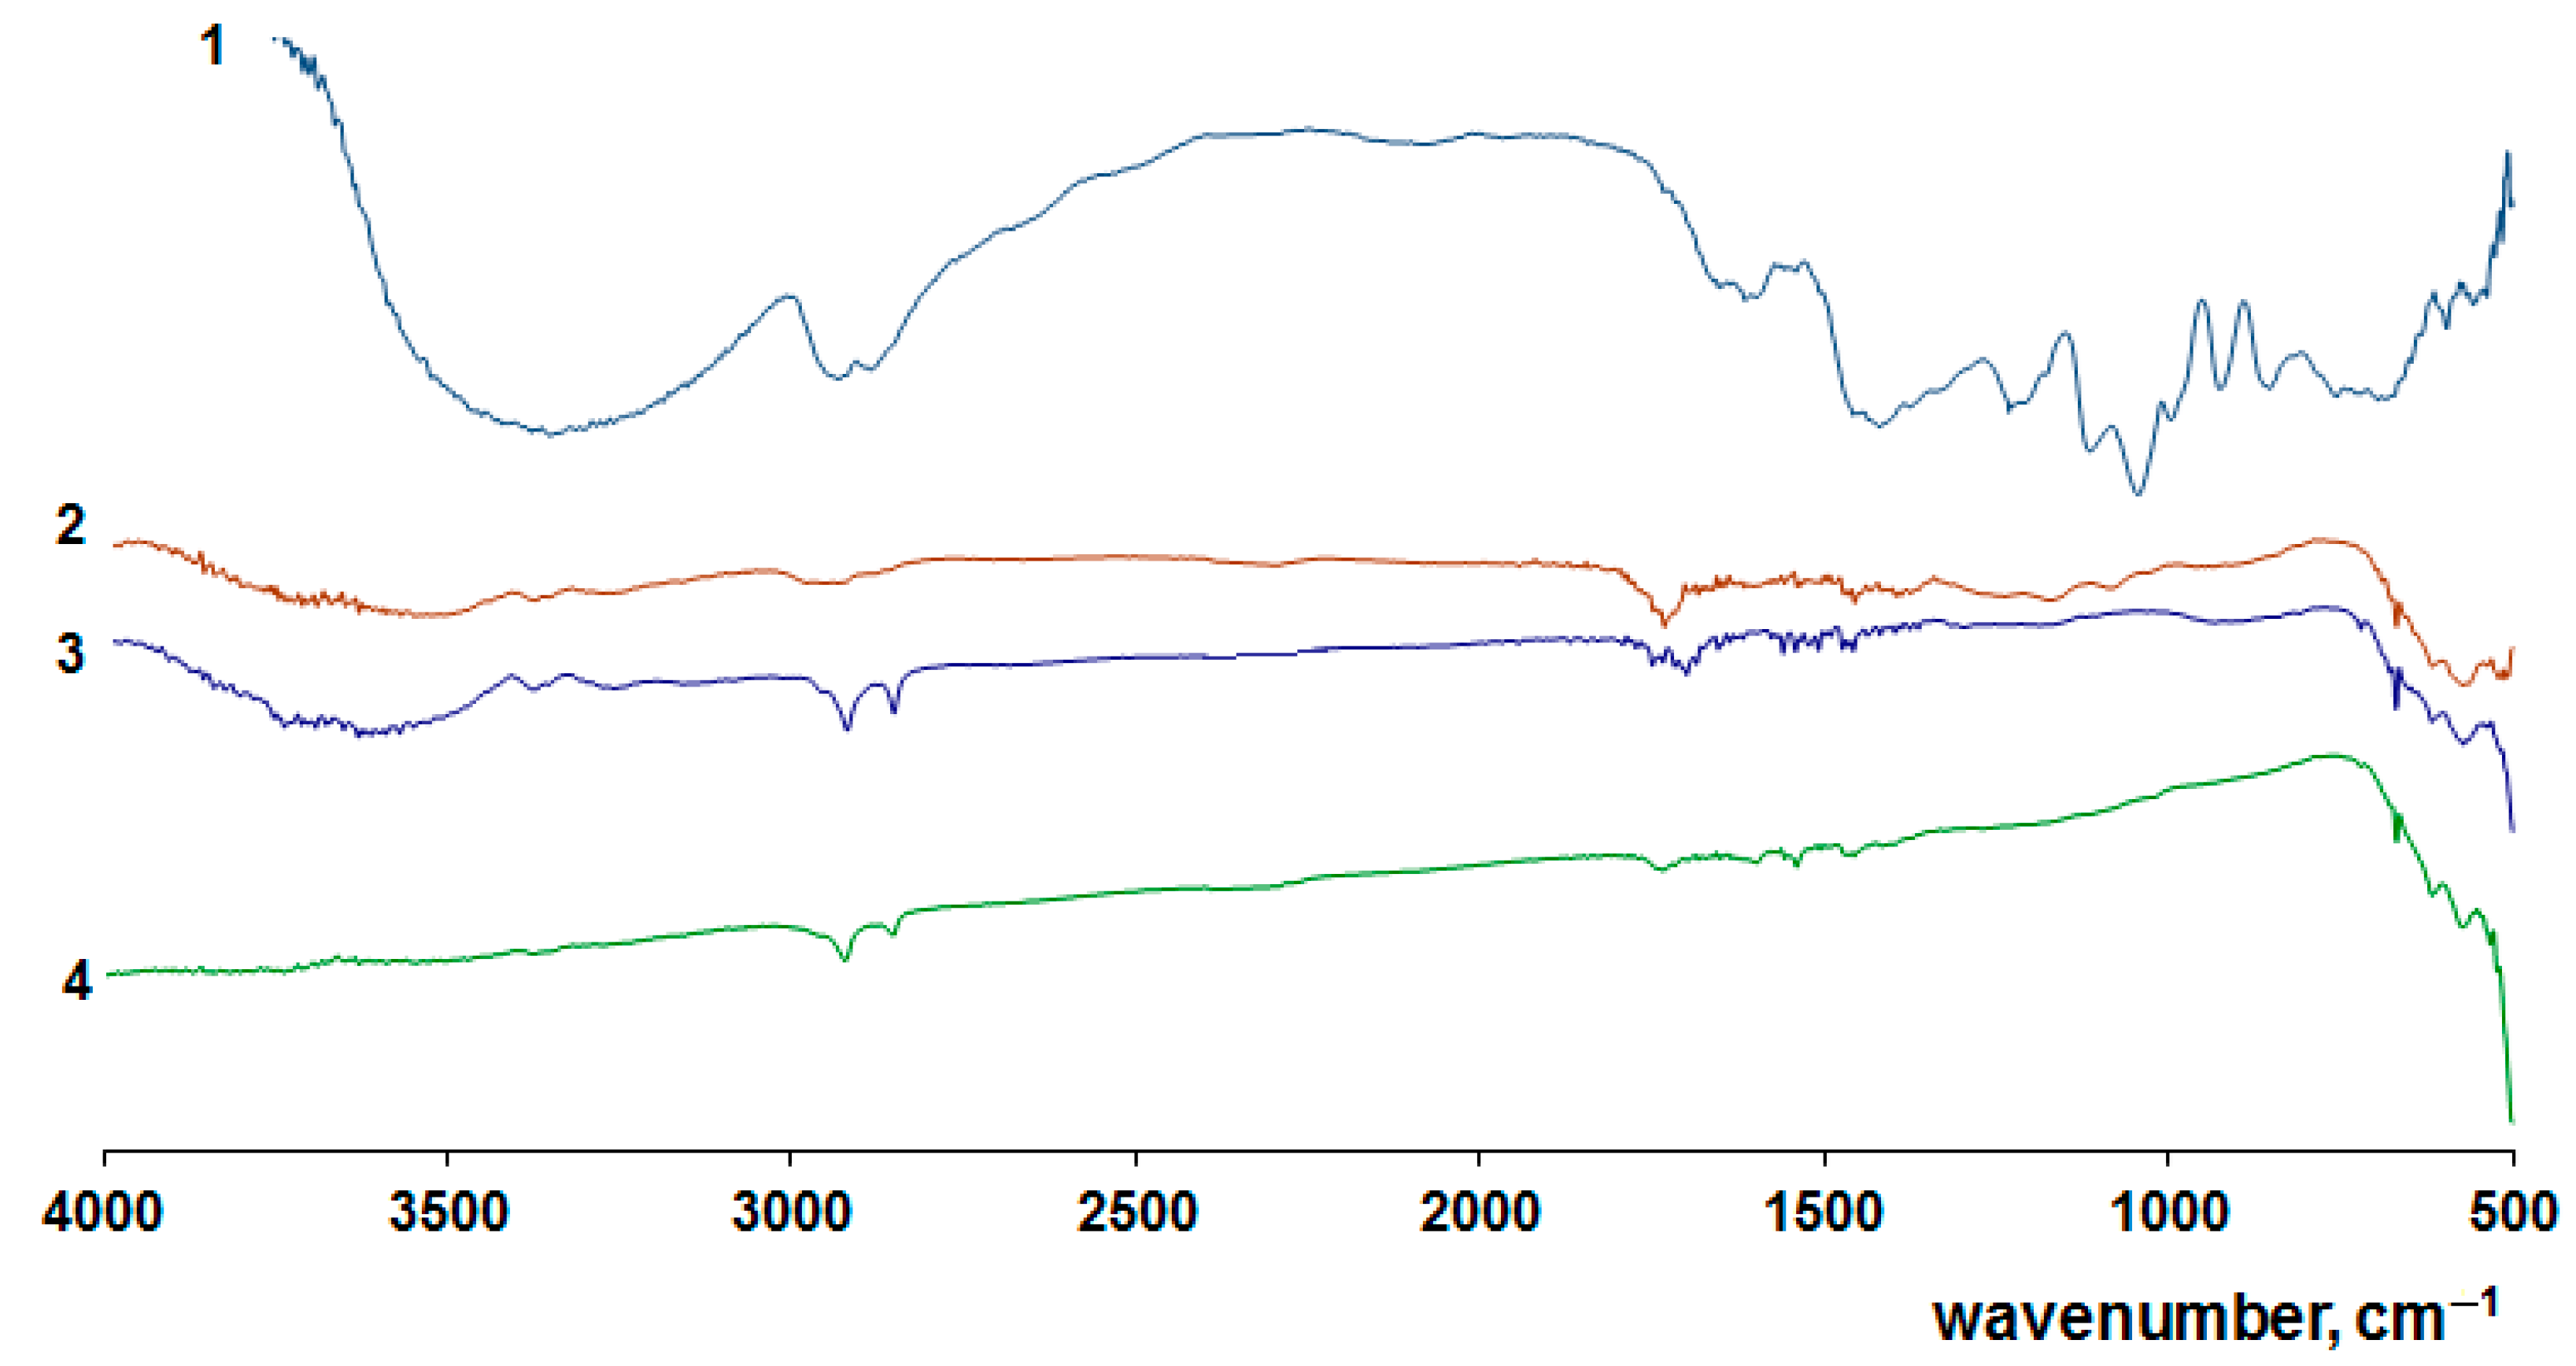
It can be assumed that the CR degradation in aqueous solution in the nanocomposites’ presence occurs by a similar mechanism, because the absorption bands at 1250–1020 cm−1 related to the C-N bond vibrations, and at 1520–1500 cm−1, related to the nitrogen group [59,60], gradually disappear in the IR spectra of the product’s CR decomposition (Figure 6).
Nitro and hydroxyl groups of biphenyl and naphthalene intermediates formed during the destruction of the azo group can also be oxidized by reactive oxygen species generated on the composites’ surface to form aromatic products. The presence of aromatic compounds in the products of the CR decomposition in solution when using nanocomposites under UV irradiation is reflected in the presence in their IR spectra of absorption bands at 2930–2850 cm−1, relating to the vibrations of the benzene ring.
The combination of results obtained on the application of PTO-containing nanocomposites for the decomposition of azo dyes indicates their high photocatalytic activity. This is most clearly manifested in the materials where the PTO is doped with silver NPs. In this regard, the photocatalytic properties of such nanocomposites were investigated in the decomposition reactions of phenol and para-nitrophenol (p-NP) under the action of both UV and visible light. Figure 7a shows the change in the spectra of p-NP solutions under UV irradiation in the presence of photocatalysts. It can be seen that there occurs a decrease in the optical density value at wavelength λ = 318 nm, which is typical of the NO2 group of p-NP [61,62]. On the basis of the spectral data using the calibration relation, the relative change of concentration of p-NP in solution under UV irradiation was calculated (Figure 7b).
The maximum possible conversion of p-NP for 400 min of UV irradiation of its solutions—by ~85%—is observed when using a composite with AN and PTO units doped with Ag NPs. In the absence of a catalyst, the change of p-NP concentration in solution does not exceed 5%.
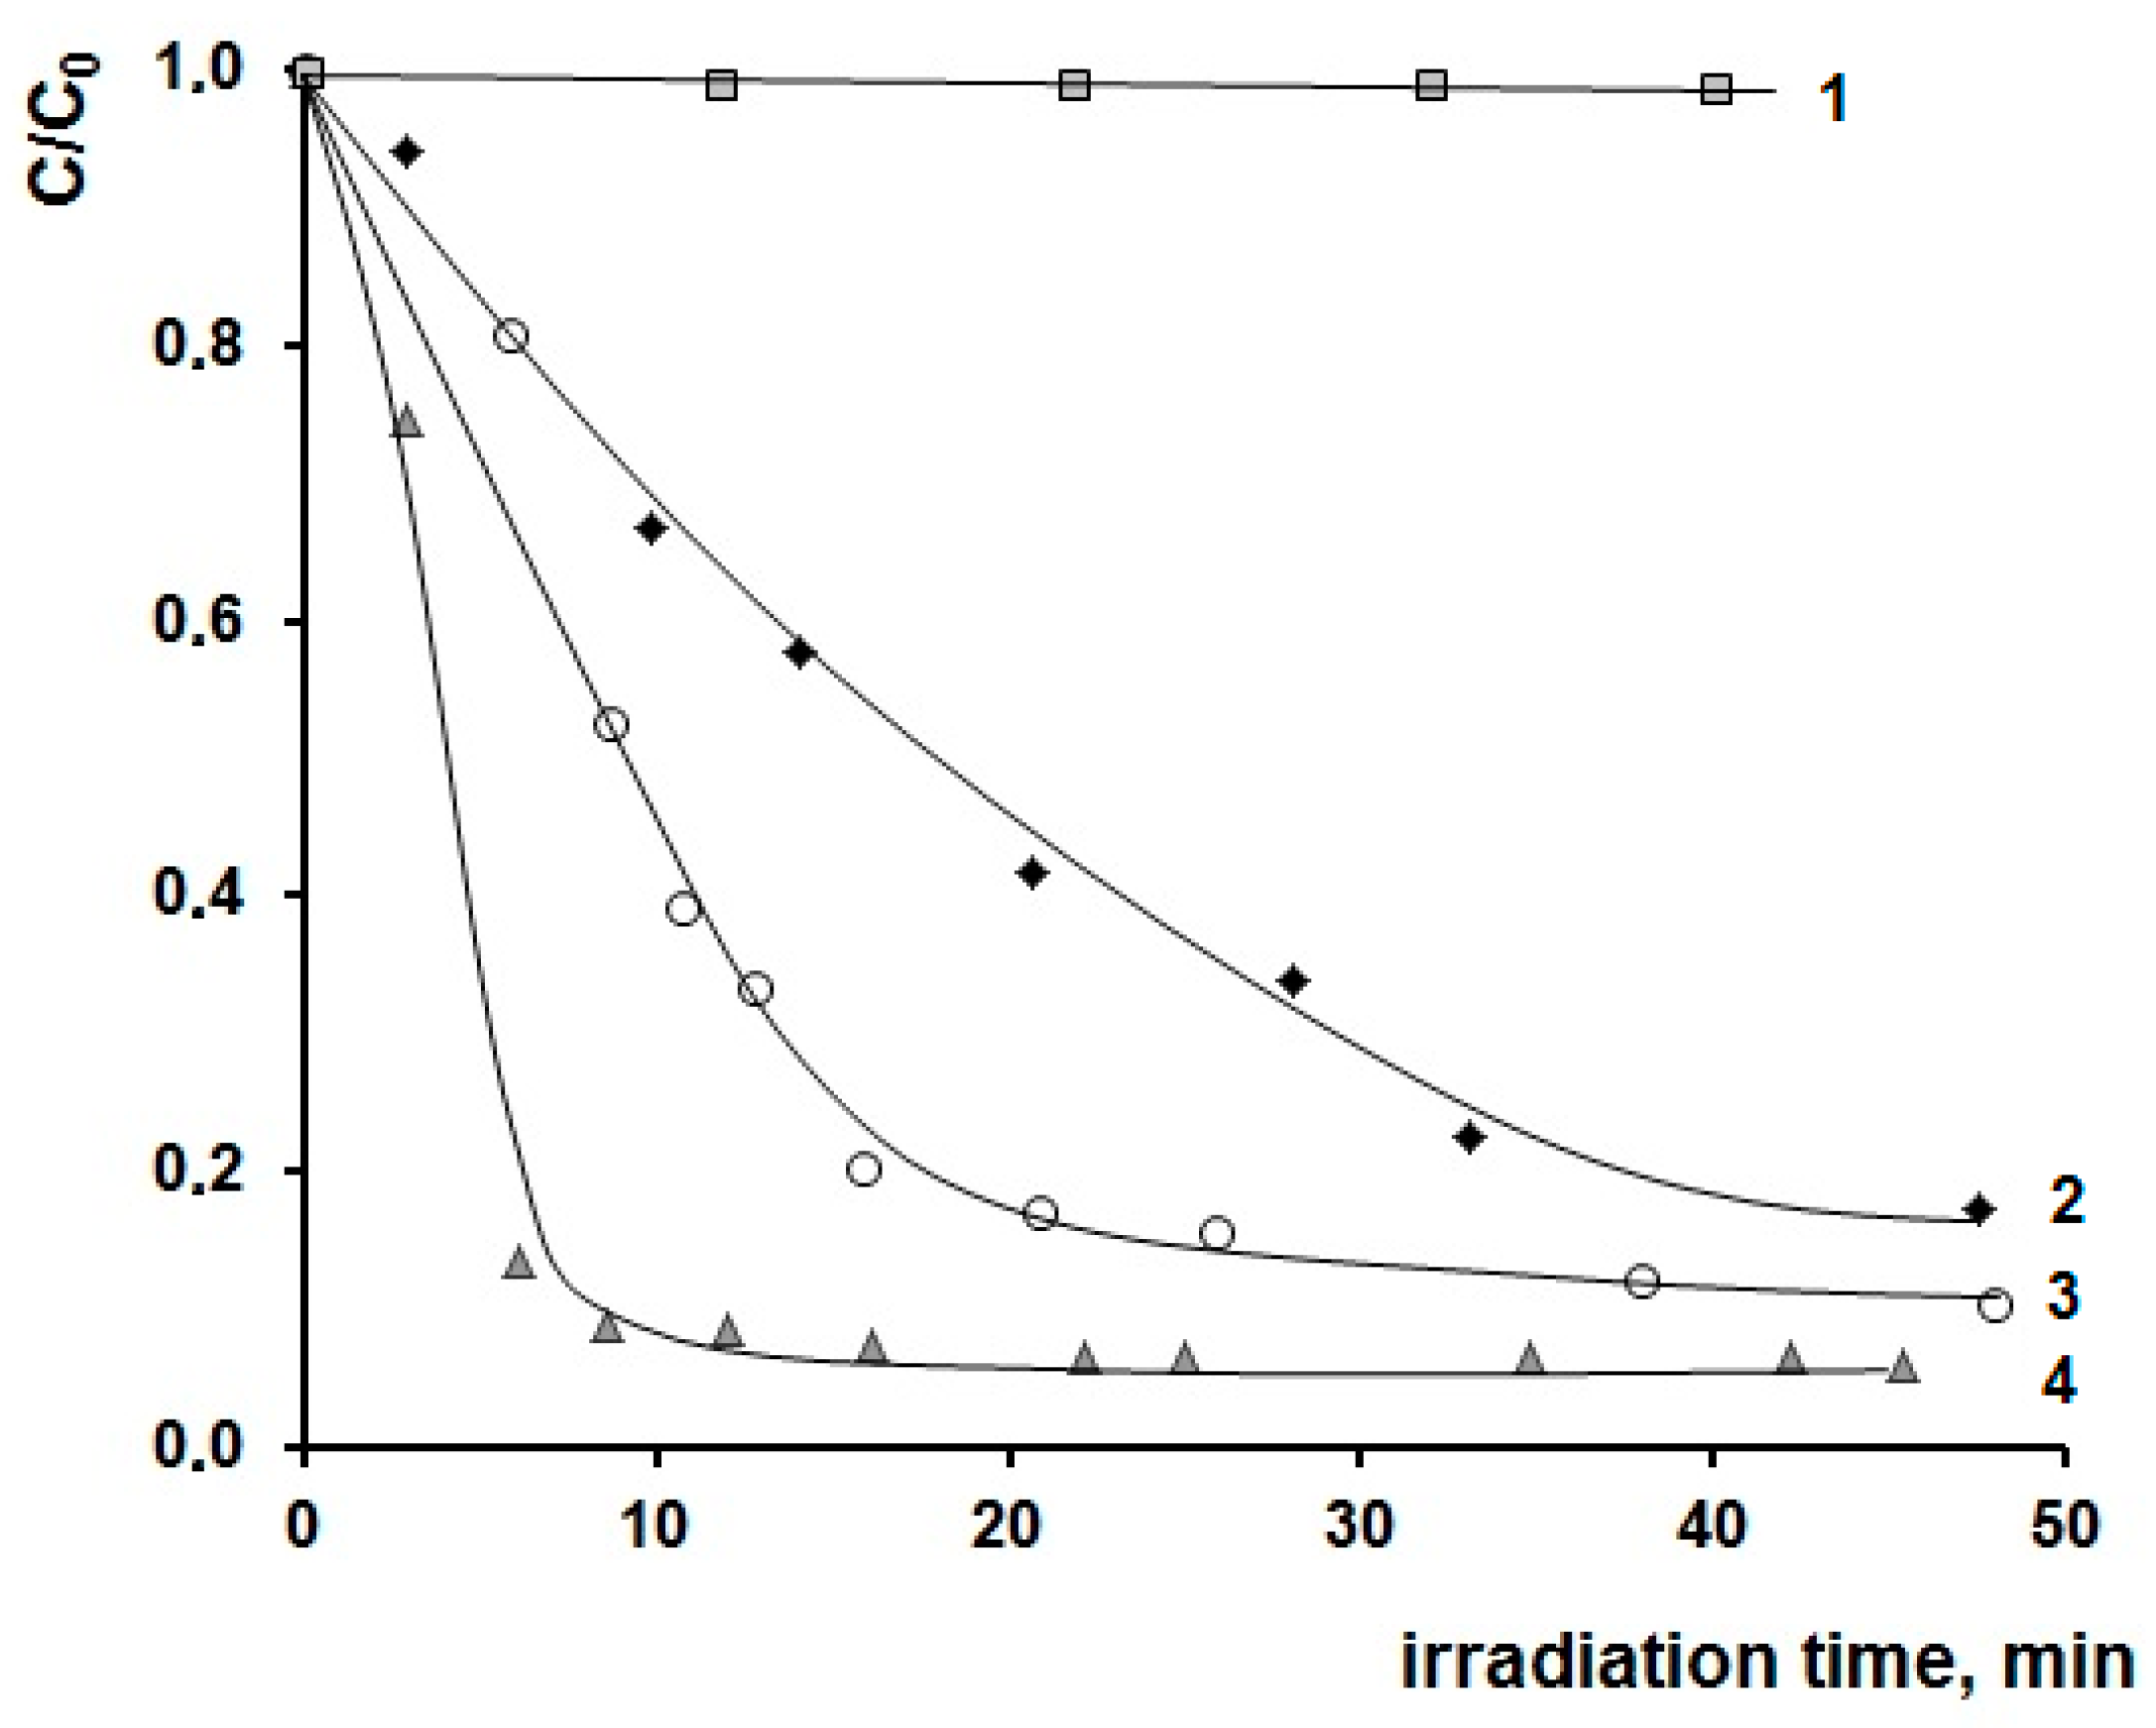
It turns out that during the studying of the photocatalytic activity of nanocomposites under the action of visible light in the p-NP degradation reaction, their efficiency appeared to be higher (Figure 8). In the absence of nanocomposites, the p-NP concentration in the solution did not change, while when nanocomposites were used, an acceleration of the reaction and an order-of-magnitude shorter p-NP conversion time compared to UV irradiation was observed.
UV irradiation in the presence of nanocomposites with AN units and Ag NPs caused the conversion of p-NP in the solution by a maximum of 85% for 400 min; then, in the case of visible light, the depth of p-NP decomposition had already been 94% for 12 min. Calculations show that the photocatalytic decomposition of p-NP at the early stages can be described by the first order equation. The rate constants of p-NP decomposition upon the irradiation of its solutions with visible light in the presence of the system [(≡TiO)n]:[HEMA]:[AN] + Ag NPs and [(≡TiO)n]:[HEMA] + Ag NPs are k = (20.51 ± 0.16)∙10−2 c−1 and k = (7.65 ± 0.32)∙10−2 c−1, respectively.
According to [63,64], during the UV irradiation of p-NP in the presence of titanium dioxide, there occurs the detachment of the—NO2 group, which is replaced by the OH group by electrophilic substitution. The hydroxylation products hydroquinone and 1,2,4-trihydroxybenzene are formed as a result. The compound 4-nitrocatechol [65] is also found as an oxidation intermediate of p-NP. Further oxidation of the intermediates leads to their complete mineralization into p-NP molecules to carbon dioxide and water [66].
IR analysis of the p-NP conversion products in our case showed that in p-NP spectra under UV irradiation and in the presence of nanocomposite, the bands typical for NO2-groups (1500–1560 cm−1) disappeared and the bands corresponding to the stretch vibration of carbonyl (-C=O) group appeared (1720–1790 cm−1) (Figure 9). It can be inferred that when using nanocomposites as intermediate reaction products, a mixture of hydroquinone, benzoquinone, and N-oxime are formed, which corresponds to the data of [67]. In the spectra of the reaction products, when the system was irradiated with visible light, only bands related to small inorganic molecules had already been detected after 40 min of irradiation, which suggests the complete oxidation of p-NP to CO2, water and nitrile, and nitrate ions occur, as described in papers [7,68].
The investigation results of the photocatalytic activity of nanocomposites containing nanostructured PTO doped with Ag NPs under the action of both UV and visible light on phenol solutions are shown in Figure 10 and Figure 11. The conversion of phenol in aqueous solution (C = 19 mmol/L) was monitored with the spectrophotometric method of changing the optical density of its solutions at wavelengths of 270 nm and 400 nm. According to previous research [69,70], these bands reflect the presence of OH groups in phenol.
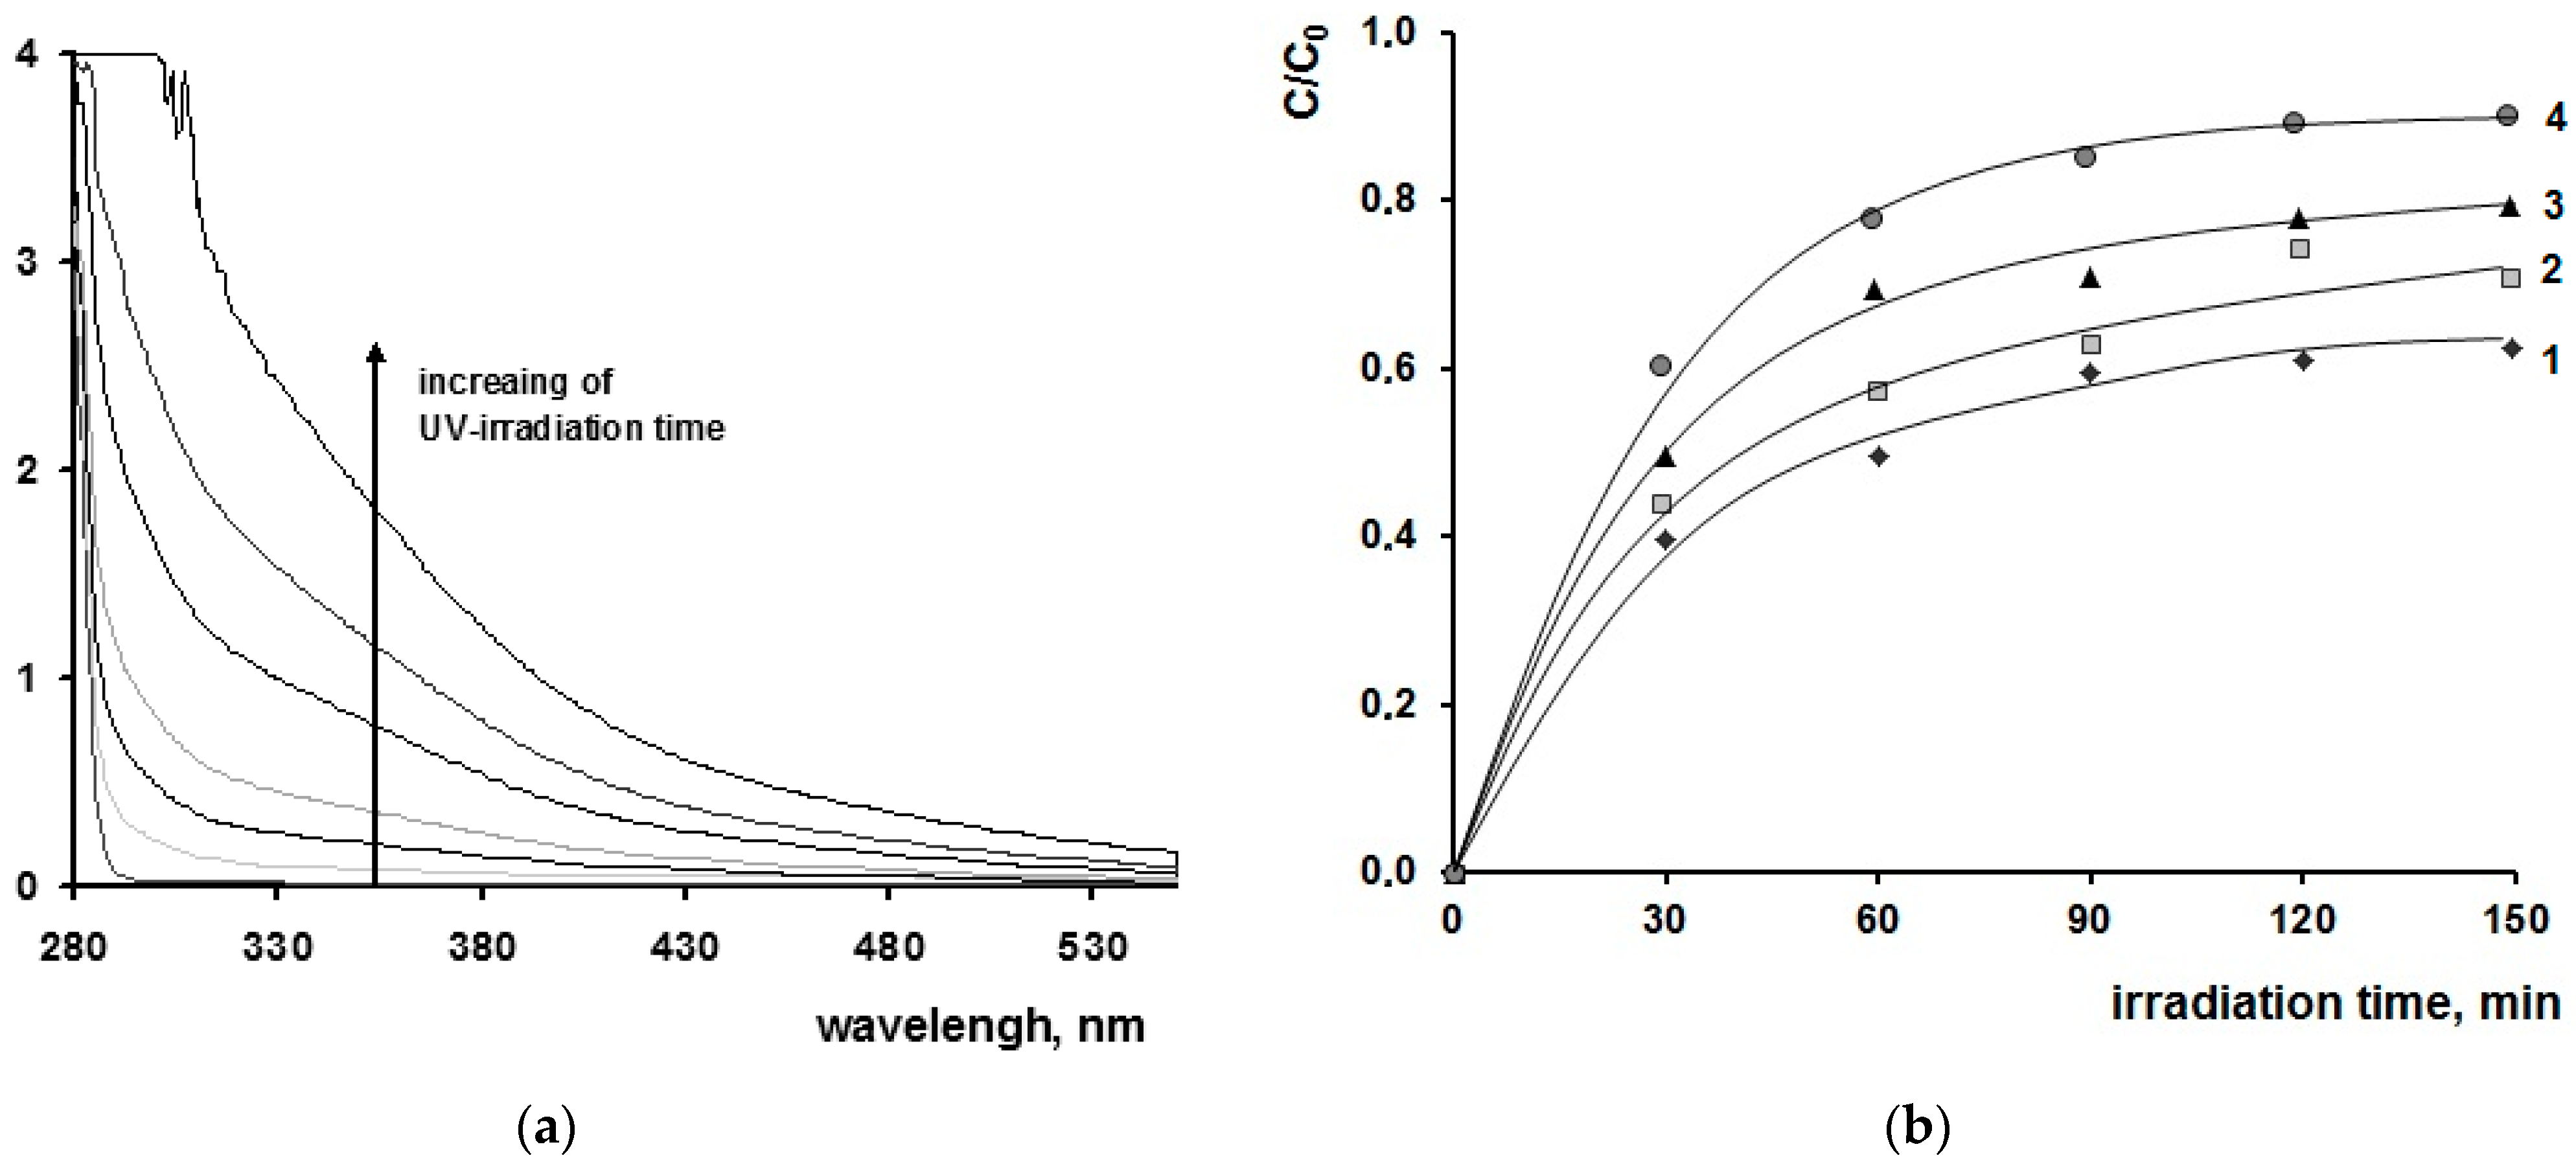
The UV irradiation of phenol solutions leads to an increase in the absorption band of its solutions at a wavelength of 400 nm, even in the absence of nanocomposites in the system (Figure 10a). Thus, the oxidation of phenol by ~40% for 2.5 h can occur without the use of nanocomposites.
However, the application of nanocomposites [(≡TiO)n]:[HEMA]:[BMA], [(≡TiO)n]:[HEMA] and [(≡TiO)n]:[HEMA]:[BMA] modified with silver NPs under UV irradiation leads to a much deeper transformation of phenol by 65, 78 and 89% during the same time, respectively.
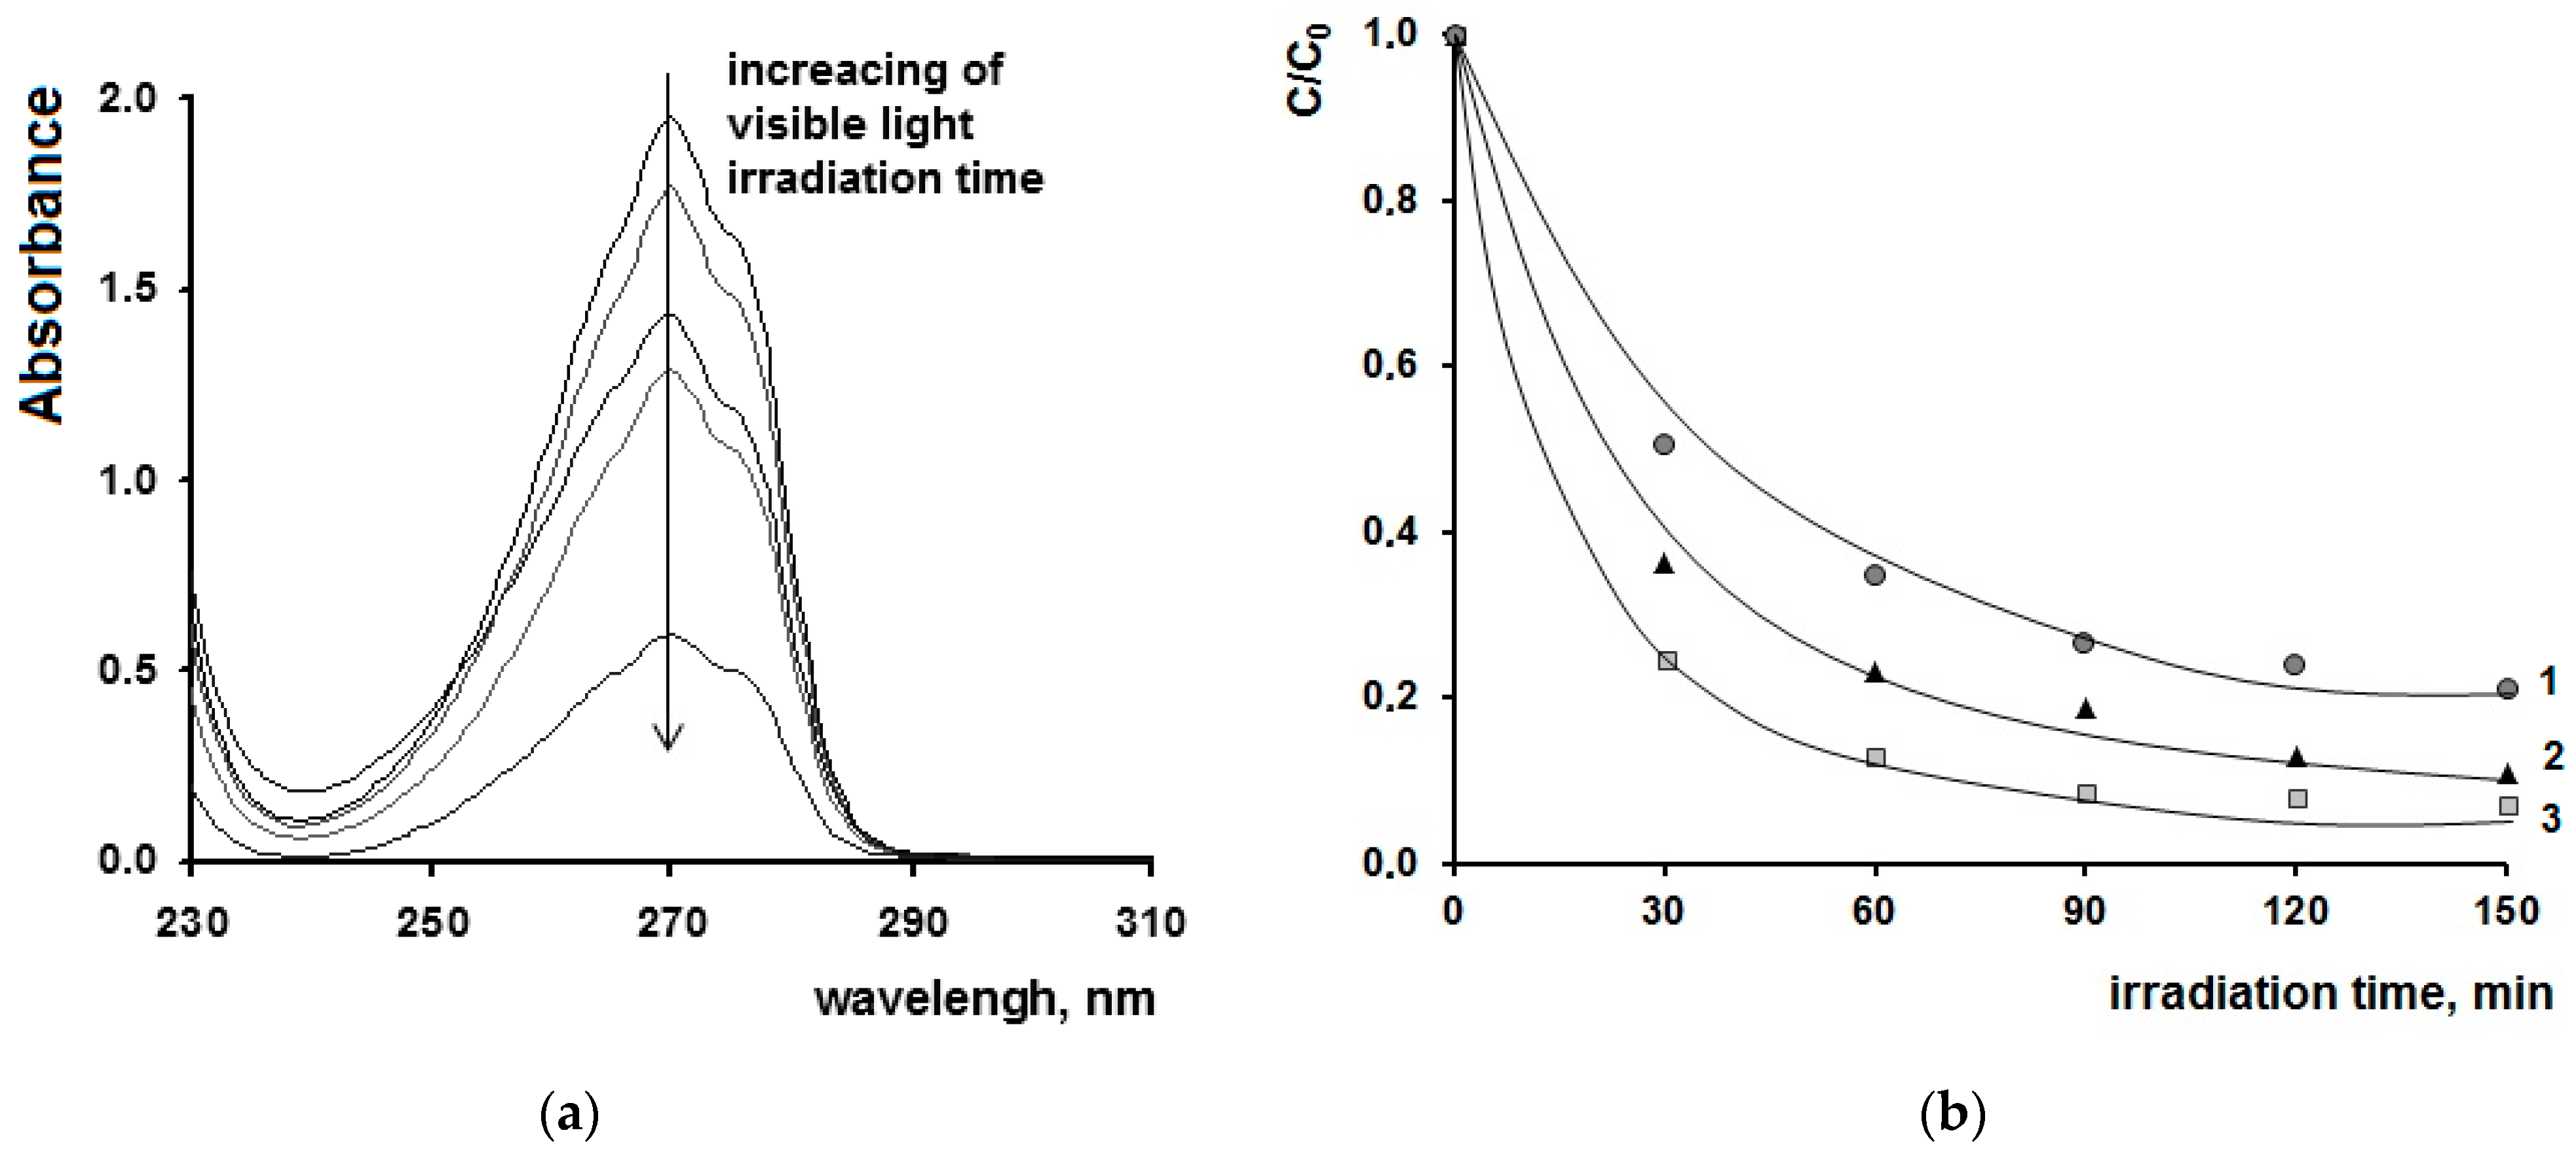
Under the action of visible light on phenol solutions in the presence of nanocomposites, a change in the optical density at λ = 270 nm was observed in the spectrum of the solution (Figure 11a). In this case exactly, this band was chosen as the indicator that would be responsible for phenol concentration in the solution. The dependence of the relative concentration of phenol in solution on time were constructed from spectral data (Figure 11b).
It is seen from the figure that for 1 h of irradiation in the presence of nanocomposite with AN and PTO doped with Ag NPs, the conversion of ~90% of phenol occurs.
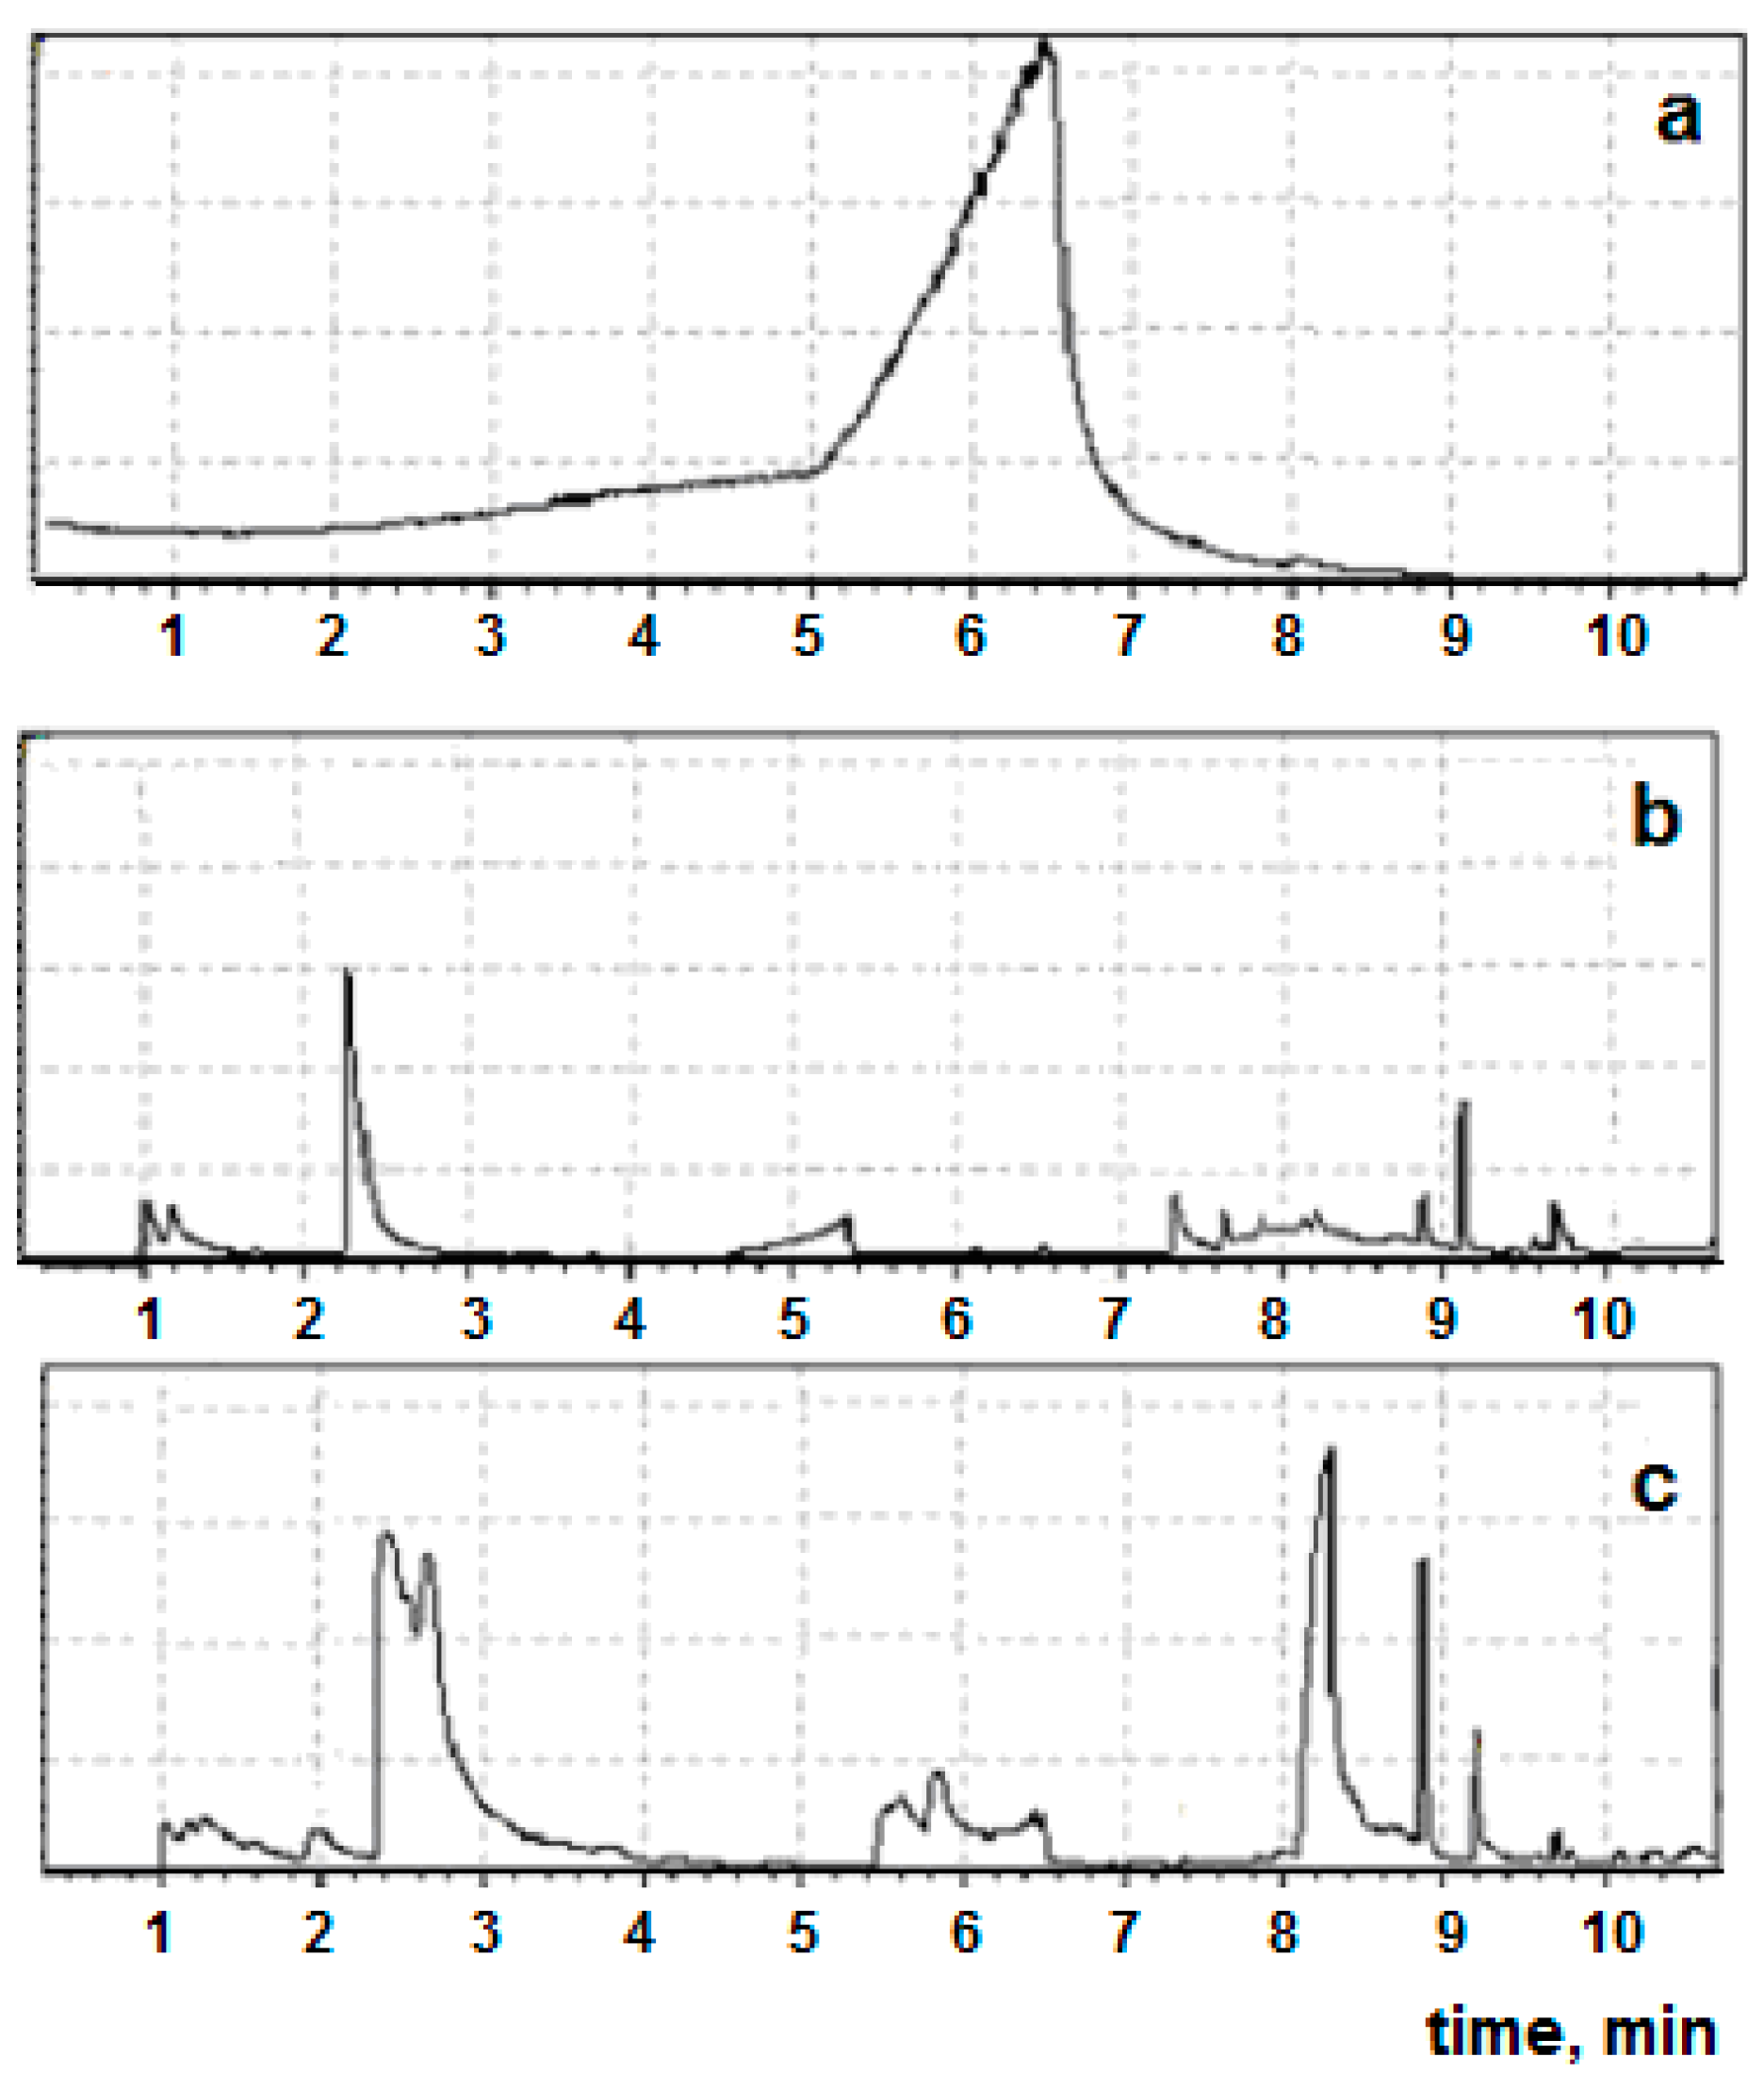
A different picture of changes in the spectra of the phenol solutions during its photocatalytic transformation under UV and visible light seems to be connected with the formation of different intermediate products. Studies from the previous years have been carried out using chromatography-mass spectrometry. For this purpose, at 260 °C, corresponding to the phenol melting point, the reaction products that are obtained after 1 h of light irradiation to the phenol solutions were investigated. The chromatograms are shown in Figure 12.
The chromatogram of the initial phenol shows only one peak at 6 min, which disappears in the chromatograms of its products. According to the integrated library of the chromatography-mass spectrometer, the intermediate products of the phenol transformation are:
  • In the case of UV light—CO2, 2-butanone, 2-propionic acid;
  • In the case of visible light—CO2, acetone, 2-propanol, butanediol—1,4, 2,4-dimethylpentanone-3, butyric acid butyl ester, 2-methyl-2-(2-hydroxyethoxy)acetic acid ethyl ester.
Not even trace amounts of phenol are observed in the IR spectra of the products of the complete transformation of phenol, which indicates its complete mineralization (Figure 13).
The mechanism of phenol phototransformation under the action of UV light in the presence of TiO2 has been reviewed in detail by authors [71,72]. According to spectral data, during the UV irradiation of phenol solutions, apparently, their oxidation occurs due to the replacement of hydrogen atoms in the benzene ring by OH groups, due to the generation of large numbers of OH radicals in solutions in the presence of photocatalysts [73,74]. It can be assumed that the complete mineralization of phenol occurs through the formation of several reaction intermediates, such as p-benzoquinone, o-benzoquinone and hydroquinone, and/or maleic and other carboxylic acid compounds [75].
We can suggest that phenol transformation begins with the eliminating of the hydroxyl group from the benzene ring when phenol solutions are irradiated with visible light, as described in [76], the consequence of which is the decrease in the intensity of its solution band at 270 nm.
Another piece of evidence for the photocatalytic decomposition of pollutants in water is the results of the analysis of the total carbon content in the solutions. Table 1 shows the values of total, organic and inorganic carbon in the water samples.
The data in Table 2 show that the application of the developed nanocomposites as photocatalysts under the action of both UV and visible light reduces the concentration of pollutants in water.
The enhancement of the photocatalytic activity of the nanocomposites where the PTO is doped with gold or silver NPs under light irradiation in a wide wavelength range seems to be related to the change in the band gap of the PTO (Table 1). The results of diffuse reflection and calculations using the Kubelka–Munk absorption function (Figure 14) showed that the introduction of a third monomer, BMA or AN, into the materials had almost no effect on the value of the band gap of PTO, which remained at 3.2–3.3 eV. PTO doping with gold and silver NPs reduced this parameter to 2.49 eV and 2.11 eV, respectively (Table 1). The metal NPs presence’s effect on the PTO band gap can be attributed to:
  • Charge transfer transitions between the d-electrons of the metal and the conduction band or valence band of the PTO;
  • Formation of impurity levels in band gap of the PTO; if these energy levels are located close to the edges of band gap, then they can overlap it, thus its width decreases [77];
  • The appearance of allowed energy states in the band gap of TiO2, as a consequence of the presence of segregated clusters of MxOy on its surface [78], which can transfer excited state energy from NPs into the conduction band of the PTO according to the scheme proposed earlier for powdered titanium dioxide [79]. At the same time, the recombination rate of the electron-hole pair will decrease, and its lifetime will increase.
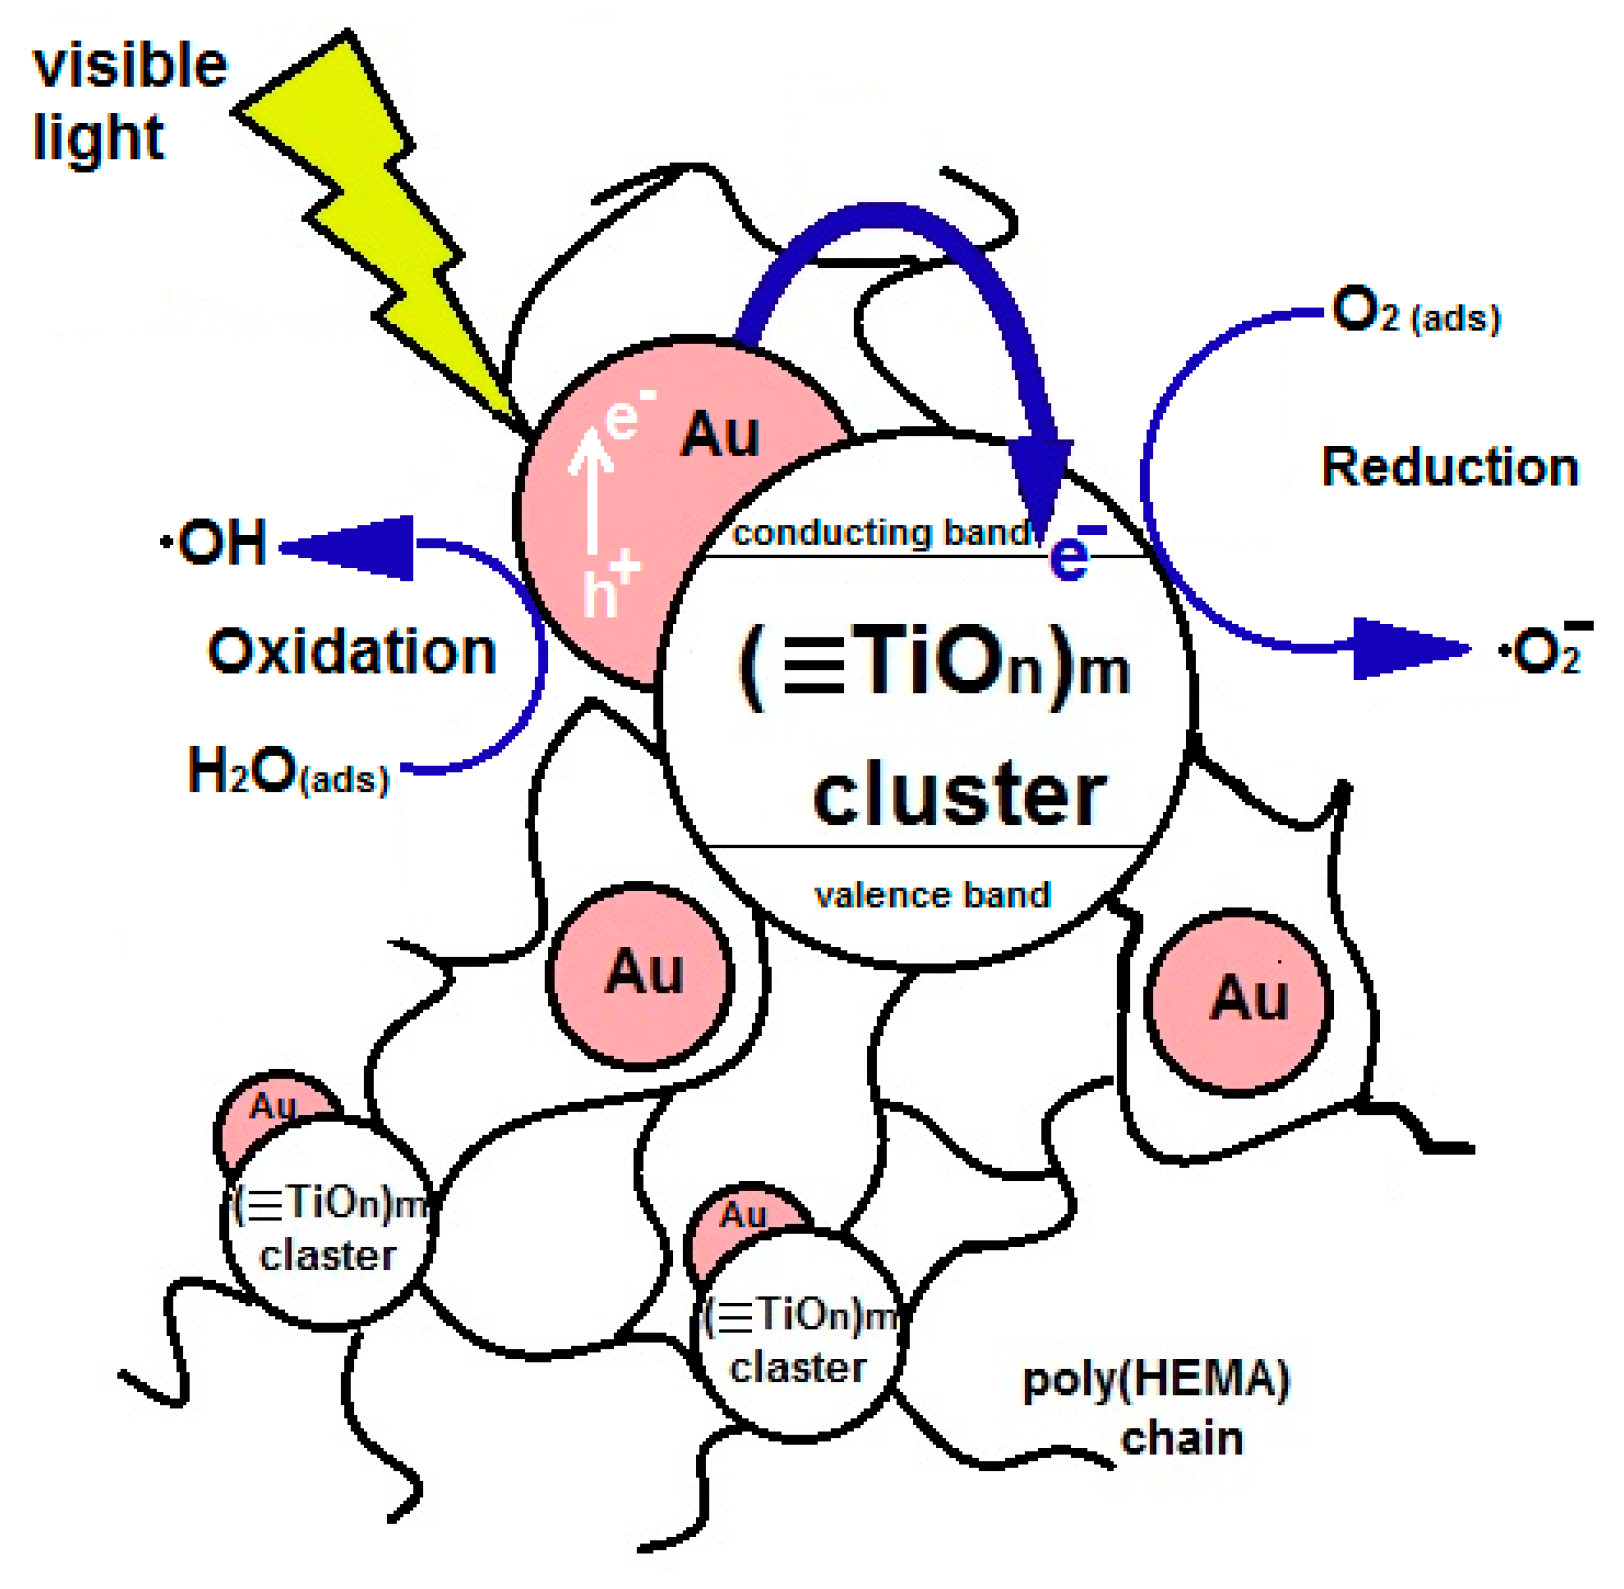
We used literature data to describe the mechanism of photocatalytic processes occurring on the surface of the polymer nanocomposites containing PTO. We believe that Au (Ag) NPs transfer the absorbed excited state energy to the conduction band of the PTO NPs, as it was previously proposed for TiO2-anatase [80] (Figure 14).
It can be assumed that the reason for the increased photocatalytic activity of the copolymers doped with Au (Ag) NPs is related to the difference in the Fermi levels of PTO particles and Au (Ag) NPs [67]. The Fermi level of the Au (Ag) NPs is higher than that of TiO2 and, consequently, that of PTO clusters [25]. The Au and Ag particles in the copolymer structure are located in close proximity to the PTO clusters [39]. In this regard, surface plasmons of metal NPs, collectively oscillating under the action of visible radiation, immediately migrate to the conduction band of PTO. As a result, the Ti–O bond is excited, accompanied by its rupture, and the one-electron transition Ti4+ + e → Ti3+ takes place. This leads to the formation of O2 ions, superoxide and hydroxyl radicals, which are involved in the oxidation of organic substances in water.

3. Materials and Methods

3.1. Synthesis of Nanocomposites

Polymeric nanocomposites containing nanostructured poly(titanium oxide) were synthesized from titanium isopropoxide Ti(OPri)4 (ACROS Organics, Geel, Belgium, base substance content 98%, without additional purification), hydroxyethyl methacrylate (HEMA) (Sigma Aldrich, Darmstadt, Germany, base substance content 99.9%, without further purification) as main components, and acrylonitrile (AN) or butyl methacrylate (BMA) as third monomers, purified by vacuum distillation according to conventional procedures. The synthesis of the samples involved the polycondensation of titanium alkoxide in organic monomer medium and the subsequent radical polymerization of the system at 70 °C, and is described in detail in our previous papers [37,38]. Molar ratio of the components in all cases was [Ti(OPri)4]:[HEMA]:[M] = 1:5:1 (where M is HEMA, AN or BMA).
Into the reaction system precursors, AgNO3 (JSC «Uralskiy zavod chimicheskikh reagents», Moscow, Russia) and HAuCl4 (gold content not less than 48%, JSC “Aurat”, Moscow, Russia) were additionally introduced at the stage when the components mixed in the concentration with 1 wt. % by Ti(OPri)4 mass for obtaining materials with PTO doped with Au or Ag NPs. In all cases, a single batching up of all reagents into reaction mixture was carried out.
The result of synthesis is solid polymer composites with a molar ratio of organic and inorganic component units [(≡TiOn)m]:[HEMA]:[M] = 1:5:1 (where M is HEMA, AN or BMA, (≡TiOn)m is poly(titanium oxide)) as thin films and bulk samples. Gold or silver nanoparticles were formed by UV irradiation of solid samples after their synthesis. The UV radiation source was a mercury lamp DRT-230 (power 1600 mW/m2).

3.2. Investigation of Nanocomposites’ Optical Properties

The formation of Ti3+ centers in the materials during UV irradiation conditioned by the one-electron transition Ti4+ + e → Ti3+ with the breakage of the Ti–O bond was controlled by the spectrophotometric method of increasing the absorption band in the region of 600–700 nm. The gold and silver NPs’ formation in the materials was monitored by the appearance and growth of plasmon resonance bands in the regions of 390–420 nm (Ag NPs) and 500–600 nm (Au NPs). Spectrophotometer SHIMADZU—UV-1650 PC (Tokyo, Japan) has been used in previously mentioned research.
The band gap of the PTO in polymeric composites was determined on the basis of their diffuse reflectance results. Diffuse reflection spectra of the samples were obtained using an optical system that included a halogen lamp (2–4.5 eV), a monochromator, a monochromatic beam profile formation system, an integral sphere and a photomultiplier tube. The samples were placed in the integrated sphere perpendicular to the emitting light. The detector was placed at a 90° angle to the line between the entrance hole of the sphere and the sample. The band gap width was determined using the Kubelka–Munk function [81]:
F ( R ) = ( 1 R ) 2 2 R = k s
where R = I s a m p l e I s tan d a r d —relative diffuse reflectance; k—absorption coefficient; and s—scattering coefficient.
The Kubelka–Munk function is proportional to the absorption coefficient α:
( F ( R ) ) 2 = C ( h ν E g )
where ν is the frequency, h is Planck’s constant, and C′ is the coefficient of proportionality.
The linear part of the dependence F(R) = f() was extrapolated up to the intersection with the abscissa axis, which allowed for the determining of the value of the band gap energy Eg of PTO in the material. As an example, Figure 15 shows the Kubelka–Munk function graphs of some samples and marks the linear sections by which the band gap energy of PTO in polymer nanocomposites was determined.

3.3. Study of the Structure of Materials Based on Organic-Inorganic Copolymers

The structure of synthesized materials was studied by X-ray diffraction analysis (XRD). X-ray diffractograms were recorded on an XRD-6000 diffractometer by Shimadzu (Tokyo, Japan, CuKα-radiation, reflection imaging geometry) with scanning step 0.02 in the range of 2θ 10–60°. The accuracy of diffraction angles (2θ) was ±0.02°. The intensity of diffraction peaks was estimated by their height (100-ball scale), and the inorganic phase in the polymer was identified with the «Find It» database.
The study was conducted for powders remaining after the degradation of the composites’ organic part. For this purpose, samples were heat-treated in a muffle furnace at a temperature of 300 to 400 °C when the temperature of the organic polymer matrix destruction was reached but the polymorphic transition of anatase into rutile was excluded. Crystallite size—D (in angstroms)—in powders was determined by the Scherrer formula given in Equation (3):
D = K λ ( a 2 cos θ )
where K is Scherrer coefficient equal to 0.94; λ—wavelength equal to 0.15418 nm for Cu-Kα; a—half-width; and θ—diffraction angle of the transducer.
The morphology and elemental analysis of the surface of polymer composite films were characterized using a JEOL JSM-IT300LV scanning electron microscope (JEOL Inc., Peabody, MA, USA) equipped with energy and wave dispersion elemental analyzers.

3.4. Investigation of Photocatalytic Activity

Photocatalytic properties of obtained nanocomposites were studied in aqueous solutions in the reactions of the azo dyes’ (methylene orange (MO), congo red (CR)) decomposition under UV irradiation and phenol and para-nitrophenol (p-NP) under the action of both UV and visible light. Concentrations of the substances in solutions are given in Table 3.
For the experiment, there were selected aliquots of these solutions in which powdered polymer composites were placed as photocatalysts. The ratios of the components in the photocatalytic cells are shown in Table 2. The thickness of the absorbing layer in each cell was 2 cm.
The obtained suspensions were incubated to achieve adsorption–desorption equilibrium in the heterogeneous system. The photocatalytic cells were covered with quartz glass when experiments were conducted with UV light, while when using visible light, they were covered with a light filter «ZhS-11» which emits light with a wavelength greater than 410 nm, cutting off the UV part of the spectrum. A DRT-230 lamp was used as a source of UV light (distance from the lamp—17 cm, power—1600 mW/cm2, the most intense emission bands—313 nm, 330 nm, 366 nm), and lamp KGM-24-150 (illumination in the plane of the cell with the solution was 24 kLk when irradiated with full lamp light) was used as visible light source.
Spectra of azo dyes and phenols solutions were recorded for every 30 min of irradiation in order to control their decomposition by changes in intensity of characteristic absorption bands indicated in Table 1. Absorption spectra were recorded using a SHIMADZU—UV-1650 PC spectrophotometer. At the end of the process, the dependences of changes in the concentration of azo dyes and phenol solutions on the time of their irradiation were plotted: C/C0 = f(t) (C—current concentration, mmol/L, C0—concentration of original solution of the substance, mmol/L). For this purpose, calibration dependences of the optical density of the characteristic absorption band maximum on the water pollutant concentration were preliminarily plotted.
Products of photocatalytic transformation of substances in solutions were studied by infrared spectroscopy on Infralum FT 801 (Simex, Novosibirsk, Russia) and pyrolysis-gas chromatography mass spectroscopy using GCMS-QP2010 Ultra “SHIMADZU” (Tokio, Japan).

3.5. Total Organic Carbon Analysis

Determination of total organic carbon was carried out according to the certified method M-02-2405-13 of LLC “ANALIT PRODUCTS”.
Measurement of carbon in the samples was carried out in parallel by two methods—differential TOC, as the difference of total carbon and inorganic dissolved carbon dioxide, and measurement of NPOC organic carbon not removed by purging. The analysis settings for both methods were set to 2 M hydrochloric acid (+0.5%). The NPOC flow and purge times were set to 100 mL/min and 60 s, respectively.

4. Conclusions

The combination of the results obtained allows us to conclude that composites containing nanostructured PTO in optically transparent polymeric matrices exhibit high photocatalytic properties under UV irradiation during the decomposition of organic pollutants in water at a PTO concentration in the volume of the purified system of 0.05 g/L. The PTO doping with gold or silver NPs increases the activity of the materials by 1.5 times under the action of UV light, and it leads to the manifestation of their high efficiency under visible light action on the solutions of persistent organic pollutants. It was found that phenol and para-nitrophenol in this case turn into harmless substances for the surrounding environment.
The advantage of the nanocomposites developed is also the simplicity of their synthesis. It involves a single batching up of all components, including precursors of the gold and silver NPs HAuCl4 and AgNO3, and a simultaneous hydrolytic polycondensation and radical polymerization of the system. At the end of the synthesis, the optically transparent nanocomposites containing PTO in the form of clusters of predominantly anatase polymorphic modification of an average size of ~12 nm and corresponding precursors were obtained. Subsequent UV irradiation of the composites for 2 h provided the PTO doping of gold or silver nanoparticles with sizes ranging from 12 to 31 nm and 9 to 23 nm, respectively.

Author Contributions

Conceptualization, E.S. and L.S.; methodology, E.S. and P.S.; investigation, E.S., P.S. and V.K.; data curation, L.S.; writing—E.S. and L.S.; writing—review and editing, E.S. and V.K.; visualization, E.S.; supervision, L.S.; project administration, E.S.; funding acquisition, E.S. All authors have read and agreed to the published version of the manuscript.

Funding

This research was funded by a grant from the President of Russian Federation, grant number MK-2195.2021.1.3.

Data Availability Statement

Data is contained within the article.

Acknowledgments

This work was carried out using the equipment of the Collective Use Center “New Materials and Resource-saving Technologies” (N.I. Lobachevsky State University of Nizhny Novgorod). The authors express their deep gratitude to Evgeny Bulanov, associate professor in the Chemistry Faculty of N.I. Lobachevsky State University of Nizhny Novgorod, for the X-ray diffraction analysis, and to Aleksander Piskunov, Vice Director of the Institute of Organometallic Chemistry of the Russian Academy of Sciences (Nizhny Novgorod), for EPR measurements.

Conflicts of Interest

The authors declare no conflict of interest.

References

  1. Fujishima, A.; Honda, K. Electrochemical Photolysis of Water at a Semiconductor Electrode. Nature 1972, 238, 37–38. [Google Scholar] [CrossRef] [PubMed]
  2. Fujishima, A.; Zhang, X.; Tryk, D. Heterogeneous photocatalysis: From water photolysis to applications in environmental cleanups. Int. J. Hydrog. Ener. 2007, 14, 2664–2672. [Google Scholar] [CrossRef]
  3. Zhu, S.; Wang, D. Photocatalysis: Basic principles, diverse forms of implementations, and emerging scientific opportunities. Adv. Energy Mater. 2017, 7, 1700841. [Google Scholar] [CrossRef] [Green Version]
  4. Marcì, G.; Palmisano, L. Heterogeneous Photocatalysis. Relationships with Heterogeneous Catalysis and Perspectives, 1st ed.; Elsevier: Amsterdam, The Netherlands, 2019; pp. 1–24. [Google Scholar]
  5. Tsang, C.H.A.; Li, K.; Zeng, Y.; Zhao, W.; Zhang, T.; Zhan, Y.; Xie, R.; Leung, D.Y.C.; Huang, H. Titanium oxide-based photocatalytic materials development and their role in air pollutants degradation: Overview and forecast. Environ. Int. 2019, 125, 200–228. [Google Scholar] [CrossRef]
  6. Fujishima, A.; Rao, T.N.; Tryk, D.A. Titanium dioxide photocatalysis. J. Photochem. Photobiol. C Photochem. Rev. 2000, 1, 1–21. [Google Scholar] [CrossRef]
  7. Schneider, J.; Matsuoka, M.; Takeuchi, M.; Zhang, J.; Horiuchi, Y.; Anpo, M.; Bahnemann, D.W. Understanding TiO2 Photocatalysis: Mechanisms and Materials. Chem. Rev. 2014, 114, 9919–9986. [Google Scholar] [CrossRef]
  8. Reddy, P.V.G.; Reddy, B.R.P.; Reddy, M.V.K.; Reddy, K.R.; Shetti, N.P.; Saleh, T.A.; Aminabhavi, T.M. A review on multicomponent reactions catalyzed by zero-dimensional/one-dimensional titanium dioxide (TiO2) nanomaterials: Promising green methodologies in organic chemistry. J. Environ. Manag. 2021, 279, 111603. [Google Scholar] [CrossRef]
  9. Chen, D.; Cheng, Y.; Zhou, N.; Chen, P.; Wang, Y.; Li, K.; Huo, S.; Cheng, P.; Peng, P.; Zhang, R.; et al. Photocatalytic degradation of organic pollutants using TiO2-based photocatalysts: A review. J. Clean. Prod. 2020, 268, 121725. [Google Scholar] [CrossRef]
  10. Dharma, H.N.C.; Jaafar, J.; Widiastuti, N.; Matsuyama, H.; Rajabsadeh, S.; Othman, M.H.D.; Rahman, M.A.; Jafri, N.N.M.; Suhaimin, N.S.; Nasir, A.M.; et al. A Review of Titanium Dioxide (TiO2)-Based Photocatalyst for Oilfield-Produced Water Treatment. Membranes 2022, 12, 345. [Google Scholar] [CrossRef]
  11. Arun, J.; Nachiappan, S.; Rangarajan, G.; Alagappan, R.P.; Gopinath, K.P.; Lichtfouse, E. Synthesis and application of titanium dioxide photocatalysis for energy, decontamination and viral disinfection: A review. Environ. Chem. Lett. 2023, 21, 362–399. [Google Scholar] [CrossRef]
  12. Prakash, J.; Cho, J.; Mishra, Y.K. Photocatalytic TiO2 nanomaterials as potential antimicrobial and antiviral agents: Scope against blocking the SARS-COV-2 spread. Micro Nano Eng. 2022, 14, 100100. [Google Scholar] [CrossRef]
  13. Qi, Y.; Xiang, B.; Zhang, J. Effect of titanium dioxide (TiO2) with different crystal forms and surface modifications on cooling property and surface wettability of cool roofing materials. Sol. Energy Mater. Sol. Cells 2017, 172, 34–43. [Google Scholar] [CrossRef]
  14. Liu, H.Y.; Hsu, Y.L.; Su, H.Y.; Huang, R.C.; Hou, F.Y.; Tu, G.C.; Liu, W.H. A comparative study of amorphous, anatase, rutile, and mixed-phase TiO2 films by mist chemical vapor deposition and ultraviolet photodetectors applications. IEEE Sens. J. 2018, 18, 4022–4029. [Google Scholar] [CrossRef]
  15. Zhang, J.; Zhou, P.; Liu, J.; Yu, J. New understanding of the difference of photocatalytic activity among anatase, rutile, and brookite TiO2. Phys. Chem. Chem. Phys. 2014, 16, 20382–20386. [Google Scholar] [CrossRef]
  16. Nair, R.V.; Gummaluri, V.S.; Matham M., V.; Vijayan, C. A review on optical bandgap engineering in TiO2 nanostructures via doping and intrinsic vacancy modulation towards visible light applications. J. Phys. D App. Phys. 2022, 55, 313003. [Google Scholar] [CrossRef]
  17. Xiong, L.-B.; Li, J.-L.; Yang, B.; Yu, Y. Ti3+ in the surface of titanium dioxide: Generation, properties, and photocatalytic application. J. Nanomat. 2012, 2012, 831524. [Google Scholar] [CrossRef] [Green Version]
  18. Kuznetsov, A.; Kameneva, O.; Alexandrov, A.; Bityurin, N.; Chhor, K.; Kanaev, A. Chemical Activity of Photoinduced Ti3+ Centers in Titanium Oxide Gels. J. Phys. Chem. B 2006, 110, 435–441. [Google Scholar] [CrossRef] [PubMed]
  19. Kuznetsov, A.; Kameneva, O.; Rozes, L.; Sanchez, C.; Bityurin, N.; Kanaev, A. Extinction of photo-induced Ti3+ centres in titanium oxide gels and gel-based oxo-PHEMA hybrids. Chem. Phys. Let. 2006, 429, 523–527. [Google Scholar] [CrossRef]
  20. Rozes, L.; Sanchez, C. Titanium oxo-clusters: Precursors for a Lego-like construction of nanostructured hybrid materials. Chem. Soc. Rev. 2011, 40, 1006–1030. [Google Scholar] [CrossRef] [PubMed]
  21. Museur, L.; Gorbovyi, P.; Traore, M.; Kanaev, A.; Rozes, L.; Sanchez, C. Luminescence properties of pHEMA-TiO2 gels based hybrids materials. J. Lumin. 2012, 132, 1192–1199. [Google Scholar] [CrossRef]
  22. Li, R.; Zhou, Q. Impact of Titanium Dioxide (TiO2) Modification on Its Application to Pollution Treatment—A Review. Catalysts 2020, 10, 804. [Google Scholar] [CrossRef]
  23. Sanzone, G.; Zimbone, M.; Cacciato, G.; Ruffino, F.; Carles, R.; Privitera, V.; Grimaldi, M.G. Ag/TiO2 nanocomposite for visible light-driven photocatalysis. Superlattices Microstruct. 2018, 123, 394–402. [Google Scholar] [CrossRef]
  24. Sornalingam, K.; McDonagh, A.; Zhou, J.L.; Johira, M.A.H.; Ahmed, M.B. Photocatalysis of estrone in water and wastewater: Comparison between Au-TiO2 nanocomposite and TiO2, and degradation by-products. Sci. Total Environ. 2018, 610–611, 521–530. [Google Scholar] [CrossRef] [PubMed]
  25. Sakthivel, S.; Shankar, M.V.; Palanichamy, M.; Arabindoo, B.; Bahnemann, D.W.; Murugesan, V. Enhancement of photocatalytic activity by metal deposition: Characterization and photonic efficiency of Pt, Au, and Pd deposited on TiO2. Water Res. 2004, 38, 3001–3008. [Google Scholar] [CrossRef] [PubMed]
  26. Ismael, M. A review and recent advances in solar-to-hydrogen energy conversion based on photocatalytic water splitting overdoped-TiO2 nanoparticles. Solar Energy 2020, 211, 522–546. [Google Scholar] [CrossRef]
  27. Tang, K.Y.; Chen, J.X.; Legaspi, E.D.R.; Owh, C.; Lin, M.; Tee, I.S.Y.; Kai, D.; Loh, X.J.; Li, Z.; Regulacio, M.D.; et al. Gold-decorated TiO2 nanofibrous hybrid for improved solar-driven photocatalytic pollutant degradation. Chemosphere 2021, 265, 129114. [Google Scholar] [CrossRef]
  28. Yu, Y.; Wen, W.; Qian, X.Y.; Liu, J.B.; Wu, J.M. UV and visible light photocatalytic activity of Au/TiO2 nanoforests with Anatase/Rutile phase junctions and controlled Au locations. Sci. Rep. 2017, 7, 41253. [Google Scholar] [CrossRef] [Green Version]
  29. Pandiyaraj, K.N.; Vasu, D.; Ghobeira, R.; Tabaei, P.S.E.; Geyter, N.D.; Morent, R.; Pichumani, M.; Padmanabhanan, P.V.A.; Deshmukh, R.R. Dye wastewater degradation by the synergetic effect of an atmospheric pressure plasma treatment and the photocatalytic activity of plasma-functionalized Cu-TiO2 nanoparticles. J. Hazard. Mat. 2020, 405, 124264. [Google Scholar] [CrossRef]
  30. Kozlov, D.A.; Lebedev, V.A.; Polyakov, A.Y.; Khazova, K.M.; Garshev, A.V. The microstructure effect on the Au/TiO2 and Ag/TiO2 nanocomposites photocatalytic activity. Nanosyst. Phys. Chem. Math. 2018, 9, 266–278. [Google Scholar] [CrossRef] [Green Version]
  31. Gao, Y.; Zhang, W.; Liu, P. Enhanced Photocatalytic Efficiency of TiO2 Membrane Decorated with Ag and Au Nanoparticles. Appl. Sci. 2018, 8, 945. [Google Scholar] [CrossRef] [Green Version]
  32. Moslah, C.; Kandyla, M.; Mousdis, G.A.; Petropoulou, G.; Ksibi, M. Photocatalytic Properties of Titanium Dioxide Thin Films Doped with Noble Metals (Ag, Au, Pd, and Pt). Phys. Status Solidi (A) 2018, 215, 1800023. [Google Scholar] [CrossRef]
  33. Malik, A.S.; Liu, T.; Rittiruam, M.; Saelee, T.; Da Silva, J.L.; Praserthdam, S.; Praserthdam, P. On a high photocatalytic activity of high-noble alloys Au–Ag/TiO2 catalysts during oxygen evolution reaction of water oxidation. Sci. Rep. 2022, 12, 2604. [Google Scholar] [CrossRef] [PubMed]
  34. Yoshiiri, K.; Wang, K.; Kowalska, E. TiO2/Au/TiO2 Plasmonic Photocatalysts: The Influence of Titania Matrix and Gold Properties. Inventions 2022, 7, 54. [Google Scholar] [CrossRef]
  35. Yang, X.; Wang, Y.; Zhang, L.; Fu, H.; He, P.; Han, D.; Lawson, T.; An, X. The Use of Tunable Optical Absorption Plasmonic Au and Ag Decorated TiO2 Structures as Efficient Visible Light Photocatalysts. Catalysts 2020, 10, 139. [Google Scholar] [CrossRef] [Green Version]
  36. Varapragasam, S.J.P.; Mia, S.; Wieting, C.; Balasanthiran, C.; Hossan, M.Y.; Baride, A.; Rioux, R.M.; Hoefelmeyer, J.D. Ag–TiO2 Hybrid Nanocrystal Photocatalyst: Hydrogen Evolution under UV Irradiation but Not under Visible-Light Irradiation. ACS Appl. Energy Mater. 2019, 2, 8274–8282. [Google Scholar] [CrossRef]
  37. Salomatina, E.; Bityurin, N.; Gulenova, M.; Gracheva, T.; Drozdov, M.; Knyazev, A.; Kir’yanov, K.; Markin, A.; Smirnova, L. Synthesis, structure, and properties of organic-inorganic (co)polymers containing poly(titanium oxide). J. Mater. Chem. C. 2013, 1, 6375–6385. [Google Scholar] [CrossRef]
  38. Salomatina, E.V.; Moskvichev, A.N.; Knyazev, A.V.; Smirnova, L.A. Effect of kinetic features in synthesis of hybrid copolymers based on Ti(OPri)4 and hydroxyethyl methacrylate on their structure and properties. Rus. J. App. Chem. 2015, 88, 197–207. [Google Scholar] [CrossRef]
  39. Loginova, A.S.; Ignatov, S.K.; Chukhmanov, E.P.; Salomatina, E.V.; Smirnova, L.A. Structure, spectra, and photoinduced electron-redistribution properties of TiO2/organic copolymers with gold nanoparticles. A DFT study. Comput. Theor. Chem. 2017, 1118, 1–15. [Google Scholar] [CrossRef]
  40. Howe, R.F.; Gratzel, M. EPR observation of trapped electrons in colloidal titanium dioxide. J. Phys. Chem. 1985, 89, 4495–4499. [Google Scholar] [CrossRef]
  41. Gratzel, M.; Howe, R.F. Electron paramagnetic resonance studies of doped titanium dioxide colloids. J. Phys. Chem. 1990, 94, 2566–2572. [Google Scholar] [CrossRef]
  42. Anpo, M.; Aikawa, N.; Kubokawa, Y. Photocatalytic hydrogenation of alkynes and alkenes with water over titanium dioxide. Platinum loading effect on the primary processes. J. Phys. Chem. 1984, 88, 3998–4000. [Google Scholar] [CrossRef]
  43. Micic, O.I.; Zhang, Y.; Cromack, K.R.; Trifunac, A.D.; Thurnauer, M.C. Photoinduced hole transfer from titanium dioxide to methanol molecules in aqueous solution studied by electron paramagnetic resonance. J. Phys. Chem. 1993, 97, 13284–13288. [Google Scholar] [CrossRef]
  44. Kuznetsov, A.I.; Kameneva, O.; Bityurin, N.; Rozes, L.; Sanchez, C.; Kanaev, A. Laser-induced photopatterning of organic-inorganic TiO2-based hybrid materials with tunable interfacial electron transfer. Phys. Chem. Chem. Phys. 2009, 11, 1248–1257. [Google Scholar] [CrossRef] [PubMed]
  45. Kameneva, O.; Kuznestov, A.I.; Smirnova, L.A.; Rozes, L.; Sanchez, C.; Aleksandrov, A.; Bityurin, N.; Chhor, K.; Kanaev, A. New photoactive hybrid organic-inorganic materials based on titanium-oxo-PHEMA nanocomposites exhibiting mixed valence properties. J. Mater. Chem. 2005, 15, 3380–3383. [Google Scholar] [CrossRef]
  46. Uklein, A.; Gorbovyi, P.; Traore, M.; Museur, L.; Kanaev, A. Photo-induced refraction of nanoparticulate organic-inorganic TiO2-pHEMA hybrids. Opt. Mater. Express 2013, 3, 533–545. [Google Scholar] [CrossRef]
  47. Hamed, M.M.; Ahmed, I.M.; Metwally, S.S. Adsorptive removal of methylene blue as an organic pollutant by marble dust as eco-friendly sorbent. J. Ind. Eng. Chem. 2014, 20, 2370–2377. [Google Scholar] [CrossRef]
  48. Mills, A.; Hill, C.; Robertson, P.K.J. Overview of the current {ISO} tests for photocatalytic materials. J. Photochem. Photobiol. A Chem. 2012, 237, 7–23. [Google Scholar] [CrossRef]
  49. Krishnan, S.; Shriwastav, A. Application of TiO2 nanoparticles sensitized with natural chlorophyll pigments as catalyst for visible light photocatalytic degradation of methylene blue. J. Environ. Chem. Eng. 2021, 9, 104699. [Google Scholar] [CrossRef]
  50. Tichapondwa, S.M.; Newman, J.P.; Kubheka, O. Effect of TiO2 phase on the photocatalytic degradation of methylene blue dye. Phys. Chem. Earth Parts A/B/C 2020, 118–119, 102900. [Google Scholar] [CrossRef]
  51. Petrella, A.; Spasiano, D.; Cosma, P.; Rizzi, V.; Race, M.; Mascolo, M.C.; Ranieri, E. Methyl Orange Photo-Degradation by TiO2 in a Pilot Unit under Different Chemical, Physical, and Hydraulic Conditions. Processes 2021, 9, 205. [Google Scholar] [CrossRef]
  52. Zha, R.; Nadimicherla, R.; Guo, X. Ultraviolet photocatalytic degradation of methyl orange by nanostructured TiO2/ZnO heterojunctions. J. Mater. Chem. A 2015, 3, 6565–6574. [Google Scholar] [CrossRef]
  53. Regraguy, B.; Rahmani, M.; Mabrouki, J.; Drhimer, F.; Ellouzi, I.; Mahmou, C.; Dahchour, A.; El Mrabet, M.; El Hajjaji, S. Photocatalytic degradation of methyl orange in the presence of nanoparticles NiSO4/TiO2. Nanotechnol. Environ. Eng. 2022, 7, 157–171. [Google Scholar] [CrossRef]
  54. He, Y.; Grieser, F.; Ashokkumar, M. The mechanism of sonophotocatalytic degradation of methyl orange and its products in aqueous solutions. Ultrason. Sonochem. 2011, 18, 974–980. [Google Scholar] [CrossRef] [PubMed]
  55. Zhang, T.; Oyama, T.; Horikoshi, S.; Hidaka, H.; Zhao, J.; Serpone, N. Photocatalyzed N-demethylation and degradation of methylene blue in titania dispersions exposed to concentrated sunlight. Solar Ener. Mater. Solar Cells 2002, 73, 287–303. [Google Scholar] [CrossRef]
  56. Dai, K.; Chen, H.; Peng, T.; Ke, D.; Yi, H. Photocatalytic degradation of methyl orange in aqueous suspension of mesoporous titania nanoparticles. Chemosphere 2007, 69, 1361–1367. [Google Scholar] [CrossRef]
  57. Wang, S.; Luo, C.; Tan, F.; Cheng, X.; Ma, Q.; Wu, D.; Li, P.; Zhang, F.; Ma, J. Degradation of Congo red by UV photolysis of nitrate: Kinetics and degradation mechanism. Sep. Purif. Technol. 2021, 262, 118276. [Google Scholar] [CrossRef]
  58. Ullah, I.; Haider, A.; Khalid, N.; Ali, S.; Ahmed, S.; Khan, Y.; Ahmed, N.; Zubair, M. Tuning the band gap of TiO2 by tungsten doping for efficient UV and visible photodegradation of Congo red dye. Spectrochim. Acta Part A Mol. Biomol. Spectrosc. 2018, 204, 150–157. [Google Scholar] [CrossRef]
  59. Qin, L.; Liang, F.; Li, Y.; Wu, J.; Guan, S.; Wu, M.; Xie, S.; Luo, M.; Ma, D. A 2D Porous Zinc-Organic Framework Platform for Loading of 5-Fluorouracil. Inorganics 2022, 10, 202. [Google Scholar] [CrossRef]
  60. Qin, L.; Li, Y.; Liang, F.; Li, L.; Lan, Y.; Li, Z.; Lu, X.; Yang, M.; Ma, D. A microporous 2D cobalt-based MOF with pyridyl sites and open metal sites for selective adsorption of CO2. Microporous Mesoporous Mater. 2022, 341, 112098. [Google Scholar] [CrossRef]
  61. Yang, L.; Luo, S.; Li, Y.; Xiao, Y.; Kang, Q.; Cai, Q. High Efficient Photocatalytic Degradation of p-Nitrophenol on a Unique Cu2O/TiO2 p-n Heterojunction Network Catalyst. Environ. Sci. Technol. 2010, 44, 7641–7646. [Google Scholar] [CrossRef]
  62. Yadav, V.; Verma, P.; Sharma, H.; Tripathy, S.; Saini, V.K. Photodegradation of 4-nitrophenol over B-doped TiO2 nanostructure: Effect of dopant concentration, kinetics, and mechanism. Environ. Sci. Pollut. Res. 2020, 27, 10966–10980. [Google Scholar] [CrossRef] [PubMed]
  63. Moctezuma, E.; Leyva, E.; Aguilar, C.A.; Luna, R.A.; Montalvo, C. Photocatalytic degradation of paracetamol: Intermediates and total reaction mechanism. J. Hazard. Mater. 2012, 243, 130–138. [Google Scholar] [CrossRef] [PubMed]
  64. Ahn, W.-Y.; Sheeley, S.A.; Rajh, T.; Cropek, D.M. Photocatalytic reduction of 4-nitrophenol with arginine-modified titanium dioxide nanoparticles. Appl. Catal. B Environ. 2007, 74, 103–110. [Google Scholar] [CrossRef]
  65. Zhao, S.; Ma, H.; Wang, M.; Cao, C.; Yao, S. Study on the role of hydroperoxyl radical in degradation of p-nitrophenol attacked by hydroxyl radical using photolytical technique. J. Photochem. Photobiol. A Chem. 2013, 259, 17–24. [Google Scholar] [CrossRef]
  66. Di Paola, A.; Augugliaro, V.; Palmisano, L.; Pantaleo, G.; Savinov, E. Heterogeneous photocatalytic degradation of nitrophenols. J. Photochem. Photobiol. A Chem. 2003, 155, 207–214. [Google Scholar] [CrossRef]
  67. Kalvert, G.; Pitts, G. Photochemistry, 1st ed.; John Wiley and Sons, Inc.: New York, NY, USA, 1966; 899p. [Google Scholar]
  68. Nakata, A.; Fujishima, A. TiO2 photocatalysis: Design and applications. J. Photochem. Photobiol C Photochem. Rev. 2012, 13, 169–189. [Google Scholar] [CrossRef]
  69. Belekbir, S.; El Azzouzi, M.; El Hamidi, A.; Rodríguez-Lorenzo, L.; Santaballa, J.A.; Canle, M. Improved Photocatalyzed Degradation of Phenol, as a Model Pollutant, over Metal-Impregnated Nanosized TiO2. Nanomaterials 2020, 10, 996. [Google Scholar] [CrossRef]
  70. Gadirova, E.M. Photochemical degradation of phenol in the presence of titanium dioxide nanoparticles. Proceed. Univ. Appl. Chem. Biotechnol. 2019, 9, 179–182. [Google Scholar]
  71. Dang, T.T.T.; Le, S.T.T.; Channei, D.; Khanitchaidecha, W.; Nakaruk, A. Photodegradation mechanisms of phenol in the photocatalytic process. Res. Chem. Intermed. 2016, 42, 5961–5974. [Google Scholar] [CrossRef]
  72. Grabowska, E.; Reszczyńska, J.; Zaleska, A. RETRACTED: Mechanism of phenol photodegradation in the presence of pure and modified-TiO2: A review. Water Res. 2012, 46, 5453–5471. [Google Scholar] [CrossRef]
  73. Dong, X.; Li, D.; Li, Y.; Sakiyama, H.; Muddassir, M.; Pan, Y.; Srivastava, D.; Kumar, A. A 3,8-connected Cd(II)-based metal–organic framework as an appropriate luminescent sensor for the antibiotic sulfasalazine. CrystEngComm 2022, 24, 7157–7165. [Google Scholar] [CrossRef]
  74. Rao, C.; Zhou, L.; Pan, Y.; Lu, C.; Qin, X.; Sakiyama, H.; Muddassir, M.; Liu, J. The extra-large calixarene-based MOFs-derived hierarchical composites for photocatalysis of dye: Facile syntheses and contribution of carbon species. J. Alloys Compd. 2022, 897, 163178. [Google Scholar] [CrossRef]
  75. Dobrosz-Gómez, I.; Gómez-García, M.Á.; Zamora, S.M.L.; GilPavas, E.; Bojarska, J.; Kozanecki, M.; Rynkowski, J.M. Transition metal loaded TiO2 for phenol photo-degradation. Comptes Rendus Chim. 2015, 18, 1170–1182. [Google Scholar] [CrossRef]
  76. Chowdhury, P.; Moreira, J.; Gomaa, H.; Ray, A.K. Visible-Solar-Light-Driven Photocatalytic Degradation of Phenol with Dye-Sensitized TiO2: Parametric and Kinetic Study. Ind. Eng. Chem. Res. 2012, 51, 4523–4532. [Google Scholar] [CrossRef]
  77. Rehman, S.; Ullah, R.; Butt, A.M.; Gohar, N.D. Strategies of making TiO2 and ZnO visible light active. J. Hazard. Mat. 2009, 170, 560–569. [Google Scholar] [CrossRef]
  78. Carp, O.; Huisman, C.L.; Reller, A. Photoinduced Reactivity of Titanium Dioxide. Prog. Solid State Chem. 2004, 32, 33–177. [Google Scholar] [CrossRef]
  79. Saih, Y.; Segawa, K. Ultradeep hydrodesulfurization of dibenzothiophene (DBT) derivatives over Mo-sulfide catalysts supported on TiO2-coated alumina composite (Review). Catal. Surv. Asia 2003, 7, 235–249. [Google Scholar] [CrossRef]
  80. Suyoulema, L.J.; Sarina, W.W. A study of photodegradation of sulforhodamine B on Au–TiO2/bentonite under UV and visible light irradiation. Solid State Sci. 2009, 11, 2037–2043. [Google Scholar]
  81. Kortum, G.F.A. Reflectance Spectroscopy: Principles, Methods, Applications; Springer Science & Business Media: New York, NY, USA, 1969. [Google Scholar]
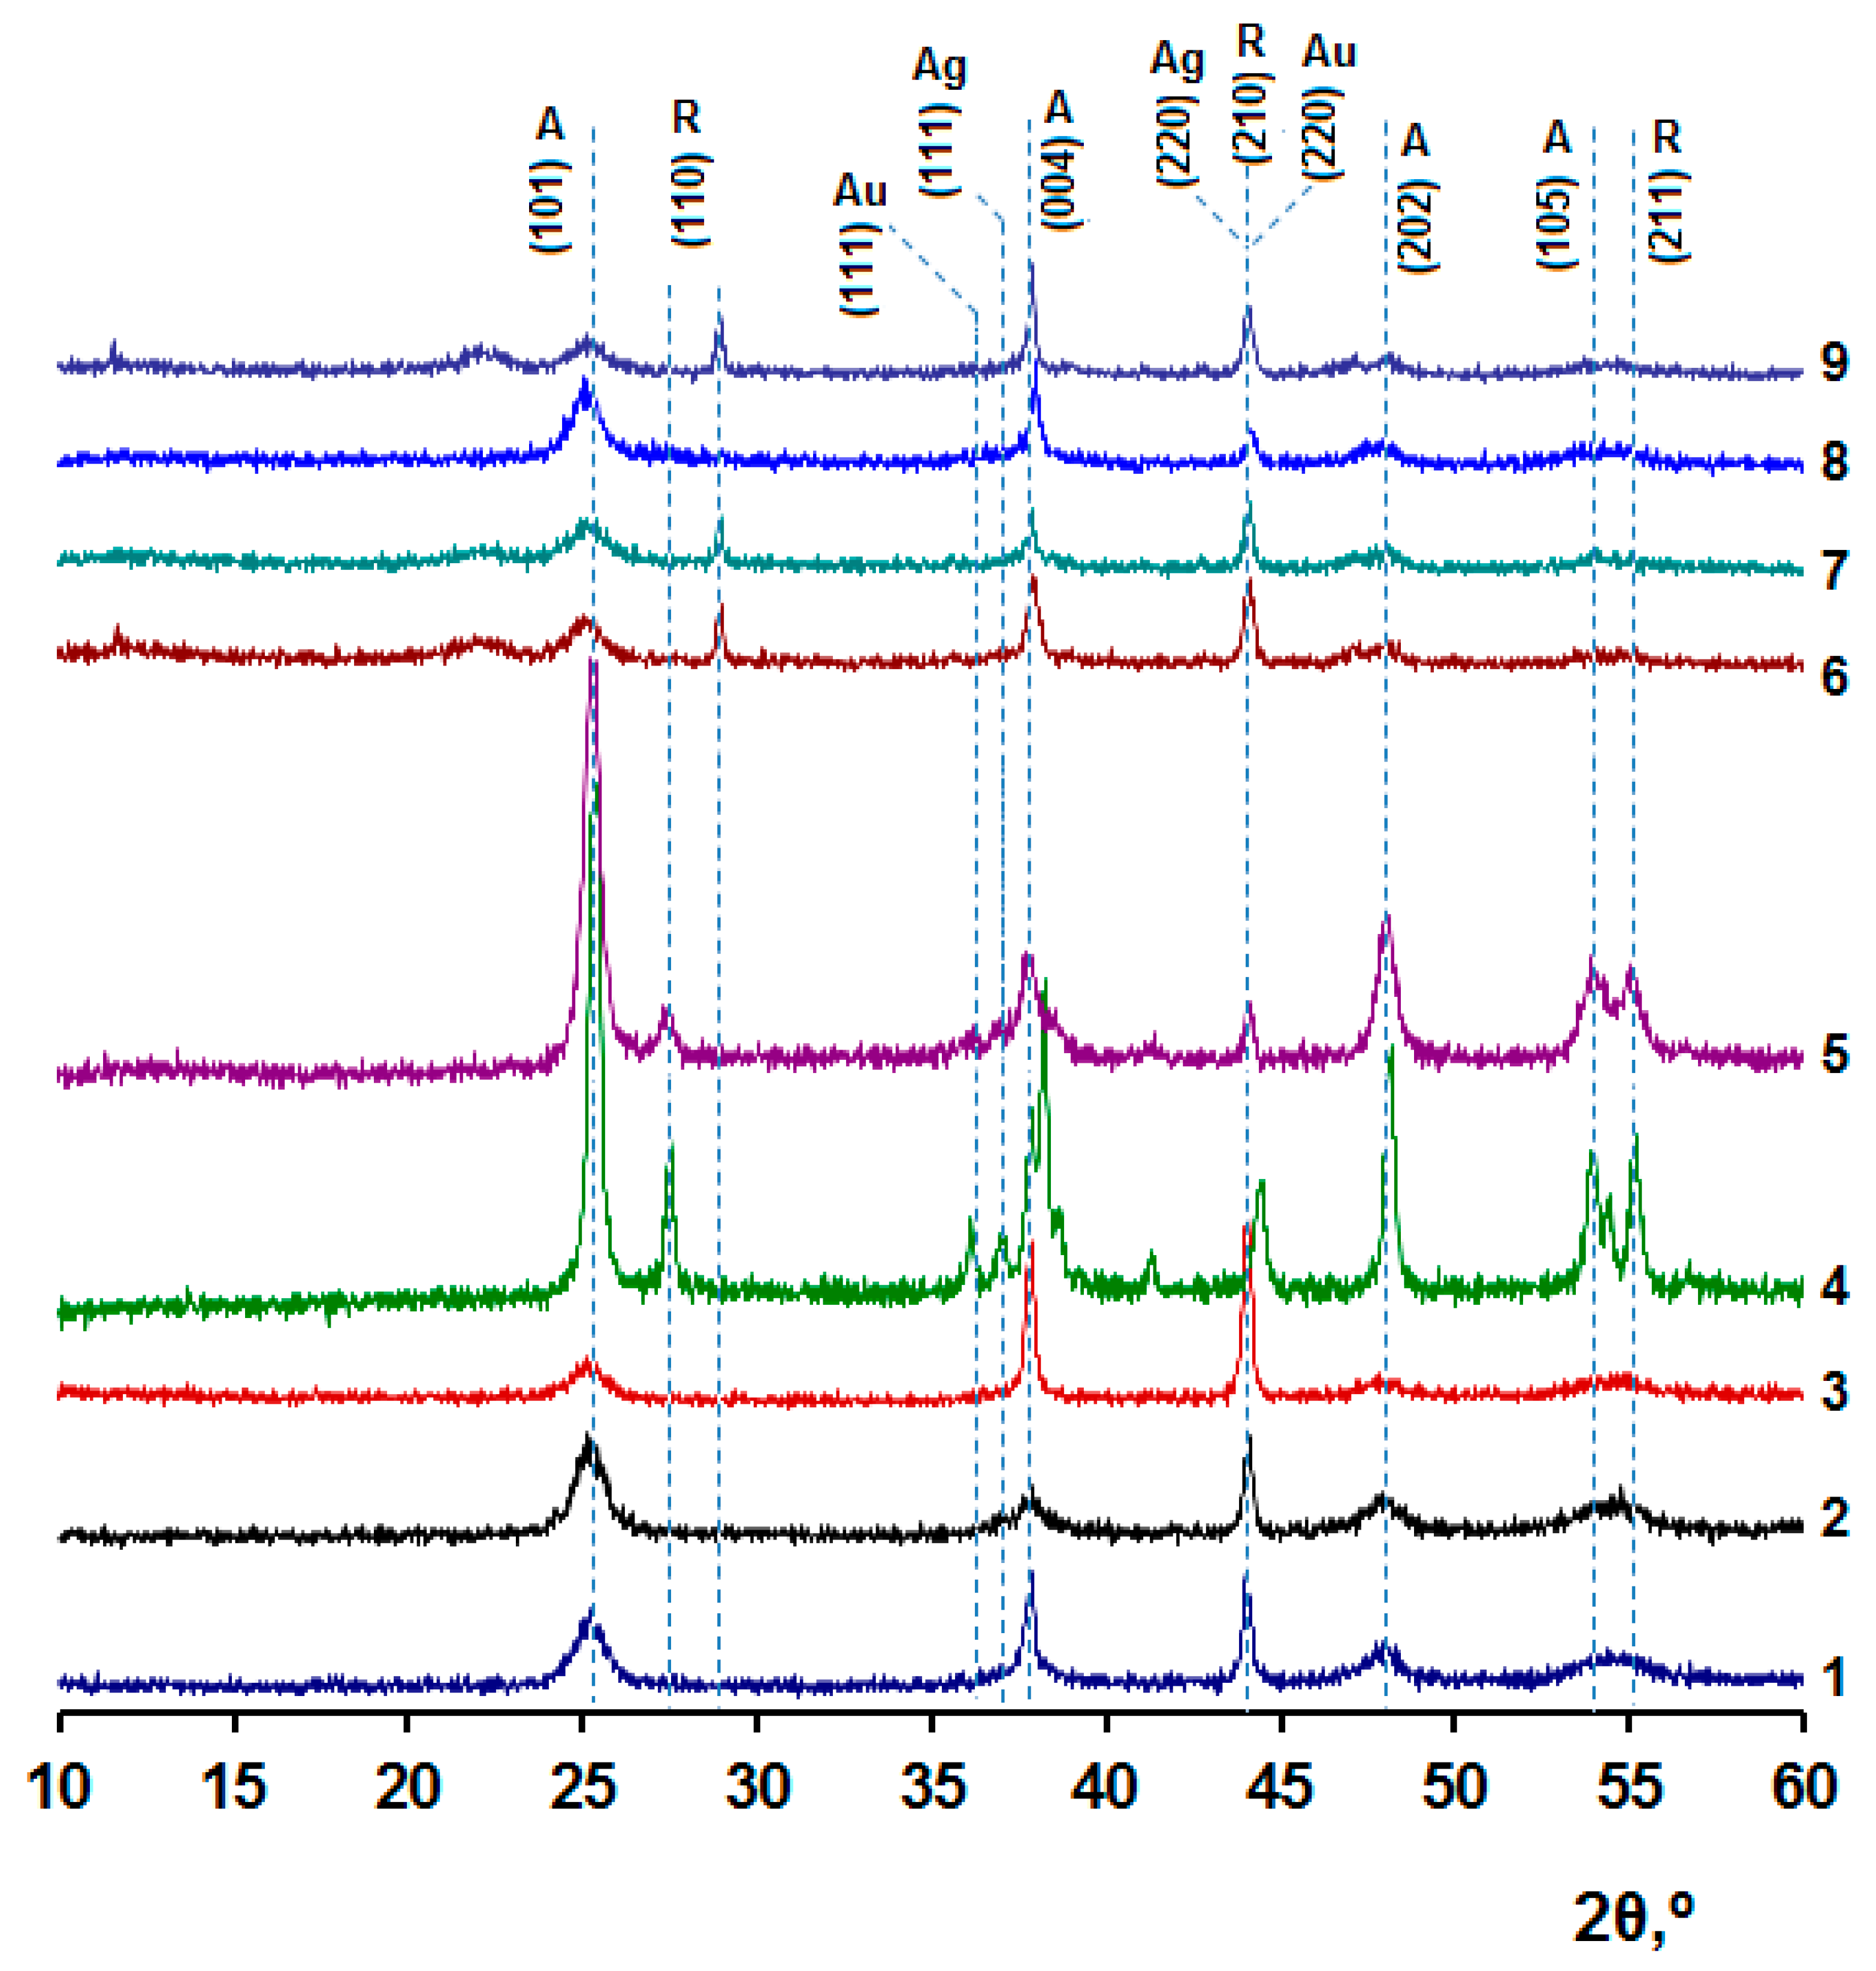
Figure 1. XRD-diffraction patterns after degradation of organic part of samples [(≡TiO)n]:[HEMA]:[M]: curve 1—HEMA, curve 2—BMA, curve 3—AN, curve 4—HEMA + Ag NPs, curve 5—HEMA + HЧ Au, curve 6—BMA + Ag NPs; curve 7—BMA + Au NPs; curve 8—AN + Ag NPs; curve 9—AN + Au NPs. A—anatase, R—rutile, Au—gold, Ag—silver.
Catalysts 13 00423 g001
Figure 2. Elemental surface composition of nanocomposites [(≡TiO)n]:[HEMA]:[AN]: (a) without nanoparticles; (b) with Ag NPs; (c) with Au NPs.
Catalysts 13 00423 g002
Figure 3. Optical properties of materials of different compositions: (a) typical change in the spectra of copolymers upon UV irradiation; (b) dependence of the optical density of composites [(≡TiO)n]:[HEMA]:[M] at 600 nm on the time of UV irradiation: curve 1—M = HEMA, curve 2—M = BMA, curve 3—M = AN; (c) EPR spectra of material with composition [(≡TiO)n]:[HEMA]:[M] = 1:5:1: curve 1—without UV irradiation, curve 2—UV irradiated sample; (d) scheme of possible processes occurring in PTO gels in alcoholic media or in organic–inorganic copolymers under UV irradiation.
Catalysts 13 00423 g003
Scheme 1. Schemes follow the same formatting.
Catalysts 13 00423 sch001
Figure 4. Photocatalytic properties of composites: (a) change in the absorption spectrum of MO aqueous solution with increasing time of its UV irradiation with the usage of copolymer of original composition [(≡TiO)n]:[HEMA]:[M] + NPs of Ag as a catalyst; (bd) a change in the MO concentration in the solution in time during its UV irradiation in the presence of composition materials with HEMA (b), BMA (c); and AN (d) units. Curve 1—«empty» experiment; curve 2—material with PTO without NPs; curve 3—PTO in the material is doped with gold NPs; and curve 4—PTO in the material is doped with silver NPs.
Catalysts 13 00423 g004
Figure 5. (a) Typical change in the spectrum of aqueous CR solution under UV irradiation in the presence of nanocomposites; (b) dependence of the relative concentration of aqueous CR solution under light irradiation in the presence of nanocomposites of different composition [(≡TiO)n]:[HEMA]:[M]: curve 1—«empty» experiment, curve 2—HEMA, curve 3—BMA, curve 4—AN, curve 5—HEMA + NPs Au, curve 6—BMA + NPs Au, curve 7—HEMA + NPs Ag, curve 8—AN + NPs Au, curve 9—AN + NPs Ag.
Catalysts 13 00423 g005
Figure 6. IR spectra of CR (curve 1) and its decomposition products under the UV irradiation of its solutions in the presence of nanocomposites [(≡TiO)n]:[HEMA] + Ag NPs (curve 2), [(≡TiO)n]:[HEMA]:[BMA] + Ag NPs (curve 3), [(≡TiO)n]:[HEMA]:[AN] + Ag NPs (curve 4).
Catalysts 13 00423 g006
Figure 7. Photocatalytic activity of copolymers under UV irradiation: (a) the change of absorption spectrum of p-NP solution in the presence of photocatalyst [(≡TiO)n]:[HEMA]:[M]; (b) the change of p-NP concentration in solution: curve 1—«empty» experiment, curve 2—BMA + NPs Ag, curve 3—HEMA + NPs Ag; curve 4—AN + NPs Ag.
Catalysts 13 00423 g007
Figure 8. Changes in concentration of p-NP in solutions during their irradiation with light > 410 nm (light filter «ZhS-11») in the presence of nanocomposites [(≡TiO)n]:[HEMA] [M]: curve 1—«empty» experiment; curve 2—BMA + Ag NPs, curve 3—HEMA + Ag NPs; curve 4—AN + Ag NPs.
Catalysts 13 00423 g008
Figure 9. IR spectra of p-NP original solution (curve 1) and intermediate products of its decomposition under UV irradiation for 200 min (curve 2) and at visible light irradiation for 40 min (curve 3) in the presence of nanocomposite [(≡TiO)n]:[HEMA]:[AN] + Ag NPs.
Catalysts 13 00423 g009
Figure 10. (a) The change of spectrum character of phenol aqueous solution under UV irradiation in the presence of nanocomposites (C = 19 mmol/L); (b) relative optical density dependence of phenol solution at 400 nm under UV irradiation in the presence of nanocomposites: curve 1—«empty» experiment, curve 2—BMA + Ag NPs, curve 3—HEMA + Ag NPs, curve 4—AN + Ag NPs.
Catalysts 13 00423 g010
Figure 11. (a) The change in the nature of the aqueous solution spectrum of phenol at its irradiation with visible light in the presence of nanocomposites; (b) the dependence of the relative concentration of phenol in the solution under irradiation of visible light in the presence of nanocomposites of different composition: curve 1—BMA + Ag NPs, curve 2—HEMA + NPs Ag, curve 3—AN + Ag NPs.
Catalysts 13 00423 g011
Figure 12. Chromatograms of original phenol (a), intermediate products of phenol decomposition at UV-irradiation (b) or visible light irradiation (c) to solutions in presence of composite [(≡TiO)n]:[HEMA]:[AN] + Ag NPs.
Catalysts 13 00423 g012
Figure 13. IR spectra of initial phenol (curve 1), its decomposition products in the presence of composite [(≡TiO)n]:[HEMA]:[AN] + Ag NPs under UV-irradiation (curve 2), under visible light irradiation (curve 3). Time of light irradiation is 400 min.
Catalysts 13 00423 g013
Figure 14. Schematic diagram of possible processes occurring in organic–inorganic copolymers containing nanostructured PTO modified with Au NPs under the action of visible light.
Catalysts 13 00423 g014
Figure 15. Kubelka-Munk function of samples with compositions [(≡TiO)n]:[HEMA] = 1:6 (a) and [(≡TiO)n]:[HEMA]:[AN] = 1:5:1 + Ag NPs (b).
Catalysts 13 00423 g015
Table 1. Particle sizes in powders after degradation of the organic part of nanocomposites of composition [(≡TiO)n]:[HEMA]:[M], containing Au or Ag NPs.
[M]Type of NPsParticle Diameter in the Powder after Degradation of the Organic Part of the Composites, nmAnatase Content, %Eg
TiO2AuAg
HEMAwithout NPs7--100.03.35
Au6-995.02.42
Ag612-81.22.75
BMAwithout NPs6--100.03.11
Au9-2087.12.11
Ag1227-75.12.49
ANwithout NPs8--100.03.20
Au11-2393.82.48
Ag1031-85.32.65
Table 2. Total organic carbon content in water before and after the photocatalytic decomposition of its organic pollutants when using the polymeric nanocomposite [(≡TiO)n]:[HEMA]:[AN] = 1:5:1 + Ag NPs.
Experiment
Conditions
TOC *, mg/LNPOC **, mg/LTC ***, mg/LIC ****, mg/L
MO + UV light, without nanocomposite80.5 ± 1.978.5 ± 1.991 ± 2.210.5 ± 0.2
MO + UV light,
with nanocomposite
14.5 ± 1.514.8 ± 1.514.7 ± 1.50.12 ± 0.1
Phenol + UV light,
without nanocomposite
95.5 ± 2.399.5± 2.4101.0 ± 2.45.5 ± 0.1
Phenol + UV light, with nanocomposite7.5 ± 0.77.4 ± 0.77.9 ± 0.70.4 ± 0.1
Phenol + visible light, with nanocomposite9.9 ± 1.010.0 ± 1.010.9 ± 1.01.0 ± 0.2
* Total organic carbon method, TOC = |TC − IC|. ** Organic carbon method, NPOC. *** Total carbon method, TC. **** Inorganic carbon method, IC.
Table 3. Component ratios in photocatalytic cells depending on the type of water pollutant.
Type of Water PollutantCharacteristic Wavelengths in the Absorption Spectrum, nmConcentration of Pollutant, mmol/LContent of Nanocomposite in Cleaning Solution, g/L
MO4703.060.5 *
CR50014.00
p-NP318 and 4000.07
phenol350 and 27019.00
* 0.05 g/L PTO content in the solution, based on the composition of the nanocomposite.
Disclaimer/Publisher’s Note: The statements, opinions and data contained in all publications are solely those of the individual author(s) and contributor(s) and not of MDPI and/or the editor(s). MDPI and/or the editor(s) disclaim responsibility for any injury to people or property resulting from any ideas, methods, instructions or products referred to in the content.