


Photocatalytic Degradation of Paracetamol under Simulated Sunlight by Four TiO2 Commercial Powders: An Insight into the Performance of Two Sub-Micrometric Anatase and Rutile Powders and a Nanometric Brookite Powder


 ,
, 
Abstract
:
1. Introduction
| → | (1) | ||
| → | (2) | ||
| → | (3) | ||
| → | (4) | ||
| → | (5) | ||
| → | (6) | ||
| → | (7) | ||
| → | (8) |
2. Results and Discussion
2.1. Physicochemical Characterization
2.2. Photocatalytic Degradation of Paracetamol under 1 SUN

2.3. About the Remarkable Photocatalytic Activity of the Comm_A and the Comm_B Powders
3. Materials and Methods
4. Conclusions
Supplementary Materials
Author Contributions
Funding
Data Availability Statement
Acknowledgments
Conflicts of Interest
References
- Lee, T.H.Y.; Chuah, J.; Snyder, S.A. Occurrence of Emerging Contaminants in Southeast Asian Environments: Present Status, Challenges, and Future Prospects. ACS ES&T Water 2022, 2, 907–931. [Google Scholar] [CrossRef]
- Wolfram, J.; Bub, S.; Petschick, L.L.; Schemmer, A.; Stehle, S.; Schulz, R. Pesticide occurrence in protected surface waters in nature conservation areas of Germany. Sci. Total. Environ. 2023, 858, 160074. [Google Scholar] [CrossRef] [PubMed]
- Bexfield, L.M.; Toccalino, P.L.; Belitz, K.; Foreman, W.T.; Furlong, E.T. Hormones and Pharmaceuticals in Groundwater Used As a Source of Drinking Water Across the United States. Environ. Sci. Technol. 2019, 53, 2950–2960. [Google Scholar] [CrossRef] [PubMed] [Green Version]
- Ferrario, C.; Finizio, A.; Villa, S. Legacy and emerging contaminants in meltwater of three Alpine glaciers. Sci. Total. Environ. 2017, 574, 350–357. [Google Scholar] [CrossRef] [PubMed]
- Patel, M.; Kumar, R.; Kishor, K.; Mlsna, T.; Pittman, C.U., Jr.; Mohan, D. Pharmaceuticals of Emerging Concern in Aquatic Systems: Chemistry, Occurrence, Effects, and Removal Methods. Chem. Rev. 2019, 119, 3510–3673. [Google Scholar] [CrossRef] [PubMed] [Green Version]
- Khasawneh, O.F.S.; Palaniandy, P. Occurrence and removal of pharmaceuticals in wastewater treatment plants. Process. Saf. Environ. Prot. 2021, 150, 532–556. [Google Scholar] [CrossRef]
- Freyria, F.S.; Geobaldo, F.; Bonelli, B. Nanomaterials for the Abatement of Pharmaceuticals and Personal Care Products from Wastewater. Appl. Sci. 2018, 8, 170. [Google Scholar] [CrossRef] [Green Version]
- Azcune, G.; Griffero, L.; Pareja, L.; Ríos, J.M.; Galbán-Malagón, C.; Pérez-Parada, A. Trends in the monitoring of legacy and emerging organic pollutants in protected areas. Trends Environ. Anal. Chem. 2022, 34, e00165. [Google Scholar] [CrossRef]
- Boyd, G.R.; Reemtsma, H.; Grimm, D.A.; Mitra, S. Pharmaceuticals and personal care products (PPCPs) in surface and treated waters of Louisiana, USA and Ontario, Canada. Sci. Total. Environ. 2003, 311, 135–149. [Google Scholar] [CrossRef]
- Yang, Y.; Zhang, X.; Jiang, J.; Han, J.; Li, W.; Li, X.; Yee Leung, K.M.; Snyder, S.A.; Alvarez, P.J.J. Which Micropollutants in Water Environments Deserve More Attention Globally? Environ. Sci. Technol. 2022, 56, 13–29. [Google Scholar] [CrossRef]
- Freyria, F.S.; Sannino, F.; Bonelli, B. Common wastewater contaminants versus emerging ones: An Overview. Nanomater. Detect. Remov. Wastewater Pollut. 2020, 19–46. [Google Scholar] [CrossRef]
- Rodea-Palomares, I.; Gonzalez-Pleiter, M.; Gonzalo, S.; Rosal, R.; Leganes, F.; Sabater, S.; Casellas, M.; Muñoz-Carpena, R.; Fernández-Piñas, F. Hidden drivers of low-dose pharmaceutical pollutant mixtures revealed by the novel GSA-QHTS screening method. Sci. Adv. 2016, 2, e1601272. [Google Scholar] [CrossRef] [PubMed] [Green Version]
- Luo, Y.L.; Guo, W.S.; Ngo, H.H.; Nghiem, L.D.; Hai, F.I.; Zhang, J.; Liang, S.; Wang, X.C. A review on the occurrence of micropollutants in the aquatic environment and their fate and removal during wastewater treatment. Sci. Total Environ. 2014, 473–474, 619–641. [Google Scholar] [CrossRef] [PubMed]
- Li, M.; Yang, L.; Wu, X.; Chen, X.; Chen, F.; Zheng, X.; Song, Q.; Liu, X. Synergistic Removal of Nutrient Pollutants and Pharmaceutical and Personal Care Products (PPCPs) from Contaminated Groundwater: Macro- and Microelements and Mi-croorganisms. ACS ES T Water 2022, 2, 1214–1224. [Google Scholar] [CrossRef]
- Badmus, K.O.; Tijani, J.O.; Massima, E.; Petrik, L. Treatment of persistent organic pollutants in wastewater using hydrodynamic cavitation in synergy with advanced oxidation process. Environ. Sci. Pollut. Res. 2018, 25, 7299–7314. [Google Scholar] [CrossRef] [Green Version]
- Tian, H.; Fan, Y.; Zhao, Y.; Liu, L. Elimination of ibuprofen and its relative photo-induced toxicity by mesoporous BiOBr under simulated solar light irradiation. RSC Adv. 2014, 4, 13061–13070. [Google Scholar] [CrossRef]
- Philippe, K.K.; Timmers, R.; van Grieken, R.; Marugan, J. Photocatalytic Disinfection and Removal of Emerging Pollutants from Effluents of Biological Wastewater Treatments, Using a Newly Developed Large-Scale Solar Simulator. Ind. Eng. Chem. Res. 2016, 55, 2952–2958. [Google Scholar] [CrossRef]
- Verlicchi, P.; Al Aukidy, M.; Zambello, E. Occurrence of pharmaceutical compounds in urban wastewater: Removal, mass load and environmental risk after a secondary treatment—A review. Sci. Total Environ. 2012, 429, 123–155. [Google Scholar] [CrossRef]
- Ruan, T.; Field, J.; Cousins, I.; Lohmann, R.; Jiang, G. Emerging Contaminants: Fluorinated Alternatives to Existing PFAS. Environ. Sci. Technol. 2022, 56, 6001–6003. [Google Scholar] [CrossRef]
- Ding, R.; Liu, S.; He, C.; Nie, X. Paracetamol affects the expression of detoxification- and reproduction-related genes and alters the life traits of Daphnia magna. Ecotoxicology 2020, 29, 398–406. [Google Scholar] [CrossRef]
- Wilkinson, J.L.; Boxall, A.B.A.; Kolpin, D.W.; Leung, K.M.Y.; Lai, R.W.S.; Galbán-Malagón, C.; Adell, A.D.; Mondon, J.; Metian, M.; Marchant, R.A.; et al. Pharmaceutical pollution of the world’s rivers. Proc. Natl. Acad. Sci. USA 2022, 119, e2113947119. [Google Scholar] [CrossRef] [PubMed]
- Li, W.; Zhang, X.; Han, J. Formation of Larger Molecular Weight Disinfection Byproducts from Acetaminophen in Chlorine Disinfection. Environ. Sci. Technol. 2022, 56, 16929–16939. [Google Scholar] [CrossRef] [PubMed]
- Reinstadler, V.; Ausweger, V.; Grabher, A.-L.; Kreidl, M.; Huber, S.; Grander, J.; Haslacher, S.; Singer, K.; Schlapp-Hackl, M.; Sorg, M.; et al. Monitoring drug consumption in Innsbruck during coronavirus disease 2019 (COVID-19) lockdown by wastewater analysis. Sci. Total. Environ. 2020, 757, 144006. [Google Scholar] [CrossRef] [PubMed]
- Kolpin, D.W.; Furlong, E.T.; Meyer, M.T.; Thurman, E.M.; Zaugg, S.D.; Barber, L.B.; Buxton, H.T. Pharmaceuticals, Hormones, and Other Organic Wastewater Contaminants in U.S. Streams, 1999-2000: A National Reconnaissance. Environ. Sci. Technol. 2002, 36, 1202–1211. [Google Scholar] [CrossRef] [PubMed] [Green Version]
- Togola, A.; Budzinski, H. Multi-residue analysis of pharmaceutical compounds in aqueous samples. J. Chromatogr. A 2008, 1177, 150–158. [Google Scholar] [CrossRef]
- McNaught, A.D.; Wilkinson, A. Also Contains Definitions of: Heterogeneous Catalysis, Homogeneous. IUPAC Compend. Chem. Terminol. 2014, 2291, 2293. [Google Scholar] [CrossRef]
- Chen, M.; Liu, J.; Bi, Y.; Rehman, S.; Dang, Z.; Wu, P. Multifunctional magnetic MgMn-oxide composite for efficient purification of Cd2+ and paracetamol pollution: Synergetic effect and stability. J. Hazard. Mater. 2020, 388, 122078. [Google Scholar] [CrossRef] [PubMed]
- Wei, X.; Zhang, Q.; Cao, S.; Xu, X.; Chen, Y.; Liu, L.; Yang, R.; Chen, J.; Lv, B. Removal of pharmaceuticals and personal care products (PPCPs) and environmental estrogens (EEs) from water using positively charged hollow fiber nanofiltration membrane. Environ. Sci. Pollut. Res. 2020, 28, 8486–8497. [Google Scholar] [CrossRef]
- Muqeet, M.; Gadhi, T.A.; Mahar, R.B.; Bonelli, B. Advanced nanomaterials for ultrafiltration membranes application. Nanomater. Detect. Remov. Wastewater Pollut. 2020, 145–160. [Google Scholar] [CrossRef]
- Rossetti, I.; Compagnoni, M.; Ramis, G.; Freyria, F.; Armandi, M.; Bonelli, B. Development of Unconventional Photocatalytic Reactors and Processes for the Abatement of Harmful N-Containing Pollutants. Chem. Eng. Trans. 2017, 57, 1663. [Google Scholar] [CrossRef]
- Freyria, F.S.; Armandi, M.; Compagnoni, M.; Ramis, G.; Rossetti, I.; Bonelli, B. Catalytic and Photocatalytic Processes for the Abatement of N-Containing Pollutants from Wastewater. Part 2: Organic Pollutants. J. Nanosci. Nanotechnol. 2017, 17, 3654–3672. [Google Scholar] [CrossRef]
- Compagnoni, M.; Ramis, G.; Freyria, F.S.; Armandi, M.; Bonelli, B.; Rossetti, I. Photocatalytic Processes for the Abatement of N-Containing Pollutants from Wastewater. Part 1: Inorganic Pollutants. J. Nanosci. Nanotechnol. 2017, 17, 3632–3653. [Google Scholar] [CrossRef]
- Hernández-Leal, L.; Temmink, H.; Zeeman, G.; Buisman, C. Removal of micropollutants from aerobically treated grey water via ozone and activated carbon. Water Res. 2011, 45, 2887–2896. [Google Scholar] [CrossRef] [PubMed]
- Gadhi, T.A.; Mahar, R.B.; Bonelli, B. Actual mineralization versus partial degradation of wastewater contaminants. Nanomater. Detect. Remov. Wastewater Pollut. 2020, 331–350. [Google Scholar] [CrossRef]
- Shahid, M.; Farooqi, Z.H.; Begum, R.; Arif, M.; Wu, W.; Irfan, A. Critical Reviews in Analytical Chemistry Hybrid Microgels for Catalytic and Photocatalytic Removal of Nitroarenes and Organic Dyes From Aqueous Medium: A Review) Hybrid Microgels for Catalytic and Photocatalytic Removal of Nitroarenes and Organic Dyes From Aqueous Medium: A Review. Crit. Rev. Anal. Chem. 2019, 50, 513–537. [Google Scholar] [CrossRef]
- Ohno, T.; Sarukawa, K.; Tokieda, K.; Matsumura, M. Morphology of a TiO2 Photocatalyst (Degussa, P-25) Consisting of Anatase and Rutile Crystalline Phases. J. Catal. 2001, 203, 82–86. [Google Scholar] [CrossRef]
- Jiang, X.; Manawan, M.; Feng, T.; Qian, R.; Zhao, T.; Zhou, G.; Kong, F.; Wang, Q.; Dai, S.; Pan, J.H. Anatase and rutile in evonik aeroxide P25: Heterojunctioned or individual nanoparticles? Catal. Today 2017, 300, 12–17. [Google Scholar] [CrossRef]
- Freyria, F.S.; Blangetti, N.; Esposito, S.; Nasi, R.; Armandi, M.; Annelio, V.; Bonelli, B. Effects of the Brookite Phase on the Properties of Different Nanostructured TiO2 Phases Photocatalytically Active Towards the Degradation of N--Phenylurea. Chemistryopen 2020, 9, 903–912. [Google Scholar] [CrossRef]
- Piumetti, M.; Freyria, F.S.; Armandi, M.; Geobaldo, F.; Garrone, E.; Bonelli, B. Fe- and V-doped mesoporous titania prepared by direct synthesis: Characterization and role in the oxidation of AO7 by H2O2 in the dark. Catal. Today 2014, 227, 71–79. [Google Scholar] [CrossRef]
- Freyria, F.S.; Compagnoni, M.; Ditaranto, N.; Rossetti, I.; Piumetti, M.; Ramis, G.; Bonelli, B. Pure and Fe-Doped Mesoporous Titania Catalyse the Oxidation of Acid Orange 7 by H2O2 under Different Illumination Conditions: Fe Doping Improves Photocatalytic Activity under Simulated Solar Light. Catalysts 2017, 7, 213. [Google Scholar] [CrossRef]
- Piumetti, M.; Freyria, F.S.; Armandi, M.; Saracco, G.; Garrone, E.; Gonzalez, G.E.; Bonelli, B. Catalytic degradation of Acid Orange 7 by H2O2 as promoted by either bare or V-loaded titania under UV light, in dark conditions, and after incubating the catalysts in ascorbic acid. Catal. Struct. React. 2015, 1, 183–191. [Google Scholar] [CrossRef] [Green Version]
- Scientific Committee on Consumer Safety SCCS Opinion on Titanium Dioxide (TiO2) Used in Cosmetic Products That Lead to Ex-posure by Inhalation. 2020. Available online: https://health.ec.europa.eu/system/files/2021-11/sccs_o_238.pdf (accessed on 1 December 2022).
- Manzoli, M.; Freyria, F.S.; Blangetti, N.; Bonelli, B. Brookite, a sometimes under evaluated TiO2 polymorph. RSC Adv. 2022, 12, 3322–3334. [Google Scholar] [CrossRef]
- Ahmed, L.O.; Omer, R.A. Journal of Physical Chemistry and Functional Materials Computational Study on Paracetamol Drug. J. Phys. Chem. Funct. Mater. 2020, 3, 9–13. [Google Scholar]
- Holmberg, J.P.; Ahlberg, E.; Bergenholtz, J.; Hassellöv, M.; Abbas, Z. Surface charge and interfacial potential of titanium dioxide nanoparticles: Experimental and theoretical investigations. J. Colloid Interface Sci. 2013, 407, 168–176. [Google Scholar] [CrossRef] [PubMed]
- Li, H.; Vrinat, M.; Berhault, G.; Li, D.; Nie, H.; Afanasiev, P. Hydrothermal synthesis and acidity characterization of TiO2 polymorphs. Mater. Res. Bull. 2013, 48, 3374–3382. [Google Scholar] [CrossRef]
- Kirstein, K.; Reichmann, K.; Preis, W.; Mitsche, S. Effect of commercial anatase-TiO2 raw materials on the electrical characteristics of ceramics with positive temperature coefficient of resistivity. J. Eur. Ceram. Soc. 2011, 31, 2339–2349. [Google Scholar] [CrossRef]
- Budarz, J.F.; Turolla, A.; Piasecki, A.F.; Bottero, J.-Y.; Antonelli, M.; Wiesner, M.R. Influence of Aqueous Inorganic Anions on the Reactivity of Nanoparticles in TiO2 Photocatalysis. Langmuir 2017, 33, 2770–2779. [Google Scholar] [CrossRef]
- Borghi, F.; Vyas, V.; Podestà, A.; Milani, P. Nanoscale Roughness and Morphology Affect the IsoElectric Point of Titania Surfaces. PLoS ONE 2013, 8, e68655. [Google Scholar] [CrossRef] [Green Version]
- Cao, Z.; Zhang, T.; Ren, P.; Cao, D.; Lin, Y.; Wang, L.; Zhang, B.; Xiang, X. Doping of Chlorine from a Neoprene Adhesive Enhances Degradation Efficiency of Dyes by Structured TiO2-Coated Photocatalytic Fabrics. Catalysts 2020, 10, 69. [Google Scholar] [CrossRef] [Green Version]
- Hadjiivanov, K.I.; Klissurski, D.G.; Davydov, A.A. Study of phosphate-modified TiO2 (anatase). J. Catal. 1989, 116, 498–505. [Google Scholar] [CrossRef]
- Zhao, D.; Chen, C.; Wang, Y.; Ji, H.; Ma, W.; Zang, L.; Zhao, J. Surface Modification of TiO2 by Phosphate: Effect on Photocatalytic Activity and Mechanism Implication. J. Phys. Chem. C 2008, 112, 5993–6001. [Google Scholar] [CrossRef]
- Liu, X.; Chen, G.; Erwin, J.G.; Adam, N.K.; Su, C. Release of phosphorous impurity from TiO2 anatase and rutile nanoparticles in aquatic environments and its implications. Water Res. 2013, 47, 6149–6156. [Google Scholar] [CrossRef] [PubMed]
- Esposito, S.; Ditaranto, N.; Dell’Agli, G.; Nasi, R.; Rivolo, P.; Bonelli, B. Effective Inclusion of Sizable Amounts of Mo within TiO2 Nanoparticles Can Be Obtained by Reverse Micelle Sol–Gel Synthesis. ACS Omega 2021, 6, 5379–5388. [Google Scholar] [CrossRef] [PubMed]
- Bonelli, B.; Tammaro, O.; Martinovic, F.; Nasi, R.; Dell’Agli, G.; Rivolo, P.; Giorgis, F.; Ditaranto, N.; Deorsola, F.A.; Esposito, S. Reverse Micelle Strategy for the Synthesis of MnOx–TiO2 Active Catalysts for NH3-Selective Catalytic Reduction of NOx at Both Low Temperature and Low Mn Content. ACS Omega 2021, 6, 24562–24574. [Google Scholar] [CrossRef] [PubMed]
- Nasi, R.; Esposito, S.; Freyria, F.S.; Armandi, M.; Gadhi, T.A.; Hernandez, S.; Rivolo, P.; Ditaranto, N.; Bonelli, B. Application of Reverse Micelle Sol–Gel Synthesis for Bulk Doping and Heteroatoms Surface Enrichment in Mo-Doped TiO2 Nanoparticles. Materials 2019, 12, 937. [Google Scholar] [CrossRef] [PubMed] [Green Version]
- Naumkin, A.v.; Kraut-Vass, A.; Gaarenstroom, S.W.; Powell, C.J. NIST X-Ray Photoelectron Spectroscopy Database. Available online: https://srdata.nist.gov/xps/Default.aspx (accessed on 1 December 2022).
- X-Ray Photoelectron Spectroscopy (XPS) Reference Pages. Available online: https://srdata.nist.gov/xps/ (accessed on 1 December 2022).
- Moctezuma, E.; Leyva, E.; Aguilar, C.A.; Luna, R.A.; Montalvo, C. Photocatalytic degradation of paracetamol: Intermediates and total reaction mechanism. J. Hazard. Mater. 2012, 243, 130–138. [Google Scholar] [CrossRef]
- Yang, L.; Yu, L.; Ray, M.B. Photocatalytic Oxidation of Paracetamol: Dominant Reactants, Intermediates, and Reaction Mechanisms. Environ. Sci. Technol. 2008, 43, 460–465. [Google Scholar] [CrossRef]
- Yang, L.; Bai, X.; Shi, J.; Du, X.; Xu, L.; Jin, P. Quasi-full-visible-light absorption by D35-TiO2/g-C3N4 for synergistic persulfate activation towards efficient photodegradation of micropollutants. Appl. Catal. B Environ. 2019, 256, 117759. [Google Scholar] [CrossRef]
- Vogna, D.; Marotta, R.; Napolitano, A.; D’Ischia, M. Advanced Oxidation Chemistry of Paracetamol. UV/H2O2-Induced Hydroxylation/Degradation Pathways and 15N-Aided Inventory of Nitrogenous Breakdown Products. J. Org. Chem. 2002, 67, 6143–6151. [Google Scholar] [CrossRef]
- Ollis, D.F. Kinetics of Photocatalyzed Reactions: Five Lessons Learned. Front. Chem. 2018, 6, 378. [Google Scholar] [CrossRef] [Green Version]
- Su, R.; Tiruvalam, R.; He, Q.; Dimitratos, N.; Kesavan, L.; Hammond, C.; Lopez-Sanchez, J.A.; Bechstein, R.; Kiely, C.J.; Hutchings, G.J.; et al. Promotion of Phenol Photodecomposition over TiO2 Using Au, Pd, and Au-Pd Nanoparticles. ACS Nano 2012, 6, 6284–6292. [Google Scholar] [CrossRef] [PubMed]
- Mendoza-Damián, G.; Tzompantzi, F.; Pérez-Hernández, R.; Gómez, R.; Hernández-Gordillo, A. Photocatalytic properties of boehmite–SnO2 composites for the degradation of phenol. Catal. Today 2016, 266, 82–89. [Google Scholar] [CrossRef]
- Trujillano, R.; Rives, V.; García, I. Photocatalytic Degradation of Paracetamol in Aqueous Medium Using TiO2 Prepared by the Sol–Gel Method. Molecules 2022, 27, 2904. [Google Scholar] [CrossRef] [PubMed]
- Li, Z.; Cong, S.; Xu, Y. Brookite vs Anatase TiO2 in the Photocatalytic Activity for Organic Degradation in Water. ACS Catal. 2014, 4, 3273–3280. [Google Scholar] [CrossRef]
- Buckeridge, J.; Butler, K.T.; Catlow, C.R.A.; Logsdail, A.J.; Scanlon, D.O.; Shevlin, S.A.; Woodley, S.M.; Sokol, A.A.; Walsh, A. Polymorph Engineering of TiO2: Demonstrating How Absolute Reference Potentials Are Determined by Local Coordination. Chem. Mater. 2015, 27, 3844–3851. [Google Scholar] [CrossRef] [Green Version]
- Hossen, M.B.; Siddique, Z.A.; Uzzaman, M.; Ahsan, A.; Chowdhury, K.U. A Computational Approach to Investigate the Biochemical Properties of Paracetamol and Its Metabolites. Biomed. J. Sci. Tech. Res. 2019, 22, 16860–16865. [Google Scholar] [CrossRef] [Green Version]
- Vequizo, J.J.M.; Matsunaga, H.; Ishiku, T.; Kamimura, S.; Ohno, T.; Yamakata, A. Trapping-Induced Enhancement of Photocatalytic Activity on Brookite TiO2 Powders: Comparison with Anatase and Rutile TiO2 Powders. ACS Catal. 2017, 7, 2644–2651. [Google Scholar] [CrossRef]
- Tran, H.T.T.; Kosslick, H.; Ibad, M.F.; Fischer, C.; Bentrup, U.; Vuong, T.H.; Nguyen, L.Q.; Schulz, A. Photocatalytic Performance of Highly Active Brookite in the Degradation of Hazardous Organic Compounds Compared to Anatase and Rutile. Appl. Catal. B Environ. 2017, 200, 647–658. [Google Scholar] [CrossRef]
- Choi, M.; Lim, J.; Baek, M.; Choi, W.; Kim, W.; Yong, K. Investigating the Unrevealed Photocatalytic Activity and Stability of Nanostructured Brookite TiO2 Film as an Environmental Photocatalyst. ACS Appl. Mater. Interfaces 2017, 9, 16252–16260. [Google Scholar] [CrossRef]


| Sample | QPA (Phase wt.%) a | Crystallite Size, nm (±) a | BET SSA (m2 g−1) b | Vtot (cm3 g−1) b | EDX c Determined Impurities (at. %) | XPS d Determined Impurities (at. %) | pHIEP e |
|---|---|---|---|---|---|---|---|
| Comm_A | 98.3 (A) | 108.9 (0.9) | 8.98 | 0.0300 | K (0.16) P (0.27) | K (2.9) P (2.7) | 1.31 |
| 1.7 (R) | 180.2 (31.7) | ||||||
| Comm_R | 4.6 (A) | 119.5 (12.4) | 2.65 | 0.00554 | Not detected | Cl (0.7) | 2.87 |
| 95.4 (R) | 209.6 (8.7) | ||||||
| Comm_B | 100 (B) | 23 (0.7) | 38.09 | 0.347 | Cl (0.03) | Not detected | 5.11 |
| P25 | 88 (A) | 19 (3) | 51.21 | 0.188 | Cl (0.09) | Not detected | 6.77 |
| 12 (R) | 23 (4) | ||||||
| Lab_A | 100 (A) | 12.4 (1.3) | 150 | 0.280 | Not detected | Not detected | 6.07 |
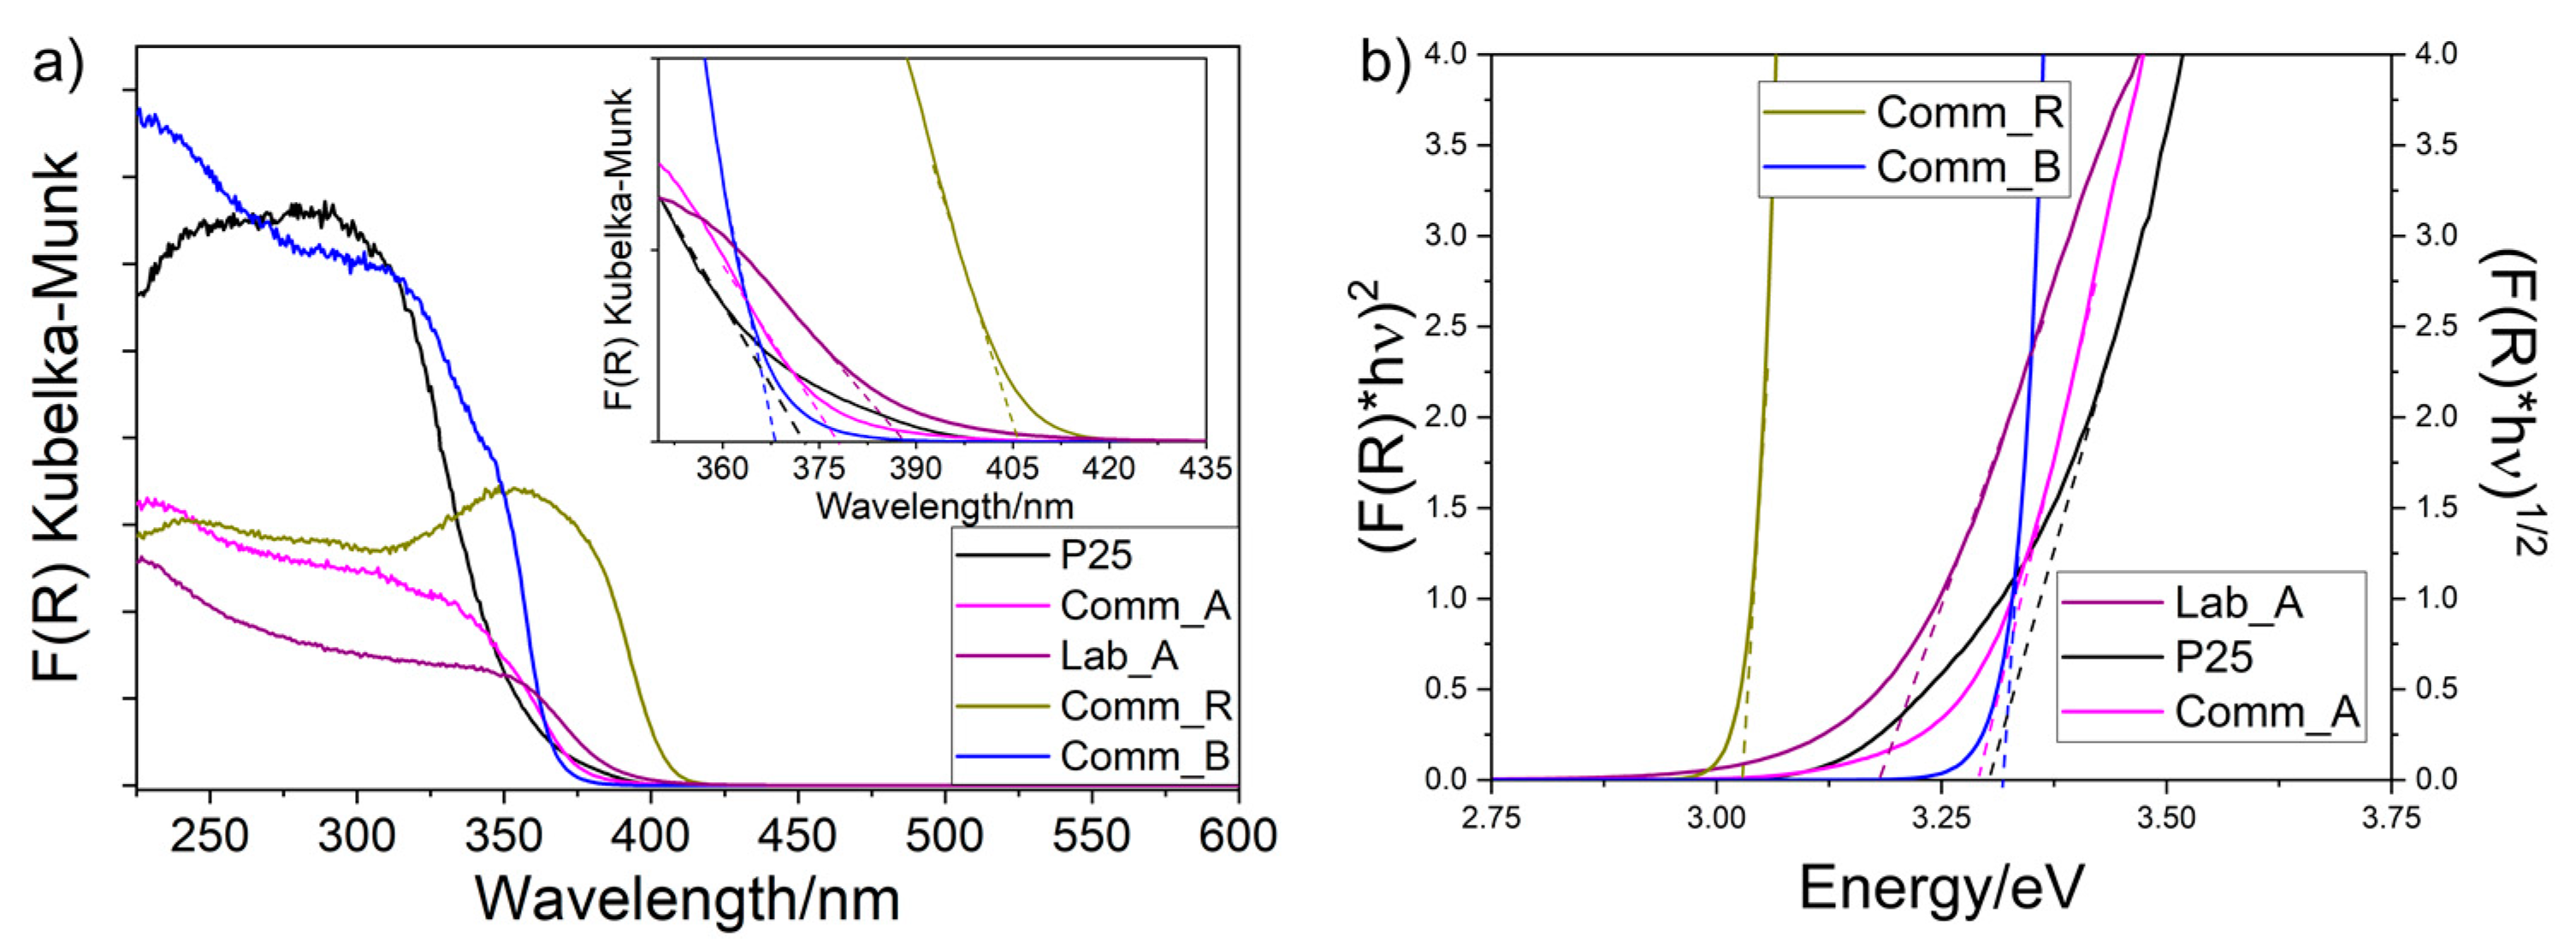
| Sample | O 1s BE (eV) | Ti 2p1/2/ Ti 2p3/2 BE (eV) | Tauc’s Plot Determined/Onset Extrapolated Eg (eV) | XPS Determined VB Energy (eV) | CB Energy (eV) | ||
|---|---|---|---|---|---|---|---|
| Comm_A | Lattice O2− | 529.52 | Ti4+ | 464.06/ 458.36 | 3.30/3.28 | 2.54 | 5.83 |
| OH− | 530.47 | ||||||
| Phosphate O | 532.44 | ||||||
| Comm_R | Lattice O2− | 529.77 | Ti4+ | 464.27/ 458.57 | 3.02/3.03 | 2.49 | 5.52 |
| OH− | 531.10 | ||||||
| P25 | Lattice O2− | 529.70 | Ti4+ | 464.16/ 458.46 | 3.33/3.31 | 2.70 | 6.02 |
| OH− | 531.95 | ||||||
| H2O/organic | 533.51 | ||||||
| Comm_B | Lattice O2− | 529.20 | Ti4+ | 463.66/ 457.94 | 3.30/3.32 | 2.40 | 5.36 |
| OH− | 530.20 | ||||||
| Lab_A | Lattice O2− | 529.78 | Ti4+ | 464.28/ 458.58 | 3.20/3.18 | 2.58 | 5.78 |
| OH− | 531.08 | ||||||
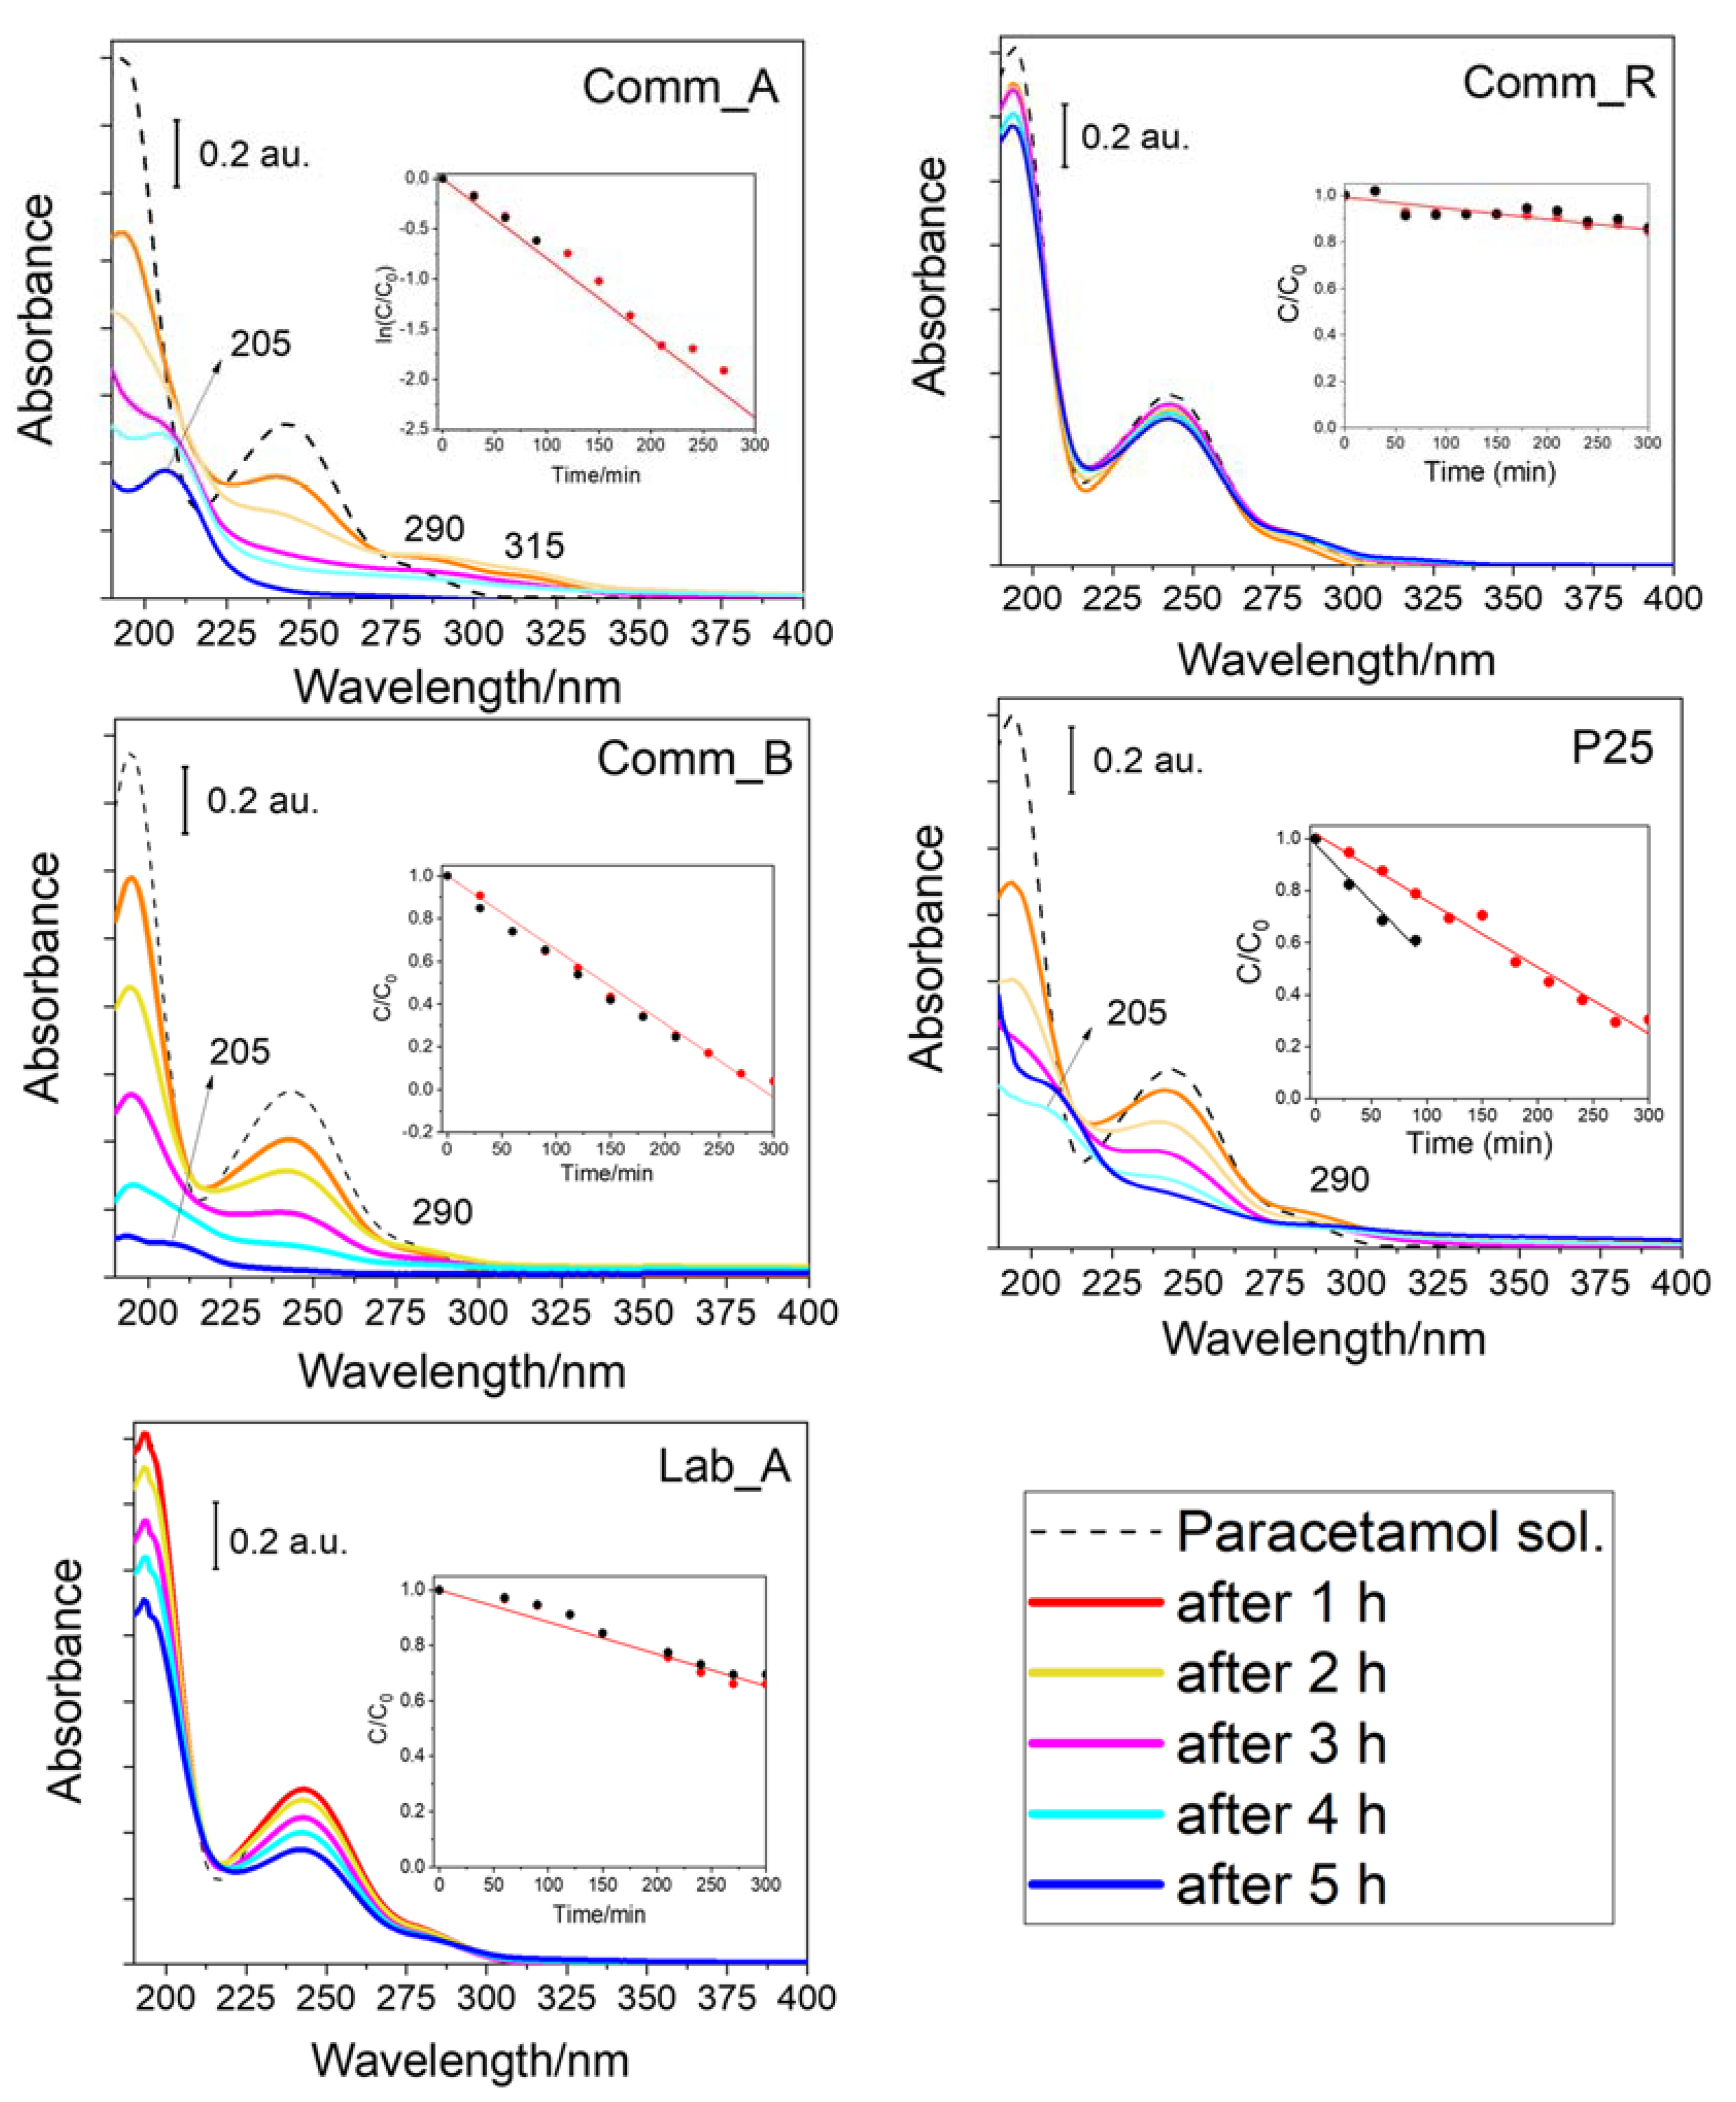
| Photocatalyst | Observed Reaction Order | Kinetic Constant (k243) Value | Paracetamol % Conversion after 300 min |
|---|---|---|---|
| Comm_A | 1 | 7.2 × 10⁻³ mol L−1 min−1 | 95 % |
| Lab_A | 0 | 1.2 × 10⁻³ min−1 | 34 % |
| Comm_R | 0 | 5.1 × 10⁻⁴ min−1 | 15 % |
| Comm_B | 0 | 3.5 × 10⁻³ min−1 | 96 % |
| P25 | 0 | 2.5 × 10⁻³ min−1 | 63 % |
Disclaimer/Publisher’s Note: The statements, opinions and data contained in all publications are solely those of the individual author(s) and contributor(s) and not of MDPI and/or the editor(s). MDPI and/or the editor(s) disclaim responsibility for any injury to people or property resulting from any ideas, methods, instructions or products referred to in the content. |
© 2023 by the authors. Licensee MDPI, Basel, Switzerland. This article is an open access article distributed under the terms and conditions of the Creative Commons Attribution (CC BY) license (https://creativecommons.org/licenses/by/4.0/).
Share and Cite
Blangetti, N.; Freyria, F.S.; Calviello, M.C.; Ditaranto, N.; Guastella, S.; Bonelli, B. Photocatalytic Degradation of Paracetamol under Simulated Sunlight by Four TiO2 Commercial Powders: An Insight into the Performance of Two Sub-Micrometric Anatase and Rutile Powders and a Nanometric Brookite Powder. Catalysts 2023, 13, 434. https://doi.org/10.3390/catal13020434
Blangetti N, Freyria FS, Calviello MC, Ditaranto N, Guastella S, Bonelli B. Photocatalytic Degradation of Paracetamol under Simulated Sunlight by Four TiO2 Commercial Powders: An Insight into the Performance of Two Sub-Micrometric Anatase and Rutile Powders and a Nanometric Brookite Powder. Catalysts. 2023; 13(2):434. https://doi.org/10.3390/catal13020434
Chicago/Turabian StyleBlangetti, Nicola, Francesca S. Freyria, Maria Chiara Calviello, Nicoletta Ditaranto, Salvatore Guastella, and Barbara Bonelli. 2023. "Photocatalytic Degradation of Paracetamol under Simulated Sunlight by Four TiO2 Commercial Powders: An Insight into the Performance of Two Sub-Micrometric Anatase and Rutile Powders and a Nanometric Brookite Powder" Catalysts 13, no. 2: 434. https://doi.org/10.3390/catal13020434
APA StyleBlangetti, N., Freyria, F. S., Calviello, M. C., Ditaranto, N., Guastella, S., & Bonelli, B. (2023). Photocatalytic Degradation of Paracetamol under Simulated Sunlight by Four TiO2 Commercial Powders: An Insight into the Performance of Two Sub-Micrometric Anatase and Rutile Powders and a Nanometric Brookite Powder. Catalysts, 13(2), 434. https://doi.org/10.3390/catal13020434