Article

Thermal and Plasma-Assisted CO2 Methanation over Ru/Zeolite: A Mechanistic Study Using In-Situ Operando FTIR

by
Domenico Aceto
1,2,
Maria Carmen Bacariza
1,
Arnaud Travert
2,
Carlos Henriques
1,* and
Federico Azzolina-Jury
2,*
1
Centro de Química Estrutural, Institute of Molecular Sciences, Departamento de Engenharia Química, Instituto Superior Técnico, Universidade de Lisboa, Av. Rovisco Pais, 1049 001 Lisboa, Portugal
2
Laboratoire Catalyse et Spectrochimie, ENSICAEN, UNICAEN, Normandie Université, CNRS, 14000 Caen, France
*
Authors to whom correspondence should be addressed.
Catalysts 2023, 13(3), 481; https://doi.org/10.3390/catal13030481
Submission received: 31 January 2023 / Revised: 21 February 2023 / Accepted: 25 February 2023 / Published: 27 February 2023
(This article belongs to the Special Issue Plasma Catalysis for CO2 Recycling)

Abstract

:
CO2 methanation is an attractive reaction to convert CO2 into a widespread fuel such as methane, being the combination of catalysts and a dielectric barrier discharge (DBD) plasma responsible for synergistic effects on the catalyst’s performances. In this work, a Ru-based zeolite catalyst, 3Ru/CsUSY, was synthesized by incipient wetness impregnation and characterized by TGA, XRD, H2-TPR, N2 sorption and CO2-TPD. Catalysts were tested under thermal and plasma-assisted CO2 methanation conditions using in-situ operando FTIR, with the aim of comparing the mechanism under both types of catalysis. The incorporation of Ru over the CsUSY zeolite used as support induced a decrease of the textural properties and an increase of the basicity and hydrophobicity, while no zeolite structural damage was observed. Under thermal conditions, a maximum CO2 conversion of 72% and CH4 selectivity above 95% were registered. These promising results were ascribed to the presence of small Ru0 nanoparticles over the support (16 nm), catalyst surface hydrophobicity and the presence of medium-strength basic sites in the catalyst. Under plasma-catalytic conditions, barely studied in similar setups in literature, CO2 was found to be excited by the plasma, facilitating its adsorption on the surface of 3Ru/CsUSY in the form of oxidized carbon species such as formates, aldehydes, carbonates, or carbonyls, which are afterwards progressively hydrogenated to methane. Adsorption and surface reaction of key intermediates, namely formate and aldehydic groups, was observed even on the support alone, an occurrence not reported before for thermal catalysis. Overall, similar reaction mechanisms were proposed for both thermal and plasma-catalysis conditions.

1. Introduction

The concentration of CO2 in the atmosphere due to anthropogenic activities has been steadily rising since the industrial revolution [1], and nowadays carbon dioxide makes up 77% of greenhouse gases emissions. In an effort to mitigate CO2 emissions, a number of strategies have been formulated over the years, and the possibility to use CO2 as a building block in the production of value-added chemicals and/or fuels has gained great interest over the past decades [2]. One of the most studied reactions to reutilize CO2 is the CO2 methanation reaction, which traditionally aims to convert CO2 into methane through thermal processes aided using various catalysts [3]. Methane is a relevant gas in today’s industrial, energy and transportation landscapes, mainly because it is an excellent energy carrier that already has an extensive distribution infrastructure, spanning across many countries [4]. Today, the methanation reaction (also known as Sabatier reaction, Equation (1) [4]) is typically carried out at 300–350 °C and has reached quite significant CO2 conversion and selectivity towards methane, depending on the catalyst used.
CO2 + 4H2 ⇄ CH4 + 2H2O → ∆Hf0 = −164 kJ/mol
The most used catalysts are nanoparticles of metals of the 8th or 10th group, such as Ni, Ru, Co, Fe, Rh or Pd [3,5,6,7,8,9,10], since the hydrogenation of CO2 to CH4 is an 8 electrons process that requires a very active hydrogenating metal [3,5] as a catalyst. One of the most utilized metals is nickel, because it has a very good compromise between activity and cost [4]. Another very interesting active metal is ruthenium, since it has a greater H2 dissociation ability than Ni, thus lowering the activation energy, and a higher resistance to re-oxidation occurring during the reaction [11,12,13]. Support materials, if carefully chosen and designed, have also been proven to greatly influence a catalyst’s efficiency in the methanation reaction. Intermediate-strength basic sites seem to be of great importance for the preliminary absorption of CO2 on the catalyst’s surface, while electronic interaction between the active metal and the support can reduce the metal after a reaction cycle [11,13]. The support’s morphology influences the dimension and dispersion of the metal particles as well. A class of materials that shows great potential to be used as support for catalysts in the methanation reaction is zeolites [14]. Indeed, one important feature of zeolites is the fine control that it is possible to achieve over their composition and structure, which permits us to have controlled active sites and to utilize the micro- and nanopores of the material as nanoreactors. Among the properties that it is possible to tune, some of them were found to be of great interest to optimize the methanation reaction: metallic phase dispersion, basic sites on the surface (high affinity to CO2), additional active sites for CO2 activation (e.g., compensating cations, extra-framework aluminum species), hydrophobicity/hydrophilicity character and hydrothermal stability [14].
Along with studies which aim to improve the reaction through the formulation of better-performing catalysts, in the last decade studies about the possibility to apply non-thermal plasmas (NTP) as a way to activate the CO2 methanation reaction are flourishing, as highlighted by many reviews [13,15,16,17]. These studies on plasma catalysis highlighted that plasma type has a significant influence on the CH4 production, and dielectric barrier discharge (DBD) plasma systems are reported to be among the most widely studied, combining mild reaction conditions (namely atmospheric pressure) with the highest CH4 yields and high conversions of CO2 [13,15,16,17,18,19]. Clearly, a thorough understanding of the effects of NTP on catalyst surface chemistry is paramount for the rational design of a plasma-catalytic system. Indeed, in thermal catalysis the reaction mechanism for CO2 methanation is still the subject of debate, although it has been the subject of numerous studies [20,21]. There are only a few reports discussing possible mechanisms for plasma-assisted CO2 methanation, mostly because it is not easy to investigate such processes due to the co-dependency of catalytic and plasma properties and due to the abundance of reactions occurring in the plasma and on the catalyst surface [22]. In-situ operando FTIR analyses of catalytic reactions is very promising for the study of IR active molecules on a surface under plasma exposure in working conditions. Azzolina-Jury and Thibault-Starzyk [23], for example, reported on the design of a low-pressure cell suitable for the investigation of IR-active surface species in a glow discharge plasma, using time-resolved T-FTIR. However, the implementation of such techniques remains a challenge when investigating atmospheric pressure plasma such as DBD. Sun et al. [24], in fact, used an FTIR cell to study the reaction mechanism of the reverse water-gas shift reaction carried out in a packed-bed DBD reactor by following the evolution of the concentration of surface species with time. Recently, Van Turnhout et al. [25] used a novel, custom-made T-FTIR cell to investigate surface species adsorbed on a Ru/SiO2 catalyst during plasma-catalytic dry reforming of methane, concluding that the formation of surface species on the catalyst sample in the plasma-catalytic setup, as well as the observed conversion and selectivity in plasma conditions, could not be explained by plasma-induced heating of the catalyst surface, but must be attributed to other plasma effects, such as the adsorption of plasma-generated radicals and molecules, or the occurrence of Eley–Rideal reactions.
Thus, in this work the mechanisms for CO2 methanation assisted by both thermal and plasma-catalysis are studied using in-situ operando FTIR. The catalyst selected for this work was prepared by dispersing 3 wt.% of Ru over a USY zeolite with Si/Al = 38 containing cesium as a compensating cation, chosen based on previous optimization studies [24]. TGA, N2 physisorption, XRD, H2-TPR and CO2-TPD were used as characterization techniques, as the correlation of chemical and structural properties to catalytic performance has been shown in a number of previous studies [26,27,28,29,30]. A custom-made in-situ cell was used to study the species developed in a DBD plasma and how they interacted with the catalyst surface in transmission mode, at atmospheric pressure, operating flow conditions (WHSV ~ 0–50,000 mL g−1 h−1), and relevant discharge voltages (~0–50 kV) and frequencies (~0–5 kHz) [25]. Comparing the proposed mechanisms in the two catalytic regimes, a possible correlation between criteria to define better catalysts under thermal and plasma-assisted conditions will be researched.

2. Results

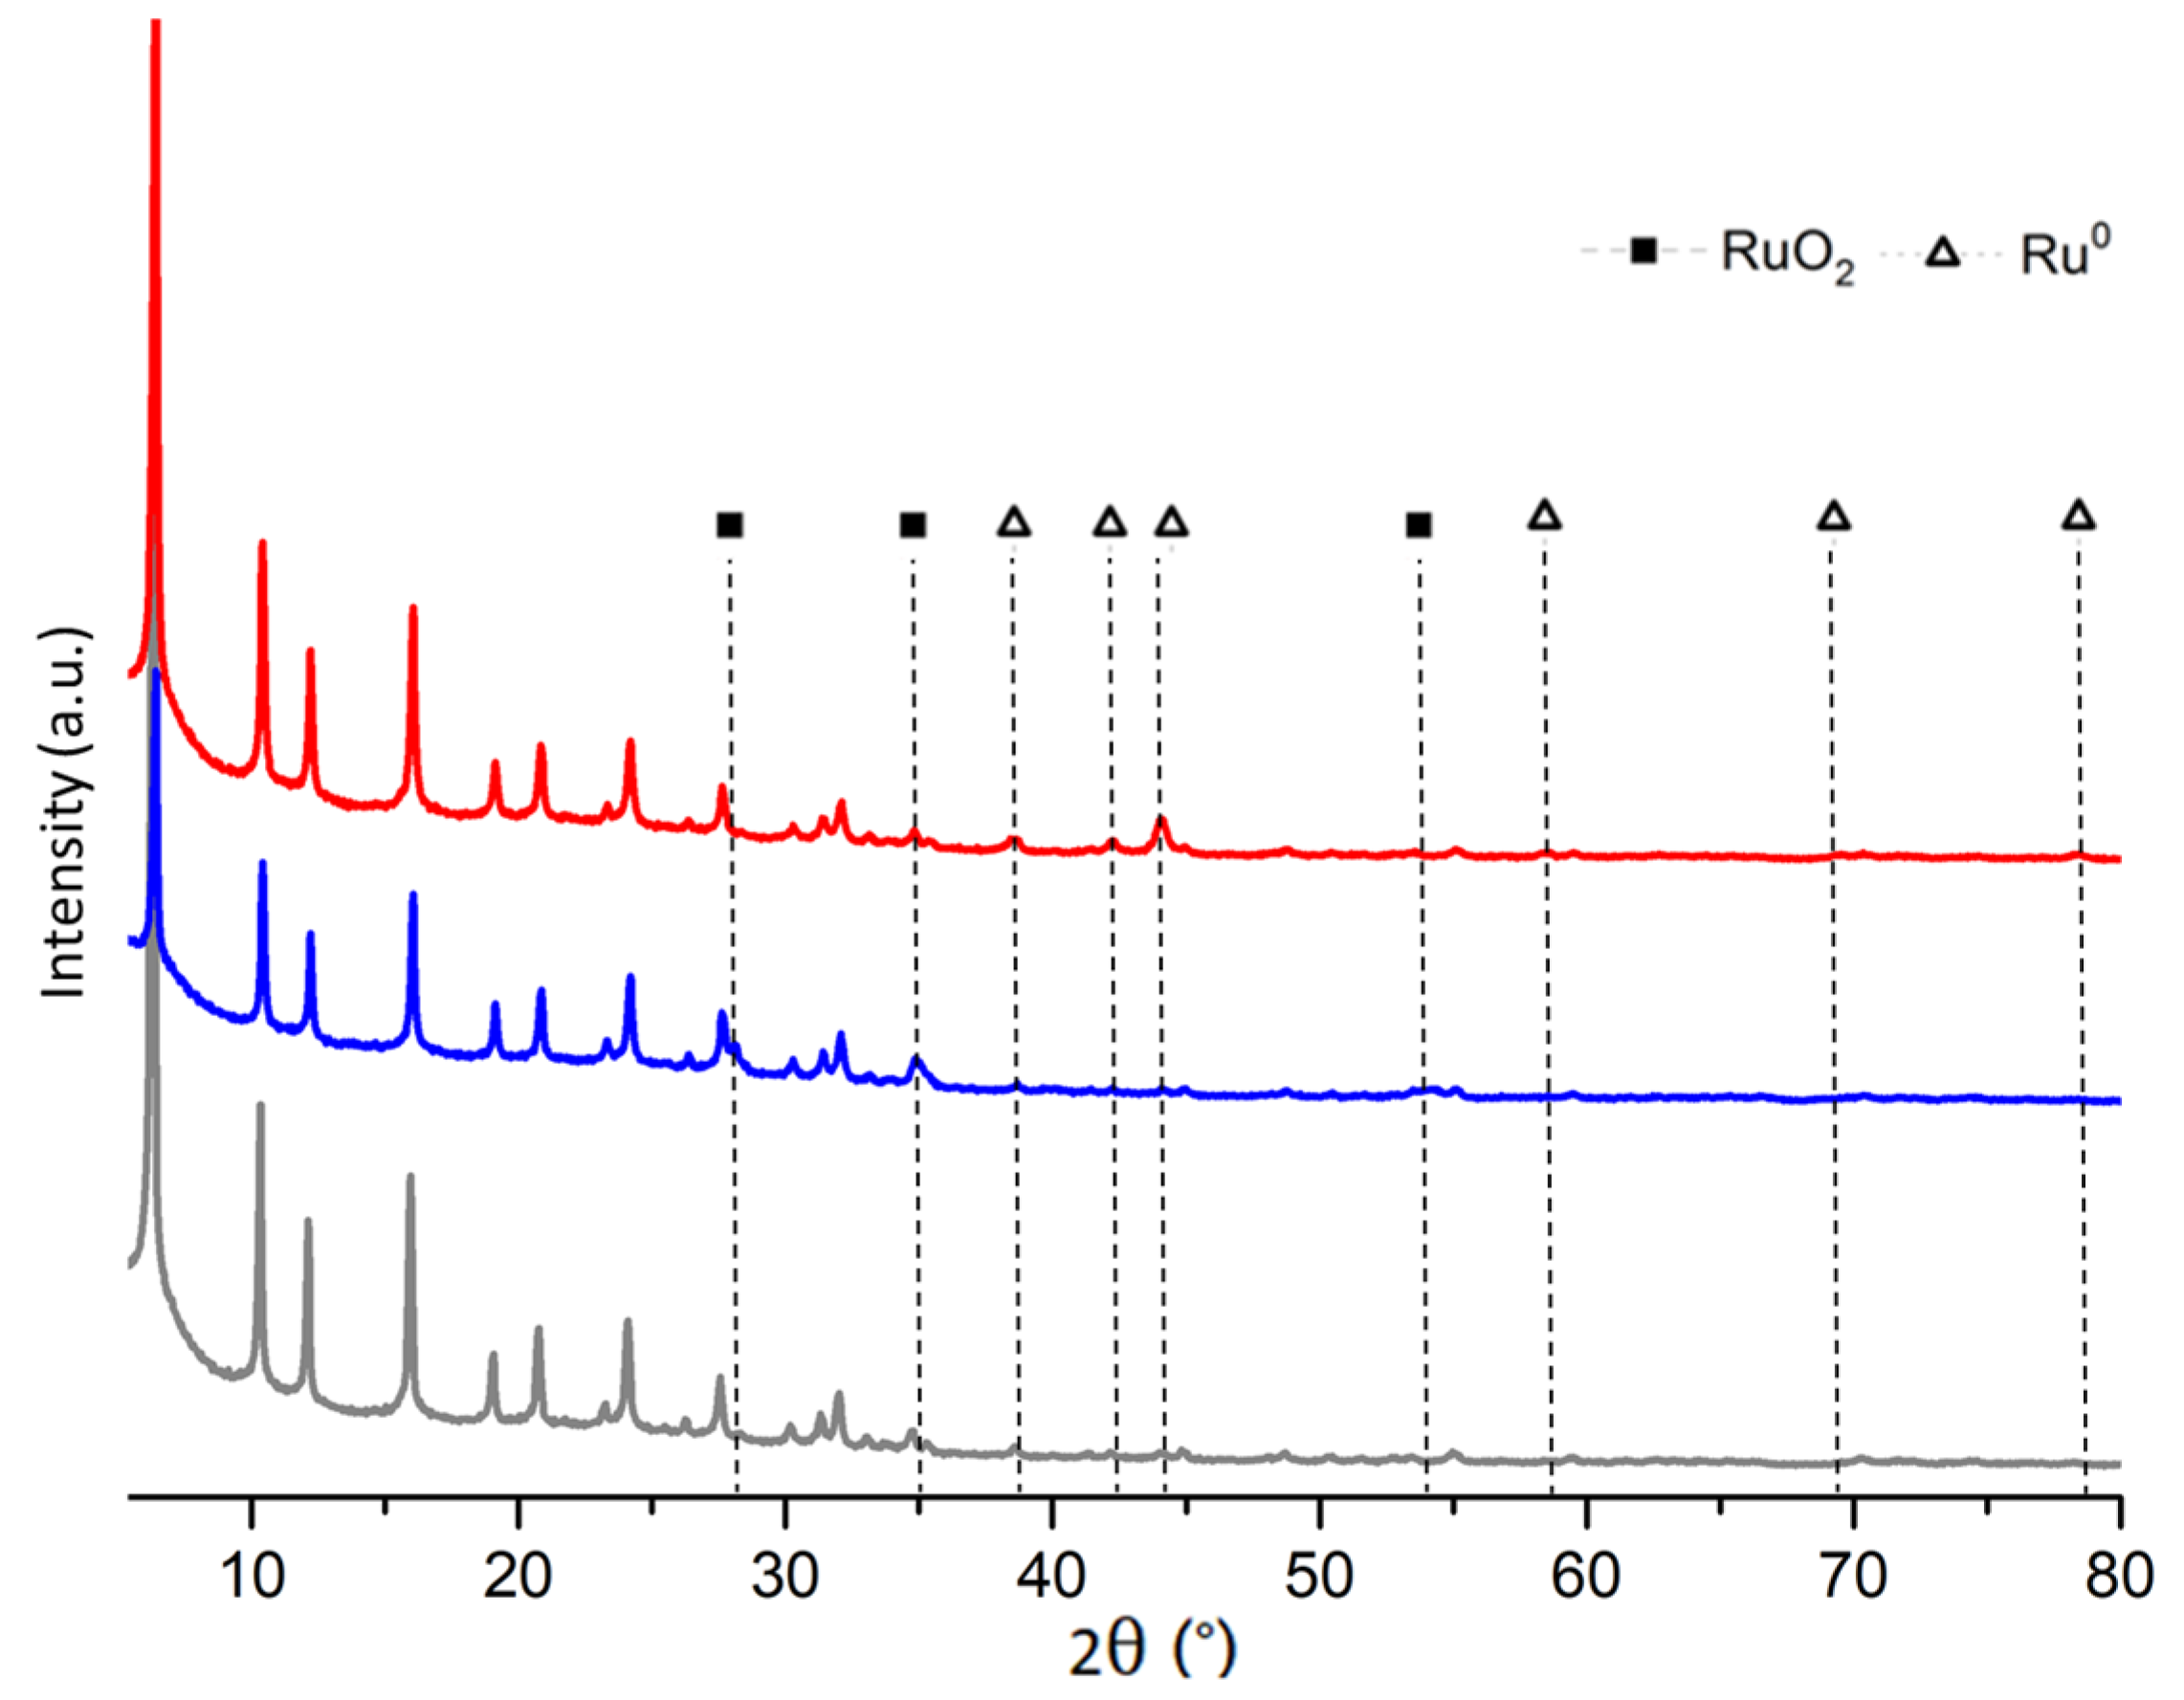
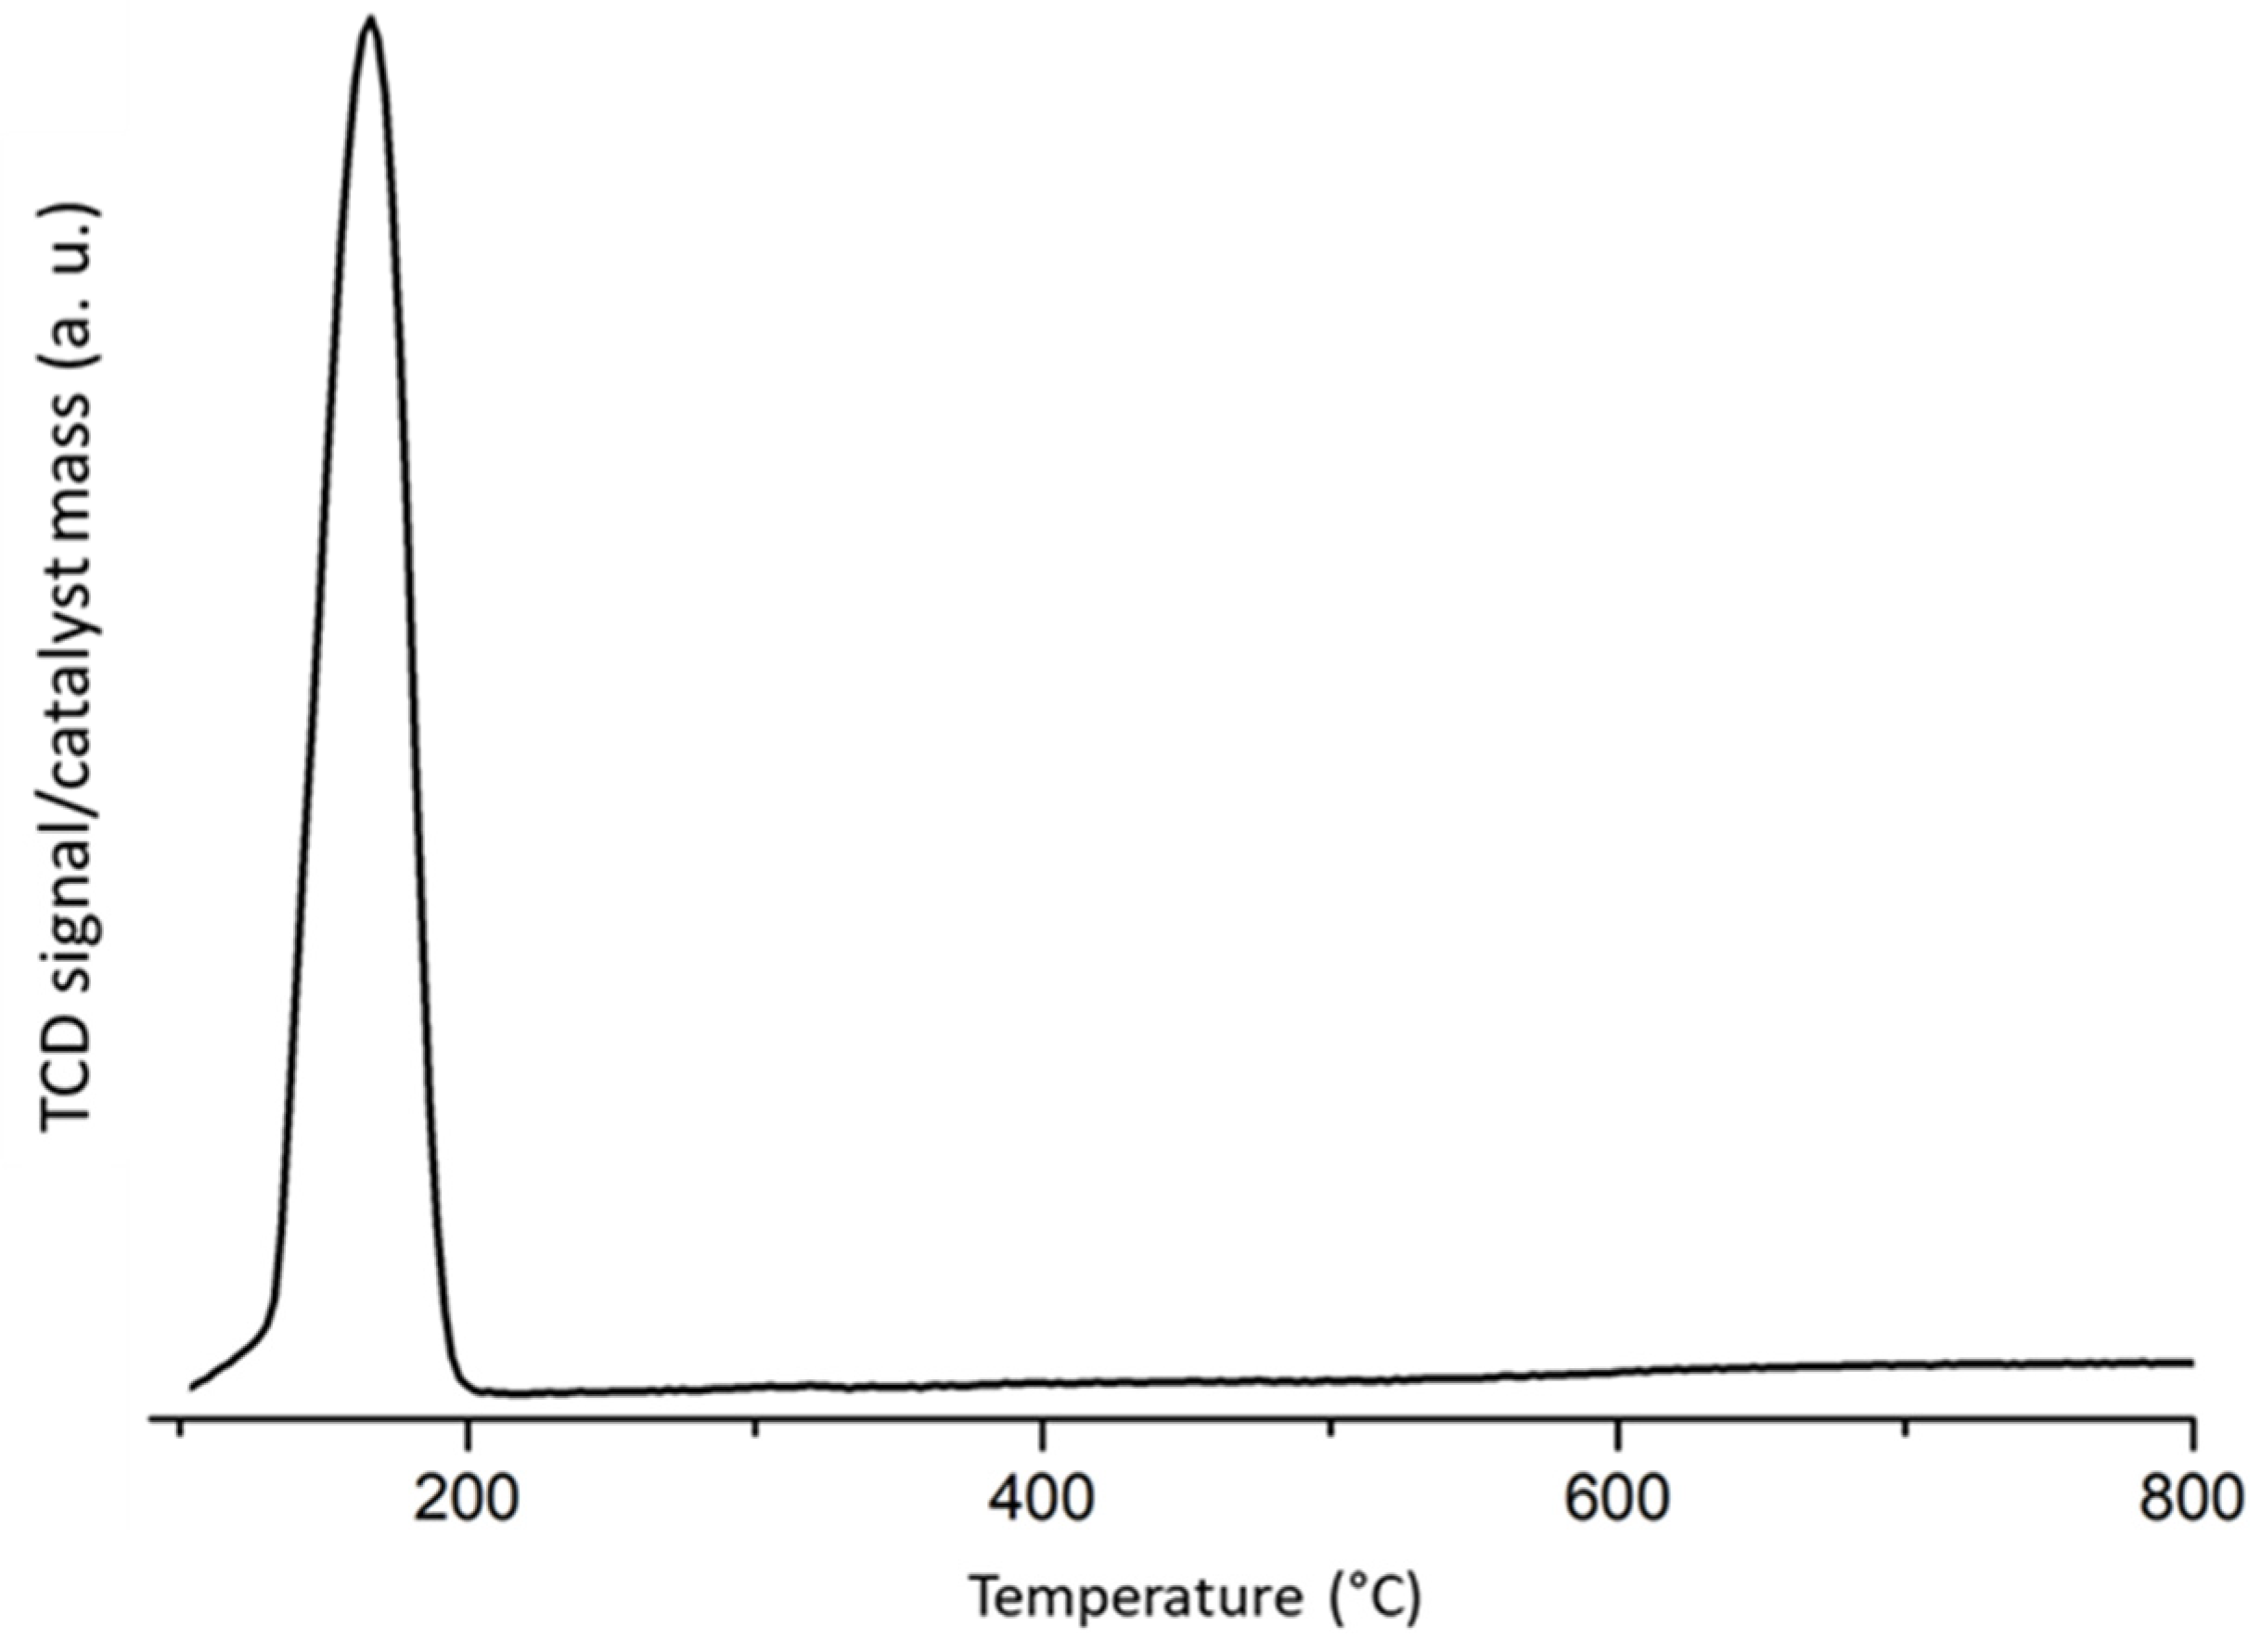
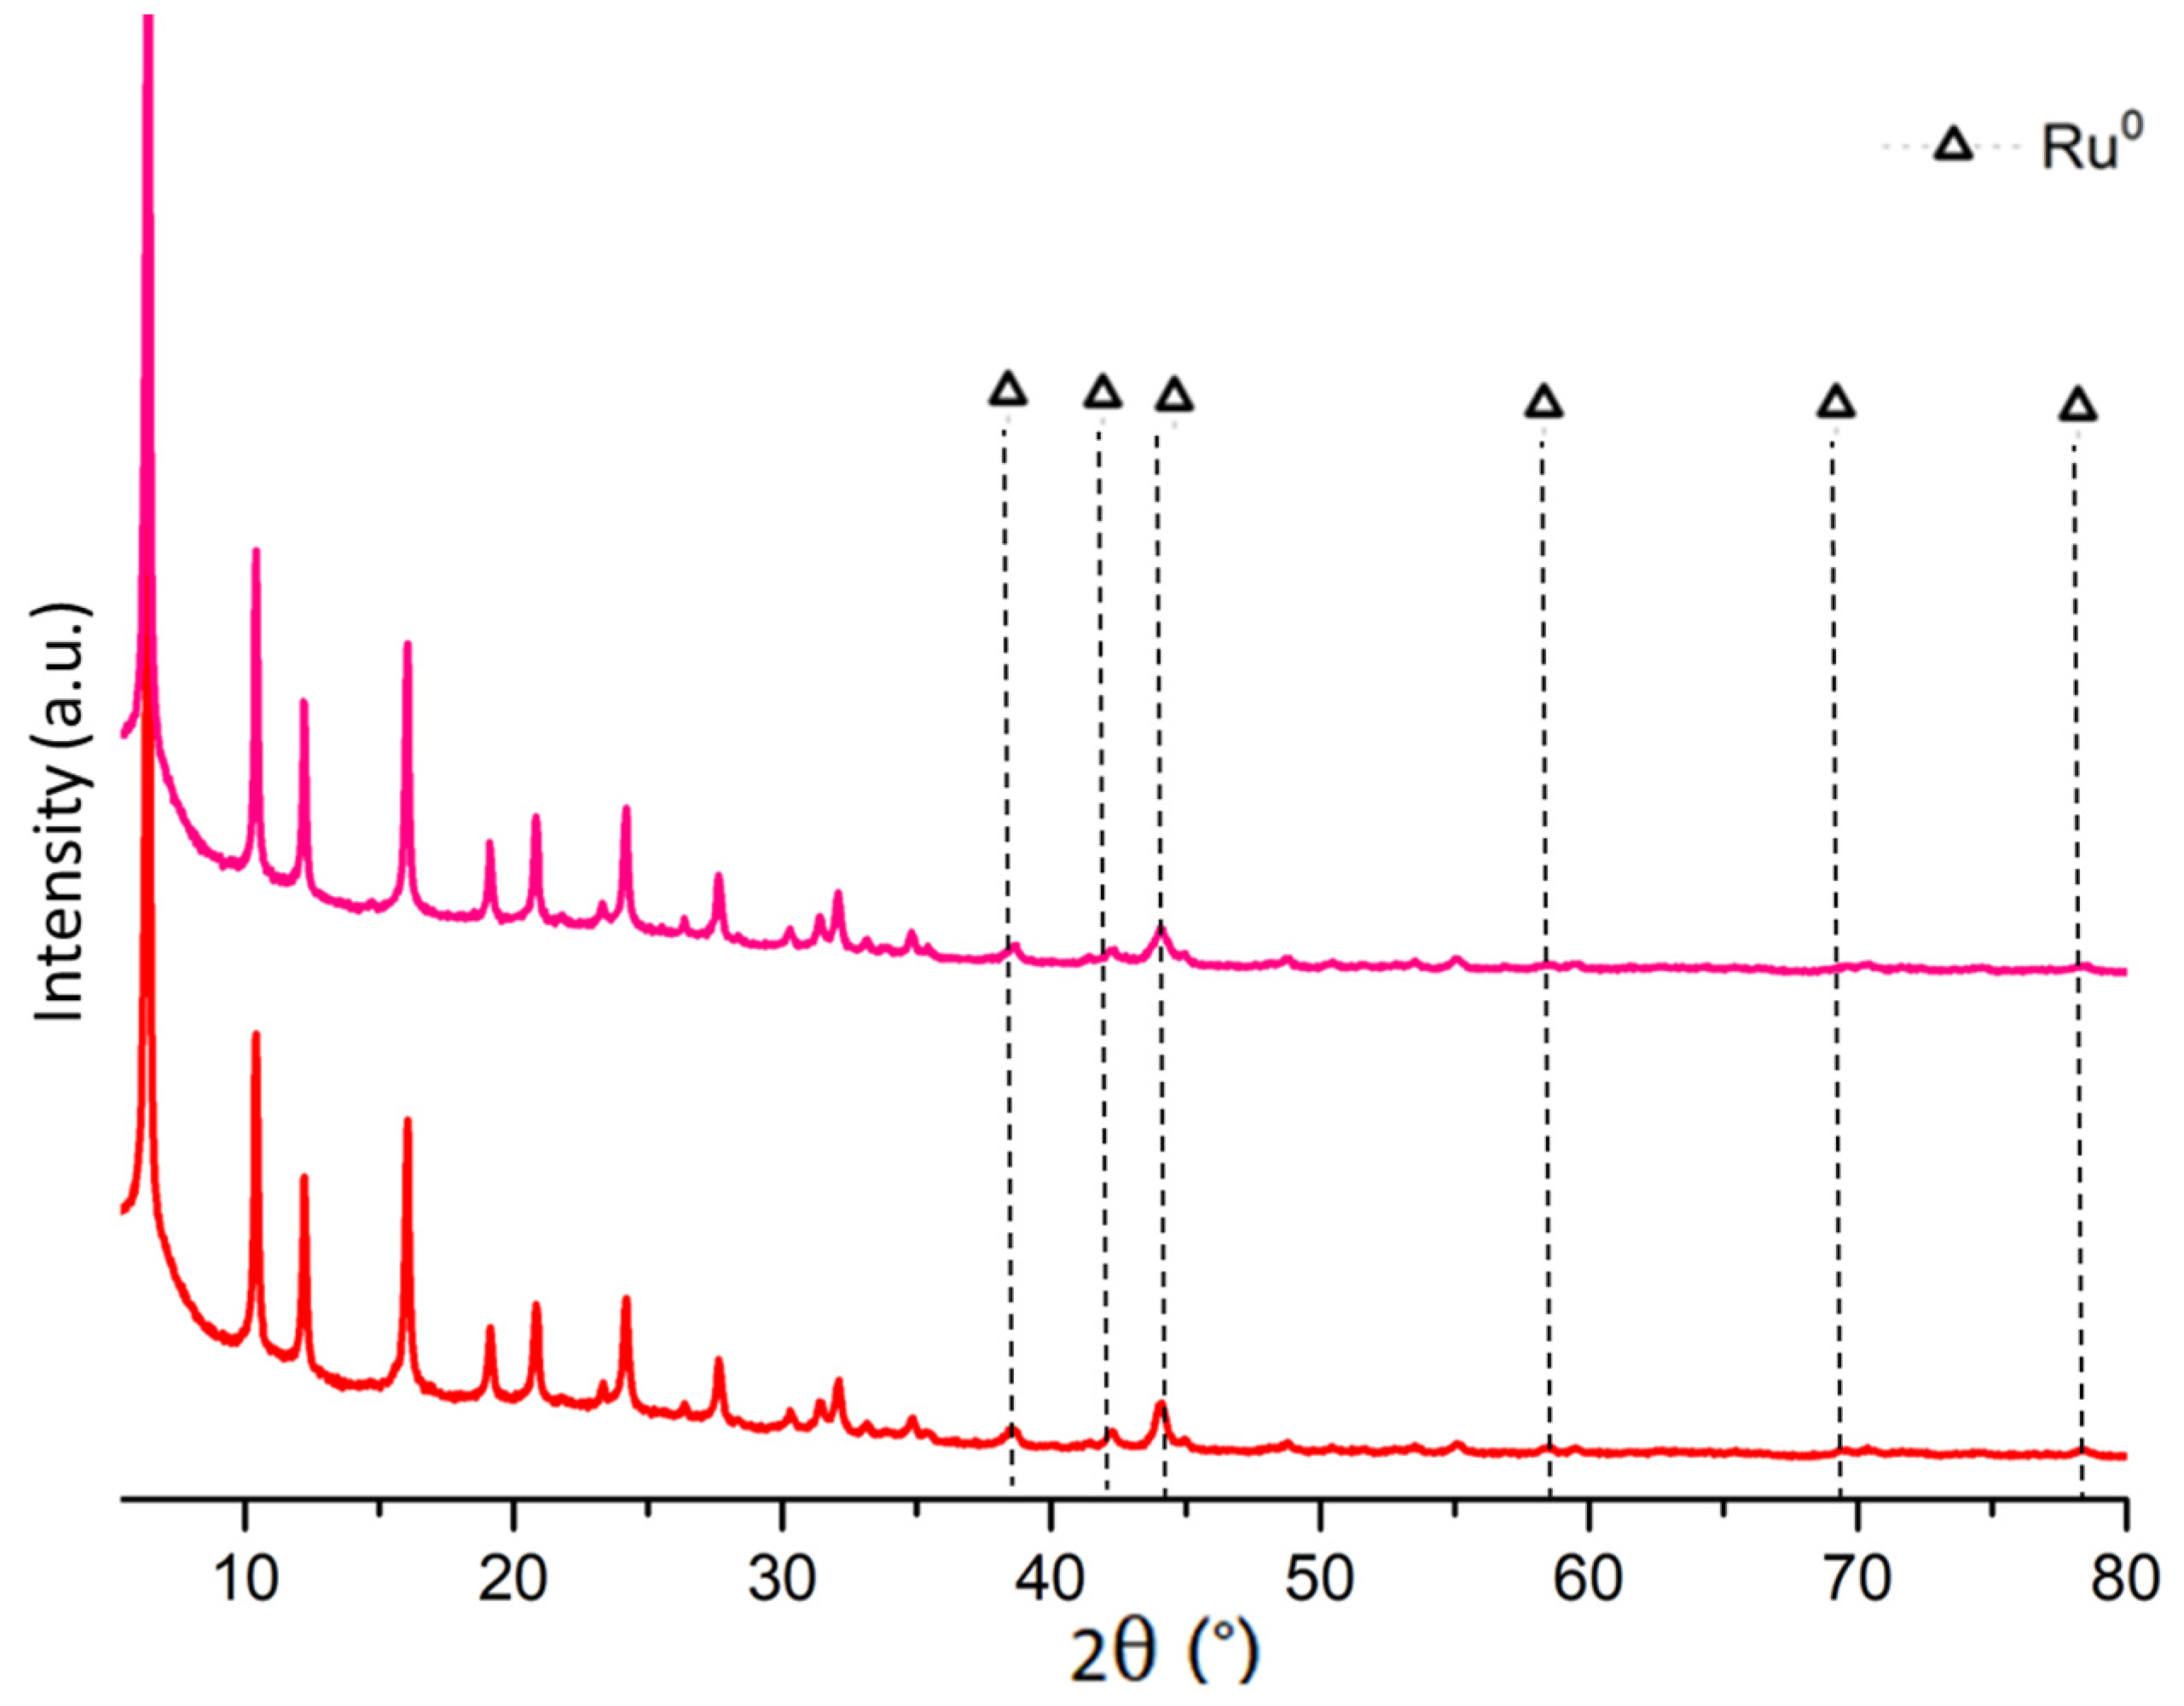
2.1. Fresh and Reduced Catalyst Characterization

After calcination, the CsUSY support and 3Ru/CsUSY catalyst were analyzed by thermogravimetric analysis (TGA) to investigate their interactions with water by calculating the corresponding h indexes [31], resulting in values of 0.94 and 0.96, respectively. Results suggested that the impregnation of Ru over the zeolite slightly increased the hydrophobicity character of the material. The h index of 0.96, very close to 1, obtained for 3Ru/CsUSY indicates that the water molecules resulting from carbon dioxide methanation reaction will be easily removed from the catalyst’s surface, reducing the inhibitory role of these species in the reaction. Indeed, water plays an inhibitory role for the reaction in two ways: by poisoning the catalyst, occupying active sites in competition with the reactant molecules; and by acting on the reaction equilibrium. The Sabatier reaction is reversible, and thus, water being a product, its accumulation can lead to a displacement of the reaction towards the reactants.
XRD patterns were collected to characterize the structural properties of the samples and identify the nature of the incorporated Ru species. The diffractograms collected for CsUSY and for 3Ru/CsUSY catalyst after calcination and after reduction are shown in Figure 1. By comparing the XRD pattern of the support with those of the 3Ru/CsUSY catalyst, the presence of the characteristic peaks of the faujasite (FAU) structure of the zeolite (5–35° [32]) in all cases indicates that the crystallinity of the zeolite was not compromised by the catalyst synthesis and reduction processes. After calcination, peaks ascribed to Ru oxide (RuO2) phases could be observed at 2θ = 28.1°, 35.0° and 54.4° [33,34,35]. However, due to their low intensity and the overlapping with FAU characteristic peaks, it was not possible to use the Scherrer equation to determine the average RuO2 crystallite size. After reduction, peaks ascribed to Ru0 phases (38.4, 42.2, 44.0, 58.4, 69.5, 78.4 [33,34,35]) were identified in the diffractograms, whereas no peaks ascribed to RuO2 were visible. This suggests that RuO2 species were fully reduced to Ru0 during the pre-reduction step. After reduction, it was possible to estimate an average Ru0 crystallite size of 16 nm using the Scherrer equation.
The reducibility of Ru species was investigated via H2-TPR, being the reduction profile of 3Ru/CsUSY catalyst shown in Figure 2. A main reduction process, assigned to the bulk RuO2 species reduction [36], could be identified at 165 °C. Its sharpness could be ascribed, based on the literature [11], to an homogenous distribution of RuO2 nanoparticles over the CsUSY support.
The textural properties of the samples under study (Table 1) were assessed by N2 physisorption carried out after calcination. Based on the results, it could be concluded that the impregnation of 3 wt.% Ru over CsUSY led to a remarkable decrease in all the textural properties of the zeolite. This effect could be attributed to the location of the RuO2 nanoparticles inside the zeolite pores or at their entrance, partially blocking the passage of nitrogen into the pores themselves. Considering the significant decrease of the external surface area, it could be concluded that most of the RuO2 species were deposited on the external surface of the CsUSY zeolite.
To better understand the interaction between the samples and CO2, TPD profiles were collected for CsUSY and 3Ru/CsUSY (Figure 3). As observed, the zeolite support showed desorption peaks at 200–350 °C and 500-750 °C, likely belonging to CO2 adsorbed on Cs+ sites. The CO2 desorption peak centered at 275 °C could be associated with the decomposition of bidentate carbonates from medium-strength basic sites [37], whereas the peak centered at 425 °C could be attributed to the decomposition of monodentate carbonates from strong basic sites [38]. The first peak is particularly relevant since medium-strength adsorption sites were reported as especially favorable for the CO2 methanation reaction [11]. After Ru impregnation, more bands appear in the desorption profile, the more prevalent being centered at around 425 °C. Indeed, this indicates that a greater number of basic sites with different strengths are formed on the surface of the samples in the presence of Ru species. The appearance of new basic sites on the surface and, thus, the general increase in surface basicity, could be explained in terms of electronegativity. Indeed, the electronegativity values of Al, Ru and O (Al and O being part of the zeolite framework), i.e., of the elements participating in CO2 adsorption, are 1.6, 2.3 and 3.5, respectively. These values indicate that surface O2− and OH- groups linked to Al must contain higher negative charge density (lower basicity) than those attached to Ru. Thus, differences in electronegativity show that a higher negative charge density transfer to surface O2− takes place for Al rather than Ru. Therefore, considering that CO2 is an acid gas with a high negative charge density, the sites with the highest CO2 adsorption capacity (and the lowest negative charge density) correspond to O2− (and OH- if applicable) linked to Ru, followed by those bound to Al [6].

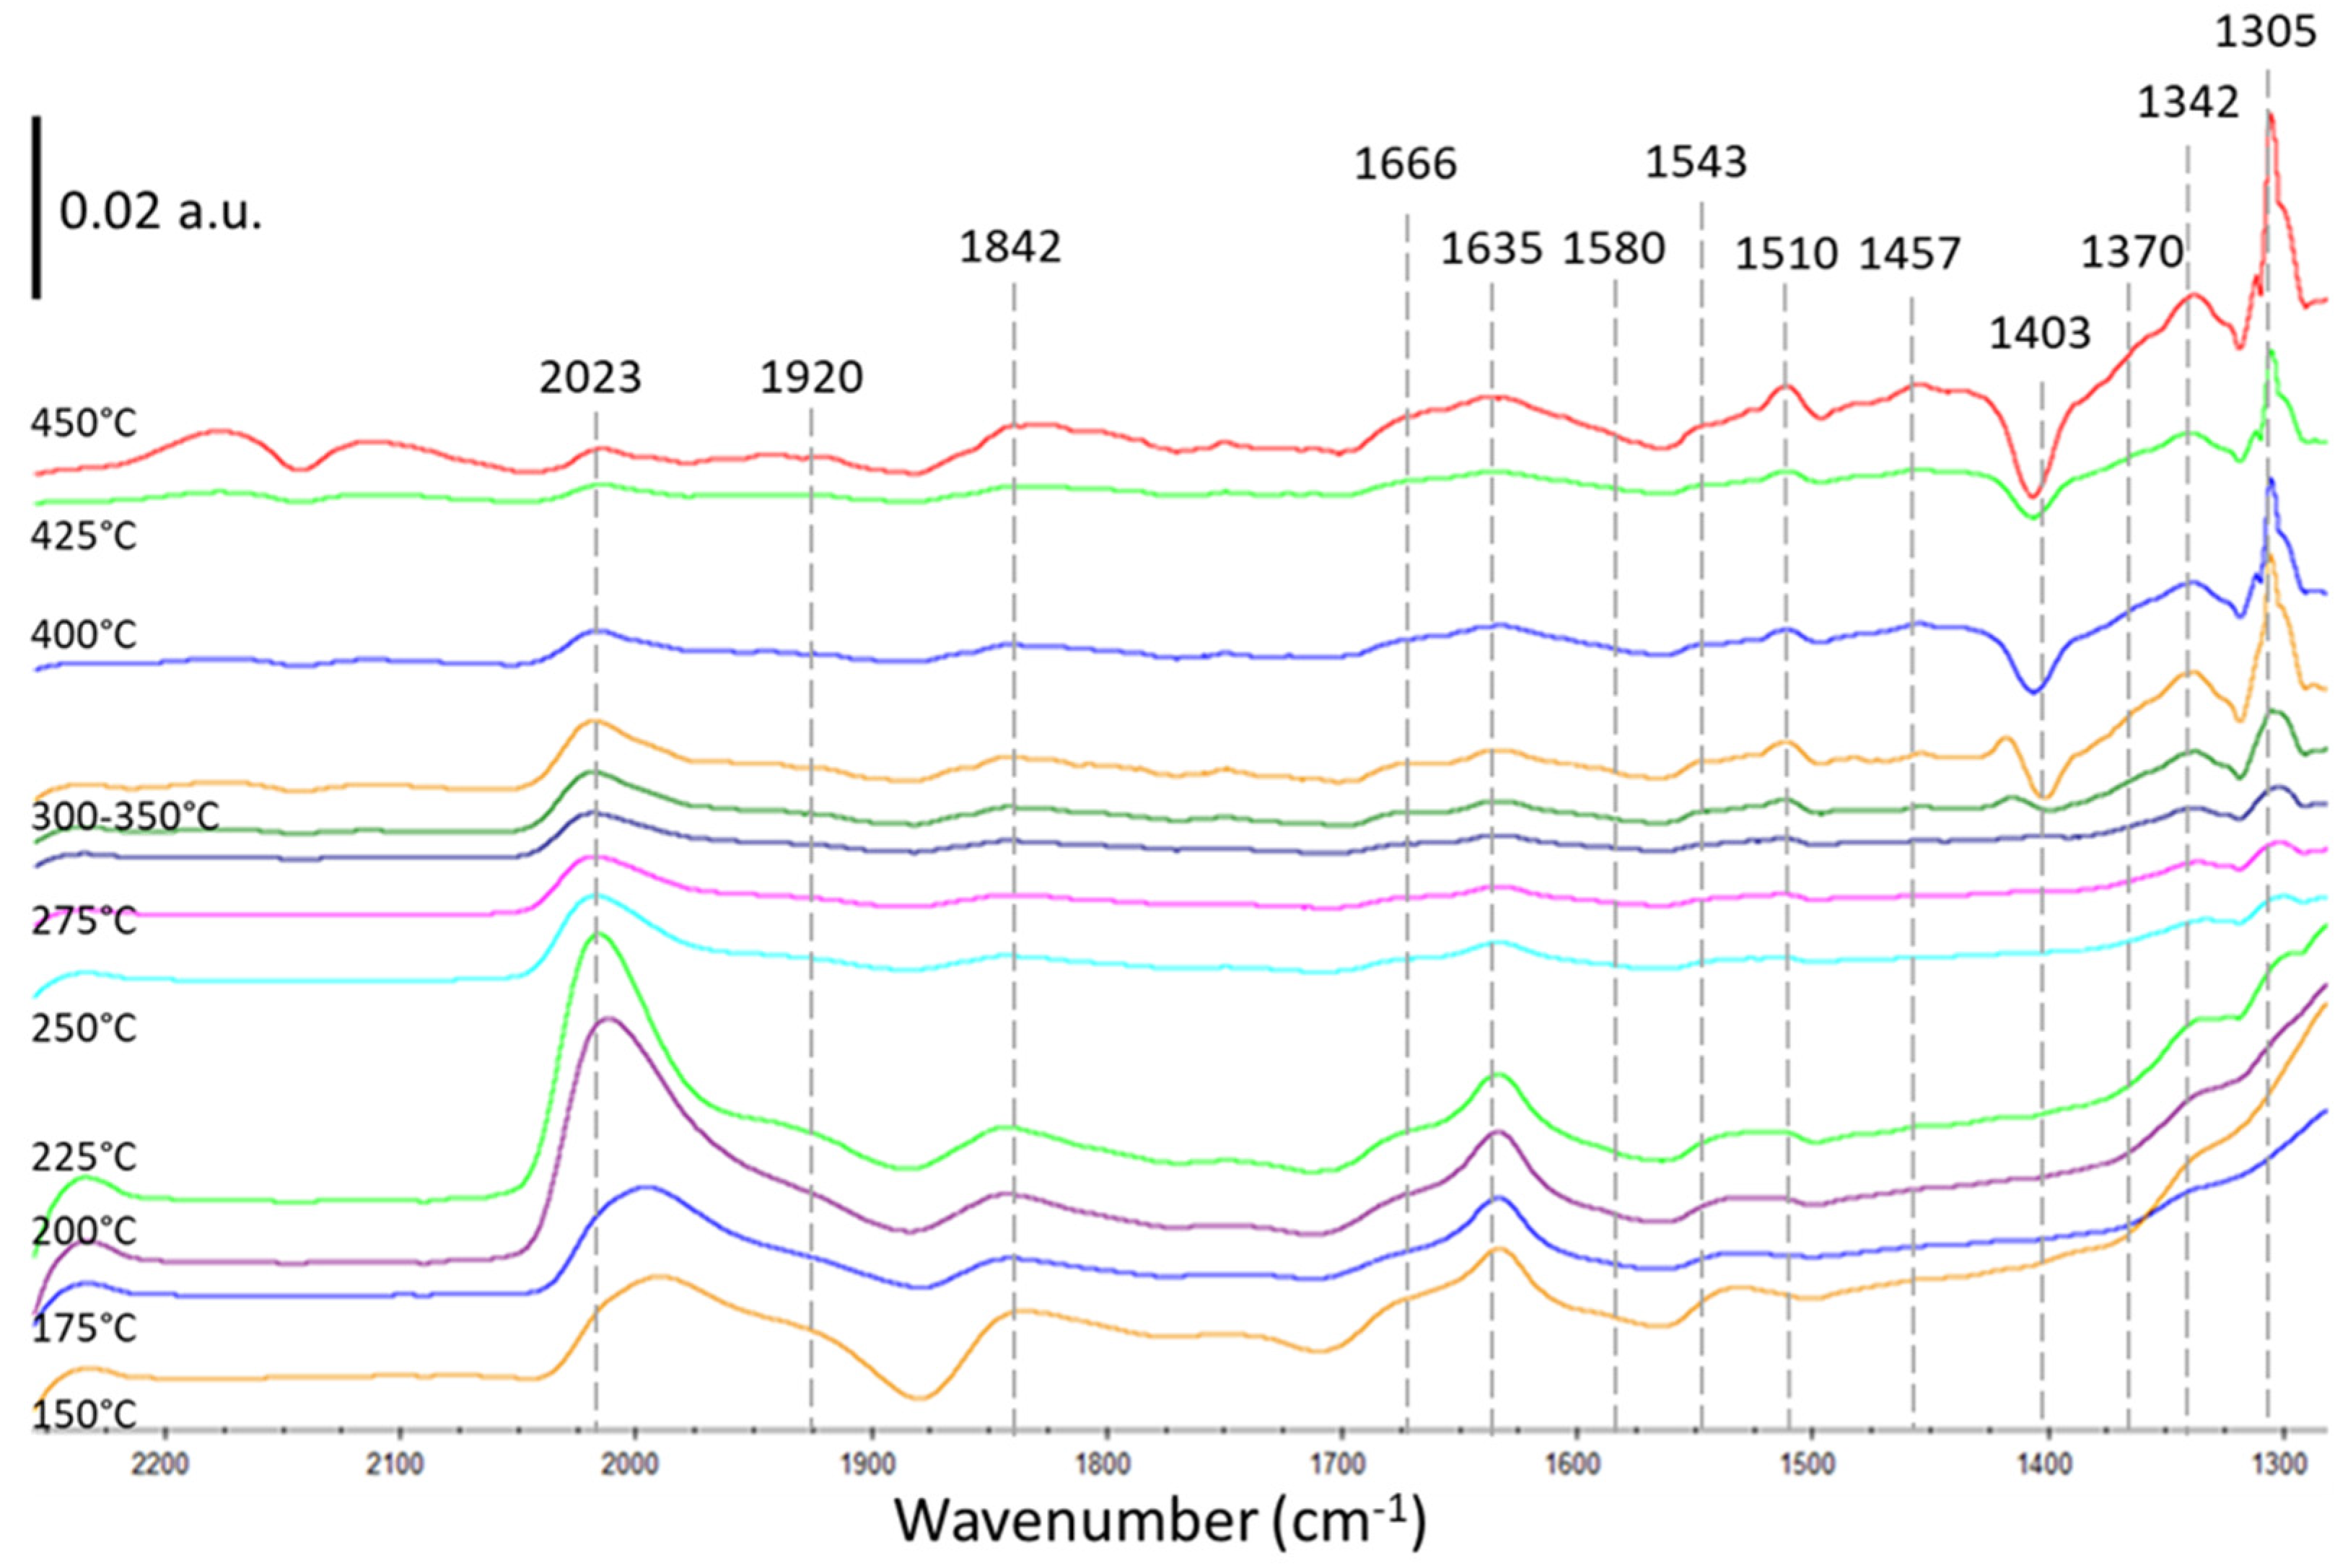
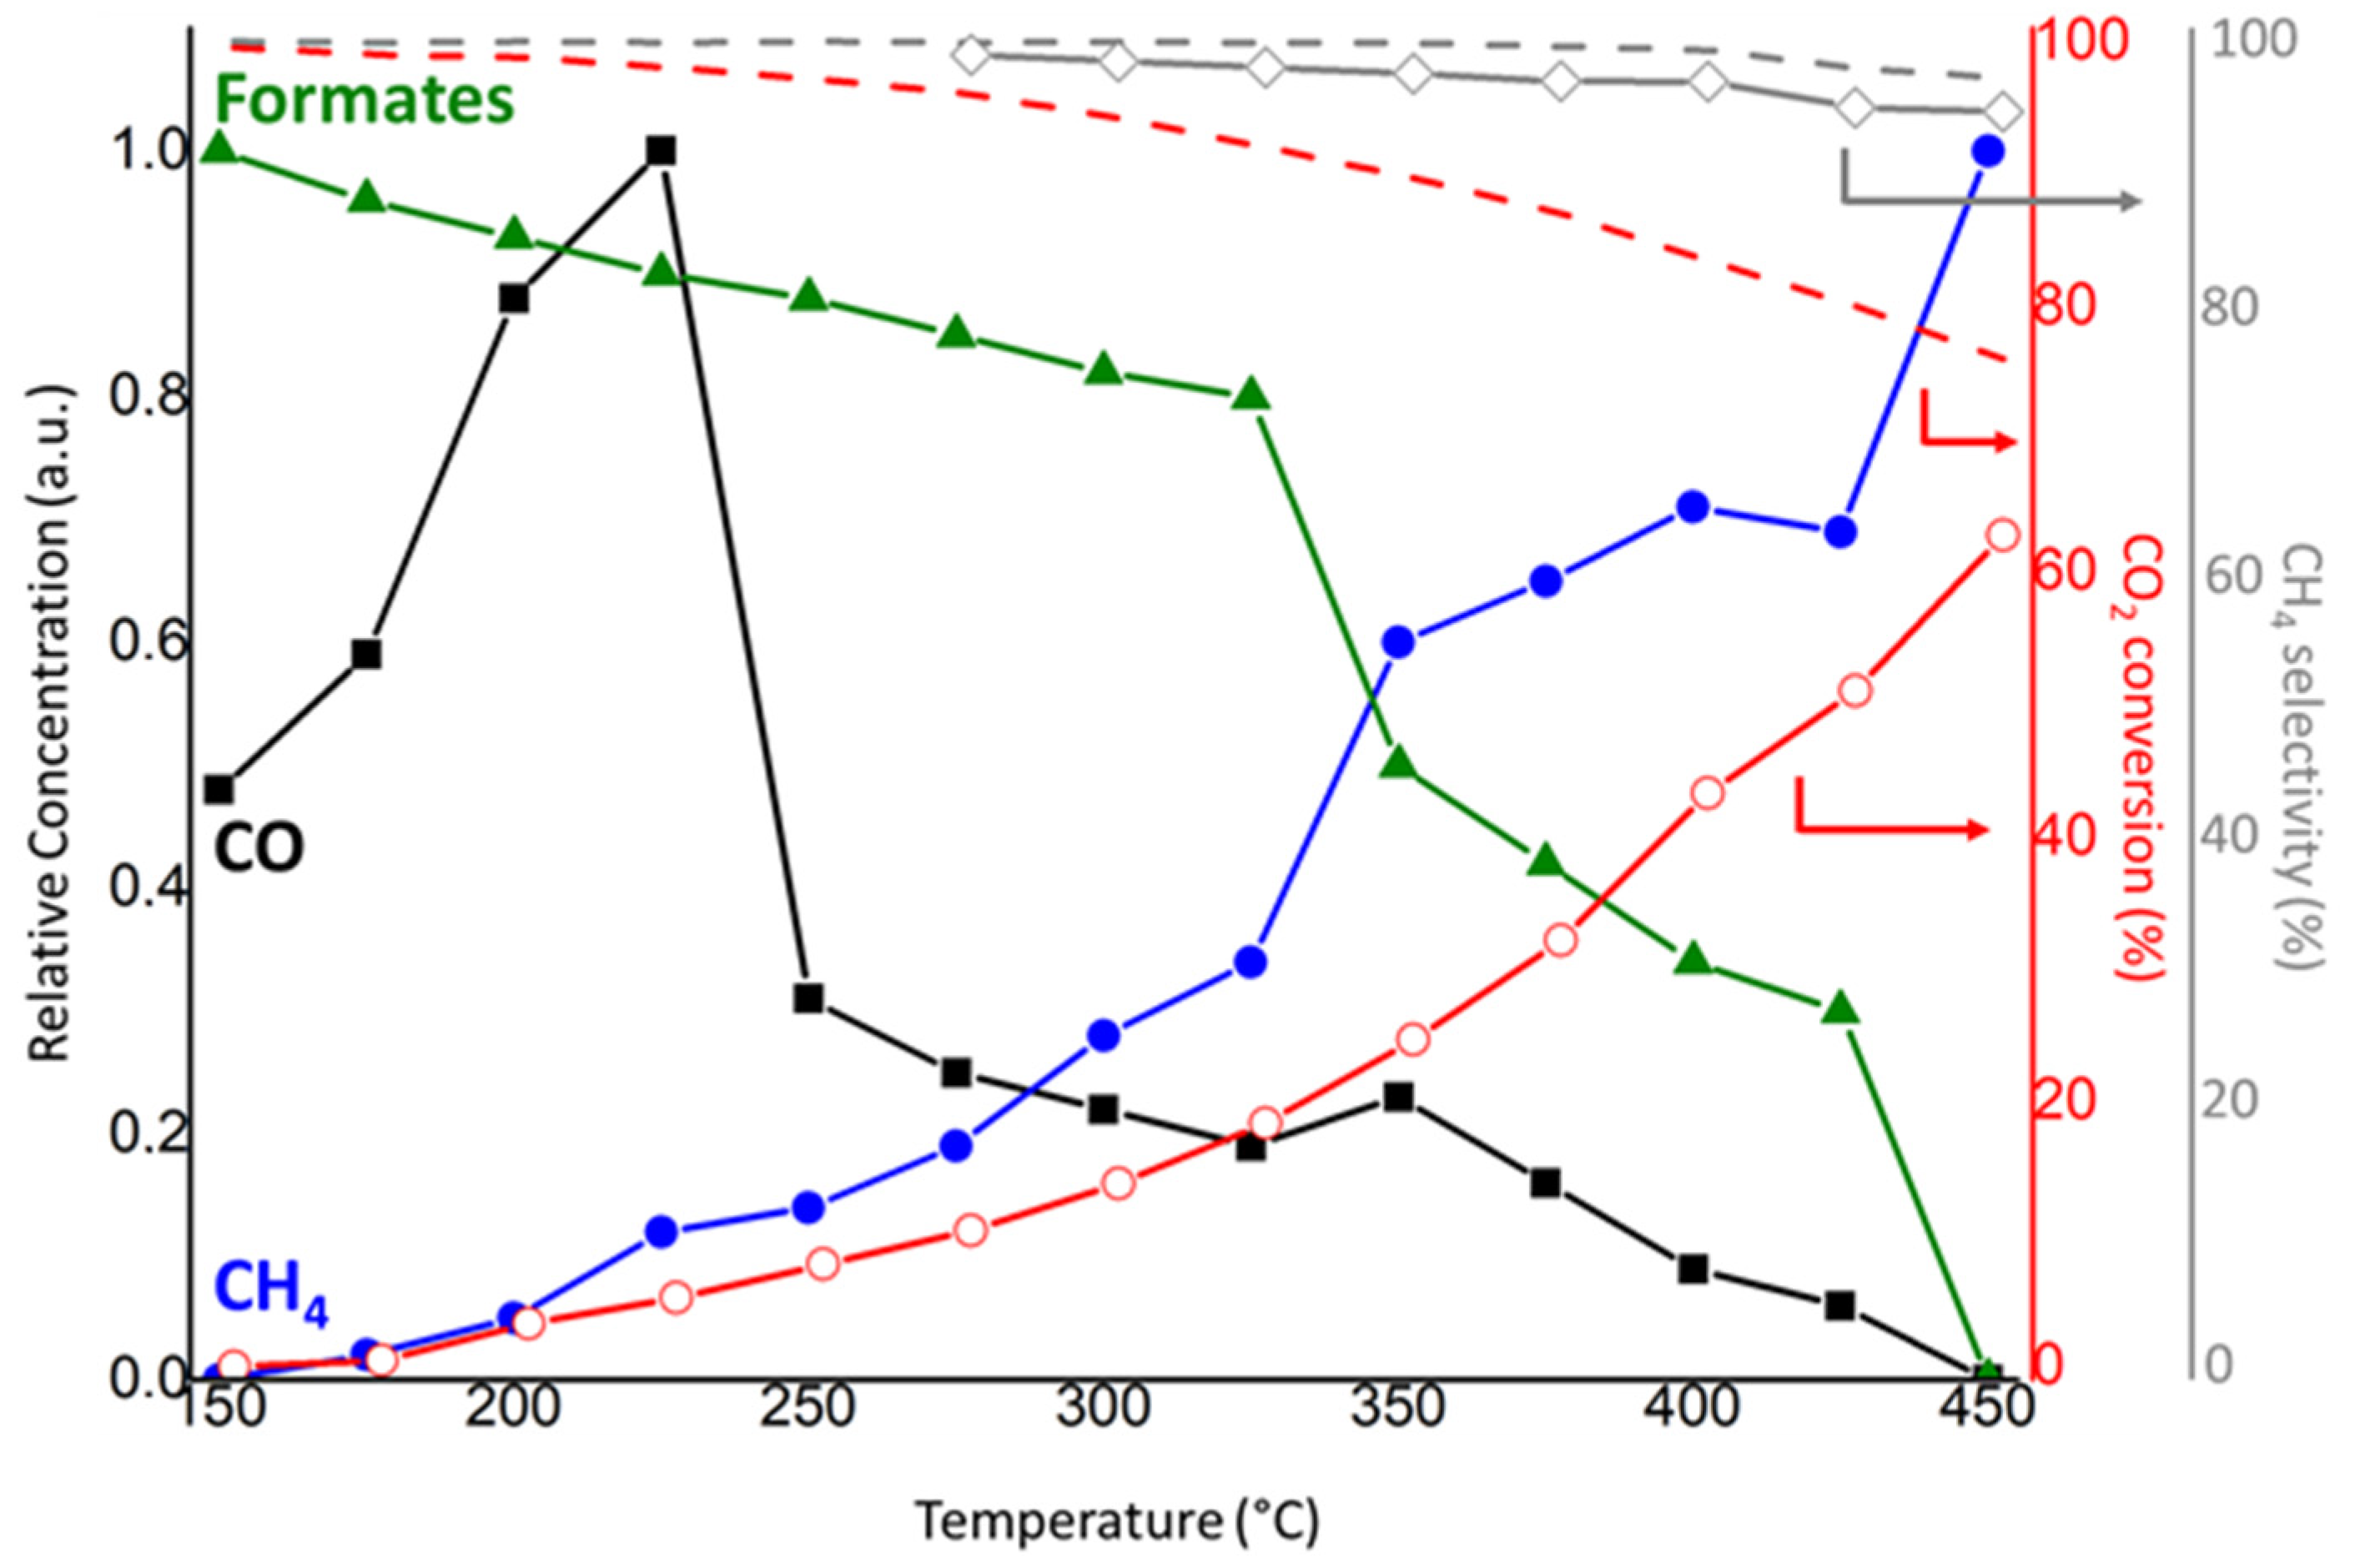
2.2. In-Situ Operando FTIR

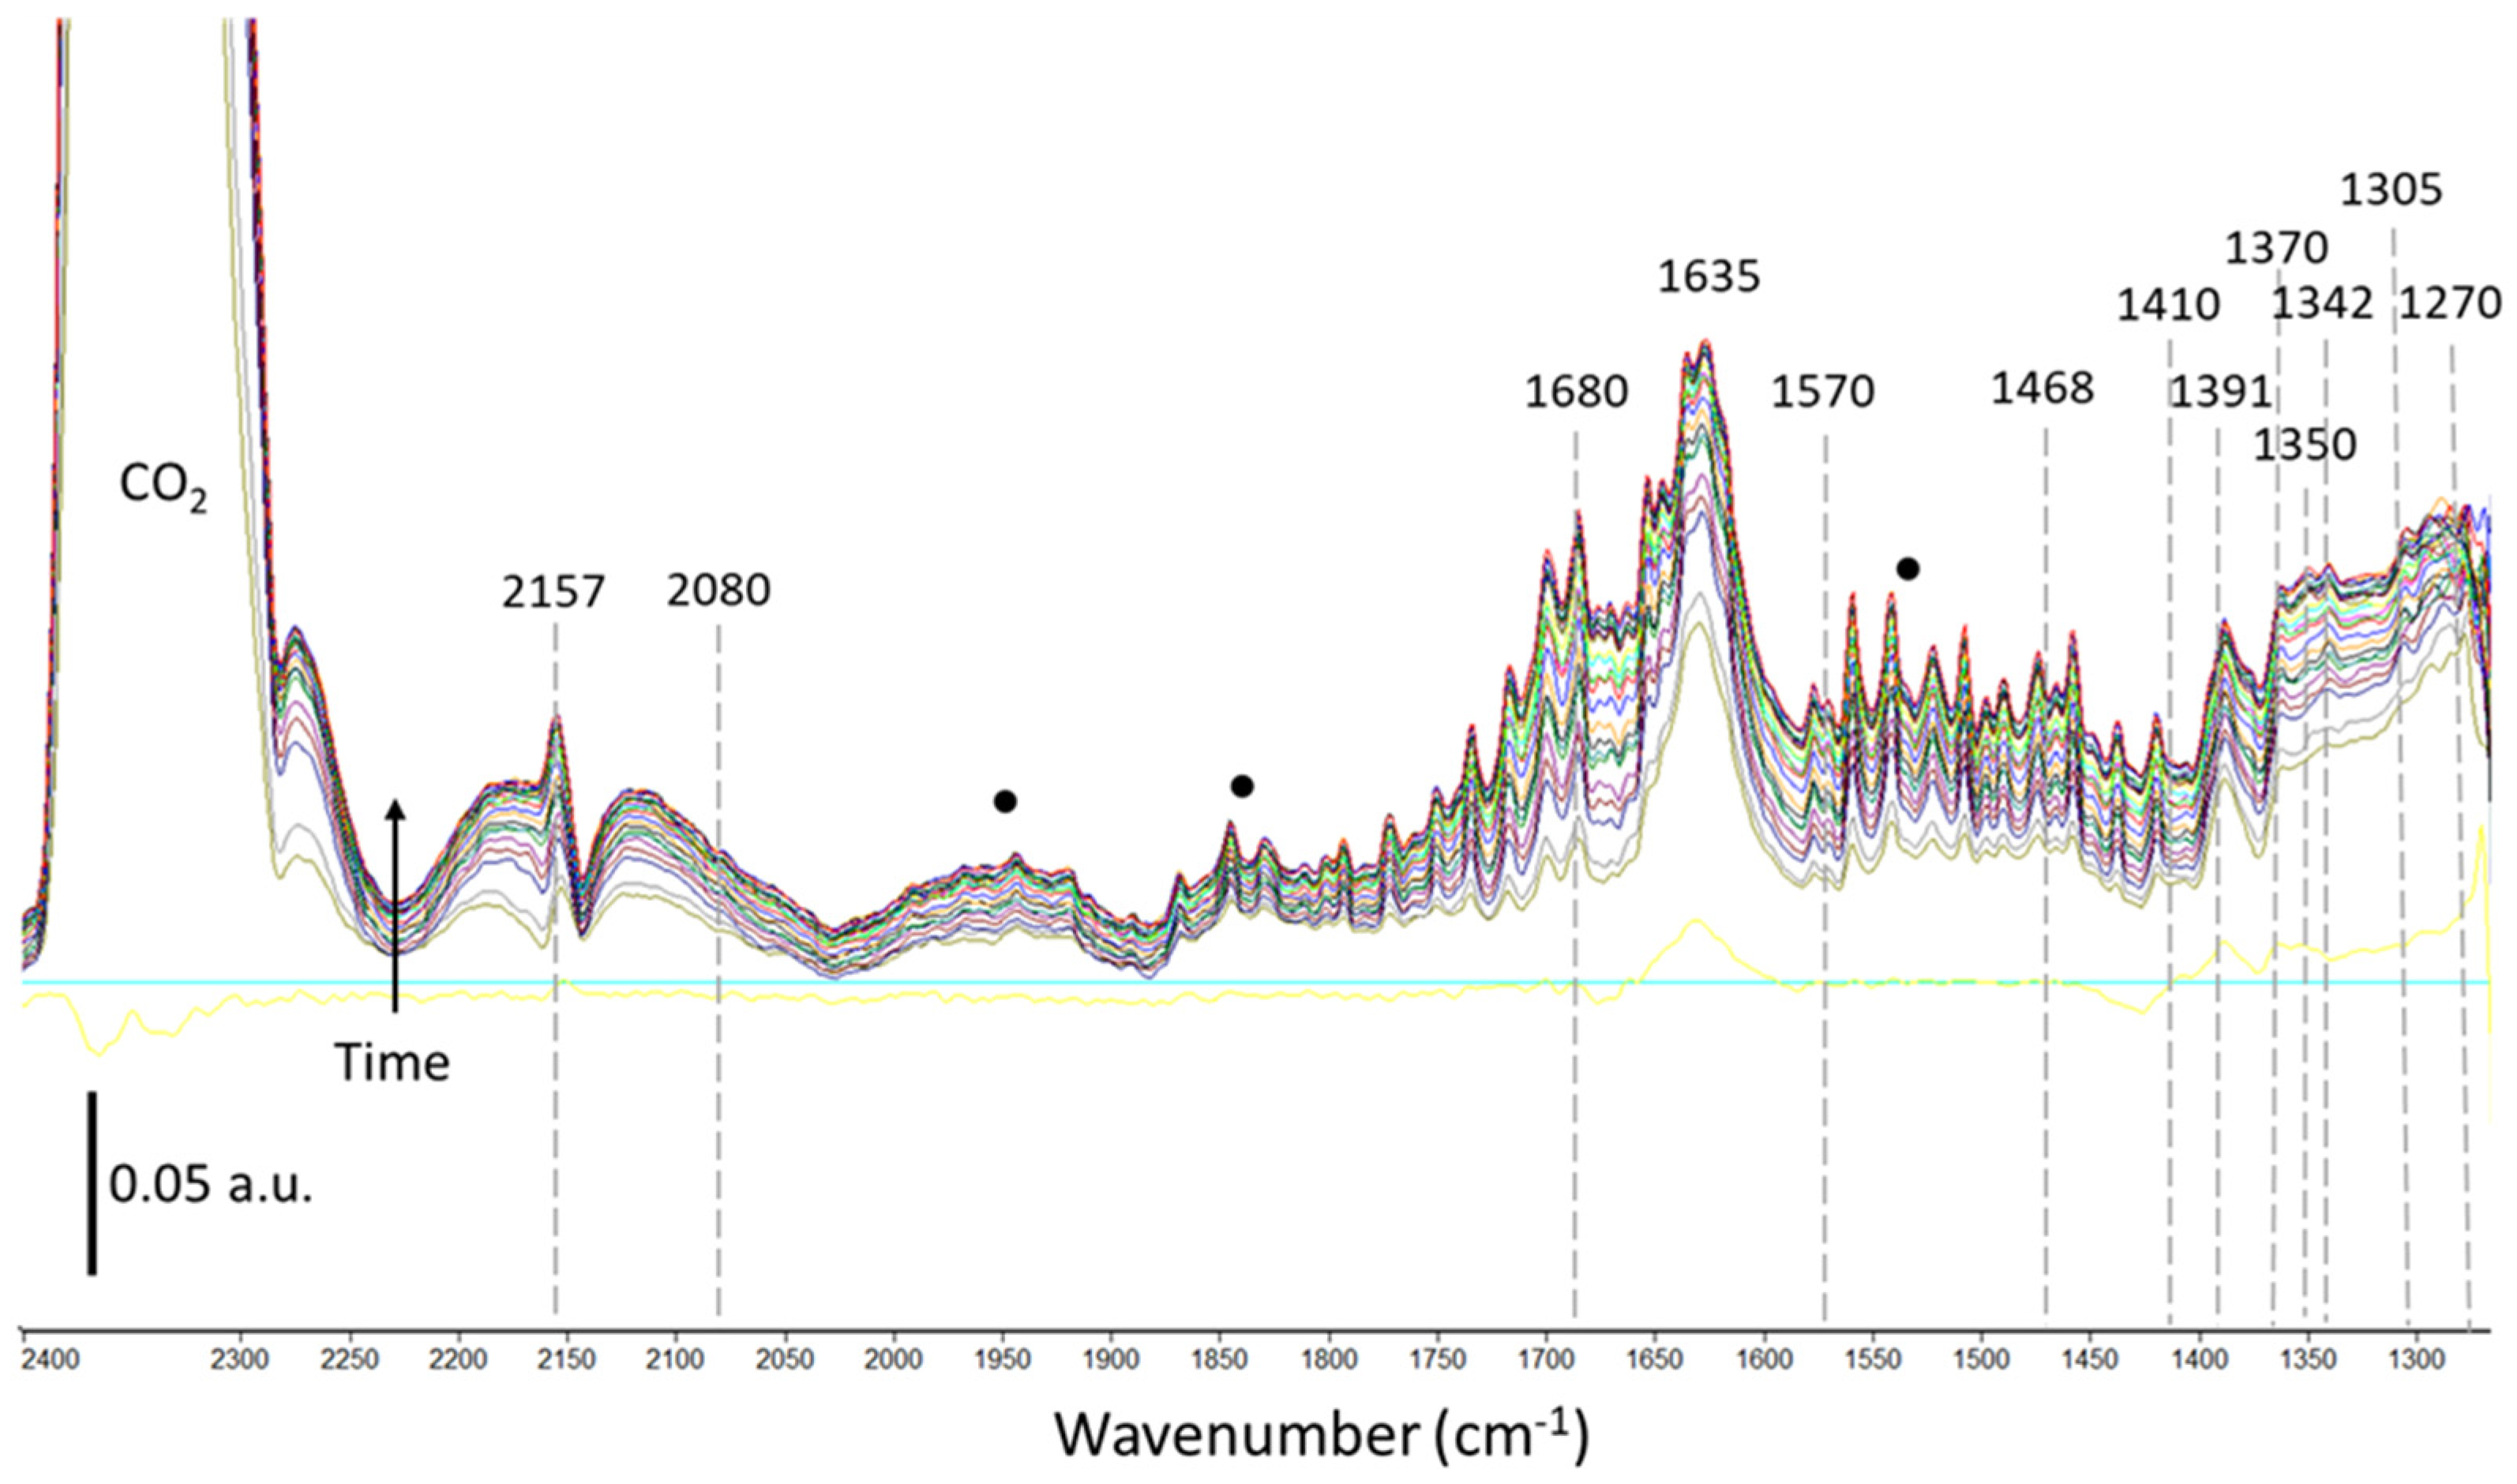
2.2.1. Thermal Catalysis

In order to investigate the thermocatalytic CO2 methanation reaction mechanism, IR operando measurements were carried out under CO2/H2 mixtures in 1/4 stoichiometric ratio from 150 to 450 °C. Operando IR spectra obtained in the course of CO2 methanation over 3Ru/CsUSY catalyst in the 2300–1300 cm−1 region are presented in Figure 4.
Typical adsorbed species can be observed at 150 °C (Figure 4) on 3Ru/CsUSY such as adsorbed water (O-H bending, 1635 cm−1) and carbonates/CO2 linear complexes. Indeed, the bands at 1370, 1457 and 1510 cm−1 could be assigned to the symmetric and asymmetric stretching of monodentate carbonates, while the bands at 1342 and 1543 cm−1 are ascribed to the same vibrational moves of bidentate carbonates. Another band is observed at 1666 cm−1, arising from the C=O stretching of bidentate bridged carbonates or aldehydic groups. The shoulder at ~1385 cm−1 could be assigned to linear OCO-Mx+ complexes, which are normally not IR active but can be observed when CO2 is adsorbed on zeolites because of interactions with the cations in the zeolite framework [21]. Other noteworthy bands are those that could be assigned to carbonyls, nominally at 2023 cm−1 (monocarbonyls adsorbed on Ru0) and 1920 and 1842 cm−1 (bridged carbonyls). A small band at 2062 cm−1 could also be attributed to dicarbonyls adsorbed on Ru0 nanoparticles. As the temperature increases, the methanation reaction starts to occur at 225 °C, as highlighted by the appearance of the band at 1305 cm−1 (C-H degenerate bending, gas-phase methane [23,39]). At the same time, signals assigned to carbonates seem to gradually increase over time, while carbonyls increase at first and then start to decrease and distribute more towards monocarbonyls once the temperature reaches 225 °C. Similarly, a band at 1403 cm−1 that can be ascribed to monodentate formates (as well as the band at 1580 cm−1) decreases until a negative peak is formed. Lastly, the appearance of gas-phase CO from 350 °C can be observed thanks to the appearance of the bands in the 2200–2050 cm−1 range. To better follow the evolution of adsorbed and gas-phase species as a function of the temperature, Figure 5 shows the relative concentration (left axis) of adsorbed formates and CO and of gas-phase methane, as well as the CO2 conversion percentage (right axis), quantified as explained below.
First of all, until 225 °C, the adsorption of CO over the catalyst is favored, probably stemming from the decomposition of carbonate and formate species. At 250 °C, the relative concentration of adsorbed CO drops decisively, hinting at the beginning of a more consistent conversion into methane. Then, until 325 °C the relative concentration of formate and CO groups slightly decreases, whereas the relative concentration of methane slightly increases. After that, from 350 °C, methane formation is more pronounced, and a steeper decrease is observed for formate and CO species. Increasing the temperature, the CO2 conversion rate constantly increases and the selectivity towards methane approaches the thermodynamic limit for the reaction as soon as methanation starts to occur, at 275 °C.

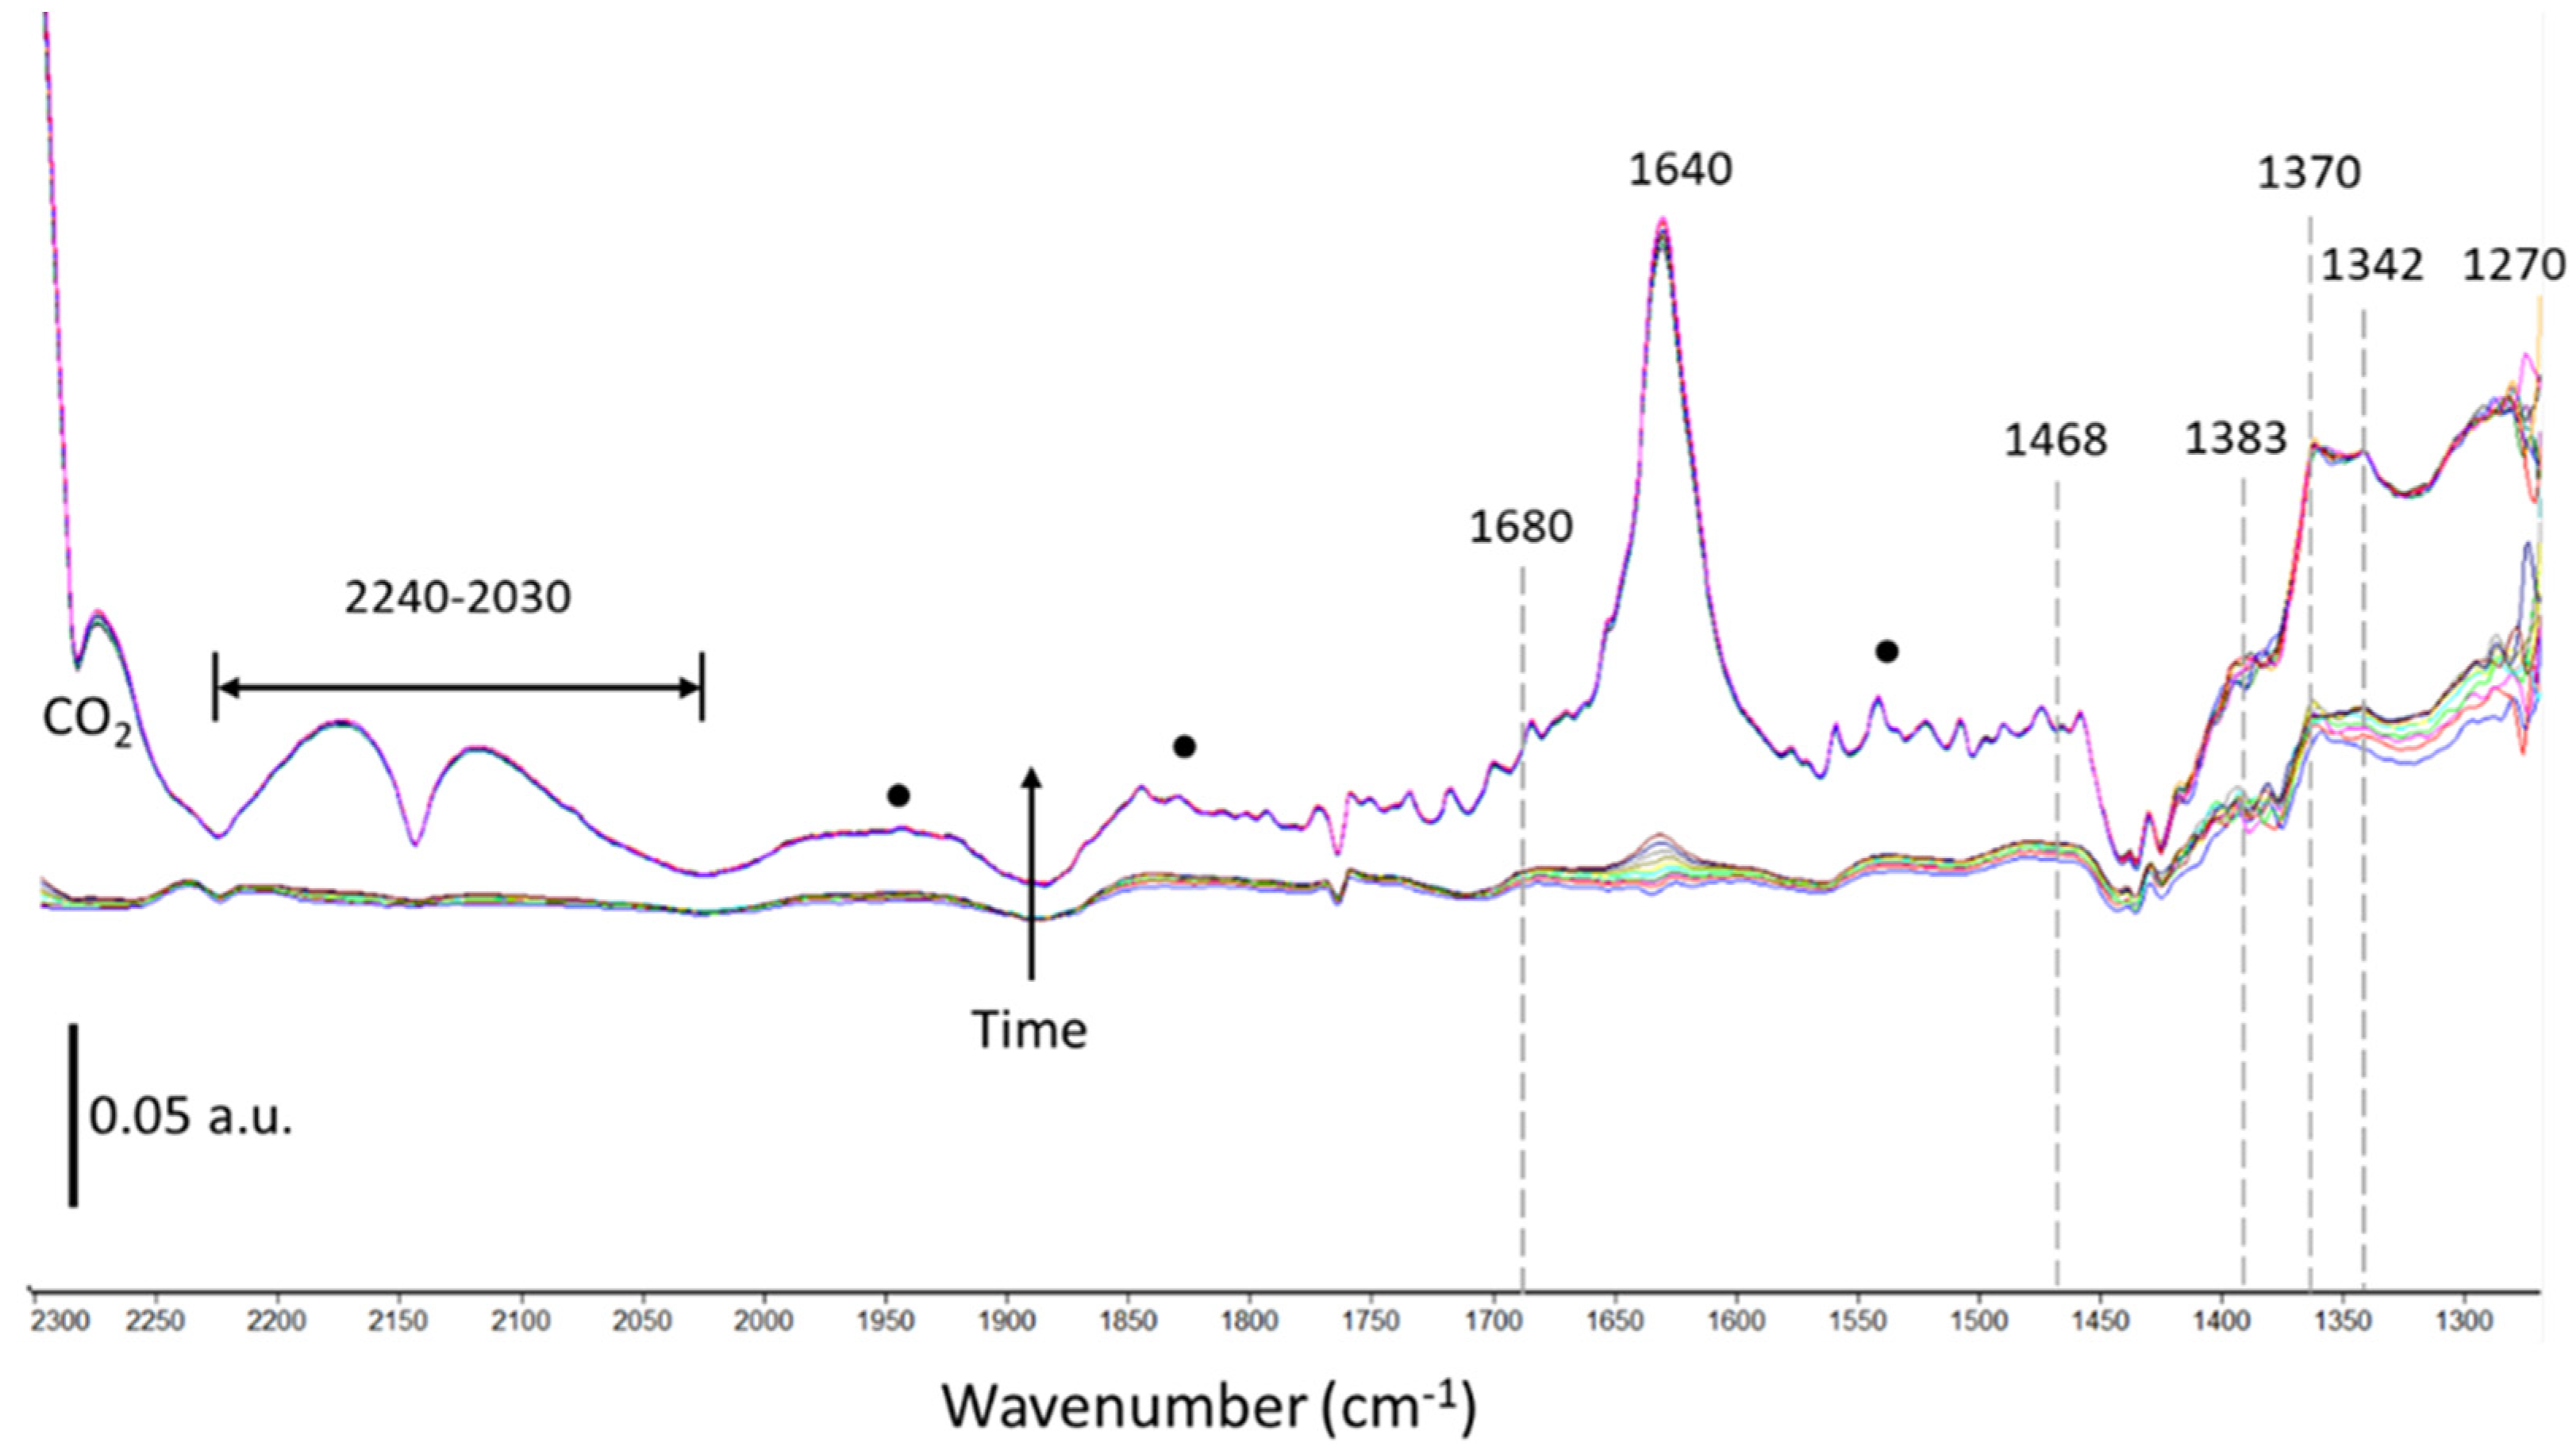
2.2.2. Plasma-Catalysis

Figure 6 represents the FTIR subtraction spectra collected over the complete range of explored wavelengths. A spectrum of the 3Ru/CsUSY catalyst before reaction was used as a reference to subtract from all the other spectra, achieving a mostly linear baseline for the spectra and highlighting the effects of the reaction on the sample itself. First, it is important to point out that was not possible to extract information from the region below 1250 cm−1 because of the intense bands attributed to the zeolite vibration bands. The only discernible band, which increased over time upon plasma ignition, is located at 900 cm−1 and could be ascribed to adsorption-desorption processes of CO2 over the KBr window exposed to plasma in the setup, coupled with heating caused by the plasma itself [40]. When the plasma was ignited and the reactant gases (CO2 and H2 in 1:4 stoichiometric ratio) were released in the cell, all the observed signals increased over time until a steady-state was reached. First, gas phase CO2 filled the cell, as indicated by the bands at 2361 and 2349 cm−1 caused by the asymmetric stretch ν3 of the CO2 molecule [41]. Moreover, the presence of gas phase CO2 is evidenced by the combination bands at 3727 and 3703 cm−1 (ν1 + ν3) and those at 3627 and 3603 cm−1 (2 ν2 + ν3). It is possible to note the appearance of a band in the 3570-3000 cm−1 region, ascribed to the O-H stretching move of water being produced in the reaction, which also develops the band at 3017 cm−1 ascribed to C-H stretching of methane in gas phase.
In Figure 7, a magnification of the FTIR difference spectra seen in Figure 6 in the 2400–1250 cm−1 region is shown.
Upon plasma ignition, all signals increased over time. Bands corresponding to gas phase CO (2165 and 2120 cm−1, ν1) start to appear (Figure 7), as a result of CO2 dissociation happening in the plasma and on the surface of the catalyst as a step of the Sabatier reaction [23]. In the same region, the 2080 cm−1 band appears and is assigned to CO stretching of linear carbonyls adsorbed into Ru0. The formation of more stable dicarbonyl species on Ru0 is indicated by the band appearing at 2157 cm−1, linked to their CO stretching mode. This high-frequency band for adsorbed carbonyls could arise from their excitation by the plasma [23] or from their adsorption into paramagnetic Ru atoms, likely originated from electric field-induced effect [42,43]. The most prominent band in the spectra is the one at 1635 cm−1, arising from the H-O-H bending mode of water adsorbed into the CsUSY support. Ancillary to this band are all equally spaced, sharp peaks that are observed in the 1850–1400 cm−1 region, originated from vapor phase water. The peak at 1305 cm−1 is assigned to the C-H bending mode of methane molecules in gas phase, indicating that the CO2 methanation reaction is indeed taking place. The CO2 adsorption processes as different carbonate species are visible through the bands that appear in the 1700–1250 cm−1 region. Monodentate carbonates are formed on the support material, on Cs+ cations, as can be seen from the bands at 1468 cm−1 and 1370 cm−1, assigned to the asymmetric and symmetric (CO3) stretching of monodentate carbonates, respectively. Bidentate carbonates are similarly adsorbed on the support, and originate the bands at 1410, 1342 and 1270 cm−1 through their asymmetric, symmetric and degenerate stretching, respectively. Moreover, bidentate carbonates can be observed through the band at 1680 cm−1, which could also be attributed to the CO stretching of aldehydic groups adsorbed on ruthenium. Interestingly from a mechanistic point of view, is the presence of monodentate formate groups adsorbed on Ru nanoparticles, that can be observed through the bands at 1570, 1391 and 1350 cm−1, attributed to νa(OCO), νs(OCO) and δ(CH), respectively [41]. Finally, bands at ~1950, ~1850 and ~1545 cm−1 (indicated with black dots in Figure 7) are attributed to zeolite USY bands. In fact, these IR absorption bands represent the contraction and expansion of the zeolite USY framework under plasma irradiation because of the adsorption and desorption processes inside the zeolite cavities [23].
The evolution of the intensity of bands linked to relevant species in the FTIR spectra over time is shown in Figure 8. It is possible to see, as mentioned above, that while the plasma is on, all signals increase over time. Interestingly, and considering the high hydrophobicity of the 3Ru/CsUSY catalyst, when the plasma is turned off a huge uptake in water adsorbed on its surface is observed. This is possibly due to the fact that, while the plasma is on, energy is consistently being supplied to the cell. Thus, water is being formed as a product of the Sabatier reaction (water absorbed on the catalyst) and then is desorbed from the surface of the catalyst (vapor water peaks). When the energy influx is interrupted, it is likely that the formed water in vapor phase condenses on the catalyst. When the system is put under vacuum, water desorbs very rapidly thanks to the highly hydrophobic character of the catalyst. The concentration of formate species adsorbed on the surface of the catalyst increase under plasma but then start to decrease as soon as plasma is extinguished, which likely identifies formates as an important reaction intermediate in the formation of carbonyls and of methane. On the other hand, carbonate species generally increase until a steady state is reached when the system is not irradiated by plasma any more. Based on this observation, carbonate species could be recognized as either spectator species that accumulate on the catalyst’s surface over time or as intermediates in the formation of formates. Indeed, as soon as energy is not being supplied to the system any more, the concentration of carbonate species could increase because they are no longer converted into formates.
FTIR subtraction spectra were collected in the same conditions also for the plasma-assisted CO2 reaction carried out on the CsUSY support to discriminate the adsorption sites of different species (Figure 9).
First, it is possible to notice that CO (bands from 2240 to 2030 cm−1) and water (peak at 1640 cm−1 and vapor phase peaks) are being formed even without the presence of the active metal on the support, suggesting that the reverse water-gas shift reaction (Equation (2)) is taking place directly in the plasma.
CO2 + H2 ⇄ CO + H2O
It is again possible to observe bands assigned to monodentate (1468, 1383 and 1370 cm−1) and bidentate (1342 and 1270 cm−1) carbonates, confirming that these are being adsorbed onto Cs+ ions on the surface of the catalyst. The band at 1680 cm−1, assigned to bidentate bridged carbonates, is present but less intense than the one observed in the spectra collected over 3Ru/CsUSY, suggesting that a contribution to this band could indeed be ascribed to aldehydic groups adsorbed on ruthenium nanoparticles. Small peaks attributed to formates are still visible, an occurrence not reported in traditional thermal catalysis on the support material alone.

2.3. Spent Catalyst Characterization

After thermal and plasma catalytic experiments, 3Ru/CsUSY catalyst was characterized by XRD with the aim of identifying potential impacts in the structure and metal species nature. Patterns can be found in Figure 10, and suggest that the sample was not damaged by exposure to the DBD plasma as the typical FAU peaks [32] remained unaltered. Furthermore, metallic Ru was not re-oxidized as Ru0 phases were identified at 2θ values of 38.4, 42.2, 44.0, 58.4, 69.5 and 78.4 [33,34,35], without the appearance of any peaks ascribable to RuO2. Thus, the plasma reaction did not impact the structural stability of the sample.

3. Discussion

Based on the previously described results, it is possible to confirm for thermal CO2 methanation over 3Ru/CsUSY a reaction mechanism similar to the one reported by Westermann et al. [21] for CO2 hydrogenation over Ni/USY catalysts. The proposed mechanism involves the adsorption of CO2 onto the catalyst’s support as linear CO2 or carbonate species, which are then converted into formates on the metal nanoparticles. The formate groups are then progressively hydrogenated to aldehydes, carbonyls and finally to methane, producing water along the process. The good performance of the catalyst in thermal catalysis conditions (72% of CO2 conversion, >95% of CH4 selectivity) can be explained by a combination of the main properties of the catalyst: its hydrophobicity removes water from the reaction environment, preventing poisoning and moving the reaction equilibrium towards the products, while its basicity, and especially the presence of medium-strength basic sites on its surfaces, promotes the adsorption and subsequent reaction of CO2.
A mechanism for plasma-assisted CO2 methanation is proposed in accordance with the results of the FTIR measurements previously described (Figure 11).
Upon plasma ignition, immediate CO2 dissociation occurs, likely in the plasma alone. It is also possible that more complex carbonate-like radicals are formed in the plasma phase. The mechanism then involves the adsorption of CO2 onto the catalyst as carbonates or formate species, which could also be formed from the conversion of adsorbed carbonates. Formate groups are reduced to aldehydic ones and then to carbonyls. Carbonyls can also be adsorbed on Ru nanoparticles directly from the plasma, where they are formed by reverse water-gas shift reaction or CO2 dissociation by electron impact. Hydrogen is also adsorbed and dissociated on Ru nanoparticles. Carbonyls are progressively hydrogenated to methane which then is freed into the gas phase, producing water that is adsorbed on the catalyst surface. Thus, it is possible to conclude that the mechanism for the thermo- and plasma-catalytic CO2 methanation reaction are somehow similar, probably because of the mild conditions of the studied DBD plasma. To this day, the few publications that exist on the topic seem to propose a mechanism concordant to the one proposed in this work, i.e., progressive hydrogenation of formates and carbonyls to methane, with the formation of adsorbed carbonates, although it was deduced for different catalytic materials and setups and using different techniques [23,44,45,46].
From the results obtained in this setup, it is likely that the most important reaction taking place in the in-situ operando DBD cell is reverse water-gas shift reaction, likely due to an excessive dead volume over the catalyst that allows the species in the gas phase to react primarily in the plasma. Unfortunately, for the same reason is not possible to extract quantitative data on the catalytic activity of the studied sample under plasma-catalysis conditions as the products (although their development can be followed by mass spectrometry) are too diluted in the exhaust gas to link their concentrations with quantitative measures. Thus, an improvement on the design of the cell to reduce the aforementioned dead volume and to ensure that all the gases let into the cell will react with the surface of the catalyst will be necessary in the future.

4. Materials and Methods

4.1. Catalyst Synthesis

The Ru based catalyst was prepared using a commercial H-USY zeolite (CBV 780, from Zeolyst International company, Conshohocken, Pennsylvania, USA) with Si/Al = 38 and without containing extra-framework aluminum specie (EFAL) as starting material. To improve its properties in terms of basicity and hydrophobicity [26], Cs+ was incorporated in the zeolite framework as compensating cation by treating 15 g of dry zeolite with three steps of ion exchange using a 1 M caesium nitrate (CsNO3) solution. A suspension containing 4 mL of CsNO3 solution for each g of zeolite was prepared and kept under stirring at room temperature for 4 h. Afterwards, the suspension was filtrated and rinsed with distillate water until pH 7 was reached, and then it was dried overnight at 100 °C. After the ion exchange procedure was repeated three times, the sample was subjected to a calcination step under air flow (60 mL min−1 g−1) at 200 °C (1 h) and 500 °C (6 h), using a heating rate of 2.5 °C min−1. The calcinated support material was named as CsUSY.
Afterwards, 3 wt.% of Ru was dispersed on CsUSY zeolite by incipient wetness impregnation. For this purpose, hydrated RuCl3 provided by BDH Chemicals Ltd. (Poole, Dorset, UK). was used as a precursor salt. The required mass of salt was dissolved in distilled water and dripped drop by drop on the support, carefully mixing after each addition to ensure a homogeneous Ru solution dispersion. The prepared catalyst was then dried overnight at 80 °C and later subjected to calcination, following the same procedure described above. The synthesized catalyst was named as 3Ru/CsUSY.

4.2. Catalyst Characterization

Thermogravimetric analysis (TGA) experiments were carried out in a Setsys Evolution TGA from Setaram instruments. The samples saturated in water (35–40 mg) were placed into a platinum crucible suspended from an analytical micro-balance. They were heated from 20 to 500 °C (with a heating rate of 10 °C min−1) under air flow (30 mL min−1). This procedure was done twice, so that a better signal could be obtained by subtracting the results of the second cycle (at the same temperature) from those obtained in the first cycle. The hydrophobicity index (h, values varying from 0 to 1) was calculated as the ratio between the mass losses registered at 150 and 400 °C, and corresponded to the fraction of water molecules interacting weakly with the catalyst.
Powder X-ray diffraction (XRD) patterns for the support and the catalyst after calcination, reduction, and operando FTIR experiments were obtained in a Bruker AXS Advance D8 diffractometer, using Cu Kα radiation (λ = 1.5418 Å), and operating at 40 kV and 40 mA. The scanning range was set from 5 to 80 ° (2θ), with a step size of 0.03 °/2 s.
H2 temperature programmed reduction (H2-TPR) experiments were carried out in a Micromeritics AutoChem II using 0.150 g of catalyst. The catalyst was pre-treated under argon flow (25 mL min−1) at 250 °C, with a ramp of 10 °C min−1, and then cooled down to the room temperature. Then, TPR was carried out by flowing 30 mL min−1 of a 5% H2/Ar flow and raising the temperature from room temperature to 900 °C, at 10 °C min−1.
The external surface area (Sext) and the mesopores and micropores volume (Vmeso and Vmicro, respectively) of the catalyst and support were determined by N2-physisorption measurements at −196 °C using a Micromeritics ASAP 2020 Plus adsorption analyzer. Before N2-adsorption, samples (0.200 g) were degassed at 200 °C overnight. The total pore volume was measured at P/P0 = 0.99. The Sext and Vmicro of the sample were calculated using the t-plot method of Lippens and Boer. Vmeso was calculated as the difference between the total pore volume and Vmicro.
CO2 temperature programmed desorption (CO2-TPD) was carried out in the present work using an Autochem II from Micromeritics, equipped with a TCD detector. The catalyst (0.150 g) was reduced in-situ at 200 °C for 1 h under H2 flow, and then cooled down to 100 °C. CO2 was adsorbed at 100 °C (1 h) and was followed by surface cleaning with He flow at the same temperature (1 h) and, finally, temperature programmed desorption till 900 °C at 10 °C min−1.

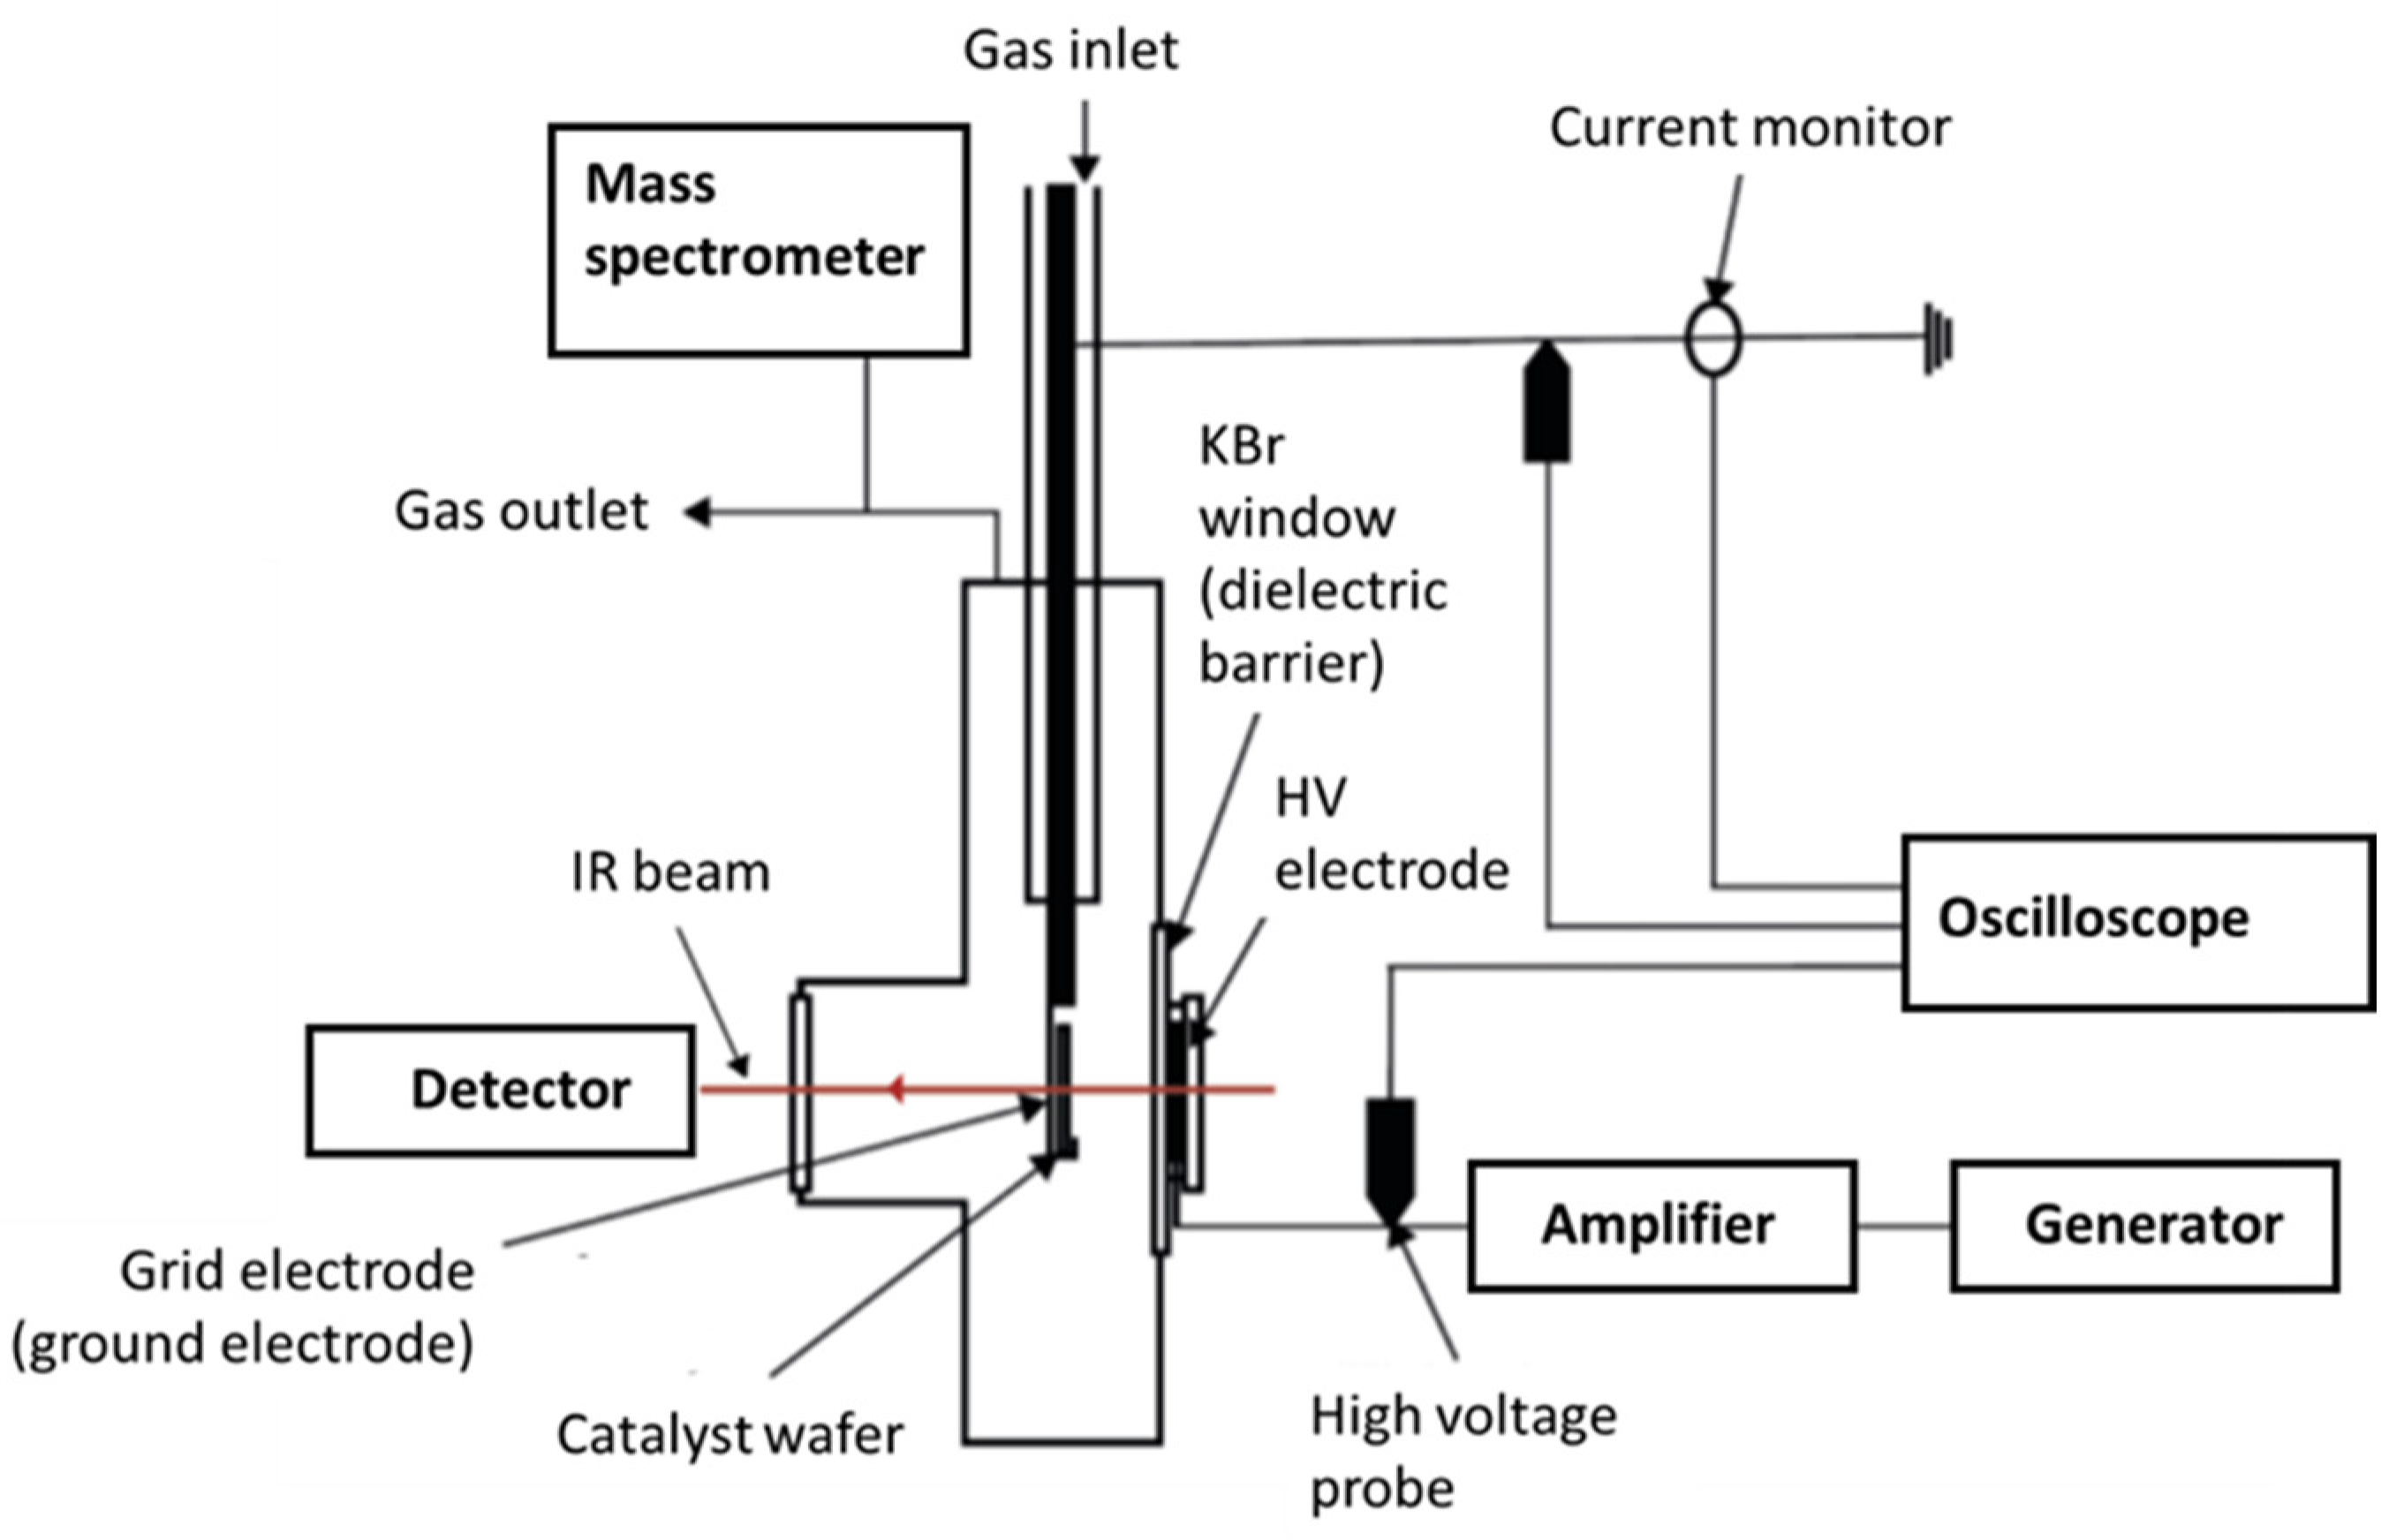
4.3. In-Situ Operando FTIR Experiments

4.3.1. Thermal Catalysis

Operando IR spectra were collected using an IR cell from InSitu Research Instruments, coupled to a Nicolet 6700 spectrometer equipped with MCT detector, by recording 50 scans at a resolution of 4 cm−1. The support zeolite and catalyst were pressed into a 16 mm diameter self-supported wafer of around 10 mg and were first reduced in-situ at 200 °C for 1 h under a flow of 20 mL min−1 composed by 20% H2 diluted in Ar. Samples were then cooled down by steps of 25 to 150 °C while recording background spectra at each step. Then, the reduced samples were exposed to the reactive mixture of CO2 and H2 in stoichiometric ratio diluted in Ar (CO2/H2/Ar = 5/20/75) for 30 min at 150 °C and the temperature was then increased up to 450 °C (2 °C min−1) while maintaining a total flow rate of 20 mL min−1. Spectra were periodically collected at increasing temperatures. All gases were supplied by Air Liquide, with purities ≥ 99.9990%. Difference spectra corresponding to the adsorbed species were obtained by subtracting those corresponding to the reduced fresh sample from those obtained under reactive conditions at the same temperatures.
The evolution of adsorbed and gas-phase species during operando experiments was followed by a semi-quantitative methodology based both on the absorbance measurement and integration of the corresponding IR band according to the presence (or not) of overlapping. Hence, the formate quantification was made by following the absorbance at 1403 cm−1 whereas the CO, CO2 and CH4 quantifications were made respectively thanks to the integrations of the respective ranges: 2050–1750 cm−1, 2450–2250 cm−1 and 3200–2800 cm−1. In all cases, the highest value measured for each species was set arbitrarily to 1 and the lowest to 0 in order to obtain normalized data and allowing a better comparison between the evolutions of each component. Regarding the evolution of adsorbed CO, the relative quantification takes into account all types of CO (monodentate, bidentate and bridged).

4.3.2. Plasma-Catalysis

The support zeolite and catalyst were pressed into a 16 mm diameter self-supported wafer of around 10 mg which was introduced in the cell using a hooked glass sample-holder. A schematic representation of the in-situ operando DBD IR cell used in this work is shown in Figure 12.
CO2, H2 and Ar gas flows were controlled through four Brooks Delta Smart II mass flowmeters. The gases were mixed through a six-ways valve and then let in the DBD cell directly above the catalyst pellet. The cell was connected to a rotary pump (~0.3 Torr, Edwards nXDS6iC) and a turbopump (10−7 Torr, Pfeiffer vacuum HiCube 80) to allow for easy purging of the cell.
The DBD IR cell was built using a repurposed ordinary in-situ FTIR glass cell and was situated in the sample compartment of a Bruker Vertex 80v spectrometer with a liquid nitrogen cooled mercury-cadmium-telluride (MCT) detector. On either side of the catalyst wafer, KBr windows were placed to allow an IR transmission window in the 4000–400 cm−1 range. To ignite a DBD plasma, two electrodes separated by, at least, one dielectric layer were necessary. The first (inner) one, a grounded grid electrode, was connected to the sample holder directly behind the sample wafer. The second (outer) grid electrode was positioned behind the KBr window (acting as the dielectric barrier) and was held in place by another KBr disk. Thus, the plasma was ignited directly on the surface of the sample, with the pellet serving as a second dielectric layer. The interelectrodic gap (sample wafer-KBr window) corresponded to ~3 mm. The outer electrode was connected to a signal generator (Générateur de fonctions arbitraires 50 MHz, Française d’Intrumentation) through an amplifier (Trek 20/20C). A voltage probe (Testec HVP-2739-1000:1) was pinned on the connections between the outer high voltage (HV) electrode and the amplifier and between the inner electrode and the ground. Additionally, a current monitor (Hioki CT6710) was placed on the ground connection. The voltage and current probes were connected to a Tektronix MDO3024 oscilloscope which allowed for continuous measurements of the voltage and current signals during the experiment.
The sample wafer was introduced in the cell and the system was purged under secondary vacuum (10−7 Torr). The sample was then subjected to thermal reduction at 350 °C for 90 min using a gas mixture of 20% H2 in Ar using a flow of 45 mL min−1. After purging again, Ar was used to return to atmospheric pressure, and the IR spectra acquisition was initiated setting a resolution of 4 cm−1, 64 acquisitions per spectrum and a spectrum recorded every 9 s, using the OPUS software. An additional, in-plasma, reduction step was carried out at 25 kV and 3 Hz using 20 mL min−1 of 20% H2 in Ar. The cell was then purged and filled with Ar again. Plasma was ignited in pure Ar and then the actual reactants were let into the cell, with a flow of 20 mL min−1 and in a 1/4/5 CO2/H2/Ar ratio. The reaction was carried out at 25 kV and 3 kHz until steady state, i.e., when the spectra were stable so that no significant variation was observed anymore (typically after 15–20 min), and then the plasma was turned off. When the signals were stable again, the system was purged under primary vacuum (0.3 Torr) to monitor the adsorbed species on the surface of the sample. After stabilization was reached again, the cell was purged under secondary vacuum (10−7 Torr) to monitor exclusively the more strongly adsorbed species.

5. Conclusions

The mechanism of thermal and plasma-assisted CO2 methanation over a 3 wt.% Ru catalyst supported over an optimized zeolite support (CsUSY) was studied by in-situ operando FTIR spectroscopy. The studied catalyst, synthesized by incipient wetness impregnation, exhibited remarkable catalytic performances in thermal catalysis (72% of CO2 conversion, >95% of CH4). Results were ascribed to the appropriate textural properties of the material, its hydrophobicity, ability to reduce the inhibitory effect of water product in the reaction, its basicity, ability to promote CO2 adsorption and activation, and the considerably small Ru0 particles (16 nm). From a mechanistic point of view, under thermal catalysis the reaction involved the formation of formates and carbonyls as intermediates, in accordance with existing literature for similar Ni/USY catalytic systems. Using a custom made in-situ operando DBD cell, it was possible to gather information on the reaction mechanism for CO2 methanation under plasma-catalysis conditions. Results indicated that the adsorption of CO2 on the catalyst’s surface occurred in the form of carbonate species on Cs+ sites (compensating cation). Formates were then originated on Ru0 nanoparticles, being subsequently hydrogenated to carbonyls. At the same time, it was suggested that CO species formed in the plasma could be also adsorbed on the Ru0 nanoparticle surface, being progressively hydrogenated to methane. Overall, in this study it was concluded that the mechanisms for the thermo- and plasma-catalytic CO2 methanation reaction were similar, this being ascribed to the mild conditions of the studied DBD plasma. Consequently, despite the mutual influence of the plasma and the catalyst on one another, the parameters that define a well performing catalyst in thermal catalysis were found to apply also to plasma-catalysis. As a future perspective, deeper analyses will be valuable to fully elucidate the reaction mechanisms under plasma catalysis conditions. For example, a better understanding of the surface reactions could be obtained by Steady-State Isotopic-Transient Kinetic Analysis (SSITKA) and step-scan FTIR experiments. Additionally, modelling the fundamental reaction steps with plasma-chemical and microkinetic surface chemistry models could shed a better light on the obtained results, providing a more complete picture of the complex interactions between the plasma and the catalyst in plasma-assisted CO2 methanation.

Author Contributions

Conceptualization, D.A., F.A.-J., A.T. and C.H.; Formal analysis, D.A., M.C.B., F.A.-J., A.T. and C.H.; Funding acquisition, F.A.-J. and C.H.; Investigation, D.A., M.C.B., F.A.-J. and C.H.; Methodology, D.A., M.C.B., F.A.-J., A.T. and C.H.; Project administration, F.A.-J., A.T. and C.H.; Resources, F.A.-J., A.T. and C.H.; Supervision, F.A.-J., A.T. and C.H.; Validation, F.A.-J., A.T. and C.H.; Writing—original draft, D.A.; Writing—review and editing, M.C.B., F.A.-J., A.T. and C.H. All authors have read and agreed to the published version of the manuscript.

Funding

This research was carried out in the framework of Plasma Catalysis CO2 Recycling, the PIONEER project which has received funding from the European Union’s Horizon 2020 research and innovation programme under the Marie Skłodowska-Curie grant agreement No 813393. Authors thank also to Fundação para a Ciência e Tecnologia (FCT) for CQE funding (UIDB/00100/2020 and UIDP/00100/2020) and Carmen Bacariza contract (2020.00030.CEECIND).

Data Availability Statement

The data presented in this study are available in the article itself.

Conflicts of Interest

The authors declare no conflict of interest.

References

  1. IPCC (Intergovernmental Panel on Climate Change). Climate Change 2022: The Physical Science Basis. Working Group I Contribution to the Sixth Assessment Report of the Intergovermental Panel on Climate Change, IPCC (Intergovernmental Panel on Climate Change). Available online: https://www.ipcc.ch/ar6-syr/ (accessed on 12 January 2023).
  2. Centi, G.; Perathoner, S. Opportunities and prospects in the chemical recycling of carbon dioxide to fuels. Catal. Today 2009, 148, 191–205. [Google Scholar] [CrossRef]
  3. Sreedhar, I.; Varun, Y.; Singh, S.A.; Venugopal, A.; Reddy, B.M. Developmental trends in CO2 methanation using various catalysts. Catal. Sci. Technol. 2019, 9, 4478–4504. [Google Scholar] [CrossRef]
  4. Rönsch, S.; Schneider, J.; Matthischke, S.; Schlüter, M.; Götz, M.; Lefebvre, J.; Prabhakaran, P.; Bajohr, S. Review on methanation—From fundamentals to current projects. Fuel 2016, 166, 276–296. [Google Scholar] [CrossRef]
  5. Garba, M.D.; Usman, M.; Khan, S.; Shehzad, F.; Galadima, A.; Ehsan, M.F.; Ghanem, A.S.; Humayun, M. CO2 towards fuels: A review of catalytic conversion of carbon dioxide to hydrocarbons. J. Environ. Chem. Eng. 2020, 9, 104756. [Google Scholar] [CrossRef]
  6. Frontera, P.; Macario, A.; Ferraro, M.; Antonucci, P. Supported Catalysts for CO2 Methanation: A Review. Catalysts 2017, 7, 59. [Google Scholar] [CrossRef]
  7. Ridzuan, N.D.M.; Shaharun, M.S.; Anawar, M.A.; Ud-Din, I. Ni-Based Catalyst for Carbon Dioxide Methanation: A Review on Performance and Progress. Catalysts 2022, 12, 469. [Google Scholar] [CrossRef]
  8. Schubert, M.; Pokhrel, S.; Thomé, A.; Zielasek, V.; Gesing, T.M.; Roessner, F.; Mädler, L.; Bäumer, M. Highly active Co–Al2O3-based catalysts for CO2 methanation with very low platinum promotion prepared by double flame spray pyrolysis. Catal. Sci. Technol. 2016, 6, 7449–7460. [Google Scholar] [CrossRef] [Green Version]
  9. Kirchner, J.; Anolleck, J.K.; Lösch, H.; Kureti, S. Methanation of CO2 on iron based catalysts. Appl. Catal. B Environ. 2018, 223, 47–59. [Google Scholar] [CrossRef]
  10. Karelovic, A.; Ruiz, P. CO2 hydrogenation at low temperature over Rh/γ-Al2O3 catalysts: Effect of the metal particle size on catalytic performances and reaction mechanism. Appl. Catal. B Environ. 2012, 113–114, 237–249. [Google Scholar] [CrossRef]
  11. Quindimil, A.; De-La-Torre, U.; Pereda-Ayo, B.; Davó-Quiñonero, A.; Bailón-García, E.; Lozano-Castelló, D.; González-Marcos, J.A.; Bueno-López, A.; González-Velasco, J.R. Effect of metal loading on the CO2 methanation: A comparison between alumina supported Ni and Ru catalysts. Catal. Today 2019, 356, 419–432. [Google Scholar] [CrossRef]
  12. Zheng, J.; Wang, C.; Chu, W.; Zhou, Y.; Köhler, K. CO2Methanation over Supported Ru/Al2O3Catalysts: Mechanistic Studies by In situ Infrared Spectroscopy. Chemistryselect 2016, 1, 3197–3203. [Google Scholar] [CrossRef]
  13. Dębek, R.; Azzolina-Jury, F.; Travert, A.; Maugé, F. A review on plasma-catalytic methanation of carbon dioxide—Looking for an efficient catalyst. Renew. Sustain. Energy Rev. 2019, 116, 109427. [Google Scholar] [CrossRef]
  14. Bacariza, M.C.; Graça, I.; Lopes, J.M.; Henriques, C. Tuning Zeolite Properties towards CO2 Methanation: An Overview. Chemcatchem 2019, 11, 2388–2400. [Google Scholar] [CrossRef]
  15. Bogaerts, A.; Kozák, T.; van Laer, K.; Snoeckx, R. Plasma-based conversion of CO2: Current status and future challenges. Faraday Discuss. 2015, 183, 217–232. [Google Scholar] [CrossRef]
  16. Ashford, B.; Wang, Y.; Wang, L.; Tu, X. Plasma-Catalytic Conversion of Carbon Dioxide. In Plasma Catalysis: Fundamentals and Applications; Springer Series on Atomic, Optical, and Plasma Physics; Tu, X., Whitehead, J.C., Nozaki, T., Eds.; Springer International Publishing: Cham, Switzerland, 2019; pp. 271–307. ISBN 978-3-030-05189-1. [Google Scholar]
  17. Snoeckx, R.; Bogaerts, A. Plasma technology—A novel solution for CO2 conversion? Chem. Soc. Rev. 2017, 46, 5805–5863. [Google Scholar] [CrossRef] [Green Version]
  18. Nizio, M.; Albarazi, A.; Cavadias, S.; Amouroux, J.; Galvez, M.E.; Da Costa, P. Hybrid plasma-catalytic methanation of CO2 at low temperature over ceria zirconia supported Ni catalysts. Int. J. Hydrogen Energy 2016, 41, 11584–11592. [Google Scholar] [CrossRef] [Green Version]
  19. Bacariza, M.; Biset-Peiró, M.; Graça, I.; Guilera, J.; Morante, J.; Lopes, J.; Andreu, T.; Henriques, C. DBD plasma-assisted CO2 methanation using zeolite-based catalysts: Structure composition-reactivity approach and effect of Ce as promoter. J. CO2 Util. 2018, 26, 202–211. [Google Scholar] [CrossRef]
  20. Solis-Garcia, A.; Fierro-Gonzalez, J.C. Mechanistic Insights into the CO2 Methanation Catalyzed by Supported Metals: A Review. J. Nanosci. Nanotechnol. 2019, 19, 3110–3123. [Google Scholar] [CrossRef]
  21. Westermann, A.; Azambre, B.; Bacariza, M.C.; Graça, I.; Ribeiro, M.F.; Lopes, J.M.; Henriques, C. Insight into CO2 methanation mechanism over NiUSY zeolites: An operando IR study. Appl. Catal. B Environ. 2015, 174–175, 120–125. [Google Scholar] [CrossRef]
  22. Neyts, E.C.; Ostrikov, K.; Sunkara, M.K.; Bogaerts, A. Plasma Catalysis: Synergistic Effects at the Nanoscale. Chem. Rev. 2015, 115, 13408–13446. [Google Scholar] [CrossRef]
  23. Azzolina-Jury, F.; Thibault-Starzyk, F. Mechanism of Low Pressure Plasma-Assisted CO2 Hydrogenation Over Ni-USY by Microsecond Time-resolved FTIR Spectroscopy. Top. Catal. 2017, 60, 1709–1721. [Google Scholar] [CrossRef]
  24. Sun, Y.; Li, J.; Chen, P.; Wang, B.; Wu, J.; Fu, M.; Chen, L.; Ye, D. Reverse water-gas shift in a packed bed DBD reactor: Investigation of metal-support interface towards a better understanding of plasma catalysis. Appl. Catal. A Gen. 2020, 591, 117407. [Google Scholar] [CrossRef]
  25. Van Turnhout, J.; Aceto, D.; Travert, A.; Bazin, P.; Thibault-Starzyk, F.; Bogaerts, A.; Azzolina-Jury, F. Observation of surface species in plasma-catalytic dry reforming of methane in a novel atmospheric pressure dielectric barrier discharge in situ IR cell. Catal. Sci. Technol. 2022, 12, 6676–6686. [Google Scholar] [CrossRef]
  26. Bacariza, M.; Bértolo, R.; Graça, I.; Lopes, J.; Henriques, C. The effect of the compensating cation on the catalytic performances of Ni/USY zeolites towards CO2 methanation. J. CO2 Util. 2017, 21, 280–291. [Google Scholar] [CrossRef]
  27. Bacariza, M.; Graça, I.; Lopes, J.; Henriques, C. Enhanced activity of CO2 hydrogenation to CH4 over Ni based zeolites through the optimization of the Si/Al ratio. Microporous Mesoporous Mater. 2018, 267, 9–19. [Google Scholar] [CrossRef]
  28. Bacariza, M.; Maleval, M.; Graça, I.; Lopes, J.; Henriques, C. Power-to-methane over Ni/zeolites: Influence of the framework type. Microporous Mesoporous Mater. 2018, 274, 102–112. [Google Scholar] [CrossRef]
  29. Afzal, M.I.; Shahid, S.; Mansoor, S.; Javed, M.; Iqbal, S.; Hakami, O.; Yousef, E.S.; Al-Fawzan, F.F.; Elkaeed, E.B.; Pashameah, R.A.; et al. Fabrication of a Ternary Nanocomposite g-C3N4/Cu@CdS with Superior Charge Separation for Removal of Organic Pollutants and Bacterial Disinfection from Wastewater under Sunlight Illumination. Toxics 2022, 10, 657. [Google Scholar] [CrossRef]
  30. Fazal, T.; Iqbal, S.; Shah, M.; Ismail, B.; Shaheen, N.; Alharthi, A.I.; Awwad, N.S.; Ibrahium, H.A. Correlation between structural, morphological and optical properties of Bi2S3 thin films deposited by various aqueous and non-aqueous chemical bath deposition methods. Results Phys. 2022, 40, 105817. [Google Scholar] [CrossRef]
  31. Huang, W.-S.; Humphrey, B.D.; MacDiarmid, A.G. Polyaniline, a novel conducting polymer. Morphology and chemistry of its oxidation and reduction in aqueous electrolytes. J. Chem. Soc. Faraday Trans. 1 Phys. Chem. Condens. Phases 1986, 82, 2385–2400. [Google Scholar] [CrossRef]
  32. Treacy, M.M.J. Collection of simulated XRD powder patterns for zeolites. Appl. Catal. 1986, 21, 388–389. [Google Scholar]
  33. Gamliel, D.P.; Karakalos, S.; Valla, J.A. Liquid phase hydrodeoxygenation of anisole, 4-ethylphenol and benzofuran using Ni, Ru and Pd supported on USY zeolite. Appl. Catal. A Gen. 2018, 559, 20–29. [Google Scholar] [CrossRef]
  34. Shen, X.; Garces, L.-J.; Ding, Y.; Laubernds, K.; Zerger, R.P.; Aindow, M.; Neth, E.J.; Suib, S.L. Behavior of H2 chemisorption on Ru/TiO2 surface and its application in evaluation of Ru particle sizes compared with TEM and XRD analyses. Appl. Catal. A Gen. 2008, 335, 187–195. [Google Scholar] [CrossRef]
  35. Biswas, A.; Paul, S.; Banerjee, A. Carbon nanodots, Ru nanodots and hybrid nanodots: Preparation and catalytic properties. J. Mater. Chem. A 2015, 3, 15074–15081. [Google Scholar] [CrossRef]
  36. Qu, L.; Li, J.; Hao, Z.; Li, L. Catalytic Oxidation of Nitric Oxide to Nitrogen Dioxide on Ru-FAU. Catal. Lett. 2009, 131, 656–662. [Google Scholar] [CrossRef] [Green Version]
  37. Juurlink, L.; Killelea, D.; Utz, A. State-resolved probes of methane dissociation dynamics. Prog. Surf. Sci. 2009, 84, 69–134. [Google Scholar] [CrossRef]
  38. Wierzbicki, D.; Debek, R.; Motak, M.; Grzybek, T.; Gálvez, M.E.; Da Costa, P. Novel Ni-La-hydrotalcite derived catalysts for CO2 methanation. Catal. Commun. 2016, 83, 5–8. [Google Scholar] [CrossRef] [Green Version]
  39. Boukha, Z.; Jiménez-González, C.; Gil-Calvo, M.; de Rivas, B.; González-Velasco, J.R.; Gutiérrez-Ortiz, J.I.; López-Fonseca, R. MgO/NiAl2O4 as a new formulation of reforming catalysts: Tuning the surface properties for the enhanced partial oxidation of methane. Appl. Catal. B Environ. 2016, 199, 372–383. [Google Scholar] [CrossRef]
  40. Meldrum, B.J.; Rochester, C.H. Fourier-transform infrared study of surface species on carbon mixed with KBr and reacted with CO2, O2 and CO. J. Chem. Soc. Faraday Trans. 1990, 86, 3647–3652. [Google Scholar] [CrossRef]
  41. Goodwin, J.G., Jr.; Naccache, C. CO adsorption on ion-exchanged Ru zeolite catalyst. J. Catal. 1980, 64, 482–486. [Google Scholar] [CrossRef]
  42. Hadjiivanov, K.; Lavalley, J.-C.; Lamotte, J.; Maugé, F.; Saint-Just, J.; Che, M. FTIR Study of CO Interaction with Ru/TiO2Catalysts. J. Catal. 1998, 176, 415–425. [Google Scholar] [CrossRef]
  43. Haq, S.; Love, J.; Sanders, H.; King, D. Adsorption and decomposition of formic acid on Ni{110}. Surf. Sci. 1995, 325, 230–242. [Google Scholar] [CrossRef]
  44. Wierzbicki, D.; Moreno, M.V.; Ognier, S.; Motak, M.; Grzybek, T.; Da Costa, P.; Gálvez, M.E. Ni-Fe layered double hydroxide derived catalysts for non-plasma and DBD plasma-assisted CO2 methanation. Int. J. Hydrogen Energy 2019, 45, 10423–10432. [Google Scholar] [CrossRef]
  45. Mikhail, M.; Da Costa, P.; Amouroux, J.; Cavadias, S.; Tatoulian, M.; Ognier, S.; Gálvez, M.E. Effect of Na and K impurities on the performance of Ni/CeZrOx catalysts in DBD plasma-catalytic CO2 methanation. Fuel 2021, 306, 121639. [Google Scholar] [CrossRef]
  46. Parastaev, A.; Kosinov, N.; Hensen, E.J.M. Mechanistic study of catalytic CO2 hydrogenation in a plasma by operando DRIFT spectroscopy. J. Phys. D Appl. Phys. 2021, 54, 264004. [Google Scholar] [CrossRef]
Figure 1. XRD patterns acquired for CsUSY support (in gray) and 3Ru/CsUSY catalyst after calcination (in blue) and after reduction (in red).
Catalysts 13 00481 g001
Figure 2. H2-TPR profile of 3Ru/CsUSY catalyst.
Catalysts 13 00481 g002
Figure 3. CO2-TPD profiles of CsUSY support (in gray) and 3Ru/CsUSY catalyst (in red).
Catalysts 13 00481 g003
Figure 4. FTIR spectra obtained under CO2 methanation conditions for 3Ru/CsUSY in the 2300–1300 cm−1 region at different temperatures.
Catalysts 13 00481 g004
Figure 5. Evolution of the relative concentrations (left axis) of CH4(g), adsorbed CO (2050–1750 cm−1) and formates (1403 cm−1); CO2 conversion (%, right axis, red) during CO2 methanation over 3Ru/CsUSY (connected symbols) and according to the thermodynamic limit of the reaction (dashed lines); CH4 selectivity (%, right axis, grey) during CO2 methanation over 3Ru/CsUSY (connected symbols) and according to the thermodynamic limit of the reaction (dashed lines).
Catalysts 13 00481 g005
Figure 6. FTIR subtraction spectra acquired as a function of time up to steady state after plasma ignition in CO2 methanation conditions on 3Ru/CsUSY, with magnification of the 3025–3000 cm−1 region.
Catalysts 13 00481 g006
Figure 7. FTIR subtraction spectra acquired as a function of time up to steady state after plasma ignition in CO2 methanation conditions on 3Ru/CsUSY, in the 2400–1250 cm−1 region. (Black dots indicate bands assigned to USY zeolite).
Catalysts 13 00481 g007
Figure 8. Evolution of the intensity of the bands (shown as absorbance) of relevant species in the FTIR spectra while the plasma is ignited (and thus the reaction is occurring), when the plasma is turned off and, finally, when the system is put under vacuum.
Catalysts 13 00481 g008
Figure 9. FTIR subtraction spectra acquired as a function of time up to steady state after plasma ignition in CO2 methanation conditions on CsUSY, in the 2400–1250 cm−1 region. (Black dots indicate bands assigned to USY zeolite”.)
Catalysts 13 00481 g009
Figure 10. XRD patterns acquired for 3Ru/CsUSY catalyst after reduction (in red) and after plasma-catalytic experiments (in purple).
Catalysts 13 00481 g010
Figure 11. Scheme of the proposed mechanism for plasma-assisted CO2 methanation over 3Ru/CsUSY.
Catalysts 13 00481 g011
Figure 12. Scheme of the in-situ operando DBD FTIR cell (from [25]).
Catalysts 13 00481 g012
Table 1. Textural properties of the studied samples obtained by N2 physisorption.
SampleVmicro
(cm3 g−1)
Vmeso
(cm3 g−1)
Sext
(m2 g−1)
CsUSY0.180.32315
3Ru/CsUSY0.140.22170
Disclaimer/Publisher’s Note: The statements, opinions and data contained in all publications are solely those of the individual author(s) and contributor(s) and not of MDPI and/or the editor(s). MDPI and/or the editor(s) disclaim responsibility for any injury to people or property resulting from any ideas, methods, instructions or products referred to in the content.

