Abstract
Ni (hydr)oxide is a promising and inexpensive material for oxygen evolution reaction (OER) catalysts and is known to dramatically increase the activity when used with Fe. Herein, we basified a Ni(II) solution and coated layered Ni(OH)2 on Ni coins to prepare a template with high stability and activity. To evaluate the stability and catalytic activity during high-current-density operation, we analyzed the electrochemical and physicochemical properties before and after constant current (CC) operation. The electrode with a Ni(OH)2 surface exhibited higher initial activity than that with a NiO surface; however, after the OER operation at a high-current density, degradation occurred owing to structural destruction. The activity of the electrodes with a NiO surface improved after the CC operation because of the changes on the electrode-surface caused by the CC operation and the subsequent Fe incorporation from the Fe impurity in the electrolyte. After confirming the improvement in activity due to Fe, we prepared NiFe-oxide electrodes with improved catalytic activity and optimized the Ni precursor and Fe loading solution concentrations. The Ni-Fe oxide electrode prepared under the optimal concentrations exhibited an overpotential of 287 mV at a current density of 10 mA/cm2, and a tafel slope of 37 mV dec−1, indicating an improvement in the OER activity.
1. Introduction
Recently, renewable energy sources have been rapidly adopted to respond to various environmental issues caused by fossil fuel combustion. According to the international renewable energy agency (IRENA), the global output capacity of renewable energy increased from 1699 GW in 2016 to 3068 GW in 2021, with wind and solar energies comprising 86% of the newly adopted renewable energy sources [1]. Unlike existing power generation methods, solar, wind, and other renewable energy sources have intermittent and unstable characteristics, which raises concerns about the reliability and stability of the power systems [2]. Consequently, demand has grown for energy storage methods to store excess power and supply it when power demand exceeds supply.
Hydrogen energy-based storage provides the advantages of high energy density and capacity, and easy transportation, making it suitable for large-capacity energy storage over long periods [3,4]. Further, alkaline water electrolysis is a simple and durable water electrolysis technique. However, the oxygen evolution reaction (OER), which has sluggish reaction kinetics, accounts for a large part of the electrolyzer resistance. Therefore, it is necessary to develop various anodes with high OER activity [5,6].
The catalyst materials currently known to exhibit the highest OER activity are Ir, Ru, and their oxides; however, owing to their cost and scarcity, anodes based on 3d transition metals such as Ni, Co, Mn, and Fe, which are cheaper and easier to procure, have been developed. In a number of the transition metals oxides and hydroxide catalysts, Ni exhibits the highest OER activity, followed by Co, Mn, and Fe [7,8]. Ni not only yields the highest OER activity but also has high corrosion resistance in alkaline environments, making it a promising material to develop anode catalysts for alkaline water electrolysis.
Thus far, Ni, NiO, NiOOH, and Ni(OH)2 have been investigated as anodes based on a single Ni metal [9,10,11]. These Ni–Oxide electrodes have been prepared, through processes such as electrochemical oxidation, calcination, hydrothermal synthesis, basification, and anodic deposition [10,12,13,14,15]. In particular, preparing Ni(OH) 2 through basification and hydrothermal synthesis enables easy morphology control, which is advantageous for preparing electrodes having improved surface area and electrochemical performance [16].
Because these Ni-based electrodes do not provide sufficient activity for commercial use, researchers have performed studies using transition metals such as Mn, Co, Fe, and Mn to improve the activity. In particular, Ni used with Fe can greatly increase the OER activity [17,18,19,20,21,22,23]. Although impregnating Fe is known to raise the activity of Ni-based electrodes, the role of Fe has not yet been completely elucidated.
In an alkaline environment, Ni, NiO, and Ni(OH)2 are known to transform to the active phase NiOOH at the OER potential and return to the original phase at the resting potential [24,25,26]. In a study by Trotochaud, impregnating Fe improved the conductivity of NiOOH [25]. Kuai et al. argued that Fe inhibits the oxidation of Ni, making it more easily reduced [27], and Friebel et al. argued that local structural changes affected the activity when Fe was impregnated [28]. Yang et al. explained that FeOOH, surrounded by the nearest NiOOH, has adsorption energy close to the optimal for the OER intermediate, thus giving it advantageous OER activity [29]. According to recent studies, the active sites of Ni(Fe)OOH mixed electrodes, which are composed of Fe contained in the NiOOH lattice, have higher activity than that of the NiOOH or FeOOH sites existing as single metal components, demonstrating that Ni(Fe)OOH is the actual active site [17,18,28]. Moreover, researchers have argued that low-coordinated Fe at the edge and defect site has a higher activity compared to that at the bulk site.
A variety of synthesis methods have been attempted to develop NiFe electrodes with enhanced activity. Lee et al. prepared NiFe alloy electrodes with a high surface area through electro-codeposition followed by leaching [20], and Dong et al. prepared NiFe-oxide electrodes by hydrothermally codeposited and then calcining them [30]. Ni and Fe hydroxides are called NiFe-LDH and have been deeply studied in various catalyst fields, including OER [18,21,31]. Although various NiFe electrodes have been prepared through codeposition and studied, NiFe electrodes prepared by impregnating Fe have not been deeply studied.
In this study, we basified a Ni(NO3)2 solution and synthesized a Ni(OH)2 electrode material with a brucite structure on a metal Ni substrate. Subsequently, to improve durability, we performed calcination at temperatures of 200 and 400 °C to attain the NiO and Ni(OH)2 crystal structure. We compared the durability and reaction characteristics of the electrodes for OER depending on the calcination temperature. The electrode with a NiO crystal structure exhibited improved OER activity after constant current (CC) operation. To explain the phenomenon, the electrode characteristics before and after the CC operation were analyzed. Furthermore, to confirm the influence of Fe impregnation on the increase in the activity of the electrode having a NiO structure, we performed reactions in Fe-purified KOH and untreated KOH solutions and conducted electrochemical and physicochemical analyses. Then, we intentionally impregnated Fe before calcination to prepare an electrode with improved OER activity. Electrodes prepared under various conditions were compared to determine the optimal Ni coating solution and Fe loading solution concentrations.
2. Results
2.1. Monometallic Ni Electrodes
2.1.1. Phase Change of Ni(OH)2 According to Calcination Temperature
After the reaction of the Ni(OH)2/Ni electrode, the destruction of the electrode material is visible to the naked eye, s bonding between the substrate and electrocatalyst is poor. Therefore, heat treatment at high temperatures was required to improve the durability of the electrodes. Accordingly, in this experiment, to synthesize the Ni(OH)2 electrode material and identify the phase change according to the temperature of the electrode material, the Ni(OH)2 was calcined from room temperature to 500 °C, and the changes in XRD(X-ray Diffraction) patterns were measured via in-situ XRD are plotted in Figure S1. According to the in-situ XRD results, Ni(OH)2 was oxidized to NiO between 250 °C and 350 °C, and the NiO structure was maintained even after cooling to room temperature. These changes are consistent with the thermogravimetric analysis results of Ni hydroxide reported in the literature [32,33]. Referring to this phase change, we calcined Ni(OH)2/Ni electrodes at 200 °C and 400 °C to synthesize electrodes with Ni(OH)2 and NiO surfaces, respectively. These synthesized electrodes were named Ni(5)-200 °C and Ni(5)-400 °C as shown in Table 1.

Table 1.
Nomenclature of Various Ni electrodes by calcination condition.
2.1.2. OER Characteristics According to Calcination Temperature
Figure S2 shows the SEM (Scanning Electron Microscope) images of the electrodes before and after calcination, which confirmed that calcination did not affect the surface morphologies of the electrodes. To evaluate the durability of the calcined electrodes in high-current operation, CC operation was conducted for 30 h at a current density of 1.5 A/cm2, the results of which are shown in Figure 1.
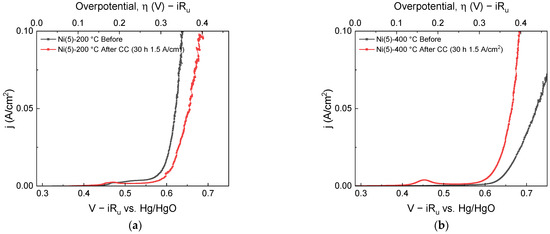
Figure 1.
LSVs taken before (black) and after (red) 30 h CC (1.5 A/cm2) operation: (a) Ni(5)-200 °C and (b) Ni(5)-400 °C.
As shown in Figure 1, before the CC operation, the overpotentials of the Ni(5)-200 °C and Ni(5)-400 °C electrodes at a 50 mA/cm2 current density were 355 and 455 mV, respectively, indicating that Ni(5)-400 °C has lower OER activity. After 30 h of CC operation, the performance of the Ni(5)-200 °C electrode decreased, resulting in an overpotential of 373 mV, whereas the Ni(5)-400 °C electrode had an overpotential of 374 mV exhibiting increased activity. Therefore, Ni(5)-400 °C was thought to be more suitable for high-current density operation. To investigate why the two electrodes exhibited different degradation trends during CC operation, each electrode was subjected to CC operations twice at 1.5 A/cm2, each conducted for 2 h. The linear sweep voltammograms (LSVs) were obtained before the CC operation, after 2 h, and after 4 h of the reaction time, which are shown in the I–V curves in Figure 2a,b. Similar to the 30 h CC test, the activity of the Ni(5)-200 °C electrode decreased, whereas that of the Ni(5)-400 °C electrode increased after the initial 2 h of CC operation. The I–V curves of the electrodes after 2-, 4-, and 30 h CC operations showed similar values, indicating that the activity change is completed within the initial 2 h, and no large OER activity change occurs thereafter.
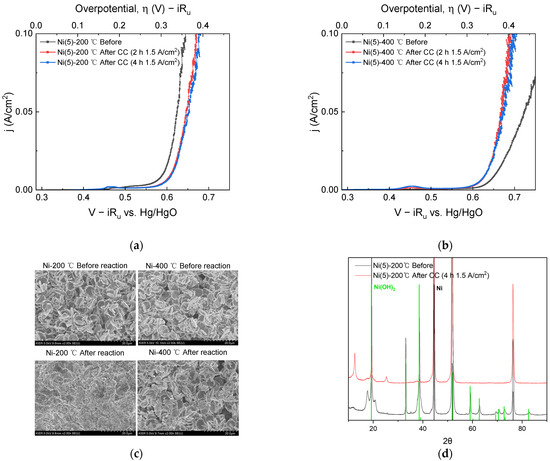
Figure 2.
I-V curves obtained before CC (1.5 A/cm2) operation (black), after 2 h CC operation (red), and after 4 h CC operation (blue): (a) Ni(5)-200 °C and (b) Ni(5)-400 °C. (c) SEM surface image and (d) XRD diffraction pattern taken before and after 4 h CC: Ni(JCPDS. 04-0850) and β-Ni(OH)2(JCPDS. 14-0117) reference pattern were indicated as black and green line separately.
SEM images and XRD diffraction patterns were obtained to determine the effect of a total 4 h of CC operation on the electrode surface morphology and phase. In the SEM images shown in Figure 2c, after the CC operation, the Ni(5)-200 °C electrode could not maintain the surface morphology observed before the reaction, whereas the Ni(5)-400 °C electrode maintained the morphology after the reaction. Therefore, for the Ni(5)-200 °C electrode, structural destruction of the Ni(OH)2 electrode material on the electrode surface occurred during CC operation at a high-current density, which is responsible for the reduced activity. This structural change was observed in the XRD diffraction patterns shown in Figure 2d. In Figure 2d, after the CC operation, the peaks corresponding to Ni(OH)2 in the Ni(5)-200 °C electrode decrease and the bulk Ni peaks increase, whereas the NiO peaks are maintained in the Ni(5)-400 °C electrode. The decrease in the activity of the Ni(5)-200 °C electrode may be attributed to the destruction of the catalyst structure on the electrode surface. Changes in the surface morphology led to changes in the surface area and double-layer capacitance (Cdl). To compare the change in surface area after CC operation, the Cdl values according to the reaction were compared and plotted in Figure S3. The Cdl values of the Ni(5)-200 °C electrode were similar to the that of the substrate after OER, whereas the Cdl values of the Ni(5)-400 °C electrode increased as the OER progressed. The Cdl was smaller than expected considering the electrode morphology, which is presumably influenced by the low conductivity of metal oxide and hydroxide electrodes [34].
2.2. Activation of NiO Electrode
2.2.1. Influence of OER on Structural Change of Ni(5)-400 °C Electrode
To examine the improvement in the activity of Ni(5)-400 °C, we investigated structural changes of the electrode. NiO and Ni(OH)2 electrodes can transform into the NiOOH phase in the OER potential region, as shown in below Equations (1) and (2) [11,13,35].
NiO + OH− ↔ NiOOH + e−
Ni(OH)2 + OH− ↔ NiOOH + H2O + e−
The oxidation peak corresponding to a Ni(OH)2 → NiOOH or NiO → NiOOH reaction appears before the OER region [20]. In the I–V curves shown in Figure 1b above, after the CC operation, the peak area of the Ni2+/Ni3+ oxidation peak, which can be observed at the potential of approximately 0.45 V Hg/HgO increases with the simultaneous increase in the activity of the Ni(5)-400 °C electrode [20].
The increase in the area of this oxidation peak and the corresponding reduction peak can clearly be observed in the cyclic voltammetry (CV) curves in Figure 3.
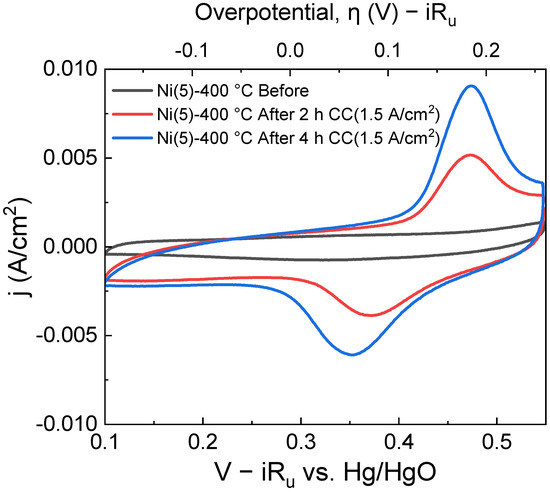
Figure 3.
Cyclic voltammogram of a Ni(5)-400 °C, taken before CC(1.5 A/cm2) operation (black), after 2 h CC operation (red), and after 4 h CC operation(blue). With each subsequent CV cycle, CV Oxidation/reduction peak area increases.
An increase in the Ni2+/Ni3+ oxidation peak area, which can be observed in the potential region of approximately 0.45–0.5 V vs. Hg/HgO implies that the amount of Ni2+ that can transform into NiOOH has increased. The increase in the Ni sites was calculated using the area of the CV peaks and is quantitatively shown in Table S1 [26,36]. NiOOH is known as the active phase of the NiO and Ni(OH)2 electrocatalyst [17,37,38]. Hence, an increase in the formation of active phase NiOOH likely contributed to the activity of the Ni(5)-400 °C electrode. To compare the structure of Ni(5)-400 °C before and after CC operation, a Raman spectroscopic analysis was conducted, whose results are shown in Figure 4. The peak at 1069 cm−1 and the peak near 1600 cm−1, which can be observed in both the spectra, corresponding to the symmetric stretching mode of carbonate and the bonding mode of H2O, respectively. The peak near 1561 cm−1 corresponds to the stretching mode of dissolved O2 [39]. A broad characteristic that can be observed between 500 cm−1 and 2000 cm−1 is the influence of water [40]. The Ni(5)-400 °C electrode shows a peak at approximately 500 cm−1 corresponding to the lattice mode of NiO before the reaction [30]. After the reaction, the peaks indicating the presence of γ-NiOOH appear at 475 cm−1 and 550 cm−1, corresponding to the Ni–O(H) lattice stretching Eg mode and Ni–O lattice stretching Alg mode, respectively [23,41].
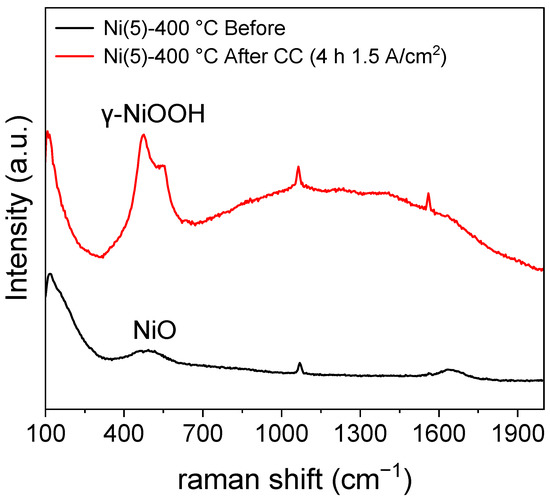
Figure 4.
Raman spectra of Ni(5)-400 °C before CC (1.5 A/cm2) operation and after 2 h CC operation, revealing the formation of γ-NiOOH after CC operation.
The structural change to NiOOH is well known, particularly through Bode’s scheme (Figure 5) of Ni(OH)2, which has been used in a variety of electrochemical fields [42]. α-Ni(OH)2/γ-NiOOH couple and β-Ni(OH)2/β-NiOOH couple could redox in each phase reversibly. Although NiOOH is known to return to the corresponding Ni(OH)2 phase or NiO phase at the resting potential [13,24,25,26], studies have reported that γ-NiOOH partially maintains the γ-NiOOH phase without completely returning to the original phase at the resting potential [41,43]. β-NiOOH can transform into γ-NiOOH through overcharging.
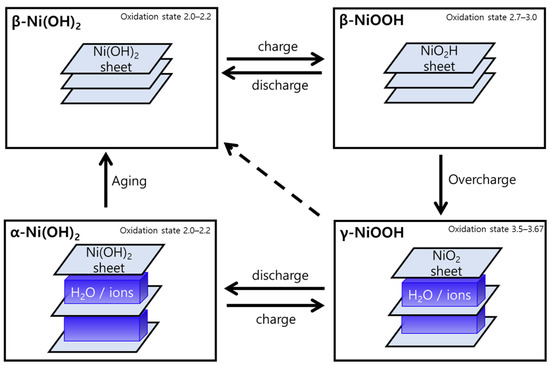
Figure 5.
Bode’s scheme expresses the Ni(OH)2/NiOOH redox transformation [44].
In the Raman analysis results in Figure 4, the formation of the γ-NiOOH phase after the CC operation is considered to occur because NiO transforms to the NiOOH phase, and some γ-NiOOH phase does not return to the original NiO structure. The XRD results indicate that most of the NiO phase transformed after the reaction returned to the original phase. However, some NiO may have formed the Ni(OH)2 phase path through the NiOOH phase. Trotochaud et al. suggested that thermally prepared oxides may change to the Ni(OH)2/NiOOH phase after electrochemical pretreatment. Therefore, when the oxidized NiOOH phase returns to the resting potential, most NiOOH transforms to the NiO phase, but some γ-NiOOH phase is maintained; here, it is estimated that some NiOOH can transform to Ni(OH)2. Carrasco explained that increasing the interlayer spacing in layered NiFe-LDH (having a similar structure to Ni(OH)2 and NiOOH) increases the electrochemical surface area (ECSA) [45]. Similarly, in Figure S3, the increase in double layer capacitance as the Ni(5)-400 °C electrode undergoes OER may be attributed to NiO with a rock salt structure forming Ni(OH)2 with a layered structure, thus exposing more of its surface.
2.2.2. Influence of Iron Impurities on Nickel Oxide-Electrode
In the CV graph shown in Figure 3, as OER progresses, the oxidation peak of Ni shifts slightly toward the positive potential direction. This phenomenon occurs when Fe impurities in the KOH electrolyte solution enter the Ni lattice and transform the bulk electronic structure [26]. The impregnated Fe can improve the activity of the Ni electrode. To confirm the contribution of Fe impurities to the improvement of the OER activity of the Ni(5)-400 °C electrode, we prepared a Fe-purified KOH solution. Subsequently, we observed the activity change of the Ni(5)-400 °C electrode as OER CC operation progressed in the Fe-purified KOH solution, as shown in Figure 6. Table 2 shows the ICP-OES results of KOH treated to remove Fe and the untreated KOH. Before removing Fe, the KOH solution contained 40 ppb of Fe, and after removal, it contained an amount smaller than the detection limit (approximately 10 pbb).
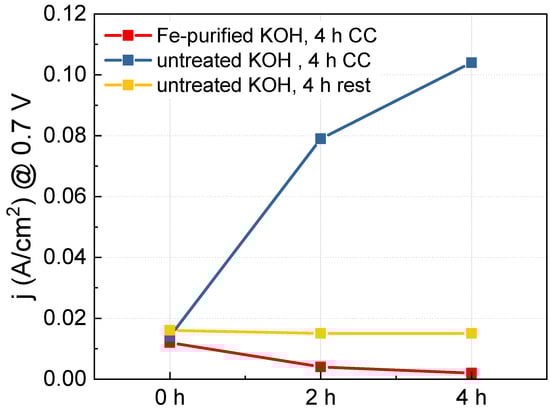
Figure 6.
Current density measurements at 0.7 V of the Ni(5)-400 °C electrodes performed using high purity Ni precursor with different operation conditions: 4 h CC (1.5 A/cm2) operation in purified KOH (red), 4 h CC operation in untreated KOH (blue), 4 h rest in untreated KOH (yellow).
Table 2.
Fe traces analyzed by ICP-OES.
Using the Fe-purified and untreated KOH solutions as electrolytes the activity when CC was applied and not applied to a Ni(5)-400 °C electrode prepared using high-purity Ni(NO3)2 6H2O reagent (Ni = 99.9985% (metal bias), Thermo Scientific)was measured. The results are shown in Figure S4; Figure 6 shows the current density at 0.7 V over the CC operation time. For the untreated KOH solution, the activity of the Ni(5)-400 °C electrode rapidly increased as the CC operation progressed (indicated in blue), whereas, for the Fe-purified KOH solution, the activity of Ni(5)-400 °C electrode gradually decreased as OER progressed (indicated in red). This demonstrates that Fe impregnation plays a key role in enhancing the OER activity of Ni(5)-400 °C electrode at high-current densities, and that the structural change of the NiO electrode itself does not contribute to the enhancement of electrode activity.
However, in the Ni(5)-400 °C electrode with a NiO structure, the activity increase by Fe does not spontaneously occur without any manipulation. After the first I–V curve measurement, there was almost no change in activity when left at a resting state instead of applying a CC of 1.5 A/cm2 (indicated in yellow). This is considered to be because Fe is not properly impregnated if a NiO structural change does not occur by applying current. According to the calculations of Zhou et al., when water is impregnated between the layers under OER conditions to form an exfoliated gel-like NiOOH, Fe2+ and Fe3+ ions flow into the layer, and the aquo-iron complex can be fixed by condensation with hydroxyl groups on the surface or in the layer [35].
To investigate the relationship between activity improvement and surface crystal structure, CC was applied for 2 h to the Ni(5)-400 °C and Ni(5)-200 °C electrodes, which have a NiO and Ni(OH)2 electrode surfaces, respectively. Then, 150 CV cycles were performed before and after the reaction, and the changes in the oxidation peak over time were observed and are displayed in Figure 7.
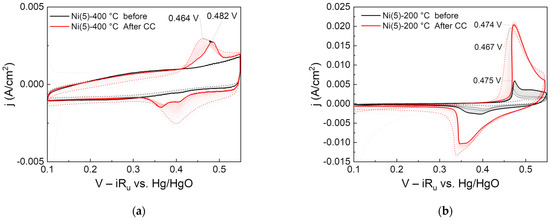
Figure 7.
Cyclic voltammograms of (a) Ni(5)-400 °C and (b) Ni(5)-200 °C: 150 CV cycles each were performed before (indicated as black line) and after (indicated as red line) 2 h CC (100 mA/cm2) operation. Dotted and emboldened lines are for the 2nd and last CV cycle, respectively.
The Ni oxidation peak of the °C electrode did not increase or shift even after repeated CV cycles before CC operation. However, the oxidation peak of the Ni(5)-400 °C electrode shifted in the direction of 20 mV positive potential compared with initially repeated CV cycles after 2 h of CC operation. The anodic shift that occurs when Fe is contained in the Ni electrode is positively correlated with the Fe content. In a study by Louie et al., in a NiFe electrode prepared through the electro-deposition, the Ni oxidation peak linearly increased from 420 to 600 mV as the Fe content changed from 0 to 100% [26]. This suggests that the Ni(5)-400 °C electrode was not impregnated with Fe before the CC operation but was impregnated with Fe after the CC operation.
Moreover, in the Ni(5)-200 °C electrode, the Ni oxidation peak changed during the repeated CV cycles performed before CC operation, and the peak at the last cycle was located at 0.475 mV vs. Hg/HgO. After the CC operation, this peak slightly shifted in the negative potential direction. However, as CV was subsequently repeated, the peak slightly increased again in the positive potential direction and returned to the same peak position before the CC operation. This indicates that, unlike the NiO-based Ni(5)-400 °C electrode, Fe can be impregnated without additional electrochemical pretreatment, which is consistent with the claim of Trotochaud et al. that Fe impregnation in Ni(OH)2 can occur even at the resting potential [25].
Accordingly, Fe impregnation is considered to be more favorable for Ni(OH)2 and NiOOH with a layered structure than NiO with a rock salt structure. The high initial activity of the Ni(5)-200 °C electrode with a Ni(OH)2 surface is considered to be because the Fe relatively easily penetrated into the layered Ni(OH)2 and improved the activity. In contrast, the Ni(5)-400 °C electrode, which had a NiO surface before CC operation, had low initial activity because Fe penetration was difficult. However, γ-NiOOH and Ni(OH)2 with wide interlayer spacing were formed through CC operation, thus facilitating the penetration of Fe and greatly increasing the activity.
As shown in the CV results of Figure 7a, after the constant current operation, the reduction peak of the Ni(5)-400 °C electrode shows two distinct, widening peaks. Stevens et al. explained that the phenomenon of two peaks occurs because Fe was not uniformly distributed in the bulk catalyst during CC operation [46]. This is consistent with studies arguing that when Fe is impregnated in NiOOH during OER, it is first deposited at the edge site, and further impregnates through bulk Ni [27,46,47]. It is important to note that because the intensity, potential, and shape of the reduction peaks of actual Ni-based OER electrodes vary with the fabrication method of the electrode, hysteresis, and the experimental conditions [12,25,46,48], it is difficult to conduct a one-to-one analysis between the shape or peak position and the Fe content or electrode structure [25]. Furthermore, as shown in Figure 6, the activity of the Ni(5)-400 °C electrode, prepared using a high-purity Ni precursor, gradually decreased as the CC operation progressed in the Fe-purified solution. Therefore, the analysis results shown in Figure 2 and Figure 3, where the activity of Ni(5)-400 °C electrode activity improved and the CV peak area increased as the CC operation progressed, were greatly influenced by Fe.
2.3. Reaction Characteristics of Nickel-Iron Oxide Electrodes
To prepare an electrode catalyst with high OER activity, a Ni-Fe-oxide electrode was prepared with impregnated Fe under a heat treatment condition of 400 °C, which provides higher durability. To identify the influence of the Ni-coating and Fe-impregnation solution concentrations on activity, one other concentration was fixed and optimized in each condition. Table 3 and Table 4 show the electrode names according to each metal’s contents in the Ni-coating and Fe-impregnation solution.
Table 3.
Nomenclature of various NiFe electrodes varying with Ni contents.
Table 4.
Nomenclature of various NiFe electrodes varying with Fe contents.
2.3.1. Phase and OER Characteristics of Nickel-Iron Oxide Electrodes
We performed physicochemical analyses on Ni(50)/Ni(5)-400 °C electrodes to confirm the phase of iron in the nickel-iron oxide electrodes. According to the SEM-EDS(Energy-dispersive X-ray spectroscopy) analysis results shown in Figure S5 Fe did not remain only on the surface of the catalyst particles but also penetrated inside the grain. In Figure S5, the cross-sectional image of the electrode catalyst appears as if a grain of Ni-Fe oxide is lumped together; however, as can be observed, in the BSE image shown in Figure S6, it is actually a structure in which several layers of plate-like structures are united. Through the SEM-EDS analysis results, the Fe atomic ratio on the surface was confirmed to be 5.2% (metal basis). However, according to the XRD analysis results of Fe(50)/Ni(5)-400 °C shown in Figures S7 and S8 besides from the peaks of the Ni substrate and NiO electrode material, independent Fe-related crystal peaks did not appear, and only Ni and NiO crystal peaks were observed similar to that for Ni(5)-400 °C. Dong et al. interpreted this phenomenon as Fe substituting the lattice of Ni while maintaining the NiO crystal structure and not forming separate crystals [30,49].
In Figure 8, the peaks corresponding to the intercalated carbonate (1069 cm−1) and the O–H bending mode (1641 cm−1) of H2O barely change their positions, whereas the peak at 500 cm−1 corresponding to the Ni–O lattice mode is blue-shifted to a peak position of 536 cm−1 in the Fe(50)/Ni(5)-400 °C electrode. In Raman spectroscopy, a blue shift occurs when the average bond length contracts. The same effect can be observed in Fe-doped Ni electrodes [30,43]. While the presence of Fe can be confirmed via SEM-EDS, an independent crystal structure containing Fe cannot be confirmed through XRD. Because the Raman peak corresponding to the Ni–O lattice was blue-shifted, most Fe in the Fe(50)/Ni(5)-400 °C electrode before OER is considered to occupy the Ni sites in the Ni–O lattice.
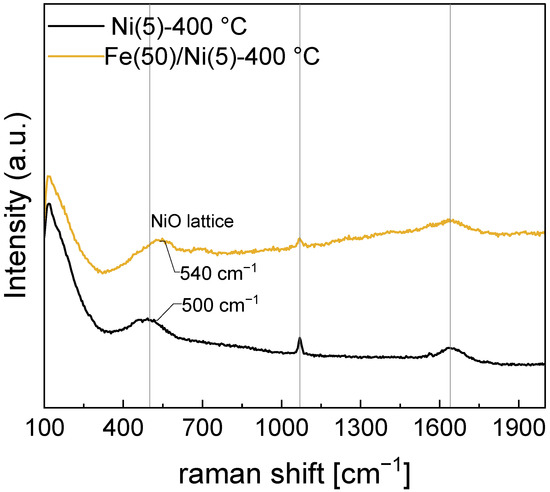
Figure 8.
Raman spectra of the Ni(5)-400 °C and Fe(50)/Ni(5)-400 °C. Blue shift of the NiO-lattice mode is due to the contraction of the bond length.
2.3.2. Relationship between Coating Solution Nickel Concentration and Nickel-Iron Oxide Electrode Activity
To evaluate the performance of the NiFe-oxide electrode according to the precursor solution concentration, we fixed the Fe solution concentration and varied the Ni solution concentration as shown in Table 3. The Fe(50)/Ni(5)-400 °C electrode was also subjected to CC operation at a high current density (1.5 A/cm2), identical to that for the Ni(5)400 electrode. The changes in the I-V curve and electrochemical impedance spectroscopy (EIS) during CC operation are shown in Figure S9 and Table S2 along with the equivalent circuit. No Raman peak shift occurred after the operation (Figure S10). Similar to the Ni(5)-400 °C electrode, the Fe(50)/Ni(5)-400 °C electrode showed enhanced activity after CC operation; therefore, when evaluating the activity of Ni(5)-400 °C and the derivative electrodes, evaluating the activity after electrochemical pretreatment is reasonable. Thus, the activity after a total 4 h CC operation was used to compare the activity and electrochemical analysis results of the NiFe-oxide electrodes prepared under various synthesis conditions.
The Fe(50)/Ni(x)-400 °C electrode prepared by heat treatment at 400 °C was analyzed via SEM to measure the thickness and OER activity, as shown in Figure 9. As the Ni coating solution concentration increased, the thickness of the coating layer increased, and the activity increased and then decreased. The OER activity was the highest at η = 0.287 V for the Fe(50)/Ni(5)-400 °C electrode, at which the catalyst layer thickness was 9.02 μm.
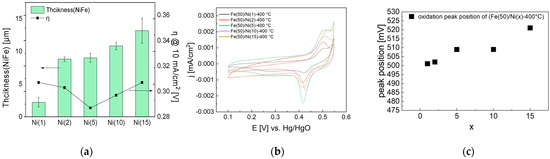
Figure 9.
Electrochemical analysis of NiFe-oxide electrodes varying with respect to Ni coating concentration: (a) Thickness of NiFe-oxide layers shown with overpotential at 10 mA/cm2 after 4 h CC (1.5 A/cm2) operation, (b) CV cycles of NiFe-oxide electrodes after 4 h CC operation and (c) CV oxidation peak position after 4 h CC operation. Because the thickness is uneven, thickness at three different points was measured and averaged.
Furthermore, the CV graph in Figure 9 demonstrates that as the Ni coating layer concentration increased, the oxidation peak shifted to a positive potential, indicating the increased Fe content. The Ni solution concentration might affect the increase in the Fe content during the impregnation process; more Fe can be accommodated as the porous Ni(OH)2 coating layer becomes thicker with the increasing Ni concentration. However, the activity decreased once the coating-layer thickness exceeded a certain level. This is presumed to be because the effect of the thick coating layer impeding mass transfer is greater than the effect of increasing the activity by increasing the Fe content.
2.3.3. Relation between Loading Solution Iron Concentration and Nickel Iron-Oxide Electrode Activity
Based on the optimal coating solution concentration with the best activity in the previous step, we prepared Fe(y)/Ni(5)-400 °C electrodes with varying Fe impregnation solution concentrations. The overpotential at 10 mA/cm2 and the surface Fe atomic ratio after a 4 h of CC operation are shown in Figure 10.
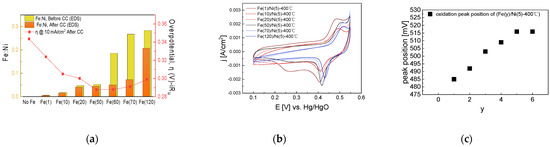
Figure 10.
Electrochemical analysis of NiFe-oxide electrodes varying with Fe impregnation concentration: (a) Fe ratio measured with SEM-EDS, shown with overpotential at 10 mA/cm2 after 4 h CC (1.5 A/cm2) operation, (b) CV cycles of NiFe-oxide electrodes after 4 h CC operation. (c) CV oxidation peak position after 4 h CC operation. The reduced Fe content after CC operation may be due to the resolution and re-deposition of Fe.
As shown in Figure 10, as the Fe impregnation solution concentration increases, surface Fe content increases, while the OER activity increases and then decreases. This trend can also be confirmed in Figure S11, which compares EIS based on Fe concentration. As the Fe concentration increases, the diameter of the semicircle in the Nyquist plot decreases and then increases. Freibel et al. also reported a decrease in the activity with increasing Fe content. They explained that in a NiFe electrode, when the Fe content is low, many active sites are present and the NiOOH host is rich, but as the Fe content increases, γ-FeOOH with lower activity occupies a larger proportion of the surface and the activity decreases.
The oxidation peak trend in the CV graph implies the formation of an isolated Fe phase that cannot replace the Ni lattice. In an electrode having of a structure where Fe is well-dispersed in bulk Ni, as the Fe content increases, the electron structure of Ni is affected by Fe, and the oxidation peak gradually increases. However, as shown in Figure 10a, the surface Fe content increases as the Fe impregnation solution concentration increases, whereas, as shown in the CV graph of Figure 10b, as the Fe impregnation solution concentration increases, the oxidation peak shifts towards the positive potential direction and then does not shift any further. Although the amount of Fe accumulated on the electrode surface increases as the Fe impregnation solution concentration increases, Fe could no longer replace the Ni lattice; therefore, the Ni bulk electronic structure did not change as well.
Hence, we assumed that when the Fe concentration is low, Fe is added to the Ni edge and bulk site as the Fe content increases, thus changing the bulk electronic structure. However, when the Fe concentration is high, the sites where Fe can be added become saturated, and an isolated phase forms on the surface, thus reducing activity.
The Tafel slopes of the Fe(x)/Ni(y)-400 °C and the Ni(5)-400 °C electrodes were calculated and are shown in Figure S12. The Ni(5)-400 °C electrode without Fe added showed the lowest activity with a Tafel slope of 56 mV dec−1. The Fe(50)/Ni(5)-400 electrode showed the highest activity with a low Tafel slope of 37 mV dec−1, confirming that the activity was successfully enhanced by Fe.
3. Materials and Methods
3.1. Electrode Preparation
In this study, we synthesized Ni(OH)2 with a plate structure on a Ni substrate, and then heat treated the synthesized electrode or first impregnated it with Fe before heat treatment to prepare the Ni and Ni-Fe electrodes, respectively.
3.1.1. Pretreatment
Sandblasted Ni plate substrates with a diameter of 20 mm and thickness of 0.6 mm were sonicated in distilled water for 60 min to remove foreign substances on the surface, and then washed with distilled water and dried.
3.1.2. Synthesis of (hydr)Oxide Electrodes
To synthesize Ni(OH)2 on the Ni coin substrate, a synthetic cylinder containing the Ni coin and Ni coating solution was placed in an oven preheated to 90 °C and aged for 48 h. The aged electrode was then washed with distilled water and dried in an oven to remove residual foreign substances. For the Ni coating solution, a certain amount of Ni(NO3)2·6H2O (97%, Daejung Chemicals & Metals Co., Siheung-si, Korea) was mixed in 80 mL of NH3 (28.0–30.0 wt.%, Junsei Chemical Co. Tokyo, Japan) aqueous solution and 20 mL of deionized water to prepare the Ni(OH)2 electrodes.
3.1.3. Heat Treatment
The uncalcined Ni(OH)2 electrodes were heated to the target temperature at a heating rate of 2 °C/min within a calcining furnace in a stagnant air atmosphere and calcined at a constant temperature for 2 h. After calcination, the electrodes were slowly cooled in the air.
3.1.4. Fe Impregnation and Heat Treatment
Fe was impregnated to improve the OER performance of the electrode. Impregnation was performed by repeatedly immersing and drying the uncalcined Ni(OH)2 electrodes. Immersing was conducted for 10 min so that the electrodes are fully soaked. The additional solution residues on the surface were removed and electrodes were dried in an oven preheated to 90 °C for 30 min to evaporate solvents. For heat treatment, after repeating impregnation and drying three times, they were heated to 400 °C at a heating rate of 2 °C/min within a calcining furnace in a stagnant air atmosphere, and then maintained at that temperature for 2 h. After heat treatment, the electrodes were gradually cooled to prepare the NiFe oxide electrodes. To prepare the impregnation solutions, Fe(NO3)2·9H2O (98%, Daejung Chemicals & Metals Co., Siheung-si, Korea) was diluted in deionized water as a precursor, and to determine the optimal activity, various concentrations were prepared according to different conditions.
3.2. Purification of KOH Solution
Because we supposed that Fe impurities in the electrolyte impacted the OER activity of the electrode, we attempted to prepare KOH solutions in which Fe impurities were removed. Adopting the procedure of L.Trotochaud, the process of removing Fe impurities from the KOH solution was conducted in two main steps; preparing high-purity Ni(OH)2 and treating the KOH solution using the high-purity Ni(OH)2 [25].
To prepare the high-purity Ni(OH)2, 2 g of Ni(NO3)2 6H2O (99.998%) and 4 mL deionized water were mixed in a polypropylene (PP) centrifuge tube. Then, 20 mL of 1 M KOH was mixed and mechanically stirred to disperse the precipitate. After completing dispersion, the mixture was centrifuged, and the supernatant was discarded. Subsequently, 20 mL of distilled water and 2 mL of 1 M KOH solution were added to the remaining solid precipitate, and the solid was dispersed, centrifuged, and then washed three times. Washed high-purity Ni(OH)2 was used for the KOH solution treatment.
To treat the KOH electrolyte, the pure Ni(OH)2 prepared from 2 g of Ni(NO3)2 6H2O was mixed with 50 mL of 1 M KOH and dispersed via mechanical stirring for at least 10 min. The dispersed solution was decanted for at least 3 h, after which it was centrifuged to remove the precipitate, and the supernatant was used as the Fe-purified KOH solution.
3.3. Analysis of Physicochemical Properties
SEM (Regulus 8220, Hitachi, Tokyo, Japan) analysis was performed to examine the surface morphology of the synthesized electrodes and the changes after the reaction. EDS (ULTIM MAX, Oxford Instruments, Oxfordshire, UK) was performed to confirm the presence and distribution of iron components. To confirm the coating layer phase according to temperature and changes in the crystal structure according to OER, an XRD (Smart Lab High Temp/Smart Lab High Resolution, Rigaku, Tokyo, Japan) analysis was conducted using Cu kα (1.5406 Å) radiation under conditions of 45 kV and 200 mA. Raman spectroscopy (RAMANFORCE, Nanophoton, Osaka, Japan) was conducted to examine the electrode surface phase, which is difficult to confirm via XRD.
3.4. Analysis of Electrochemical Properties
For the electrochemical analysis including EIS, LSV, CV, and CC, a potentiostat (ZIVE SP2, WonAtech, Seoul, Korea) was used to analyze the OER characteristics of electrodes composed of a Pt counter electrode and Hg/HgO reference electrode (Hg/HgO, RE 61AP, ALS Co. Ltd, Tokyo, Japan) in a three-electrode cell. All voltages in this study were written based on the voltage of the Hg/HgO electrode.
The performance was evaluated in 500 mL of 1 M KOH at 25 °C in the order of OCP, EIS, and LSV. EIS was conducted in the frequency range of 100 kHz–30 mHz with an amplitude of 10.0 mV based on 580 mV, the starting point of OER. The solution resistance of LSV and CV was compensated by the solution resistance obtained from EIS. LSV was conducted to evaluate the electrochemical activity of the catalyst, which was measured from 200 to 800 mV at a scan rate of 0.2 mV/s. CV was performed in the Faraday region to investigate the redox characteristics and in the non-Faraday region to measure the double-layer capacitance. The measurements in the Faraday region were performed at a scan rate of 1 mV/s from 100 to 550 mV. For the analysis in the non-Faraday region, the charging current was measured while varying the CV scan rate from 20 to 100 mV/s at intervals of 20 mV/s in the range of 300–400 mV. Referring to the measurement method proposed by Charles, the potential was maintained for 1 min at each potential peak during CV to measure Cdl [34]. To identify the effects of harsh operating conditions on the electrodes and select electrodes having low degradation tendencies, we applied 1.5 A/cm2 of CC for 30 h or for 4 h at 2 h increments, and then compared the LSV and CV curves before and after the reaction.
4. Conclusions
In this study, we synthesized plate-type Ni(OH)2 electrodes via basification and identified the influence of Fe impurities in a KOH electrolyte on the activity of Ni oxide and hydroxide electrodes. We then prepared NiFe oxide electrodes impregnated with Fe and observed the influence of the Ni-coating and Fe-impregnation solution concentrations on the electrode activity. In future studies, various substrates, hydroxide synthesis conditions, and impregnation conditions could be investigated to prepare effective OER catalysts.
(1). According to the performance evaluation results at a high-current density, surface structure destruction, and decreased activity were observed in the heat-treated electrodes at 200 °C, whereas the heat-treated electrodes at 400 °C maintained the surface structure and showed increased activity. These findings indicate that 400 °C is a more suitable heat-treatment temperature for high-current, long-term OER operation than 200 °C.
(2). Activity improvement by Fe impregnation easily occurred on the γ-NiOOH surface of Ni(5)-400 °C after the reaction and Ni(5)-200 °C with a Ni(OH)2 surface but did not easily occur in Ni(5)-400 °C with a NiO surface. Hence, improving activity by Fe impregnation is favorable for Ni(OH)2 and γ-NiOOH with a layered structure, but unfavorable for NiO with a rock salt structure.
(3). Fe(50)/Ni(x)-400 °C (x = 1, 2, 5, 10, 15) electrodes were prepared by varying the concentration of the Ni coating solution. As the Ni coating solution concentration increased, the electrode coating layer grew thicker. The thickness indirectly caused the Fe content to increase. Simultaneously, the electrode activity tended to increase and then decrease. At low coating solution concentrations, the improvement in activity by increasing the Fe content was dominant, whereas, at high coating solution concentrations, thickness limited the mass transfer and charge transfer, which had a significant effect on the reducing activity.
(4). Fe(y)/Ni(5)-400 °C (y = 1, 10, 20, 60, 120) electrodes were prepared by varying the concentration of the Fe impregnation solution. The Fe content on the electrode surface increased as the Fe impregnation solution concentration increased. As the Fe content increased, the Ni oxidation peak gradually shifted towards the positive direction; however, the increment gradually became smaller, indicating that the extent of Fe replacing the Ni lattice decreased. Although Fe extensively replaced the Ni lattice and improved the activity, at high impregnation solution concentrations, a considerable amount of Fe could not replace the Ni lattice and existed as an isolated phase on the surface, thus reducing the activity. The Fe(50)/Ni(5)-400 °C electrode exhibited the lowest overpotential of 287 mV at a current density of 10 mA/cm2, thus demonstrating a high OER activity.
Supplementary Materials
The following supporting information can be downloaded at: https://www.mdpi.com/article/10.3390/catal13030496/s1, Figure S1. Stacked in-situ XRD patterns for coating material under air atmosphere with temperature ranges of 100 °C–500 °C. In the range of 25 °C–100 °C, the heating rate was 10 °C/min; it was 2 °C /min for a temperature range of 100 °C–500 °C. XRD was conducted at 2θ = 5°–90°range, scan rate = 2°/min, and step size = 0.02. A peak corresponding to the (001), (100), (101) plane of β-Ni(OH)2 at 2θ = 19.26°, 33.06°, and 38.54° (JCPDS. 14-0117) appears between 25 °C and 350 °C. At 350 °C, peaks of the (111), (200), (220) plane of NiO appears at 2θ = 37.16°, 43.18°, and 62.7° (JCPDS. 79-7390) while the peak of β-Ni(OH)2 is reducing. XRD peaks of NiO remain almost the same after additional heating and following cooling. Figure S2. SEM images of Nickel-hydroxide electrodes under various calcination conditions. Figure S3. Cdl varying with operation time of (a) Ni(5)-200 °C (b) Ni(5)-400 °C, and (c) comparison of the double-layer capacitance (Cdl) of the Ni(5)-400 °C Ni(5)-200 °C electrode. Table S1. Changes in the CV peak area of Ni(5)-400 °C and corresponding apparent coverage of the Ni site. Figure S4. I–V and CV curves taken before CC and after 2 h and 4 h CC in various conditions. Measured Ni(5)-400 °C electrodes were prepared with high-purity Ni precursor to avoid any Fe trace in the electrode. Different colors were assigned to each condition; CC operation in purified KOH solution (indicated in red color), CC operation in unpurified KOH solution (indicated in blue color), and CC operation in unpurified KOH solution, which did not undergo CC operation (indicated in yellow color). Figure S5. Cross-section SEM-EDS image of the Fe(50)/Ni(5)-400 °C electrode prepared with epoxy molding followed by polishing. Observed with a magnification of ×10.0 k. Figure S6. Cross-section SEM image (left) and BSE image (right) of the Fe(50)/Ni(5)-400 °C electrode prepared with epoxy molding followed by polishing. Figure S7. XRD diffraction pattern of Ni(5)-400 °C and Fe(50)/Ni(5)-400 °C electrodes with a scan rate of 2 °/min. The Ni(JCPDS. 04-0850) and NiO (JCPDS. 89-7390) reference pattern was superimposed. XRD patterns of the Fe(50)/Ni(5)-400 °C electrode have slightly lower NiO peaks. Any other peak cannot be observed. Figure S8. XRD diffraction pattern of the Fe(50)/Ni(5)-400 °C electrode before reaction and after CC (1.5 A/cm2 in 25 °C1 M KOH) reaction with a scan rate of 2°/min. Figure S9. (a) I–V curves of Fe(50)/Ni(5)-400 °C with a scan rate of 0.2 mV/s. (b) EIS spectra of Fe(50)/Ni(5)-400 °C at a bias potential of 560 mV, measured before and after CC (1.5 A/cm2) operation. Table S2. Simulated parameters of the elements in the equivalent circuits for OER of Fe(50)/Ni(5)-400 °C. Figure S10. Raman spectroscopy of the Fe(50)/Ni(5)-400 °C electrode before reaction and after CC (1.5 A/cm2 in 25 °C1 M KOH) reaction with 532 nm excitation. Figure S11. EIS spectra of Fe(y)/Ni(5)-400 °C (y = 1, 10, 20, 50, 60, 70, 120) at a bias potential of 560 mV, measured before and after CC (1.5 A/cm2) operation. Figure S12. Tafel slope of 400 °C-calcined electrodes obtained after 4 h of OER CC (1.5 A/cm2) operation. Reference [50] is cited in the supplementary materials.
Author Contributions
Conceptualization, T.-H.K. and K.-S.K.; Data curation, T.-H.K. and K.-S.K.; Funding acquisition, K.-Y.K.; Investigation, T.-H.K.; Methodology, K.-S.K. and K.-Y.K.; Project administration, K.-S.K. and K.-Y.K.; Supervision, C.-S.P., K.-Y.K., S.-U.J., Y.-H.K., J.-E.K., S.-H.L. and K.-S.K.; Validation, K.-Y.K. and K.-S.K.; Writing—original draft, T.-H.K.; Writing—review and editing, T.-H.K., Y.-H.K. and K.-S.K. All authors have read and agreed to the published version of the manuscript.
Funding
This research was funded by the Korea Hydro & Nuclear Power Co., Ltd. (KHNP), grant number G20IO12.
Data Availability Statement
The data presented in this study are available in the article and supplementary material.
Conflicts of Interest
The authors declare no conflict of interest.
References
- IRENA. Renewable Energy Statistics 2022; The International Renewable Energy Agency: Masdar City, United Arab Emirates, 2022. [Google Scholar]
- Yang, L.; Hu, Z.; Xie, S.; Kong, S.; Lin, W. Adjustable Virtual Inertia Control of Supercapacitors in PV-Based AC Microgrid Cluster. Electr. Power Syst. Res. 2019, 173, 71–85. [Google Scholar] [CrossRef]
- David, M.; Ocampo-martínez, C.; Sánchez-peña, R. Advances in Alkaline Water Electrolyzers: A Review. J. Energy Storage 2019, 23, 392–403. [Google Scholar] [CrossRef]
- Yue, M.; Lambert, H.; Pahon, E.; Roche, R.; Jemei, S.; Hissel, D. Hydrogen Energy Systems: A Critical Review of Technologies, Applications, Trends and Challenges. Renew. Sustain. Energy Rev. 2021, 146, 111180. [Google Scholar] [CrossRef]
- Singh, T.I.; Rajeshkhanna, G.; Pan, U.N.; Kshetri, T.; Lin, H.; Kim, N.H.; Lee, J.H. Alkaline Water Splitting Enhancement by MOF-Derived Fe–Co–Oxide/Co@NC-MNS Heterostructure: Boosting OER and HER through Defect Engineering and In Situ Oxidation. Small 2021, 17, 2101312. [Google Scholar] [CrossRef]
- Li, X.; Kou, Z.; Xi, S.; Zang, W.; Yang, T.; Zhang, L.; Wang, J. Porous NiCo2S4/FeOOH Nanowire Arrays with Rich Sulfide/Hydroxide Interfaces Enable High OER Activity. Nano Energy 2020, 78, 105230. [Google Scholar] [CrossRef]
- Trotochaud, L.; Ranney, J.K.; Williams, K.N.; Boettcher, S.W. Solution-Cast Metal Oxide Thin Film Electrocatalysts for Oxygen Evolution. J. Am. Chem. Soc. 2012, 134, 17253–17261. [Google Scholar] [CrossRef]
- Subbaraman, R.; Tripkovic, D.; Chang, K.C.; Strmcnik, D.; Paulikas, A.P.; Hirunsit, P.; Chan, M.; Greeley, J.; Stamenkovic, V.; Markovic, N.M. Trends in Activity for the Water Electrolyser Reactions on 3d M(Ni,Co,Fe,Mn) Hydr(Oxy)Oxide Catalysts. Nat. Mater. 2012, 11, 550–557. [Google Scholar] [CrossRef]
- Babar, P.T.; Lokhande, A.C.; Gang, M.G.; Pawar, B.S.; Pawar, S.M.; Kim, J.H. Thermally Oxidized Porous NiO as an Efficient Oxygen Evolution Reaction (OER) Electrocatalyst for Electrochemical Water Splitting Application. J. Ind. Eng. Chem. 2018, 60, 493–497. [Google Scholar] [CrossRef]
- Tao, S.; Wen, Q.; Jaegermann, W.; Kaiser, B. Formation of Highly Active NiO(OH) Thin Films from Electrochemically Deposited Ni(OH)2 by a Simple Thermal Treatment at a Moderate Temperature: A Combined Electrochemical and Surface Science Investigation. ACS Catal. 2022, 12, 1508–1519. [Google Scholar] [CrossRef]
- Stern, L.A.; Hu, X. Enhanced Oxygen Evolution Activity by NiOx and Ni(OH)2 Nanoparticles. Faraday Discuss. 2014, 176, 363–379. [Google Scholar] [CrossRef]
- Corrigan, D.A.; Maheswari, S.P. The Catalysis of the Oxygen Evolution Reaction by Iron Impurities in Thin Film Nickel Oxide Electrodes. Electrochem. Soc. Ext. Abstr. 1985, 134, 377–384. [Google Scholar] [CrossRef]
- Liu, X.; Zhai, Z.Y.; Chen, Z.; Zhang, L.Z.; Zhao, X.F.; Si, F.Z.; Li, J.H. Engineering Mesoporous NiO with Enriched Electrophilic Ni3+ and O− toward Efficient Oxygen Evolution. Catalysts 2018, 8, 310. [Google Scholar] [CrossRef]
- Wu, Y.J.; Yang, J.; Tu, T.X.; Li, W.Q.; Zhang, P.F.; Zhou, Y.; Li, J.F.; Li, J.T.; Sun, S.G. Evolution of Cationic Vacancy Defects: A Motif for Surface Restructuration of OER Precatalyst. Angew. Chem. Int. Ed. 2021, 60, 26829–26836. [Google Scholar] [CrossRef] [PubMed]
- Obradović, M.D.; Gojković, S.L. Challenges in Determining the Electrochemically Active Surface Area of Ni–Oxides in the Oxygen Evolution Reaction. J. Electroanal. Chem. 2022, 918, 116479. [Google Scholar] [CrossRef]
- Gund, G.S.; Dubal, D.P.; Jambure, S.B.; Shinde, S.S.; Lokhande, C.D. Temperature Influence on Morphological Progress of Ni(OH)2 Thin Films and Its Subsequent Effect on Electrochemical Supercapacitive Properties. J. Mater. Chem. A Mater. 2013, 1, 4793–4803. [Google Scholar] [CrossRef]
- Klaus, S.; Cai, Y.; Louie, M.W.; Trotochaud, L.; Bell, A.T. Effects of Fe Electrolyte Impurities on Ni(OH)2/NiOOH Structure and Oxygen Evolution Activity. J. Phys. Chem. C 2015, 119, 7243–7254. [Google Scholar] [CrossRef]
- Chen, J.Y.C.; Dang, L.; Liang, H.; Bi, W.; Gerken, J.B.; Jin, S.; Alp, E.E.; Stahl, S.S. Operando Analysis of NiFe and Fe Oxyhydroxide Electrocatalysts for Water Oxidation: Detection of Fe4+ by Mössbauer Spectroscopy. J. Am. Chem. Soc. 2015, 137, 15090–15093. [Google Scholar] [CrossRef] [PubMed]
- Sengupta, D.; Privitera, S.M.S.; Milazzo, R.G.; Bongiorno, C.; Scalese, S.; Lombardo, S. Ni Foam Electrode Solution Impregnated with Ni-FeX(OH)Y Catalysts for Efficient Oxygen Evolution Reaction in Alkaline Electrolyzers. RSC Adv. 2020, 10, 25426–25434. [Google Scholar] [CrossRef] [PubMed]
- Lee, S.H.; Kim, J.E.; Joo, H.; Park, C.S.; Jeong, S.U.; Jung, K.; Kim, Y.H.; Kang, K.S. Effect of Plating Variables on Oxygen Evolution Reaction of Ni–Zn–Fe Electrodes for Alkaline Water Electrolysis. Catalysts 2022, 12, 346. [Google Scholar] [CrossRef]
- Chen, J.; Zheng, F.; Zhang, S.J.; Fisher, A.; Zhou, Y.; Wang, Z.; Li, Y.; Xu, B.B.; Li, J.T.; Sun, S.G. Interfacial Interaction between FeOOH and Ni-Fe LDH to Modulate the Local Electronic Structure for Enhanced OER Electrocatalysis. ACS Catal. 2018, 8, 11342–11351. [Google Scholar] [CrossRef]
- Liu, C.; Han, Y.; Yao, L.; Liang, L.; He, J.; Hao, Q.; Zhang, J.; Li, Y.; Liu, H. Engineering Bimetallic NiFe-Based Hydroxides/Selenides Heterostructure Nanosheet Arrays for Highly-Efficient Oxygen Evolution Reaction. Small 2021, 17, 2007334. [Google Scholar] [CrossRef] [PubMed]
- Gong, M.; Dai, H. A Mini Review of NiFe-Based Materials as Highly Active Oxygen Evolution Reaction Electrocatalysts. Nano Res. 2015, 8, 23–39. [Google Scholar] [CrossRef]
- Lee, S.Y.; Kim, I.S.; Cho, H.S.; Kim, C.H.; Lee, Y.K. Resolving Potential-Dependent Degradation of Electrodeposited Ni(OH)2 Catalysts in Alkaline Oxygen Evolution Reaction (OER): In Situ XANES Studies. Appl. Catal. B Environ. 2021, 284, 119729. [Google Scholar] [CrossRef]
- Trotochaud, L.; Young, S.L.; Ranney, J.K.; Boettcher, S.W. Nickel-Iron Oxyhydroxide Oxygen-Evolution Electrocatalysts: The Role of Intentional and Incidental Iron Incorporation. J. Am. Chem. Soc. 2014, 136, 6744–6753. [Google Scholar] [CrossRef]
- Louie, M.W.; Bell, A.T. An Investigation of Thin-Film Ni-Fe Oxide Catalysts for the Electrochemical Evolution of Oxygen. J. Am. Chem. Soc. 2013, 135, 12329–12337. [Google Scholar] [CrossRef] [PubMed]
- Kuai, C.; Xi, C.; Hu, A.; Zhang, Y.; Xu, Z.; Nordlund, D.; Sun, C.J.; Cadigan, C.A.; Richards, R.M.; Li, L.; et al. Revealing the Dynamics and Roles of Iron Incorporation in Nickel Hydroxide Water Oxidation Catalysts. J. Am. Chem. Soc. 2021, 143, 18519–18526. [Google Scholar] [CrossRef] [PubMed]
- Friebel, D.; Louie, M.W.; Bajdich, M.; Sanwald, K.E.; Cai, Y.; Wise, A.M.; Cheng, M.J.; Sokaras, D.; Weng, T.C.; Alonso-Mori, R.; et al. Identification of Highly Active Fe Sites in (Ni,Fe)OOH for Electrocatalytic Water Splitting. J. Am. Chem. Soc. 2015, 137, 1305–1313. [Google Scholar] [CrossRef]
- Yang, L.; Liu, Z.; Zhu, S.; Feng, L.; Xing, W. Ni-Based Layered Double Hydroxide Catalysts for Oxygen Evolution Reaction. Mater. Today Phys. 2021, 16, 100292. [Google Scholar] [CrossRef]
- Dong, Y.; Yang, J.; Liu, Y.; Wang, Y.; Dong, Z.; Cui, M.; Li, M.; Yuan, X.; Zhang, X.; Dai, X. 2D Fe-Doped NiO Nanosheets with Grain Boundary Defects for the Advanced Oxygen Evolution Reaction. Dalton Trans. 2020, 49, 6355–6362. [Google Scholar] [CrossRef]
- Kim, J.E.; Bae, K.K.; Park, C.S.; Jeong, S.U.; Kim, J.W.; Yoon, J.; Cho, H.; Lee, K.B.; Kang, K.S. Nickel–Iron Hydroxide Oxygen Evolution Electrocatalysts Prepared by a Simple Chemical Bath Deposition Method. Int J Hydrog. Energy 2021, 46, 20313–20324. [Google Scholar] [CrossRef]
- Gadalla, A.M. Thermal Behavior of Oxides and Hydroxides of Iron and Nickel. Thermochim. Acta 1989, 145, 1–9. [Google Scholar] [CrossRef]
- Hoque, N.A.; Thakur, P.; Kool, A.; Das, S.; Ray, P.P. Optical and Dielectric Properties of Hydrothermally Synthesized Ni(OH)2 Nanoparticles: A Morphology and Size Dependent Study. J. Mater. Sci. Mater. Electron. 2017, 28, 5375–5383. [Google Scholar] [CrossRef]
- Jung, S.; McCrory, C.C.L.; Ferrer, I.M.; Peters, J.C.; Jaramillo, T.F. Benchmarking Nanoparticulate Metal Oxide Electrocatalysts for the Alkaline Water Oxidation Reaction. J. Mater. Chem. 2016, 4, 3068–3076. [Google Scholar] [CrossRef]
- Zhou, Y.; López, N. The Role of Fe Species on NiOOH in Oxygen Evolution Reactions. ACS Catal. 2020, 10, 6254–6261. [Google Scholar] [CrossRef]
- Golabi, S.M.; Nozad, A. Electrocatalytic Oxidation of Methanol on a Nickel-Porphyrin IX Complex Modified Glassy Carbon Electrode in Alkaline Medium. Electroanalysis 2004, 16, 199–209. [Google Scholar] [CrossRef]
- Li, Y.F.; Li, J.L.; Liu, Z.P. Structure and Catalysis of NiOOH: Recent Advances on Atomic Simulation. J. Phys. Chem. C 2021, 125, 27033–27045. [Google Scholar] [CrossRef]
- Gao, M.; Sheng, W.; Zhuang, Z.; Fang, Q.; Gu, S.; Jiang, J.; Yan, Y. Efficient Water Oxidation Using Nanostructured α-Nickel-Hydroxide as an Electrocatalyst. J. Am. Chem. Soc. 2014, 136, 7077–7084. [Google Scholar] [CrossRef]
- Saguì, N.A.; Ström, P.; Edvinsson, T.; Bayrak Pehlivan, İ. Nickel Site Modification by High-Valence Doping: Effect of Tantalum Impurities on the Alkaline Water Electro-Oxidation by NiO Probed by Operando Raman Spectroscopy. ACS Catal. 2022, 12, 6506–6516. [Google Scholar] [CrossRef]
- Qiu, Z.; Tai, C.W.; Niklasson, G.A.; Edvinsson, T. Direct Observation of Active Catalyst Surface Phases and the Effect of Dynamic Self-Optimization in NiFe-Layered Double Hydroxides for Alkaline Water Splitting. Energy Environ. Sci. 2019, 12, 572–581. [Google Scholar] [CrossRef]
- Du, R.N.; Maltoni, P.; Tian, H.; Jousselme, B.; Hammarstr, L.; Edvinsson, T. From NiMoO4 to γ-NiOOH: Detecting the Active Catalyst Phase by Time Resolved in Situ and Operando Raman Spectroscopy. ACS Nano 2021, 15, 13504–13515. [Google Scholar] [CrossRef]
- Sac-Epée, N.; Palacìn, M.R.; Delahaye-Vidal, A.; Chabre, Y.; Tarâscon, J.-M. Evidence for Direct γ-NiOOH ↔ β - Ni(OH)2 Transitions during Electrochemical Cycling of the Nickel Hydroxide Electrode. J. Electrochem. Soc. 1998, 145, 1434–1441. [Google Scholar] [CrossRef]
- Varshney, D.; Dwivedi, S. Synthesis, Structural, Raman Spectroscopic and Paramagnetic Properties of Sn Doped NiO Nanoparticles. Superlattices Microstruct. 2015, 86, 430–437. [Google Scholar] [CrossRef]
- Lyons, M.E.G.; Brandon, M.P. The Oxygen Evolution Reaction on Passive Oxide Covered Transition Metal Electrodes in Aqueous Alkaline Solution. Part 1-Nickel. Int. J. Electrochem. 2008, 3, 1386–1424. [Google Scholar]
- Carrasco, J.A.; Sanchis-Gual, R.; Seijas-Da Silva, A.; Abellan, G.; Coronado, E. Influence of the Interlayer Space on the Water Oxidation Performance in a Family of Surfactant-Intercalated NiFe-Layered Double Hydroxides. Chem. Mater. 2019, 31, 6798–6807. [Google Scholar] [CrossRef]
- Sirisomboonchai, S.; Li, S.; Yoshida, A.; Li, X.; Samart, C.; Abudula, A.; Guan, G. Fabrication of NiO Microflake@NiFe-LDH Nanosheet Heterostructure Electrocatalysts for Oxygen Evolution Reaction. ACS Sustain. Chem. Eng. 2019, 7, 2327–2334. [Google Scholar] [CrossRef]
- Farhat, R.; Dhainy, J.; Halaoui, L.I. OER Catalysis at Activated and Codeposited NiFe-Oxo/Hydroxide Thin Films Is Due to Postdeposition Surface-Fe and Is Not Sustainable without Fe in Solution. ACS Catal. 2020, 10, 20–35. [Google Scholar] [CrossRef]
- Klaus, S.; Louie, M.W.; Trotochaud, L.; Bell, A.T. Role of Catalyst Preparation on the Electrocatalytic Activity of Ni1-XFexOOH for the Oxygen Evolution Reaction. J. Phys. Chem. C 2015, 119, 18303–18316. [Google Scholar] [CrossRef]
- Al Boukhari, J.; Zeidan, L.; Khalaf, A.; Awad, R. Synthesis, Characterization, Optical and Magnetic Properties of Pure and Mn, Fe and Zn Doped NiO Nanoparticles. Chem. Phys. 2019, 516, 116–124. [Google Scholar] [CrossRef]
- Zhang, B.; Lui, Y.H.; Zhou, L.; Tang, X.; Hu, S. An Alkaline Electro-Activated Fe-Ni Phosphide Nanoparticle-Stack Array for High-Performance Oxygen Evolution under Alkaline and Neutral Conditions. J. Mater. Chem. A Mater. 2017, 5, 13329–13335. [Google Scholar] [CrossRef]


Disclaimer/Publisher’s Note: The statements, opinions and data contained in all publications are solely those of the individual author(s) and contributor(s) and not of MDPI and/or the editor(s). MDPI and/or the editor(s) disclaim responsibility for any injury to people or property resulting from any ideas, methods, instructions or products referred to in the content. |
© 2023 by the authors. Licensee MDPI, Basel, Switzerland. This article is an open access article distributed under the terms and conditions of the Creative Commons Attribution (CC BY) license (https://creativecommons.org/licenses/by/4.0/).