Article

Perspective of Use of Pd/rGO in a Direct Urea Microfluidic Fuel Cell

by
M. P. Gurrola
1,2,*,
J. C. Cruz
2,
F. I. Espinosa-Lagunes
3,
A. Martínez-Lázaro
4,
J. Ledesma-García
4,
L. G. Arriaga
3,* and
R. A. Escalona-Villalpando
4
1
CONACYT-Tecnológico Nacional de México/Instituto Tecnológico de Chetumal, Av. Insurgentes 330, Chetumal 77013, Quintana Roo, Mexico
2
Tecnológico Nacional de México/Instituto Tecnológico de Chetumal, Av. Insurgentes 330, Chetumal 77013, Quintana Roo, Mexico
3
Centro de Investigación y Desarrollo Tecnológico en Electroquímica, Querétaro 76703, Querétaro, Mexico
4
División de Investigación y Posgrado, Facultad de Ingeniería, Universidad Autónoma de Querétaro, Santiago de Querétaro 76010, Querétaro, Mexico
*
Authors to whom correspondence should be addressed.
Catalysts 2023, 13(5), 788; https://doi.org/10.3390/catal13050788
Submission received: 9 March 2023 / Revised: 17 April 2023 / Accepted: 19 April 2023 / Published: 22 April 2023

Abstract

:
The urine/urea oxidation reaction through catalysts with a higher performance in direct urea microfluidic fuel cells (DUµFC) is a promising method for power generation due to the large amount of human and animal urine containing 2–2.5 wt% urea. This paper presents a study that used urea as fuel in a DUµFC in the presence of palladium supported by reduced graphene oxide (rGO) for power generation. Some parameters, such as urea, KOH and H2SO4 concentration and flux rate, among others, are optimized in order to carry out the evaluation of urine samples as fuel in an air-breathing microfluidic fuel cell. The results show that the Pd/rGo catalyst mixed with Nafion® in the anodic compartment is dispersed and attached to the paper fibers, generating electrical contact and giving rise to the reactions of interest. In addition, XRD analysis confirmed the successful deposition of Pd and rGo on the substrate. These electrochemical results are promising, since, despite the decrease in the general performance of the DUµFC under ideal conditions with respect to normal cells, the generation of energy from urine was demonstrated.

1. Introduction

There are several published works that address the importance of energy production with wastewater treatment as a sustainable alternative through adequate waste management. In this context, urea is a residual compound to be used for wastewater treatment and energy production, because it is a non-toxic, innocuous molecule; is easy to handle; and has a high energy density of 16.9 MJ·L−1 [1,2]. Urea is considered an environmental problem due to its decomposition into ammonia and other nitrogenous components [3]. The most common treatments for urea removal are nitrification, denitrification and electrolysis [4]. The use of urea-rich wastewater has received recent attention as an alternative energy source, since a large amount of human and animal urine is produced every day, containing approximately 2–2.5% of urea by weight [5]. The urea oxidation through catalysts is an efficient alternative, since it can also generate energy, as is the case with the direct urea fuel cell (DUFC) [6].
In general, the reactions of the DUFCs have a high open circuit voltage (OCV) of 1.146 V, which is the contribution of the anodic reaction (−0.746 vs. SHE) and cathodic reaction (0.4 vs. SHE) obtained through the use of different catalysts [1,2,7]. There are several metallic catalysts used for the urea oxidation reaction, such as Ni [8,9]; Ni alloys with chalcogenides [10]; metallic mixes, such as NiCo2O4 [11], Ni-Cu/ZnO, Ni1.5Mn1.5O4, LaNiO3, and Co [12]; or precious metals, such as Pt [13], Ti, Ir, and Ru-TiO2 [1], which display a high performance in basic media. Pd as catalyst is an multifunctional alternative that can be used in DUFCs and the oxidation reaction in alternative fuels, such as glucose [14,15] or alcohols [16], although it has preferentially been used in oxygen reduction reaction as a Pt replacement [1].
In addition to the catalyst, the support is another important factor, since it is able to improve the active surface area and thermal stability and increase the catalytic efficiency. Preferably, carbon materials are used as supports, such as multi-walled carbon nanotubes (MWCNT), carbon nanotubes (CNT), sponges and rGO. In this context, thanks to its unique properties, rGO allows a better distribution of the catalyst, possess excellent electrical conductivity and the efficient collection of electrons generated in the oxidation of the fuel and also has a low cost compared to other carbon materials, which makes this material an excellent candidate to be used as a support [17,18].
For the optimal functioning of the DUFC, an anionic membrane is used, since this type of catalyst improves its performance in alkaline medium. A technological alternative is the use of microfluidic fuel cells (µFC), which have various advantages, such as the elimination of the use of the membrane, the use of different electrolytes in the anolyte and catholyte, the miniaturization of the electronic device, the reduction of manufacturing costs and versatility in the use of catalysts and fuels [19].
The literature related to the direct urea microfluidic fuel cell (DUµFC) is scarce compared to other conventional fuels with excellent prospects for study and application [20,21]. Therefore, in this work, a study of DUµFC was carried out using palladium supported on rGO (Pd/rGO) as anodic catalyst for power generation using urea as fuel and commercial platinum/C-based cathode (Pt/C) for oxygen reduction reaction. An air-breathing type microfluidic fuel cell was used, optimizing the flow rate of electrolytes, urea concentration and anolyte and catholyte concentration. Finally, the microdevice was tested in the presence of a urine sample with the prospect of being used for the remediation of wastewater and energy production [22,23].

2. Physicochemical Characterization

The morphology and microstructure of the Pd/rGO and Pt/C electrodes were investigated by scanning electron microscopy, SEM (JEOL, model JSM-6510LV), equipped with an energy-dispersive spectroscopy detector (EDS, BrukerXFlash 6I10). The crystal structures were measured by X-ray diffraction (XRD; D8-advance diffractometer Bruker) equipped with a CuKα X-ray source (λ = 0.1541 nm, 40 kV, 40 mA), using a step size of 0.02° 2θ and a scan step time of 5 s. The electronic structure of the elements was measured by X-ray photoelectron spectroscopy (XPS; K-Alpha+ spectrometer equipped with the Avantage Data System from Thermo ScientificTM).

3. Results and Discussion

3.1. Physical Characterization

The anode and cathode surfaces of the electrodes corresponding to Pd/rGO and commercial Pt/C, respectively, were examined by SEM as is illustrated in Figure 1a. This figure shows different increments, where it can be seen, in both cases, that the electrocatalytic material is deposited on the Toray paper fibers, which is distinguished by its intense brightness. In the case of the anode, it can be seen that the mixture of Pd/rGo with Nafion® is dispersed and attached to the paper fibers, generating good electrical contact between the electrode and the supported catalyst particles [24]. In addition, it is also possible to observe that the catalytic mixture is embedded in the binder, which translates to a certain resistance to the flow of electrons [25,26]. In the case of the cathode, it can be seen that the electrocatalytic material presents a good dispersion and, therefore, the ability to react.
XRD patterns of Pd/rGO nanoparticles are presented in Figure 1b. The main diffraction peaks of Pd are observed at 2θ = 40°, 46.7°, 68.1° and 82.2°, corresponding to files (111), (200), (220) and (311), respectively, and also corresponding to files JPDS:41-1487 and JCPDS 05-0681, respectively. It is possible to observe two peaks for rGO at 2θ = 26.1° and 43.5°. Through Rietveld’s refinement analysis, the adjustment of the signals using the parameters of the crystallographic database (COD data) was performed, where the Bragg equation and the Scherrer equation were used to determine FWHM and the particle size of the mean peak of the Pd/rGO, where the average value of the crystallite size was 6.40 nm, with a microstrain of 3.41 × 10⁻³ and dislocation density of 49.13 × 10⁻³ nm−2. For more details, see Figure S1 and Tables S1 and S2 in the Supplementary Materials. The maximum in the diffractogram can be related to the most probable intersegmental distance (spacing d) between the rGO and Pd using the Bragg equation, which is given in (111). The spacing d showed slight growth depending on the content of rGO chains; this can be attributed to the presence of bulky carbon chain units, which restricted the free rotation of the chains and hindered dense packing, which is observed at 2θ = 26.1° [27].
Using the X-ray photoelectron spectroscopy technique (XPS), an analysis of Pd/rGO was performed to determine the chemical composition and oxidation state before and after of the evaluation of the electrocatalyst in the microfluidic fuel cell, and the comparison is presented in Figure 2. In Figure 2a the presence of C, Pd and O can be appreciated, which is typical of the material synthesis under study. However, a slight change in the intensity of peaks is observed for the analysis post-evaluation of the microfluidic cell, with greater material oxidation. The spectra of Pd 3d can be seen in Figure 2b, where a comparative analysis of the oxidation states present in the synthesis of Pd/rGO and those present after the analysis of the microfluidic cell is performed and can be seen to be deconvolution orbitals in Pd 3d 5/2 and Pd 3d 3/2, with the peaks of 335.1 eV and 340.8 eV corresponding to Pd0. In comparison, those located at 336.25 eV and 342.5 correspond to Pd2+ [14,28], so they are attributed to a change in the oxidation state that constitutes the Pd/PdO structure for the Pd/rGO sample. A higher concentration of Pd0 is observed in Pd/rGO, according to electrochemical analysis, where the corresponding oxidation peaks of the material are observed, due to the presence of rGO, which contributes to the stability of the catalyst. However, for the subsequent analysis, there is a ±5 displacement of the signals in the energy band, revealing a higher concentration of Pd2+ and, therefore, a greater oxidation of Pd0.
The comparison of the spectra of C 1 s is presented in Figure 2c, which indicates the oxidation degree with three components corresponding to C atoms in different functional groups: the non-oxygenated ring C-C at 284.3 eV, the C atom at the C-O bond at 286.3 eV and the carbonyl C=O at 288.1 eV [29], for both samples. The spectrum showed the same functional groups but with reduced intensities and displaced peak positions in the oxygen-containing groups. Therefore, this can be attributed to the composition of rGO, where the C-O ratio presents a higher proportion due to the elimination of oxygen-containing functional groups caused by the presence of the Pd0 state before and after the evaluation of the microfluidic cell’s performance.
Finally, Figure 2d presents the comparison of the spectra of O 1 s, which indicates the presence of bonds with Pd and rGO, respectively: when analyzing the oxygen-containing functional groups, an increase in sp2 networks in the basal plane of rGO was observed, as well as the presence of H2O post-evaluation of the microfluidic device. These changes in chemical functionalities decrease the stability of rGO in an aqueous solution, increasing the tendency of rGO agglomeration with each other [30]. However, rGO could be well dispersed in a high pH solution since the carboxylic groups at the edge of rGO can be deprotonated to provide repulsive charges by containing the interaction with Pd0 and Pd2+ observed in this type of material.
Through the XPS analysis performed, it was possible to conclude the elemental composition, the oxidation states present in the synthesis of Pd/rGO and the concentration ratio, which is involved in the physicochemical techniques outlined in this work.

3.2. Effect of Electrolyte Flow Rate on Cell Performance

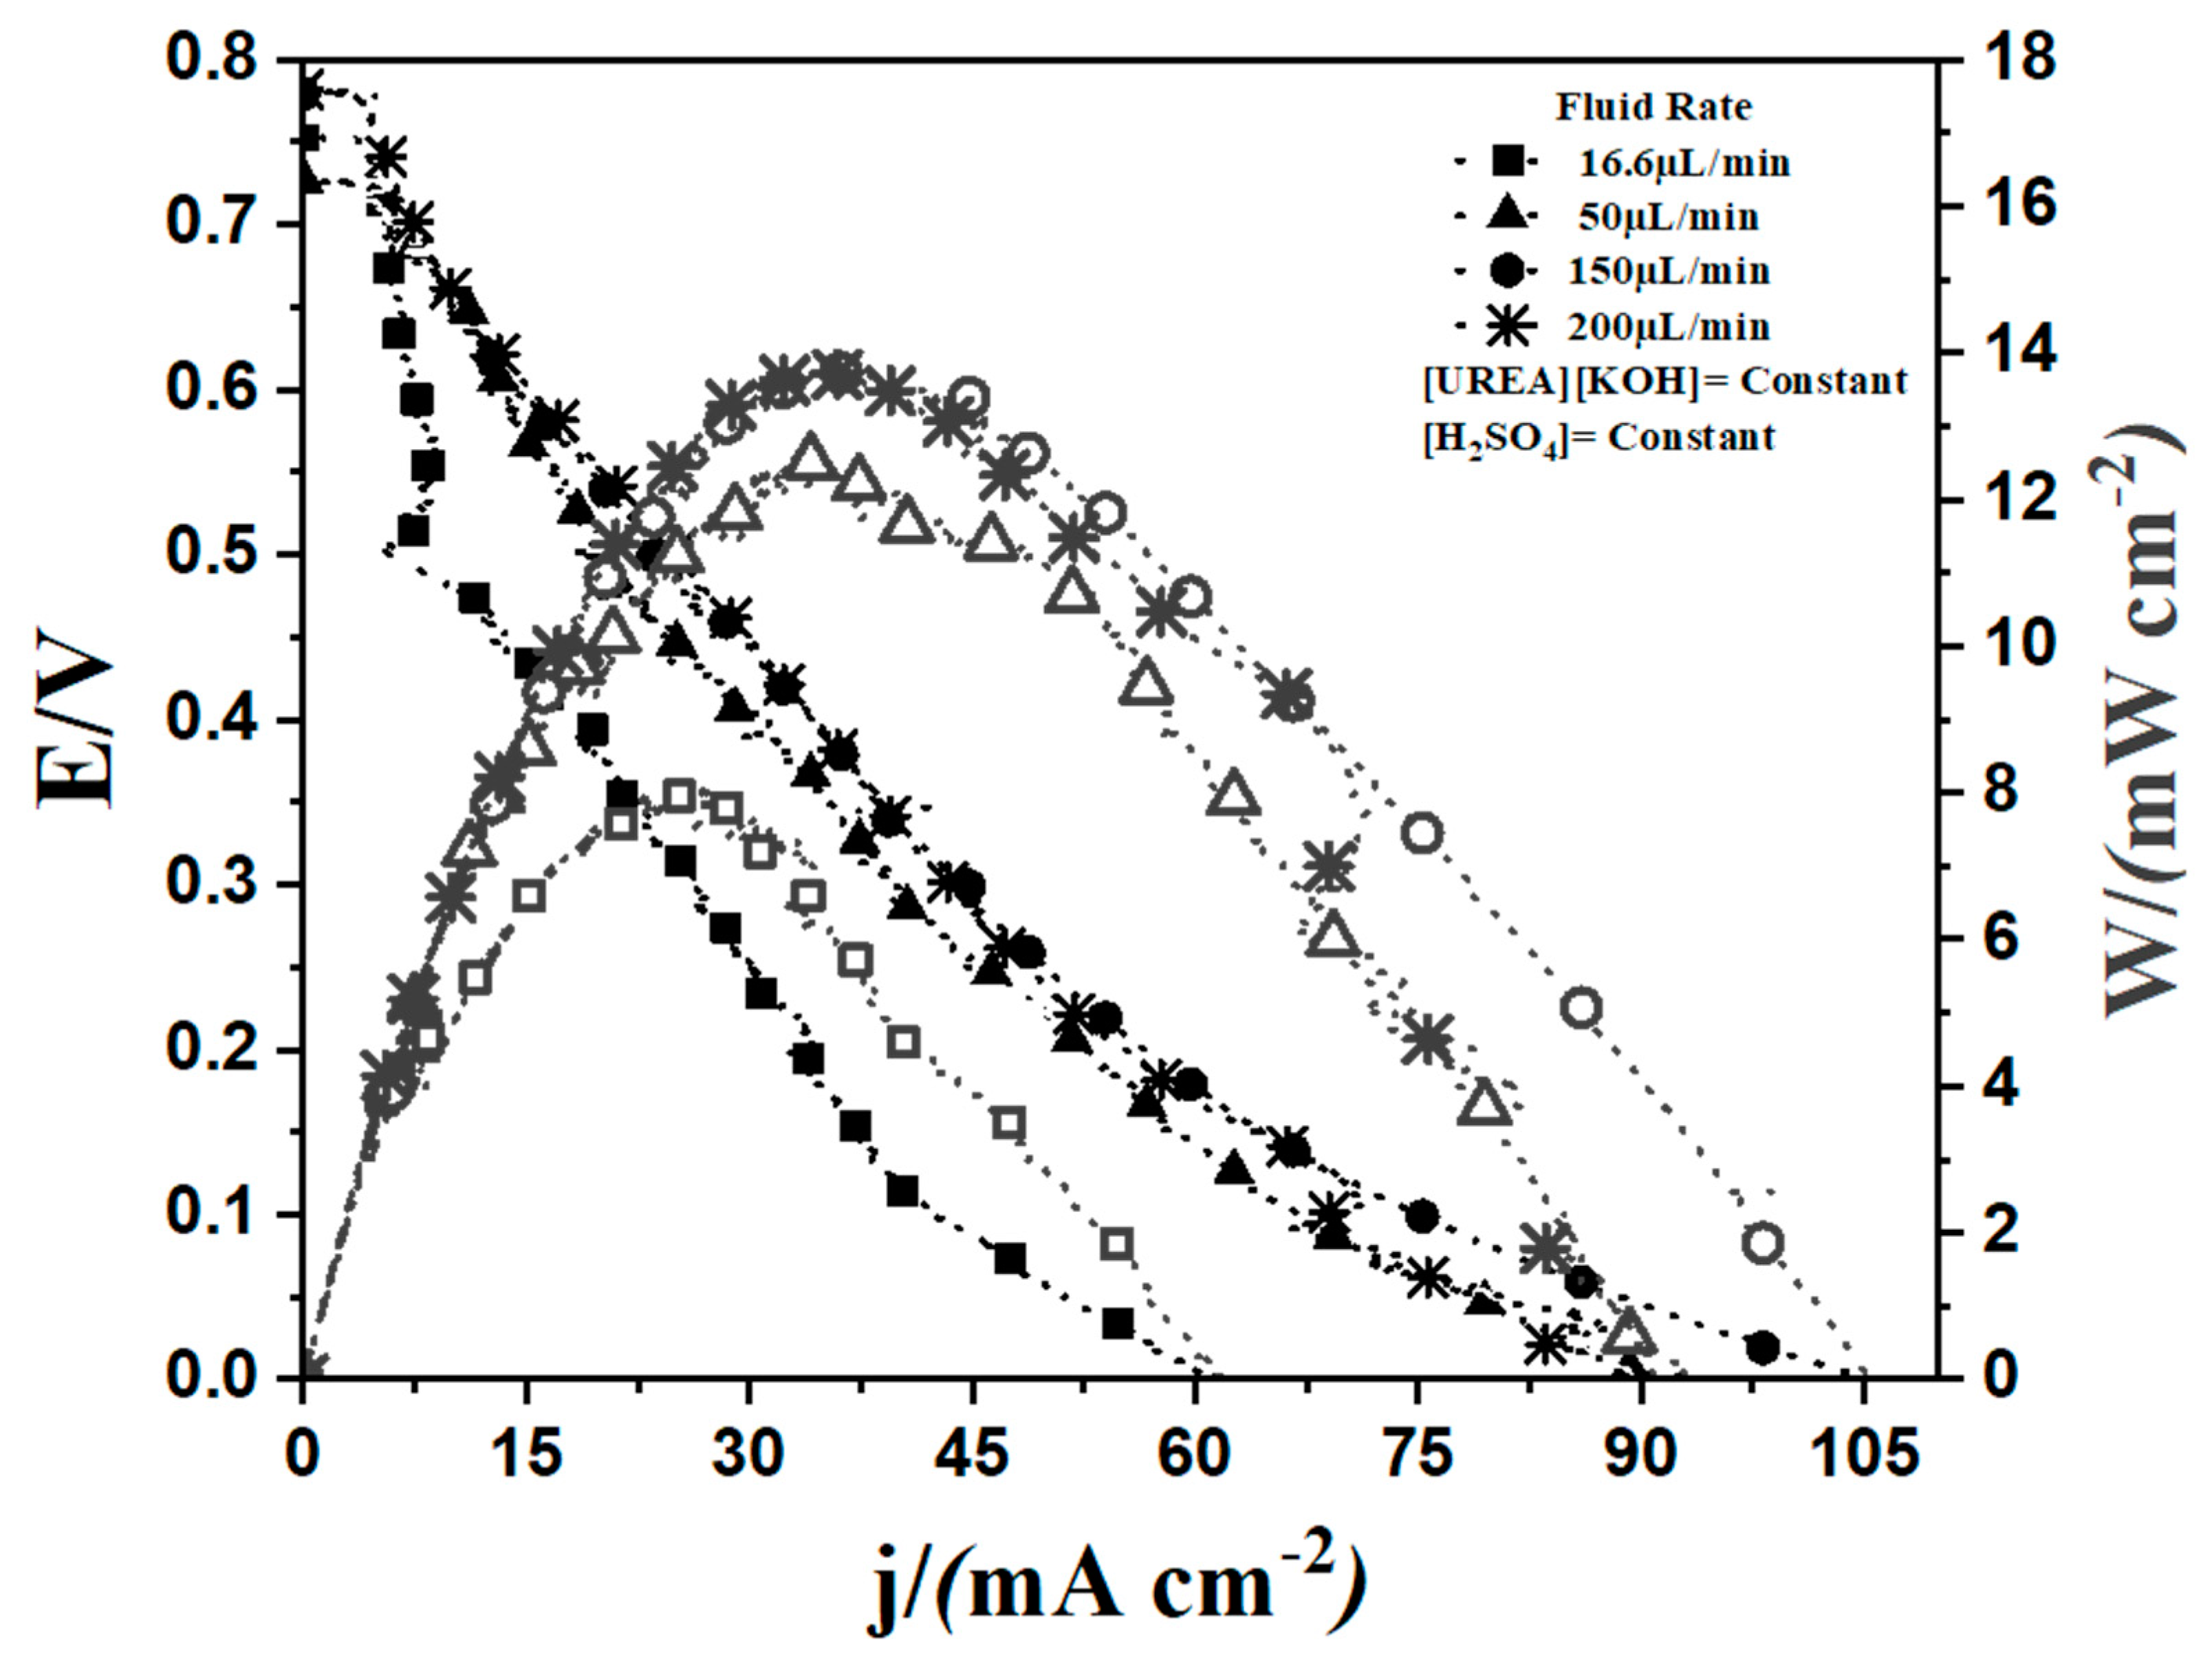
Microfluidic fuel cell tests were performed by varying the flow rate in the system. In Figure 3, it can be observed that 150 μL min−1 was the flow rate value for which a current density limit and stable maximum power density were obtained, since, when increasing the flow rate to 200 μL min−1, although maximum power density (Pmax) is maintained, current density (jlim) decreases. This is probably due to the urea oxidation reaction kinetics, where for flows of less than 150 μL min−1, the current limit decreased, since the urea reaching the surface of Pd is quickly consumed before more fuel arrives to be oxidized, primarily due to reduced concentration polarization because of improved mass transfer. In addition, the microfuel cell throughput of flow-through cases remains relatively constant beyond 50 μL min−1, indicating that cell throughput is limited by reaction kinetics [31].

3.3. Effect of Fuel and Anolyte/Catholyte Concentration on DUµFC Performance

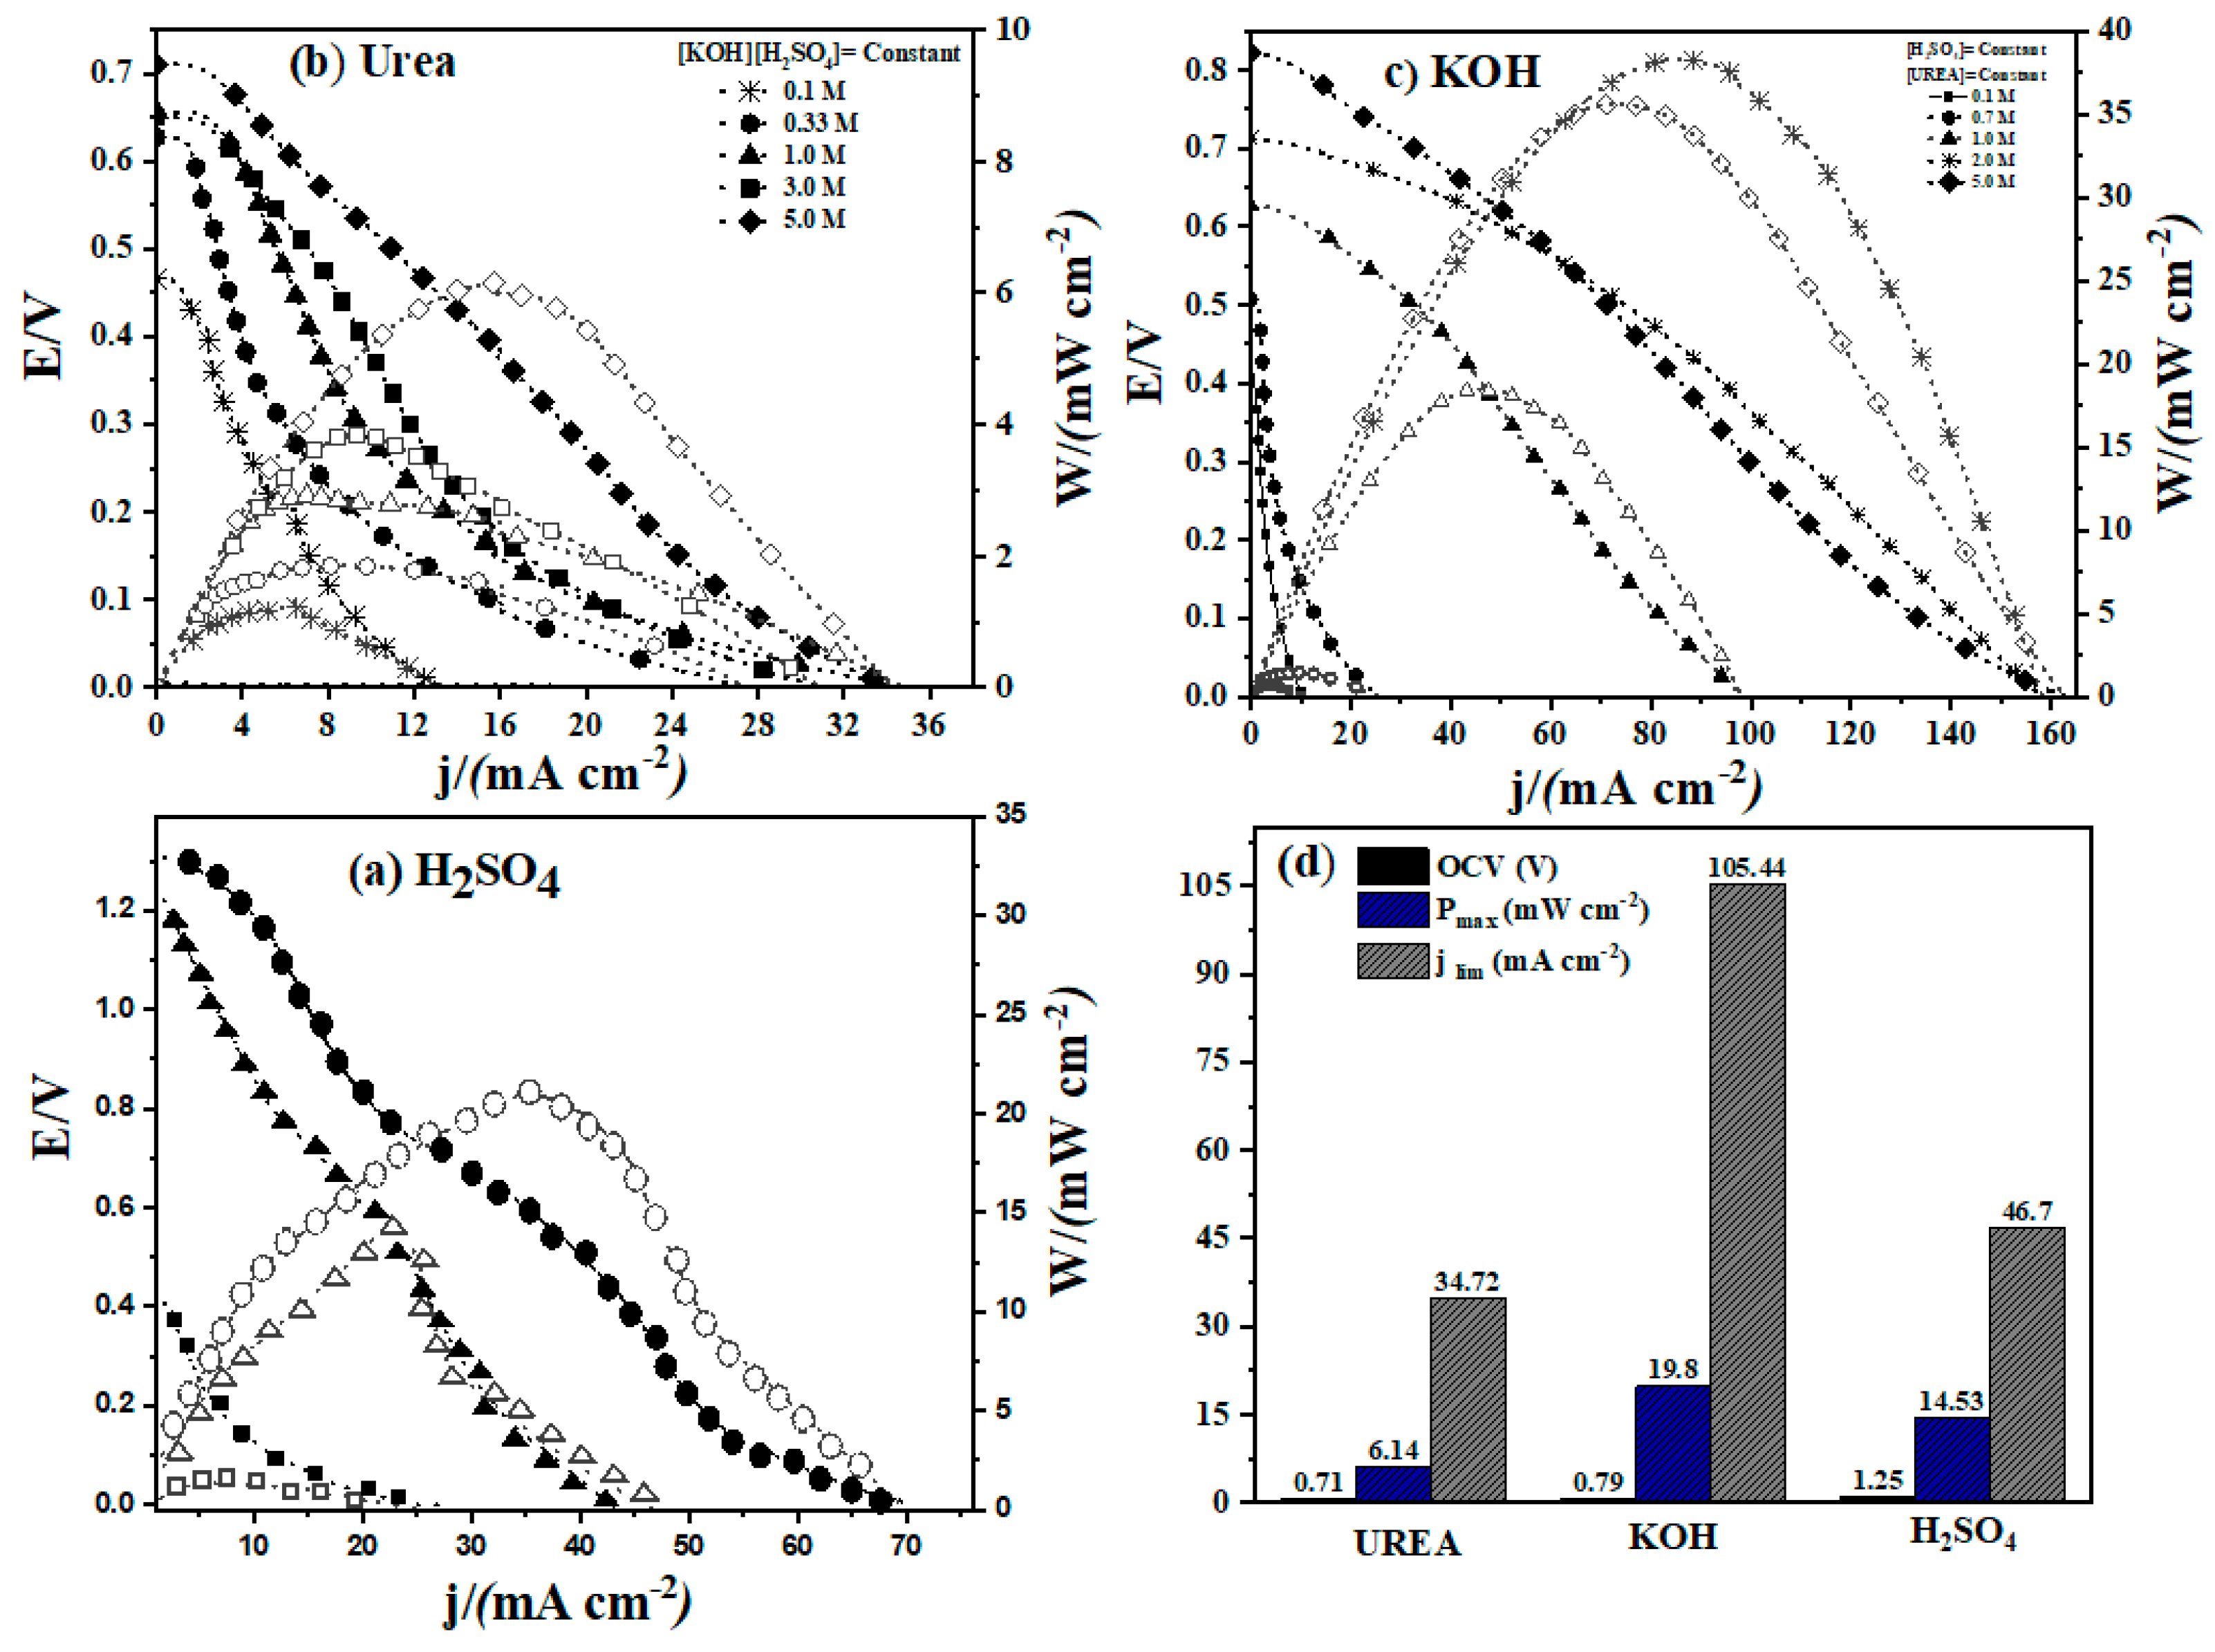
DUµFC performance as a function of the variation of anolyte, catholyte and fuel concentration is presented in Figure 4a. All tests were carried out at 50 μL min−1 flow rate, which showed the best performance, as seen in Figure 3. Figure 4a shows the effect generated by the increase in fuel concentration on the limit of jlim, where this parameter presents a linear increase from [Urea] = 0.1 M to 1 M, reaching values from 17.2 to 43 mA cm−2. For [Urea] > 1 M and up to 5 M, jlim presented no significant change, until around 42 mA cm−2; this is because at [Urea] = 1 M, the saturation had been reached in the Pd nanoparticles and, due to the pH conditions given by the anolyte, is not possible to improve the urea oxidation kinetics. On the other hand, Pmax presented a linear increase with respect to [Urea], as, due to the increase in fuel, the [Ox]/[Red] ratio is modified, improving the voltage of the cell and favoring the Pmax reached, since P = jcell∙Ecell, thus achieving a Pmax = 7.52 mW cm−2 at [Urea] = 5 M. Additionally, it is possible to appreciate an increase in the limit current value and Pmax when the fuel concentration raises up to a value of jlim = 34.72 mA cm−2 and Pmax = 7.14 mW cm−2, respectively. This behavior is to be expected, since there is a greater number of active species exposed to the respective oxidation, and the OCV increases as the fuel concentration increases, which is also to be expected, achieving a maximum value of E = 0.71 V at [Urea] = 5 M at the limit current.
Figure 4b shows the DUµFC performance as a function of the variation of [KOH], keeping the urea and H2SO4 concentration constant. It is possible to observe that the increase in the potassium hydroxide concentration substantially favors the limit current. It is evident that the concentration of the electrolyte has a significant impact on the urea oxidation, since, according to the literature, 6 OH groups are necessary to attack the partially positive groups in the urea molecule (C from the C=O group and the two Ns of the NH2 groups). Once the urea molecule has been attacked by -OH ions, the C-N and N-H bonds can be broken, forming N2, CO2 and 5 H2O [32,33,34]. Unlike nickel, which is the most widely used electrocatalyst for urea oxidation, palladium presents greater resistance to CO poisoning [35], which is an intermediate by-product of the urea oxidation process. Therefore, with the increase in the KOH concentration, jlim = 198 mA cm−2 and Pmax = 43.68 mW cm−2 can be reached.
On the other hand, by increasing [H2SO4] to 1 M, it was possible to increase the OCV up to around to 1.3 V (Figure 4c). This is probably due to the fact that, by increasing the acid nature of the cathodic side, extra energy from the neutralization process is provided for both supporting electrolytes [36] and an increase of jlim = 94.86 mA cm−2 and Pmax = 29.64 mW cm−2 is reached. Finally, in Figure 4d, the current, power and performance efficiency of the DUµFC on the OCV are compared when varying fuel, analyte and catholic concentrations. It can be seen that the variation of [KOH] has a greater effect on the increase in overall performance of the DUµFC without the fuel saturation that could poison the catalysts or the production of H2SO4 that could generate a greater amount of K2SO4 at the interface when mixed with KOH [7,37].

3.4. Evaluation of Urine Sample as Fuel

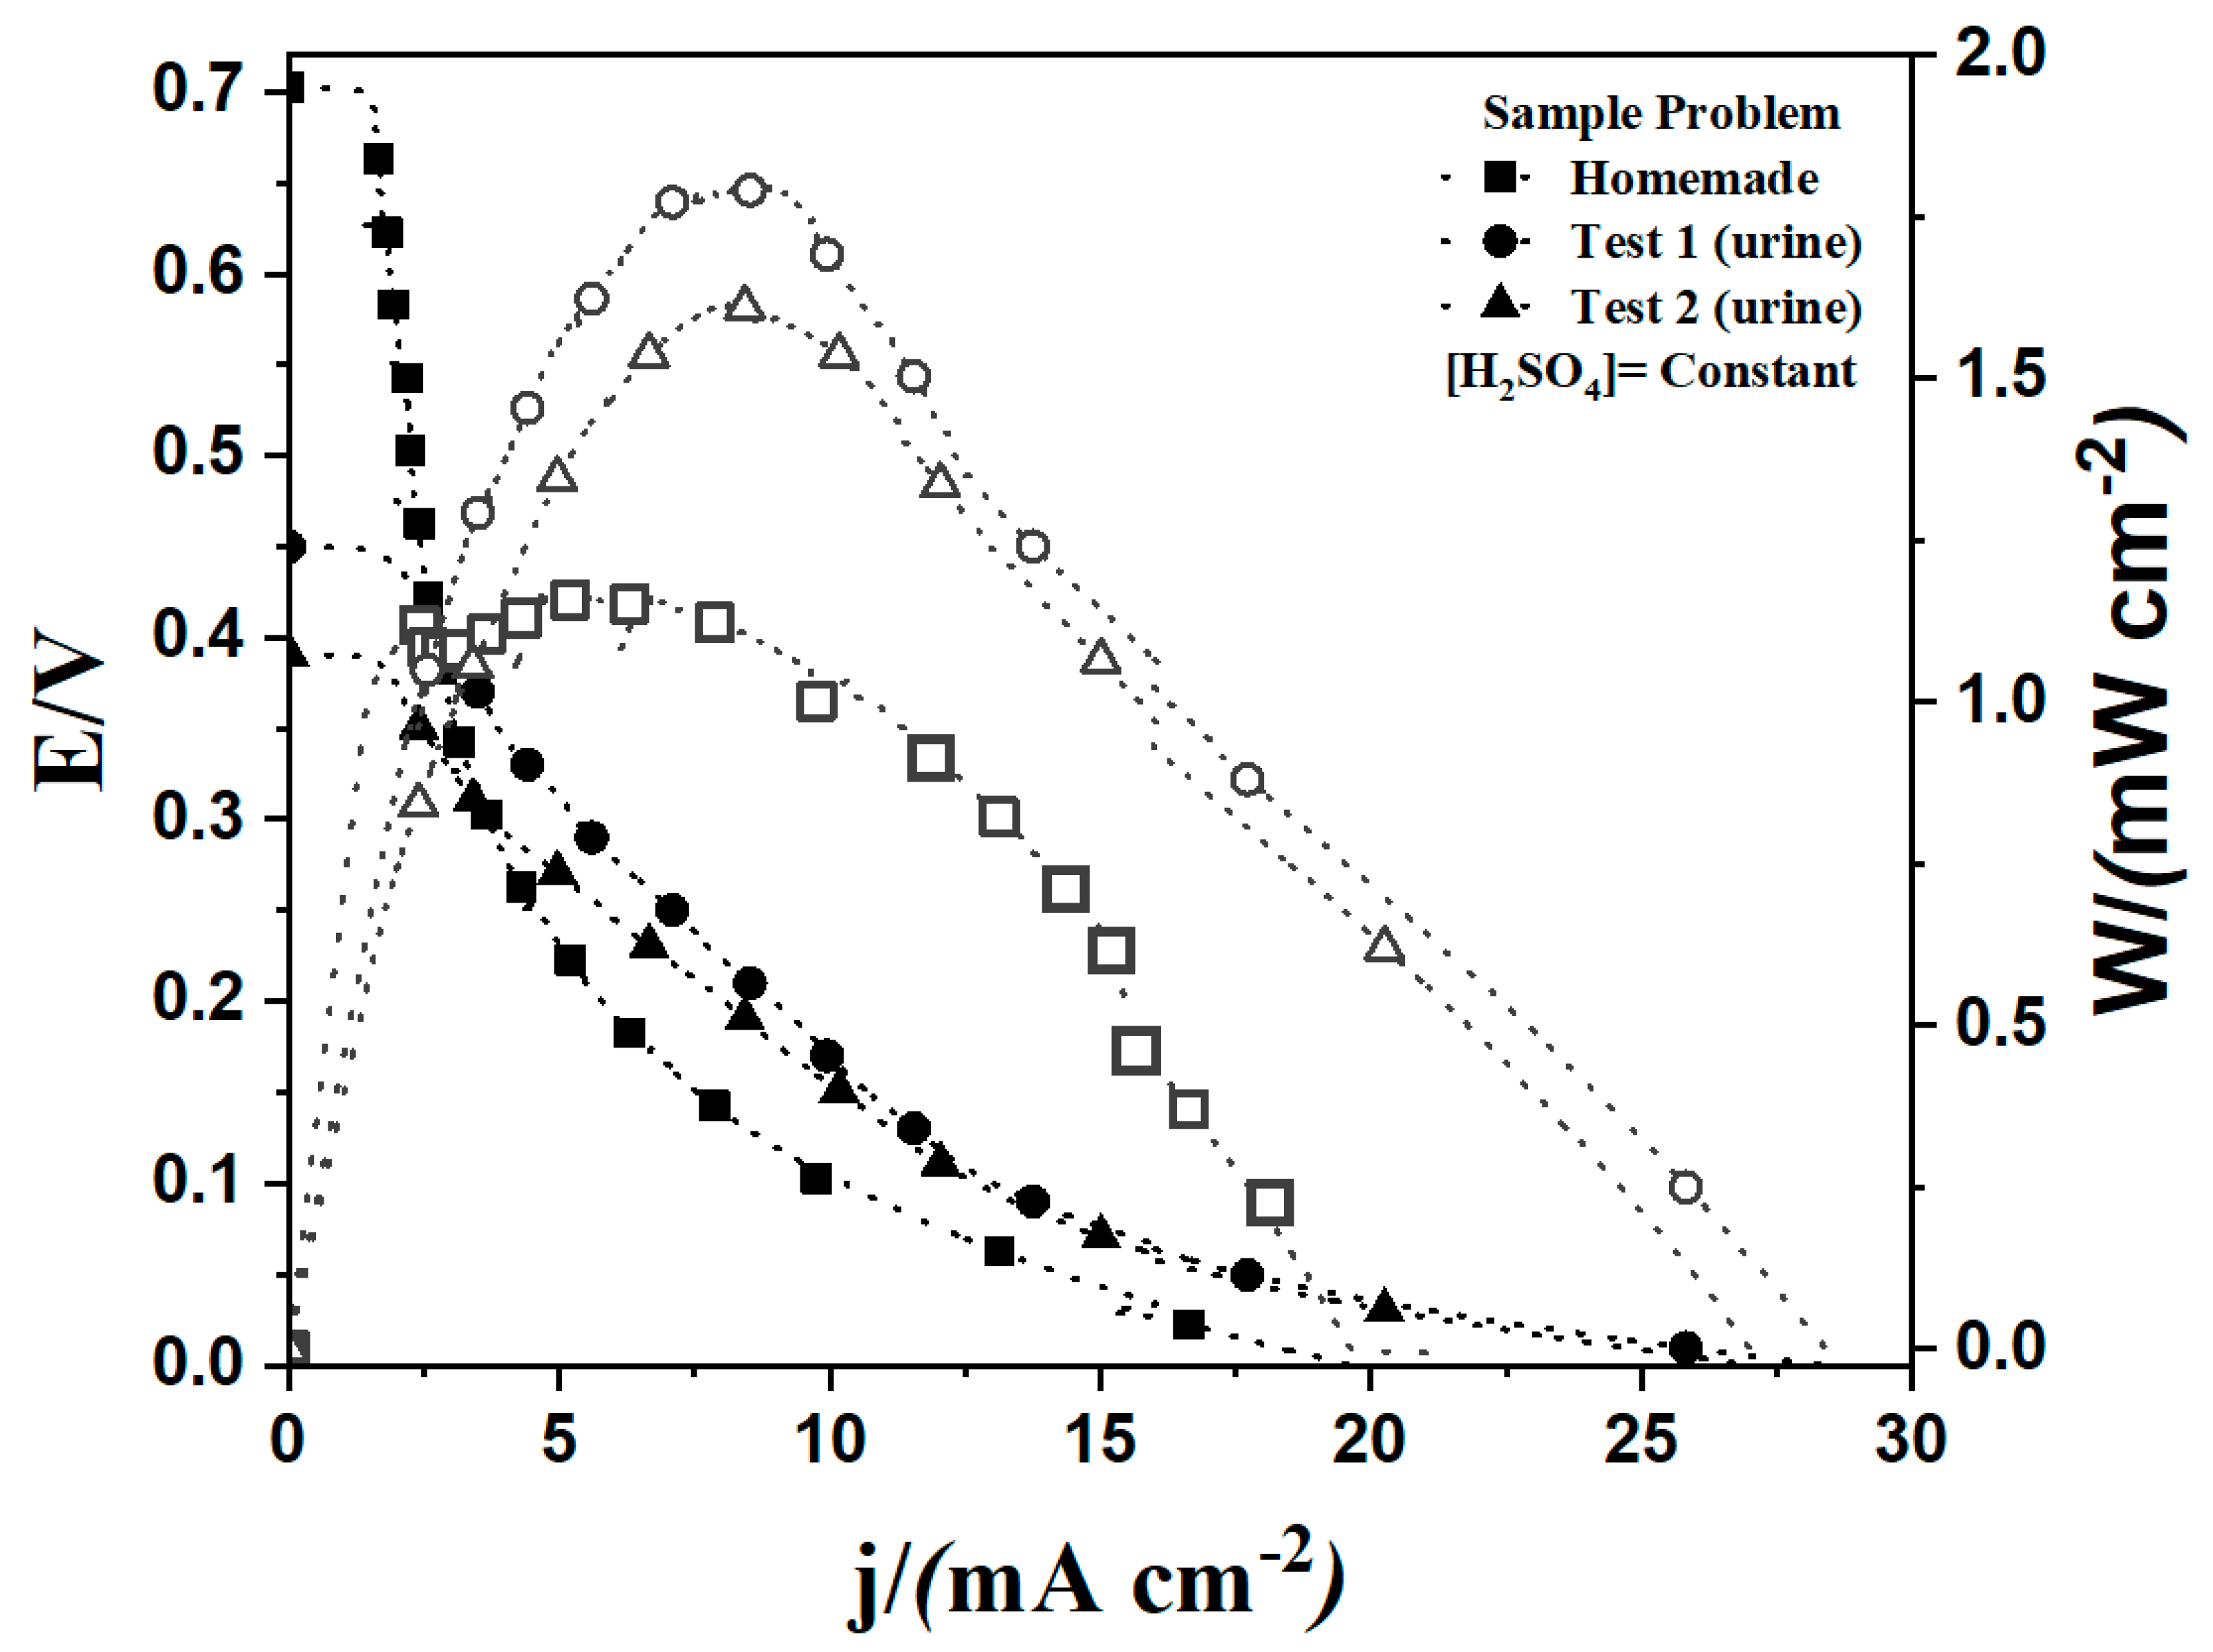
Figure 5 shows the DUµFC performance using human urine (from two healthy voluntary donors) as fuel, reaching OCV, jlim and Pmax values of 0.45 V, 27 mA cm−2 and 1.76 mW cm−2, respectively. Decreases in overall performance may be due to anolyte pH changes, different ionic strengths of the anolyte, adsorbed species on the anode catalyst and different oxidation potentials of organic molecules present in the urine. These results are promising since, despite the decrease in the overall performance of DUµFC under ideal conditions in contrast to real conditions, the generation of energy in urine was possible to achieve, which is a significant contribution of DUµFC since, at present, not all applications using urea from urine as fuel have succeeded in this [6,38].

4. Materials and Methods

4.1. Construction of the DUµFC

For the elaboration of the electrodes, firstly, two catalytic inks were prepared for the anodic compartment, Pd/rGO, 50:50 wt% (home-made), according to Morales-Acosta et al. [39], while for the cathodic chamber, 20% Pt/Vulcan XC-72 (Fuel Cell, Texas, USA) commercial was used. The preparation of both inks was carried out directly in an ultrasonic bath through the aqueous dispersion of 5.0 mg of the catalytic mixture (catalyst/support), 35 µL of Nafion® (5% Electrochem, State Mx, Mexico) and 365 µL of isopropyl alcohol (J.T. Baker CDMX, Mexico). The resulting inks were deposited in the electrode matrix (Toray Paper, Fuel Cell, Texas, USA) by the spray technique, employing an airbrush until the base metal loading was 0.6 mg (see Scheme 1) [40,41]. The microfuel cell µFC design used in this study was derived from the previously published works of the our research group [19,42,43]. Briefly, three-dimensional electrodes of 30 mm × 2 mm × 0.164 mm length, width and thickness were manufactured using Carbon Toray Paper. The µFC was sandwiched by two supporting plates fabricated from polymethyl methacrylate (PMMA) using a micro milling system CNC (computer numerical control), and the top plate had one outlet for the reaction by-products. The bottom plate had an air-breathing window of 20 mm × 2 mm for the take-up of oxygen from the air and two additional inlets for oxidant and fuel electrolytes. The microchannel and gaskets were fabricated of a silicone elastomer film using an Elcometer® Film Applicator (Elcometer, N.L., Mexico) with a final thickness of approximately 600 µm and were traced using a Silhouette® cutting plotter (Silhuette, CDMX, Mexico) (Scheme 1).

4.2. Direct Urea Microfluidic Fuel Cell Operation

For the evaluation of the device, the analysis of Zhang et al. [20] and the logic analysis of Zou et al. [36] were considered. Based on these analyses as a starting point, it was possible to couple dual acid-base reactions for a DUµFC by neutralizing reactions in the double electrolyte configuration Reaction (4). An anodic reaction of a typical DUFC Reaction (1) and its respective cathodic reaction in an acid medium Reaction (2) was considered. It was possible to obtain an OCV of E = 1.976 V according to the overall reaction Reaction (3), but it was different to that presented in Reaction (4), since it included acid-base neutralization reactions [25]. According to Nernst equation, the voltage generated by the combination of OH ions with H+ ions to form water is equal to E = 0.83 V, under standard conditions [44]. In an direct urea fuel cell/(O2, H+), a higher voltage of E = 1.976 V with an additional energy of E = 0.83 V, compared to the direct urea fuel cell/(O2, OH), can be obtained; therefore, it can be interpreted as the energy of the electrochemical neutralization reaction [1] and can be applied to produce energy, favoring the urea energy conversion (Scheme 1).
Anode reaction:
C O ( N H 2 ) 2 + 6 O H N 2 + C O 2 + 5 H 2 O + 6 e E 0 = 0.746   V   v s .   S H E
Cathode reaction in acid medium:
3 2 O 2 + 6 H + + 6 e 3 H 2 O E 0 = + 1.23   V   v s .   S H E
Overall reaction for the urea/(O2, H+) fuel cell:
C O N H 2 2 + 3 2 O 2 + 6 H + + 6 O H N 2 + C O 2 + 8 H 2 O Δ E 0 = + 1.976   V   v s .   S H E
H + + O H H 2 O Δ E 0 = + 0.83   V
Different reaction conditions were used to improve the DUµFC performance by modifying flow rates, fuel concentration, anolytes and catholytes. Both currents, anodic and cathodic, were optimized according to Table 1, and the catholyte stream consisted of saturated O2.
Oxidant and fuel solutions were fed at a 50 µL min−1 flow rate by means two Single-Syringe Infusion Pumps (NE-4000, New Era Pump Systems, Inc, NY USA). Current collectors were cut from a commercial foil (Alumark 50 CDMX, Mexico). In the case of a flow rate effect (1:1), the flow rates were 16.66, 50, 100, 150 and 200 μL min−1. After optimizing system parameters with urea as fuel, urine samples from two voluntary donors were evaluated for the anodic component, while, for the cathode, 1 M H2SO4 was used. All solutions were prepared with deionized water DI (ρ ≥ 18 MΩ cm). Polarization curves were recorded at 10 mV s−1 using a BioLogicSAS (Science Instruments, Model VSP, Knoxville, TN, USA). All the evaluations were performed at room temperature with a one-to-one KOH–urine ratio.

5. Conclusions

The performance of a composite based on Pd/rGo, prepared on Carbon Toray Paper using the spray technique, was evaluated. SEM evaluation showed that the mixture of Pd/rGo with Nafion® in the anodic component was dispersed and attached to the paper fibers, generating good electrical contact. XRD analysis confirmed the successful deposition of Pd and rGO on the substrate. XPS was able to verify a possible change in the oxidation states of Pd and C in Pd/rGO, where an oxido-reduction process was executed due to the operation of the electrocatalyst in a DUµFC, resulting in 80% of the oxidized material (Pd 2+) available, demonstrating the high stability of the material. Likewise, variables such as Urea, KOH and H2SO4 concentration were also assessed, with the aim of optimizing parameters in the system to be able to compare them with a human urine sample. Based on the above, it was possible to observe that the greatest effect in the system under study was generated by the variation of KOH concentration in the fuel, achieving values of Pmax = 19.8 mW cm−2 and jlim =105.44 mA cm−2 and, when compared to a real urine sample, these values decreased.
The obtained results have an effect on the performance of the system associated with the different ionic strengths of the anolyte, adsorbed species on the anode catalyst and the different oxidation potentials of organic molecules present in the urine. However, these results are promising since, despite the decrease in the overall DUµFC performance under ideal conditions vs. real conditions, it was possible to generate energy from urine, which is a significant contribution to DUµFCs research, since, at present, not all applications using urea from urine as fuel have successfully achieved this.

Supplementary Materials

The following supporting information can be downloaded at: https://www.mdpi.com/article/10.3390/catal13050788/s1, Figure S1: Rietveld refinement Pd/rGO; Figure S2: Current density limit and maximum power density for (a) urea concentration variation, (b) anolyte concentration variation and (c) catholyte concentration variation; Table S1: Calculation of crystallite size from XRD data using Rietveld refinement; Table S2: Calculation of the microstrain and dislocation density from XRD data using Rietveld refinement; Table S3: Calculation of the crystallographic parameter from XRD data using COD data.

Author Contributions

Conceptualization, R.A.E.-V., M.P.G. and J.C.C.; methodology, R.A.E.-V., M.P.G., J.L.-G. and L.G.A.; software, R.A.E.-V. and F.I.E.-L.; formal analysis, R.A.E.-V., F.I.E.-L., M.P.G., L.G.A. and J.L.-G.; investigation R.A.E.-V., M.P.G. and J.C.C.; resources, J.L.-G. and M.P.G.; visualization, R.A.E.-V., F.I.E.-L. and M.P.G.; writing—original draft preparation, R.A.E.-V., F.I.E.-L., L.G.A., A.M.-L. and J.L.-G.; writing—review and editing R.A.E.-V., M.P.G., L.G.A., A.M.-L. and J.L.-G.; supervision, R.A.E.-V., M.P.G. and L.G.A.; funding acquisition, J.L.-G. and M.P.G. All authors have read and agreed to the published version of the manuscript.

Funding

This research received no external funding.

Data Availability Statement

Not applicable.

Acknowledgments

The authors acknowledge the Mexican Council for Science and Technology (CONACYT) for the financial support through the Project Ciencia de Frontera (Frontier Science) 2019, grant No. 845132; Chairs-CONACYT—Project Number 746; and the National Laboratories 2023- 321116 for their technical support.

Conflicts of Interest

The authors declare no conflict of interest. The funders had no role in the design of the study; in the collection, analyses, or interpretation of data; in the writing of the manuscript; or in the decision to publish the results.

References

  1. Sayed, E.T.; Eisa, T.; Mohamed, H.O.; Abdelkareem, M.A.; Allagui, A.; Alawadhi, H.; Chae, K.J. Direct Urea Fuel Cells: Challenges and Opportunities. J. Power Sources 2019, 417, 159–175. [Google Scholar] [CrossRef]
  2. Lan, R.; Tao, S.; Irvine, J.T.S. A Direct Urea Fuel Cell—Power from Fertiliser and Waste. Energy Environ. Sci. 2010, 3, 438–441. [Google Scholar] [CrossRef]
  3. Wang, J.H.; Zhuang, L.L.; Xu, X.Q.; Deantes-Espinosa, V.M.; Wang, X.X.; Hu, H.Y. Microalgal Attachment and Attached Systems for Biomass Production and Wastewater Treatment. Renew. Sustain. Energy Rev. 2018, 92, 331–342. [Google Scholar] [CrossRef]
  4. Wang, J.; Li, S.; Guo, S.; Ma, C.; Wang, J.; Sun, J. Analysis of Heat Transfer Properties of Hollow Block Wall Filled by Different Materials in Solar Greenhouse. Eng. Agric. Environ. Food 2017, 10, 31–38. [Google Scholar] [CrossRef]
  5. Ishii, S.K.L.; Boyer, T.H. Life Cycle Comparison of Centralized Wastewater Treatment and Urine Source Separation with Struvite Precipitation: Focus on Urine Nutrient Management. Water Res. 2015, 79, 88–103. [Google Scholar] [CrossRef] [PubMed]
  6. Hao, J.; Zhao, S.; Mao, R.; Zhao, X. Nickel Phosphide on Ni Foam as Anode and Peroxymonosulfate as the Chemical Oxidizer for Effective Direct Urea Fuel Cell. J. Environ. Sci. 2021, 110, 84–91. [Google Scholar] [CrossRef]
  7. Kim, O.H.; Choi, H.J.; Kang, S.Y.; Jang, G.Y.; Karuppannan, M.; Park, J.E.; Sung, Y.E.; Kwon, O.J.; Cho, Y.H. Towards Outstanding Performance of Direct Urea Fuel Cells through Optimization of Anode Catalyst Layer and Operating Conditions. J. Electroanal. Chem. 2022, 921, 116661. [Google Scholar] [CrossRef]
  8. Ghanem, M.A.; Al-Mayouf, A.M.; Singh, J.P.; Arunachalam, P. Concurrent Deposition and Exfoliation of Nickel Hydroxide Nanoflakes Using Liquid Crystal Template and Their Activity for Urea Electrooxidation in Alkaline Medium. Electrocatalysis 2017, 8, 16–26. [Google Scholar] [CrossRef]
  9. Ma, Y.; Ma, C.; Wang, Y.; Wang, K. Advanced Nickel-Based Catalysts for Urea Oxidation Reaction: Challenges and Developments. Catalysts 2022, 12, 337. [Google Scholar] [CrossRef]
  10. Sayed, E.T.; Abdelkareem, M.A.; Bahaa, A.; Eisa, T.; Alawadhi, H.; Al-Asheh, S.; Chae, K.J.; Olabi, A.G. Synthesis and Performance Evaluation of Various Metal Chalcogenides as Active Anodes for Direct Urea Fuel Cells. Renew. Sustain. Energy Rev. 2021, 150, 111470. [Google Scholar] [CrossRef]
  11. Ranjani, M.; Senthilkumar, N.; Gnana Kumar, G.; Manthiram, A. 3D Flower-like Hierarchical NiCo2O4 Architecture on Carbon Cloth Fibers as an Anode Catalyst for High-Performance, Durable Direct Urea Fuel Cells. J. Mater. Chem. A 2018, 6, 23019–23027. [Google Scholar] [CrossRef]
  12. Sayed, E.T.; Abdelkareem, M.A.; Alawadhi, H.; Olabi, A.G. Enhancing the Performance of Direct Urea Fuel Cells Using Co Dendrites. Appl. Surf. Sci. 2021, 555, 149698. [Google Scholar] [CrossRef]
  13. Pierozynski, B. Electrochemical Behaviour of Urea at Pt (111) Single-Crystal Surface in 0.1 M NaOH. Electrocatalysis 2013, 4, 37–41. [Google Scholar] [CrossRef]
  14. Hassan, K.M.; Khalifa, Z.; Elhaddad, G.M.; Abdel Azzem, M. The Role of Electrolytically Deposited Palladium and Platinum Metal Nanoparticles Dispersed onto Poly(1,8-Diaminonaphthalene) for Enhanced Glucose Electrooxidation in Biofuel Cells. Electrochim. Acta 2020, 355, 136781. [Google Scholar] [CrossRef]
  15. Zhiani, M.; Abedini, A.; Majidi, S. Comparison of Electro-Catalytic Activity of Fe-Ni-Co/C and Pd/C Nanoparticles for Glucose Electro-Oxidation in Alkaline Half-Cell and Direct Glucose Fuel Cell. Electrocatalysis 2018, 9, 735–743. [Google Scholar] [CrossRef]
  16. Fashedemi, O.O.; Mwonga, P.V.; Miller, H.A.; Maphanga, R.R.; Vizza, F.; Ozoemena, K.I. Performance of Pd@FeCo Catalyst in Anion Exchange Membrane Alcohol Fuel Cells. Electrocatalysis 2021, 12, 295–309. [Google Scholar] [CrossRef]
  17. Wang, Y.; Liu, G. Reduced Graphene Oxide Supported Nickel Tungstate Nano-Composite Electrocatalyst for Anodic Urea Oxidation Reaction in Direct Urea Fuel Cell. Int. J. Hydrogen Energy 2020, 45, 33500–33511. [Google Scholar] [CrossRef]
  18. Lera, I.L.; Khasnabis, S.; Wangatia, L.M.; Olu, F.E.; Ramamurthy, P.C. Insights into the Electrochemical Behavior and Kinetics of NiP@PANI/RGO as a High-Performance Electrode for Alkaline Urea Oxidation. Electrocatalysis 2022, 13, 283–298. [Google Scholar] [CrossRef]
  19. Gurrola, M.P.; Escalona-Villalpando, R.A.; Arjona, N.; Ledesma-García, J.; Arriaga, L.G. Microfluidic Fuel Cells. In Encyclopedia of Electrochemistry; Wiley: Hoboken, NJ, USA, 2021; pp. 1–16. ISBN 9783527610426. [Google Scholar]
  20. Zhang, H.; Wang, Y.; Wu, Z.; Leung, D.Y.C. A Direct Urea Microfluidic Fuel Cell with Flow-through Ni-Supported-Carbon- Nanotube-Coated Sponge as Porous Electrode. J. Power Sources 2017, 363, 61–69. [Google Scholar] [CrossRef]
  21. Chino, I.; Muneeb, O.; Do, E.; Ho, V.; Haan, J.L. A Paper Microfluidic Fuel Cell Powered by Urea. J. Power Sources 2018, 396, 710–714. [Google Scholar] [CrossRef]
  22. Ibrahim, O.A.; Navarro-Segarra, M.; Sadeghi, P.; Sabaté, N.; Esquivel, J.P.; Kjeang, E. Microfluidics for Electrochemical Energy Conversion. Chem. Rev. 2022, 7, 7236–7266. [Google Scholar] [CrossRef] [PubMed]
  23. Wang, Y.; Luo, S.; Kwok, H.Y.H.; Pan, W.; Zhang, Y.; Zhao, X.; Leung, D.Y.C. Microfluidic Fuel Cells with Different Types of Fuels: A Prospective Review. Renew. Sustain. Energy Rev. 2021, 141, 110806. [Google Scholar] [CrossRef]
  24. Mao, R.; Zhao, X.; Lan, H.; Liu, H.; Qu, J. Efficient Electrochemical Reduction of Bromate by a Pd/RGO/CFP Electrode with Low Applied Potentials. Appl. Catal. B Environ. 2014, 160–161, 179–187. [Google Scholar] [CrossRef]
  25. Liu, Y.; Liu, L.; Shan, J.; Zhang, J. Electrodeposition of Palladium and Reduced Graphene Oxide Nanocomposites on Foam-Nickel Electrode for Electrocatalytic Hydrodechlorination of 4-Chlorophenol. J. Hazard. Mater. 2015, 290, 1–8. [Google Scholar] [CrossRef] [PubMed]
  26. Li, J.; Zhou, P.; Li, F.; Ren, R.; Liu, Y.; Niu, J.; Ma, J.; Zhang, X.; Tian, M.; Jin, J.; et al. Ni@Pd/PEI-RGO Stack Structures with Controllable Pd Shell Thickness as Advanced Electrodes for Efficient Hydrogen Evolution. J. Mater. Chem. A 2015, 3, 11261–11268. [Google Scholar] [CrossRef]
  27. Ge, L.; Zhang, M.; Wang, R.; Li, N.; Zhang, L.; Liu, S.; Jiao, T. Fabrication of CS/GA/RGO/Pd Composite Hydrogels for Highly Efficient Catalytic Reduction of Organic Pollutants. RSC Adv. 2020, 10, 15091–15097. [Google Scholar] [CrossRef]
  28. Zhang, J.W.; Zhang, B.; Zhang, X. Enhanced Catalytic Activity of Ternary NiCoPd Nanocatalyst Dispersed on Carbon Nanotubes toward Methanol Oxidation Reaction in Alkaline Media. J. Solid State Electrochem. 2017, 21, 447–453. [Google Scholar] [CrossRef]
  29. Wagner, C.D.; Riggs, W.M.; Davis, L.E.; Moulder, J.F.; Muilenberg, G.E. Handbook of X-Ray Electron Spectroscopy. Perkin-Elmer Corp. 1979, 192, 72–73. [Google Scholar]
  30. Shin, Y.-E.; Sa, Y.J.; Park, S.; Lee, J.; Shin, K.-H.; Joo, S.H.; Ko, H. An Ice-Templated, PH-Tunable Self-Assembly Route to Hierarchically Porous Graphene Nanoscroll Networks. Nanoscale 2014, 6, 9734–9741. [Google Scholar] [CrossRef]
  31. Jaleh, B.; Nasrollahzadeh, M.; Eslamipanah, M.; Nasri, A.; Shabanlou, E.; Manwar, N.R.; Zboril, R.; Fornasiero, P.; Gawande, M.B. The Role of Carbon-Based Materials for Fuel Cells Performance. Carbon N. Y. 2022, 198, 301–352. [Google Scholar] [CrossRef]
  32. Guo, Y.; Liu, X.; Li, Y.; Ma, F.; Zhang, Q.; Wang, Z.; Liu, Y.; Zheng, Z.; Cheng, H.; Huang, B.; et al. Anion-Modulation in CoMoO4 Electrocatalyst for Urea-Assisted Energy-Saving Hydrogen Production. Int. J. Hydrogen Energy 2022, 47, 33167–33176. [Google Scholar] [CrossRef]
  33. Wang, C.; Du, X.; Zhang, X. Controlled Synthesis of Fe Doped NiCoM (M=O, P, S and Se) as Robust Electrocatalyst for Urea Electrolysis. J. Alloys Compd. 2022, 928, 167094. [Google Scholar] [CrossRef]
  34. Durrani, S.K.; Naz, S.; Mehmood, M.; Nadeem, M.; Siddique, M. Structural, Impedance and Mössbauer Studies of Magnesium Ferrite Synthesized via Sol–Gel Auto-Combustion Process. J. Saudi Chem. Soc. 2017, 21, 899–910. [Google Scholar] [CrossRef]
  35. Easa, J.; Yan, C.; Schneider, W.F.; O’Brien, C.P. CO and C3H6 Poisoning of Hydrogen Permeation across Pd77Ag23 Alloy Membranes: A Comparative Study with Pure Palladium. Chem. Eng. J. 2022, 430, 133080. [Google Scholar] [CrossRef]
  36. Zou, H.; Chen, J.; Fang, Y.; Ding, J.; Peng, W.; Liu, R. A Dual-Electrolyte Based Air-Breathing Regenerative Microfluidic Fuel Cell with 1.76 V Open-Circuit-Voltage and 0.74 V Water-Splitting Voltage. Nano Energy 2016, 27, 619–626. [Google Scholar] [CrossRef]
  37. Nguyen, P.K.T.; Kim, J.; Yoon, Y.S.; Yoon, H.H.; Hur, J. Mathematical Modeling of a Direct Urea Fuel Cell. Int. J. Hydrogen Energy 2023, 48, 2314–2327. [Google Scholar] [CrossRef]
  38. Nangan, S.; Ding, Y.; Alhakemy, A.Z.; Liu, Y.; Wen, Z. Hybrid Alkali-Acid Urea-Nitrate Fuel Cell for Degrading Nitrogen-Rich Wastewater. Appl. Catal. B Environ. 2021, 286, 119892. [Google Scholar] [CrossRef]
  39. Morales-Acosta, D.; Flores-Oyervides, J.D.; Rodríguez-González, J.A.; Sánchez-Padilla, N.M.; Benavides, R.; Fernández-Tavizón, S.; Mercado-Silva, J.A. Comparative Methods for Reduction and Sulfonation of Graphene Oxide for Fuel Cell Electrode Applications. Int. J. Hydrogen Energy 2019, 44, 12356–12364. [Google Scholar] [CrossRef]
  40. Cruz, J.C.; Baglio, V.; Siracusano, S.; Ornelas, R.; Arriaga, L.G.; Antonucci, V.; Aricò, A.S. Nanosized Pt/IrO2 Electrocatalyst Prepared by Modified Polyol Method for Application as Dual Function Oxygen Electrode in Unitized Regenerative Fuel Cells. Int. J. Hydrogen Energy 2012, 37, 5508–5517. [Google Scholar] [CrossRef]
  41. Cruz, J.C.; Rivas, S.; Beltran, D.; Meas, Y.; Ornelas, R.; Osorio-Monreal, G.; Ortiz-Frade, L.; Ledesma-García, J.; Arriaga, L.G. Synthesis and Evaluation of ATO as a Support for Pt-IrO2 in a Unitized Regenerative Fuel Cell. Int. J. Hydrogen Energy 2012, 37, 13522–13528. [Google Scholar] [CrossRef]
  42. Escalona-Villalpando, R.A.; Dector, A.; Dector, D.; Moreno-Zuria, A.; Durón-Torres, S.M.; Galván-Valencia, M.; Arriaga, L.G.; Ledesma-García, J. Glucose Microfluidic Fuel Cell Using Air as Oxidant. Int. J. Hydrogen Energy 2016, 41, 23394–23400. [Google Scholar] [CrossRef]
  43. Escalona-Villalpando, R.A.; Gurrola, M.P.; Trejo, G.; Guerra-Balcázar, M.; Ledesma-García, A.L. Electrodeposition of Gold on Oxidized and Reduced Graphite Surfaces and Its Influence on Glucose Oxidation. J. Electroanal. Chem. 2018, 816, 92–98. [Google Scholar] [CrossRef]
  44. Alonso-Vante, N. Electroquímica y Electrocatálisis: Materiales: Aspectos Fundamentales Y Aplicaciones; E-libro.net: Miami, FL, USA, 2003; ISBN 1413501001. [Google Scholar]
Figure 1. (a) SEM images of the electrodes (anode and cathode). (b) powder X-ray diffraction (XRD) pattern of Pd/rGO.
Catalysts 13 00788 g001
Figure 2. Comparison of high-resolution XPS of Pd/rGO before and after evaluation of DUµFC performance. (a) General spectra of Pd/rGO; (b) spectra in the Pd 3d; (c) spectra in the C 1 s region; and (d) spectra in the O 1 s region.
Catalysts 13 00788 g002
Figure 3. DUµFC performance under different flow rates, using 5 M urea in 1 M KOH and 1 M H2SO4 as the anolyte and catholyte, respectively, and applying 10 mV s−1 as the polarization curve.
Catalysts 13 00788 g003
Figure 4. DUµFC performance under different conditions: (a) [Urea] variation at a constant anolyte and catholyte concentration; (b) [KOH] variation at a constant fuel and catholyte concentration; (c) [H2SO4] variation and constant anolyte concentration; (d) current density limit (jlim), OCV and maximum density (Pmax) under different conditions.
Catalysts 13 00788 g004
Figure 5. DUµFC performance using urea from urine as fuel.
Catalysts 13 00788 g005
Scheme 1. Schematic illustration of the DUµFC configuration. The operation in flow-through electrolytes with independent inlets and the coupling of the catalysts.
Catalysts 13 00788 sch001
Table 1. Variations of the parameters for the anodic and cathodic current optimizations of the DUµFC.
Fuel
(Urea)/mol L−1
Anolyte
(KOH)/mol L−1
Catholyte
(H2SO4)/mol L−1
[KOH] = 0.5 M, [H2SO4] = 1 M[UreaOptimal]= 5 M, [H2SO4] =1 M[KOHOptimal] = 3 M, [UreaOptimal] = 5 M
0.10.10.5
10.31
30.51.5
50.7
1
2
3
Disclaimer/Publisher’s Note: The statements, opinions and data contained in all publications are solely those of the individual author(s) and contributor(s) and not of MDPI and/or the editor(s). MDPI and/or the editor(s) disclaim responsibility for any injury to people or property resulting from any ideas, methods, instructions or products referred to in the content.