Article

Production of Fructooligosaccharides Using a Commercial Heterologously Expressed Aspergillus sp. Fructosyltransferase

by
Klaudia Karkeszová
and
Milan Polakovič
*
Department of Chemical and Biochemical Engineering, Institute of Chemical and Environmental Engineering, Faculty of Chemical and Food Technology, Slovak University of Technology, Radlinského 9, 812 37 Bratislava, Slovakia
*
Author to whom correspondence should be addressed.
Catalysts 2023, 13(5), 843; https://doi.org/10.3390/catal13050843
Submission received: 27 March 2023 / Revised: 19 April 2023 / Accepted: 4 May 2023 / Published: 6 May 2023
(This article belongs to the Special Issue Enzyme Catalysis: Advances, Techniques and Outlooks)

Abstract

:
The catalytic properties of Seqenzym® FT, a fungal fructosyltransferase heterologously expressed in yeasts, were investigated at a temperature of 55 °C and pH 5.5. The initial rate measurements showed that the transfructosylation rate was only slightly inhibited by sucrose above the concentration of 1.5 M. A rather low level of hydrolytic side activity was observed even at sucrose concentrations as low as 0.25 M. In progress curve experiments, the mass yield of fructooligosaccharides (FOS) reached a maximum value of 57% at this sucrose concentration, although it dropped to about 35% later on. At high initial sucrose concentrations up to 2 M, the FOS yield reached a maximum value of approximately 63% at a sucrose conversion of approximately 90%. Although neither the yield nor the conversion changed much later on, the progress of the reaction was manifested by the gradual depletion of shorter chain FOS, 1-kestose and nystose, and the accumulation of 1-β-fructofuranosyl nystose. At initial sucrose concentrations of 2 M, the degree of polymerization expressed through the number of fructosyl units grew from 2.3 at a conversion degree of 87% to 3.1 at a conversion degree of 94%. Compared to other commercial preparations, Seqenzym® FT can better produce FOS with a higher degree of polymerization.

1. Introduction

Short inulin-type fructooligosaccharides (FOS) are described as fructans, commonly containing from two to ten fructose units bound together via β(1,2)-glycosidic bonds and terminated with a glucose residue. FOS have a strong bifidogenic effect on intestinal health; for this reason, they are classified as prebiotics and have gained a large amount of interest [1]. The stimulation of the growth of beneficial bacteria in the large intestine confers a variety of health benefits, such as immunomodulatory effects, improved mineral absorption, and reduced total cholesterol levels. FOS are present in nature (in onions, bananas, and Jerusalem artichokes) and can also be synthesized by microorganisms, such as Aspergillus sp., Aureobasidium sp., Penicillium sp., Arthrobacter sp., etc. [2].
Microbial synthesis allows their mass production and guarantees year-round access to FOS. Due to their positive impact on human well-being, their production is in persistent global demand from food and pharmaceutical industries. They are commonly included in infant formulas or digestive aid tablets to influence the intestines’ metabolic activity [3]. FOS have also been used as a low-calorie alternative in several dairy and bakery products. Due to their characteristics, they can improve the organoleptic properties of products and their self-life [4]. It has been reported that 1-kestose is responsible for the prebiotic effect of commercial FOS mixtures [5,6]. On the other hand, higher FOS oligomers can provide other benefits for their application in food products, such as lower sweetness or higher viscosity levels [7].
The preparation of the most common FOS, 1-kestose (GF2), nystose (GF3), and 1-β-fructofuranosyl nystose (GF4), is generally carried out using sucrose mainly by the action of fructosyltransferases (FTases) or β-fructosidases that possess transfructosylating activity [8]. The transfructosylation of sucrose starts with the cleavage of fructose, which is subsequently transferred to a saccharide acceptor, such as sucrose or fructooligosaccharide. The production of FOS is a complex process involving several simultaneous reactions, whereas the synthesized FOS acts as both a donor and an acceptor in the synthesis of FOS with a higher number of fructose moieties [7].
In recent years, different biotechnological approaches have been investigated for the synthesis of FOS. The composition of the FOS mixture produced depends on the enzyme source, substrate concentration, reaction time, temperature, and pH [9]. The key to efficient FOS production is the high fructosyltransferase activity level of the microbial enzyme. This is determined by the type of microbial source itself, but it can also be affected by the reaction conditions. Most isolated enzymes exhibit transferase and some hydrolytic activity. The correct ratio of these two activities is important for the efficiency of sucrose conversion in FOS and is mainly determined by the concentration of sucrose in the reaction medium [10]. Transfructosylation activity is greatly enhanced at sucrose concentrations above 300 g/L [4,11].
The studies published thus far usually agree on the following optimal FOS production conditions: a temperature in the range from 50 °C to 60 °C, pH values of 4.5–6.5, and sucrose concentration above 50% (w/v). Under the latter conditions, the maximum FOS yield was between 50% and 60% (g FOS/g sucrose) [7,8,12,13]. The highest values reported are slightly above 60% at approximately 90% sucrose conversion. It should be emphasized that the theoretical yields for the complete sucrose conversion are 73.6% for 1-kestose, 64.9% for nystose, and 60.5% for 1-β-fructofuranosyl nystose. Thus, the FOS yield decreases with the progress of the reaction.
Generally, fructosyltransferases from filamentous fungi, Aspergillus sp. or Aureobasidium sp., are among the most efficient industrial FOS producers. Fructosyltransferases from these microorganisms can be used in the form of a whole-cell catalyst under controlled cultivation or as purified enzyme preparations. The latter ones facilitate the biocatalytic process by excluding the tedious cultivation and purification step to obtain FTases with sufficient transfructosylation activity [14,15]. Many commercial enzyme preparations (pectinases, polygalacturonases, and glucanases) also have the potential to produce FOS because of their FTase side activity [15,16,17].
Several authors have observed that industrially relevant wild-type strains often do not provide a single enzyme, but there are several that transform sucrose either via transfructosylation or via hydrolysis [18,19,20]. For example, Yoshikawa et al. isolated four fructofuranosidases with high transferase activity and one form with higher hydrolytic activity from an Aureobasidium pullulans strain [19]. It was also demonstrated that the expression of favorable fructofuranosidases in Aspergillus sp. can be induced by the cultivation medium composition [18,20]. Much progress in the optimization of FTase-producing strains was made by genetic engineering techniques [21].
Kurakake et al. were probably the first people to identify the gene encoding FTase [20]. Several authors have recently focused on the production of recombinant FTases mainly from Aspergillus niger overproduced in Pichia pastoris [22,23,24,25]. The overproduction of recombinant FTase can significantly decrease the cost of the enzyme. For example, two different works declared about a 1000 times higher productivity level of the cultivation bioreactor for the recombinant strain compared to that of the wild-type strain [24,25]. The development of bioinformatics tools have provided a better understanding of the catalytic mechanism of different FTases and enabled their in silico evaluation as efficient FOS producers [23,26,27]. Very recently, some authors combined the results of molecular modeling with site-directed mutagenesis and enzyme overproduction [23,28]. Xia et al. developed an FTase with an about six times higher specific activity level than that of the wild-type enzyme and improved affinity as well as thermal stability [23].
It is not surprising that the optimization of FTases via genetic engineering techniques has attracted not only the academia, but also industry. The French company, Protéus by Seqens, developed Seqenzym® FT, a high-performance enzyme preparation used for FOS synthesis [29]. The microbial source of Seqenzym® FT is a wild-type filamentous fungus of Aspergillus sp. The gene encoding this fungal fructosyltransferase has been sequenced, synthesized without modification, and heterologously expressed in a host cell. The expression system has been genetically modified mainly by the deletion of genes that encode the secretion of enzymes that compete with fructosyltransferase by altering the yield of sucrose conversion to FOS.
In this work, Seqenzym® FT has been studied for its catalytic properties in FOS production. Initial rate and progress curve methods were used to investigate the effect of sucrose concentration on the transfructosylation and hydrolysis rates and the yield of FOS. Furthermore, the kinetics of the formation of FOS was investigated using different enzyme concentrations. The composition of the FOS mixture during the reaction progress was analyzed, and the degree of polymerization was evaluated. From this aspect, the performance of Seqenzym® FT was compared with other enzyme preparations.

2. Results and Discussion

2.1. Effect of Sucrose Concentration—Initial Rate Measurements

Sucrose concentrations in the range from 85 g/L (250 mM) to 685 g/L (2000 mM) were used to establish its effect on the rate of transfructosylation and yield in FOS production mediated by Seqenzym® FT. Other operating conditions such as pH and temperature were selected based on the literature overview presented in the Introduction Section. The effect of sucrose concentration was investigated using the initial rate method and progress curve measurements.
Figure 1 presents the results of the initial rate method. It is evident from this plot that the hydrolytic activity level of Seqenzym® FT was rather low throughout the concentration range and that the total activity was almost identical to the transfructosylation activity. To be more accurate, no detectable hydrolytic activity was observed at the highest sucrose concentrations (1.5 M and 2.0 M).
The ratio of transfructosylation and hydrolytic activity at 250 mM was about nine. This result is very similar to those observed by other authors for enzymes from Aspergillus sp. [30] or Aureobasidium sp. [19]. On the other hand, commercial preparations from other species with fructosyltransferase side activity (Rohapect CM, Viscozyme L, and Pectinex Ultra SP-L) had several times higher levels of hydrolytic side activity at 1000 mM sucrose [15]. It is clearly legible from the dependence shown in Figure 1 that the initial rate of the transfructosylation reaction follows Michaelis–Menten kinetics up to a substrate concentration of 1500 mM. At 2000 mM sucrose, a slight decrease in the reaction rate was observed, which is common due to the thermodynamic properties of highly concentrated sucrose solutions [31].
The difference between the maximum rate and the rate at 2000 mM was only 5%. A similar result was obtained by L’Hocine et al. for a highly purified FTase from wild-type A. niger [18]. These authors used four chromatographic steps to separate FTase from invertase. On the other hand, wild-type enzyme preparations with a lower degree of purification had a greater difference between the rates at maximum and at 2.0 M sucrose. For example, this difference was about 15% in the work by Antošová et al. [11]. Thus, Seqenzym® FT has an advantageous substrate concentration effect.

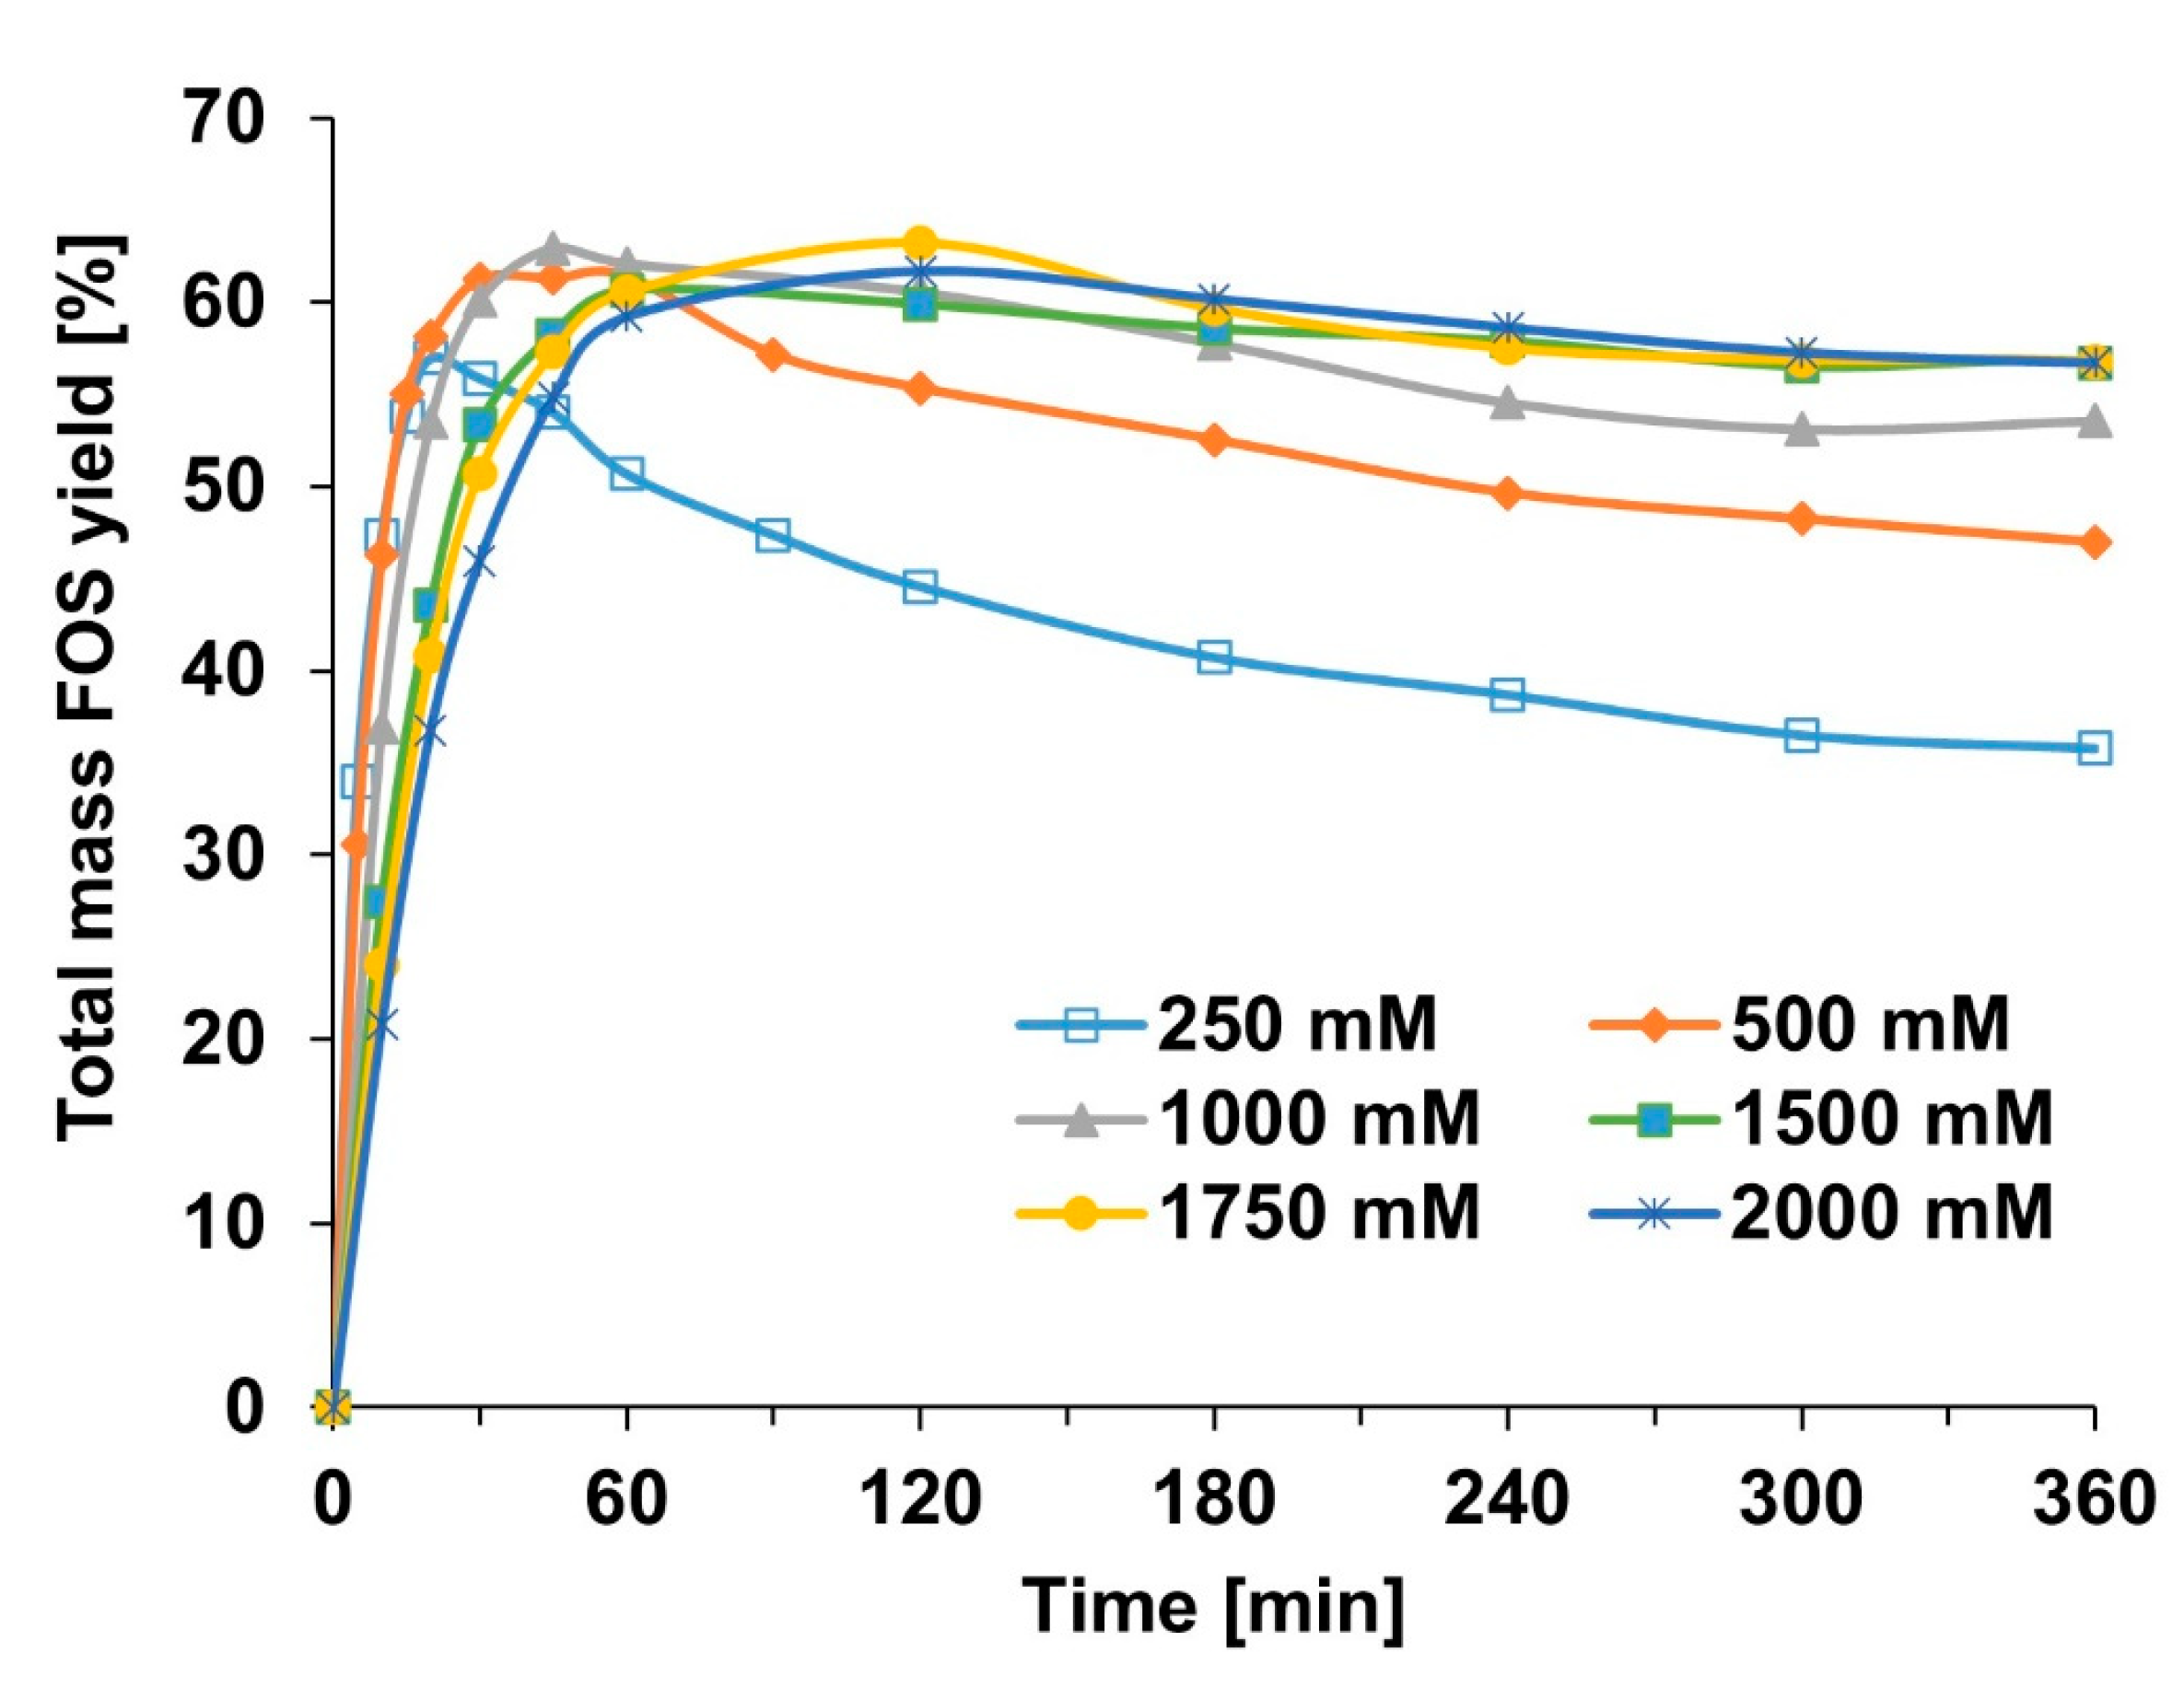
2.2. Effect of Sucrose Concentration—Progress Curve Measurements

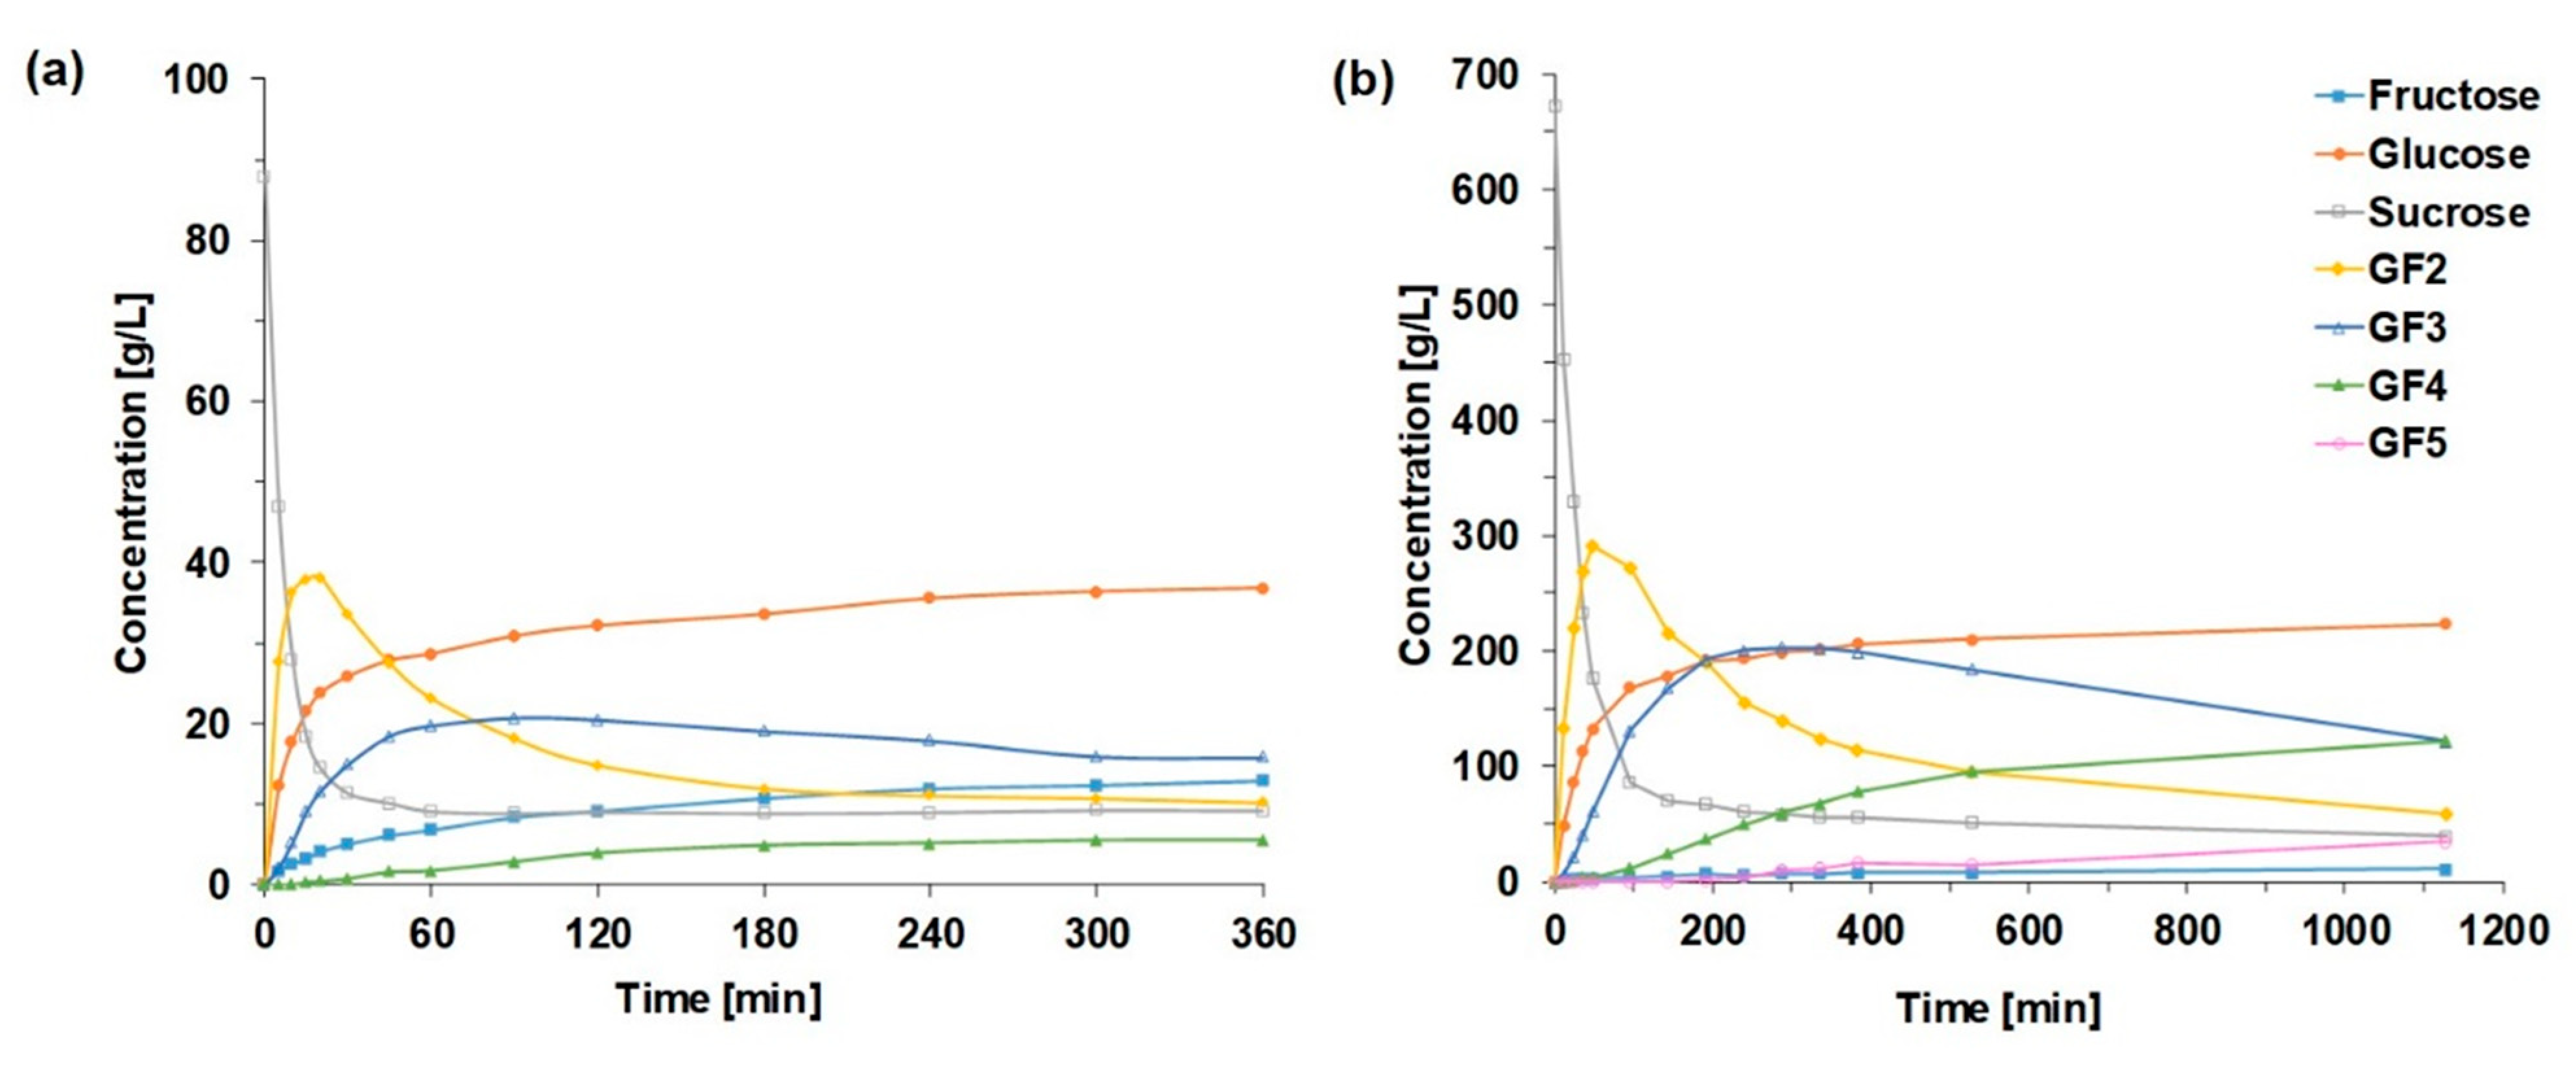
2.2.1. Saccharide Concentration Courses

The influence of initial sucrose concentrations was also investigated in progress curve experiments. The same concentrations were used as for the initial rate measurements. Figure 2 illustrates the courses of individual saccharide concentrations for two initial concentrations: 250 mM (Figure 2a) and 2000 mM (Figure 2b). Progress curves for the remaining concentrations are included in the Supporting Information (Figures S1–S4). Figure 2a,b shows the difference between the effects of the lowest and highest initial sucrose concentrations. As was concluded above, sucrose hydrolysis takes place to a certain degree at 250 mM. Figure 2a confirms this conclusion when hydrolysis is manifested by the formation of fructose during the entire reaction time. After 6 h, fructose made up 14% of the total sugar content in the reaction medium.
However, Figure 2a also confirms that consecutive transfructosylation reactions prevailed even at this low sucrose concentration. The very fast formation of 1-kestose, produced in the first step from two sucrose molecules, occurred when its maximum was reached at around 15–20 min. After this time, 1-kestose primarily acted as a fructosyl acceptor in the synthesis of nystose, an FOS oligomer with a higher degree of polymerization. This reaction was exhibited by a decelerated decrease in 1-kestose concentration until the end of the experiment. The same reaction pattern was repeated for the synthesis of 1-β-fructofuranosyl nystose from nystose, which caused a gradual conversion of FOS with a lower degree of polymerization to higher forms [4]. Nystose also reached a maximum at 90 min, which was followed by a slow decline. Only the GF4 concentration grew during the whole process.
Figure 2b shows that similar shapes of the FOS progress curves were observed at the highest sucrose concentration of 2000 mM, although they lasted for three times longer. The positions of maxima of GF2 and GF3 were also shifted by a time factor of three. Approximately 300 g/L of GF2 was obtained in 1 h, and about 200 g/L of GF3 was obtained in 4–5 h. The amount of GF4 grew again until the end of the experiment, and it reached approximately 120 g/L after 19 h. In this experiment, the formation of a higher oligomer, GF5, was observed. It appeared in measurable amounts at about 4 h, and its concentration increased to 42 g/L.
The reaction mixture also contained approximately 225 g/L of the main by-product, glucose, and approximately 40 g/L of the residual substrate, sucrose. Although the initial rate measurements indicated a zero rate of sucrose hydrolysis to fructose, a small amount of fructose, 10 g/L, was found in the reaction mixture at the end of the experiment. However, the phenomenon of fructose formation cannot be interpreted unequivocally via sucrose hydrolysis in this case. At high initial sucrose concentrations, fructose can be released primarily from FOS, which are hydrolyzed much more easily than sucrose is [11,30]. The tendency of FOS to hydrolyze increases with the degree of polymerization [30].
As was mentioned in the Introduction Section, high initial sucrose concentrations are applied in the industrial FOS production. In the experiment presented in Figure 2b, the final concentration of FOS was 340 g/L, but the highest value of 420 g/L was achieved after about 2 h. Thus, shorter reaction times for the enzyme concentration used in this series of experiments were more relevant from the point of view of the maximization of FOS yield.

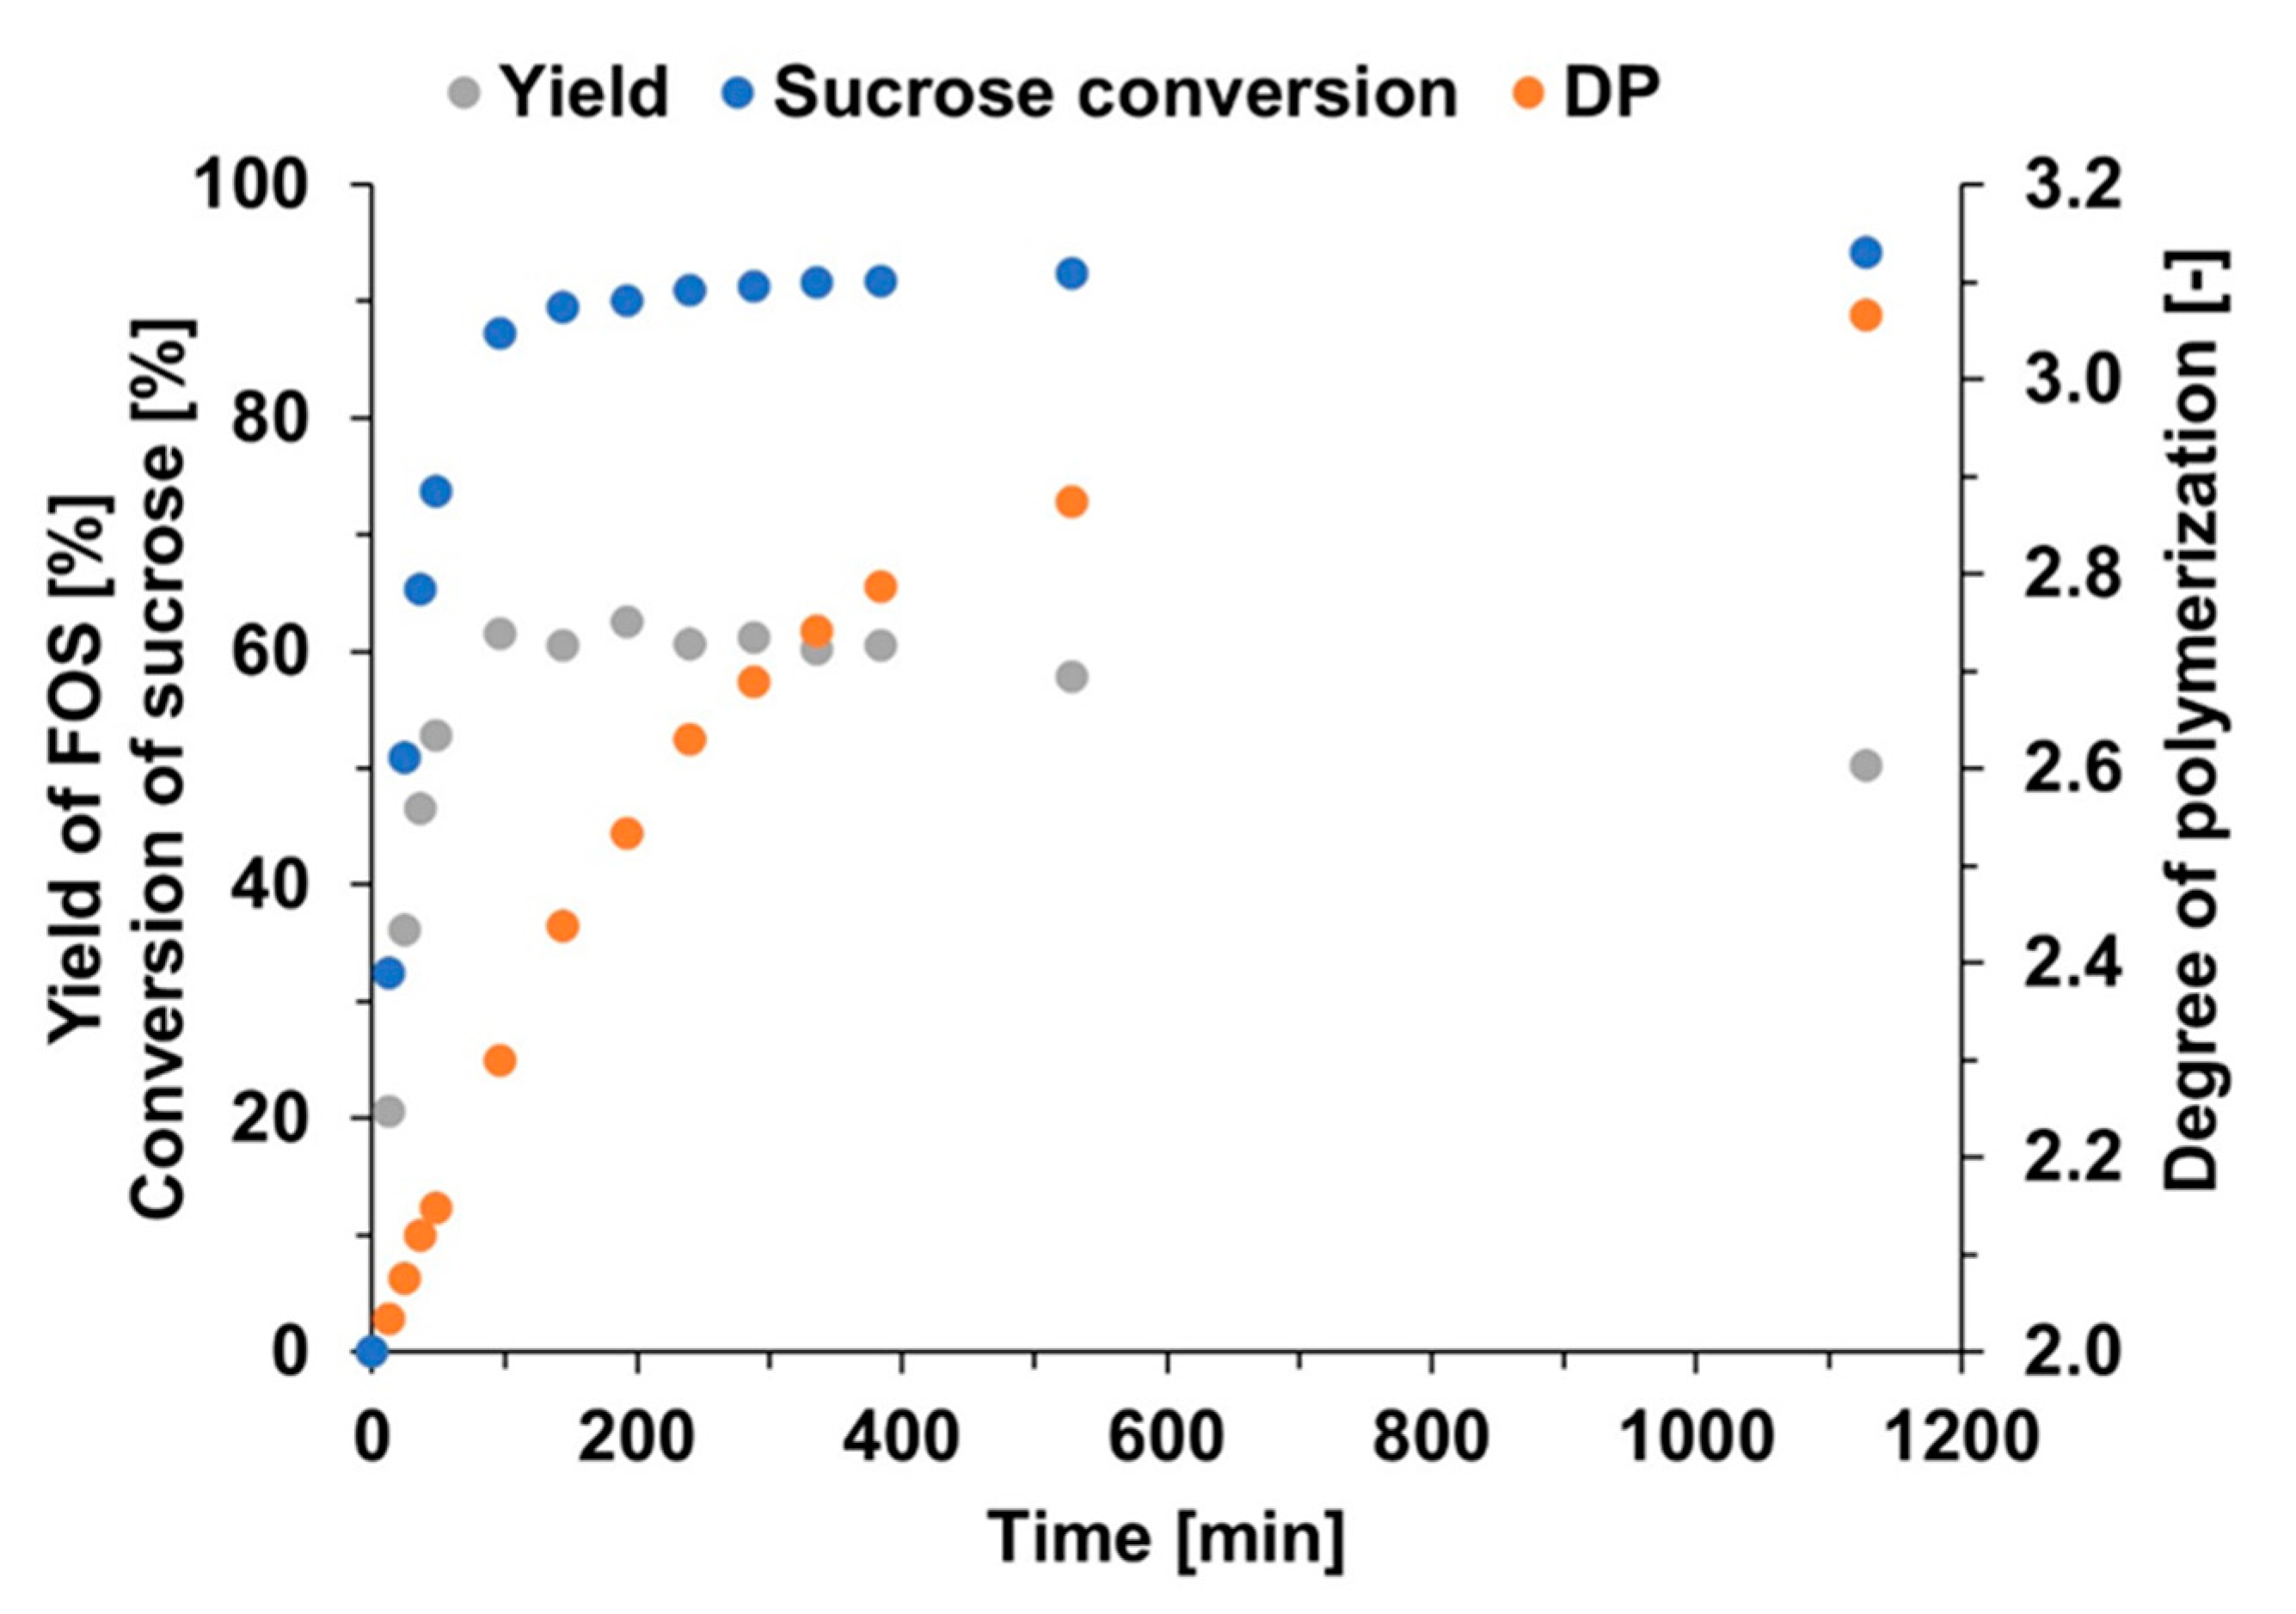
2.2.2. Courses of FOS Yield and Degree of Polymerization

Figure 3 presents the FOS yield courses for all initial sucrose concentrations. These results demonstrate the strong ability of Seqenzym® FT to transform sucrose into fructooligosaccharides. It is interesting that the FOS yield reached a maximum close to 60% also at the lowest initial sucrose concentration of 250 mM, where a higher level of hydrolytic activity of this enzyme was expected. However, after reaching the maximum yield of 57% at 20 min, a rapid decrease to 35% was observed. Of course, a part of this decline must be associated with the increase in higher oligomeric forms, but the crucial part was caused by the hydrolysis of sucrose and FOS.
At initial sucrose concentrations greater than 250 mM, the maximum FOS yields reached approximately the same value of 63%. This value means that Seqenzym® FT is assigned to the commercial enzyme preparations with the highest FOS yield [15]. It means that the concentration of the FOS formed proportionally increased with the initial sucrose concentration. However, the later decline in FOS yield had some correlation with the initial sucrose concentration. It was evidently still quite fast at 500 mM and was slightly faster at 1000 mM than it was at three higher concentrations, at which no significant differences in the yield course were observed. This outcome is another piece of evidence of the significant suppression of hydrolytic activity of Seqenzym® FT at high sucrose concentrations. This is also indicated by the final amounts of fructose, which represented 1–3% of the total saccharides (Figures S1–S4).
The FOS yields for the three highest sucrose concentrations presented in Figure 3 decreased to 57% after 6 h. Figure 4 shows the course of the FOS yield for the initial sucrose concentration of 2 M for the extended period of 19 h. It shows a further drop in FOS yield to 50%. This figure also shows the sucrose conversion and DP of FOS (Equation (1)). The three curves were evaluated using the saccharide progress curves presented in Figure 2b. In fact, the course of sucrose conversion was very typical for all initial sucrose concentrations (Figure S5). Conversion occurred very quickly in the initial phase, during which the GF2 concentration reached a maximum. The conversion degree reached about 75% after 1 h. During the following 1 to 2 h, the conversion degree approached 90%.
The period of the fast increase was stopped at this conversion value. The course of sucrose conversion gives an impression of the existence of apparent pseudo-equilibrium at 92%, which is similar to those in our earlier papers [11,16]. However, this longer experiment showed that the sucrose conversion degree grew slowly to 94% during the period of the subsequent transformation of lower FOS oligomers into higher ones. This very small change in sucrose concentration means that the rate of consumption of sucrose as a donor of fructosyl moieties and the rate of sucrose formation by 1-kestose hydrolysis are approximately equal.
The progress curve of DP presented in Figure 4 quantifies the increase in the mean size of the FOS oligomers during the reaction. The DP starts at the value of two at zero time. The rate of increase in DP was much slower than those of sucrose conversion or FOS yield were. The DP was about 2.3 at the time when the conversion approached 90% and the yield was 60%. In the period of more-or-less constant conversion and yield, which lasted until about 6 h, the DP increased to a value of about 2.7. Until the end of the experiment, at the 19th hour, the DP increased to 3.1. These results show that the reaction time can be used to control the optimal composition of the FOS mixture with regard to its application.
Table 1 compares the DP values of the FOS mixtures achieved using Seqenzym® FT, fructosyltransferase from Aerobasidium pullulans [11] and three commercial enzyme preparations [15]. The DP values were compared for the products obtained at three different sucrose conversions: 85%, 90%, and 92%. Table 1 shows that the DP value at 85% sucrose conversion was around 2.3 for Seqenzym® FT, Rohapect CM, and Pectinex SP-L. Two other enzymes, Viscozyme L and A. pullulans, synthesized FOS with a slightly lower DP: about 2.25. At higher substrate conversions, the mixtures produced via Seqenzym® FT had higher values of DP than those prepared using other FOS-producing biocatalysts did. At the conversion of 92%, this difference was approximately 0.2–0.3. This result indicates that Seqenzym® FT possesses a good capability to generate longer-chain FOS.

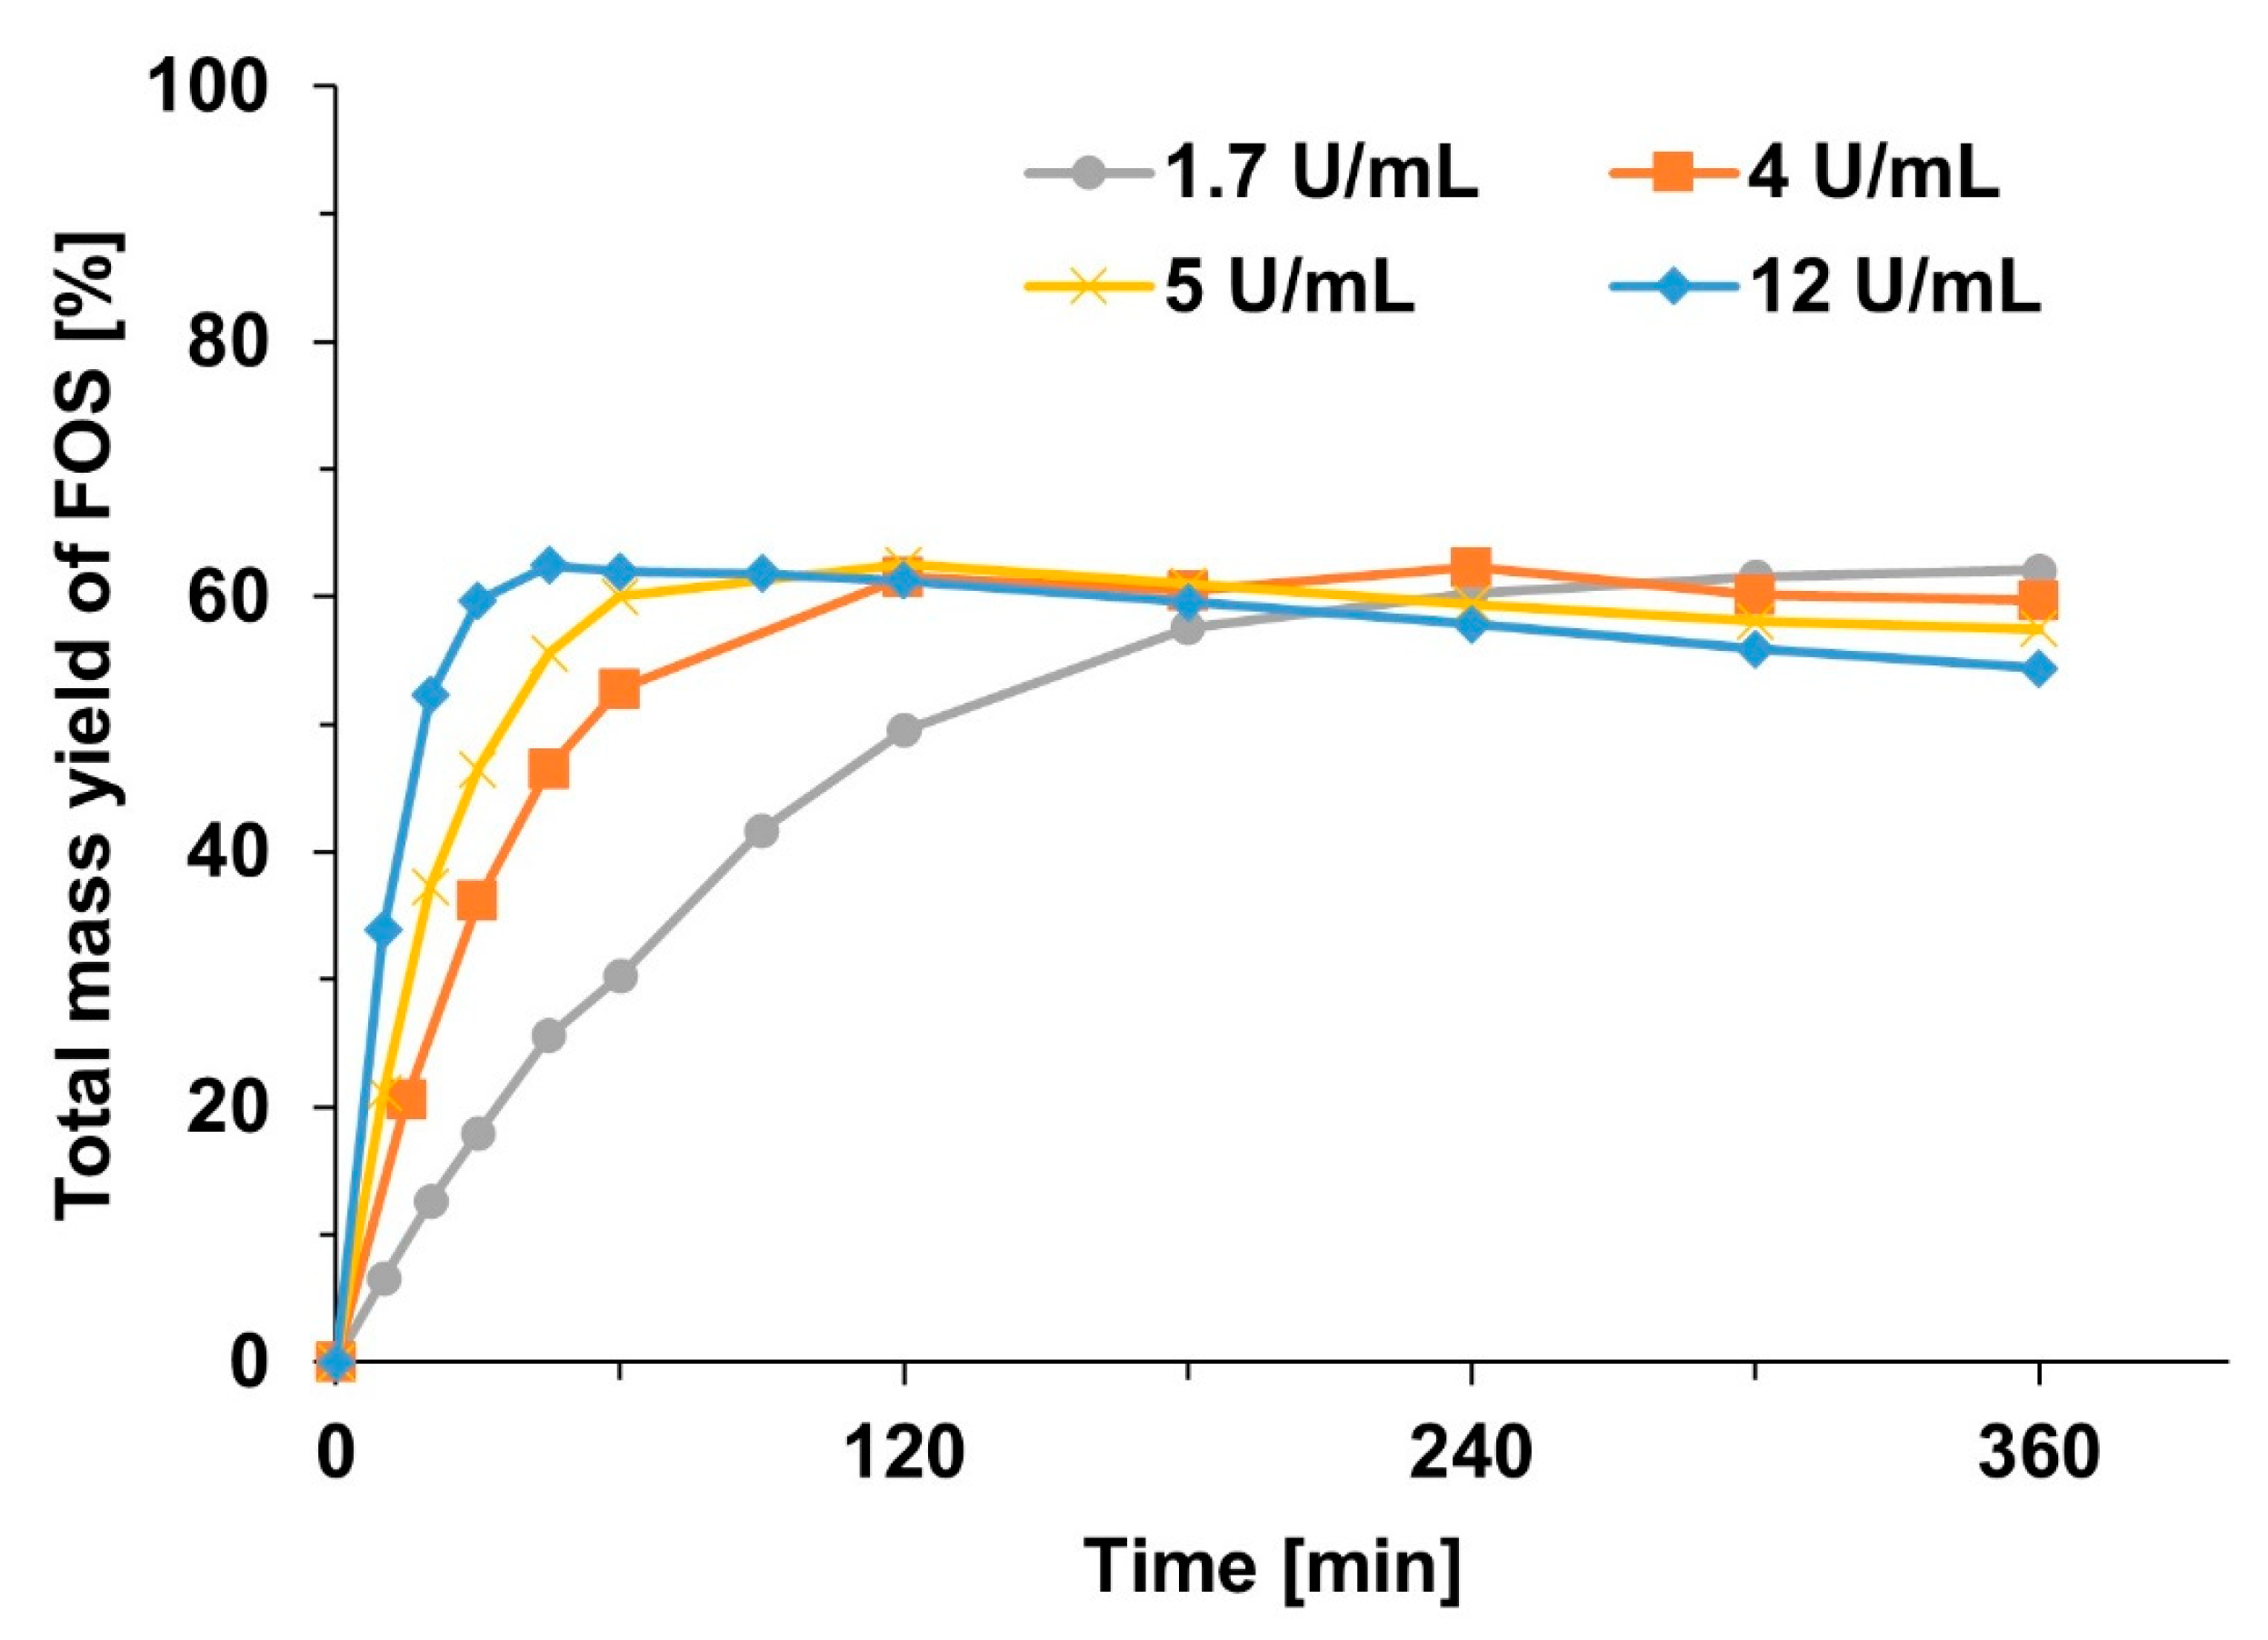
2.3. Effect of Enzyme Concentration

The essential parameters of the economics of biocatalytic production processes are the cost of the biocatalyst and the total turnover number of biocatalysts. These two quantities are closely interrelated. In general, cheaper biocatalysts have a less specific activity and, therefore, a lower turnover number. Therefore, larger amounts of biocatalysts are needed per unit amount of product. In contrast, highly active biocatalysts can be very expensive due to numerous advanced separation techniques used for their preparation. This is often the case with novel biocatalysts presented in scientific papers.
The specific activity of industrial preparations is typically the result of the trade-off between performance and cost. For that reason, it is reasonable to compare the specific activity of Seqenzym® FT with the specific activity of preparations that can be used on a large scale. However, comparison with the data from other authors is complicated by the lack of unified methods of activity determination. However, the specific activity of around 2000 U/mL Seqenzym® FT implies that this biocatalyst is very efficient, and its consumption per unit amount of FOS product will be low.
Its specific activity can be directly compared with those of the preparations examined in the paper by Hollá et al., since the same activity determination method was used [16]. Seqenzym® FT has an about 30 times higher specific activity level than Pectinex Ultra SP-L does and an about 70 times higher level than that of Viscozyme L. The only commercial preparation that could have had the specific activity of the same order of magnitude as Seqenzym® FT is Rohapect CM [15].
When a particular biocatalyst is applied in the production process, its concentration determines the volumetric productivity of the bioreactor. Overly low concentrations result in very long reaction times, which is not effective. On the other hand, overly high concentrations complicate the control of achieving the required product composition. For this reason, the effect of the concentration of Seqenzym® FT on the course of the reaction was investigated. In addition to the enzyme activity of 5 U/mL presented in previous parts, three other enzyme concentrations in the range from 1.7 to 12 U/mL were applied.
Figure 5 shows the progress curves of the FOS yields using these different enzyme concentrations. The results correspond to the theoretical assumption that the time when the same conversion is reached is inversely proportional to the enzyme concentration if the enzyme inactivation is negligible. Figure 5 also confirms that the concentration of about 5 U/mL is optimal for producing short-chain FOS with a relatively low DP. At the concentration of 1.7 U/mL, the conversion degree was still only 89% after 6 h. In contrast, at 12 U/mL, the decline in FOS yield already started after 45 min. Of course, the enzyme concentration can be customized if an FOS product with a higher DP is preferred.

3. Materials and Methods

3.1. Materials

3.1.1. Enzyme

Seqenzym® FT, a liquid form enzyme preparation [29], was kindly donated by Protéus by Seqens (Ecully, France). The fructosyltransferase gene originating from an Aspergillus sp. was sequenced and produced without any genetic adjustments. The yeasts, Pichia pastoris, Saccharomyces cerevisiae, or Yarrowia lipolytica, were selected as host cells for the heterologous expression of the fungal enzyme. Microbial expression systems were modified to be free of genes that encode enzymes with hydrolytic activity. These yeasts are expression systems for metabolites that ensure a high level of food safety without the co-expression of toxic compounds. The cultivation of these yeasts in a controlled environment allows the expression of the enzyme secreted into the culture medium. Enzyme purification steps involve centrifugation and filtration techniques. The activity of this enzyme preparation determined by the method described in Section 3.2.1 was 2009 U/mL, with a standard deviation of 38 U/mL.

3.1.2. Chemicals

Chemical reagents purchased from Sigma-Aldrich Produktions (Steinheim, Germany) were sucrose, glucose, and fructose. Buffer components and methanol used for purity pro analysis were purchased from Centralchem (Bratislava, Slovakia). BioLaTest Glu 500 was obtained from Erba Lachema (Brno, Czech Republic). HPLC-grade acetonitrile was purchased from Merck (Darmstadt, Germany). Carbohydrate standards including 1-kestose, nystose, and 1-β-fructofuranosyl nystose were purchased from Wako Pure Chemical (Osaka, Japan).

3.2. Analytical Methods

3.2.1. Enzyme Activity Assay

The total activity of Seqenzym® FT was determined using 146 mM sucrose in 0.1 M citrate-phosphate buffer with pH 5.5. The reaction mixture consisted of 1.0 mL of the substrate solution and 0.1 mL of the enzyme preparation diluted suitably. The assay was carried out at 40 °C. Samples (100 µL) were taken at regular intervals, and the reaction was stopped by adding 100% methanol (300 µL). Released glucose was determined by taking a spectrophotometric measurement at 500 nm using the Bio-La-Test Glu colorimetric test. One unit of total enzyme activity was defined as the amount of enzyme that catalyzes the formation of 1 µmol of glucose per minute under the described assay conditions. The assay was carried out in triplicate. Results presented are the averages of the replicates.

3.2.2. HPLC Analysis

HPLC analyses were performed using an Agilent 1260 system equipped with an Asahipak NH2P-50 4E column (250 × 4.6 mm, 5 µm; Shodex, Tokyo, Japan) and an NH2P-50G 4A guard column (4.6 × 10 mm, 5 µm; Shodex, Japan) at a temperature that was maintained at 35 °C. The HPLC system was coupled to an Agilent 1110 refractive index (RI) detector operated at 35 °C and used for the determination of saccharides. The composition of the eluent was fixed at 68% acetonitrile/water (v/v). Samples withdrawn from the reaction medium were diluted to a final concentration of 68% (v/v) acetonitrile, filtered through 0.22 µm syringe filters, and analyzed at a flow rate of 1.0 mL/min. FOS and the other saccharides were quantified by the external standard method using the peak areas.

3.3. Biocatalytic Experiments

3.3.1. Initial Rate Measurements

Initial rate measurements were determined at different sucrose concentrations in the range from 250 mM to 2000 mM. Reactions were carried out at 55 °C in a 0.1 M citrate-phosphate buffer with pH 5.5. The enzyme concentration in the reaction mixture was 1.25 U/mL. For 20 min, seven aliquots of 100 µL were taken from a reaction mixture and mixed with 300 µL of 100% methanol to stop the reaction. The initial rate of transfructosylation was calculated from the slope of the linear region of 1-kestose formation over time. In the same way, but from the formations of fructose and glucose, respectively, the initial rate of hydrolysis and the total initial rate of the reaction were evaluated. The molar concentrations of the products in the samples were quantified by the HPLC analytical methods described in Section 3.2.2. All initial rate measurements were duplicated.

3.3.2. Progress Curve Measurements of Fructooligosaccharide Production

Effect of Initial Sucrose Concentration

The production of FOS was examined at six sucrose concentrations ranging from 250 mM to 2000 mM. The reaction conditions were 55 °C, 0.1 M citrate-phosphate buffer with pH 5.5, and an enzyme concentration of 5 U/mL. The final reaction volume was 4 mL. Aliquots of 100 µL were withdrawn at regular intervals and mixed with 300 µL of 100% methanol to terminate the reaction. Before HPLC analysis, the samples were diluted in the solution of acetonitrile/water (in % v/v: 68:32). All progress curve measurements were duplicated.
The total mass yield of FOS was calculated as a ratio of the sum of the mass concentrations of the produced FOS to the initial mass concentration of sucrose. The degree of polymerization (DP) of a mixture containing various FOS oligomers represents the average number of fructose units and is given by the following equation:
D P = i = 2 5 i x G F i i = 2 5 x G F i
where xGFi is the mole fractions of FOS.

Effect of Enzyme Concentration

The synthesis of FOS by Seqenzym® FT in 2 M sucrose was monitored, except for 5 U/mL, at three additional initial enzyme concentrations: 1.7 U/mL, 4 U/mL, and 12 U/mL. All other reaction conditions were the same as those given in Effect of Initial Sucrose Concentration. All progress curve measurements were duplicated.

4. Conclusions

Seqenzym® FT, a commercial enzyme preparation with a high specific transfructosylating activity, successfully synthesized short-chain inulin-type FOS. The initial rate measurements showed that the hydrolytic activity level of this enzyme was quite low even at the lowest sucrose concentration used (250 mM) and was not detectable at concentrations greater than 1 M. The level of substrate inhibition, common for this type of enzyme, was low.
A high transfructosylating activity level was demonstrated in progress curve experiments for different initial sucrose concentrations. The same maximum FOS yield, 63%, was reached for initial sucrose concentrations in the range from about 300 to 680 g/L. The levels of residual fructose formed by hydrolysis of sucrose, were less than 3% of the total saccharides. It was observed that the amount of 1-kestose formed in the very early phase quickly reached a maximum. It was transformed into nystose, which also reached a maximum content later on. Only the concentrations of higher FOS oligomers, GF4 and GF5, increased with time during the entire course of the reaction.
All FOS oligomers were subject to hydrolysis, and thus, contributed to the formation of fructose. The degree of polymerization of FOS produced by Seqenzym® FT achieved a value of about 2.3 for a product with a high 1-kestose content, but it increased to 3.1 when GF4 became the prevailing FOS oligomer. Seqenzym® FT provided FOS mixtures with a higher DP that is better than those of other industrial enzyme preparations. The investigation of the effect of enzyme concentration provided useful information about the optimal loading of Seqenzym® FT in practical applications. Taking into account all of these results, Seqenzym® FT is an excellent candidate for the industrial production of FOS.

Supplementary Materials

The following supporting information can be downloaded at: https://www.mdpi.com/article/10.3390/catal13050843/s1, Figure S1: Courses of individual saccharide concentrations for the FOS synthesis using 5 U/mL of Seqenzym® FT in 500 mM sucrose solution at pH 5.5 and 55 °C; Figure S2: Courses of individual saccharide concentrations for the FOS synthesis using 5 U/mL of Seqenzym® FT in 1000 mM sucrose solution at pH 5.5 and 55 °C; Figure S3: Courses of individual saccharide concentrations for the FOS synthesis using 5 U/mL of Seqenzym® FT in 1500 mM sucrose solution at pH 5.5 and 55 °C; Figure S4: Courses of individual saccharide concentrations for the FOS synthesis using 5 U/mL of Seqenzym® FT in 1750 mM sucrose solution at pH 5.5 and 55 °C; Figure S5: Conversion of sucrose at different initial concentrations of sucrose using 5 U/mL of Seqenzym® FT at pH 5.5 and 55 °C.

Author Contributions

Conceptualization, M.P.; methodology, K.K.; validation, K.K. and M.P.; formal analysis, K.K.; investigation, K.K.; resources, M.P.; data curation, K.K.; writing—original draft, K.K.; writing—review and editing, K.K. and M.P.; visualization, K.K.; supervision, M.P.; project administration, M.P., funding acquisition, M.P. All authors have read and agreed to the published version of the manuscript.

Funding

This work was supported by grants from the Slovak Research and Development Agency (grant number: APVV-18-0188), the Slovak Grant Agency for Science (grant number: VEGA 1/0515/22), and the Operational Program Integrated Infrastructure for the project “Support of research activities of Excellence laboratories STU in Bratislava” (grant no. 313021BXZ1) co-financed by the European Regional Development Fund.

Data Availability Statement

Data are contained within the article and supplementary materials.

Acknowledgments

Julien Boutet and his colleagues from Protéus by Seqens are acknowledged for providing the enzyme and inspiration to carry out this work.

Conflicts of Interest

On behalf of both authors, the corresponding authors state that there are no conflict of interest.

References

  1. Kumar, A.K.; Parikh, B.S.; Pravakar, M. Natural Deep Eutectic Solvent Mediated Pretreatment of Rice Straw: Bioanalytical Characterization of Lignin Extract and Enzymatic Hydrolysis of Pretreated Biomass Residue. Environ. Sci. Pollut. Res. 2016, 23, 9265–9275. [Google Scholar] [CrossRef] [PubMed]
  2. Michel, M.R.; Rodríguez-Jasso, R.M.; Aguilar, C.N.; Gonzalez-Herrera, S.M.; Flores-Gallegos, A.C.; Rodríguez-Herrera, R. Fructosyltransferase Sources, Production, and Applications for Prebiotics Production. In Probiotics and Prebiotics in Human Nutrition and Health; InTech: Rijeka, Croatia, 2016; pp. 169–189. [Google Scholar]
  3. Sabater-Molina, M.; Larqué, E.; Torrella, F.; Zamora, S. Dietary Fructooligosaccharides and Potential Benefits on Health. J. Physiol. Biochem. 2009, 65, 315–328. [Google Scholar] [CrossRef]
  4. Martins, G.N.; Ureta, M.M.; Tymczyszyn, E.E.; Castilho, P.C.; Gomez-Zavaglia, A. Technological Aspects of the Production of Fructo and Galacto-Oligosaccharides. Enzymatic Synthesis and Hydrolysis. Front. Nutr. 2019, 6, 78. [Google Scholar] [CrossRef] [PubMed]
  5. Tochio, T.; Kadota, Y.; Tanaka, T.; Koga, Y. 1-Kestose, the Smallest Fructooligosaccharide Component, Which Efficiently Stimulates Faecalibacterium Prausnitzii as Well as Bifidobacteria in Humans. Foods 2018, 7, 140. [Google Scholar] [CrossRef] [PubMed] [Green Version]
  6. Suzuki, N.; Aiba, Y.; Takeda, H.; Fukumori, Y.; Koga, Y. Superiority of 1-Kestose, the Smallest Fructo-Oligosaccharide, to a Synthetic Mixture of Fructo-Oligosaccharides in the Selective Stimulating Activity on Bifidobacteria. Biosci. Microflora 2006, 25, 109–116. [Google Scholar] [CrossRef]
  7. Antošová, M.; Polakovič, M. Fructosyltransferases: The Enzymes Catalyzing Production of Fructooligosaccharides. Chem. Pap. 2001, 55, 350–358. [Google Scholar]
  8. Sangeetha, P.T.; Ramesh, M.N.; Prapulla, S.G. Production of Fructo-Oligosaccharides by Fructosyl Transferase from Aspergillus oryzae CFR 202 and Aureobasidium pullulans CFR 77. Process Biochem. 2004, 39, 755–760. [Google Scholar] [CrossRef]
  9. Singh, S.P.; Jadaun, J.S.; Narnoliya, L.K.; Pandey, A. Prebiotic Oligosaccharides: Special Focus on Fructooligosaccharides, Its Biosynthesis and Bioactivity. Appl. Biochem. Biotechnol. 2017, 183, 613–635. [Google Scholar] [CrossRef]
  10. Ganaie, M.A.; Lateef, A.; Gupta, U.S. Enzymatic Trends of Fructooligosaccharides Production by Microorganisms. Appl. Biochem. Biotechnol. 2014, 172, 2143–2159. [Google Scholar] [CrossRef]
  11. Antošová, M.; Illeová, V.; Vandáková, M.; Družkovská, A.; Polakovič, M. Chromatographic Separation and Kinetic Properties of Fructosyltransferase from Aureobasidium pullulans. J. Biotechnol. 2008, 135, 58–63. [Google Scholar] [CrossRef]
  12. Madlová, A.; Antošova, M.; Baráthová, M.; Polakovič, M.; Štefúca, V.; Báleš, V. Screening of Microorganisms for Transfructosylating Activity and Optimization of Biotransformation of Sucrose to Fructooligosaccharides. Chem. Pap.-Slovak Acad. Sci. 1999, 53, 366–369. [Google Scholar]
  13. Coetzee, G.; van Rensburg, E.; Görgens, J.F. Evaluation of the Performance of an Engineered β-Fructofuranosidase from Aspergillus fijiensis to Produce Short-Chain Fructooligosaccharides from Industrial Sugar Streams. Biocatal. Agric. Biotechnol. 2020, 23, 101484. [Google Scholar] [CrossRef]
  14. Ganaie, M.A.; Gupta, U.S.; Kango, N. Screening of Biocatalysts for Transformation of Sucrose to Fructooligosaccharides. J. Mol. Catal. B Enzym. 2013, 97, 12–17. [Google Scholar] [CrossRef]
  15. Vega-Paulino, R.J.; Zúniga-Hansen, M.E. Potential Application of Commercial Enzyme Preparations for Industrial Production of Short-Chain Fructooligosaccharides. J. Mol. Catal. B Enzym. 2012, 76, 44–51. [Google Scholar] [CrossRef]
  16. Hollá, V.; Antošová, M.; Karkeszová, K.; Mastihuba, V.; Polakovič, M. Screening of Commercial Enzymes for Transfructosylation of Tyrosol: Effect of Process Conditions and Reaction Network. Biotechnol. J. 2019, 14, 1800571. [Google Scholar] [CrossRef]
  17. Hollá, V.; Karkeszová, K.; Antošová, M.; Polakovič, M. Transglycosylation Properties of a Kluyveromyces Lactis Enzyme Preparation: Production of Tyrosol β-Fructoside Using Free and Immobilized Enzyme. Process Biochem. 2021, 110, 168–175. [Google Scholar] [CrossRef]
  18. L’Hocine, L.; Wang, Z.; Jiang, B.; Xu, S. Purification and Partial Characterization of Fructosyltransferase and Invertase from Aspergillus niger AS0023. J. Biotechnol. 2000, 81, 73–84. [Google Scholar] [CrossRef]
  19. Yoshikawa, J.; Amachi, S.; Shinoyama, H.; Fujii, T. Multiple β-Fructofuranosidases by Aureobasidium pullulans DSM2404 and Their Roles in Fructooligosaccharide Production. FEMS Microbiol. Lett. 2006, 265, 159–163. [Google Scholar] [CrossRef] [Green Version]
  20. Kurakake, M.; Ogawa, K.; Sugie, M.; Takemura, A.; Sugiura, K.; Komaki, T. Two Types of β-Fructofuranosidases from Aspergillus oryzae KB. J. Agric. Food Chem. 2008, 56, 591–596. [Google Scholar] [CrossRef]
  21. Choukade, R.; Kango, N. Production, Properties, and Applications of Fructosyltransferase: A Current Appraisal. Crit. Rev. Biotechnol. 2021, 41, 1178–1193. [Google Scholar] [CrossRef]
  22. Mao, S.; Liu, Y.; Yang, J.; Ma, X.; Zeng, F.; Zhang, Z.; Wang, S.; Han, H.; Qin, H.M.; Lu, F. Cloning, Expression and Characterization of a Novel Fructosyltransferase from: Aspergillus niger and Its Application in the Synthesis of Fructooligosaccharides. RSC Adv. 2019, 9, 23856–23863. [Google Scholar] [CrossRef] [PubMed] [Green Version]
  23. Xia, Y.; Guo, W.; Han, L.; Shen, W.; Chen, X.; Yang, H. Significant Improvement of Both Catalytic Efficiency and Stability of Fructosyltransferase from Aspergillus niger by Structure-Guided Engineering of Key Residues in the Conserved Sequence of the Catalytic Domain. J. Agric. Food Chem. 2022, 70, 7202–7210. [Google Scholar] [CrossRef] [PubMed]
  24. Yang, H.; Wang, Y.; Zhang, L.; Shen, W. Heterologous Expression and Enzymatic Characterization of Fructosyltransferase from Aspergillus niger in Pichia Pastoris. New Biotechnol. 2016, 33, 164–170. [Google Scholar] [CrossRef] [PubMed]
  25. Guo, W.; Yang, H.; Qiang, S.; Fan, Y.; Shen, W.; Chen, X. Overproduction, Purification, and Property Analysis of an Extracellular Recombinant Fructosyltransferase. Eur. Food Res. Technol. 2016, 242, 1159–1168. [Google Scholar] [CrossRef]
  26. Trollope, K.M.; van Wyk, N.; Kotjomela, M.A.; Volschenk, H. Sequence and Structure-Based Prediction of Fructosyltransferase Activity for Functional Subclassification of Fungal GH32 Enzymes. FEBS J. 2015, 282, 4782–4796. [Google Scholar] [CrossRef]
  27. Olarte-Avellaneda, S.; Rodríguez-López, A.; Patiño, J.D.; Alméciga-Díaz, C.J.; Sánchez, O.F. In Silico Analysis of the Structure of Fungal Fructooligosaccharides-Synthesizing Enzymes. Interdiscip. Sci. 2018, 10, 53–67. [Google Scholar] [CrossRef]
  28. Alvarado-Obando, M.; Contreras, N.; León, D.; Botero, L.; Beltran, L.; Díaz, D.; Rodríguez-López, A.; Reyes, L.H.; Alméciga-Díaz, C.J.; Sánchez, O.F. Engineering a Heterologously Expressed Fructosyltransferase from Aspergillus oryzae N74 in Komagataella Phaffii (Pichia pastoris) for Kestose Production. New Biotechnol. 2022, 69, 18–27. [Google Scholar] [CrossRef]
  29. Biocatalyst for Sucrose Conversion into Fructo-Oligosaccharides. Available online: https://www.seqens.com/en/biocatalyst-for-sucrose-conversion-into-fructo-oligosaccharides/ (accessed on 27 March 2023).
  30. Jen Duan, K.; Shin Chen, J.; Chyi Sheu, D. Kinetic Studies and Mathematical Model for Enzymatic Production of Fructooligosaccharides from Sucrose. Enzym. Microb. Technol. 1994, 16, 334–339. [Google Scholar] [CrossRef]
  31. Shearwin, K.E.; Winzor, D.J. Substrate as a Source of Thermodynamic Nonideality in Enzyme Kinetic Studies: Invertase-Catalyzed Hydrolysis of Sucrose. Arch. Biochem. Biophys. 1988, 260, 532–539. [Google Scholar] [CrossRef]
Figure 1. Effect of the initial concentration of sucrose on the initial rates of transfructosylation and hydrolysis. Assay conditions: enzyme concentration of 1.25 U/mL, 55 °C, and 0.1 M citrate-phosphate buffer with pH 5.5.
Catalysts 13 00843 g001
Figure 2. Courses of individual saccharide concentrations for FOS synthesis using 5 U/mL of Seqenzym® FT in (a) 250 mM and (b) 2000 mM sucrose solution at pH 5.5 and 55 °C.
Catalysts 13 00843 g002
Figure 3. Progress curves of total FOS yields at different initial concentrations of sucrose. Reaction conditions: 5 U/mL of Seqenzym® FT, 55 °C, and pH 5.5.
Catalysts 13 00843 g003
Figure 4. Courses of sucrose conversion, FOS yield, and degree of polymerization. Reaction conditions: 2000 mM sucrose, 5 U/mL of Seqenzym® FT, 55 °C, and pH 5.5.
Catalysts 13 00843 g004
Figure 5. Influence of initial enzyme concentrations on the formation of FOS catalyzed by Seqenzym® FT at 2000 mM sucrose, pH 5.5, and 55 °C.
Catalysts 13 00843 g005
Table 1. Average degree of polymerization of FOS produced by various enzyme preparations.
BiocatalystInitial Sucrose Concentration (g/L)Sucrose Conversion (%)DPReference
852.29
Seqenzym® FT599902.50This work
922.73
852.23
A. pullulans FTase600902.36[11]
922.43
852.29
Pectinex Ultra SP-L536.2902.41[15]
922.50
852.31
Rohapect CM536.2902.46[15]
922.55
Viscozyme L536.2852.25[15]
902.35
Disclaimer/Publisher’s Note: The statements, opinions and data contained in all publications are solely those of the individual author(s) and contributor(s) and not of MDPI and/or the editor(s). MDPI and/or the editor(s) disclaim responsibility for any injury to people or property resulting from any ideas, methods, instructions or products referred to in the content.

