
Gas-Phase Deoxygenation of Biomass Pyrolysis Tar Catalyzed by Rare Earth Metal Loaded Hβ Zeolite


Abstract
1. Introduction
2. Results
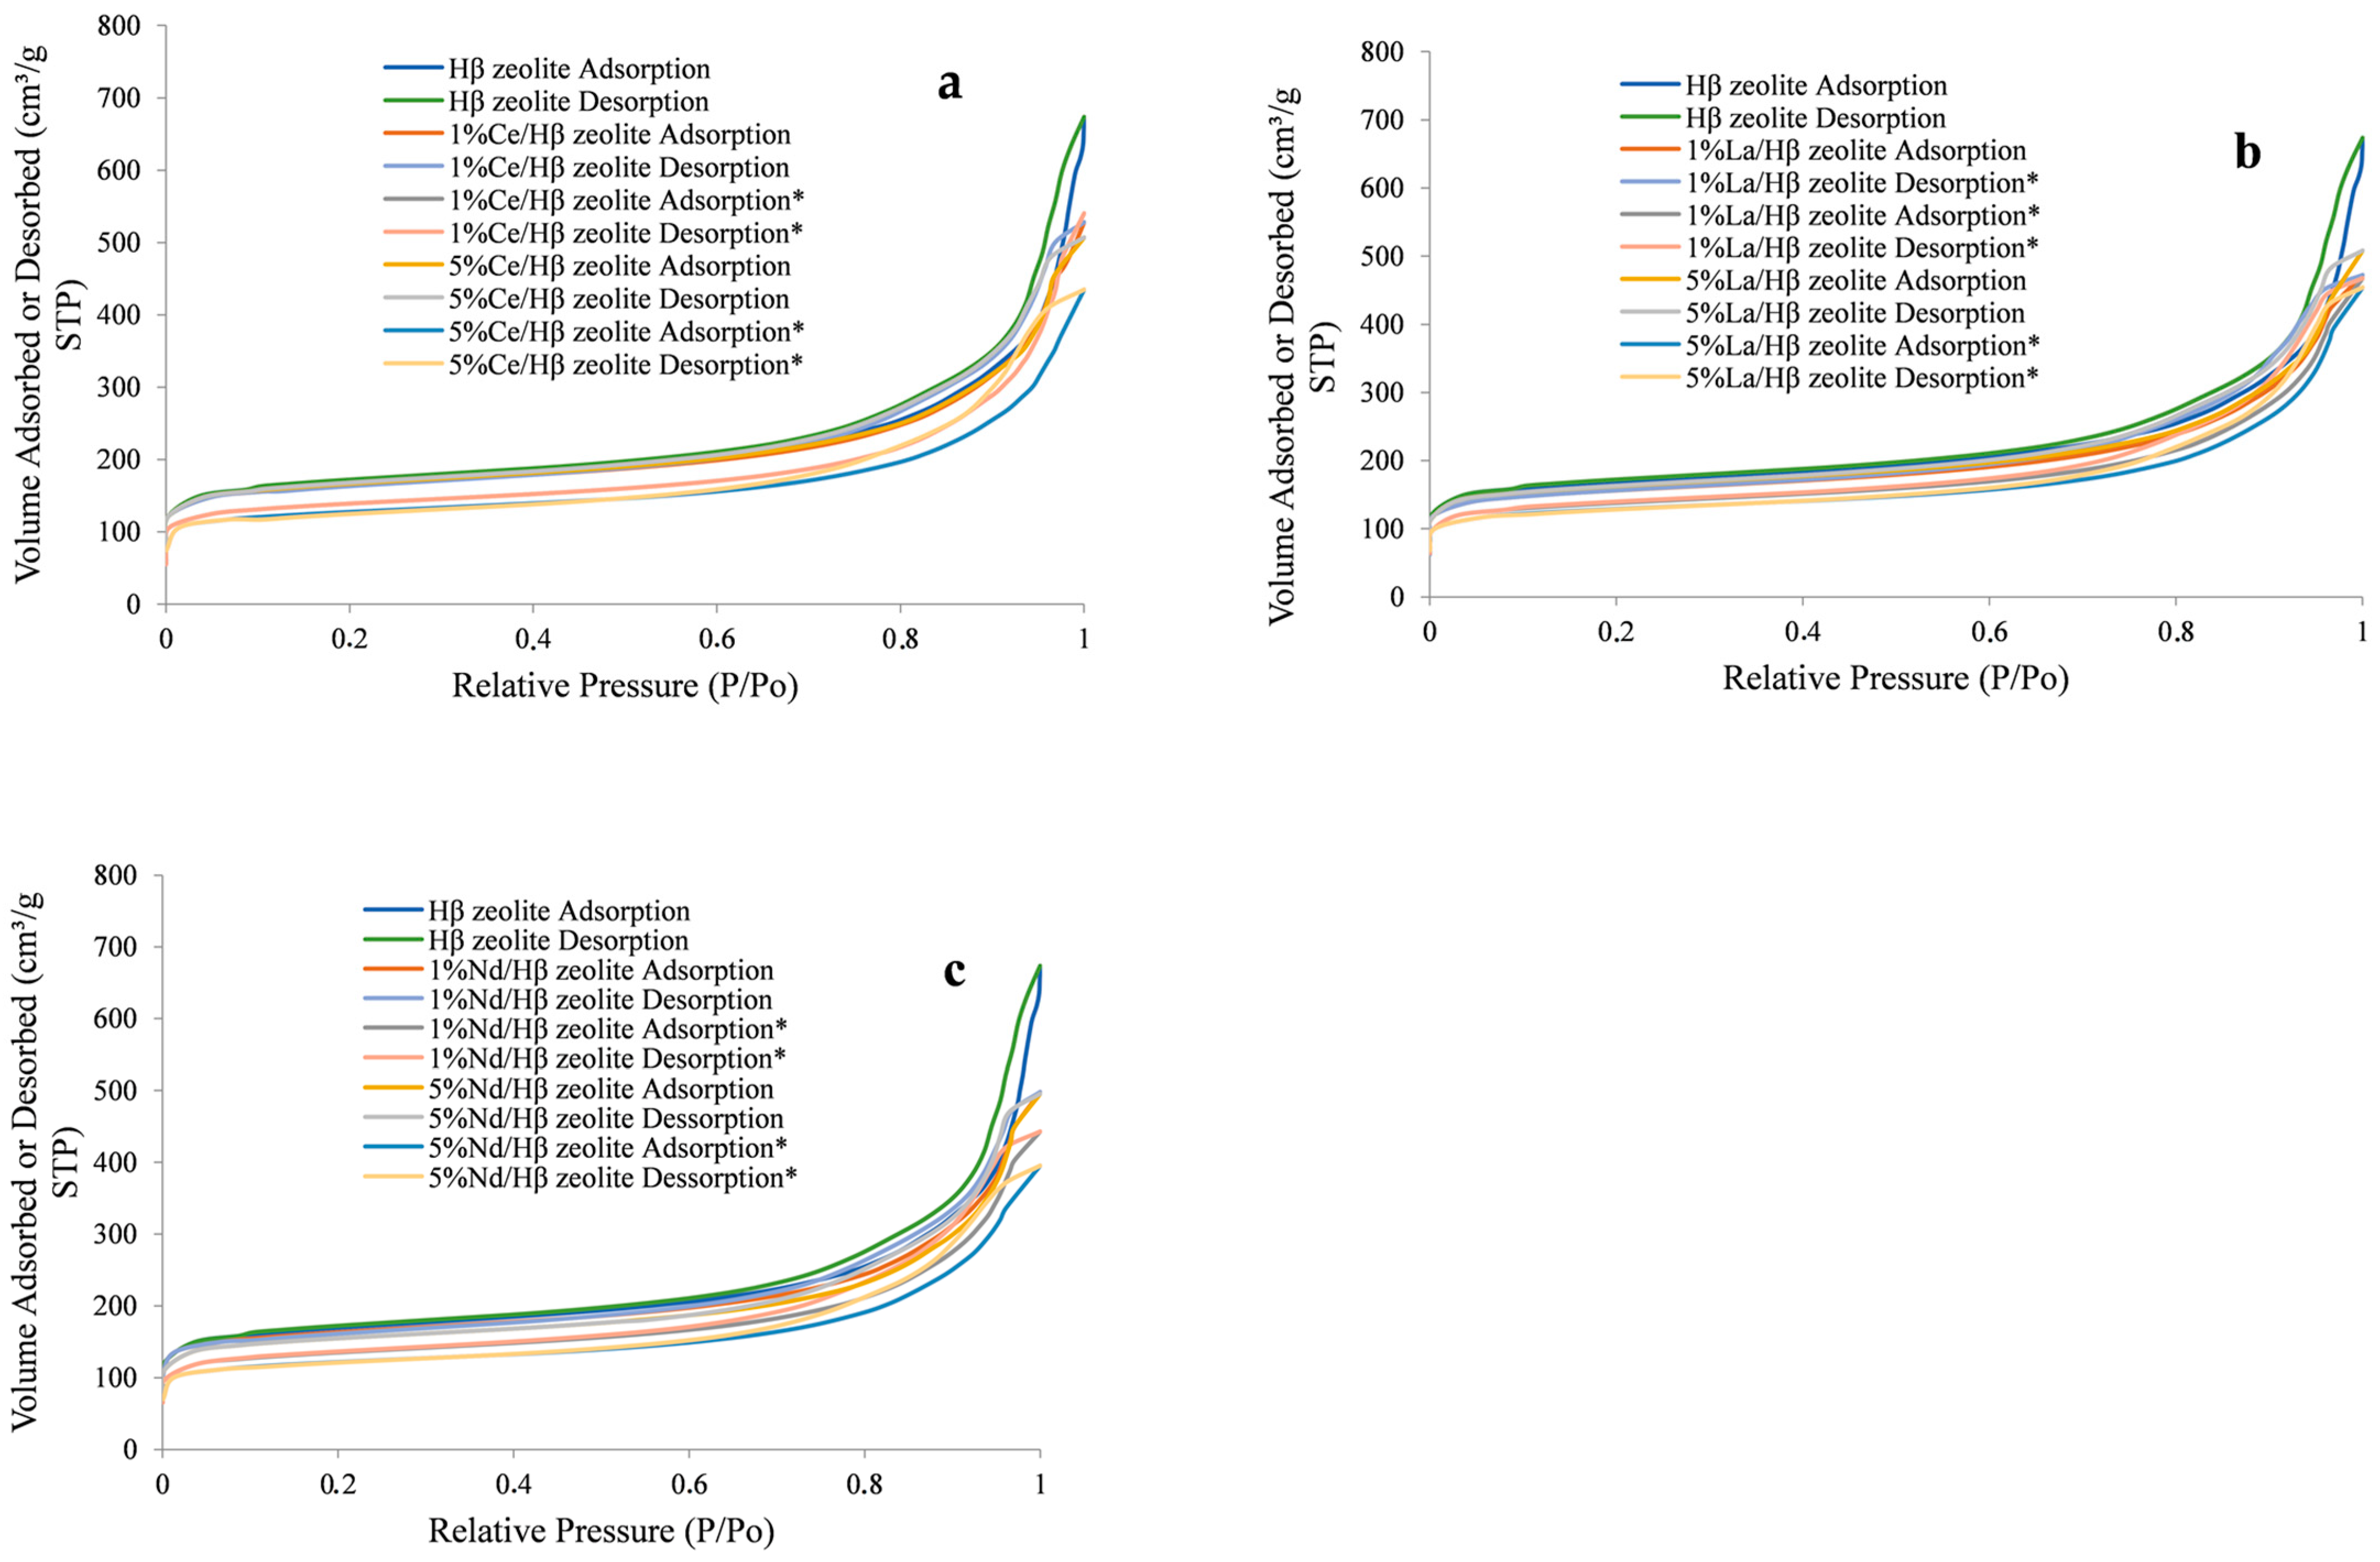
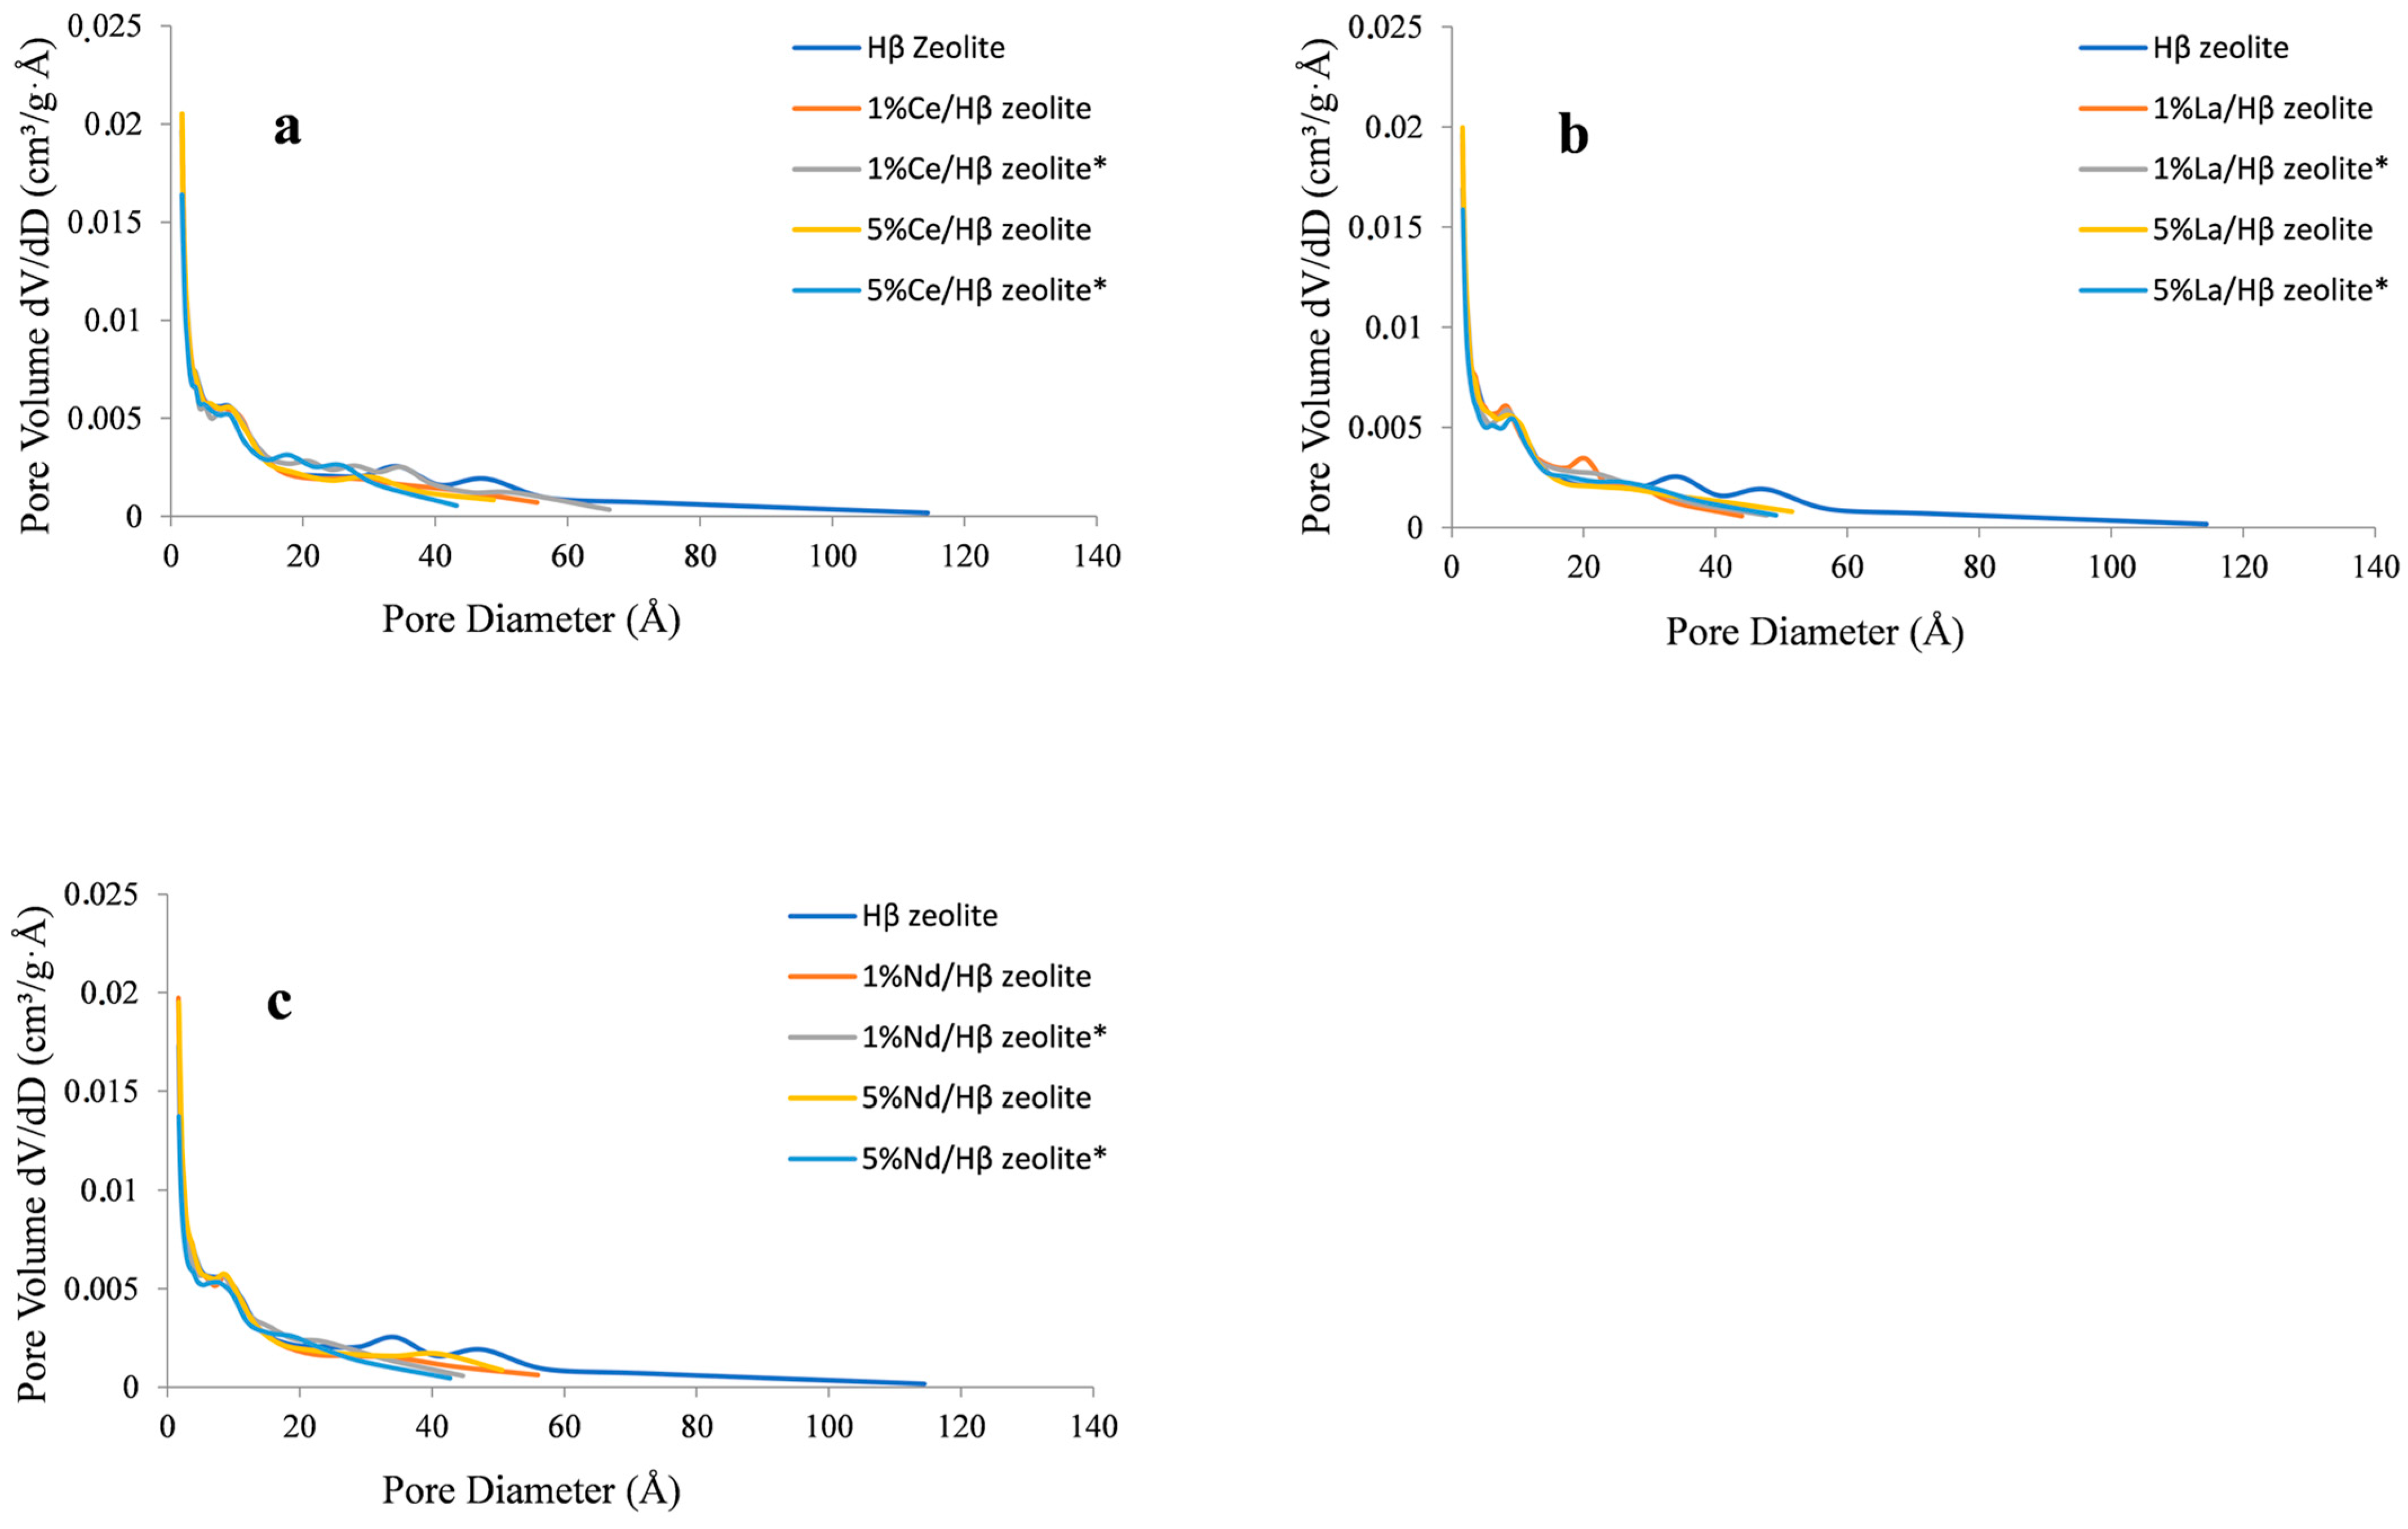
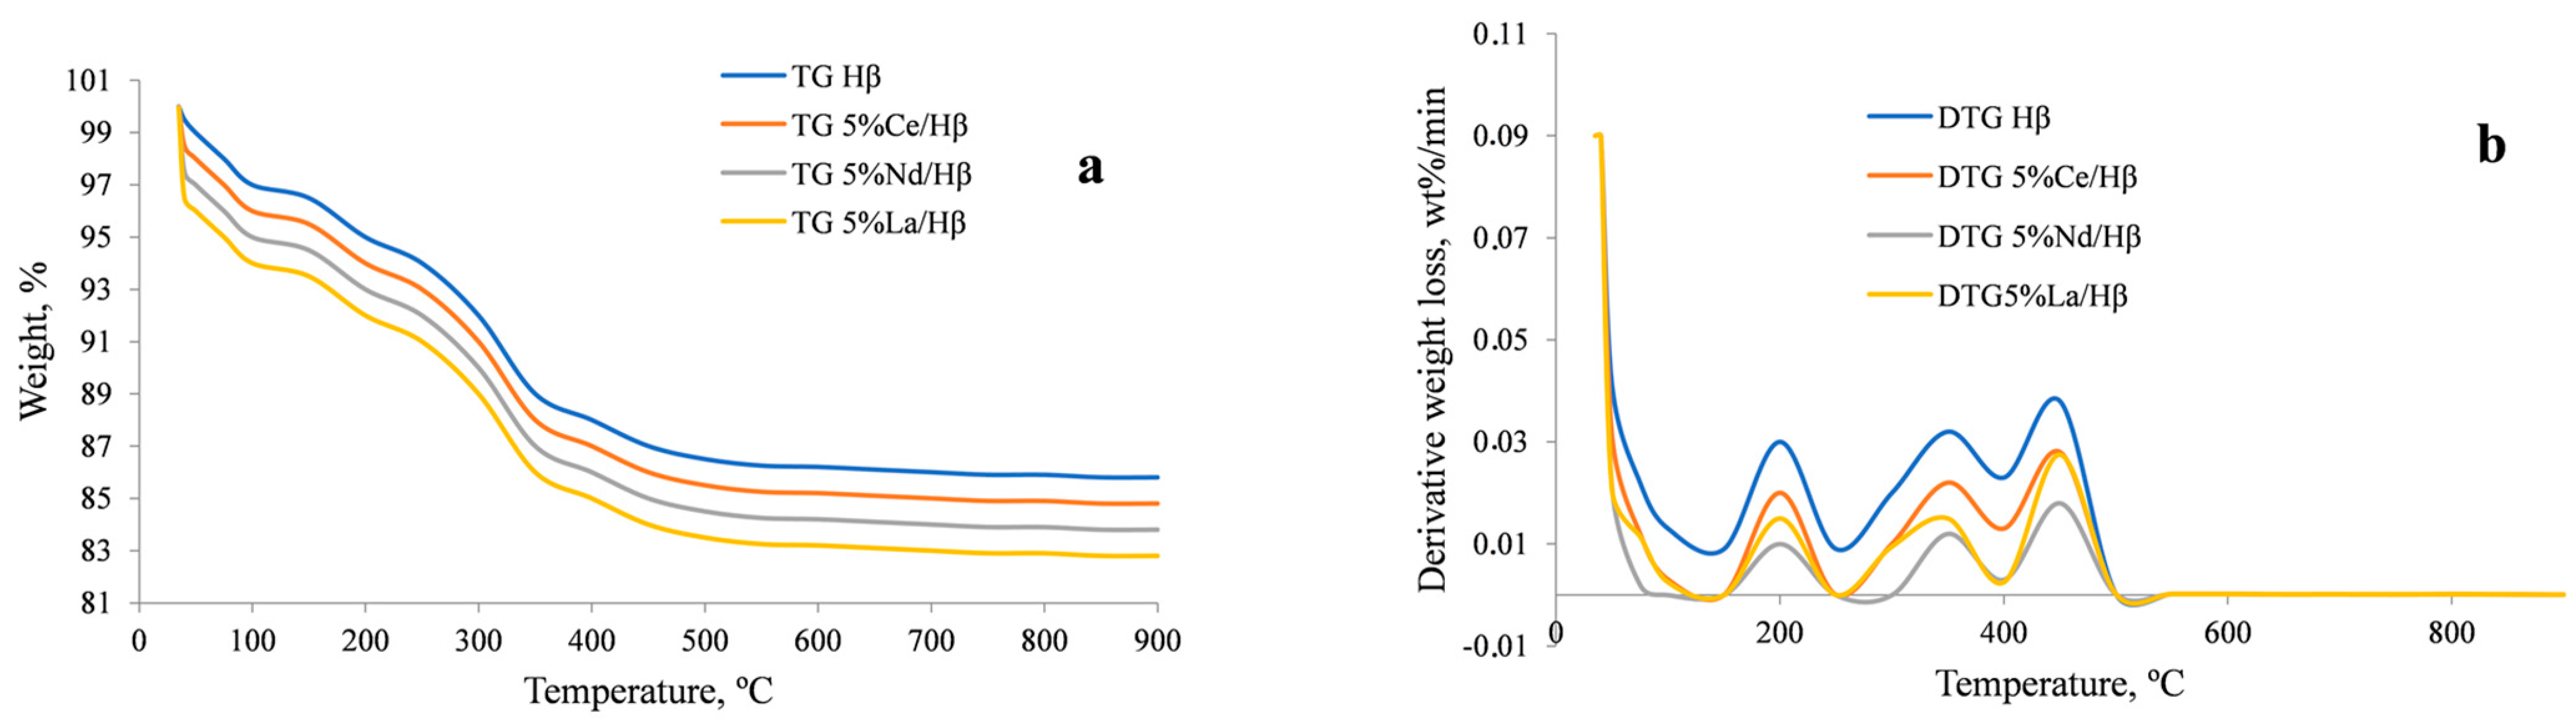
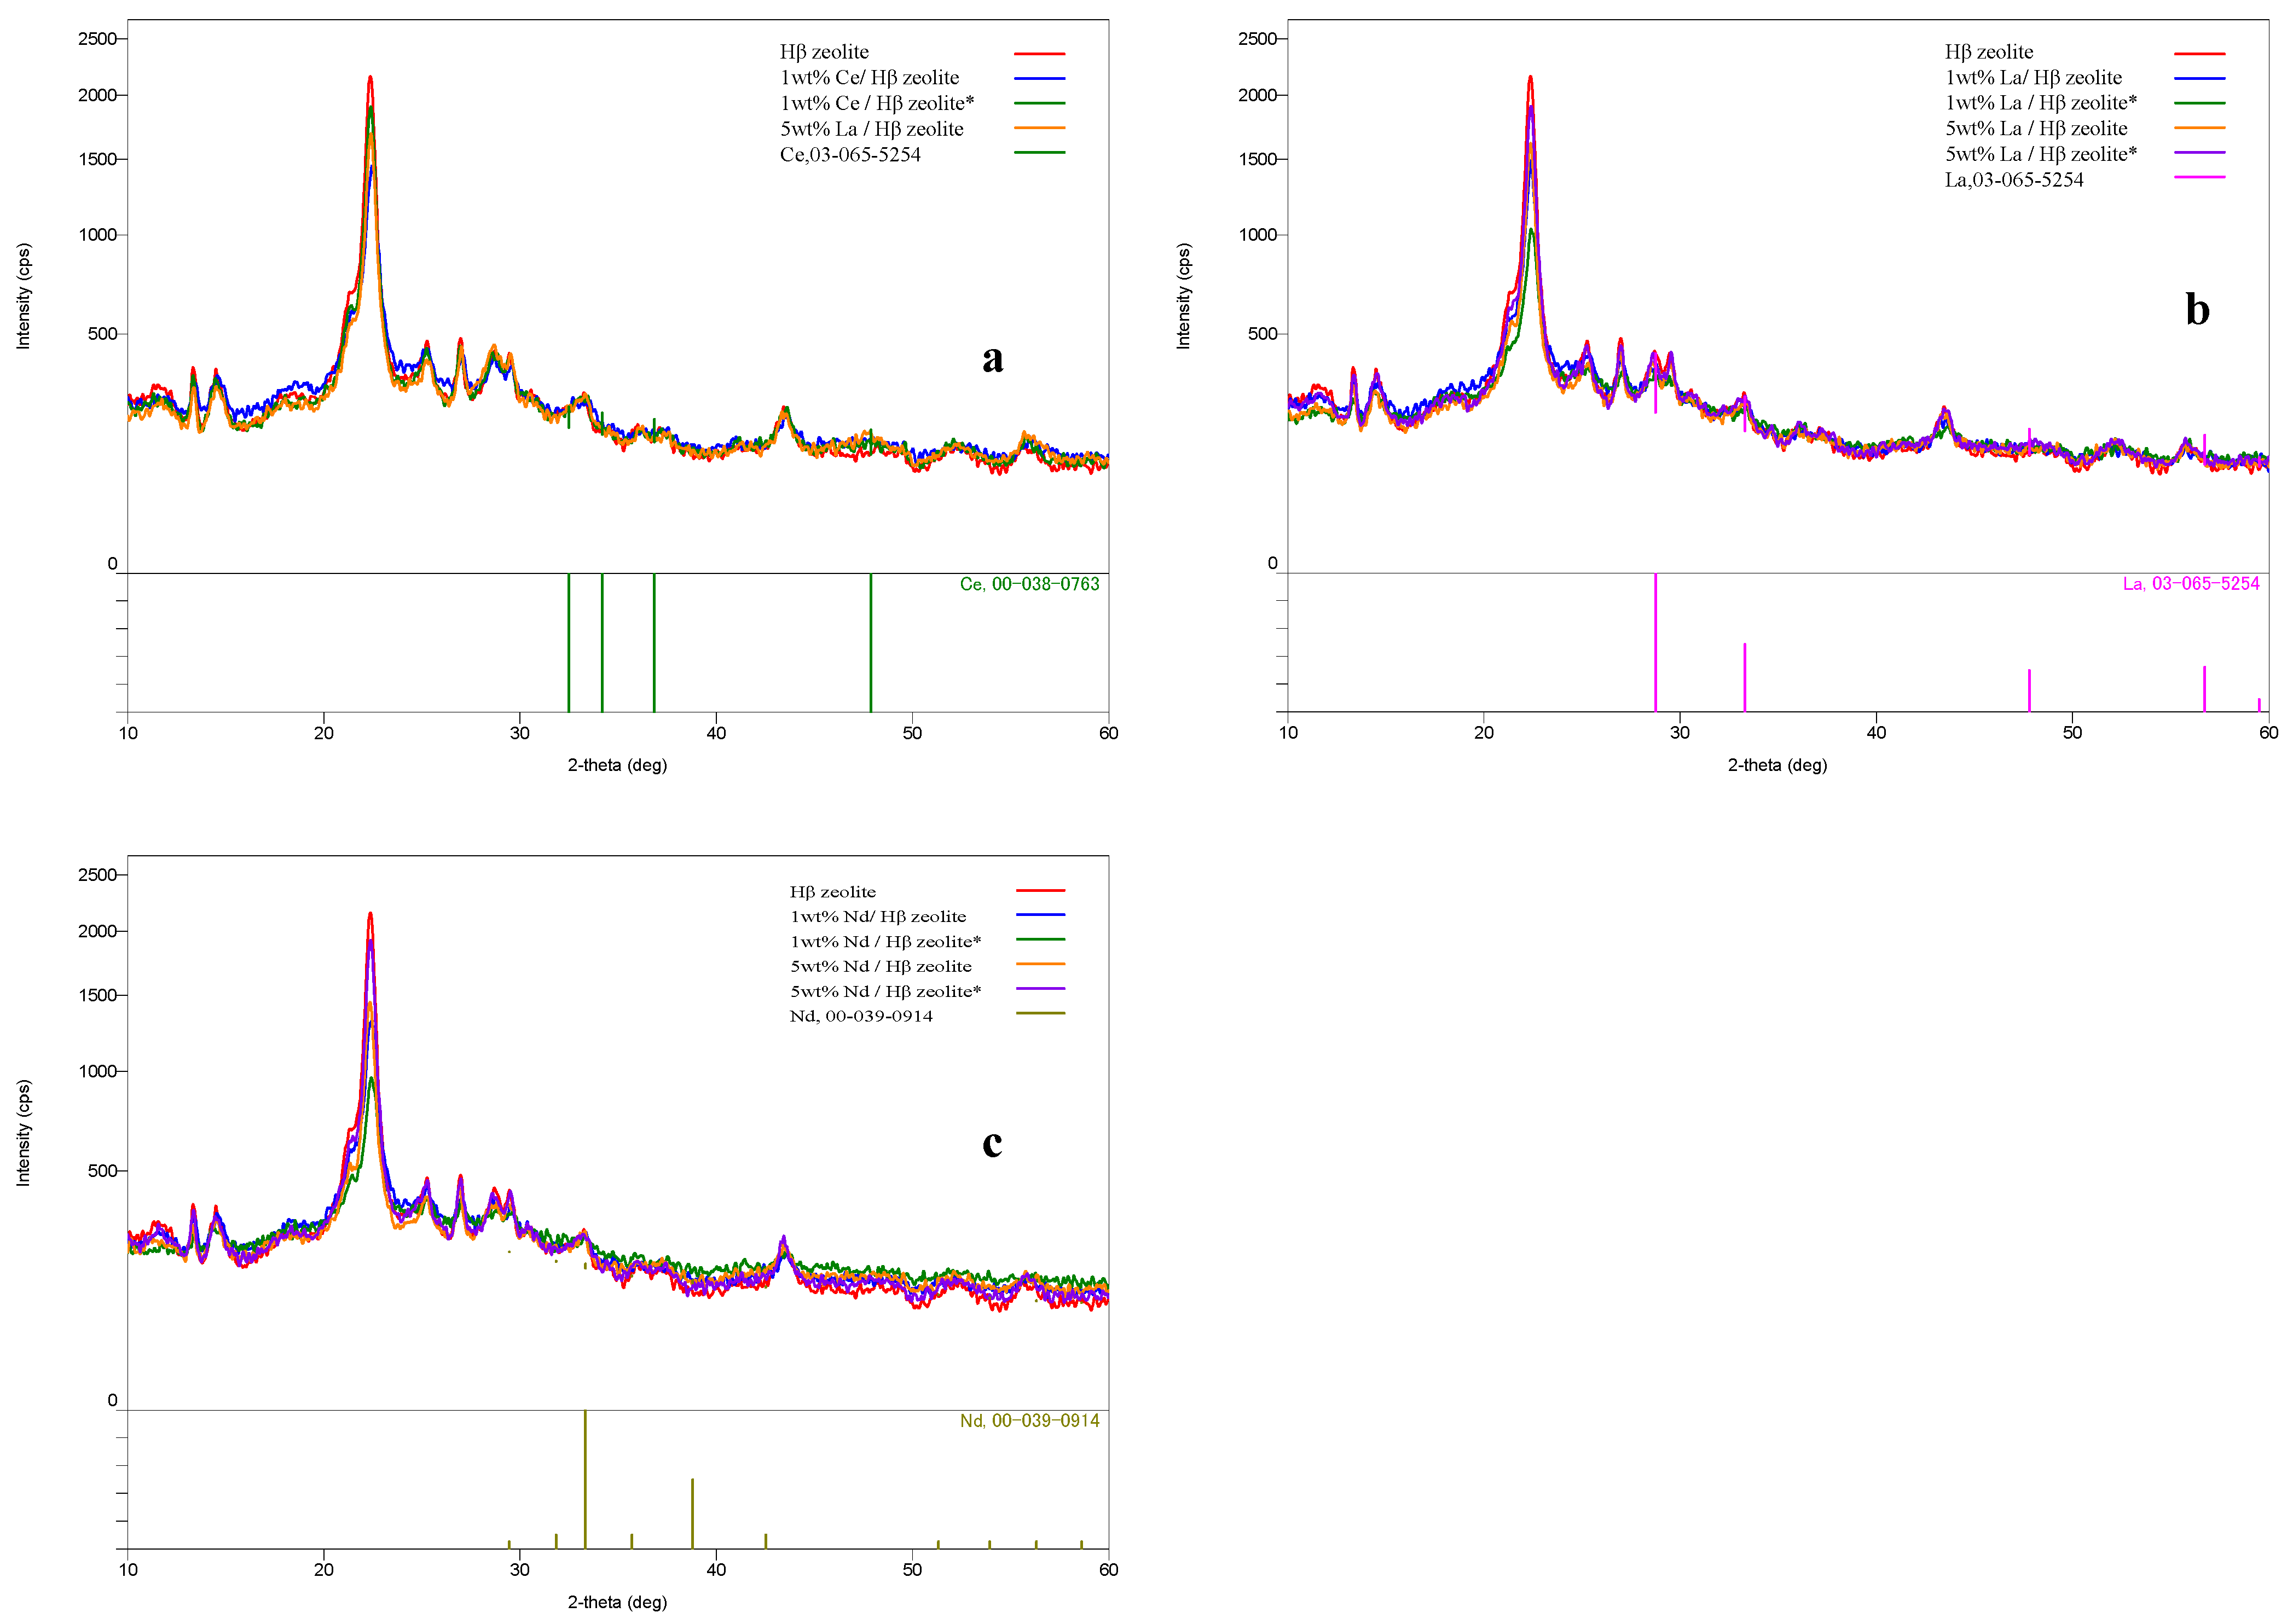
2.1. Zeolite Characterization
2.2. Acetone Model Component
2.2.1. Catalyst Activity
2.2.2. Contact Time
2.2.3. Effect of Gas-Phase Deoxygenation Temperature
2.2.4. Reaction Network for Acetone Model Compound
2.3. Biomass Pyrolysis Tar
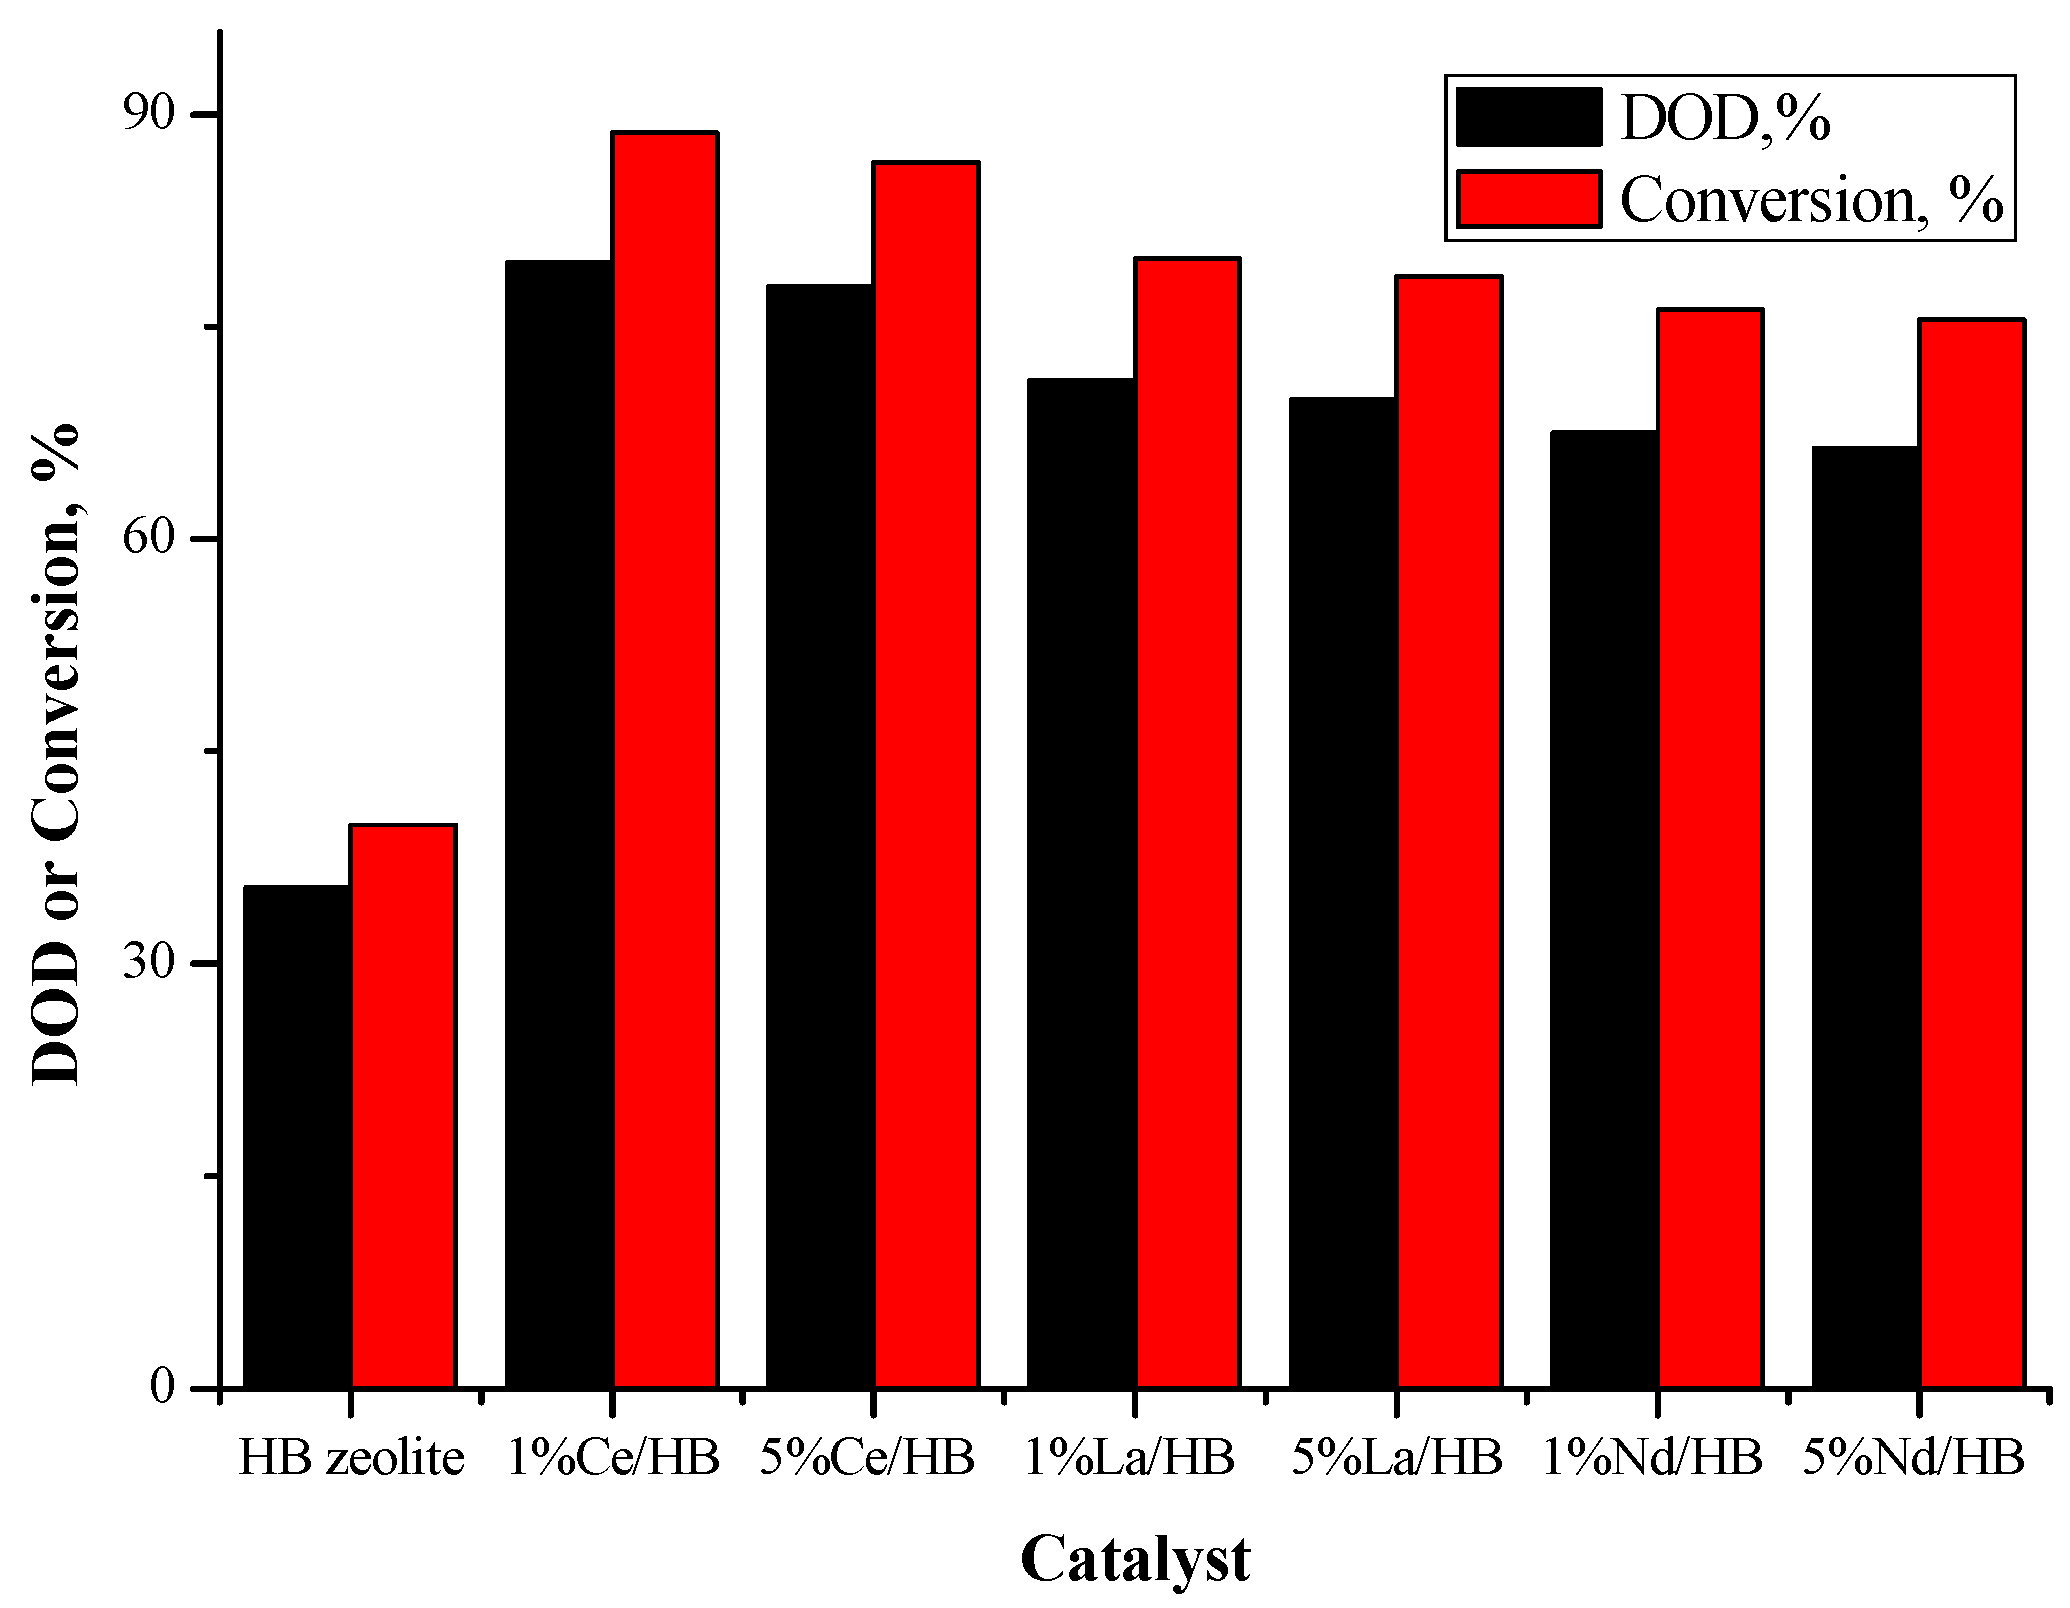
2.3.1. Catalyst Activity
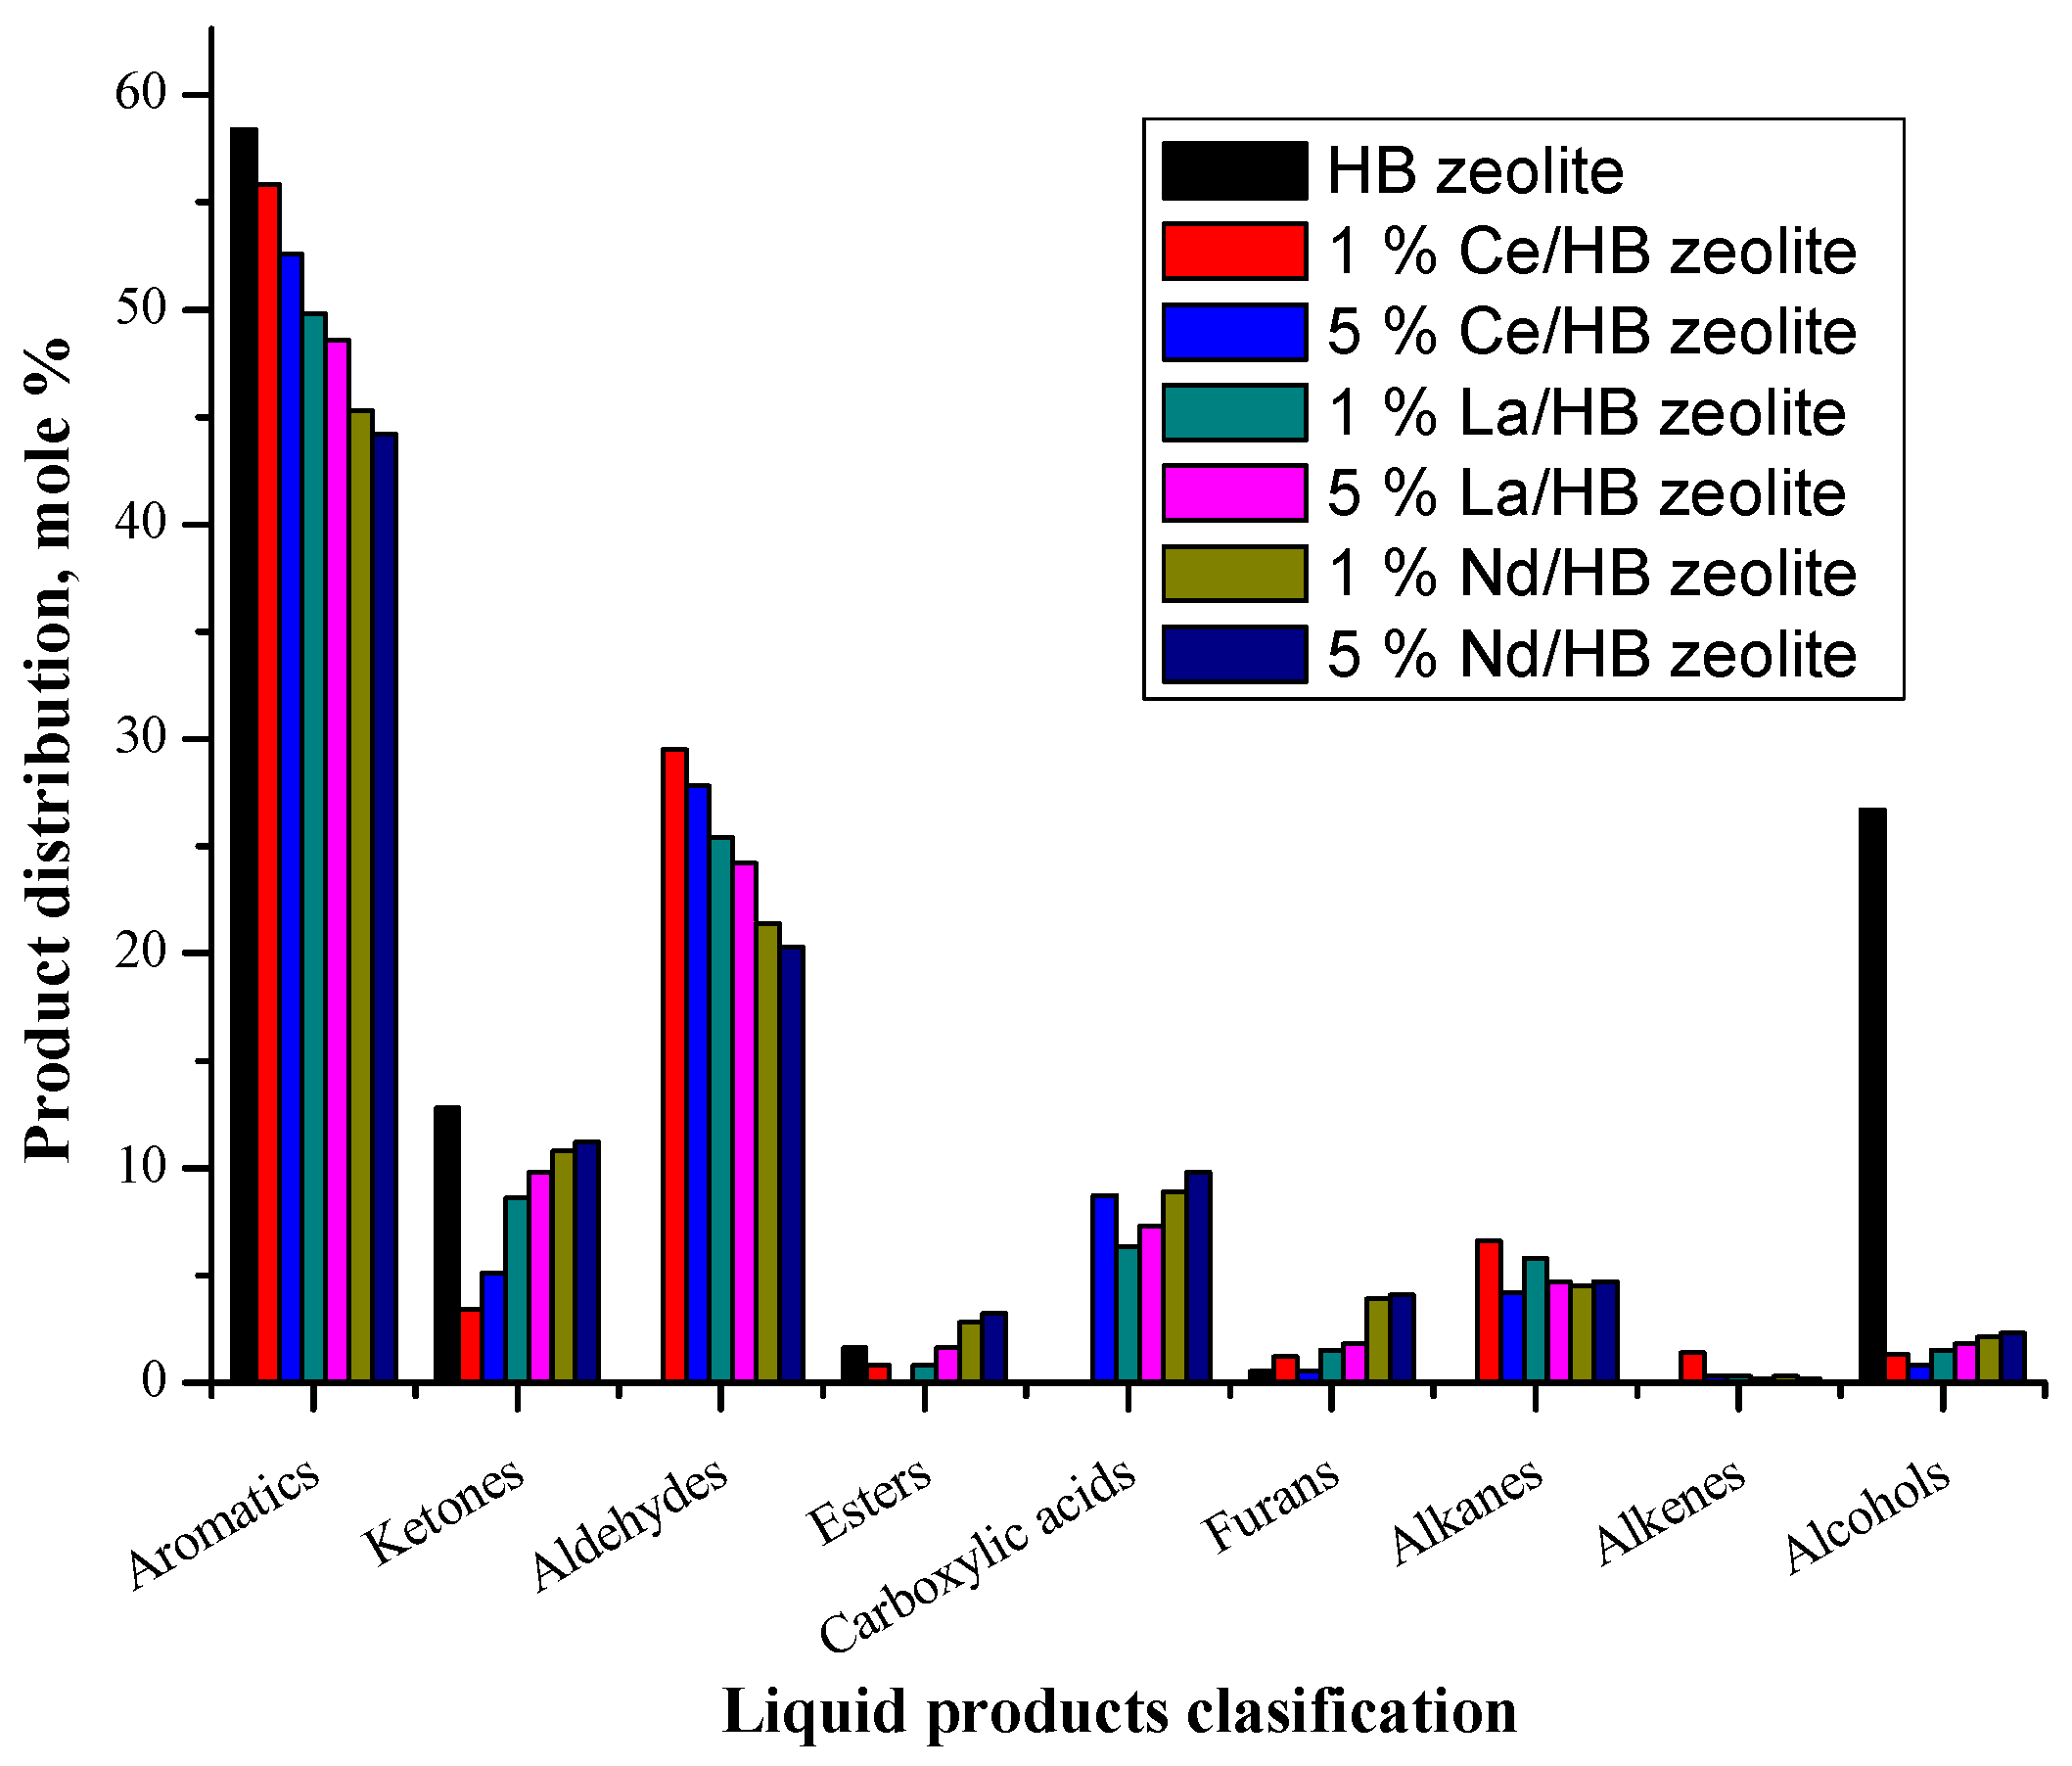
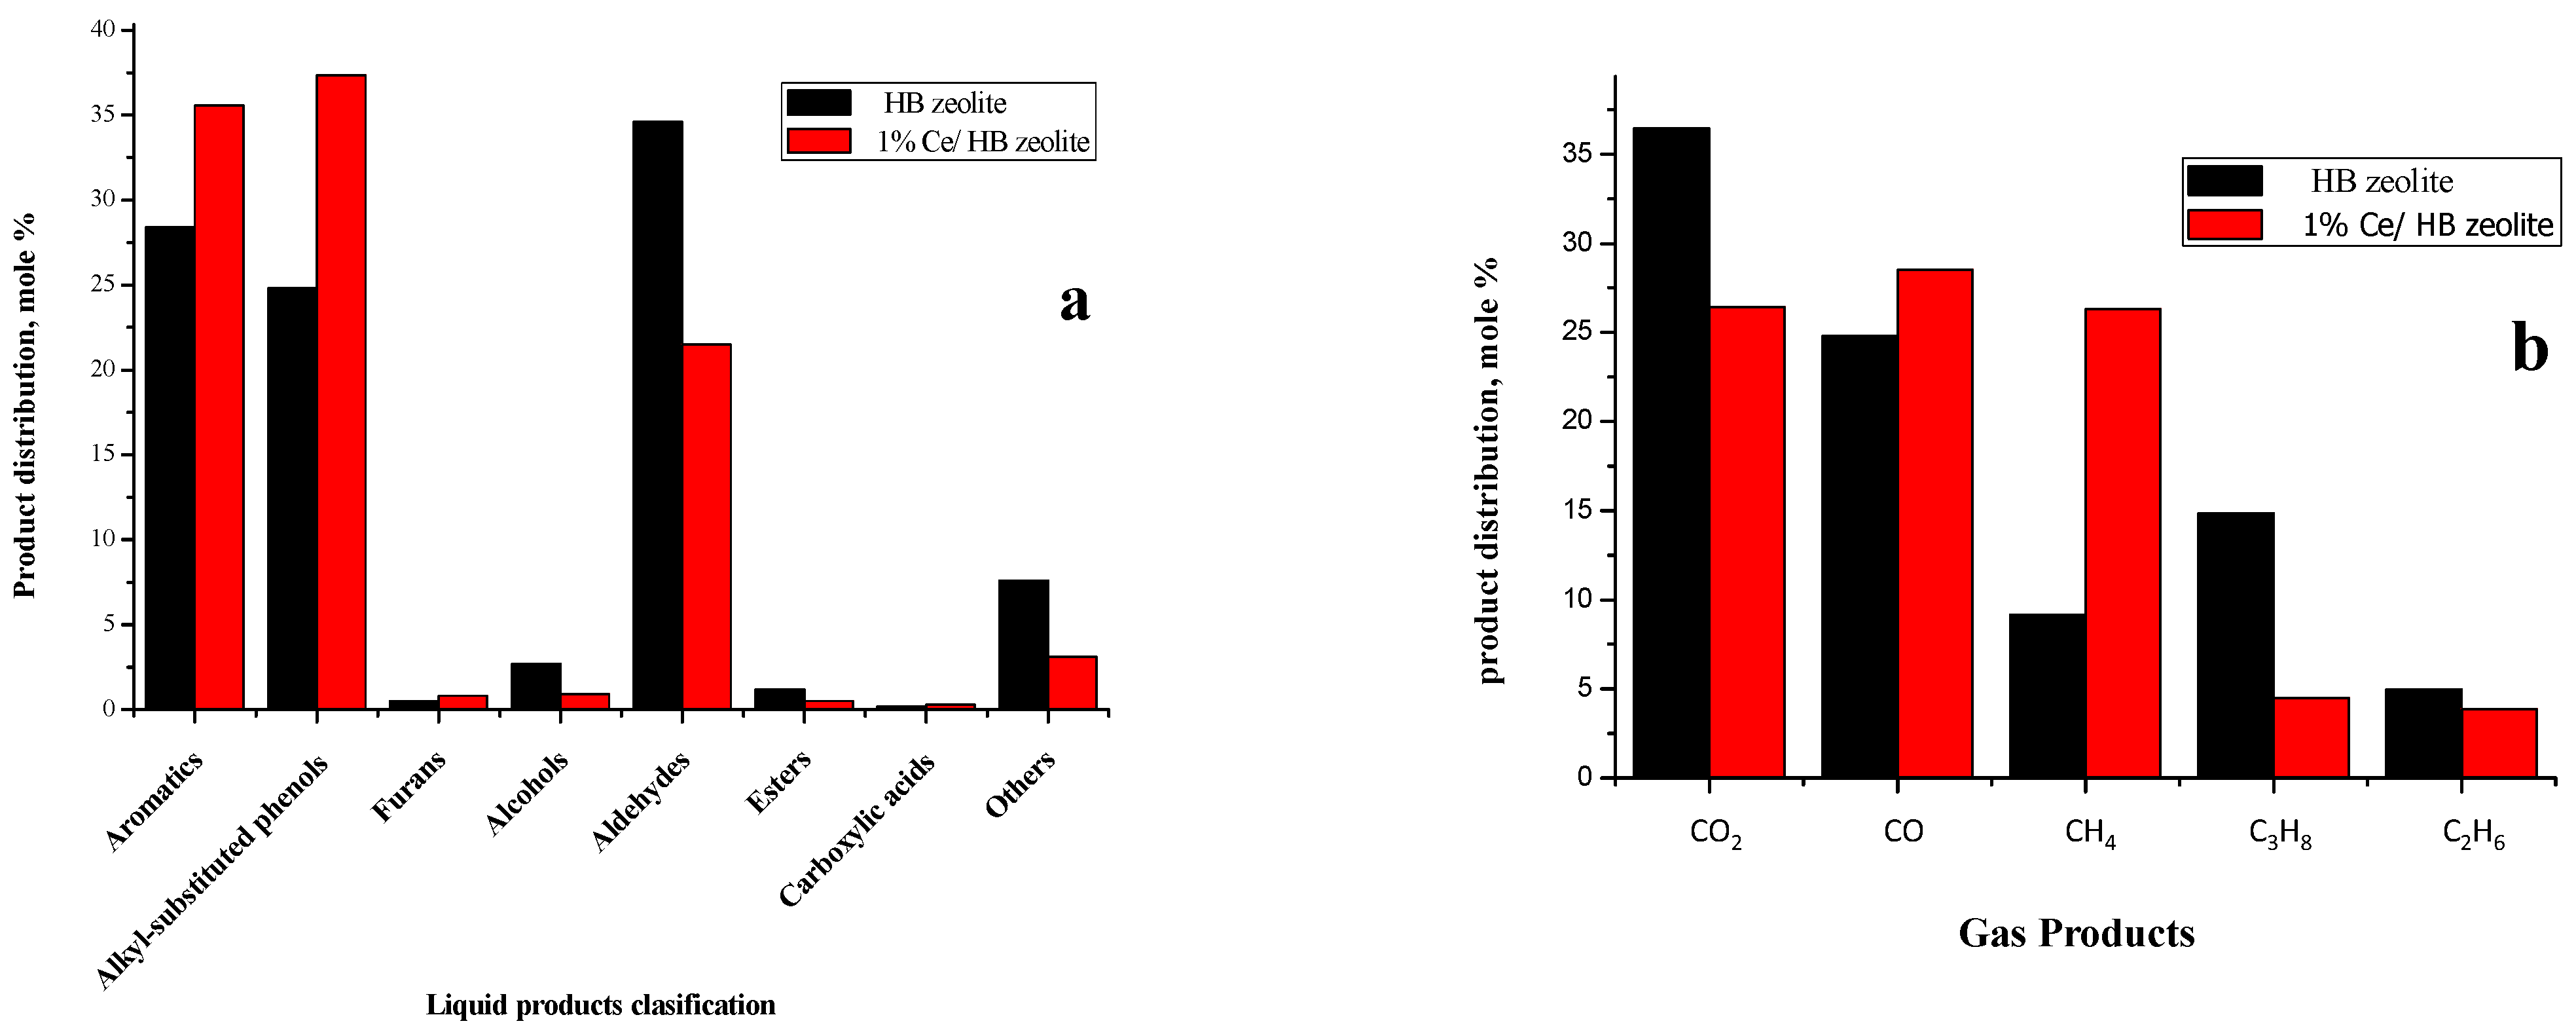
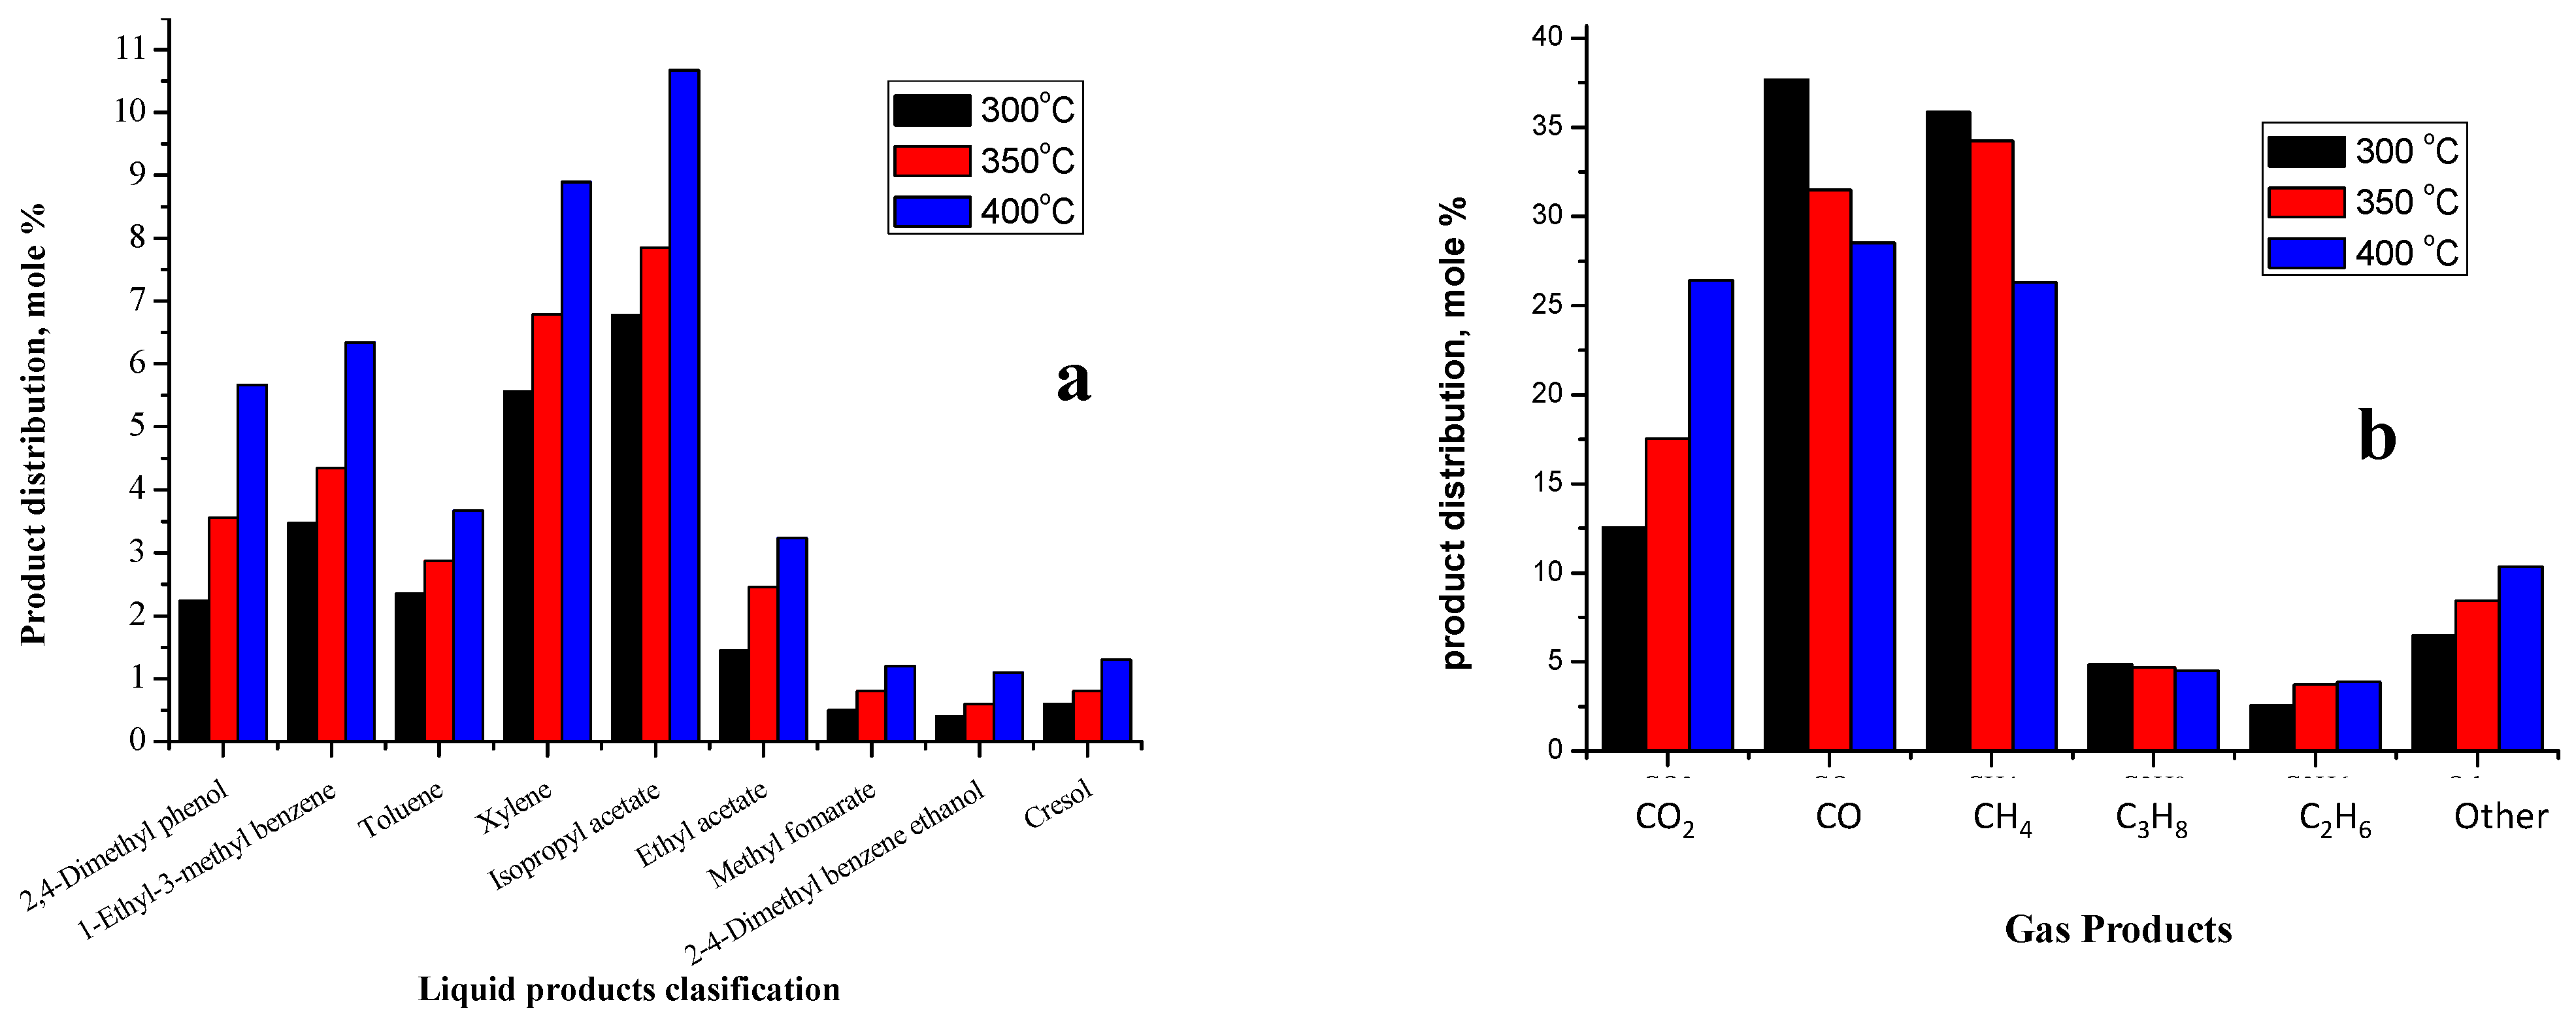
2.3.2. Liquid Products
2.3.3. Gas Products
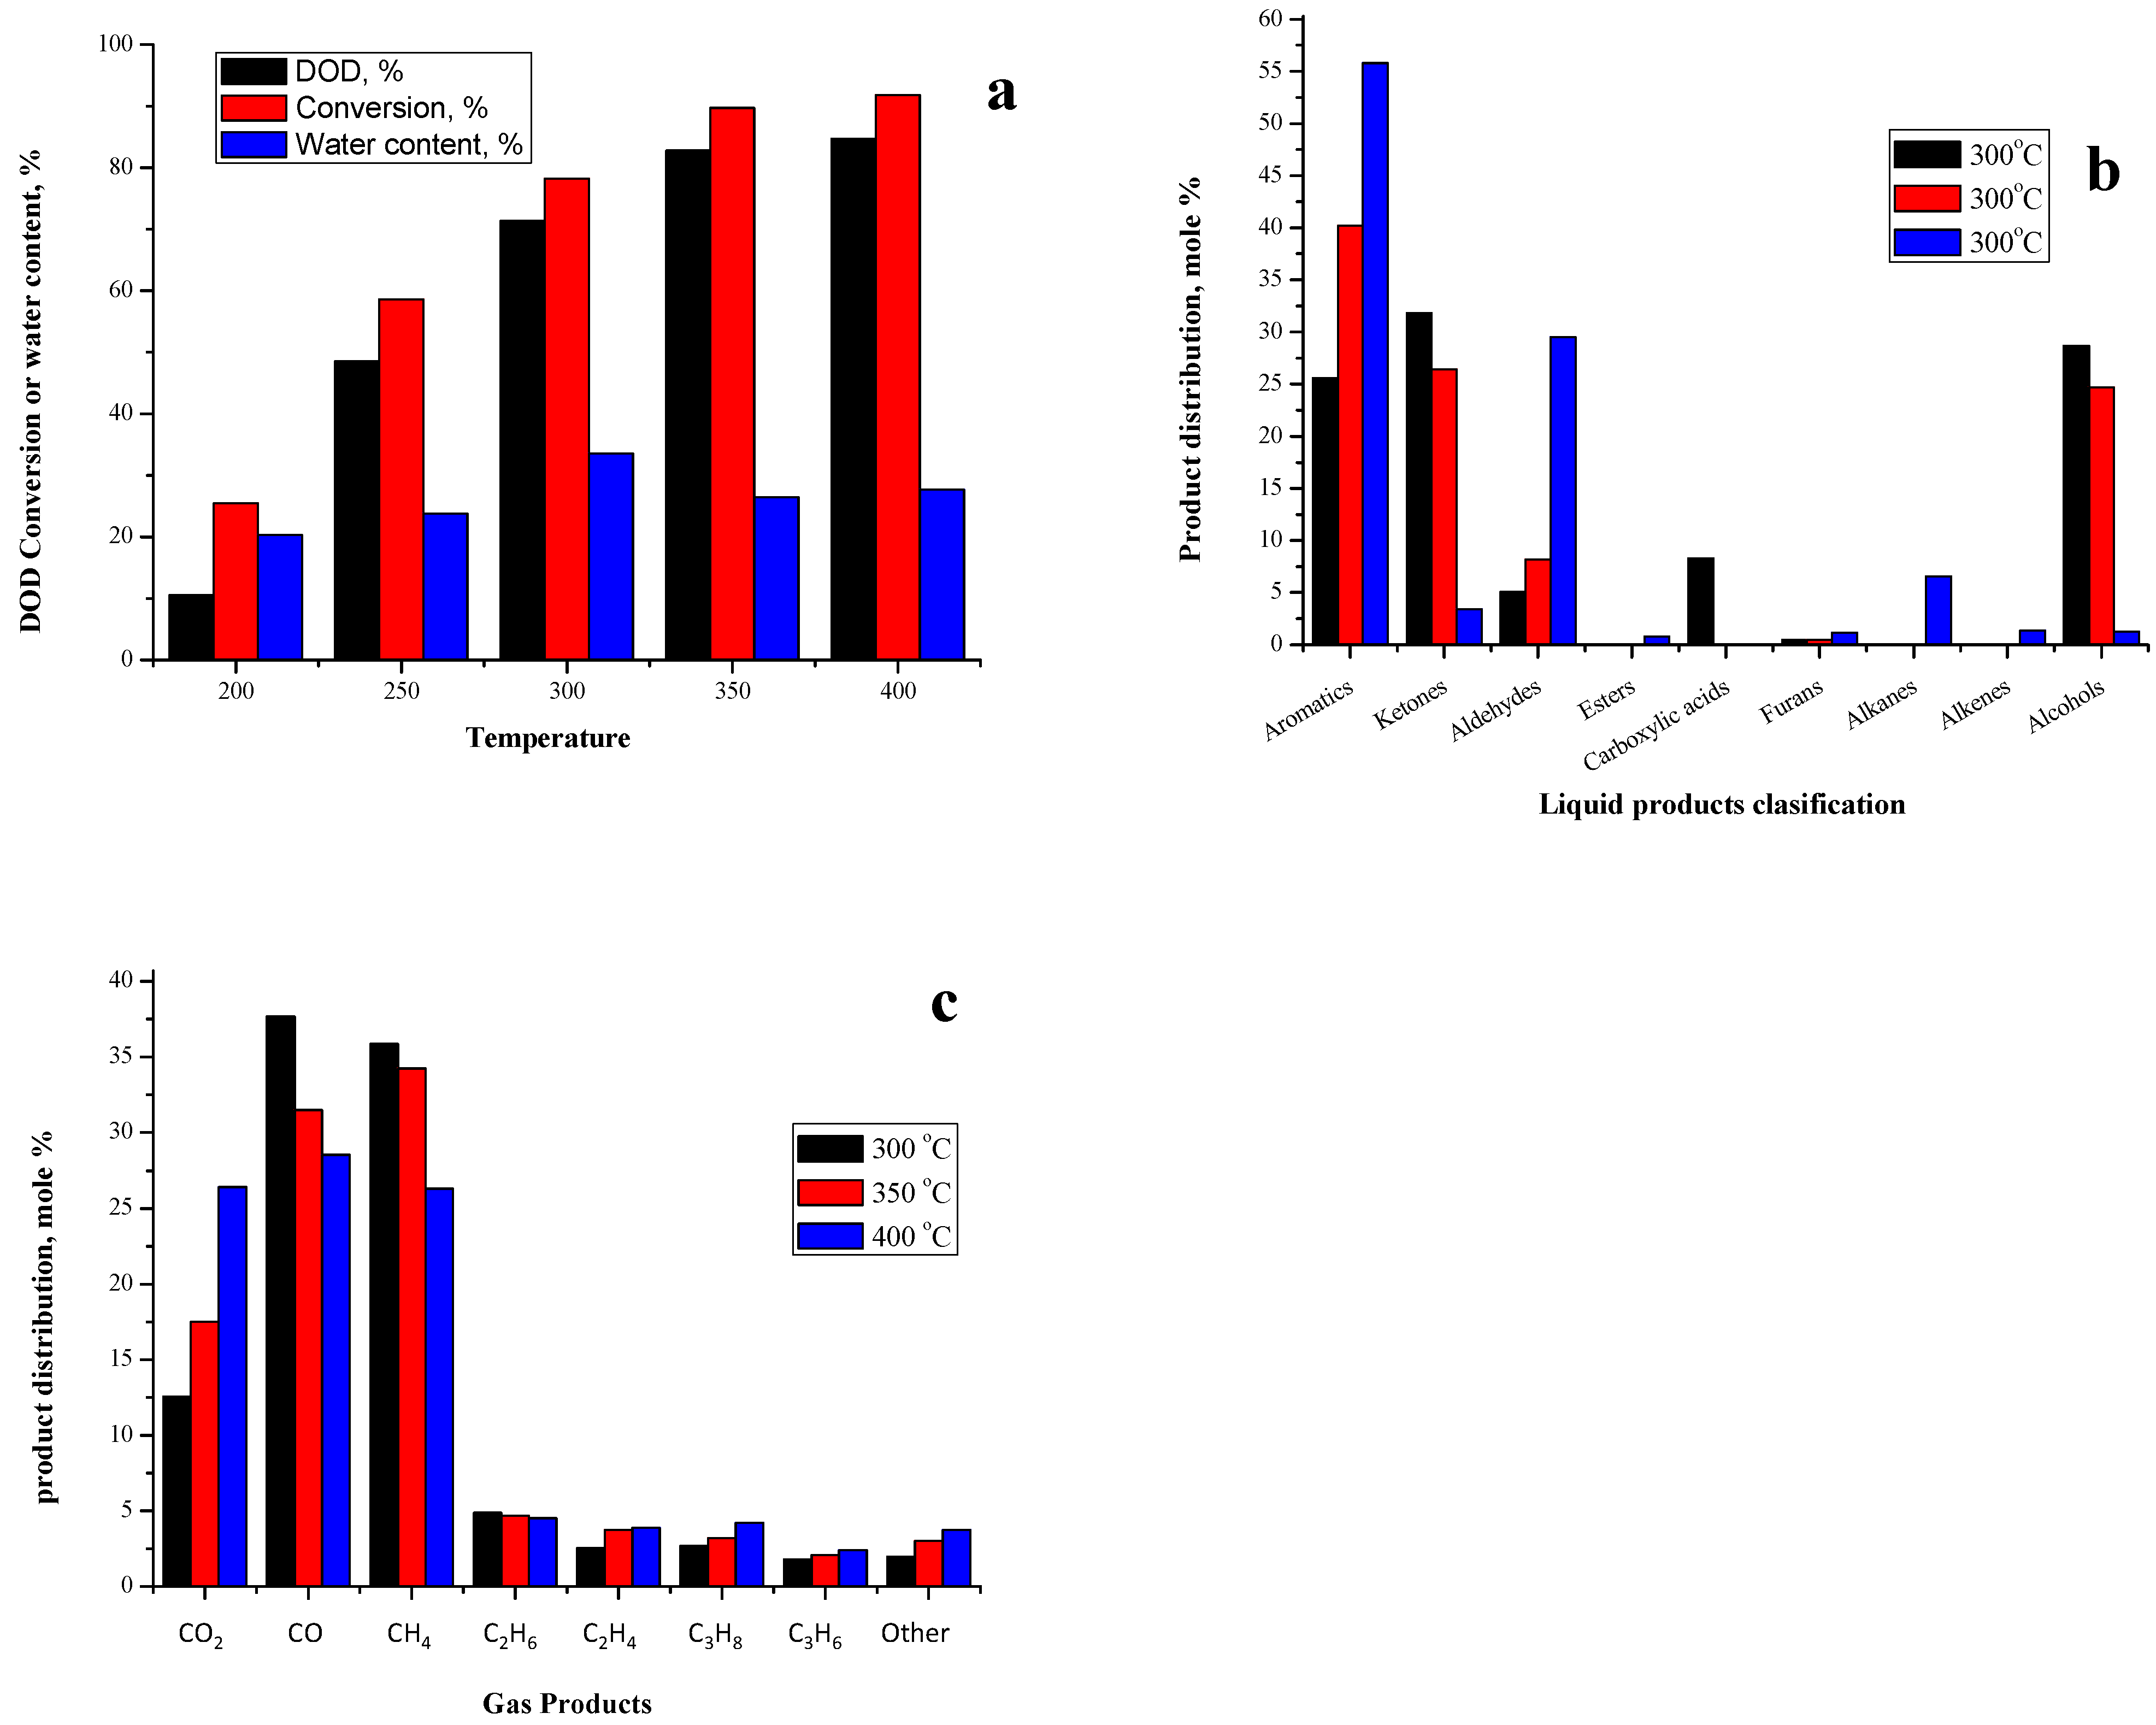
2.3.4. Effect of Gas-Phase Deoxygenation Temperature
3. Materials and Methods
3.1. Materials
3.2. Synthesis of Modified Hβ Zeolite
3.3. Catalyst Characterization
3.4. Biomass Pyrolysis Tar Purification
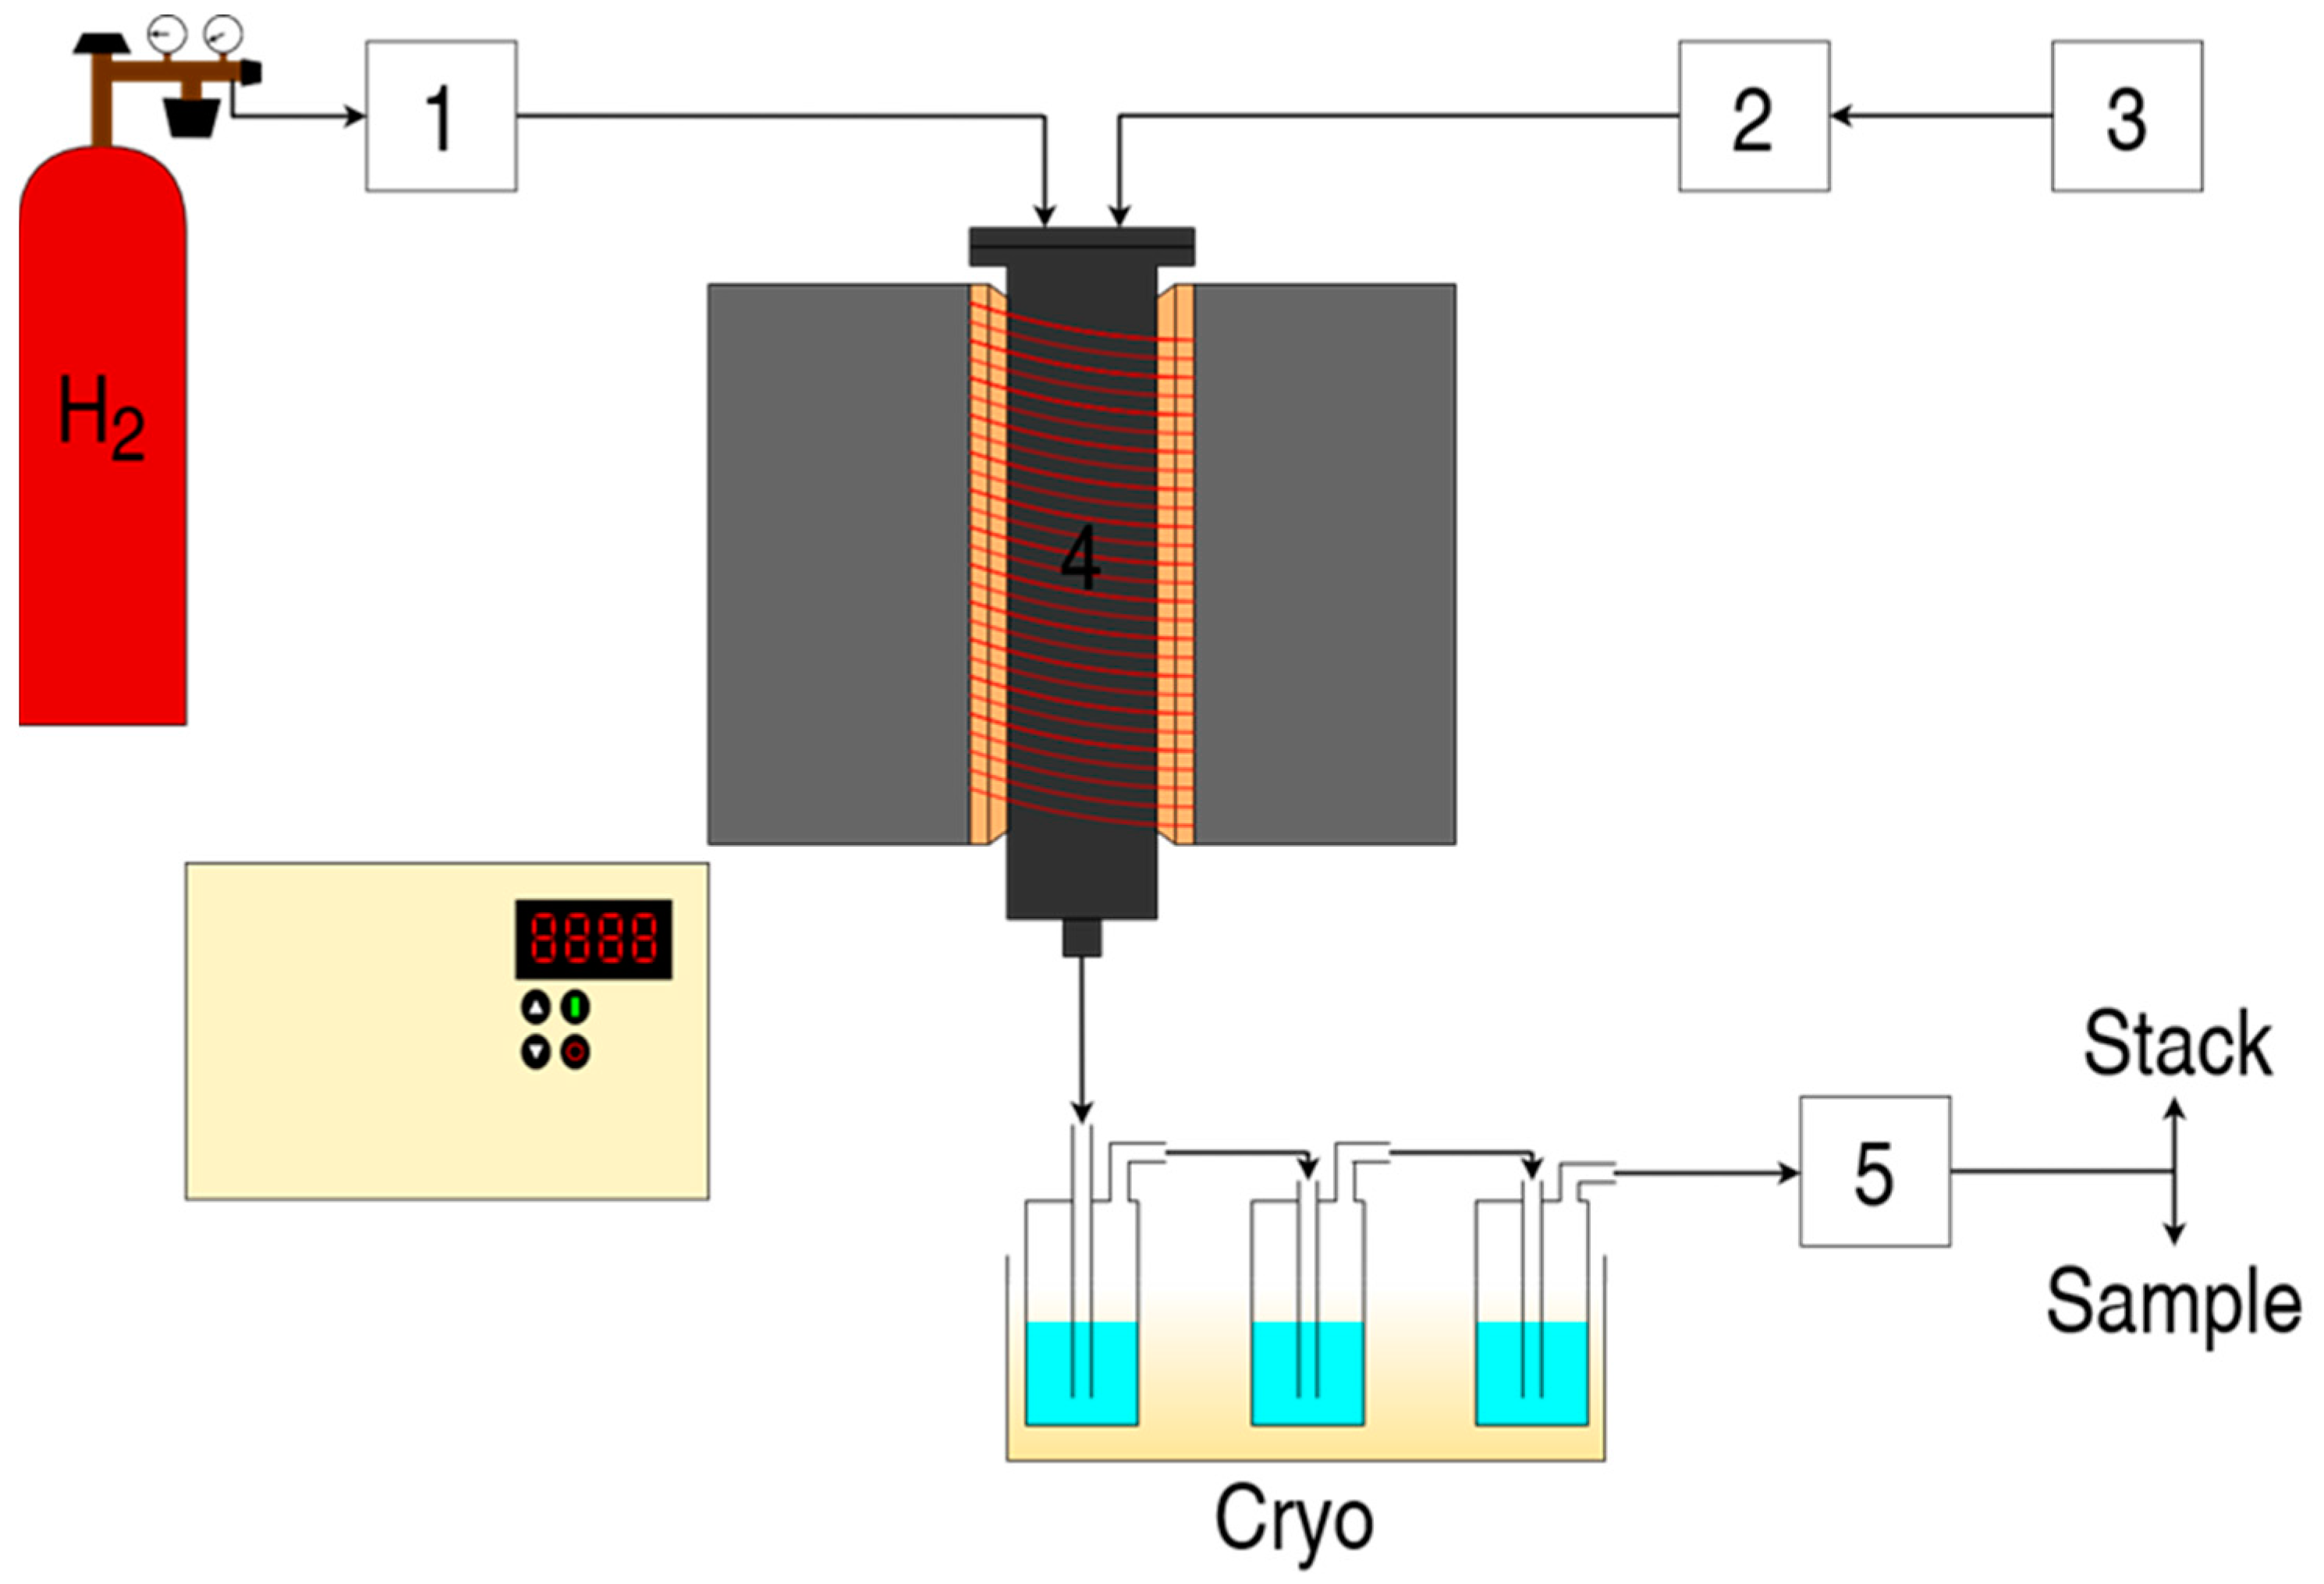
3.5. Gas-Phase Deoxygenation
3.6. Biomass Pyrolysis Tar and Product Analysis
4. Conclusions
Supplementary Materials
Author Contributions
Funding
Data Availability Statement
Acknowledgments
Conflicts of Interest
References
- Hasan, N.H.; Jazie, A.A. Hydrothermal Liquefaction Conversion of Lignocelluloses and waste Biomass Using Zeolite Catalyst. IOP Conf. Series Earth Environ. Sci. 2021, 790, 012036. [Google Scholar] [CrossRef]
- Nolte, M.W.; Shanks, B.H. A Perspective on Catalytic Strategies for Deoxygenation in Biomass Pyrolysis. Energy Technol. 2017, 5, 7–18. [Google Scholar] [CrossRef]
- Yek, P.N.Y.; Mahari, W.A.W.; Kong, S.H.; Foong, S.Y.; Peng, W.; Ting, H.; Liew, R.K.; Xia, C.; Sonne, C.; Tabatabaei, M.; et al. Pilot-scale co-processing of lignocellulosic biomass, algae, shellfish waste via thermochemical approach: Recent progress and future directions. Bioresour. Technol. 2022, 347, 126687. [Google Scholar] [CrossRef] [PubMed]
- Husár, J.; Šuhaj, P.; Haydary, J. Experimental validation of complex mathematical model of screw reactor coupled with particle model describing pyrolysis of lignocellulosic biomass. J. Environ. Chem. Eng. 2021, 9, 105543. [Google Scholar] [CrossRef]
- Vignesh, N.S.; Soosai, M.R.; Chia, W.Y.; Wahid, S.N.; Varalakshmi, P.; Moorthy, I.M.G.; Ashokkumar, B.; Arumugasamy, S.K.; Selvarajoo, A.; Chew, K.W. Microwave-assisted pyrolysis for carbon catalyst, nanomaterials and biofuel production. Fuel 2022, 313, 123023. [Google Scholar] [CrossRef]
- Zhang, Z.; Li, H. Water-mediated catalytic hydrodeoxygenation of biomass. Fuel 2022, 310, 122242. [Google Scholar] [CrossRef]
- Shukla, S.S.; Chava, R.; Appari, S.; Bahurudeen, A.; Kuncharam, B.V.R. Sustainable use of rice husk for the cleaner production of value-added products. J. Environ. Chem. Eng. 2022, 10, 106899. [Google Scholar] [CrossRef]
- Qin, Q.; Zhou, J.; Zhou, L.; Guo, Q. Investigation on effect of coal fly ash on properties of corn straw pyrolysis products. J. Energy Inst. 2022, 100, 213–224. [Google Scholar] [CrossRef]
- Lee, W.-S.; Wang, Z.; Zheng, W.; Vlachos, D.; Bhan, A. Catalysis Science & Technology 2-methylfuran on molybdenum carbide catalysts †. Catal. Sci. Technol. 2014, 4, 2340–2352. [Google Scholar] [CrossRef]
- Li, G.; Li, N.; Yang, J.; Wang, A.; Wang, X.; Cong, Y.; Zhang, T. Synthesis of renewable diesel with the 2-methylfuran, butanal and acetone derived from lignocellulose. Bioresour. Technol. 2013, 134, 66–72. [Google Scholar] [CrossRef]
- Mortensen, P.M.; Grunwaldt, J.-D.; Jensen, P.A.; Jensen, A.D. Influence on nickel particle size on the hydrodeoxygenation of phenol over Ni/SiO2. Catal. Today 2016, 259, 277–284. [Google Scholar] [CrossRef]
- Sulman, A.; Mäki-Arvela, P.; Bomont, L.; Alda-Onggar, M.; Fedorov, V.; Russo, V.; Eränen, K.; Peurla, M.; Akhmetzyanova, U.; Skuhrovcová, L.; et al. Kinetic and Thermodynamic Analysis of Guaiacol Hydrodeoxygenation. Catal. Lett. 2019, 149, 2453–2467. [Google Scholar] [CrossRef]
- Wang, J.; Abdelouahed, L.; Xu, J.; Brodu, N.; Taouk, B. Catalytic Hydrodeoxygenation of Model Bio-oils Using HZSM-5 and Ni2P/HZM-5 Catalysts: Comprehension of Interaction. Chem. Eng. Technol. 2021, 44, 2126–2138. [Google Scholar] [CrossRef]
- Ly, H.V.; Galiwango, E.; Kim, S.-S.; Kim, J.; Choi, J.H.; Woo, H.C.; Othman, M.R. Hydrodeoxygenation of 2-furyl methyl ketone as a model compound of algal Saccharina Japonica bio-oil using iron phosphide catalyst. Chem. Eng. J. 2017, 317, 302–308. [Google Scholar] [CrossRef]
- Wang, J.; Jabbour, M.; Abdelouahed, L.; Mezghich, S.; Estel, L.; Thomas, K.; Taouk, B. Catalytic upgrading of bio-oil: Hydrodeoxygenation study of acetone as molecule model of ketones. Can. J. Chem. Eng. 2021, 99, 1082–1093. [Google Scholar] [CrossRef]
- Ju, C.; Li, M.; Fang, Y.; Tan, T. Efficient Hydro-Deoxygenation of Lignin Derived Phenolic Compounds over Bifunctional Catalysts with Optimized Acid/Metal Interactions. Green Chem. 2018, 20, 4492–4499. [Google Scholar] [CrossRef]
- Li, Z.; Xu, X.; Jiang, E.; Han, P.; Sun, Y.; Zhou, L.; Zhong, P.; Fan, X. Alkane from hydrodeoxygenation (HDO) combined with in-situ multistage condensation of biomass continuous pyrolysis bio-oil via mixed supports catalyst Ni/HZSM-5-γ-Al2O3. Renew. Energy 2020, 149, 535–548. [Google Scholar] [CrossRef]
- Yan, P.; Bryant, G.; Li, M.M.-J.; Mensah, J.; Kennedy, E.; Stockenhuber, M. Shape selectivity of zeolite catalysts for the hydrodeoxygenation of biocrude oil and its model compounds. Microporous Mesoporous Mater. 2020, 309, 110561. [Google Scholar] [CrossRef]
- Wu, Y.; Xu, X.; Sun, Y.; Jiang, E.; Fan, X.; Tu, R.; Wang, J. Gas-phase hydrodeoxygenation of guaiacol over Ni-based HUSY zeolite catalysts under atmospheric H2 pressure. Renew. Energy 2020, 152, 1380–1390. [Google Scholar] [CrossRef]
- Yu, W.; Tang, Y.; Mo, L.; Chen, P.; Lou, H.; Zheng, X. One-step hydrogenation–esterification of furfural and acetic acid over bifunctional Pd catalysts for bio-oil upgrading. Bioresour. Technol. 2011, 102, 8241–8246. [Google Scholar] [CrossRef]
- Wan, H.; Chaudhari, R.V.; Subramaniam, B. Aqueous Phase Hydrogenation of Acetic Acid and Its Promotional Effect on p-Cresol Hydrodeoxygenation. Energy Fuels 2013, 27, 487–493. [Google Scholar] [CrossRef]
- Chen, W.; Luo, Z.; Yu, C.; Li, G.; Yang, Y.; Zhang, J.; Lu, K. Catalytic transformations of acids, aldehydes, and phenols in bio-oil to alcohols and esters. Fuel 2014, 135, 55–62. [Google Scholar] [CrossRef]
- Zeng, Y.; Wang, Z.; Lin, W.; Song, W. In situ hydrodeoxygenation of phenol with liquid hydrogen donor over three supported noble-metal catalysts. Chem. Eng. J. 2017, 320, 55–62. [Google Scholar] [CrossRef]
- Sankaranarayanan, T.; Kreider, M.; Berenguer, A.; Gutiérrez-Rubio, S.; Moreno, I.; Pizarro, P.; Coronado, J.; Serrano, D. Cross-reactivity of guaiacol and propionic acid blends during hydrodeoxygenation over Ni-supported catalysts. Fuel 2018, 214, 187–195. [Google Scholar] [CrossRef]
- Funkenbusch, L.T.; Mullins, M.E.; Salam, M.A.; Creaser, D. Catalytic Hydrotreatment of Pyrolysis Oil Phenolic Compounds over Pt/Al2O3 and Pd/C. Fuel 2019, 243, 441–448. [Google Scholar] [CrossRef]
- Gutiérrez-Rubio, S.; Moreno, I.; Serrano, D.P.; Coronado, J.M. Hydrotreating of Guaiacol and Acetic Acid Blends over Ni2P/ZSM-5 Catalysts: Elucidating Molecular Interactions during Bio-Oil Upgrading. ACS Omega 2019, 4, 21516–21528. [Google Scholar] [CrossRef]
- Azreena, I.N.; Lau, H.L.N.; Asikin-Mijan, N.; Izham, S.M.; Hassan, M.A.; Kennedy, E.; Stokenhuber, M.; Taufiq-Yap, Y.H. Hydrodeoxygenation of oleic acid for effective diesel-like hydrocarbon production using zeolite-based catalysts. React. Kinet. Catal. Lett. 2021, 134, 1069–1083. [Google Scholar] [CrossRef]
- Sousa-Aguiar, E.F.; Trigueiro, F.E.; Zotin, F.M.Z. The role of rare earth elements in zeolites and cracking catalysts. Catal. Today 2013, 218–219, 115–122. [Google Scholar] [CrossRef]
- Jazie, A.A.; Haydary, J.; Abed, S.A.; Al-Dawody, M.F. Hydrothermal liquefaction of Fucus vesiculosus algae catalyzed by Hβ zeolite catalyst for Biocrude oil production. Algal Res. 2022, 61, 102596. [Google Scholar] [CrossRef]
- Zhang, Y.; Wang, Y.; Bu, Y.; Mi, Z.; Wu, W.; Min, E.; Han, S.; Fu, S. Beckmann rearrangement of cyclohexanone oxime over Hβ zeolite and Hβ zeolite-supported boride. Catal. Commun. 2005, 6, 53–56. [Google Scholar] [CrossRef]
- Zhang, Q.; Ming, W.; Ma, J.; Zhang, J.; Wang, P.; Li, R. De novo assembly of a mesoporous beta zeolite with intracrystalline channels and its catalytic performance for biodiesel production. J. Mater. Chem. A 2014, 2, 8712–8718. [Google Scholar] [CrossRef]
- Fei, J.; Hou, Z.; Zhu, B.; Lou, H.; Zheng, X. Synthesis of dimethyl ether (DME) on modified HY zeolite and modified HY zeolite-supported Cu–Mn–Zn catalysts. Appl. Catal. A Gen. 2006, 304, 49–54. [Google Scholar] [CrossRef]
- Otomo, R.; Yokoi, T.; Kondo, J.N.; Tatsumi, T. Dealuminated Beta zeolite as effective bifunctional catalyst for direct transformation of glucose to 5-hydroxymethylfurfural. Appl. Catal. A Gen. 2014, 470, 318–326. [Google Scholar] [CrossRef]
- Liu, X.; Liu, Y.; Li, X.; Xiang, S.; Zhang, Y.; Ying, P.; Wei, Z.; Can, L. Cyclopropanation on a highly active heterogeneous catalyst. Appl. Catal. A Gen. 2003, 239, 279–286. [Google Scholar] [CrossRef]
- Wang, H.; Zou, Y. Modified Beta Zeolite as Catalyst for Fries Rearrangement Reaction. Catal. Lett. 2003, 86, 163–167. [Google Scholar] [CrossRef]
- Zaiku, X.; Qingling, C.; Chengfang, Z.; Jiaqing, B.; Yuhua, C. Influence of Citric Acid Treatment on the Surface Acid Properties of Zeolite Beta. J. Phys. Chem. B 2000, 104, 2853–2859. [Google Scholar] [CrossRef]
- Berenguer, A.; Bennett, J.A.; Hunns, J.; Moreno, I.; Coronado, J.M.; Lee, A.F.; Pizarro, P.; Wilson, K.; Serrano, D.P. Catalytic hydrodeoxygenation of m-cresol over Ni 2 P/hierarchical ZSM-5. Catal. Today 2018, 304, 72–79. [Google Scholar] [CrossRef]
- Li, Y.; Yang, X.; Zhu, L.; Zhang, H.; Chen, B. Hydrodeoxygenation of phenol as a bio-oil model compound over intimate contact noble metal–Ni2P/SiO2 catalysts. RSC Adv. 2015, 5, 80388–80396. [Google Scholar] [CrossRef]
- Choi, I.-H.; Lee, H.-J.; Hwang, K.-R. Understanding the effect of co-reactants on ketonization of carboxylic acids in the aqueous-phase pyrolysis oil of wood. Wood Sci. Technol. 2021, 55, 1745–1764. [Google Scholar] [CrossRef]
- Oyama, S.T.; Onkawa, T.; Takagaki, A.; Kikuchi, R.; Hosokai, S.; Suzuki, Y.; Bando, K. Production of Phenol and Cresol from Guaiacol on Nickel Phosphide Catalysts Supported on Acidic Supports. Top. Catal. 2015, 58, 201–210. [Google Scholar] [CrossRef]
- Parikh, J.K.; Srivastava, S.; Jadeja, G.C. Selective Hydrogenation of Furfural to Tetrahydrofurfuryl Alcohol Using Supported Nickel–Cobalt Catalysts. Ind. Eng. Chem. Res. 2019, 58, 16138–16152. [Google Scholar] [CrossRef]
- Alotaibi, M.A.; Kozhevnikova, E.F.; Kozhevnikov, I.V. Efficient hydrodeoxygenation of biomass-derived ketones over bifunctional Pt-polyoxometalate catalyst. Chem. Commun. 2012, 48, 7194–7196. [Google Scholar] [CrossRef]
- Kong, L.; Liu, C.; Gao, J.; Wang, Y.; Dai, L. Efficient and controllable alcoholysis of Kraft lignin catalyzed by porous zeolite-supported nickel-copper catalyst. Bioresour. Technol. 2019, 276, 310–317. [Google Scholar] [CrossRef]
- Zhang, W.; Zhang, Y.; Zhao, L.; Wei, W. Catalytic Activities of NiMo Carbide Supported on SiO2 for the Hydrodeoxygenation of Ethyl Benzoate, Acetone, and Acetaldehyde. Energy Fuels 2010, 24, 2052–2059. [Google Scholar] [CrossRef]
- Nikolopoulos, A.; Jang, B.-L.; Spivey, J. Acetone condensation and selective hydrogenation to MIBK on Pd and Pt hydrotalcite-derived MgAl mixed oxide catalysts. Appl. Catal. A Gen. 2005, 296, 128–136. [Google Scholar] [CrossRef]
- Gamman, J.J.; Jackson, S.D.; Wigzell, F.A. Synthesis of Methyl Isobutyl Ketone over Pd/MgO/SiO2. Ind. Eng. Chem. Res. 2010, 49, 8439–8443. [Google Scholar] [CrossRef]
- Zhang, H.; Xiao, R.; Jin, B.; Xiao, G.; Chen, R. Biomass catalytic pyrolysis to produce olefins and aromatics with a physically mixed catalyst. Bioresour. Technol. 2013, 140, 256–262. [Google Scholar] [CrossRef] [PubMed]
- Simakova, I.L.; Murzin, D.Y. Transformation of bio-derived acids into fuel-like alkanes via ketonic decarboxylation and hydrodeoxygenation: Design of multifunctional catalyst, kinetic and mechanistic aspects. J. Energy Chem. 2016, 25, 208–224. [Google Scholar] [CrossRef]
- Nakagawa, Y.; Liu, S.; Tamura, M.; Tomishige, K. Catalytic Total Hydrodeoxygenation of Biomass-Derived Polyfunctionalized Substrates to Alkanes. Chemsuschem 2015, 8, 1114–1132. [Google Scholar] [CrossRef]
- Witsuthammakul, A.; Sooknoi, T. Selective Hydrodeoxygenation of Bio-Oil Derived Products: Ketones to Olefins. Catal. Sci. Technol. 2015, 5, 3639–3648. [Google Scholar] [CrossRef]
- Bej, S.; Thompson, L. Acetone condensation over molybdenum nitride and carbide catalysts. Appl. Catal. A Gen. 2004, 264, 141–150. [Google Scholar] [CrossRef]
- Mullery, A.A.; Hoang, J.N.; Nguyen, A.T.; Luong, C.D.; Ledesma, E.B. Thermal decomposition pathways of 4-ethylguaiacol under fast pyrolysis and gasification conditions. J. Anal. Appl. Pyrolysis 2017, 123, 83–91. [Google Scholar] [CrossRef]
- Kunkes, E.L.; Simonetti, D.A.; West, R.M.; Serrano-ruiz, J.C.; Gärtner, C.A.; Dumesic, J.A. Catalytic Conversion of Biomass. Science 2008, 1381, 417–421. [Google Scholar] [CrossRef]
- Jaatinen, S.K.; Karinen, R.; Lehtonen, J.S. Liquid Phase Furfural Hydrotreatment to 2-Methylfuran with Carbon Supported Copper, Nickel, and Iron Catalysts. ChemistrySelect 2017, 2, 51–60. [Google Scholar] [CrossRef]
- Mante, O.D.; Rodriguez, J.A.; Babu, S.P. Selective defunctionalization by TiO2 of monomeric phenolics from lignin pyrolysis into simple phenols. Bioresour. Technol. 2013, 148, 508–516. [Google Scholar] [CrossRef] [PubMed]
- Xu, Y.; Zhang, L.; Chang, J.; Zhang, X.; Ma, L.; Wang, T.; Zhang, Q. One step hydrogenation–esterification of model compounds and bio-oil to alcohols and esters over Raney Ni catalysts. Energy Convers. Manag. 2016, 108, 78–84. [Google Scholar] [CrossRef]
- Li, W.; Wang, H.; Wu, X.; Betancourt, L.E.; Tu, C.; Liao, M.; Cui, X.; Li, F.; Zheng, J.; Li, R. Ni/hierarchical ZSM-5 zeolites as promising systems for phenolic bio-oil upgrading: Guaiacol hydrodeoxygenation. Fuel 2020, 274, 117859. [Google Scholar] [CrossRef]
- Williams, C.L.; Chang, C.-C.; Do, P.; Nikbin, N.; Caratzoulas, S.; Vlachos, D.G.; Lobo, R.F.; Fan, W.; Dauenhauer, P.J. Cycloaddition of Biomass-Derived Furans for Catalytic Production of Renewable p-Xylene. ACS Catal. 2012, 2, 935–939. [Google Scholar] [CrossRef]
- Kumar, R.; Strezov, V.; Lovell, E.; Kan, T.; Weldekidan, H.; He, J.; Dastjerdi, B.; Scott, J. Bio-oil upgrading with catalytic pyrolysis of biomass using Copper/zeolite-Nickel/zeolite and Copper-Nickel/zeolite catalysts. Bioresour. Technol. 2019, 279, 404–409. [Google Scholar] [CrossRef]
- Kosri, C.; Deekamwong, K.; Sophiphun, O.; Osakoo, N.; Chanlek, N.; Föttinger, K.; Wittayakun, J. Comparison of Fe/HBEA catalysts from incipient wetness impregnation with various loading on phenol hydroxylation. React. Kinet. Catal. Lett. 2017, 121, 751–761. [Google Scholar] [CrossRef]


| Sample | Specific Area (m2/g) | Pore Volume (cm3/g) | Pore Size (Å) | |||||
|---|---|---|---|---|---|---|---|---|
| SBET | Smicro | Sexternal | VTotal | Vmicro | VBJH | Daverage | DBJH | |
| Hβ zeolite | 525.98 | 225.56 | 300.42 | 1.04 | 0.08 | 0.96 | 24.71 | 26.61 |
| 1 wt% Ce/Hβ | 496.63 | 198.78 | 297.85 | 0.77 | 0.06 | 0.71 | 13.96 | 15.79 |
| 1 wt% Ce/Hβ * | 423.68 | 195.65 | 228.03 | 0.69 | 0.06 | 0.62 | 13.40 | 15.66 |
| 5 wt% Ce/Hβ | 510.16 | 199.89 | 310.27 | 0.74 | 0.06 | 0.68 | 14.49 | 16.64 |
| 5 wt% Ce/Hβ * | 390.46 | 187.88 | 202.58 | 0.61 | 0.06 | 0.55 | 12.75 | 14.84 |
| 1 wt% La/Hβ | 481.12 | 189.89 | 291.23 | 0.77 | 0.08 | 0.69 | 15.63 | 17.29 |
| 1 wt% La/Hβ * | 418.73 | 187.75 | 230.98 | 0.82 | 0.08 | 0.74 | 19.29 | 21.36 |
| 5 wt% La/Hβ | 508.49 | 198.93 | 309.56 | 0.74 | 0.07 | 0.67 | 13.93 | 15.75 |
| 5 wt% La/Hβ * | 400.74 | 185.78 | 214.96 | 0.67 | 0.07 | 0.60 | 14.25 | 16.62 |
| 1 wt% Nd/Hβ | 500.08 | 195.87 | 304.21 | 0.72 | 0.07 | 0.64 | 13.07 | 15.12 |
| 1 wt% Nd/Hβ * | 419.20 | 189.88 | 229.32 | 0.72 | 0.07 | 0.66 | 14.53 | 16.65 |
| 5 wt% Nd/Hβ | 481.64 | 188.78 | 292.86 | 0.79 | 0.07 | 0.72 | 14.39 | 16.47 |
| 5 wt% Nd/Hβ * | 373.66 | 165.78 | 207.88 | 0.68 | 0.07 | 0.61 | 15.53 | 17.35 |
| Catalyst | Metal (wt%) | Crystallinity (%) | Bronsted Acidity (mmol/gm) | Lewis Acidity (mmol/gm) |
|---|---|---|---|---|
| Hβ zeolite | 0.00 | 100 | 0.56 | 0.28 |
| 1 wt% Ce/Hβ | 1.04 | 95 | 0.79 | 0.91 |
| 1 wt% Ce/Hβ * | 1.03 | 94 | 0.79 | 0.91 |
| 5 wt% Ce/Hβ | 4.98 | 94 | 0.82 | 0.93 |
| 5 wt% Ce/Hβ * | 4.97 | 93 | 0.81 | 0.92 |
| 1 wt% La/Hβ | 1.05 | 93 | 0.67 | 0.61 |
| 1 wt% La/Hβ * | 1.04 | 92 | 0.67 | 0.61 |
| 5 wt% La/Hβ | 4.96 | 92 | 0.71 | 0.63 |
| 5 wt% La/Hβ * | 4.95 | 91 | 0.70 | 0.62 |
| 1 wt% Nd/Hβ | 1.06 | 93 | 0.64 | 0.54 |
| 1 wt% Nd/Hβ * | 1.05 | 92 | 0.64 | 0.54 |
| 5 wt% Nd/Hβ | 5.09 | 92 | 0.67 | 0.58 |
| 5 wt% Nd/Hβ * | 5.08 | 91 | 0.65 | 0.57 |
| Contact Time, Sec | Conversion, % | Mesitylene,% | Benzene, % | Toluene, % | Xylene, % | Alkanes and Alkenes, % |
|---|---|---|---|---|---|---|
| 0.31 | 82 | 1.01 | 0.64 | 3.42 | 3.63 | 2.45 |
| 0.63 | 88 | 1.31 | 1.12 | 9.23 | 15.78 | 8.00 |
| 0.71 | 92 | 0.61 | 1.61 | 9.02 | 11.67 | 2.29 |
| 1.03 | 100 | 0.52 | 1.42 | 8.89 | 9.84 | 2.17 |
| DOD, Conversion, or Yield (wt%) | Hβ Zeolite | 1wt%Ce/Hβ Zeolite |
|---|---|---|
| DOD | 59.8 | 68.6 |
| Acetic acid conversion | 74.8 | 88.3 |
| Acetone conversion | −185.4 | 79.5 |
| Furfural conversion | 100 | 100 |
| 4-ethlyguaiacol conversion | 47.6 | 38.5 |
| Phenol conversion | 4.3 | 16.4 |
| Yield of water | 21.35 | 18.33 |
| Yield of liquid products | 49.76 | 47.42 |
| Yield of gas products | 28.89 | 34.25 |
| DOD, Conversion, or Yield (wt%) | 300 °C | 350 °C | 400 °C |
|---|---|---|---|
| DOD | 54.7 | 62.4 | 68.6 |
| Acetic acid conversion | 46.8 | 58.5 | 88.3 |
| Acetone conversion | 37.2 | 49.8 | 79.5 |
| Furfural conversion | 100 | 100 | 100 |
| 4-ethlyguaiacol conversion | 26.7 | 31.4 | 38.5 |
| Phenol conversion | 24.5 | 18.3 | 16.4 |
| Yield of water | 9.68 | 15.15 | 18.33 |
| Yield of liquid products | 64.75 | 57.45 | 47.42 |
| Yield of gas products | 24.76 | 28.65 | 34.25 |
| Material | HHV (MJ/kg) ** | Ultimate Analysis (wt%) ** | |||||
|---|---|---|---|---|---|---|---|
| C (wt%) | H (wt%) | N (wt%) | S (wt%) | O (wt%) * | Ash | ||
| Biomass pyrolysis tar | 24.23 ± 0.06 | 59.06 ± 0.08 | 9.50 ± 0.09 | 0.32 ± 0.04 | 0.00 ± 0.0 | 25.54 ± 0.07 | 5.58 ± 0.06 |
| Liquid product from tar | 27.34 ± 0.08 | 76.80 ± 0.05 | 8.24 ± 0.04 | 0.90 ± 0.02 | 0.00 ± 0.0 | 13.06 ± 0.07 | 0.00 ± 0.00 |
| Solid product from tar *** | 12.78 ± 0.05 | 35.29 ± 0.09 | 12.37 ± 0.07 | 0.12 ± 0.01 | 0.05 ± 0.1 | 17.56 ± 0.07 | 34.61 ± 0.09 |
Disclaimer/Publisher’s Note: The statements, opinions and data contained in all publications are solely those of the individual author(s) and contributor(s) and not of MDPI and/or the editor(s). MDPI and/or the editor(s) disclaim responsibility for any injury to people or property resulting from any ideas, methods, instructions or products referred to in the content. |
© 2023 by the authors. Licensee MDPI, Basel, Switzerland. This article is an open access article distributed under the terms and conditions of the Creative Commons Attribution (CC BY) license (https://creativecommons.org/licenses/by/4.0/).
Share and Cite
Jazie, A.A.; Haydary, J.; Abed, S.A.; Husár, J. Gas-Phase Deoxygenation of Biomass Pyrolysis Tar Catalyzed by Rare Earth Metal Loaded Hβ Zeolite. Catalysts 2023, 13, 1016. https://doi.org/10.3390/catal13061016
Jazie AA, Haydary J, Abed SA, Husár J. Gas-Phase Deoxygenation of Biomass Pyrolysis Tar Catalyzed by Rare Earth Metal Loaded Hβ Zeolite. Catalysts. 2023; 13(6):1016. https://doi.org/10.3390/catal13061016
Chicago/Turabian StyleJazie, Ali A., Juma Haydary, Suhad A. Abed, and Jakub Husár. 2023. "Gas-Phase Deoxygenation of Biomass Pyrolysis Tar Catalyzed by Rare Earth Metal Loaded Hβ Zeolite" Catalysts 13, no. 6: 1016. https://doi.org/10.3390/catal13061016
APA StyleJazie, A. A., Haydary, J., Abed, S. A., & Husár, J. (2023). Gas-Phase Deoxygenation of Biomass Pyrolysis Tar Catalyzed by Rare Earth Metal Loaded Hβ Zeolite. Catalysts, 13(6), 1016. https://doi.org/10.3390/catal13061016