Article

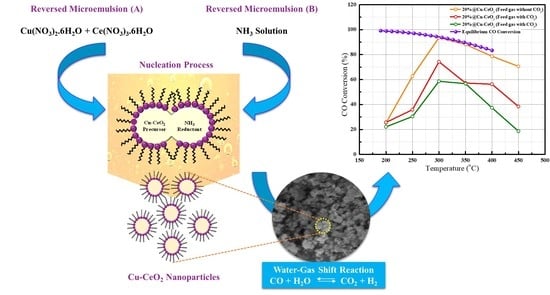
Modification of Copper-Ceria Catalyst via Reverse Microemulsion Method and Study of the Effects of Surfactant on WGS Catalyst Activity

1
Graduate School of Energy Science and Technology, Chungnam National University, 99 Daehak-ro, Yuseong-gu, Daejeon 34134, Republic of Korea
2
Department of Chemical Engineering Education, Chungnam National University, 99 Daehak-ro, Yuseong-gu, Daejeon 34134, Republic of Korea
3
Department of Convergence System Engineering, Chungnam National University, 99 Daehak-ro, Yuseong-gu, Daejeon 34134, Republic of Korea
*
Authors to whom correspondence should be addressed.
These authors contributed equally to this work.
Catalysts 2023, 13(6), 951; https://doi.org/10.3390/catal13060951
Submission received: 28 April 2023 / Revised: 26 May 2023 / Accepted: 29 May 2023 / Published: 30 May 2023
(This article belongs to the Special Issue Advances in Catalysts for Water-Gas Shift Reaction)

Abstract

:
Some major drawbacks encountered in the synthesis of copper-ceria (Cu-CeO2)-based Water Gas Shift (WGS) catalyst via the conventional Impregnation (IMP) method are aggregate formation and nanoparticles’ instability. These lead to the poor interaction between Copper and Ceria, thereby impeding the catalytic activity with the inefficient utilization of active sites. To overcome these drawbacks, in this study, we described the synthesis of the Cu-CeO2 catalyst via the Reverse Microemulsion (RME) method with the help of the organic surfactant. This development of insights and strategies resulted in the preparation of porous particles with uniform size distribution and improved interaction within the composites, which were evident through XRD, XPS, BET Surface area, TPR, TEM and SEM analysis results. Remarkably, the optimum 20% Cu-CeO2 catalyst prepared by RME method was found to have superior Water Gas Shift (WGS) catalytic activity than the conventionally Impregnated catalyst when their CO conversion efficiencies were tested in WGS reaction at different feed gas compositions with and without CO2. Moreover, the 20% Cu-CeO2 sample prepared by RME method exhibited sustained catalytic activity throughout the entire 48 h period without any signs of deactivation. This observation highlights RME method as the potential pathway for developing more effective nanoparticle catalysts for hydrogen production, contributing to the growing demand for clean and sustainable energy sources.

Graphical Abstract

1. Introduction

With the progressive development of the global population, more challenges have been occurring in sectors regarding energy, food, water, and medical care as they become more reliable. Among them, the higher energy demand is still a major challenge for global citizens. According to the prediction of the International Energy Agency (IEA), the worldwide energy need would increase by nearly 50% over the next 30 years [1]. Over the last decades, the major parts of energy sources of our planet greatly relied on the fossil fuels such as petroleum, coal, etc. [2,3]. As a consequence of the extraction of resources from the environment and excessive usage of these fossil fuels, carbon emission from these sources has already triggered climate changes and most parts of the globe have experienced the impact of these changes in recent years.
As a consequence of the influence of these climate change with global warming and to fulfill some segments of expanding energy requirements, lots of efforts have already been applied to the investigation of eco-friendly and energy-sufficient technologies [4]. Among them, hydrogen production is one of the most popular technologies, and most experts expected hydrogen as the life-changing energy source of the 21st century and then considered it a part of the potential Clean Energy of the Future [5,6]. Due to the above environmental and social benefits of hydrogen, it has been increasingly produced around the globe as a versatile energy carrier that can help to tackle various challenges [7]. Depending upon the sources of hydrogen production, synthesized hydrogen can be mainly divided into four main categories. Hydrogen produced from coal can be classified as brown hydrogen while hydrogen created from natural gas, petroleum, and other side products such as pet coke can be categorized as grey hydrogen. The refined hydrogen obtained from brown and grey hydrogen production combined with carbon capture and utilization/storage could be referred to as blue hydrogen. Hydrogen synthesized using renewable energy could be described as green hydrogen. To achieve the standards of clean technologies and goals of net zero emissions by 2050, green hydrogen technologies should be preferable for long-term conditions. However, in the current era, electrolysis is the only reliable method for producing green hydrogen and it still has limitations in practical usage because of its unserviceableness in economic and technological aspects [8,9,10].
Currently, the majority of hydrogen was commercially manufactured from steam methane reforming of natural gas [11] or hydrogen-rich syngas produced from coal gasification of hydrocarbons such as petroleum coke (pet coke) [12,13]. As the consequence of CO presence, Water Gas Shift (WGS) reaction usually accompanies commercial hydrogen production to produce high concentration hydrogen from syngas. Because of the thermodynamic and kinetically favorability of WGS reaction, it can be divided into operations with two different temperature regions [4]. High temperature Water Gas Shift (HT-WGS) is usually applied initially; however, a trace amount of CO still remains in the product gas composition, which is why Low temperature Water Gas Shift (LT-WGS) usually follows [14]. Since LT-WGS only provides a small amount of energy during the process, catalysts with high catalytic efficiency and stability are usually demanded in industrial and commercialized applications [15].
In order to meet these necessities, at least three compositions must be included in most catalysts: active part and support together with promotor/stabilizer. In some preparations of the LT-WGS catalysts, two or more chemicals were utilized only even for a promotor/stabilizer in addition for active part and support as in the investigation of the Kinetics and Catalysis of the Water-Gas-Shift Reaction conducted by Callaghan (2006). In this study, to fulfill the equilibrium CO conversion even in the gas composition without CO2, catalysts with more than two chemical components were utilized [16]. Moreover, some research works were performed by using precious chemical components such as platinum or palladium for the active part to achieve catalysts with high-performance efficiency. Callaghan (2006) investigated the effect of precious metal catalyst on WGS activity by doping platinum, palladium, rhodium, and ruthenium on alumina pellets. Additionally, Jain et al. (2014) also conducted a study involving the synthesis of platinum-ceria catalyst for WGS activity and successfully achieved 100% CO conversion at 250 °C [16,17]. Although these types of catalysts proved high activity and selectivity performance, they are impracticable for industrial and commercialized applications because of their rareness and high costs.
On the other hand, Cu-CeO2 catalysts have brought about considerable attractiveness in heterogeneous catalysis nowadays because of the presence of unique chemical properties that are effective and practicable for chemical reactions regarding environmental and energy sectors [18,19,20]. These composite catalysts are also efficient in syngas chemistry such as LT-WGS reactions. As a critical factor shaping the catalytic properties of Cu-CeO2 composites, strong copper-ceria interaction is predominantly viewed as the responsible phenomenon that determines the activity and selectivity of the catalyst. Chen et al. (2019) conducted a study on the structure of catalytically active copper–ceria interfacial perimeter and proved the copper–ceria interfacial perimeter, Cu+–Ov–Ce3+, as the active sites for LT-WGS reaction. Moreover, Yao et al. (2014) also reported the enhancement of the copper-ceria interaction on the activity and stability of Cu-CeO2 catalysts [19,21,22]. But other parameters such as surface morphology, pore diameter and deposited active metal size, etc. also affect the proficiency of the catalyst. Previous studies had already proven that having bulk structures can cause deactivation and reduce the activity and stability of the catalysts. Reina et al. (2016) constructed a study by comparing the bulk CuO-CeO2 and CuO-CeO2/Al2O3 samples on WGS activity and from this study, the author highlighted the hindered performance of the bulk samples [22,23,24]. According to the literature reviews, the RME method is one of the well-known catalyst preparation methods for the nanoparticle availability with uniform dispersion of metal on the support. Iqbal et al. (2023) performed to enhance the surface area stability of CeO2 via RME method and proved the availability of nanoparticles with uniform size and shape in the application of Reverse Water Gas Shift (RWGS) catalyst [25]. On the contrary, RME method can have a great potential to be practically applied in the synthesis of efficient WGS catalysts and to the best of our knowledge, there has been no report of LT-WGS reaction over Cu-CeO2 catalysts synthesized via the RME method.
In this research, we modified Cu-CeO2 catalysts with the help of an organic surfactant via Reverse Microemulsion (RME) method to obtain nanocomposite particles assembled with uniformly sized copper species highly dispersed with the ceria support to achieve adequate activity and particle stability. This uniform dispersion led to creation of higher oxygen vacancy and the improvement of pore characteristics of the catalyst such as the surface area, pore diameter and pore size distribution of material which are crucial factors for WGS catalysts [26]. After that, the as-synthesized Cu-CeO2 catalysts were applied to the reactor and tested for their catalytic efficiencies by using both made-up feed-gas composition without CO2 and the real pet coke gas composition from the industrial sector, which contains high concentrations of CO and CO2. To prove the potential utilization of RME method in WGS catalyst production by being competitive to the conventional methods, Cu-CeO2 catalyst with the optimum chemical composition achieved via RME method was prepared again through the Impregnation method and their catalytic activities were comparatively evaluated. Moreover, the stability of the Cu-CeO2 catalyst with optimal chemical composition synthesized via RME method was evaluated under the optimal reaction conditions with the real pet coke gas composition that contains high concentration of CO2. According to the analysis results, RME method was able to provide a more capable catalyst with its unique characteristics, identified by X-ray Diffraction (XRD), Braunauer–Emmett–Teller (BET), Temperature Programmed Reduction by Hydrogen (H2-TPR), X-ray Photoelectron Spectroscopy (XPS), High-Resolution Transmission Electron Microscopy (HR-TEM), and Scanning Electron Microscopy (SEM) analysis.

2. Results and Discussion

2.1. X-ray Diffraction (XRD) Analysis

The crystalline structure investigation and average crystallite size calculation of (n)Cu-CeO2 composites were conducted from XRD patterns. In accordance with the XRD diffraction peaks as monitored in Figure 1, it mainly verified the presence of typical diffraction peaks of pure CeO2 in all samples (JCPDS # 00-034-0394) while CuO (111) diffraction lines with only small intensities were identified for almost all composites (JCPDS # 48-1548) [27,28,29]. This observation proved the fact that Cu species are highly dispersed on the surface of the ceria support with the help of the surfactant. Additionally, these diffraction lines with small intensities also indicated the presence of small nanoparticles that are hard to be detected [30].
In consonance with literature reviews, the average crystallite size of the catalysts prepared by the RME method can contribute to the nanoparticle size distributions within the range of 2–50 nm [31,32,33]. To enhance this statement, the average crystallite size for each sample was calculated from XRD patterns by using Debye–Scherrer Equation. According to the calculation result as shown in Table 1, it can be seen that, even at the high Cu loading amount, the average crystallite size of catalysts could manage to maintain in the small nanocrystallite range of ~10 nm. Among samples prepared through RME technique, 20% Cu-CeO2 composition achieved the smallest crystallite size with 9.70 nm, which is preferable for the catalytic activity. In accordance with these XRD analysis results, it can be confirmed that the RME method can provide not only nanoparticles but also high dispersion of Cu on the surface of the CeO2 support.
Besides, in the comparative analysis of XRD patterns of 20% Cu-CeO2 and 20% Cu-CeO2(IMP) as depicted in Figure 1, CuO and CeO2 peaks were observed in these two samples at similar positions correspondingly. But the intensities of the peaks detected in the 20% Cu-CeO2(IMP) were found to be significantly higher than those determined in 20% Cu-CeO2. This showed the presence of larger crystallite particles in the sample prepared with IMP method, which was further confirmed through the calculation of its average crystallite size as described in Table 1. This comparison clarifies that the conventional Impregnation method leads to the formation of larger crystallites compared to the RME method which poses a drawback for the WGS activity. Moreover, these findings align with the correlation between catalysts’ crystallite size and activity proposed by the Yao et al. (2014), indicating that the synthesis conducted through the RME method offers advantageous prospects for catalysts [22].

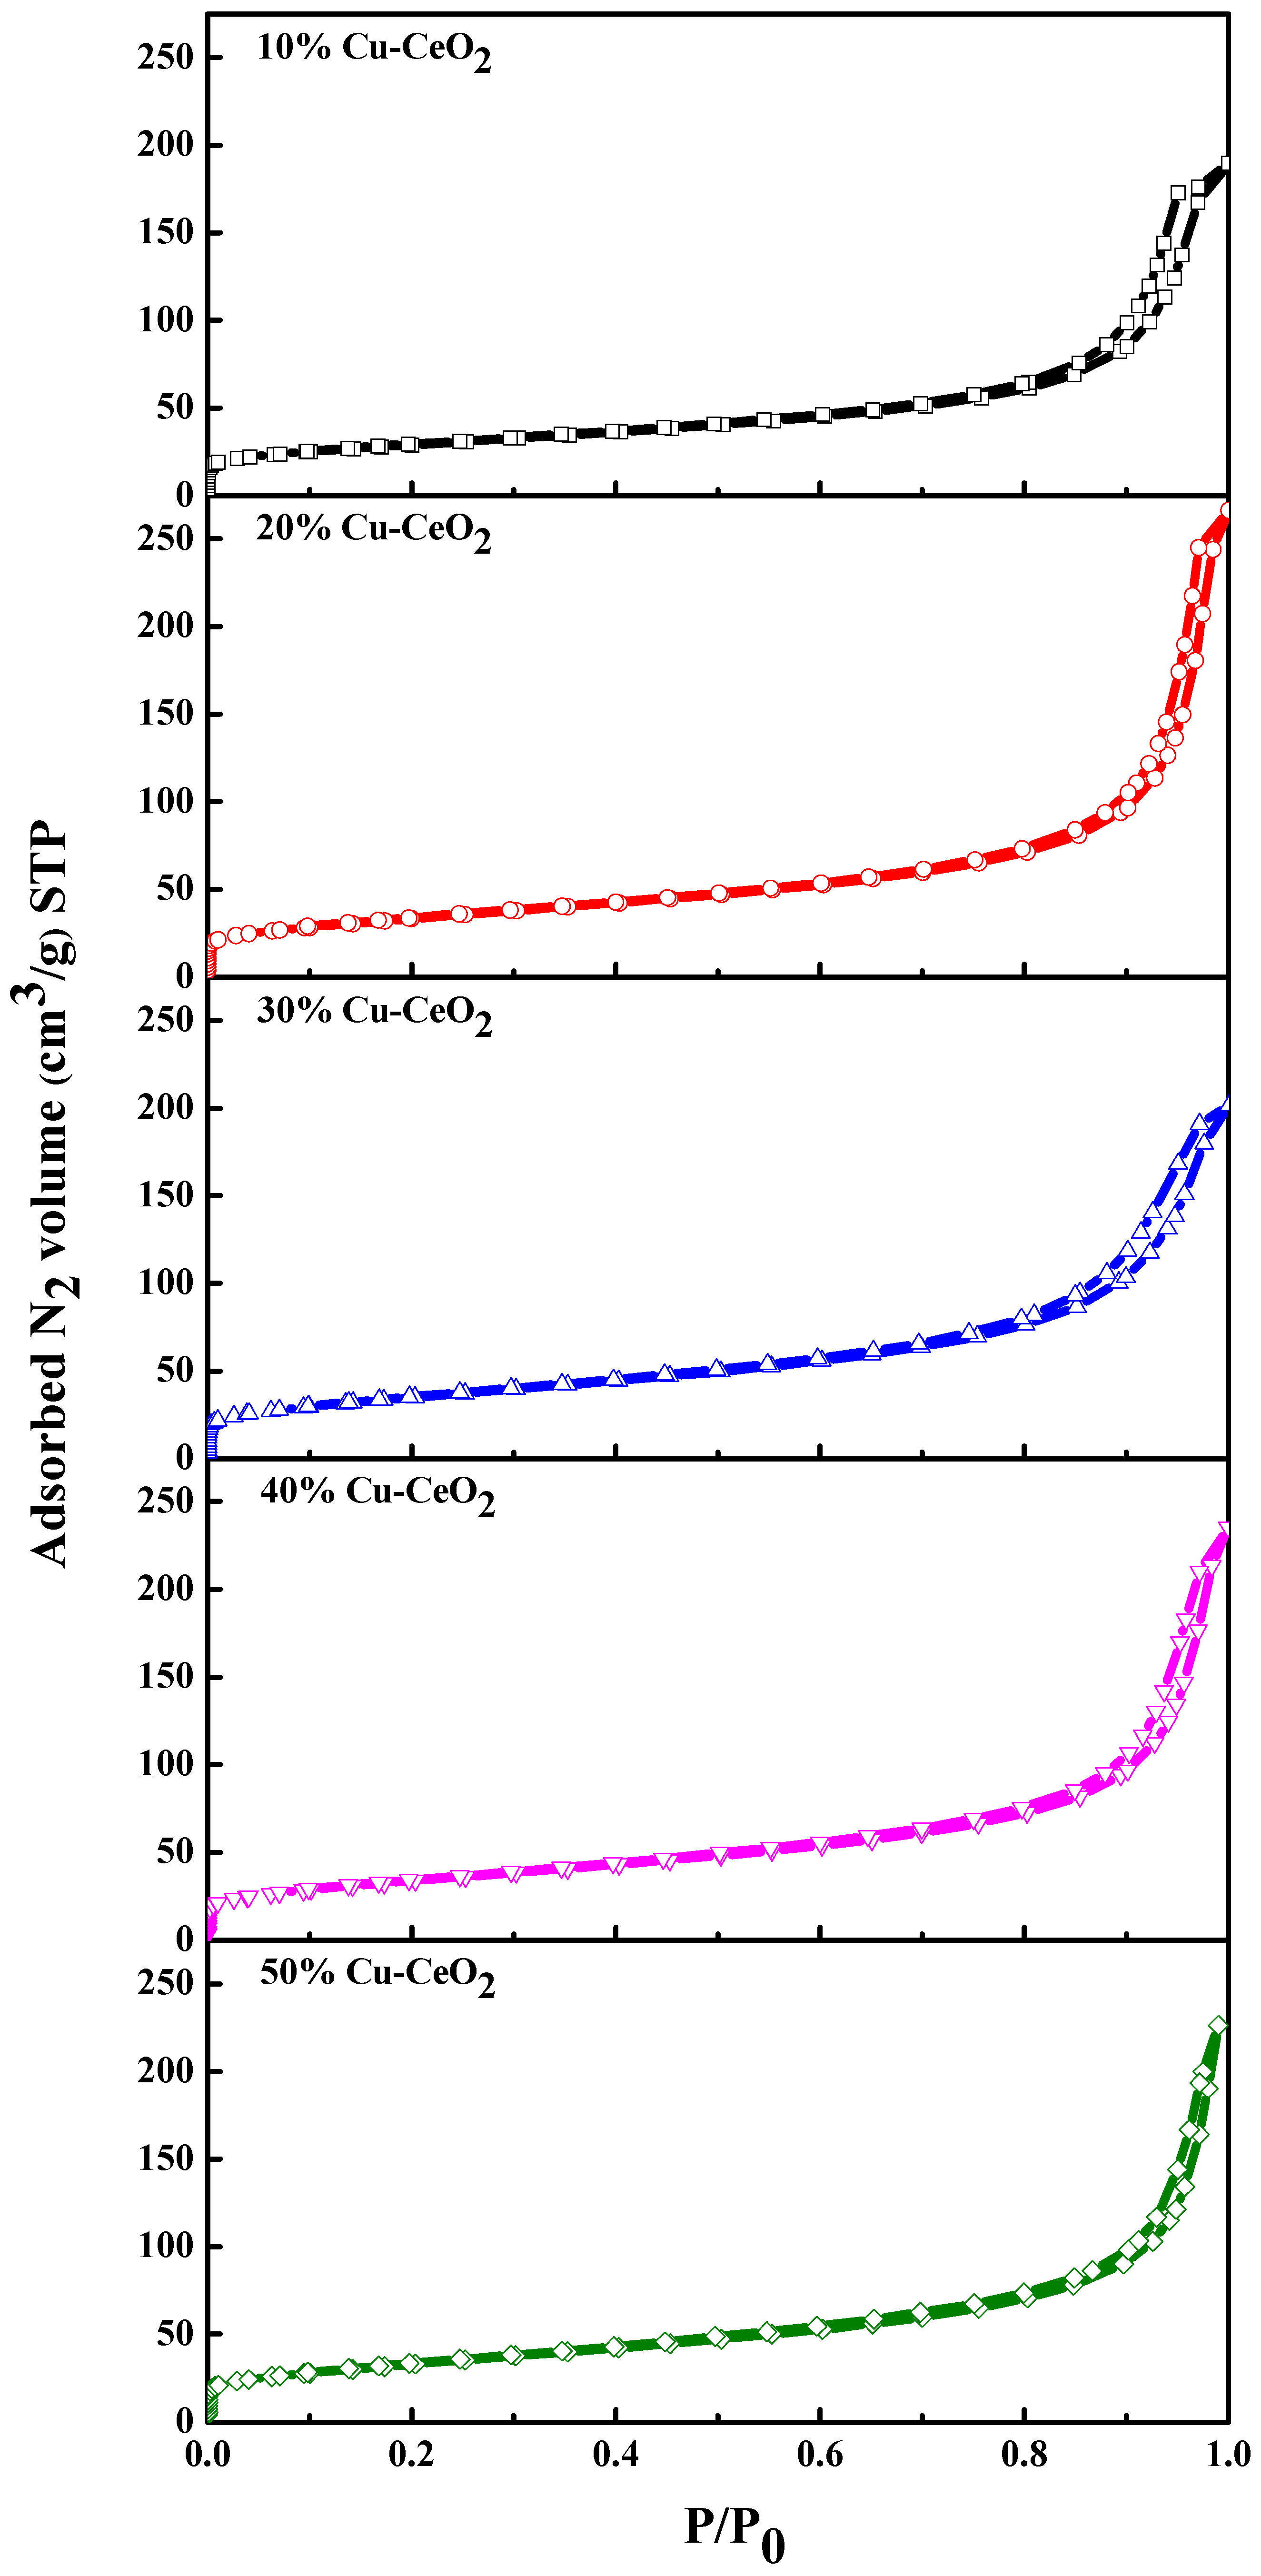
2.2. Pore Characteristics and Braunauer–Emmett–Teller (BET) Surface Area Analysis

The BET surface area and pore characteristics determined from N2 physisorption isotherms of (n)Cu-CeO2 composites were described in Table 2 and Figure 2. According to the BET surface area analysis, as the Cu loading amount increased above 20 wt% in (n)Cu-CeO2 samples, the resultant surface area was found to decrease as similarly reported in the previous research works [34,35,36]. Also, in the analysis of pore-diameter changes, a similar trend was witnessed as in the case of BET surface area changes.
Even though CeO2 generally possesses low surface areas [37], all (n)Cu-CeO2 samples synthesized via the RME method were able to achieve surface areas with at least ~100 m2 g−1. Among these samples, 20% Cu-CeO2 composite attained the highest BET surface area of 123.1 m2 g−1 together with the largest average pore diameter of 13.3 nm which can enhance the gas adsorption and diffusion. leading to a higher reaction rate and elevating the catalytic activity as attested by the literature [26]. In previous research work conducted by Bernard et al. (2021), the influence of the surface area on the heterogeneous catalysis was demonstrated. According to that demonstration, the author proved that a large surface area can enhance not only reaction rate but also activity of catalysts in heterogeneous catalysis [38]. Building upon this phenomenon, the RME method’s capability to synthesize composites with large surface area without the need hazardous chemical solvents or extreme synthesis parameters can offer significant benefits for practical applications.
Moreover, the pore morphology of each sample was estimated using the N2 physisorption isotherms’ features. According to the IUPAC classification, the appearances of the measured isotherms were identified as the type (IV) isotherms with the H1 hysteresis loop [39] as described in Figure 2. Conclusively, it can be projected from these identified isotherms that (n)Cu-CeO2 catalysts contain spherical-shaped mesoporous particles with well-defined cylindrical-like pore channels [37,40,41].

2.3. Temperature Programmed Reduction by Hydrogen (H2-TPR) Analysis

With the intention to investigate the reducible properties of CeO2 and Cu species and their interaction, H2-TPR analysis was conducted. Ordinarily, the reduction of pure CuO by H2 occurs at around 200~300 °C [42]. Then, the reduction of pure CeO2 establishes at temperatures much higher than 400 °C with two reduction stages; one is at about 430 °C for the surface CeO2 reduction and the other one is at about 900 °C for bulk CeO2 reduction [30,43].
As shown in Figure 3, the H2-TPR profiles of (n)Cu-CeO2 sample composites were detected at distinct lower reduction temperatures below 200 °C. This is due to the fact that the reducibility of CeO2 and Cu species was greatly enhanced with the strong synergistic redox interaction between Cu and CeO2. For each sample, two similar reduction peaks were deconvoluted as shown in Figure 3. Firstly, the reduction peak with small intensity at around 110–140 °C could be assigned for the reduction of finely dispersed CuO species to Cu2O on CeO2 support. An additional reduction temperature with a higher intensity at around 140–170 °C could be designated for the reduction of Cu2O species to Cu0 because of the interaction of Cu–Ox–Ce [44].
As increasing Cu loading amounts in composites, the reduction temperatures of each composite slightly shifted towards the higher temperatures. However, the H2-TPR profile of 20% Cu-CeO2 demonstrated significantly lower reduction temperatures of 110.2 and 143.5 °C when compared to those of other composites samples. From this distinctness, it can be established that this outstanding property was achieved not only because of the stronger interaction between Cu and CeO2 than in other composites but also as a consequence of the high dispersion of Cu on the surface of the CeO2 support [45].
When the H2-TPR profiles of 20% Cu-CeO2 and 20% Cu-CeO2(IMP) were comparatively studied in terms of interaction between Cu and CeO2 as presented in Table 3 and Figure 3, it is noticeable that the reduction peaks for the 20% Cu-CeO2 sample prepared by the conventional Impregnation method occurred at distinctly higher temperatures than those of the 20% Cu-CeO2 sample prepared through RME method. This observation highlights the superior reducibility of CeO2 and Cu in the samples synthesized through RME technique, probably due to a stronger interaction in these samples. Furthermore, in previous studies, Di Sarli et al. (2021) reported that stronger interaction between Cu and CeO2 can yield significant modifications in the redox properties of the Cu-promoted catalysts and lead to the enhance activity [46]. Additionally, the authors also noted the strong Cu-CeO2 interaction promotes the creation of oxygen vacancies which is also a crucial parameter for WGS catalysts. In line with these findings and considering the results obtained from H2-TPR analysis, it can be inferred that the RME method has the potential to enhance the interaction between Cu-CeO2 composites.

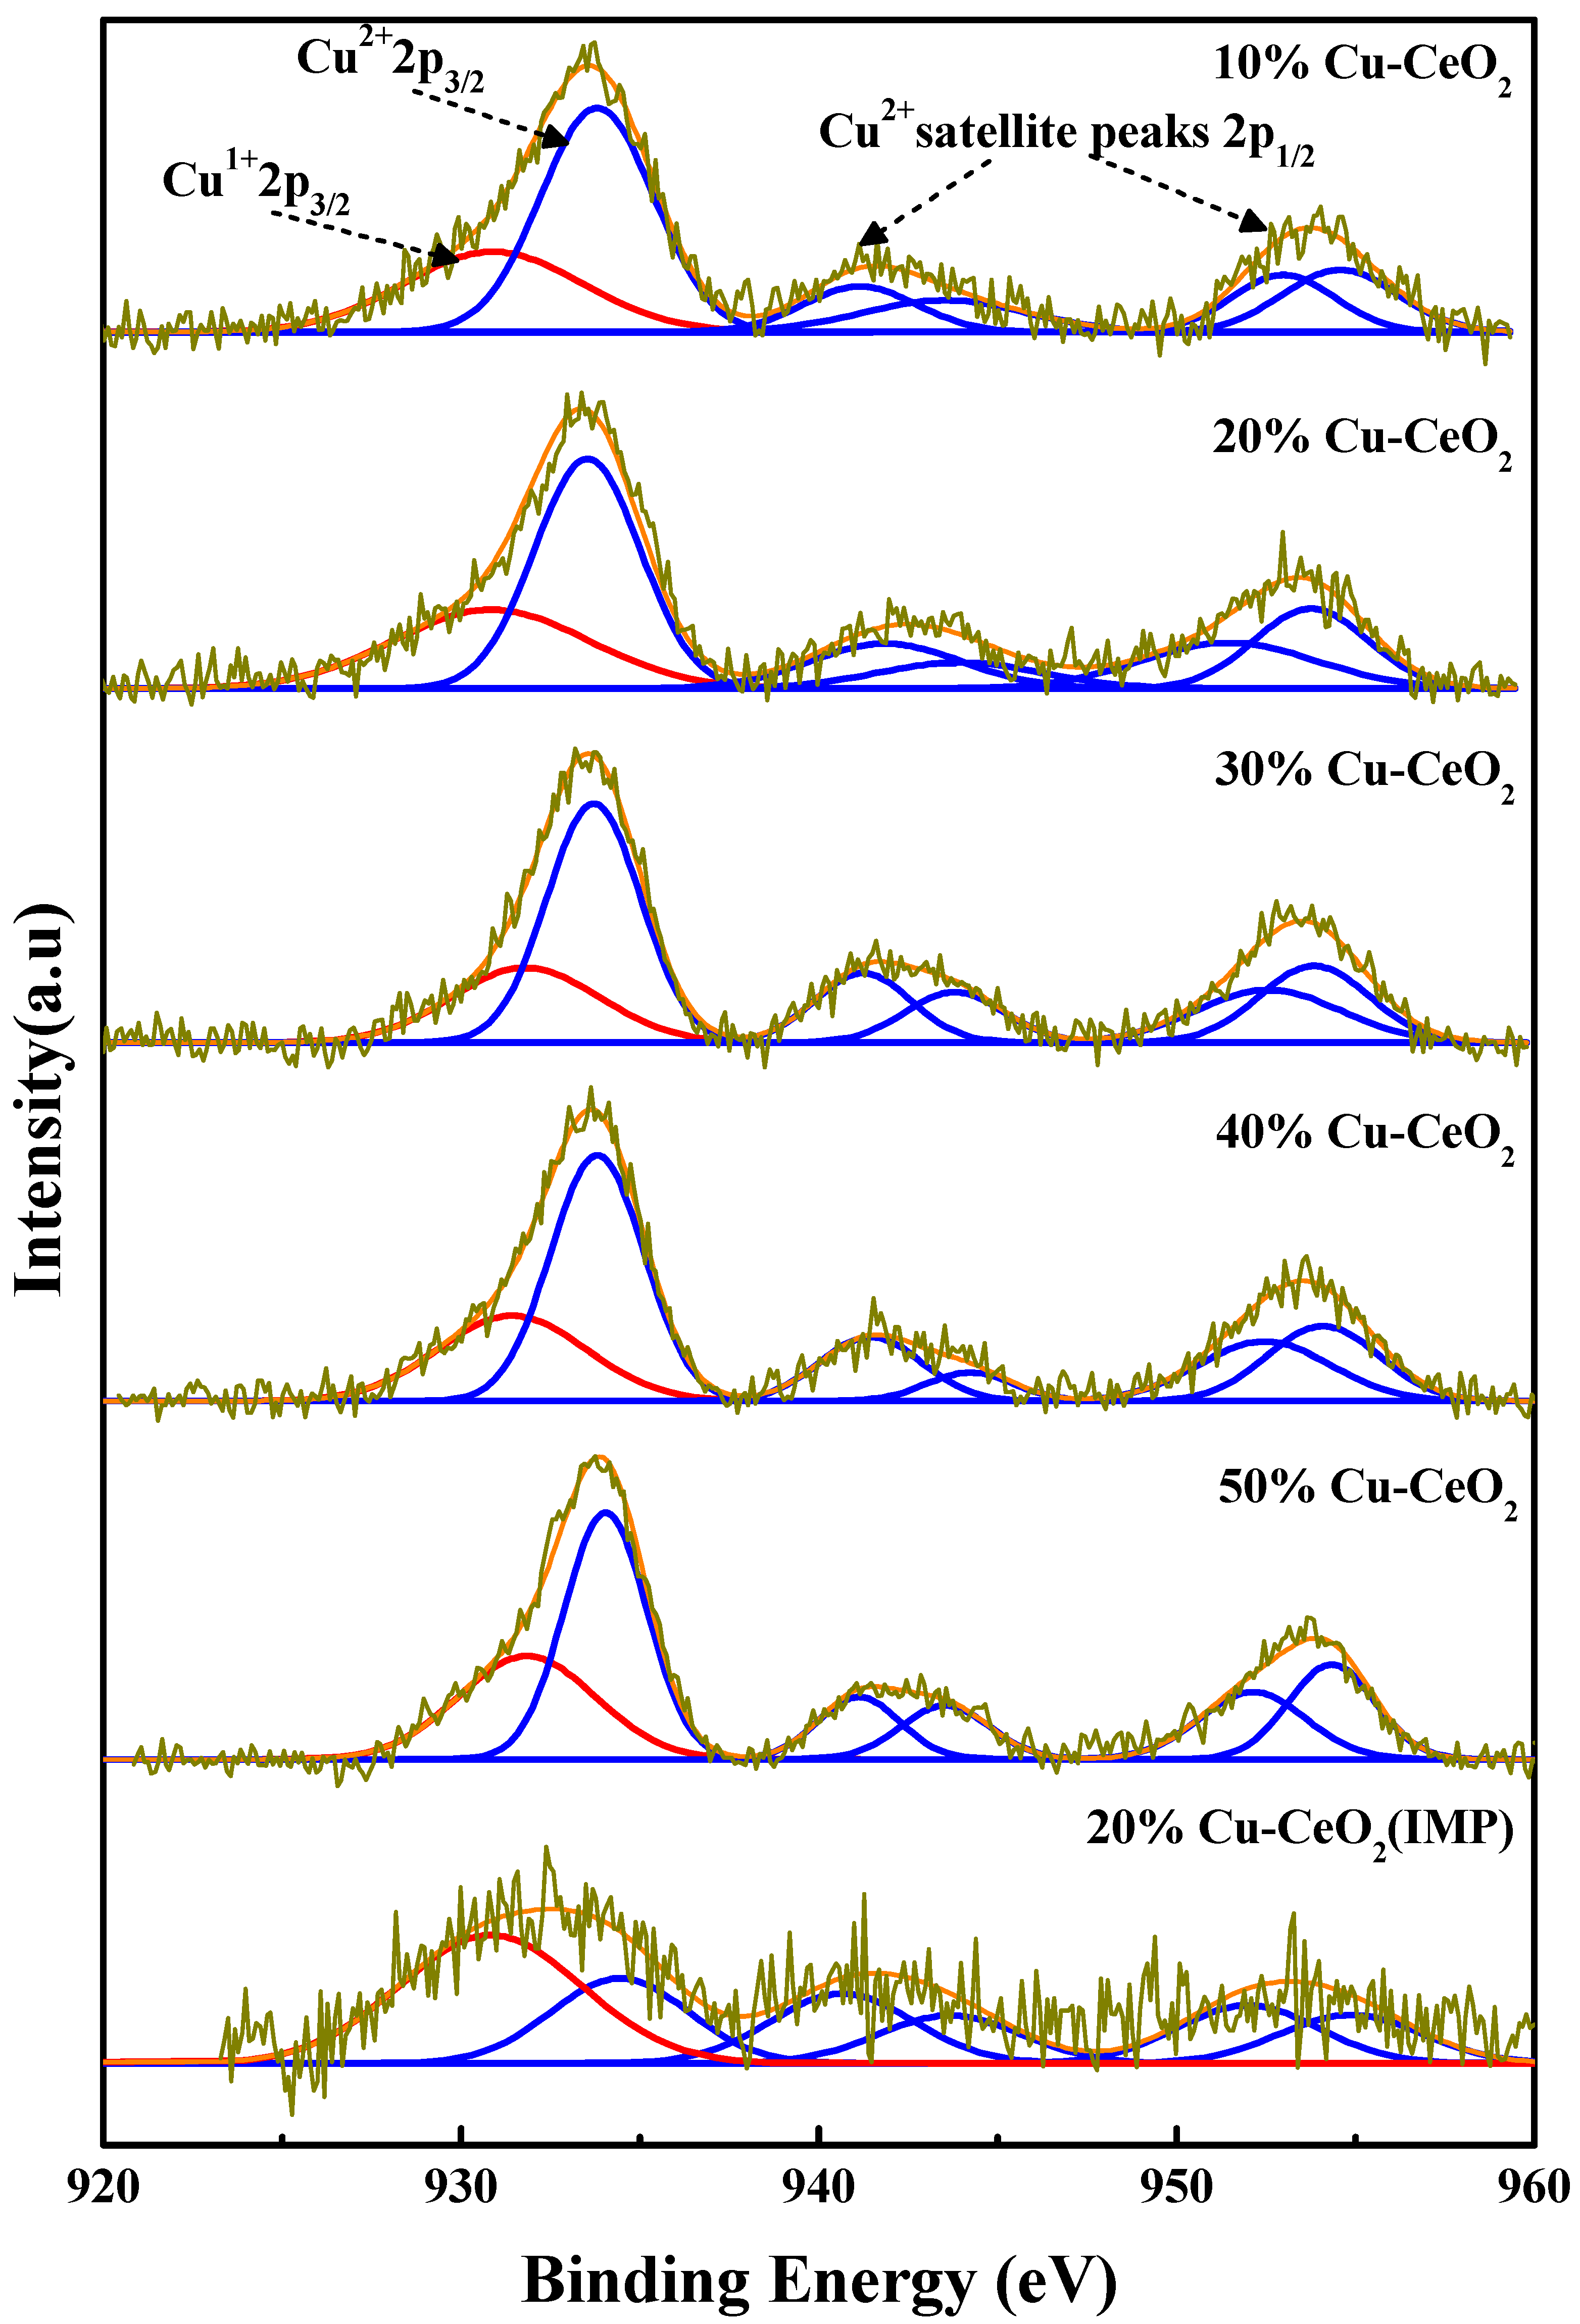
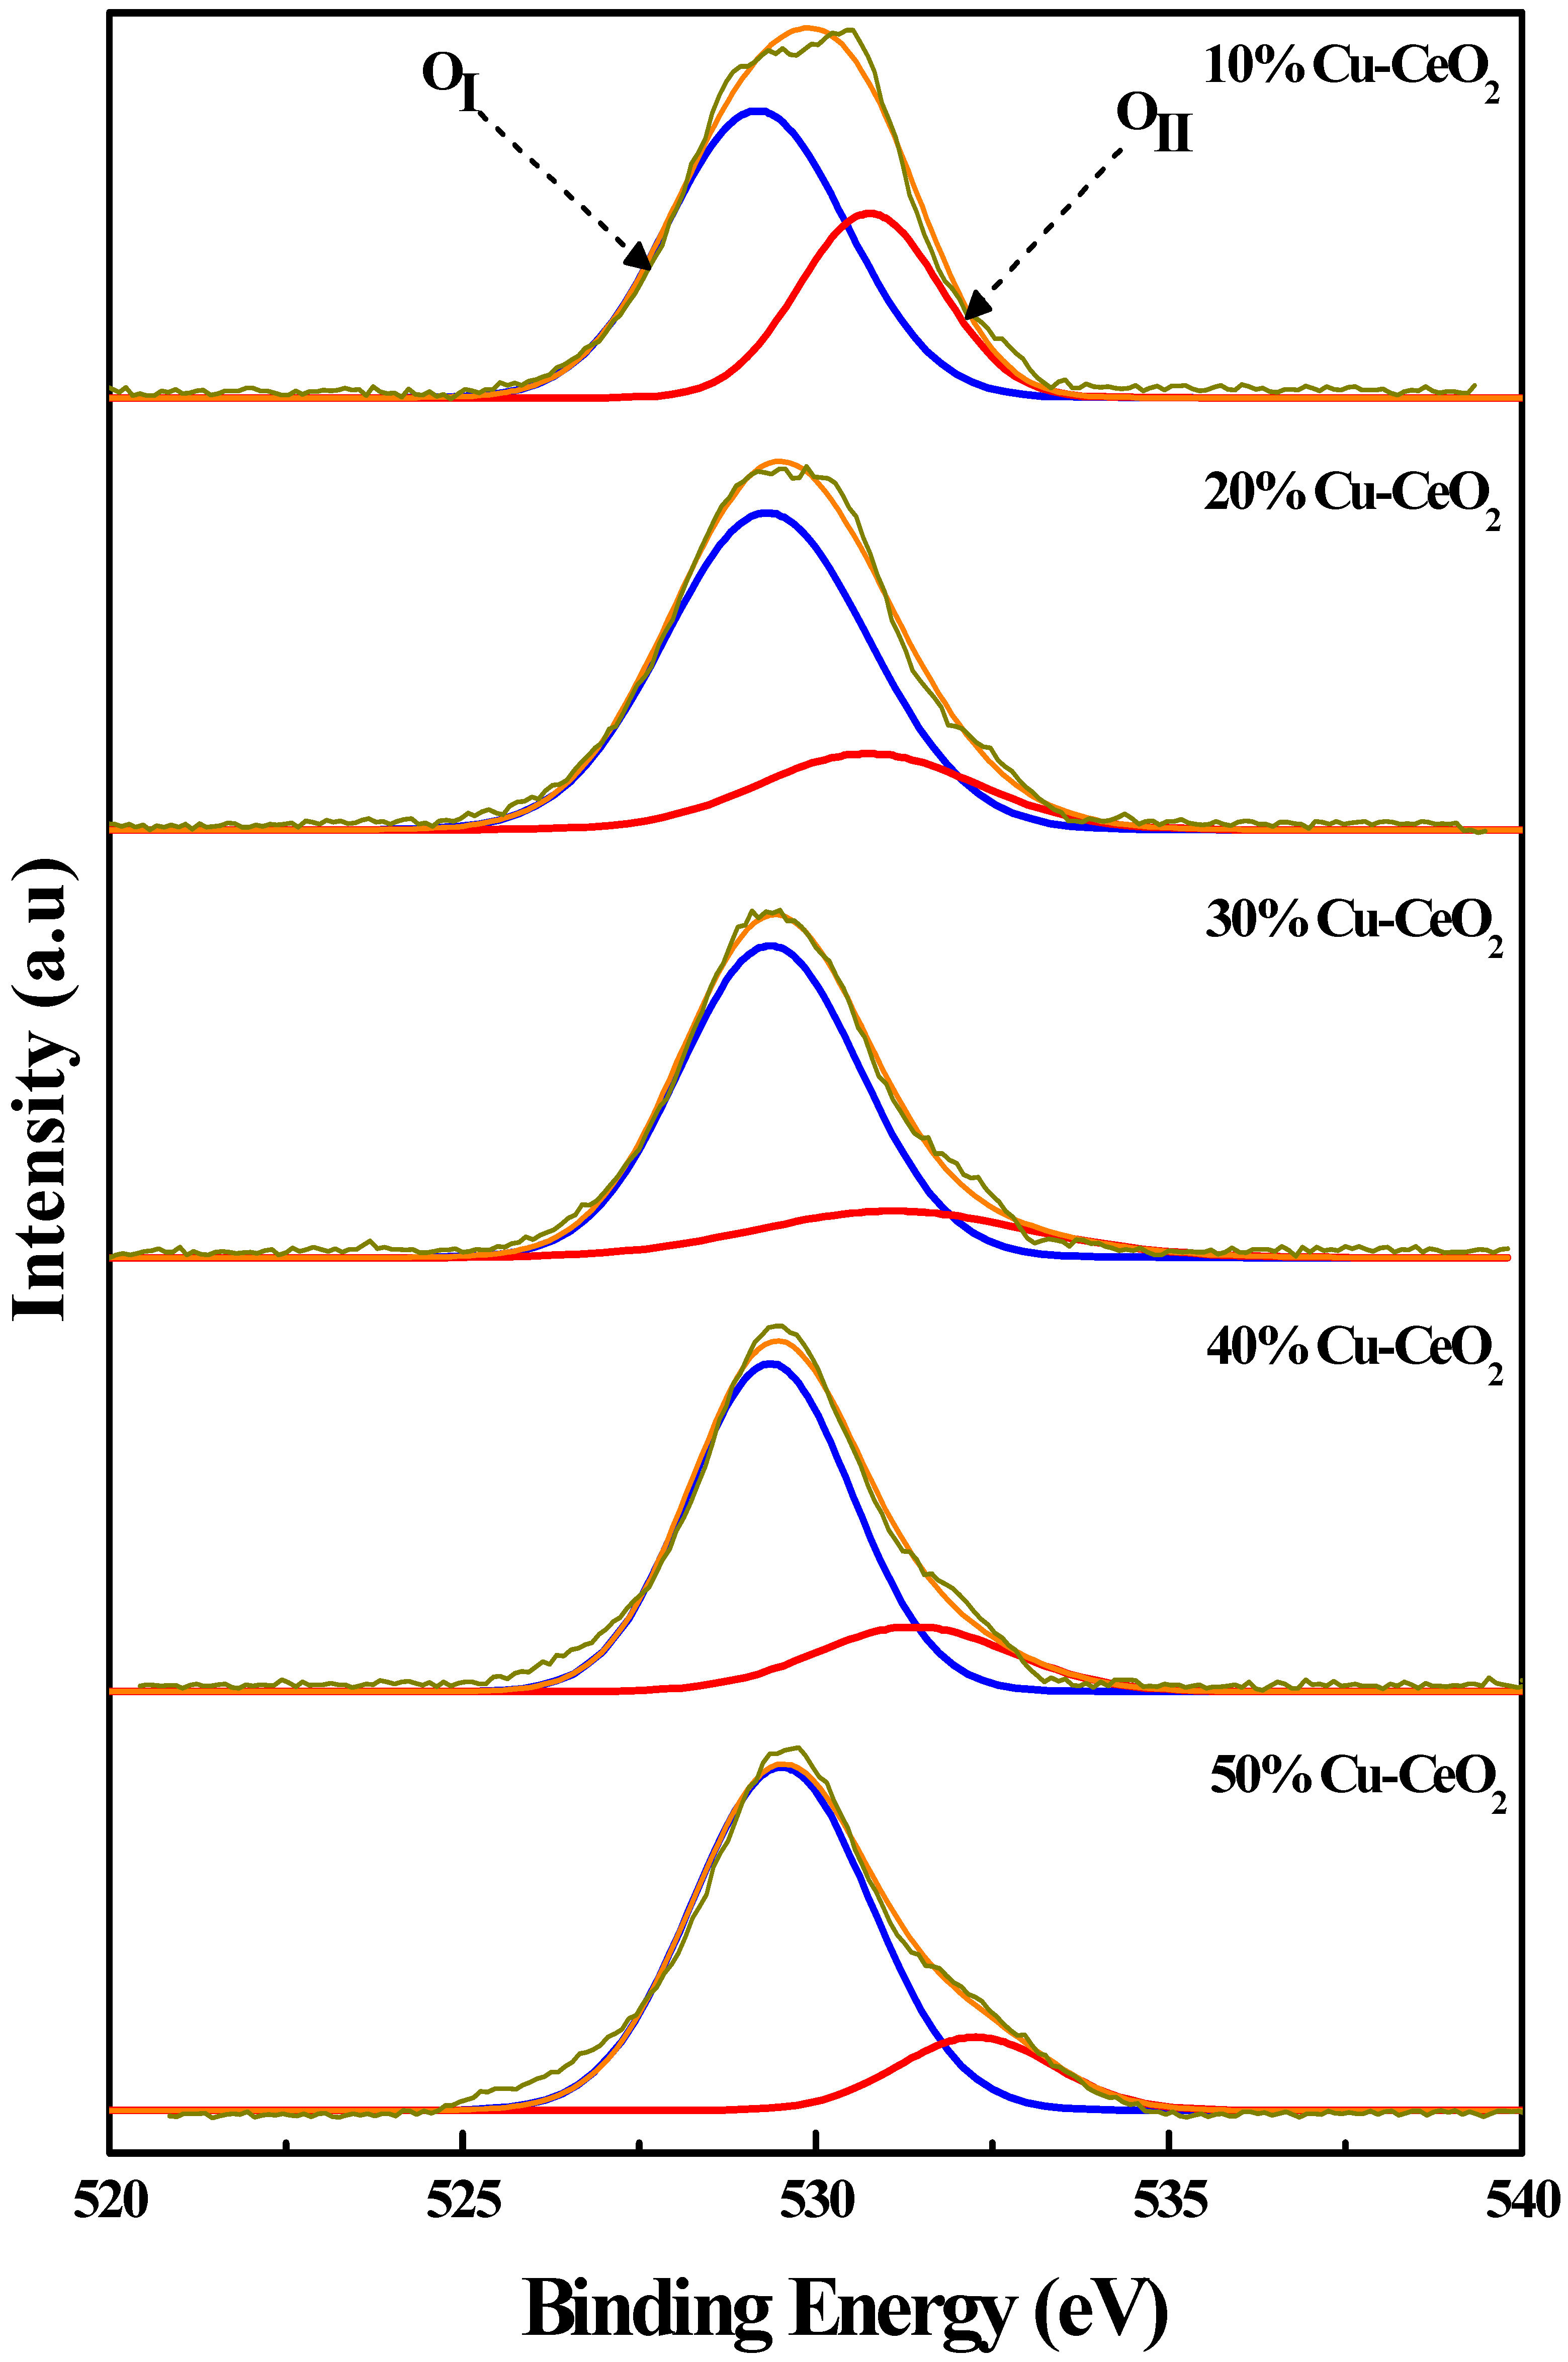
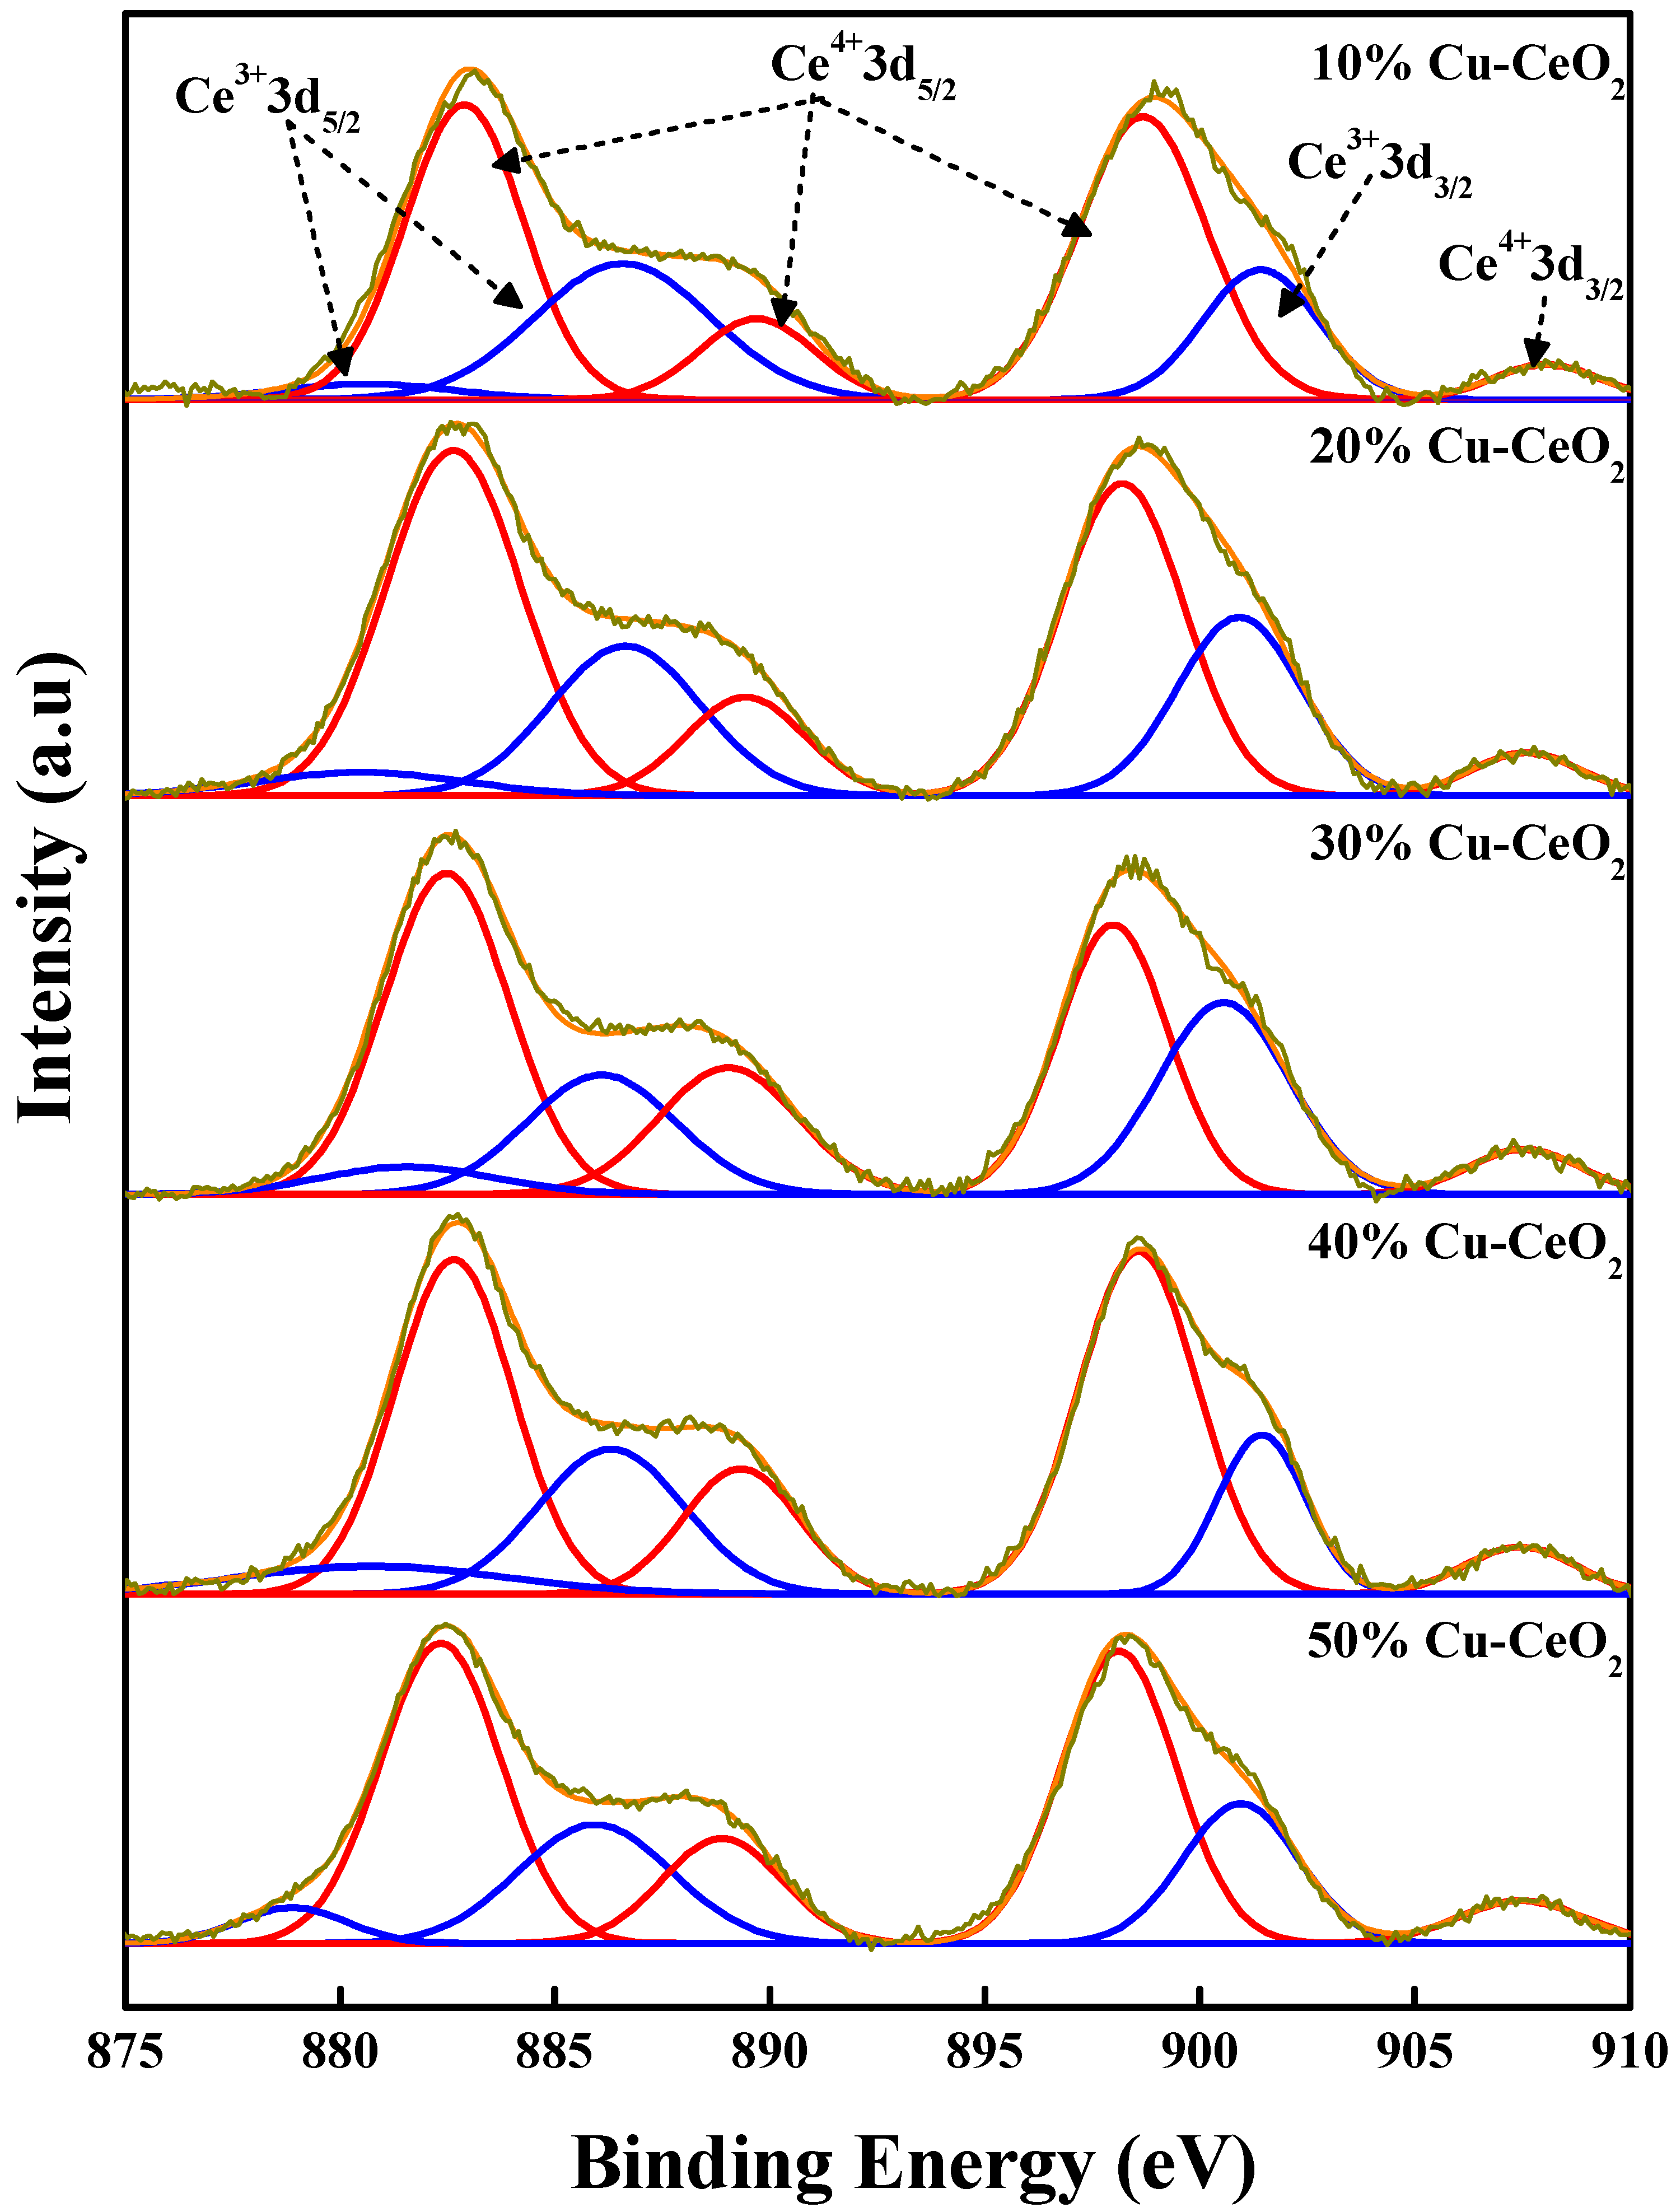
2.4. X-ray Photoelectron Spectroscopy (XPS) Analysis

Each elemental state together with its respective percentage concentration of (n)Cu-CeO2 composites was examined through deconvoluted peak positions and areas of XPS analysis profiles. As mentioned in Figure 4, the Cu 2p XPS profiles of (n)Cu-CeO2 composites indicated the presence of two different copper species corresponding to Cu1+ ion detected at Cu 2p3/2 binding energy at around 932.0 eV and Cu2+ ion at around 934.0 eV together with the satellite peaks [47,48]. As increasing Cu loading amounts, the binding energies were observed to slightly shift toward higher regions.
According to the calculation of percentage concentration of Cu species from their corresponding deconvoluted peak areas as described in Table 4, higher proportion of Cu2+ species was evidenced as increasing Cu loading amounts. However, interestingly, in the case of 20% Cu-CeO2, the existing Cu2+ species was more highly reduced to Cu1+ ions when compared to other samples, which was evidenced through an increase in its Cu1+ ion percent concentration. From this significant monitoring, it could be concluded that because of the high dispersion of Cu on CeO2 and well interaction between Cu species and oxygen vacancies of CeO2, more Cu2+ species are readily reduced to the Cu1+ states by CeO2 [21,49,50].
In the study of the effect of the conventional IMP method on Cu 2p XPS profile of 20% Cu-CeO2 sample by being compared to RME method, as depicted in Figure 4, both Cu1+ and Cu2+ species were identified in the sample of IMP method as similar to the sample synthesized via RME method. However, the presence of the less percent concentration of Cu1+ species in the 20% Cu-CeO2(IMP) sample (17.43%) than in the case of the RME sample (24.77%). This is consistent with the previous literature review which suggests that the presence of less Cu1+ species indicates the inferior reducibility of CeO2 and Cu species, resulting from the poor synergetic interaction between them [30]. This comparative analysis of Cu 2p XPS spectrum reveals a distinct advantage of the RME method which is possessing the capability to induce stronger interactions within Cu-CeO2 catalysts, surpassing effectiveness of the conventional Impregnation method. This heightened interaction potential holds significant promise for enhancing the catalytic activity and corroborates findings reported by Di Sarli et al. (2021) [46]. Furthermore, it is noteworthy that this observation aligns consistently with the outcomes derived from H2-TPR analysis as we discussed in the previous section.
By the deconvolution of O 1s XPS spectrum of each (n)Cu-CeO2 sample as described in Figure 5, two major peaks were identified. The first peak with higher intensity at around 529.2 eV could be assigned to the presence of lattice oxygen. Besides, the remaining peak with the low intensity at around 531.3 eV could be designated as the defect oxygen species [51,52,53]. The percentage concentrations of these determined oxygen species were calculated from the respective deconvoluted peak areas, reported in Table 4. Among the examined samples, the notable prevalence of defect oxygen species could be identified specifically in 20% Cu-CeO2 catalyst. In accordance with the literature, these defect oxygen species were concluded to be related to oxygen vacancy formation which subsequently contribute to the enhancement of catalytic activity. Moreover, the existence of these substantial oxygen defects can be ascribed to the stronger interaction Cu and CeO2. These findings are also agreeable with the studies conducted by Di Sarli et al. (2021) [46].On the other hand, the formation of defect oxygen species is in turn influenced by the quantity of Ce3+ surface defects [54]. Therefore, the participation of Ce3+ ion in the (n)Cu-CeO2 composition will be further confirmed through Ce 3d XPS profile.
The Ce 3d XPS spectra of (n)Cu-CeO2 composites were deconvoluted into two major species Ce3+ and Ce4+ as shown in Figure 6. The observed peaks at around 880.0, 887.8, and 902.0 eV could be assigned for the Ce3+ species [55,56,57] and the other deconvoluted peaks are characterized for the Ce4+ species [55]. The percentages of the identified Ce species were calculated from deconvoluted peak areas as described in Table 4. Among (n)Cu-CeO2 samples, Ce3+ species are found to be dominant in the 20% Cu-CeO2 catalyst with its higher percentage concentration at around 28.51%. Having a superior proportion of Ce3+ species claimed that more Ce3+ species could strongly interact with the Cu+ species through oxygen vacancies in the character of Ce3+–Ov–Cu+ and could enhance the activity of the catalyst [21,30,58]. Through the comparison of XPS spectra among the examined samples, it is evident that the RME method possesses the capability to induce strong interactions within Cu-CeO2 based catalysts consequently resulting in enhanced catalytic activity compared to the conventional Impregnation method. Based on these insights, it can be inferred that the utilization of the RME method holds promising implications for practical applications.

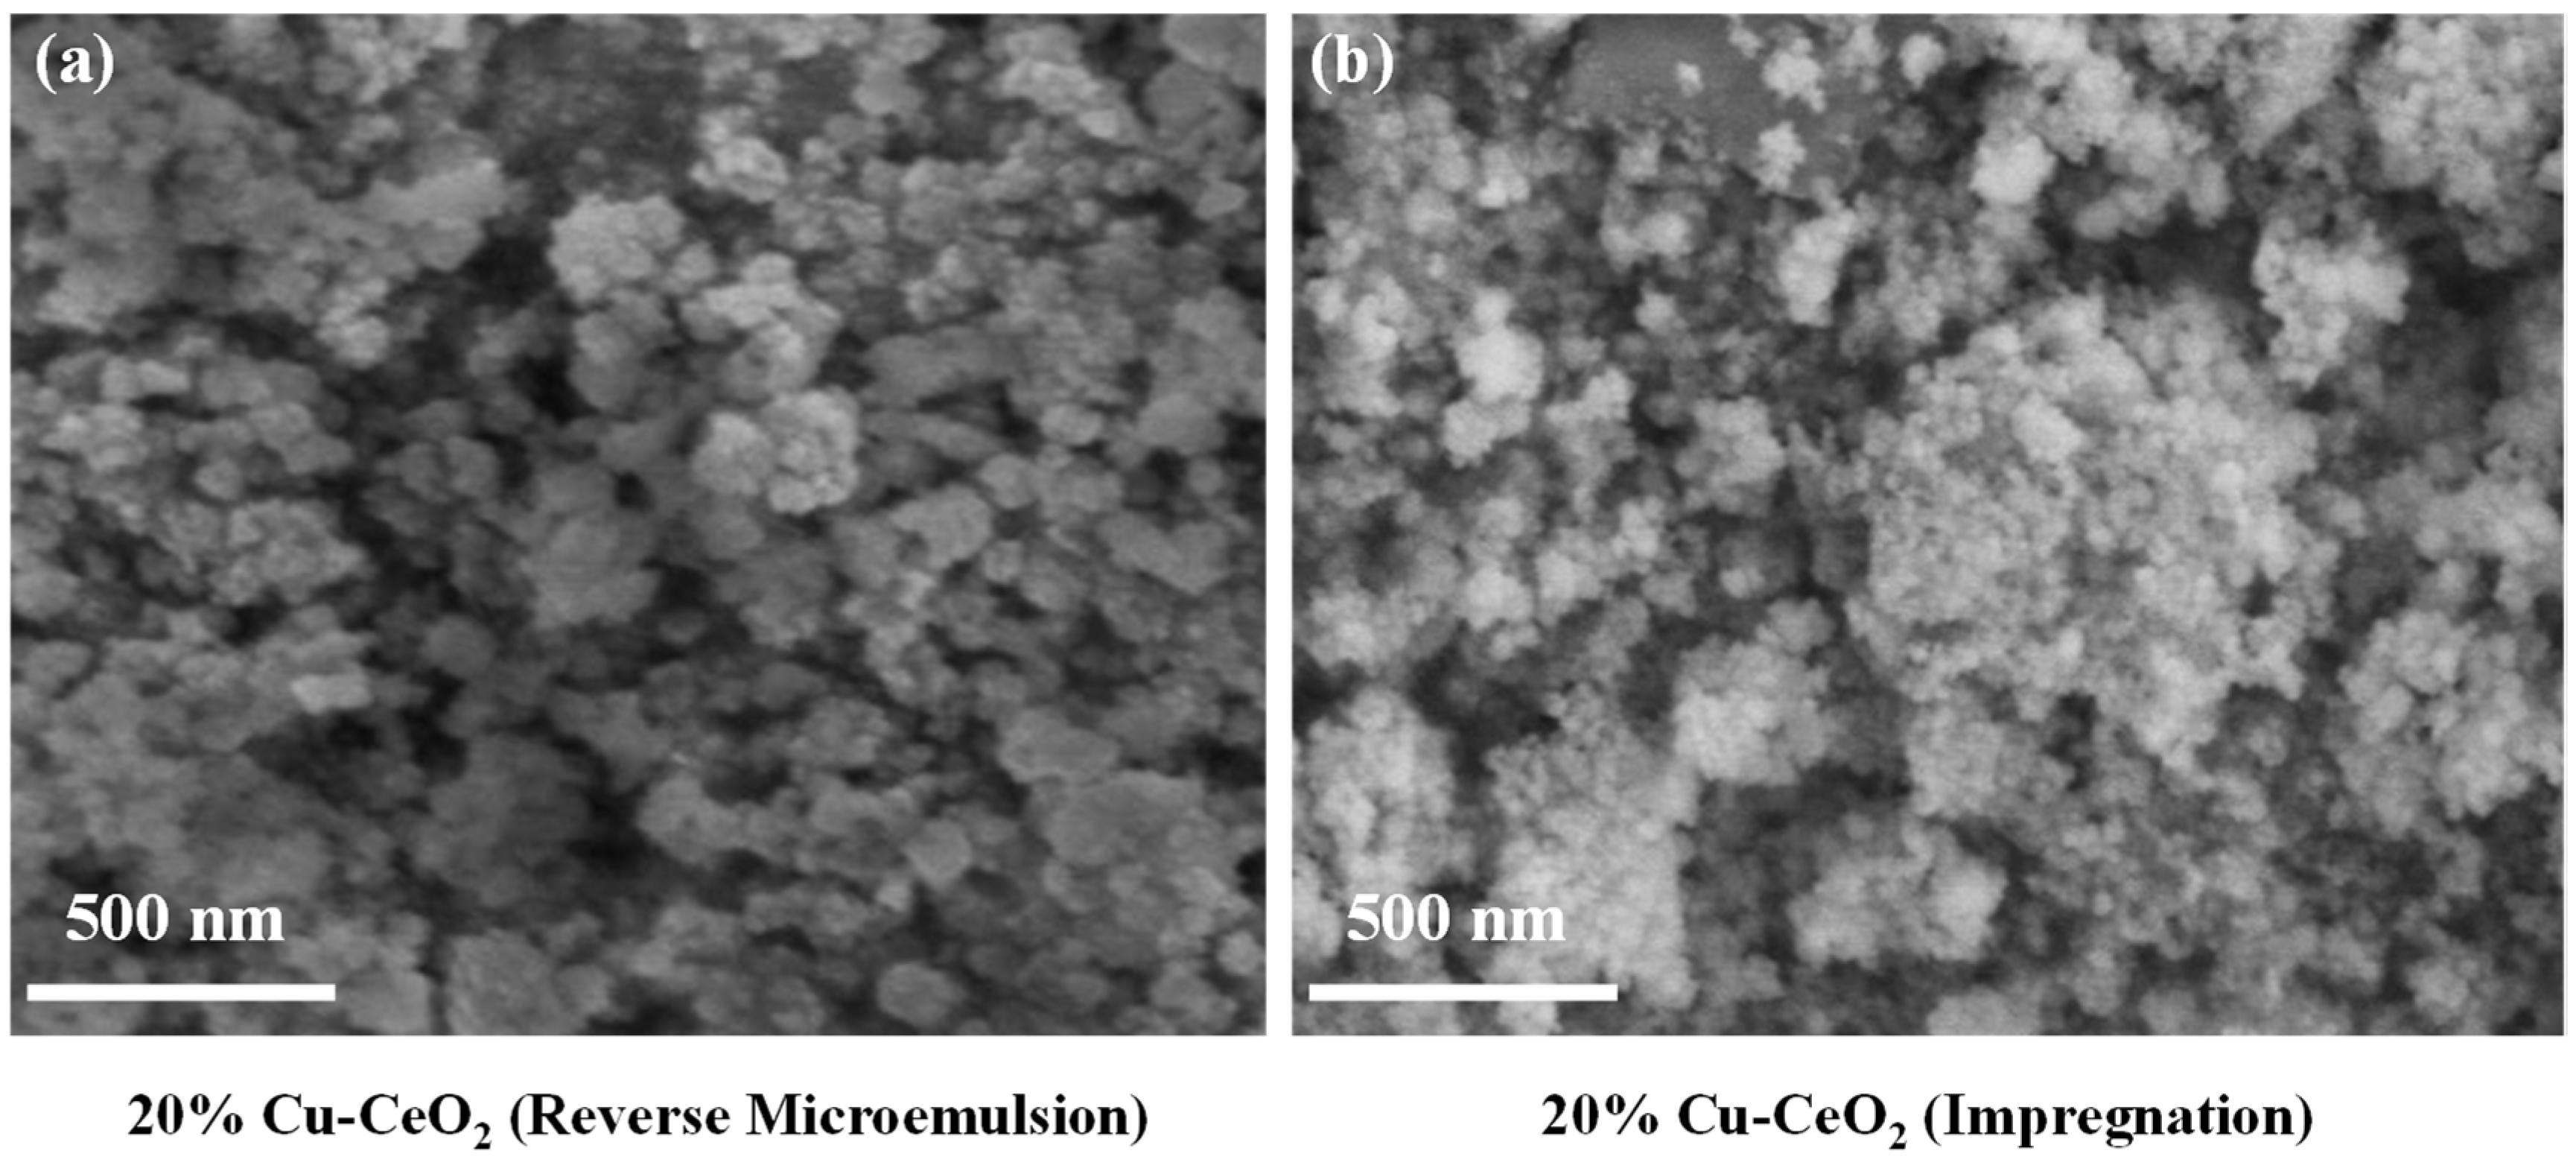
2.5. Scanning Electron Microscope (SEM) Analysis

SEM image of 20% Cu-CeO2 catalyst prepared via RME method was displayed in Figure 7a while Figure 7b demonstrated the SEM image of 20% Cu-CeO2 composite prepared via Impregnation method. Regarding the shape of the catalyst particles, 20% Cu-CeO2 sample synthesized via RME method exhibited specific spherical structure with the well-defined small droplet as reported in the previous research work for surface area stabilization of CeO2 via RME method for RWGS catalyst [25]. Additionally, the uniform size distribution of Cu-CeO2 particles with their individual separate micelles droplets could be visible through SEM micrograph. The detailed structural information of as-synthesized 20% Cu-CeO2 via RME method will be discussed in the following HR-TEM section. On the other hand, in the case of 20%Cu-CeO2(IMP), Cu-CeO2 particles aggregated with each other to form agglomerated clusters, which is a major drawback for most of catalytic activity.

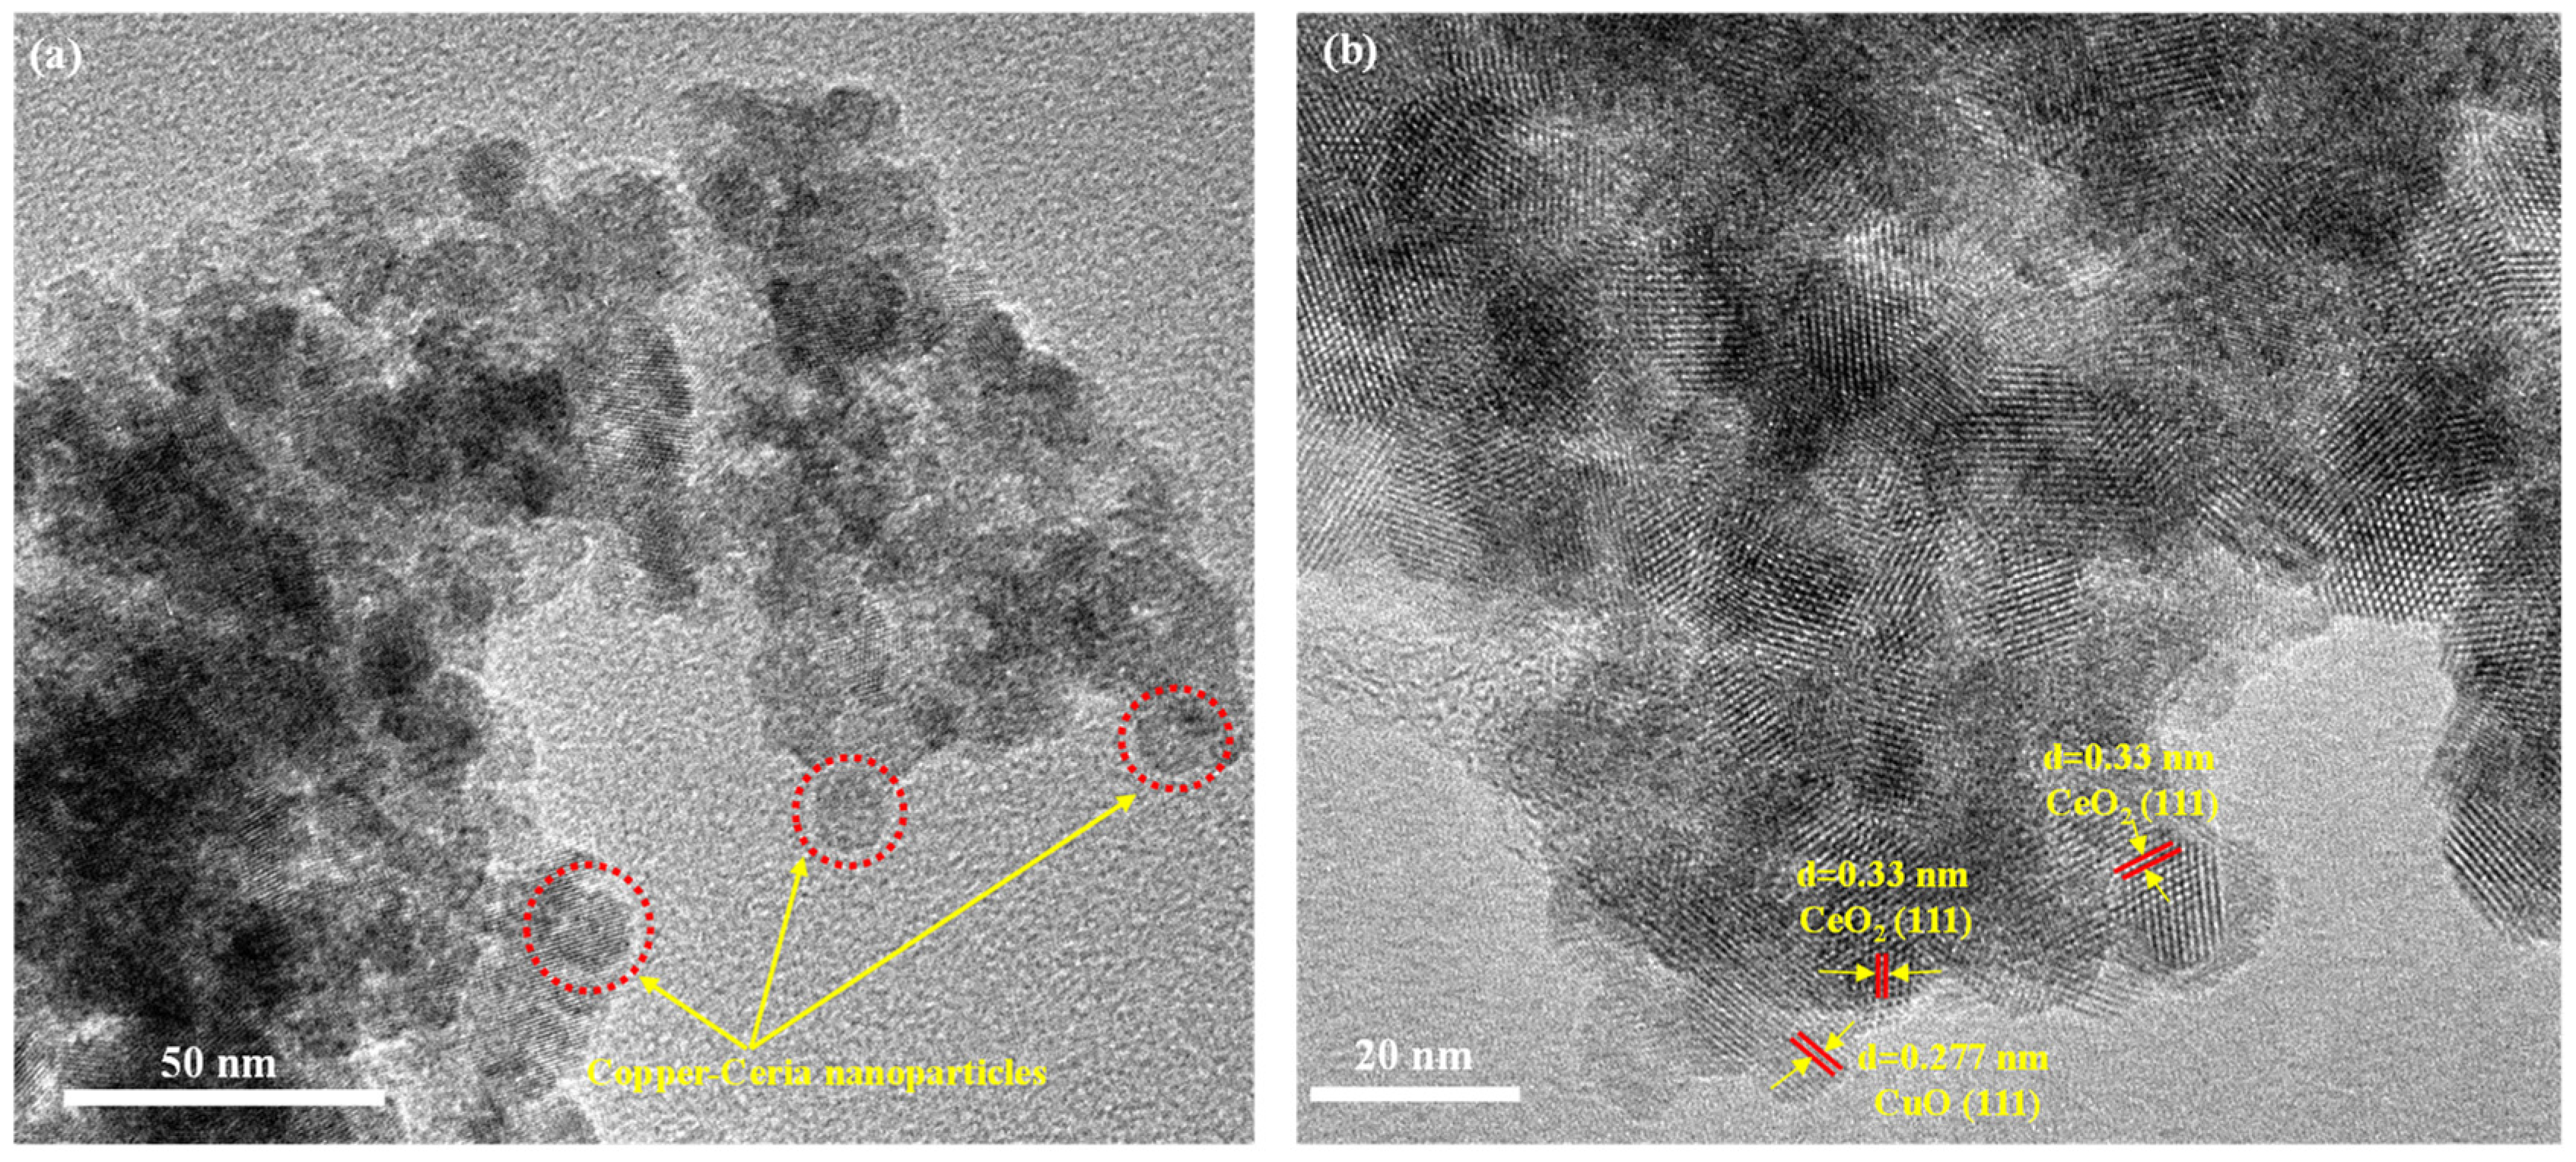
2.6. High-Resolution Transmission Electron Microscopy (HR-TEM) Analysis

The structural evidence of the as-synthesized 20% Cu-CeO2 via RME sample was thoroughly investigated by using HR-TEM Analysis. The obtained TEM image, as illustrated in Figure 8a, clearly identifies the presence of Cu-CeO2 nanoparticles exhibiting relatively uniform shape and size distribution which corroborates the detected view of the scanning electron microscopy (SEM) analysis. Furthermore, it also can be clearly seen that the Cu-CeO2 composite particles occupy diminutive crystallite sizes within nanoscale. This finding also aligns coherently with the outcomes acquired through the XRD crystallite-size analysis. Additionally, the lattice structure of the CuO active site adhering to CeO2 surface was obtained by the determination of the distinct interplanar lattice spacings of CuO (111) and CeO2 (111), at the d values of 0.27 nm and 0.33 nm respectively, through HRTEM image (Figure 8b) by using Gatan Digital Micrograph Software. This finding provides evidence of the interaction between Cu and CeO2, which is consistent with the findings reported by Oh et al. (2017) [59].

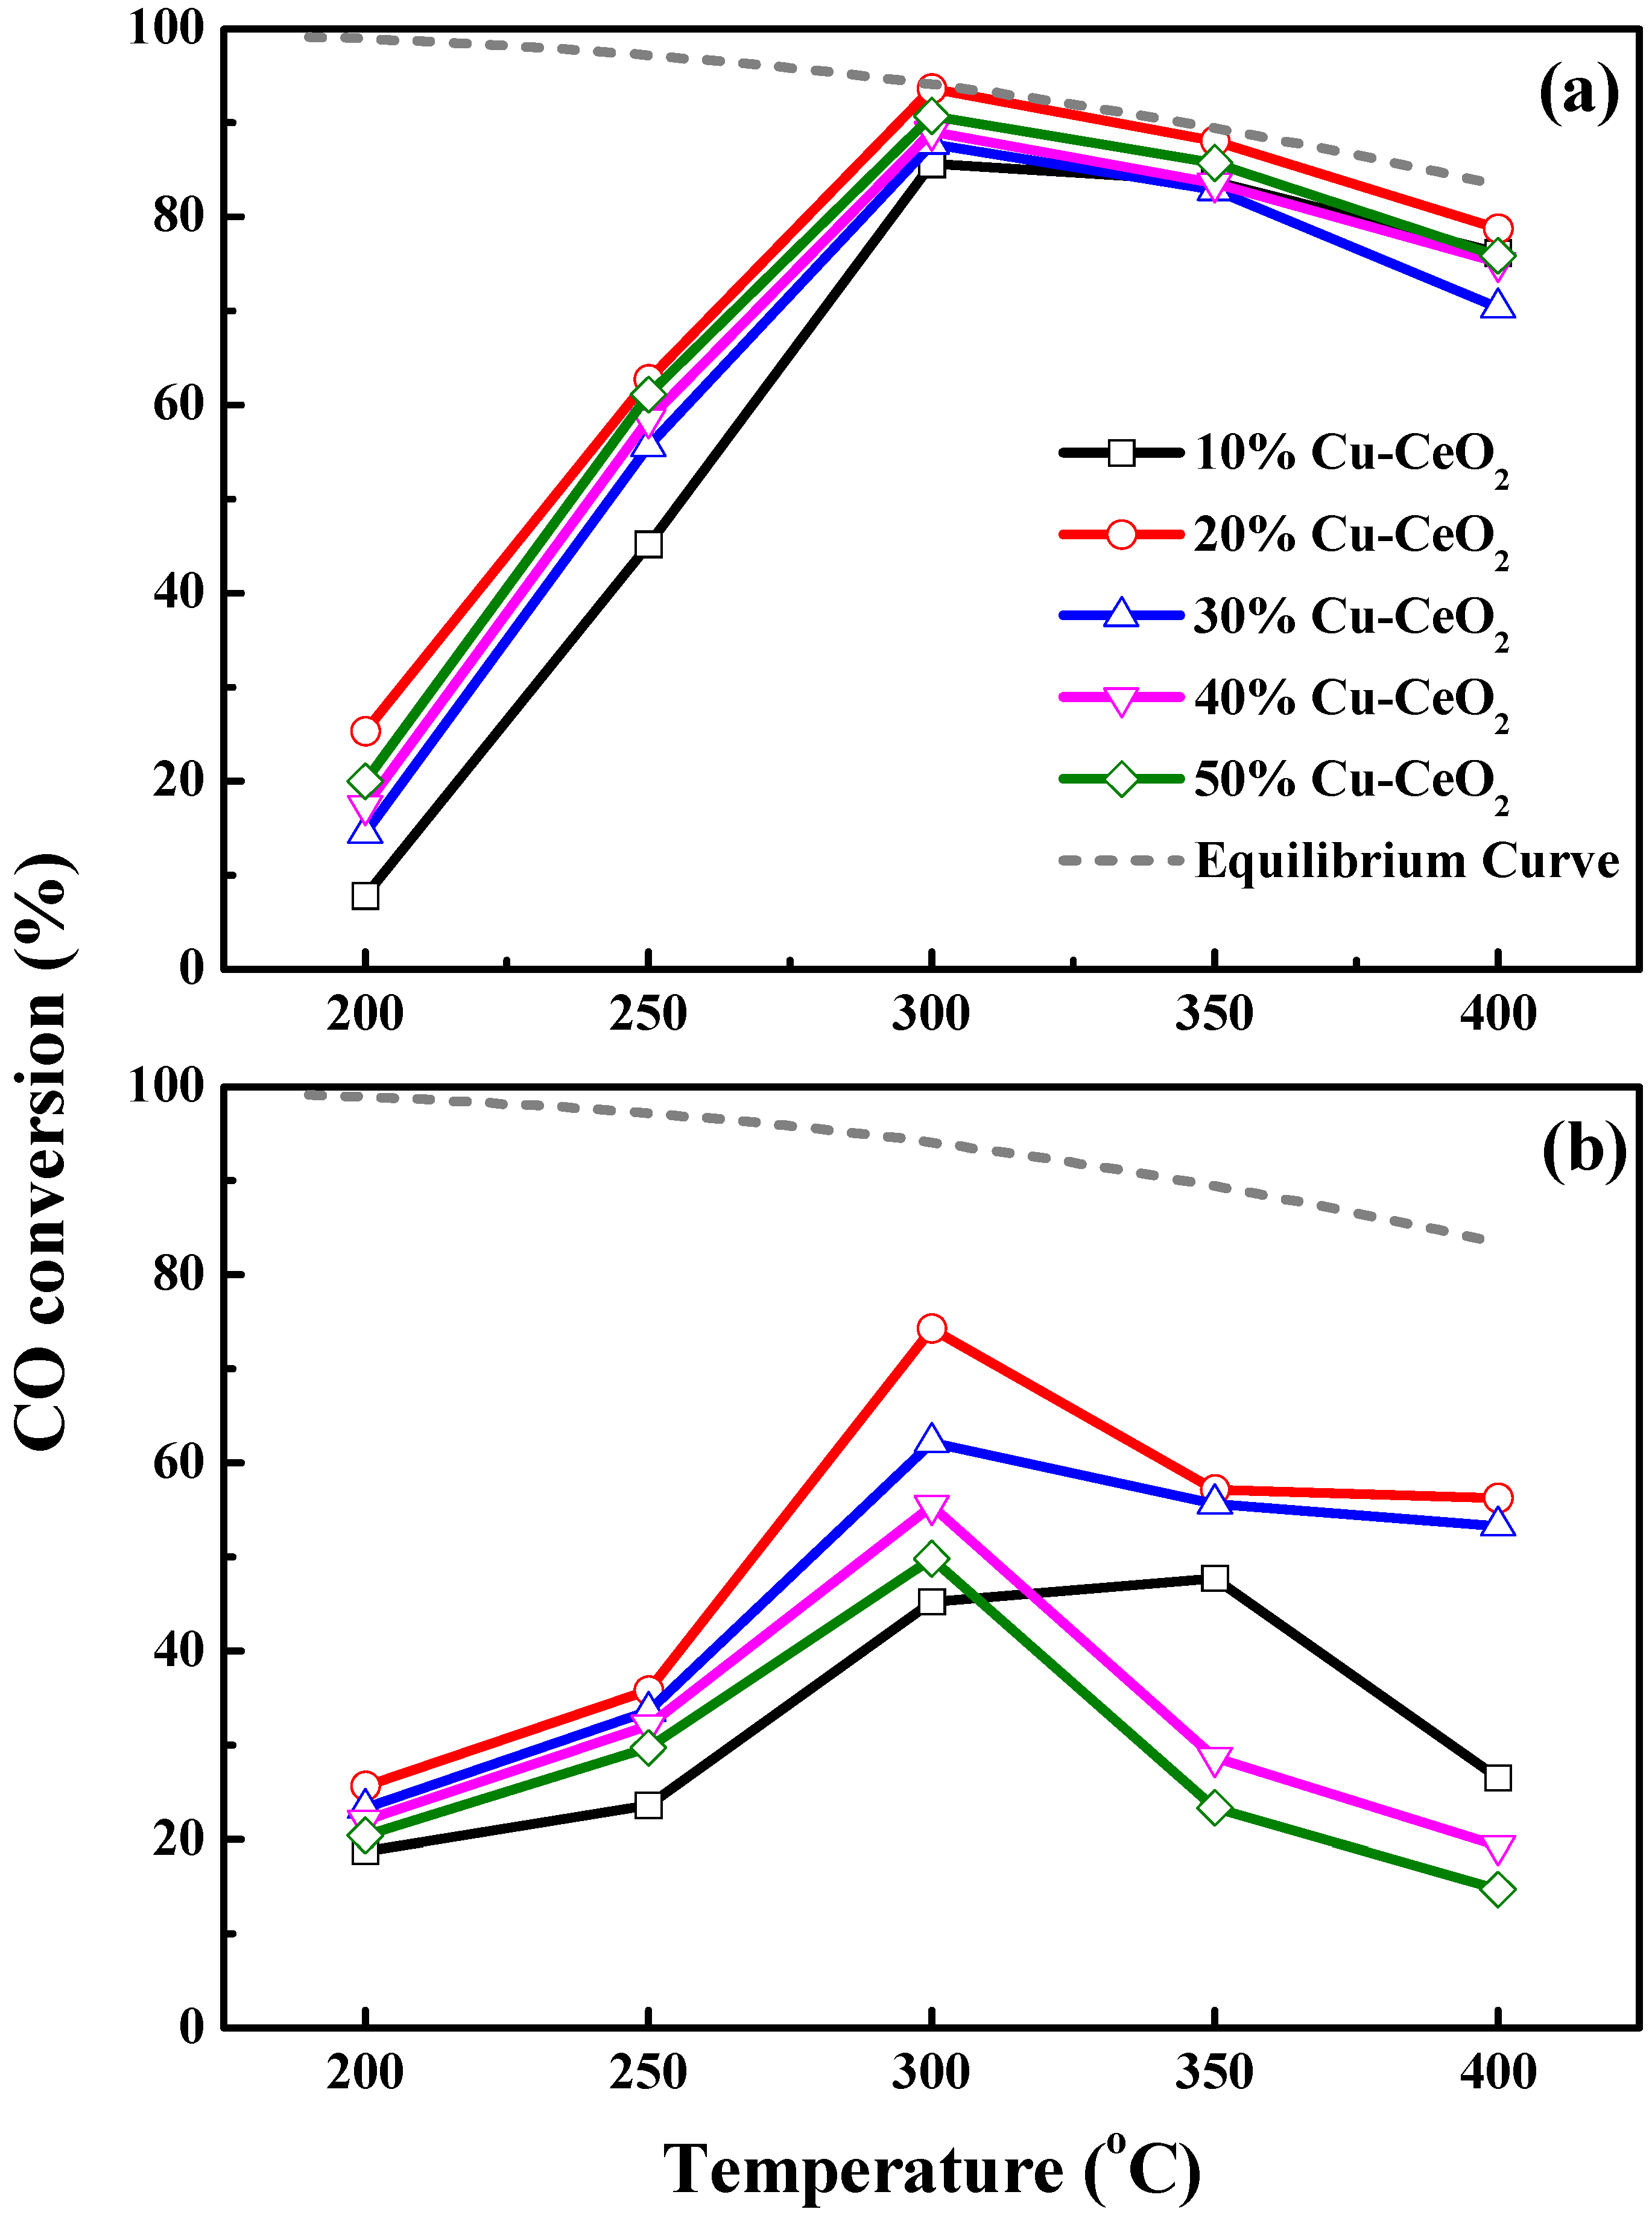
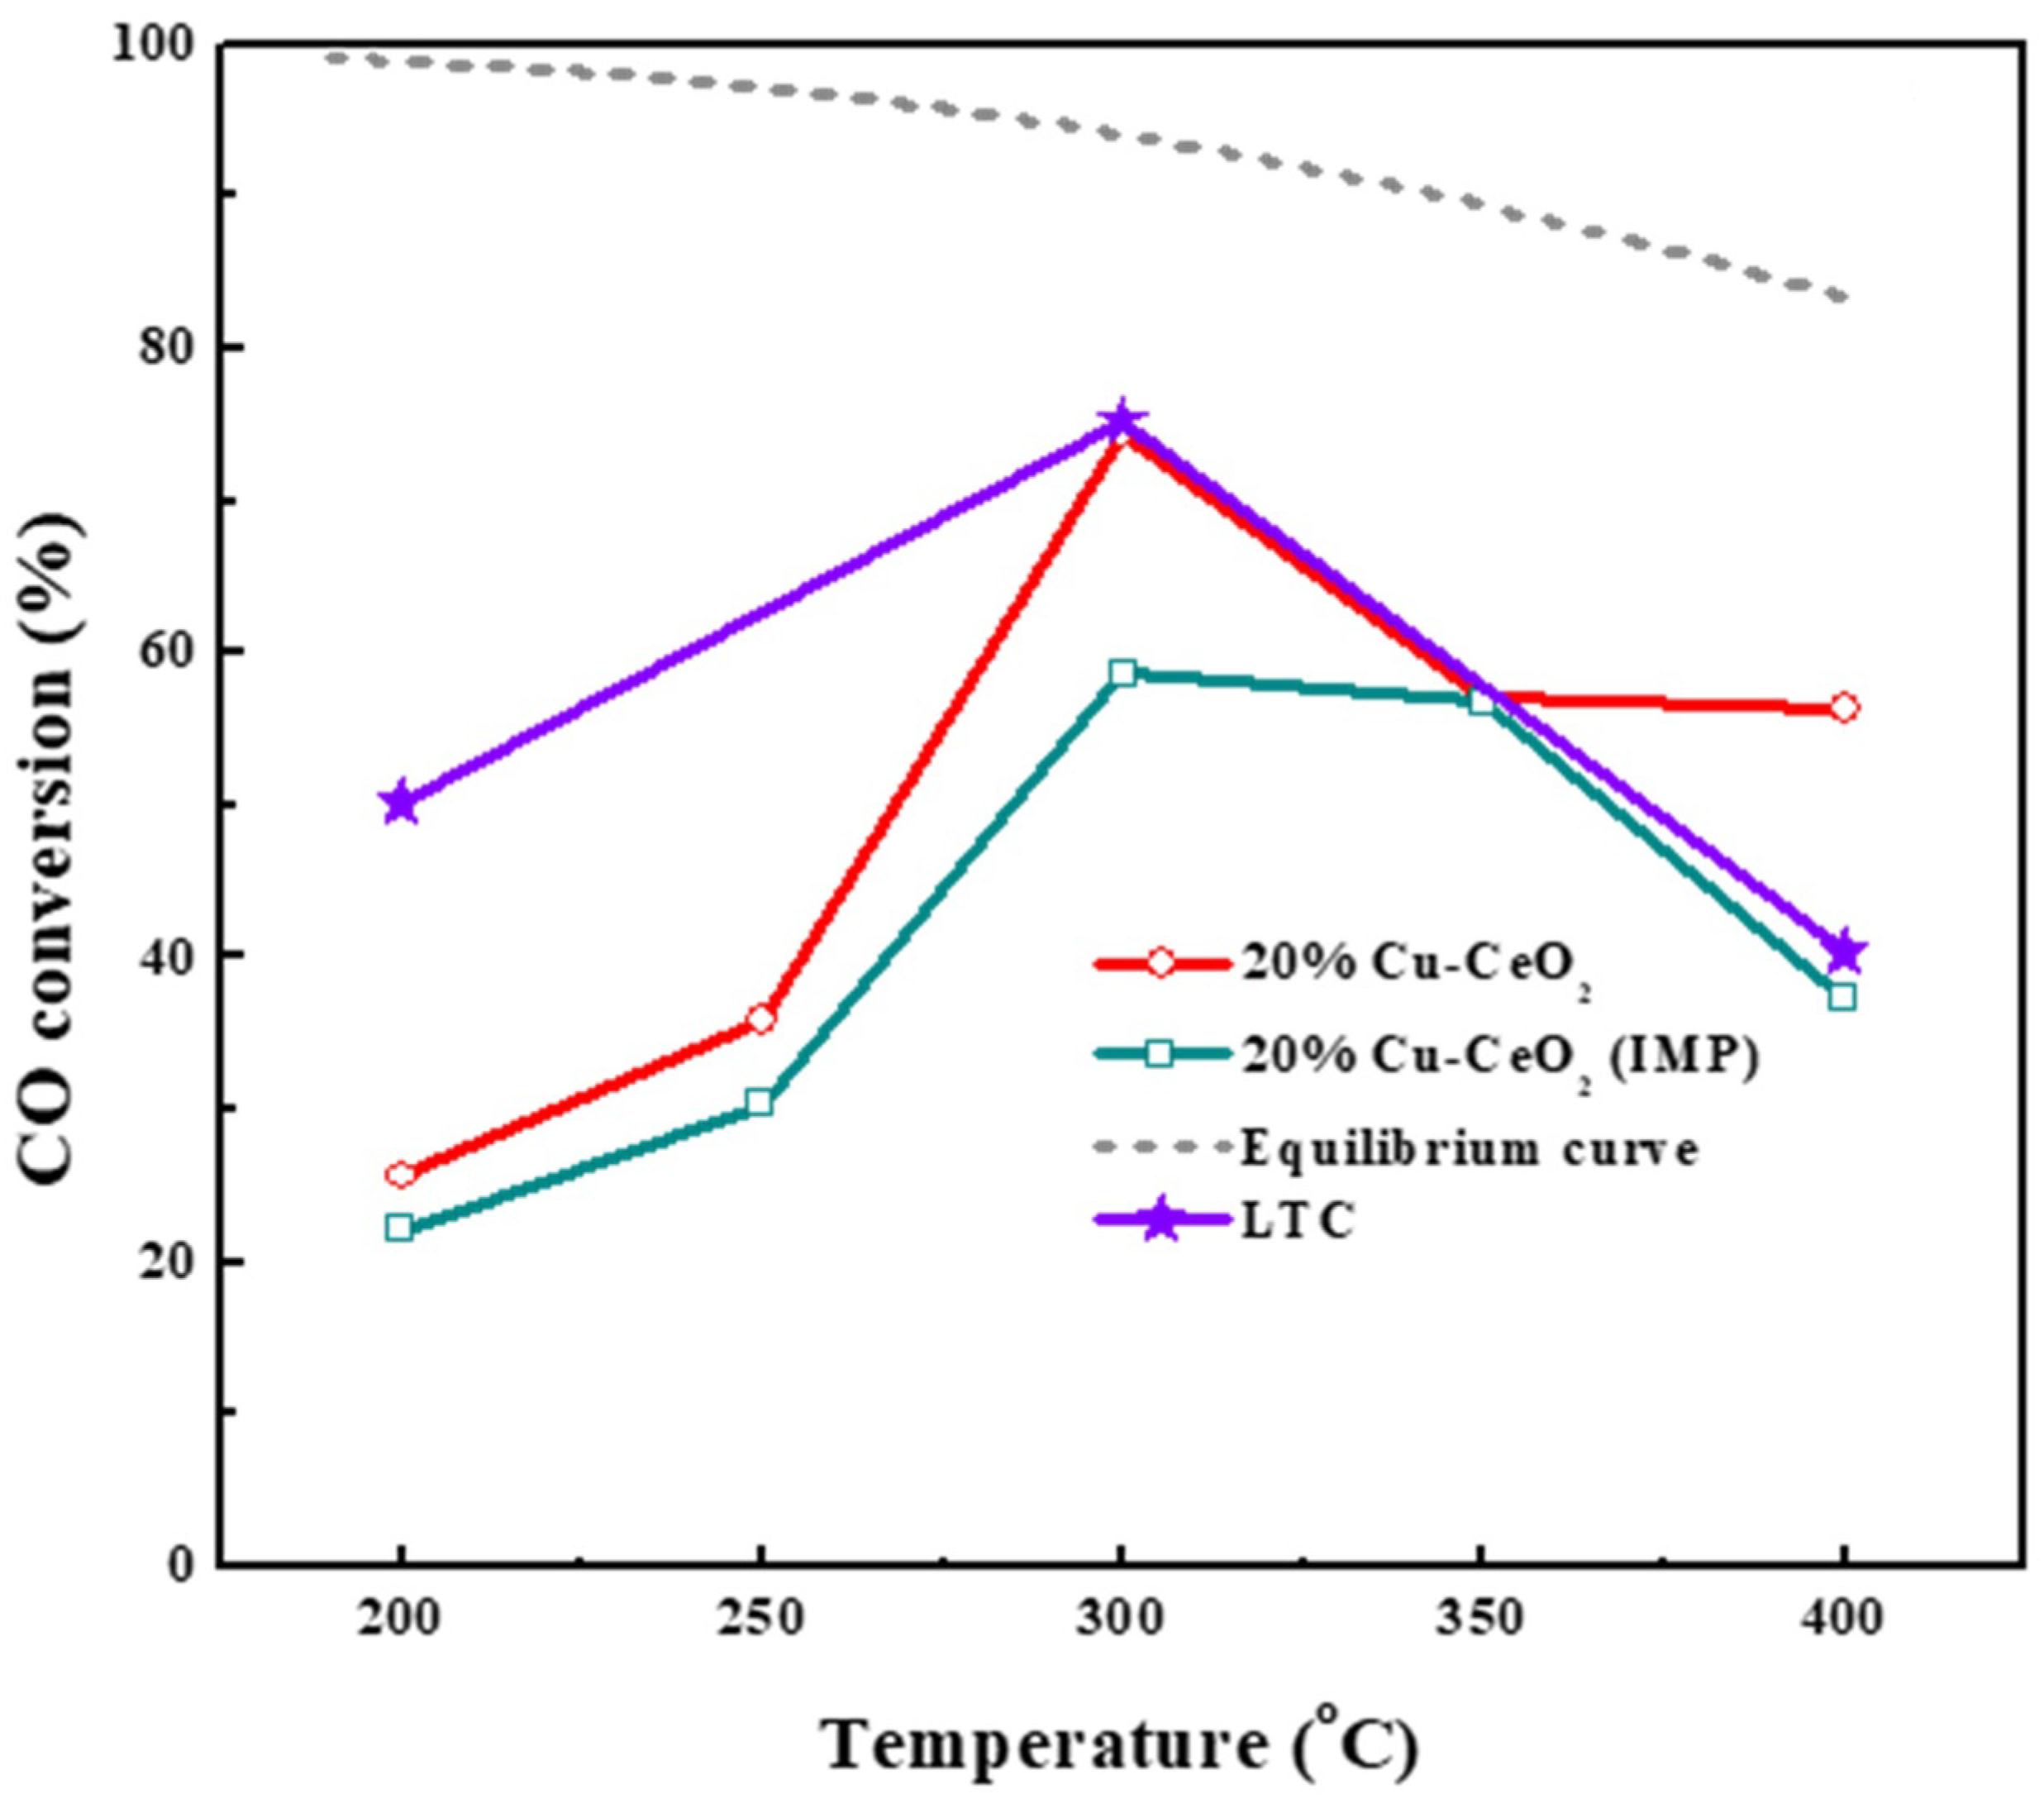
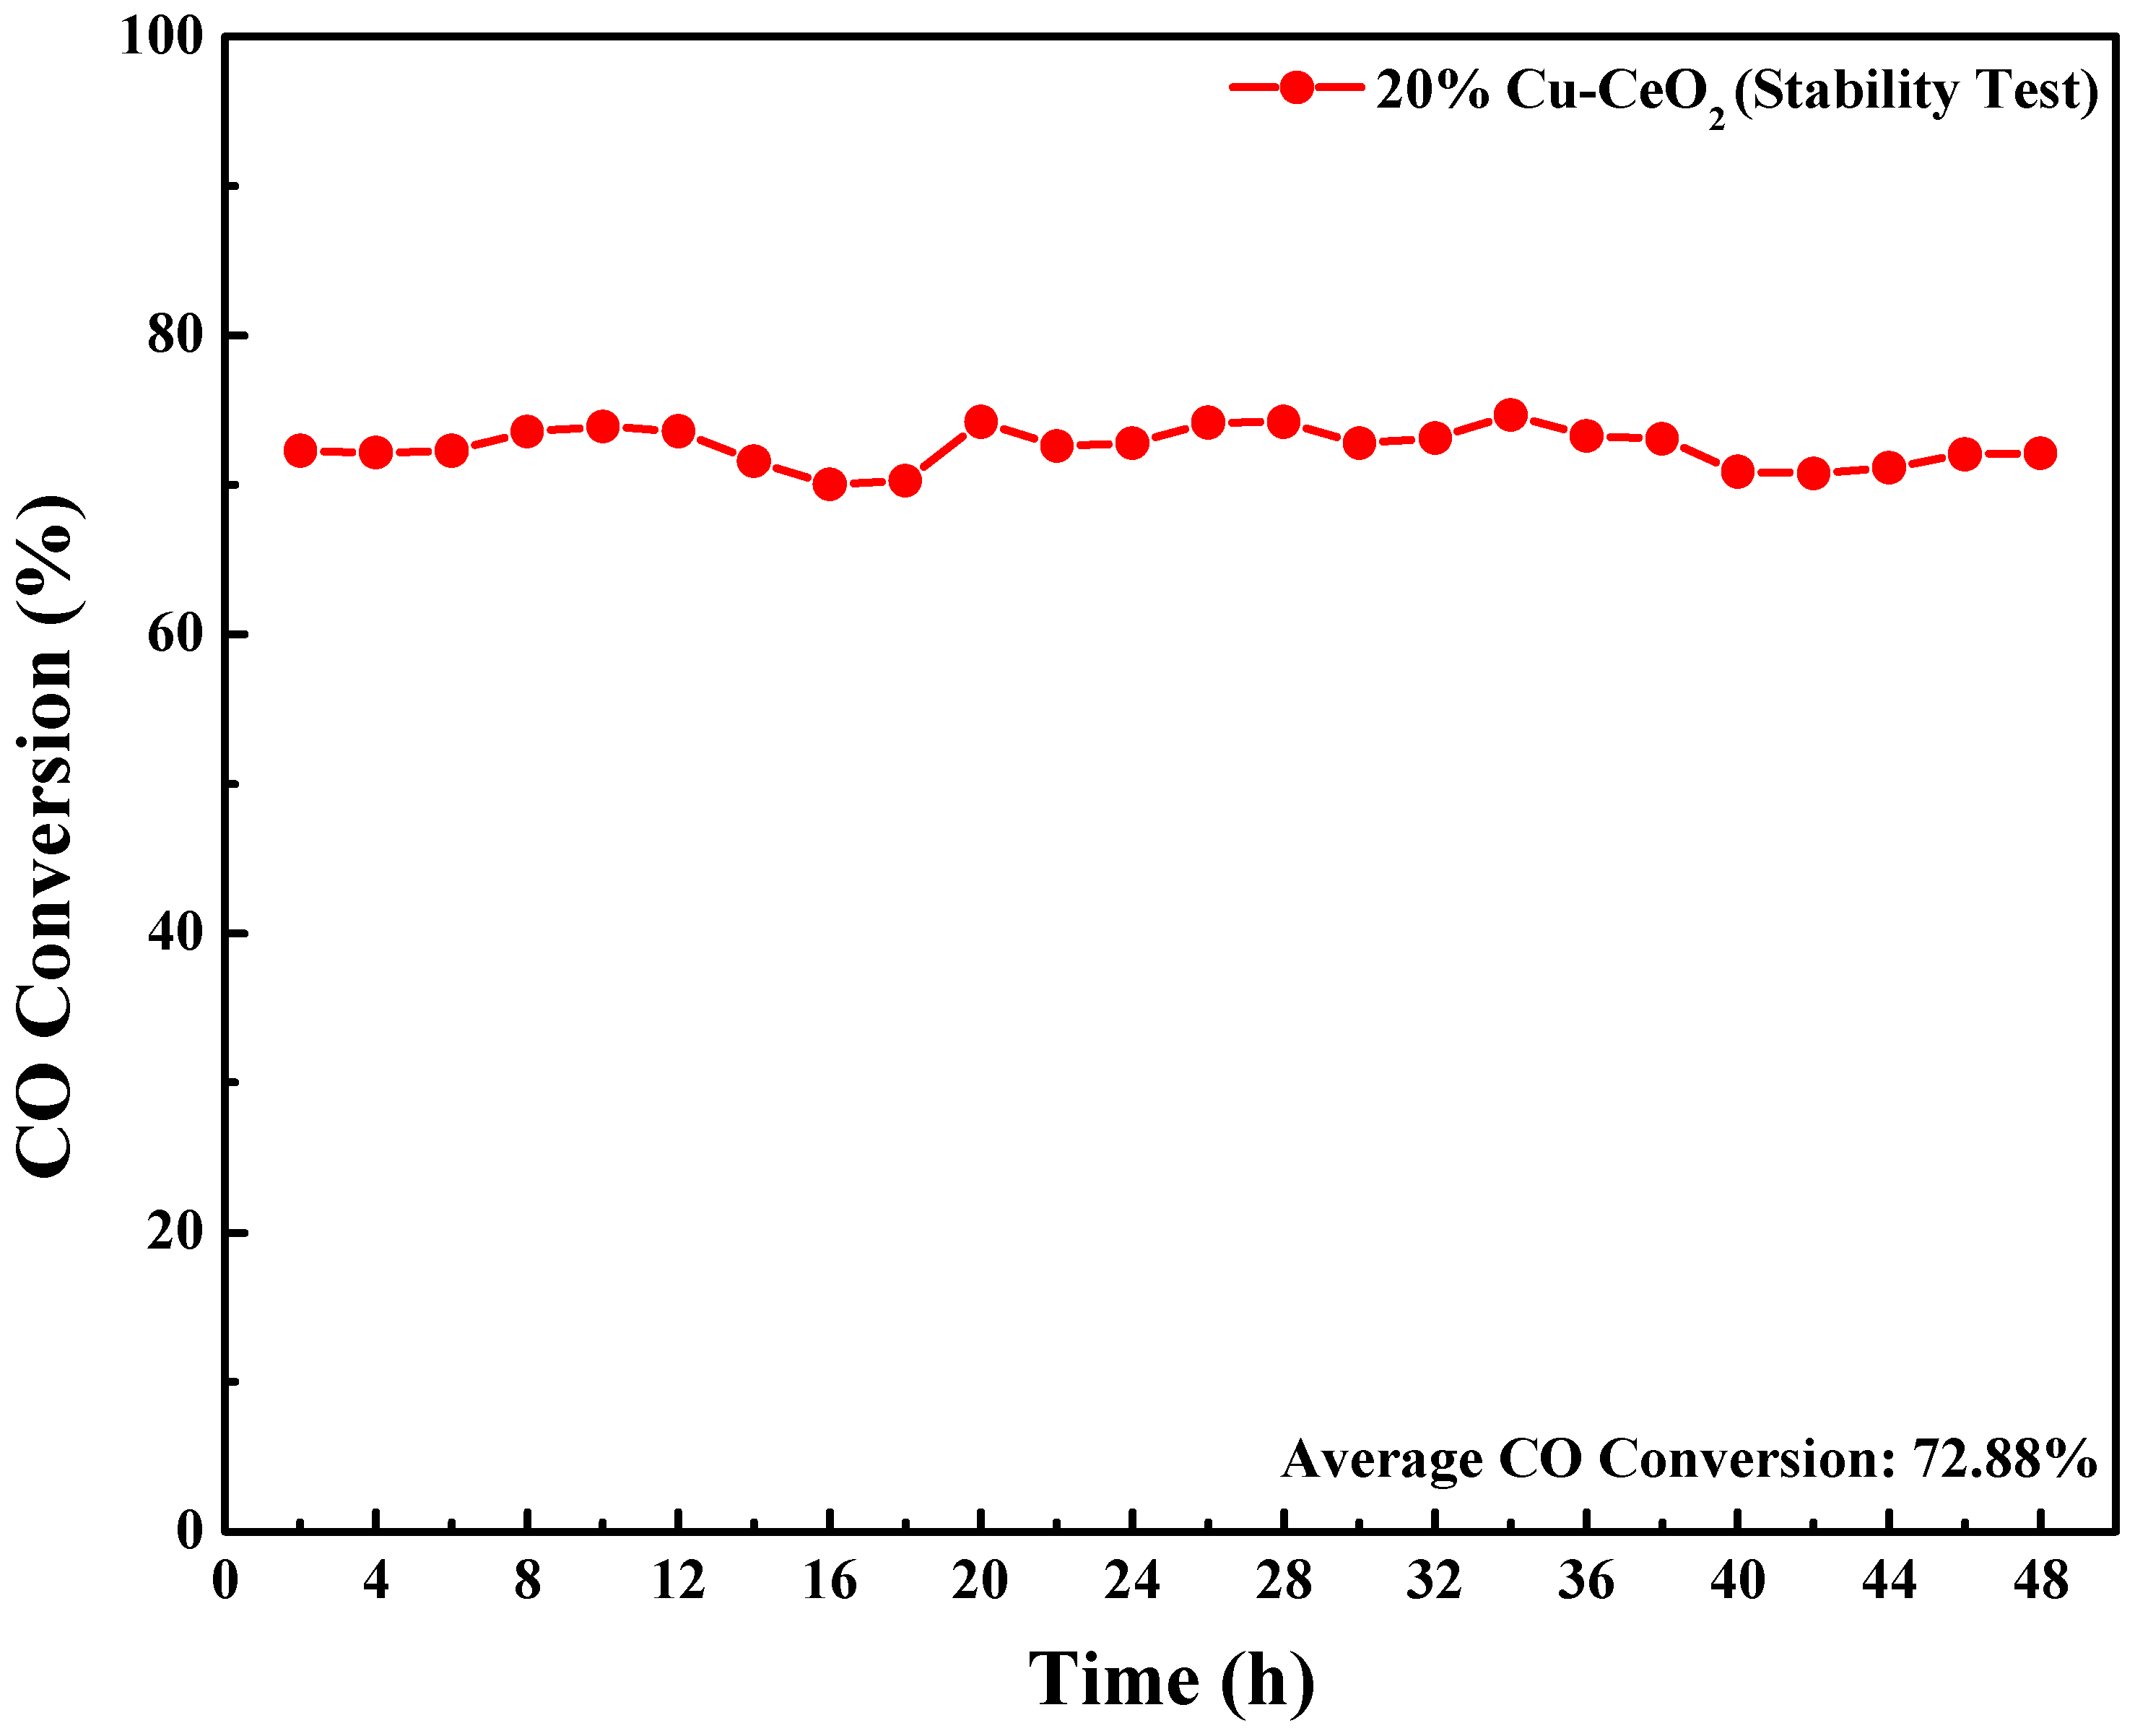
2.7. Evaluation of Catalytic Performances in Water Gas Shift Reaction

The effects of the different feed gas compositions (containing or lacking CO2) on the catalytic activity of (n)Cu-CeO2 composite of RME method were comparatively studied in terms of CO conversion as described in Figure 9a,b. Primarily, the CO conversion was evaluated in the absence of CO2 as mentioned in Figure 9a. The (n)Cu-CeO2 samples prepared using the RME method exhibited the CO conversion range of 85 to 94% at an optimum temperature of 300 °C. Among them, 20% Cu-CeO2 sample attained the theoretical equilibrium CO conversion of ~94% and displayed the optimal activity across the entire temperature range of 200 to 400 °C.
On the other hand, the literature review mentioned that the co-existence of CO2 in feed gas composition in practical applications has a negative impact on the conversion of CO in the WGS reaction by causing the reaction to reverse direction at the high level of CO2 [60]. In Figure 9b, the activity of (n)Ce-CeO2 was evaluated using the harsh feed gas composition containing the high concentrations of CO and CO2. Under these conditions, the CO conversion of each sample ranged from 45% to 75% at an optimum temperature of 300 °C. Among them, 20% Cu-CeO2 sample acquired again the highest CO conversion with ~75% activity similarly as in the previous test with the feed gas without CO2. This observed distinctness in WGS activity could be attributed to the distinctive features of 20% Cu-CeO2 sample including its large surface area and pore diameter, reduced crystallite size, effective interaction between Cu and CeO2 with increased oxygen vacancies, and other physiochemical advantages resulting from the RME method.
In addition, to comparatively evaluate the impact of preparation methods on the catalytic activity of samples, WGS activity test was also conducted by using the 20% Cu-CeO2(IMP) sample and Low temperature commercial WGS catalyst (LTC) under the same reaction conditions as the preceding experiment, which involved the usage of CO2 comprising feed gas. By the CO conversion result, it indicated that the sample prepared through the conventional Impregnation method showed inferior activity in all temperature ranges compared to the sample synthesized via the RME method. Even at the optimal temperature of 300 °C, the activity in terms of CO conversion (~58%) of 20% Cu-CeO2(IMP) was found to decrease by approximately 15% compared to the 20% Cu-CeO2 sample synthesized via RME, as depicted in Figure 10. This decrease in observed activity can be the consequence of the weaknesses in the catalyst preparation by Impregnation method as discussed in the previous characterization sections such as the aggregation and formation of larger particles, as well as deficient interaction between Cu and CeO2. Moreover, in the comparison between Cu-CeO2 sample synthesized via RME method LTC remarkable observations were made. Specifically, at the optimal temperature of 300 °C and temperatures above this range, the catalytic activity of the 20% Cu-CeO2 sample prepared via RME method exhibited a comparable performance to that of the Low temperature commercial WGS catalyst. However, in temperature ranges lower than 300 °C, the LTC demonstrated superior activity. These findings highlight the need for further exploration of alternative approaches and parameters to enhance the performance of Cu-based WGS catalysts in the low temperature region in the future.
Finally, in order to evaluate the catalytic stability of (n)Cu-CeO2 samples synthesized via RME method, 20% Cu-CeO2 composite was chosen as the optimal sample based on its exceptional performance in the activity test. The experimental conditions employed in the stability test remained consistent with those utilized in the initial activity test, including the gas composition containing CO2. Notably, the 20% Cu-CeO2 sample exhibited the highest CO conversion at 300 °C, thus prompting the selection of this temperature range as the constant and optimal condition for the subsequent stability test. After 48 h duration of operating WGS reaction, the 20% Cu-CeO2 sample exhibited the ability to sustain its catalytic activity, maintaining an average CO conversion of ~73%, as depicted in Figure 11. This observed stability can be attributed to the enhanced redox properties resulting from the well-interaction between Cu and CeO2. Furthermore, the 20% Cu-CeO2 catalyst demonstrated resilience against the detrimental effects of CO2 present in the gas composition, which is known to induce catalyst deactivation [60]. The advantageous characteristics exhibited by the Cu-CeO2 catalyst synthesized using the RME method suggest its promising potential for practical applications in Cu-based catalyst synthesis.

3. Materials and Methods

3.1. Preparation of Cu-CeO2 Catalysts by Reverse Microemulsion (RME) Method

In order to synthesize modified Cu-CeO2 catalysts via RME method, the organic surfactant solution was initially prepared by adding an appropriate amount of the mixture of Triton X-100 (Samchun, max ~0.4 wt% in H2O, Pyeongtaek-si, Gyeonggi-do, Republic of Korea) as a surfactant and 2-propanol (Samchun, 99.8% purity, Pyeongtaek-si, Gyeonggi-do, Republic of Korea) as a cosurfactant into the cyclohexane solvent (Samchun, 99.0% purity, Pyeongtaek-si, Gyeonggi-do, Republic of Korea). Then, (n)Cu-CeO2 precursor salt solutions with different Cu loadings (10~50 wt% based on CeO2 final support) were prepared by dissolving the appropriate amount of Copper (II) nitrate trihydrate (Samchun, 99.0% purity, Pyeongtaek-si, Gyeonggi-do, Republic of Korea) and Cerium (III) nitrate hexahydrate (Samchun, 99.0% purity, Pyeongtaek-si, Gyeonggi-do, Republic of Korea) in 20 mL of distilled water.
After that, two separated reverse microemulsions were prepared by dispersing (n)Cu-CeO2 precursor salt solution in 80 mL of previously prepared organic surfactant solution, denoted as Cu-CeO2 (Mixing) Nitrates RME. Moreover, in another 80 mL of organic surfactant solution, Ammonia solution (Samchun, 28.0~30.0% conc. Pyeongtaek-si, Gyeonggi-do, Republic of Korea) was dispersed to use as a precipitating agent, denoted as Precipitant RME. Then, each individual reverse microemulsion was stirred vigorously at room temperature for 1 h to achieve uniform homogeneous solution. This was followed by the dropwise addition of Cu-CeO2 (Mixing) Nitrates RME into the Precipitant RME to precipitate Cu-CeO2 nanoparticles by nucleation growth, after which the aging process was performed by stirring with 400 rpm at 60 °C for 24 h.
Afterward, the post-treatment processes were performed to remove impurities and stabilize the final Cu-CeO2 nanoparticles. Firstly, these particles were washed with distilled water (~1 L), followed by vacuum filtration. The achieved nanoparticles were dried at 150 °C for 6 h and calcined at 400 °C for 4 h with the heating rate of 5 °C min−1 under atmospheric conditions. Finally, these calcined particles were crushed and sieved to achieve particles with a uniform size of between 150~300 µm, which were denoted as (n)Cu-CeO2 where (n) is the amount of loading wt% of Cu on the surface of the CeO2. The schematic diagram of detailed preparation steps was demonstrated in Figure S1.

3.2. Preparation of Cu-CeO2 Catalysts by Impregnation Method

Another catalyst sample with the same chemical composition used in the preparation of the optimum WGS catalyst (20% Cu-CeO2) by RME method was synthesized again through the conventional Impregnation method to differentiate catalyst characteristics and activities between these two methods. In this synthesis, firstly, the appropriate amount of Copper and Cerium nitrate precursor salts were dissolved in the same amount of distilled water as in the RME method, and Ammonia solution was added dropwise to the above solution. After that, the aging process and other post-treatment processes were also prepared under the same conditions as executed in the RME method. The obtained sample will be denoted as 20% Cu-CeO2(IMP).

3.3. Characterization of Catalysts

To analyze the crystalline structures of (n)Cu-CeO2 samples, Powder X-ray Diffraction patterns were recorded by using (XRD, Bruker D8 ADVANCE Powder instrument, Bruker Corporation, Billerica, MA, USA). which operated at 40 kV with Cu-Kα1 (λ = 1.54056 Å). The characterization test was performed within the scanning range of 2θ of 10–90° with a scanning rate of 0.02° s−1. From the acquired XRD patterns, the average crystallite sizes of each sample were calculated by using Debye–Scherrer Equation as follows.
D = K λ β c o s θ
where D = Average Crystallite Size
K = Scherrer’s Constant (K = 0.9)
λ = Wavelength of X-ray (λ = 1.54056 Å)
β = Full Width at Half Maximum (FWHM) of diffraction peaks
θ = Angle of the diffraction
Pore characteristics and Braunauer–Emmett–Teller (BET) surface areas of each sample were calculated from the N2 physisorption isotherm curves measured by (BET, BELSORP-miniX, MicrotracBEL Corp.) at −196 °C after degassing process of the sample at 200 °C for 6 h under vacuum conditions.
In order to investigate the reducibility of copper oxide species and redox properties of Cu-CeO2, Temperature Programmed Reduction by hydrogen was conducted by using (H2-TPR, BELCAT–M, MicrotracBEL Corp., Osaka, Kansei District, Japan) instrument. (n)Cu-CeO2 samples (150~300 µm) were loaded into the reactor tube and exposed to the 10 vol% H2/Ar gas mixture with a flow rate of (50 cc min−1). The analysis was performed by increasing the temperature from 25 to 500 °C with the heating rate of 5 °C min−1 under the constant flow of the gas mixture.
X-ray Photoelectron Spectroscopy was conducted to identify the chemical compositions together with oxidation states of the (n)Cu-CeO2 and 20% Cu-CeO2(IMP) sample composites and peak deconvolution was carried out. The analysis was carried out with (XPS, Thermo Scientific K-Alpha X-ray Photoelectron Spectroscopy, Thermo Fisher Scientific Inc, Waltham, MA, USA). Charge correction was performed by adjusting the binding energy of C 1s at 284.8 eV of adventitious hydrocarbons.
Finally, the surface morphological micrographs of 20% Cu-CeO2 and 20% Cu-CeO2(IMP) were observed through Scanning Electron Microscope (SEM, Hitachi S-4800, Hitachi, Ltd., Chiyoda, Marunouchi District, Japan), to compare the particle shape, dispersion and aggregation condition between samples synthesized through RME and IMP methods.
Moreover, to elucidate the nanostructure of the 20% Cu-CeO2 synthesized via RME method, Transmission Electron Microscopy (TEM) was conducted, and this analysis was performed through (TEM, FEI (Tecnai G2 F30), FEI Company, Hillsboro, OR, USA) at an accelerating voltage of 300 kV.

3.4. Catalytic Test

To pinpoint the most effective reaction conditions of (n)Cu-CeO2 catalysts by taking consideration into both kinetic and thermodynamic aspects of WGS reaction, the activity test was performed by using a fixed bed reactor from 200 °C to 400 °C which included both LT-WGS and HT-WGS temperature range. Firstly, the (n)Cu-CeO2 samples were pelletized, crushed, and sieved to get particles with the range of 150–300 µm. After that, the samples were inserted to 2 cm length into the quartz reactor with an inner diameter of 4 mm. A thermocouple was inserted into the quartz reactor to record the real-time temperature of the WGS reaction. The H2O source (steam) was supplied via a water pump (NP-KX-200, Nihon Seimitsu Kagaku Co., Ltd., Kawaguchi, Honmachi District, Japan), the temperature conditions together with the reaction segments were controlled by the program controller (UP35A, YOKOGAWA, Musashino, Tokyo Metropolis, Japan), and the flow rates of each used gas was controlled by MFC controller (GMC1200, Yongin-si, Gyeonggi-do, Republic of Korea). The excessive steam coming out of the quartz reactor was captured in the steam coolant together with the water trap and the output CO amount was recorded via a Gas Chromatography (GC, 3000 Micro GC INFICON, Bad Ragaz, SG, Switzerland) system cooperated with a thermal conductivity detector (TCD) as described in the Figure 12.
Before performing the WGS reaction, (n)Cu-CeO2 samples were pretreated by increasing temperature from room temperature to 400 °C with the heating rate of 2 °C min−1 and maintaining at 400 °C for 1 h by flowing the 50 vol% of H2 balanced with the 50 vol% of N2 (100 cc min−1). For the reaction, two feed gas compositions were utilized to study the effect of CO2 over the activity of the catalyst: one without CO2 (CO = 10.01 vol%, H2 = 59.99%, N2 = 30.00%) and one with a high amount of CO and CO2 (CO = 10.01 vol%, CO2 = 34.97 vol%, H2 = 55.02 vol%) which was similar to real pet coke composition. The feed gas flow rate was maintained at 50 cc min−1 while the amount of steam supplied to the reactor was fixed at 12 µL min−1. By maintaining these reaction conditions, the steam to carbon monoxide ratio (S/CO) could be maintained at 5 together with the Gas Hourly Space Velocity (GHSV) at 14,310 h−1. The output CO concentration was recorded at intervals of 50 °C from 200 °C to 400 °C, with a measurement time of 30 min for each interval. From these output concentrations, the activity of the catalyst (CO conversion) was calculated by the following equation.
CO   conversion   ( % ) = [ CO ] i n [ CO ] o u t [ CO ] i n × 100
Moreover, to compare the effects of preparation methods on the performance efficiency of the catalysts, 20% Cu-CeO2(IMP) catalyst and Low temperature commercial WGS catalyst (LTC) were also tested using feed gas composition with high concentrations of CO and CO2 under the same reaction conditions as described above. Furthermore, to evaluate the effectiveness of the RME method in terms of catalytic activity stability, a long-term stability test was conducted using the optimal sample selected from the (n)Cu-CeO2 samples under the optimal reaction conditions for 48 h and the output CO concentration was recorded with a measurement time of 2 h interval.

4. Conclusions

To mitigate the drawbacks of Cu-CeO2 catalysts synthesized via conventional Impregnation method, Cu-CeO2 catalysts with various Cu loading amounts were synthesized via RME method using organic surfactants. This method affords several advantages that can enhance catalytic activity, such as nanoparticle stability, small and uniformly distributed particle size that exposes more active sites, and even dispersion of metal on the support. Moreover, a comparative study of the characterization and activity of Cu-CeO2 catalysts synthesized by the RME and conventional impregnation methods was conducted using identical reaction conditions to confirm the effectiveness of the RME method. Even at the high Cu loading amounts, the fair dispersion of uniform-sized Cu-CeO2 composite particles could be maintained via RME method, resulting in enhanced interaction between Cu and CeO2 with high oxygen vacancy, which led to improved catalyst activity compared to the conventional Impregnation method. Additionally, the negative impact of the presence of CO2 in the feed gas composition on the Cu-based WGS catalyst was also verified. Among the prepared samples, 20% Cu-CeO2 sample achieved optimal activity with ~75% CO conversion at 300 °C and found to be comparable with Low temperature commercial WGS catalyst (LTC). Furthermore, the stability of the samples prepared via RME method was evaluated through continuous operation of WGS reaction for 48 h under the optimal reaction conditions, including the usage of the harsh gas composition containing CO2. Remarkably, the 20% Cu-CeO2 sample exhibited sustained catalytic activity throughout the entire 48-h period without any signs of deactivation. However, in the temperature range lower than 300 °C, lower activity was observed for the 20% Cu-CeO2 catalyst prepared via RME method compared to that of LTC. Due to this reason, further exploration of alternative approaches and parameters is necessary to enhance the performance of Cu-based WGS catalysts in the low temperature region in the future. Despites this vulnerable catalytic activity at low temperature region, in every characterization category, the sample prepared via RME method demonstrated superior physiochemical properties compared to the sample synthesized through conventional Impregnation method. Because of these benefits, the RME method was concluded that this could have the great potential for the future nanoparticle catalyst preparation for industrial applications.

Supplementary Materials

The following supporting information can be downloaded at: https://www.mdpi.com/article/10.3390/catal13060951/s1. Figure S1: The schematic diagram for preparation of (n)Cu-CeO2 WGS catalysts by Reverse Microemulsion (RME) method.

Author Contributions

Conceptualization, W.O. and K.B.Y.; methodology, W.O.; software, W.O. and J.H.P.; validation, J.H.P., D.C. and K.B.Y.; formal analysis, W.O.; investigation, W.O.; resources, J.H.P.; data curation, W.O. and J.H.P.; writing—original draft preparation, W.O.; writing—review and editing, J.H.P. and M.Z.W.; visualization, W.O. and Z.A.S.; supervision, D.C. and K.B.Y.; project administration, K.B.Y.; funding acquisition, J.H.P. All authors have read and agreed to the published version of the manuscript.

Funding

This research was funded by Ministry of Land, Infrastructure and Transport grant number 22PCHG-C161575-02.

Data Availability Statement

The authors confirm that the data supporting the findings of this study are available within the article and its Supplementary Materials. Raw data that support the findings of this study are available from corresponding authors, upon reasonable request.

Conflicts of Interest

The authors declare no conflict of interest.

References

  1. Newell, R.; Raimi, D.; Villanueva, S.; Prest, B. Global Energy Outlook 2021: Pathways from Paris. Resour. Future 2021, 8, 3–12. [Google Scholar]
  2. Smil, V. Energy Transitions: Global and National Perspectives, 2nd ed.; ABC-CLIO: Santa Barbara, CA, USA, 2016. [Google Scholar]
  3. Dudley, B. Bp Statistical Review of World Energy 2018. Energy Economic, Centre for Energy Economics Research and Policy. British Petroleum. 2018. Available online: https://www.bp.com/en/global/corporate/energy-economics/statistical-review-of-world-energy/electricity.html (accessed on 7 February 2023).
  4. Lee, Y.L.; Lee, K.; Ko, C.H.; Roh, H.S. Optimization of Nano-catalysts for Application in Compact Reformers. Chem. Eng. J. 2022, 431, 134299. [Google Scholar] [CrossRef]
  5. Fiorio, J.L.; Gothe, M.L.; Kohlrausch, E.C.; Zardo, M.L.; Tanaka, A.A.; de Lima, R.B.; da Silva, A.G.M.; Garcia, M.A.S.; Vidinha, P.; Machado, G. Nanoengineering of Catalysts for Enhanced Hydrogen Production. Hydrogen 2022, 3, 218–254. [Google Scholar] [CrossRef]
  6. Johnston, B.; Mayo, M.C.; Khare, A. Hydrogen: The Energy Source for the 21st century. Technovation 2005, 25, 569–585. [Google Scholar] [CrossRef]
  7. Canton, H. International Energy Agency-IEA. In The Europa Directory of International Organizations 2021, 23rd ed.; Europa Publications, Ed.; Routledge: London, UK, 2021; pp. 684–686. [Google Scholar] [CrossRef]
  8. U.S.E.I Adminstration, Hydrogen Explained: Production of Hydrogen. Available online: https://www.eia.gov/energyexplained/hydrogen/production-of-hydrogen.php (accessed on 21 January 2022).
  9. IRENA, Green Hydrogen: A Guide to Policy Making. Available online: https://www.irena.org/publications/2020/Nov/Green-hydrogen (accessed on 25 November 2020).
  10. Sadik-Zada, E.R. Political Economy of Green Hydrogen Rollout: A Global Perspective. Sustainability 2021, 13, 13464. [Google Scholar] [CrossRef]
  11. Lee, Y.L.; Kim, K.J.; Hong, G.R.; Roh, H.S. Target-oriented water–gas shift reactions with customized reaction conditions and catalysts. Chem. Eng. J. 2023, 458, 141422. [Google Scholar] [CrossRef]
  12. Dincer, I.; Acar, C. Review and Evaluation of Hydrogen Production Methods for Better Sustainability. Int. J. Hydrogen Energy 2015, 40, 11094–11111. [Google Scholar] [CrossRef]
  13. El Gemayel, J.; Macchi, A.; Hughes, R.; Anthony, E.J. Simulation of the Integration of a Bitumen Upgrading Facility and an IGCC Process with Carbon Capture. Fuel 2014, 117, 1288–1297. [Google Scholar] [CrossRef]
  14. Lee, S.; Kim, H.S.; Park, J.; Kang, B.M.; Cho, C.H.; Lim, H.; Won, W. Scenario-Based Techno-Economic Analysis of Steam Methane Reforming Process for Hydrogen Production. Appl. Sci. 2021, 11, 6021. [Google Scholar] [CrossRef]
  15. Coletta, V.C.; Gonçalves, R.V.; Bernardi, M.I.; Hanaor, D.A.; Assadi, M.H.; Marcos, F.C.; Nogueira, F.G.; Assaf, E.M.; Mastelaro, V.R. Cu-Modified SrTiO3 Perovskites Toward Enhanced Water–Gas Shift Catalysis: A Combined Experimental and Computational Study. ACS Appl. Energy Mater. 2020, 4, 452–461. [Google Scholar] [CrossRef]
  16. Callaghan, C.A. Kinetics and Catalysis of the Water-Gas-Shift Reaction: A Microkinetic and Graph Theoretic Approach. Doctoral Dissertation, Worcester Polytechnic Institute, Worcester, MA, USA, 31 March 2006. [Google Scholar]
  17. Jain, R.; Maric, R. Synthesis of nano-Pt onto ceria support as catalyst for water–gas shift reaction by Reactive Spray Deposition Technology. Appl. Catal. A Gen. 2014, 475, 461–468. [Google Scholar] [CrossRef]
  18. Senanayake, S.D.; Stacchiola, D.; Rodriguez, J.A. Unique Properties of Ceria Nanoparticles Supported on Metals: Novel Inverse Ceria/Copper Catalysts for CO Oxidation and the Water-Gas Shift Reaction. ACC Chem. Res. 2013, 46, 1702–1711. [Google Scholar] [CrossRef]
  19. Montini, T.; Melchionna, M.; Monai, M.; Fornasiero, P. Fundamentals and Catalytic Applications of CeO2-Based Materials. Chem. Rev. 2016, 116, 5987–6041. [Google Scholar] [CrossRef]
  20. Wu, K.; Sun, L.D.; Yan, C.H. Recent progress in well-controlled synthesis of ceria-based nanocatalysts towards enhanced catalytic performance. Adv. Energy Mater. 2016, 6, 1600501. [Google Scholar] [CrossRef]
  21. Chen, A.; Yu, X.; Zhou, Y.; Miao, S.; Li, Y.; Kuld, S.; Sehested, J.; Liu, J.; Aoki, T.; Hong, S.; et al. Structure of the catalytically active copper–ceria interfacial perimeter. Nat. Catal. 2019, 2, 334–341. [Google Scholar] [CrossRef]
  22. Yao, S.Y.; Xu, W.Q.; Johnston-Peck, A.C.; Zhao, F.Z.; Liu, Z.Y.; Luo, S.; Senanayake, S.D.; Martínez-Arias, A.; Liu, W.J.; Rodriguez, J.A. Morphological effects of the nanostructured ceria support on the activity and stability of CuO/CeO2 catalysts for the water-gas shift reaction. Phys. Chem. Chem. Phys. 2014, 16, 17183–17195. [Google Scholar] [CrossRef]
  23. Jia, M.L.; Zhang, Y.P.; Bao, Y.S.; Wang, J.; Xu, A.J. Recyclable CuMgAl hydrotalcite for oxidative esterification of aldehydes with alkylbenzenes. Green Chem. Lett. Rev. 2018, 11, 230–236. [Google Scholar] [CrossRef]
  24. Reina, T.R.; Ivanova, S.; Laguna, O.H.; Centeno, M.A.; Odriozola, J.A. WGS and CO-PrOx reactions using gold promoted copper-ceria catalysts: “Bulk CuOCeO2 vs. CuOCeO2/Al2O3 with low mixed oxide content”. Appl. Catal. B Environ. 2016, 197, 62–72. [Google Scholar] [CrossRef]
  25. Iqbal, M.W.; Yu, Y.; Simakov, D.S.A. Enhancing the surface area stability of the cerium oxide reverse water gas shift nanocatalyst via reverse microemulsion synthesis. Catal. Today 2023, 407, 230–243. [Google Scholar] [CrossRef]
  26. Meshkani, F.; Rezaei, M. Preparation of mesoporous nanocrystalline alkali promoted chromium free catalysts (Fe2O3–Al2O3–NiO) for a high temperature water gas shift reaction. RSC Adv. 2015, 5, 9955–9964. [Google Scholar] [CrossRef]
  27. Khan, M.E.; Khan, M.M.; Cho, M.H. Ce3+-ion, Surface Oxygen Vacancy, and Visible Light-induced Photocatalytic Dye Degradation and Photocapacitive Performance of CeO2-Graphene Nanostructures. Sci. Rep. 2017, 7, 5928. [Google Scholar] [CrossRef] [PubMed]
  28. Hussain, M.K.; Khalid, N.R.; Tanveer, M.; Kebaili, I.; Alrobei, H. Fabrication of CuO/MoO3 p-n heterojunction for enhanced dyes degradation and hydrogen production from water splitting. Int. J. Hydrogen Energy 2022, 47, 15491–15504. [Google Scholar] [CrossRef]
  29. Siddiqui, H.; Parra, M.R.; Qureshi, M.S.; Malik, M.M.; Haque, F.Z. Studies of structural, optical, and electrical properties associated with defects in sodium-doped copper oxide (CuO/Na) nanostructures. J. Mater. Sci. 2018, 53, 8826–8843. [Google Scholar] [CrossRef]
  30. Ning, J.; Zhou, Y.; Chen, A.; Li, Y.; Miao, S.; Shen, W. Dispersion of copper on ceria for the low-temperature water-gas shift reaction. Catal. Today 2020, 357, 460–467. [Google Scholar] [CrossRef]
  31. Paschalidou, P.; Theocharis, C.R. Surface properties of ceria synthesised using Triton-X based reverse microemulsions. RSC Adv. 2019, 9, 7025–7031. [Google Scholar] [CrossRef]
  32. Housaindokht, M.R.; Nakhaei Pour, A. Size Control of Iron Oxide Nanoparticles Using Reverse Microemulsion Method: Morphology, Reduction, and Catalytic Activity in CO Hydrogenation. J. Chem. 2013, 2013, 781595. [Google Scholar] [CrossRef]
  33. Ricciardi, L.; Martini, M.; Tillement, O.; Sancey, L.; Perriat, P.; Ghedini, M.; Szerb, E.I.; Yadav, Y.J.; La Deda, M. Multifunctional material based on ionic transition metal complexes and gold–silica nanoparticles: Synthesis and photophysical characterization for application in imaging and therapy. J. Photochem. Photobiol. B Biol. 2014, 140, 396–404. [Google Scholar] [CrossRef]
  34. Li, Y.; Fu, Q.; Flytzani-Stephanopoulos, M. Low-temperature water-gas shift reaction over Cu- and Ni-loaded cerium oxide catalysts. Appl. Catal. B 2000, 27, 179–191. [Google Scholar] [CrossRef]
  35. Avgouropoulos, G.; Ioannides, T. Effect of synthesis parameters on catalytic properties of CuO-CeO2. Appl. Catal. B 2006, 67, 1–11. [Google Scholar] [CrossRef]
  36. Gunawardana, P.V.D.S.; Lee, H.C.; Kim, D.H. Performance of copper–ceria catalysts for water gas shift reaction in medium temperature range. Int. J. Hydrogen Energy 2009, 34, 1336–1341. [Google Scholar] [CrossRef]
  37. Kang, W.; Ozgur, D.O.; Varma, A. Solution Combustion Synthesis of High Surface Area CeO2 Nanopowders for Catalytic Applications: Reaction Mechanism and Properties. ACS Appl. Nano Mater. 2018, 1, 675–685. [Google Scholar] [CrossRef]
  38. Bernard, P.; Stelmachowski, P.; Broś, P.; Makowski, W.; Kotarba, A. Demonstration of the influence of specific surface area on reaction rate in heterogeneous catalysis. J. Chem. Educ. 2021, 98, 935–940. [Google Scholar] [CrossRef]
  39. White, R.J.; Budarin, V.; Luque, R.; Clark, J.H.; Macquarrie, D.J. Tuneable porous carbonaceous materials from renewable resources. Chem. Soc. Rev. 2009, 38, 3401–3418. [Google Scholar] [CrossRef] [PubMed]
  40. Broekhoff, J.C.P. Mesopore Determination from Nitrogen Sorption Isotherms: Fundamentals, Scope, Limitations. Stud. Surf. Sci. Catal. 1979, 3, 663–684. [Google Scholar] [CrossRef]
  41. ALOthman, Z.A. A Review: Fundamental Aspects of Silicate Mesoporous Materials. Materials 2012, 5, 2874–2902. [Google Scholar] [CrossRef]
  42. Tang, X.; Zhang, B.; Li, Y.; Xu, Y.; Xin, Q.; Shen, W. Carbon monoxide oxidation over CuO/CeO2 catalysts. Catal. Today 2004, 93, 191–198. [Google Scholar] [CrossRef]
  43. Trovarelli, A. Catalytic Properties of Ceria and CeO2-Containing Materials. Catal. Rev. 1996, 38, 439–520. [Google Scholar] [CrossRef]
  44. Park, J.; Baek, J.H.; Jo, G.H.; Rasheed, H.U.; Yi, K.B. Catalytic Characteristics of Water-Treated Cu/ZnO/MgO/Al2O3 Catalyst for LT-WGS Reaction. Trans. Korean Hydrog. New Energy Soc. 2019, 30, 95–102. [Google Scholar] [CrossRef]
  45. Zhang, Y.; Zheng, N.; Wang, K.; Zhang, S.; Wu, J. Effect of Copper Nanoparticles Dispersion on Catalytic Performance of Cu/SiO2 Catalyst for Hydrogenation of Dimethyl Oxalate to Ethylene Glycol. J. Nanomater. 2013, 2013, 629375. [Google Scholar] [CrossRef]
  46. Di Sarli, V.; Landi, G.; Di Benedetto, A.; Lisi, L. Synergy between ceria and metals (Ag or Cu) in catalytic diesel particulate filters: Effect of the metal content and of the preparation method on the regeneration performance. Top. Catal. 2021, 64, 256–269. [Google Scholar] [CrossRef]
  47. Pardo, A.; Merino, M.C.; Carboneras, M.; Viejo, F.; Arrabal, R.; Munoz, J. Influence of Cu and Sn content in the corrosion of AISI 304 and 316 stainless steels in H2SO4. Corros. Sci. 2006, 48, 1075–1092. [Google Scholar] [CrossRef]
  48. Zhao, H.; Sun, Y.; Yin, L.; Yuan, Z.; Lan, Y.; Xu, D.; Yang, C.; Yang, K. Improved corrosion resistance and biofilm inhibition ability of copper-bearing 304 stainless steel against oral microaerobic Streptococcus mutans. J. Mater. Sci. Technol. 2021, 66, 112–120. [Google Scholar] [CrossRef]
  49. Zhou, Y.; Chen, A.; Ning, J.; Shen, W. Electronic and geometric structure of the copper-ceria interface on Cu/CeO2 catalysts. Chin. J. Catal. 2020, 41, 928–937. [Google Scholar] [CrossRef]
  50. Szabová, L.; Camellone, M.F.; Huang, M.; Matolín, V.; Fabris, S. Thermodynamic, electronic and structural properties of Cu/CeO2 surfa ces and interfaces from first-principles DFT+ U calculations. J. Chem. Phys. 2010, 133, 234705. [Google Scholar] [CrossRef]
  51. Jiang, D.; Wang, W.; Zhang, L.; Zheng, Y.; Wang, Z. Insights into the Surface-Defect Dependence of Photoreactivity over CeO2 Nanocrystals with Well-Defined Crystal Facets. ACS Catal. 2015, 5, 4851–4858. [Google Scholar] [CrossRef]
  52. Jeong, D.W.; Jang, W.J.; Na, H.S.; Shim, J.O.; Jha, A.; Roh, H.S. Comparative study on cubic and tetragonal Cu–CeO2–ZrO2 catalysts for water gas shift reaction. J. Ind. Eng. Chem. 2015, 27, 35–39. [Google Scholar] [CrossRef]
  53. Jin, S.; Byun, H.; Lee, C.H. Enhanced oxygen mobility of nonreducible MgO-supported Cu catalyst by defect engineering for improving the water-gas shift reaction. J. Catal. 2021, 400, 195–211. [Google Scholar] [CrossRef]
  54. Dongil, A.B.; Bachiller-Baeza, B.; Castillejos, E.; Escalona, N.; Guerrero-Ruiz, A.; Rodríguez-Ramos, I. The promoter effect of potassium in CuO/CeO2 systems supported on carbon nanotubes and graphene for the CO-PROX reaction. Catal. Sci. Technol. 2016, 6, 6118–6127. [Google Scholar] [CrossRef]
  55. Chen, Z.; Kronawitter, C.X.; Yang, X.; Yeh, Y.W.; Yao, N.; Koel, B.E. The promoting effect of tetravalent cerium on the oxygen evolution activity of copper oxide catalysts. Phys. Chem. Chem. Phys. 2017, 19, 31545–31552. [Google Scholar] [CrossRef]
  56. Shen, H.; Tang, Z.; Xiao, X.; Wu, H.; Zhou, H.; Fang, P.; Zhu, D.; Ge, J. Catalytic Oxidation of NO by Ozone over Mn-Ce/Al2O3/TiO2 Catalyst. Processes 2022, 10, 1946. [Google Scholar] [CrossRef]
  57. Wang, L.; Zhuang, L.; Xin, H.; Huang, Y.; Wang, D. Semi-Quantitative Estimation of Ce3+/Ce4+ Ratio in YAG: Ce3+ Phosphor under Different Sintering Atmosphere. Open J. Inorg. Chem. 2015, 5, 12. [Google Scholar] [CrossRef]
  58. Chen, S.; Li, L.; Hu, W.; Huang, X.; Li, Q.; Xu, Y.; Zuo, Y.; Li, G. Anchoring High-Concentration Oxygen Vacancies at Interfaces of CeO2–x/Cu toward Enhanced Activity for Preferential CO Oxidation. ACS Appl. Mater. Interfaces 2015, 7, 22999–23007. [Google Scholar] [CrossRef]
  59. Oh, J.; Yoo, J.D.; Kim, K.; Yun, H.J.; Jung, W.; Bae, J. Negative Effects of Dopants on Copper–Ceria Catalysts for CO Preferential Oxidation Under the Presence of CO2 and H2O. Catal. Lett. 2017, 147, 2987–3003. [Google Scholar] [CrossRef]
  60. Pradhan, S.; Reddy, A.S.; Devi, R.N.; Chilukuri, S. Copper-based catalysts for water gas shift reaction: Influence of support on their catalytic activity. Catal. Today 2009, 141, 72–76. [Google Scholar] [CrossRef]
Figure 1. XRD patterns of (n)Cu-CeO2 synthesized through RME method and 20% Cu-CeO2 synthesized through conventional Impregnation method.
Catalysts 13 00951 g001
Figure 2. N2-physisorption isotherms of (n)Cu-CeO2 synthesized through RME method.
Catalysts 13 00951 g002
Figure 3. H2-TPR profiles of (n)Cu-CeO2 synthesized through RME method and 20% Cu-CeO2 synthesized through conventional Impregnation method.
Catalysts 13 00951 g003
Figure 4. Cu 2p XPS spectra of (n)Cu-CeO2 synthesized through RME method and 20% Cu-CeO2 synthesized through conventional Impregnation method.
Catalysts 13 00951 g004
Figure 5. O 1s XPS spectra of (n)Cu-CeO2 synthesized through RME method.
Catalysts 13 00951 g005
Figure 6. Ce 3d XPS spectra of (n)Cu-CeO2 synthesized through RME method.
Catalysts 13 00951 g006
Figure 7. SEM image of (a) 20% Cu-CeO2 synthesized via RME method, and (b) 20% Cu-CeO2 synthesized via conventional Impregnation method.
Catalysts 13 00951 g007
Figure 8. (a) TEM, and (b) HR-TEM images of 20% Cu-CeO2 synthesized via RME method.
Catalysts 13 00951 g008
Figure 9. Catalytic activities of (n)Cu-CeO2 catalysts synthesized via RME method with (a) gas composition without CO2, and (b) gas composition with CO2 (syngas).
Catalysts 13 00951 g009
Figure 10. Comparison of catalytic activity between 20% Cu-CeO2 samples synthesized via RME and conventional Impregnation method and Low temperature commercial WGS catalyst (LTC).
Catalysts 13 00951 g010
Figure 11. Long term catalytic stability of 20% Cu-CeO2 sample synthesized via RME method.
Catalysts 13 00951 g011
Figure 12. Reactor setup diagram and visual key components for Water Gas Shift (WGS) reaction. Where, V = Valve; MFC = Mass Flow Controller; P = Pump for steam source; PC = Program Controller; GC = Gas Chromatography.
Catalysts 13 00951 g012
Table 1. Calculation of average crystallite size of samples from XRD patterns.
SampleAverage Crystallite Size (nm)
10% Cu-CeO29.92
20% Cu-CeO29.70
30% Cu-CeO210.19
40% Cu-CeO210.47
50% Cu-CeO210.55
20% Cu-CeO2(IMP)11.60
Table 2. Surface area and pore properties of (n)Cu-CeO2 samples synthesized via RME method.
SampleBET Surface Area (m2 g−1)Average Pore Diameter (nm)
10% Cu-CeO2100.210.8
20% Cu-CeO2123.113.3
30% Cu-CeO2120.512.0
40% Cu-CeO2118.311.6
50% Cu-CeO2116.49.6
Table 3. H2-TPR profiles of (n)Cu-CeO2 samples synthesized via RME and Impregnation methods.
SampleReduction Temperature (°C)
Reduction of Finely Dispersed CuO Reduction of Cu-Ox-Ce Interaction
10% Cu-CeO2140.0168.4
20% Cu-CeO2110.2143.5
30% Cu-CeO2133.6168.7
40% Cu-CeO2128.9162.1
50% Cu-CeO2133.8168.2
20% Cu-CeO2(IMP)130.0160.4
Table 4. Atomic compositions of (n)Cu-CeO2 synthesized via RME and Impregnation methods.
SampleAtomic Composition (%) *
Cu1+Cu2+Ce3+Ce4+Lattice O2O-Defect
10% Cu-CeO222.6877.3221.0978.9176.3923.61
20% Cu-CeO224.7775.2328.5171.4966.3733.63
30% Cu-CeO222.2777.7326.4073.6079.7520.25
40% Cu-CeO220.7879.2225.2374.7781.3218.68
50% Cu-CeO218.0881.9225.1374.8781.8018.20
20% Cu-CeO2(IMP)17.4382.5721.0778.9383.3316.67
* Calculated from areas of peak deconvolution of XPS diffraction peaks.
Disclaimer/Publisher’s Note: The statements, opinions and data contained in all publications are solely those of the individual author(s) and contributor(s) and not of MDPI and/or the editor(s). MDPI and/or the editor(s) disclaim responsibility for any injury to people or property resulting from any ideas, methods, instructions or products referred to in the content.

