Abstract
The chemical transformation of carbon dioxide (CO2) not only reduces the amount of carbon dioxide emitted into the Earth’s atmosphere by humans, but also produces carbon compounds that can be used as precursors for chemical and fuel production. Herein, a selective catalytic conversion of carbon dioxide to methanol is achieved by a bifunctional molybdenum disulfide catalyst (MoS2) with magnesium oxide and nickel and potassium promoters. Molybdenum disulfide prepared by the supercritical ethanol method has a large specific surface area and presents good catalytic performance with high methanol selectivity when loaded with potassium (K) and nickel (Ni) promoters. In addition, the catalysts were evaluated and it was founded that the addition of the K-promoter improved methanol selectivity. This research provides a new strategy for improved product selectivity and space–time yield (STY) of methanol in CO2 hydrogenation.
1. Introduction
As a greenhouse gas, carbon dioxide (CO2) is closely related to the increase in fossil fuel use for human industry and daily life, as well as climate change, following significant energy consumption [1]. Although scientific and technological progress has contributed to an increasing proportion of clean energy in production, fossil fuel resources, such as coal and oil, play an important role in practical chemical production, and the use of coal and oil resources release huge amounts of carbon dioxide into the atmosphere [2]. The urgent task is to reduce the overuse of fossil resources and control carbon dioxide emissions [3]. In addition, “carbon capture, storage and utilization” are gaining attention, not only for reducing CO2 emissions, but also to use CO2 as an environmentally friendly carbon resource. This technology opens up a new field of transformation from “carbon emissions” to “working carbon”, with important implications for sustainable development [4]. However, it is well known that carbon dioxide is difficult to use because of its thermodynamic stability and low chemical potential. As a result, high-energy hydrogen is often required to convert carbon dioxide into C1 material. In the conversion of various carbon dioxide, hydrogenation is a recognized and feasible method that contributes to sustainable development [5]. Hydrogen can be obtained from photocatalytic water decomposition under sunlight and hydrolysis through electricity generated from renewable energy sources [6]. CO2 can be synthesized into a wide variety of chemicals, such as alcohols, alkenes, aromatics, etc. [7].
Methanol (CH3OH) is an important chemical fuel. Nowadays, the hydrogenation of CO2 to methanol has attracted great interest in scientific research. Shih and colleagues [8] came up with the idea of liquid sunlight, with the hydrogenation of carbon dioxide to methanol as the primary goal [9]. George Olah [8] proposed that the “methanol economy” place the hydrogenation of carbon dioxide to methanol and its derivatives at the theory’s core. Nowadays, methanol is the main raw material of the chemical industry and is widely used in processes such as transforming methanol into olefins and aromatics [10]. Hydrogenation of CO2 to methanol is an attractive and potentially profitable route for “carbon capture, storage and utilization”, reducing CO2 emissions and dependence on fossil resources [11]. The synthesis of CH3OH from CO2 hydrogenation is the reverse process of methanol reforming. In order to prevent side reactions, the reaction must be carried out at a low temperature [12]. The conversion of CO2 to methanol is an exothermic high-pressure reaction. Increasing pressure and decreasing temperature are beneficial to methanol production. However, given the inertness of CO2 and reaction kinetics, temperatures above 240 °C are generally appropriate [13].
In recent years, molybdenum disulfide (MoS2)-based catalysts have been extensively studied in the field of catalytic CO2 reduction due to its high activity and low energy consumption. Two-dimensional MoS2 has a layered structure, which makes it highly anisotropic in electronic, chemical, mechanical, dynamic and other forms. Due to its various advantages in structure and electronic properties, it has great application prospects in catalytic processes such as hydrodesulfurization, catalytic hydrogenation, synthesis of alcohol from syngas and water cracking [7,14,15,16]. Nevertheless, there are still some limitations in the synthesis of methanol via CO2 hydrogenation, such as difficulty in CO2 activation and the formation of C1 by-products (CO and CH4). Saito and Anderson reported that MoS2 was used in CO2 hydrogenation at 350 °C, 1 atm, and H2/CO2 = 3.74 in 1981, where CO was the sole product due to the Reverse Water–Gas Shift Reaction (CO2 + H2→CO + H2O) [17]. A few layers of MoS2 exhibited high catalytic activity for CO2 hydrogenation, but the major product was methane, frequently with selectivity above 95%, and in some cases, close to 100% [18]. Alkali metals have been widely used to improve product selectivity over Mo-based catalysts for CO2 hydrogenation. In general, alkalies can restrain the alkylation reaction by inhibiting the hydrogenation of surface alkyl species (CxHy*), especially CH4 formation [19]. This would give a higher chance to promote the formation of alcohols [20]. Several studies have reported that alkalies play the role of electronic and geometric perspectives in CO2 hydrogenation [21]. Although potassium (K), as an effective alkali promoter, can enhance the methanol selectivity, it can also reduce the activity of the catalyst by blocking the surface-active sites [22]. Additionally, acidic support is more likely to generate hydrocarbons than neutral or alkaline support, while alkaline support, such as magnesium oxide, can be added to the catalyst to neutralize acidic sites and reduce the formation of hydrocarbons. In the hydrogenation of CO2 to methanol, it is difficult to balance catalytic activity and selectivity, which remains a huge challenge. Therefore, the design of efficient heterogeneous catalysts for methanol production from CO2 hydrogenation is of great importance [23].
Here, the nickel (Ni)–MoS2/magnesium oxide (MgO) catalyst and x% K–Ni–MoS2/MgO catalyst were prepared by the supercritical one-pot method with molybdenum disulfide as support and nickel and potassium as promoters, which were used in the hydrogenation of carbon dioxide to methanol. It was founded that the adding of Ni and K as promoters could enhance the catalytic performance of the MoS2-based/MgO catalyst, especially CO2 conversion and CH3OH selectivity. Combined with SEM, BET, CO2/H2-TPD and other characterization techniques, we discuss the influence of catalyst structure on catalytic performance in order to deeply understand the structure–performance relationship and provide clues for the rational design of catalysts with controllable product selectivity.
2. Results and Discussion
2.1. Catalyst Characterization
X-ray diffraction (XRD) detections were performed to reveal the crystal phases of MoS2 and x% K–Ni–MoS2/MgO (x = 0, 2, 6, 9, 10, 11 and 12) catalysts prepared at 400 °C. As shown in Figure 1, the typical characteristic peaks at 14.1°, 32.9°, 39.5°, 44.0° and 58.7° correspond to the (002), (100), (103), (104) and (110) crystal phases of MoS2 over 0–10% K–Ni–MoS2/MgO catalyst, indicating that the prepared catalyst contains molybdenum disulfide [24]. The diffraction peak of molybdenum disulfide is wide and faint, indicating that molybdenum disulfide particles are small and lamellar. However, the characteristic peak of MoS2 disappears when the content of K is over 11%. In addition, the diffraction peaks of magnesium oxide and magnesium carbonate were observed on all catalysts. The related compounds of K are difficult to distinguish in XRD spectra, indicating that it has high dispersion and low metal loading on the catalyst surface. There are characteristic peaks of Ni on all catalysts, corresponding to the (111) crystal phases of Ni.
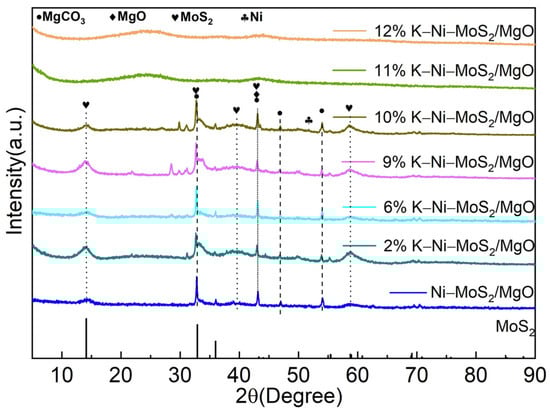
Figure 1.
XRD spectra of MoS2 catalyst to x% K–Ni–MoS2/MgO catalyst (x = 0, 2, 6, 9, 10, 11, 12).
The BET data of the prepared MoS2 and x% K–Ni–MoS2/MgO (x = 0, 2, 6, 9, 10, 11 and 12) catalysts are listed in Table S1. The molybdenum disulfide catalyst prepared by the supercritical method has a large specific surface area of 160 m2/g, which provides a larger surface for the loading of subsequent additives. The magnesium oxide carrier was obtained by calcining magnesium carbonate under 700 °C, and its specific surface area was low. Therefore, the specific surface area of composite catalysts (x% K–Ni–MoS2/MgO) were reduced by using magnesia as the carrier in the one-pot process. Specifically, when molybdenum disulfide is loaded with nickel oxide, the specific surface area decreases by nearly half, and when MgO is added, the specific surface area decreases from 83.8 to 6.2 m2/g. After adding 6% K content, the specific surface area of 6% K–Ni–MoS2/MgO catalyst is further decreased to 4.1 m2/g.
The catalysts were further characterized by SEM micrographs. As seen in Figure 2a, the prepared MoS2 catalyst is spherical and MoS2 nanocomposites are comparable to lamella morphology [25]. From 10% K–Ni–MoS2/MgO catalyst, the prepared MoS2 is a random stack of many nanosheets (Figure 2b). Furthermore, the petals are similar in shape and spherical, and the diameter of the petals is between 100 and 300 nanometers. From the elemental mapping pictures, it can be seen that the Ni/K additive is uniformly distributed on the 10% K–Ni–MoS2/MgO catalyst (Figure S1). Nevertheless, it can be observed that the particles aggregate on the carrier, and the morphology of MoS2 disappears in the SEM image (Figure 2c) of the 11% K–Ni–MoS2/MgO catalyst [26].
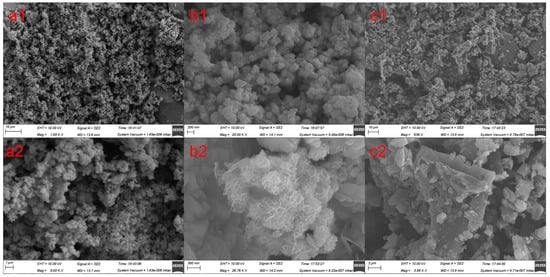
Figure 2.
SEM micrographs for MoS2 (a1): 10 μm and (a2): 1 μm, 10% K–Ni–MoS2/MgO (b1): 200 nm and (b2): 300 nm, and 11% K–Ni–MoS2/MgO (c1): 10 μm and (c2): 2 μm.
In order to further elucidate the structure of the catalyst, transmission electron microscopy (TEM) and high-resolution transmission electron microscopy (HRTEM) analysis were performed (Figure 3). From the MoS2 and 10% K–Ni–MoS2/MgO catalyst, in Figure 3(a1,b1), the MoS2 particles showed a long and uniform multilayer structure. However, no similar phenomena were observed in the 11% K–Ni–MoS2/MgO catalyst. Additionally, the HRTEM images of the MoS2 and 10% K–Ni–MoS2/MgO catalyst (Figure 3(a2,b2)) showed the surface has clear lattice fringes with characteristic lattice spacing of 0.62 nm, corresponding to the (002) crystal planes of different MoS2 crystals. In addition, clear lattice streaks of Ni are observed on the 10% K–Ni–MoS2/MgO catalyst (Figure S2). The SAED patterns (Figure 3(a3,b3)) also demonstrate the low crystallinity of MoS2. Meanwhile, it is difficult to observe the lattice fringes of MoS2 in the 11% K–Ni–MoS2/MgO catalyst. This result was consistent with the XRD characterization, indicating that excessive K content may disrupt the formation of a multilayered structure of MoS2 particles [27].
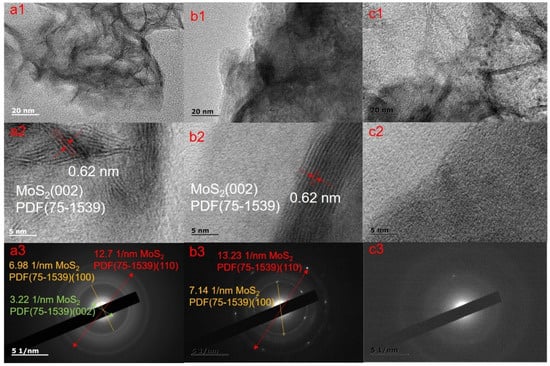
Figure 3.
TEM, HRTEM and SAED (5/1 nm) images of the synthesized catalysts: (a1–a3) MoS2; (b1–b3) 10% K–Ni–MoS2/MgO catalyst; (c1–c3) 11% K–Ni–MoS2/MgO catalyst.
2.2. Catalytic Performance Study
The addition of basic elements (K) is helpful to the selective hydrogenation of carbon dioxide to prepare methanol, and can improve the adsorption or activation of the carrier for weakly acidic CO2. The 0% to x% K–Ni–MoS2/MgO catalysts were evaluated for CO2 hydrogenation reaction under the conditions of 5 MPa, H2/CO2 = 3, 5000 mL/(gcat·h) and 320 °C. As seen in Figure 4, the conversion rate of carbon dioxide gradually increases from 17.6% in the Ni–MoS2/MgO catalyst to 41.2% at 12% K–Ni–MoS2/MgO catalyst. In terms of space–time yield of methanol (STYmethanol), the K–Ni–MoS2/MgO catalyst can reach 13.3 gmethanolkgcat−1h−1 in the absence of K content. As the K content increases, the STYmethanol of x% K–Ni–MoS2/MgO increases to a maximum of 19 gmethanolkgcat−1h−1 at 10%K, and then decreases. As shown in Figure 4c, the methanol selectivity exhibits a volcanic trend with the increase of K content. When the amount of K added was less than 6%, the methanol selectivity decreased and the by-products (CO and CH4) increased, especially CO, demonstrating that a small amount of K might enhance the RWGS reaction (CO2 + H2→CO + H2O), thereby resulting in the decrease of STYmethanol from 13.25 to 3.09. When K content is 10% K, the 10% K–Ni–MoS2/MgO catalyst displays the highest methanol selectivity, approximately 19.9. Furthermore, the CO selectivity decreased from 69.1 to 7.5 as the K content increased. For 2% K–Ni–MoS2/MgO catalyst, the selectivity of methane is approximately 9%, and increasing the proportion of K can be observed to significantly reduce the selectivity of methane, reaching the lowest 1.16%, which promotes the formation of methanol in the forward reaction. For methanol synthesis, low methane selectivity is often required. CH4 is commonly reported as a secondary by-product in the hydrogenation of carbon dioxide to methanol [3,28,29,30]. However, less attention has been paid to CH4 due to its low selectivity (less than 1%), which may lead to the misconception that it is not important, but this may limit the application of carbon dioxide and green hydrogen in CH3OH-synthesis plants.
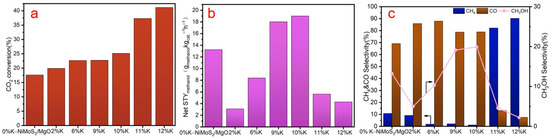
Figure 4.
Changes in CO2 conversion (a), STY of CH3OH (b) and product selectivity (c) of 0% to 12% K–Ni–MoS2/MgO catalyst at 320 °C. (Reaction conditions: 5 MPa, 320 °C, 5000 mL/(gcat·h) and H2/CO2 = 3:1).
3. Discussion of Structure-Performance Relationship
3.1. H2-TPD and H2-TPR Analysis
To further explore the hydrogenation ability over MoS2-based catalysts, the actual adsorption behaviors of H2 were examined through an H2-TPD (temperature-programmed desorption of H2) experiment and presented in Figure 5a. The general desorption hydrogen peak is attributed to the strongly attached hydrogen at the MoS2 site in the range of 450~650 °C [31]. As the K content increased, the hydrogen desorption temperature decreased, suggesting that the hydrogen adsorption capacity was weakened. This result demonstrated that the adding of K can suppress the adsorption of H2. Meanwhile, it can be shown that the H2 desorption area of x% K–Ni–MoS2/MgO catalyst generally increases with the increase of K content, demonstrating that the higher K content may improve the CO2 conversion, which was in agreement with the result of catalytic performance. Additionally, the hydrogen reduction behavior over MoS2-based catalysts was investigated by the H2-TPR (temperature-programmed reduction of H2) experiment (Figure 5b). The whole temperature range can be divided into three regions. The low-temperature region (200–420 °C) corresponds to the reversible hydrogen adsorption on MoS2. The middle-temperature region (420–580 °C) is ascribed to the surface S reduction of MoS2, and the high-temperature region (>580 °C) is mainly responsible for the large number of sulfur vacancies produced in the bulk of MoS2 [32]. It can be seen that the higher K content can slightly suppress reduction of H2, which is in accordance with the above H2-TPD results.
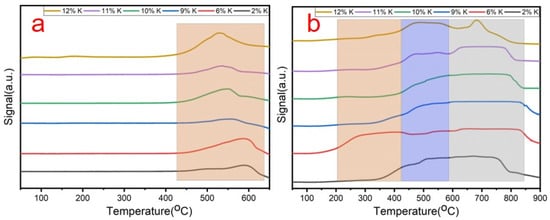
Figure 5.
The H2-TPD (a) and H2-TPR (b) analyses of the MoS2-based catalysts.
3.2. CO2-TPD and CO-TPD Analysis
The details of CO2 and CO adsorption behavior were obtained by the CO2- and CO-TPD (temperature-programmed desorption of CO2 and CO) experiment (Figure 6a,b). As shown in Figure 6a, the CO2 desorption peaks of high temperature are noticeable, and are designated as the strong CO2 adsorption. With the increase of K content, the CO2 adsorption strength over x% K–Ni–MoS2/MgO catalysts were generally enhanced. In contrast to the x% K–Ni–MoS2/MgO catalysts, the 10% K–Ni–MoS2/MgO catalyst shows the highest temperature of CO2 adsorption, demonstrating that it displays strong basic sites which is conducive to methanol synthesis [33]. In addition, to further clarify the actual CO desorption behavior, the CO-TPD experiment was conducted (Figure 6b). All x% K–Ni–MoS2/MgO catalysts show an obvious CO desorption zone around 350–800 °C in CO-TPD curves (see Figure 6b). Moreover, the desorption zone of high temperature is attributed to the CO dissociation. In addition, the adsorption temperature of the investigated catalyst decreases with the increase of K content, suggesting that the CO can be easily dissociated under higher K content which may enhance the formation of CH4. The above results are consistent with the catalytic performance.
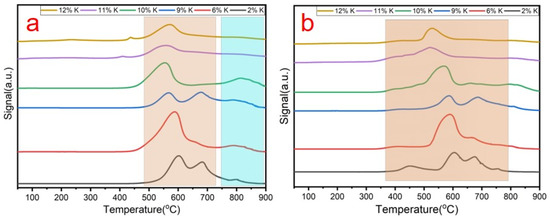
Figure 6.
The CO2-TPD (a) and CO-TPD (b) analysis of the MoS2-based catalysts.
3.3. Influence of K and Ni Additives on Catalytic Performance
The mechanism of promoters affecting the activity and selectivity of low alcohol catalysts is an electronic effect and a structural effect, that is, the promoters interact with the structure of electrons and active components. In addition, the additives can also play an auxiliary role in the “misalignment” between the support and the active metal, change the dispersion of the active ingredient, reduce the coordination number of the active atom, help form the active center, and then affect the performance of the catalyst [34]. The addition of promoter Ni to the catalyst shows high hydrogenation activity. When the adsorption of H2 molecules on Ni surface is in the process of physical adsorption, it can be converted into chemical adsorption, as long as a little activation energy is provided. In addition, Ni has a good selectivity for CO2, which has a good role in promoting the hydrogenation of carbon dioxide to methanol. As shown Table S2, the MoS2 catalyst produces a large amount of methane in the CO2 hydrogenation reaction, which is unfavorable for the synthesis of methanol (methanol selectivity, approximately 1%). After addition of auxiliary Ni, the selectivity of methane was reduced and the selectivity of methanol was enhanced over Ni–MoS2/MgO catalyst. Alkali metal K can improve the anti-carbon deposition ability of the catalyst by alkali doping, which is conducive to the uniform distribution of active components, and can also increase the specific surface area of the catalyst and inhibit internal diffusion control. Therefore, adding K to the catalyst has a good catalytic effect. The catalytic performance results of 0% to 10% K–Ni–MoS2/MgO catalyst at 320 °C was confirmed.
4. Materials and Methods
4.1. Reagents
Ammonium molybdate ((NH4)6Mo7O24), carbon disulfide and nickel acetate were purchased from Tianjin Fuyu Fine Chemical Co., Ltd. (Tianjin, China), Kaida Chemical Plant Co., Ltd. (Baoji, China) and Aladdin Co., Ltd. (Shanghai, China), respectively.
4.2. Catalyst Preparation
Preparation of MgO. First, a 2 mol/L magnesium nitrate solution and a 2 mol/L potassium carbonate solution were prepared. The above two solutions were added in parallel by using a peristaltic pump to precipitate, and then were aged in a 70 °C water bath for 2 h after precipitation. Finally, the resulting precipitates were calcined in a tubular furnace under nitrogen atmosphere at 700 °C to obtain MgO.
Preparation of Ni–MoS2/MgO catalyst. A 4.398 g ammonium molybdate tetrahydrate was dissolved in 20 mL deionized water to form a homogeneous solution. The above homogeneous solution, 15 mL CS2, 2 g MgO and 1.476 g nickel were acetated in the high-temperature reactor; the gas was added in the reactor with 2 MPa pressure Ar atmosphere and maintained at 400 °C for 4 h. The catalyst was prepared by alkaline washing with sodium hydroxide solution and stirred in a 60 °C water bath for three hours. It was then centrifuged 3–5 times and alternated with water and ethanol until the pH was 7–8. The catalyst was dried at 90 °C; the dried catalyst was then placed in the tube furnace and activated by hydrogen for 3 h at 300 °C with an activation temperature rise rate of 2 °C/min. Then, the activated catalyst was obtained.
Preparation of x% K–Ni–MoS2/MgO catalyst. The Ni–MoS2/MgO catalyst was weighed at 3 g. Different masses of anhydrous potassium carbonate were weighed and added to the appropriate amount of deionized water to form a homogeneous solution. The homogeneous solution and the Ni–MoS2/MgO catalyst were mixed and stirred continuously for 5–10 min. The stirred catalyst was placed into a blast-drying oven for overnight drying at 90 °C. Following that, the dried catalyst was placed into the tube furnace and activated by hydrogen for 3 h at 300 °C with an activation temperature rise rate of 2 °C/min. Then, the activated x% K–Ni–MoS2/MgO catalyst was obtained.
4.3. Characterization
The specific surface area and porosity of the samples were analyzed by the AutosorbiQMP low-temperature nitrogen adsorption instrument. The surface morphology of the samples was investigated by scanning electron microscope (SEM) (Fena World Corporation Quanta 250). An X-ray diffractometer (XRD) was used to determine the fabricated materials’ crystalline structure (scanning range of 5–90°), with an operating voltage of 40 kV and an operating current of 40 mA. Temperature-programmed reduction (TPR) and desorption (TPD) of the catalysts were tested by a Micromeritics Chemisorb 2720 TPD/TPR apparatus. H2-TPD experiments were performed using TCD on a Micromeritics Chemisorb 2720. Briefly, 100 mg samples were reduced in a 10 H2/Ar flow at 400 °C for 3 h and then cooled to 50 °C in an Ar flow. The sample was then saturated with pure H2 at 50 °C at 50 mL/min for 1 h, followed by the removal of physically adsorbed H2 molecules by argon flow for 1 h. Subsequently, argon gas was flowing at 50 mL/min and the heating rate was 10 °C/min at 50~900 °C. Finally, the desorption spectra of the samples were detected by a quadrupole mass spectrometer, performing continuous tracking and recording of MS signals (CO/H2/CO2, m/z = 28/2/44). H2-TPR experiments were performed on a Micromeritics Chemisorb 2720 containing TCD. The samples were first pretreated in argon at 350 °C for 1 h to remove adsorbed moisture and impurities. After cooling to 50 °C, a reducing gas (10% H2/Ar) was introduced at a flow rate of 50 mL/min. The signal of hydrogen consumption at 50~900 °C was recorded by TCD. CO2 temperature-programmed desorption (CO2-TPD) was performed in a quartz U-tube reactor, using a 100 mg powder catalyst. Prior to measurement, the sample was pretreated in an N2 flow (40 mL/min) at 500 °C for 1 h. After the reactor was cooled to 30 °C, a flow of CO2/N2 mixed gas (V(CO2)/V(N2) = 50/50, 40 mL/min) was passed through the sample for 0.5 h to achieve the adsorption equilibrium. After 1 h of He flush (30 mL/min) at 100 °C, the sample was heated (10 °C/min) up to 900 °C under flowing He (30 mL/min). CO-TPD studies were performed in a conventional atmospheric pressure quartz flow reactor with He (40 mL/min) as the carrier gas. The sample was pretreated in the same way as for CO2-TPD, then purged with He until the baseline was steady. Then, the TPD test was conducted by increasing the temperature to 900 °C at a heating rate of 10 °C/min. The microstructure of the catalyst was observed by transmission electron microscopy (TEM) on a JEM-2100.
4.4. Catalyst Evaluation
One g of catalyst was loaded into the constant temperature zone of the reactor, and 10% H2/N2 at 5 L/h passed to reduce it for 3 h at 300 °C under normal pressure. After cooling to room temperature, the atmosphere was converted into H2/CO2 = 3:1, pressurized to 5 MPa, and heated to the required reaction temperature at a gas flow rate of 5 L/h. All data points were collected 24 h after venting, the reaction tail gas was sent to Beifen Gas Chromatography for continuous detection, and the alcohol and water phase products were collected through a cold trap. The mass balance and carbon balance were calculated and kept between 98% and102%.
For the analysis of raw gas and tail gas by gas chromatography, H2, CO, CH4 and CO2 were separated by carbon molecular sieve column with nitrogen as carrier gas, and detected by TCD. The hydrocarbons in the tail gas were separated by the modified Al2O3 column, in which argon was used as carrier gas and hydrogen FID was used for detection. Shimazu gas chromatography was used to detect the products of alcohol water phase, in which nitrogen was used as carrier gas.
The CO2 conversion rate and product selectivity were calculated using Equations (1)–(4). The CO2 conversion rate is expressed as , the selectivity of products CO, CH4, CH3OH is expressed as , , . , , and are the peak area of CO2 and N2 signals at the inlet and tail. The and are the correction factor for CO2 and N2. and are the correction coefficients of exhaust signal response area and CO in turn. and represent the molar concentrations of CH4 and CH3OH tail gas, respectively. and are the number of moles of CO2 inlet and exhaust gas [27].
In addition, the space–time yield (STY) of CH3OH was calculated according to the following Equation (5):
where is the volumetric flow rate of CO2, is the molecular weight of CH3OH, Vm is the molar volume of ideal gas under standard condition (22.414 L/mol), is the mass of catalyst, and is the yield of CH3OH.
5. Conclusions
MoS2 catalyst prepared by the supercritical method has a large specific surface area, and the MoS2/MgO catalyst prepared by this method has a strong bond-breaking ability for carbon dioxide, as well as a good regularity in the hydrogenation of carbon dioxide to methanol. Compared with the MoS2 catalyst, the MoS2/MgO catalysts after the adding of K and Ni promoter displayed a higher conversion rate of carbon dioxide and the selectivity of methanol. As the K content increased, the space–time yield of methanol and methanol selectivity exhibited a volcanic trend. When K was 10%, the selectivity of methanol and STYmethanol was up to 19.93% and 19 gmethanolkgcat−1h−1, respectively. Meanwhile, the methane selectivity showed inverted volcanic changes, reaching its lowest (1.1) at 10% of K content. Combining the H2/CO2/CO-TPD and the H2-TPR characterization, the K and Ni promoter affect the adsorption behavior, thereby improving catalytic performance of MoS2/MgO catalysts. This provides important basic research for the subsequent modification of catalysts.
Supplementary Materials
The following supporting information can be downloaded at: https://www.mdpi.com/article/10.3390/catal13071030/s1, Figure S1: Elemental mapping of the 10% K–Ni–MoS2/MgO catalyst. Figure S2: The Ni HRTEM images of the 10% K–Ni–MoS2/MgO catalysts. Table S1: BET data of each catalyst. Table S2: Catalytic performance data of MoS2 catalyst.
Author Contributions
Writing—original draft preparation, S.J.; methodology and investigation, Y.R. and S.M.; formal analysis, Y.Z. and Q.S.; conceptualization, C.H. and Y.W.; validation, S.J. and X.L. All authors have read and agreed to the published version of the manuscript.
Funding
This work was supported by grants from the Outstanding Foreign Scientists Studio of Coal Green Conversion of Henan Province (GZS2020012), and National Natural Science Foundation of China Youth Fund (22208085).
Data Availability Statement
The data is true and reliable.
Acknowledgments
The authors are grateful to Henan Polytechnic University for providing the characterization equipment for this study.
Conflicts of Interest
The authors declare no conflict of interest.
References
- De Cian, E.; Sue Wing, I. Global Energy Consumption in a Warming Climate. Environ. Resour. Econ. 2017, 72, 365–410. [Google Scholar] [CrossRef]
- Sha, F.; Han, Z.; Tang, S.; Wang, J.; Li, C. Hydrogenation of Carbon Dioxide to Methanol over Non-Cu-based Heterogeneous Catalysts. ChemSusChem 2020, 13, 6160–6181. [Google Scholar] [CrossRef]
- Liang, X.-L.; Dong, X.; Lin, G.-D.; Zhang, H.-B. Carbon nanotube-supported Pd–ZnO catalyst for hydrogenation of CO2 to methanol. Appl. Catal. B Environ. 2009, 88, 315–322. [Google Scholar] [CrossRef]
- Artz, J.; Muller, T.E.; Thenert, K.; Kleinekorte, J.; Meys, R.; Sternberg, A.; Bardow, A.; Leitner, W. Sustainable Conversion of Carbon Dioxide: An Integrated Review of Catalysis and Life Cycle Assessment. Chem. Rev. 2018, 118, 434–504. [Google Scholar] [CrossRef]
- Makri, M.; Symillidis, A.; Grigoriou, D.; Katsaounis, A.; Vayenas, C. Electrochemical Promotion of CO2 Reduction on a Dispersed Ru/YSZ Catalyst Supported on YSZ Solid Electrolyte. Mater. Today Proc. 2018, 5, 27617–27625. [Google Scholar] [CrossRef]
- Zhao, Y.; Ding, C.; Zhu, J.; Qin, W.; Tao, X.; Fan, F.; Li, R.; Li, C. A Hydrogen Farm Strategy for Scalable Solar Hydrogen Production with Particulate Photocatalysts. Angew. Chem. Int. Ed. Engl. 2020, 59, 9653–9658. [Google Scholar] [CrossRef]
- Wang, J.; Li, G.; Li, Z.; Tang, C.; Feng, Z.; An, H.; Liu, H.; Liu, T.; Li, C. A highly selective and stable ZnO-ZrO2 solid solution catalyst for CO2 hydrogenation to methanol. Sci. Adv. 2017, 3, e1701290. [Google Scholar] [CrossRef] [PubMed]
- Olah, G.A. Beyond oil and gas: The methanol economy. Angew. Chem. Int. Ed. Engl. 2005, 44, 2636–2639. [Google Scholar] [CrossRef]
- Shih, C.F.; Zhang, T.; Li, J.; Bai, C. Powering the Future with Liquid Sunshine. Joule 2018, 2, 1925–1949. [Google Scholar] [CrossRef]
- Olah, G.A.; Goeppert, A.; Prakash, G.K.S. Chemical Recycling of Carbon Dioxide to Methanol and Dimethyl Ether: From Greenhouse Gas to Renewable, Environmentally Carbon Neutral Fuels and Synthetic Hydrocarbons. J. Org. Chem. 2009, 74, 487–498. [Google Scholar] [CrossRef]
- Zhang, Z.; Wang, T.; Blunt, M.J.; Anthony, E.J.; Park, A.-H.A.; Hughes, R.W.; Webley, P.A.; Yan, J. Advances in carbon capture, utilization and storage. Appl. Energy 2020, 278, 115627. [Google Scholar] [CrossRef]
- Ren, M.; Zhang, Y.; Wang, X.; Qiu, H. Catalytic Hydrogenation of CO2 to Methanol: A Review. Catalysts 2022, 12, 403. [Google Scholar] [CrossRef]
- Ma, J.; Sun, N.; Zhang, X.; Zhao, N.; Xiao, F.; Wei, W.; Sun, Y. A short review of catalysis for CO2 conversion. Catal. Today 2009, 148, 221–231. [Google Scholar] [CrossRef]
- Tang, Q.; Shen, Z.; Huang, L.; He, T.; Adidharma, H.; Russell, A.G.; Fan, M. Synthesis of methanol from CO(2) hydrogenation promoted by dissociative adsorption of hydrogen on a Ga(3)Ni(5)(221) surface. Phys. Chem. Chem. Phys. 2017, 19, 18539–18555. [Google Scholar] [CrossRef]
- Ye, J.; Liu, C.; Mei, D.; Ge, Q. Active Oxygen Vacancy Site for Methanol Synthesis from CO2 Hydrogenation on In2O3(110): A DFT Study. ACS Catal. 2013, 3, 1296–1306. [Google Scholar] [CrossRef]
- Martin, O.; Martin, A.J.; Mondelli, C.; Mitchell, S.; Segawa, T.F.; Hauert, R.; Drouilly, C.; Curulla-Ferré, D.; Pérez-Ramírez, J. Indium Oxide as a Superior Catalyst for Methanol Synthesis by CO2 Hydrogenation. Angew. Chem. Int. Ed. Engl. 2016, 55, 6261–6265. [Google Scholar] [CrossRef] [PubMed]
- Saiyo, M.; Anderson, R.B. The activity of several molybdenum compounds for the methanation of CO2. J. Catal. 1981, 67, 296–302. [Google Scholar]
- Primo, A.; He, J.; Jurca, B.; Cojocaru, B.; Bucur, C.; Parvulescu, V.I.; Garcia, H. CO2 methanation catalyzed by oriented MoS2 nanoplatelets supported on few layers graphene. Appl. Catal. B Environ. 2019, 245, 351–359. [Google Scholar] [CrossRef]
- Ding, M.; Tu, J.; Qiu, M.; Wang, T.; Ma, L.; Li, Y. Impact of Potassium Promoter on Cu-Fe Based Mixed Alcohols Synthesis Catalyst. Appl. Energy 2015, 138, 584–589. [Google Scholar] [CrossRef]
- Xu, D.; Ding, M.; Hong, X.; Liu, G. Mechanistic Aspects of the Role of K Promotion on Cu–Fe-Based Catalysts for Higher Alcohol Synthesis from CO2 Hydrogenation. ACS Catal. 2020, 10, 14516–14526. [Google Scholar] [CrossRef]
- Bandoa, K.K.; Sogab, K.; Kunimorib, K.; Arakawa, H. Effect of Li additive on CO2 hydrogenation reactivity of zeolite supported Rh catalysts. Appl. Catal. A Gen. 1998, 175, 67–81. [Google Scholar] [CrossRef]
- Morrill, M.R.; Thao, N.T.; Agrawal, P.K.; Jones, C.W.; Davis, R.J.; Shou, H.; Barton, D.G.; Ferrari, D. Mixed MgAl Oxide Supported Potassium Promoted Molybdenum Sulfide as a Selective Catalyst for Higher Alcohol Synthesis from Syngas. Catal. Lett. 2012, 142, 875–881. [Google Scholar] [CrossRef]
- Yang, C.; Mu, R.; Wang, G.; Song, J.; Tian, H.; Zhao, Z.-J.; Gong, J. Hydroxyl-mediated ethanol selectivity of CO2 hydrogenation. Chem. Sci. 2019, 10, 3161–3167. [Google Scholar] [CrossRef] [PubMed]
- Hu, J.; Yu, L.; Deng, J.; Cheng, K.; Ma, C.; Zhang, Q.; Wen, W.; Yu, S.; Pan, Y.; Yang, J.; et al. Sulfur vacancy-rich MoS2 as a catalyst for the hydrogenation of CO2 to methanol. Nat. Catal. 2021, 4, 242–250. [Google Scholar] [CrossRef]
- Khan, M.I.; Hasan, M.S.; Bhatti, K.A.; Rizvi, H.; Wahab, A.; Rehman, S.U.; Afzal, M.J.; Nazneen, A.; Nazir, A.; Iqbal, M. Effect of Ni doping on the structural, optical and photocatalytic activity of MoS2, prepared by Hydrothermal method. Mater. Res. Express 2020, 7, 015061. [Google Scholar] [CrossRef]
- Ai, X.; Fan, H.; Wang, Y.; Guo, Y.; Liu, X.; Yang, L.; Liu, H.; Yang, J. XPS and Raman study of the active-sites on molybdenum disulfide nanopetals for photocatalytic removal of rhodamine B and doxycycline hydrochlride. RSC Adv. 2018, 8, 36280–36285. [Google Scholar] [CrossRef]
- Cui, P.; Sun, R.; Xiao, L.; Wu, W. Exploring the Effects of the Interaction of Carbon and MoS2 Catalyst on CO2 Hydrogenation to Methanol. Int. J. Mol. Sci. 2022, 23, 5220. [Google Scholar] [CrossRef]
- Iwasa, N.; Suzuki, H.; Terashita, M.; Arai, M.; Takezawa, N. Methanol synthesis from CO2 under atmospheric pressure over supported Pd catalysts. Catal. Lett. 2004, 96, 75–78. [Google Scholar] [CrossRef]
- Díez-Ramírez, J.; Sánchez, P.; Valverde, J.L.; Dorado, F. Electrochemical promotion and characterization of PdZn alloy catalysts with K and Na ionic conductors for pure gaseous CO2 hydrogenation. J. CO2 Util. 2016, 16, 375–383. [Google Scholar] [CrossRef]
- Xu, J.; Su, X.; Liu, X.; Pan, X.; Pei, G.; Huang, Y.; Wang, X.; Zhang, T.; Geng, H. Methanol synthesis from CO2 and H2 over Pd/ZnO/Al2O3: Catalyst structure dependence of methanol selectivity. Appl. Catal. A Gen. 2016, 514, 51–59. [Google Scholar] [CrossRef]
- Zhao, L.; Li, Y.; Liu, X.; Fang, K. Low-temperature synthesis of high-performance nano-MoS2-based catalyst via non-thermal plasma for higher alcohol synthesis from syngas. Catal. Today 2019, 355, 17–25. [Google Scholar] [CrossRef]
- Chen, B.; Zhang, Q.; Zhao, P.; Cen, M.; Song, Y.; Zhao, W.; Peng, W.; Li, Y.; Zhang, F.; Fan, X. Coupled Co-Doped MoS2 and CoS2 as the Dual-Active Site Catalyst for Chemoselective Hydrogenation. ACS Appl. Mater. Interfaces 2023, 15, 1317–1325. [Google Scholar] [CrossRef] [PubMed]
- Krishnan, P.S.; Neelaveni, M.; Tamizhdurai, P.; Mythily, M.; Mohan, S.K.; Mangesh, V.; Shanthi, K. COx-free hydrogen generation via decomposition of ammonia over al, Ti and Zr¡Laponite supported MoS2 catalysts. Int. J. Hydrogen Energy 2020, 45, 8568–8583. [Google Scholar] [CrossRef]
- Xiang, M.; Li, D.; Xiao, H.; Zhang, J.; Li, W.; Zhong, B.; Sun, Y. K/Ni/β-Mo2C: A highly active and selective catalyst for higher alcohols synthesis from CO hydrogenation. Catal. Today 2008, 131, 489–495. [Google Scholar] [CrossRef]


Disclaimer/Publisher’s Note: The statements, opinions and data contained in all publications are solely those of the individual author(s) and contributor(s) and not of MDPI and/or the editor(s). MDPI and/or the editor(s) disclaim responsibility for any injury to people or property resulting from any ideas, methods, instructions or products referred to in the content. |
© 2023 by the authors. Licensee MDPI, Basel, Switzerland. This article is an open access article distributed under the terms and conditions of the Creative Commons Attribution (CC BY) license (https://creativecommons.org/licenses/by/4.0/).