Article

Size Effect on Diffusion and Catalytic Performance of Mordenite in Dimethyl Ether Carbonylation

1
Key Laboratory for Green Chemical Technology of Ministry of Education, School of Chemical Engineering and Technology, Tianjin University, Tianjin 300350, China
2
Haihe Laboratory of Sustainable Chemical Transformations, Tianjin 300350, China
3
Zhejiang Institute of Tianjin University, Ningbo 315201, China
4
College of Chemistry, Nankai University, Tianjin 300350, China
*
Author to whom correspondence should be addressed.
These authors contributed equally to this work.
Catalysts 2023, 13(7), 1049; https://doi.org/10.3390/catal13071049
Submission received: 22 May 2023 / Revised: 18 June 2023 / Accepted: 20 June 2023 / Published: 29 June 2023
(This article belongs to the Section Catalytic Reaction Engineering)

Abstract

:
The carbonylation of dimethyl ether (DME) to produce methyl acetate (MA) has a promising prospect in industry. Mordenite (MOR) has been widely studied due to its excellent catalytic activity and high MA selectivity; however, its microporous characteristic limits the intracrystalline diffusion that influences the activity and stability. Therefore, it becomes essential to clarify the relationship between catalytic activity and diffusion. In this study, a series of MOR samples with similar Si/Al contents and aspect ratios, but different sizes, were successfully synthesized by adjusting the synthesis parameters (Si/Al contents in gel, aging time, the amount of water, and alkalinity). Based on quantitative analysis of acid properties and catalyst evaluation, both the apparent turnover frequency of MA (TOFMA) and the stability decrease with the increase in particle size. Diffusion parameter measurements and kinetic analysis via zero length column methods show that the intracrystalline diffusion restriction becomes more serious with increasing particle size. The larger the MOR crystals with enhanced mass transfer limitation that undergo lower activity, the higher the selectivity of byproducts, as well as the faster their deactivation.

Graphical Abstract

1. Introduction

Carbonylation is a typical and important reaction for carbon-chain growth, which usually has high atom economy and mild reaction conditions. The carbonylation of dimethyl ether (DME) is an efficient way to produce methyl acetate (MA), which is an organic intermediate and solvent. This reaction is also a key step in producing ethanol from syngas, which drew much attention in recent years [1,2]. Solid acids, such as heteropoly acids and zeolites, are capable of catalyzing the carbonylation of DME, in which Brønsted acid sites (BASs) are proven to function as active sites [3]. After methyl species generating on the BASs via DME dissociation, CO inserts into methyl groups to form acetyl intermediates, with this stage being the rate-determining step. Subsequently, the surface acetyl groups react with another DME molecule to form methyl acetate. Among the reported solid acid catalysts, mordenite (MOR) is currently the most promising catalyst for DME carbonylation due to its high selectivity for MA (~99%) and outstanding reactivity [4,5].
MOR is a porous aluminosilicate, with one-dimensional 8- (8-MR, 2.6 × 5.7 Å) and 12-membered ring (12-MR, 6.5 × 7.0 Å) pore channels along the c-axis, as well as 8-MR side pockets (3.4 × 4.8 Å) along the b-axis. Numerous studies established that BASs in 8-MR are the active sites because the spatial confinement of 8-MR reduces the energy of the transition state and stabilizes the acetyl intermediate [5,6,7]. Therefore, the MA formation rate is proportional to the number of BASs in 8-MR in a lot of published works [8]. Meanwhile, increasing the quantity and strength of BASs in 8-MR was demonstrated as an efficient strategy to boost the DME carbonylation reactivity [9,10,11,12,13,14]. On the other hand, the BASs located in 12-MR with larger sizes allow for carbon deposition and lead to catalyst deactivation [15,16,17,18].
Although the one-dimension straight channels of MOR are relatively large compared to other zeolites (e.g., FER, CHA, etc.), it is still noteworthy that the microporous characteristics of MOR hinder the accessibility of active sites and limit internal diffusion, resulting in negative effects on catalytic performance. Many researchers are dedicated to boosting the DME carbonylation by adjusting crystal morphology [19,20,21,22] and modulating pore structure [23,24]. Both top-down and bottom-up strategies are employed to promote mass transfer within the zeolite crystals and, thus, enhance the catalytic performance. The former method typically involves post-treatment, such as steaming treatment, acid or alkali treatment, etc., while the latter method applies specific structure-directing agents to obtain nanoscale zeolites. Shen et al. reported a one-step hydrothermal synthesis technique to produce MOR that ranged in size from 50 to 100 nm [25]. The obtained nanoscale MOR shows dramatically enhanced activity and stability in DME carbonylation processes compared to commercial micron-scale MOR. Subsequently, through means of mono-quaternary ammonium surfactants, they achieved the synthesis of 20–40 nm MOR nanosheets, in which the intracrystalline diffusion path was greatly shortened, leading to an acceleration in the activity [20]. Li et al. reported a facile method for synthesizing nanosheet MOR without using organic templates. The specific morphology facilitated the migration of carbonaceous precursors to the external surface of MOR and dramatically promotes catalyst stability [21]. In our previous work, the MOR morphology was successfully tuned (e.g., assembled nanosheets, bundles and flower-like MOR) using cetyltrimethylammonium bromide as a growth modifier [19]. TG results confirmed that the enhanced DME diffusion dependent on morphology boosted the DME carbonylation. Sheng et al. synthesized a series of hierarchical zeolites by employing n-butylamine and polyacrylamide as soft templating agents [26]. Consequently, the BASs in the 12-MR reduced, while the improved mass transfer efficiency inhibited the formation of carbon deposits. Wang et al. created mesopores in MOR via treatment in NaOH solution [24]. The promotion of diffusion and fewer acid sites in 12-MR significantly delayed the deactivation rate, while carbonylation reactivity hardly changed because the template protected the BASs in 8-MR during the treatment. Liu et al. created mesopores in MOR after its gentle etching in NH4F solution [23]. The hierarchical structure promoted both the diffusion of DME and coke precursors. Eventually, the coke formation rate and diffusion rate might together contribute to the volcano-like deactivation rate. In summary, it was established that diffusion had a crucial role in activity and stability [19,20,21,22,23,24]. Nevertheless, the correlation between mass transfer and catalytic properties in the literature is mainly based on qualitative analysis. Therefore, a detailed quantitative description of the diffusion effects through the implementation of diffusion kinetic study is critical for gaining a thorough comprehension of the DME carbonylation reaction and guiding the design of zeolite catalysts with high MA yield.
In this study, we aim to elucidate the size effect of MOR crystal on DME carbonylation, especially focusing on its diffusion behaviors and catalytic performance. Firstly, the conditions for the synthesis of MOR crystals with high crystallinity and varied sizes were investigated and optimized. Our previous work established a positive correlation between the ratio of the length along with the c-axis to that with the b-axis (c/b aspect ratio) and the catalytic activity of DME carbonylation [27]. Therefore, four MOR samples with similar Si/Al contents, pore structures and c/b aspect ratios but incremental sizes were selected as model catalysts. By combining analysis of the acidic properties and diffusion parameter measurements, the size effect of MOR crystals is identified.

2. Results and Discussion

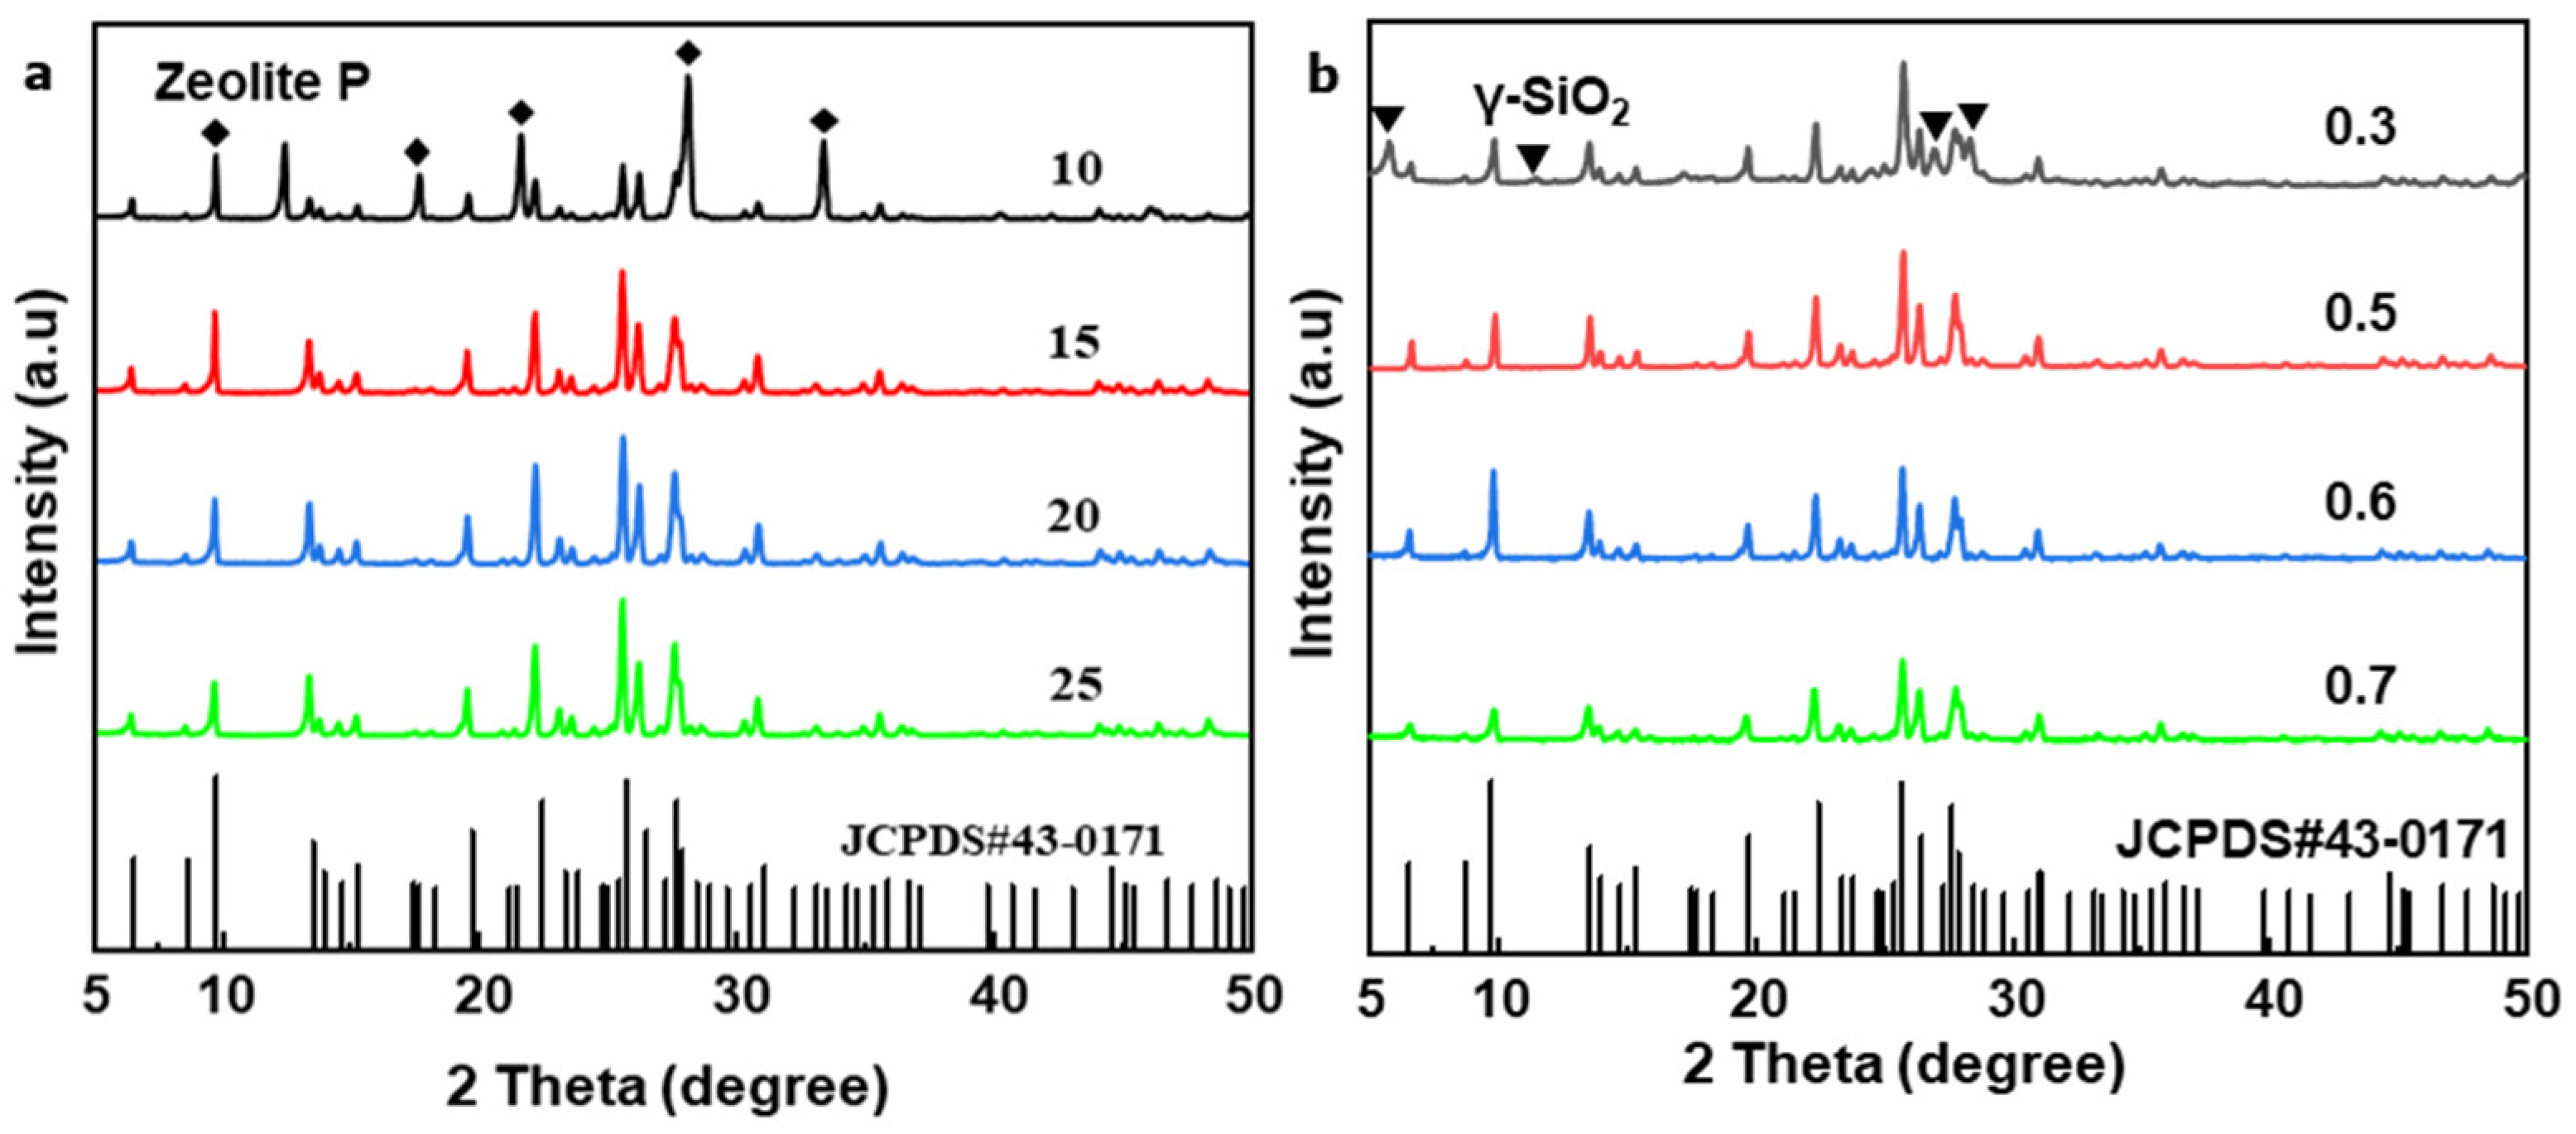
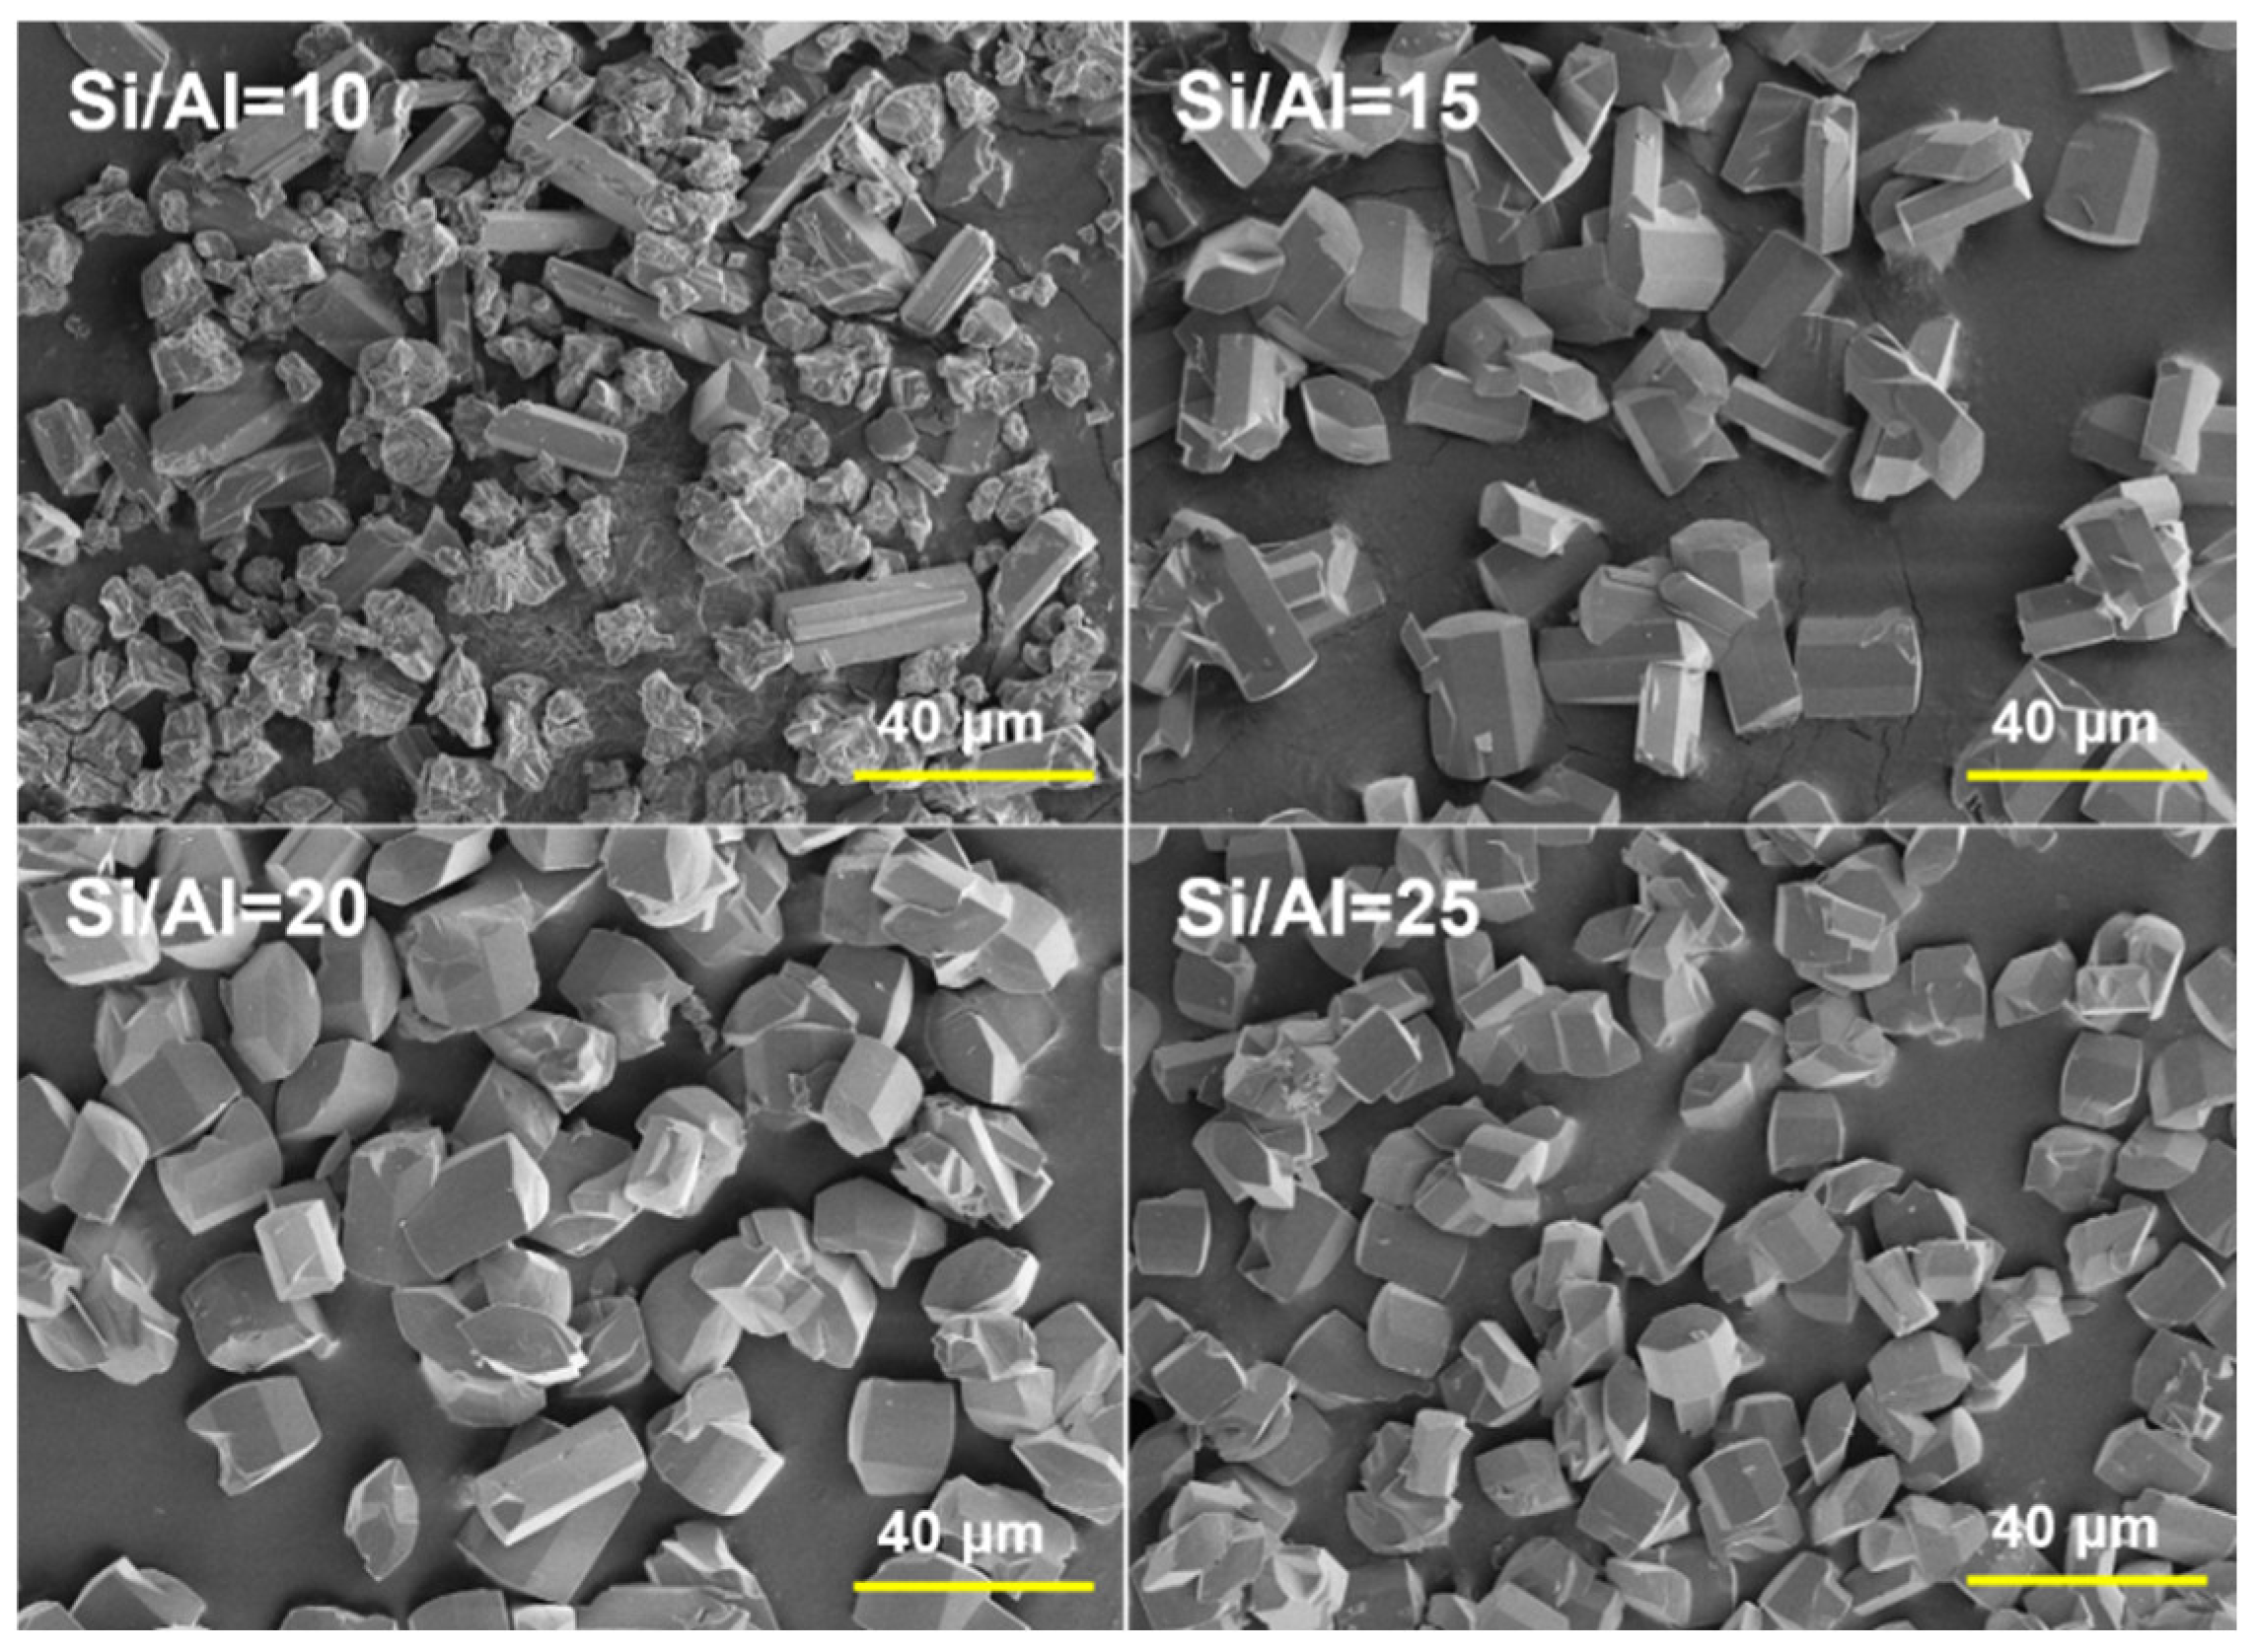
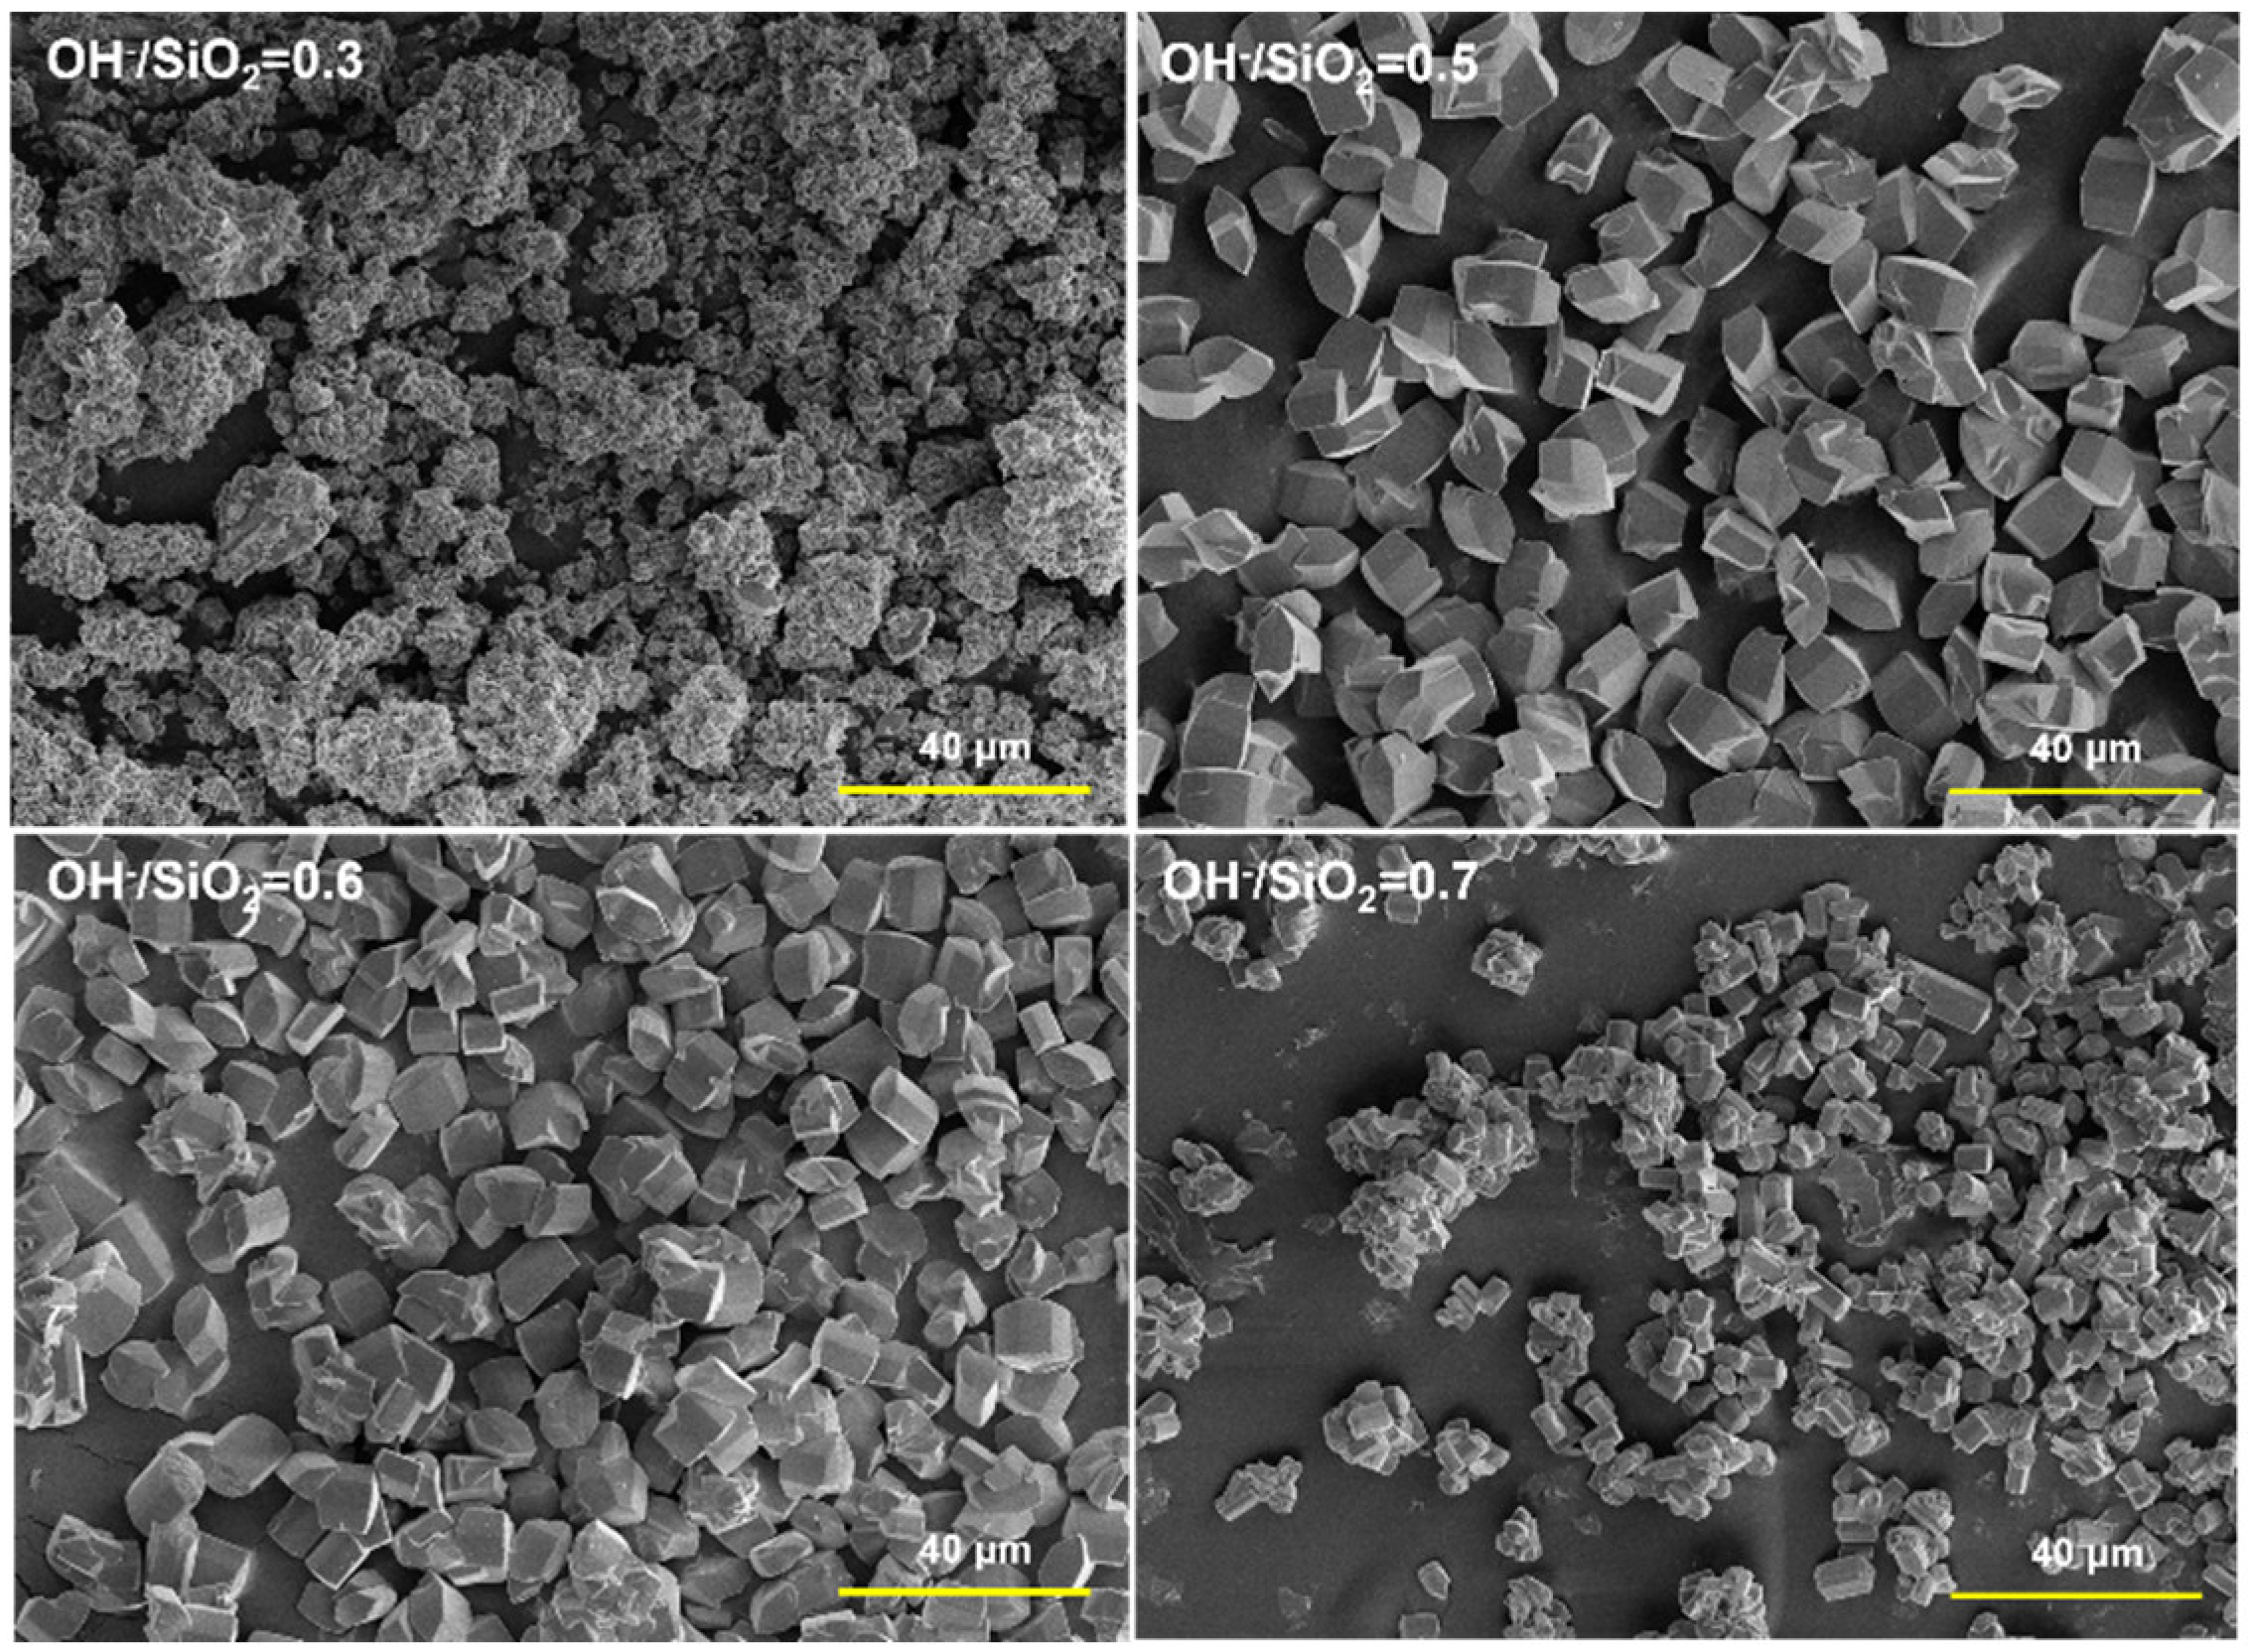
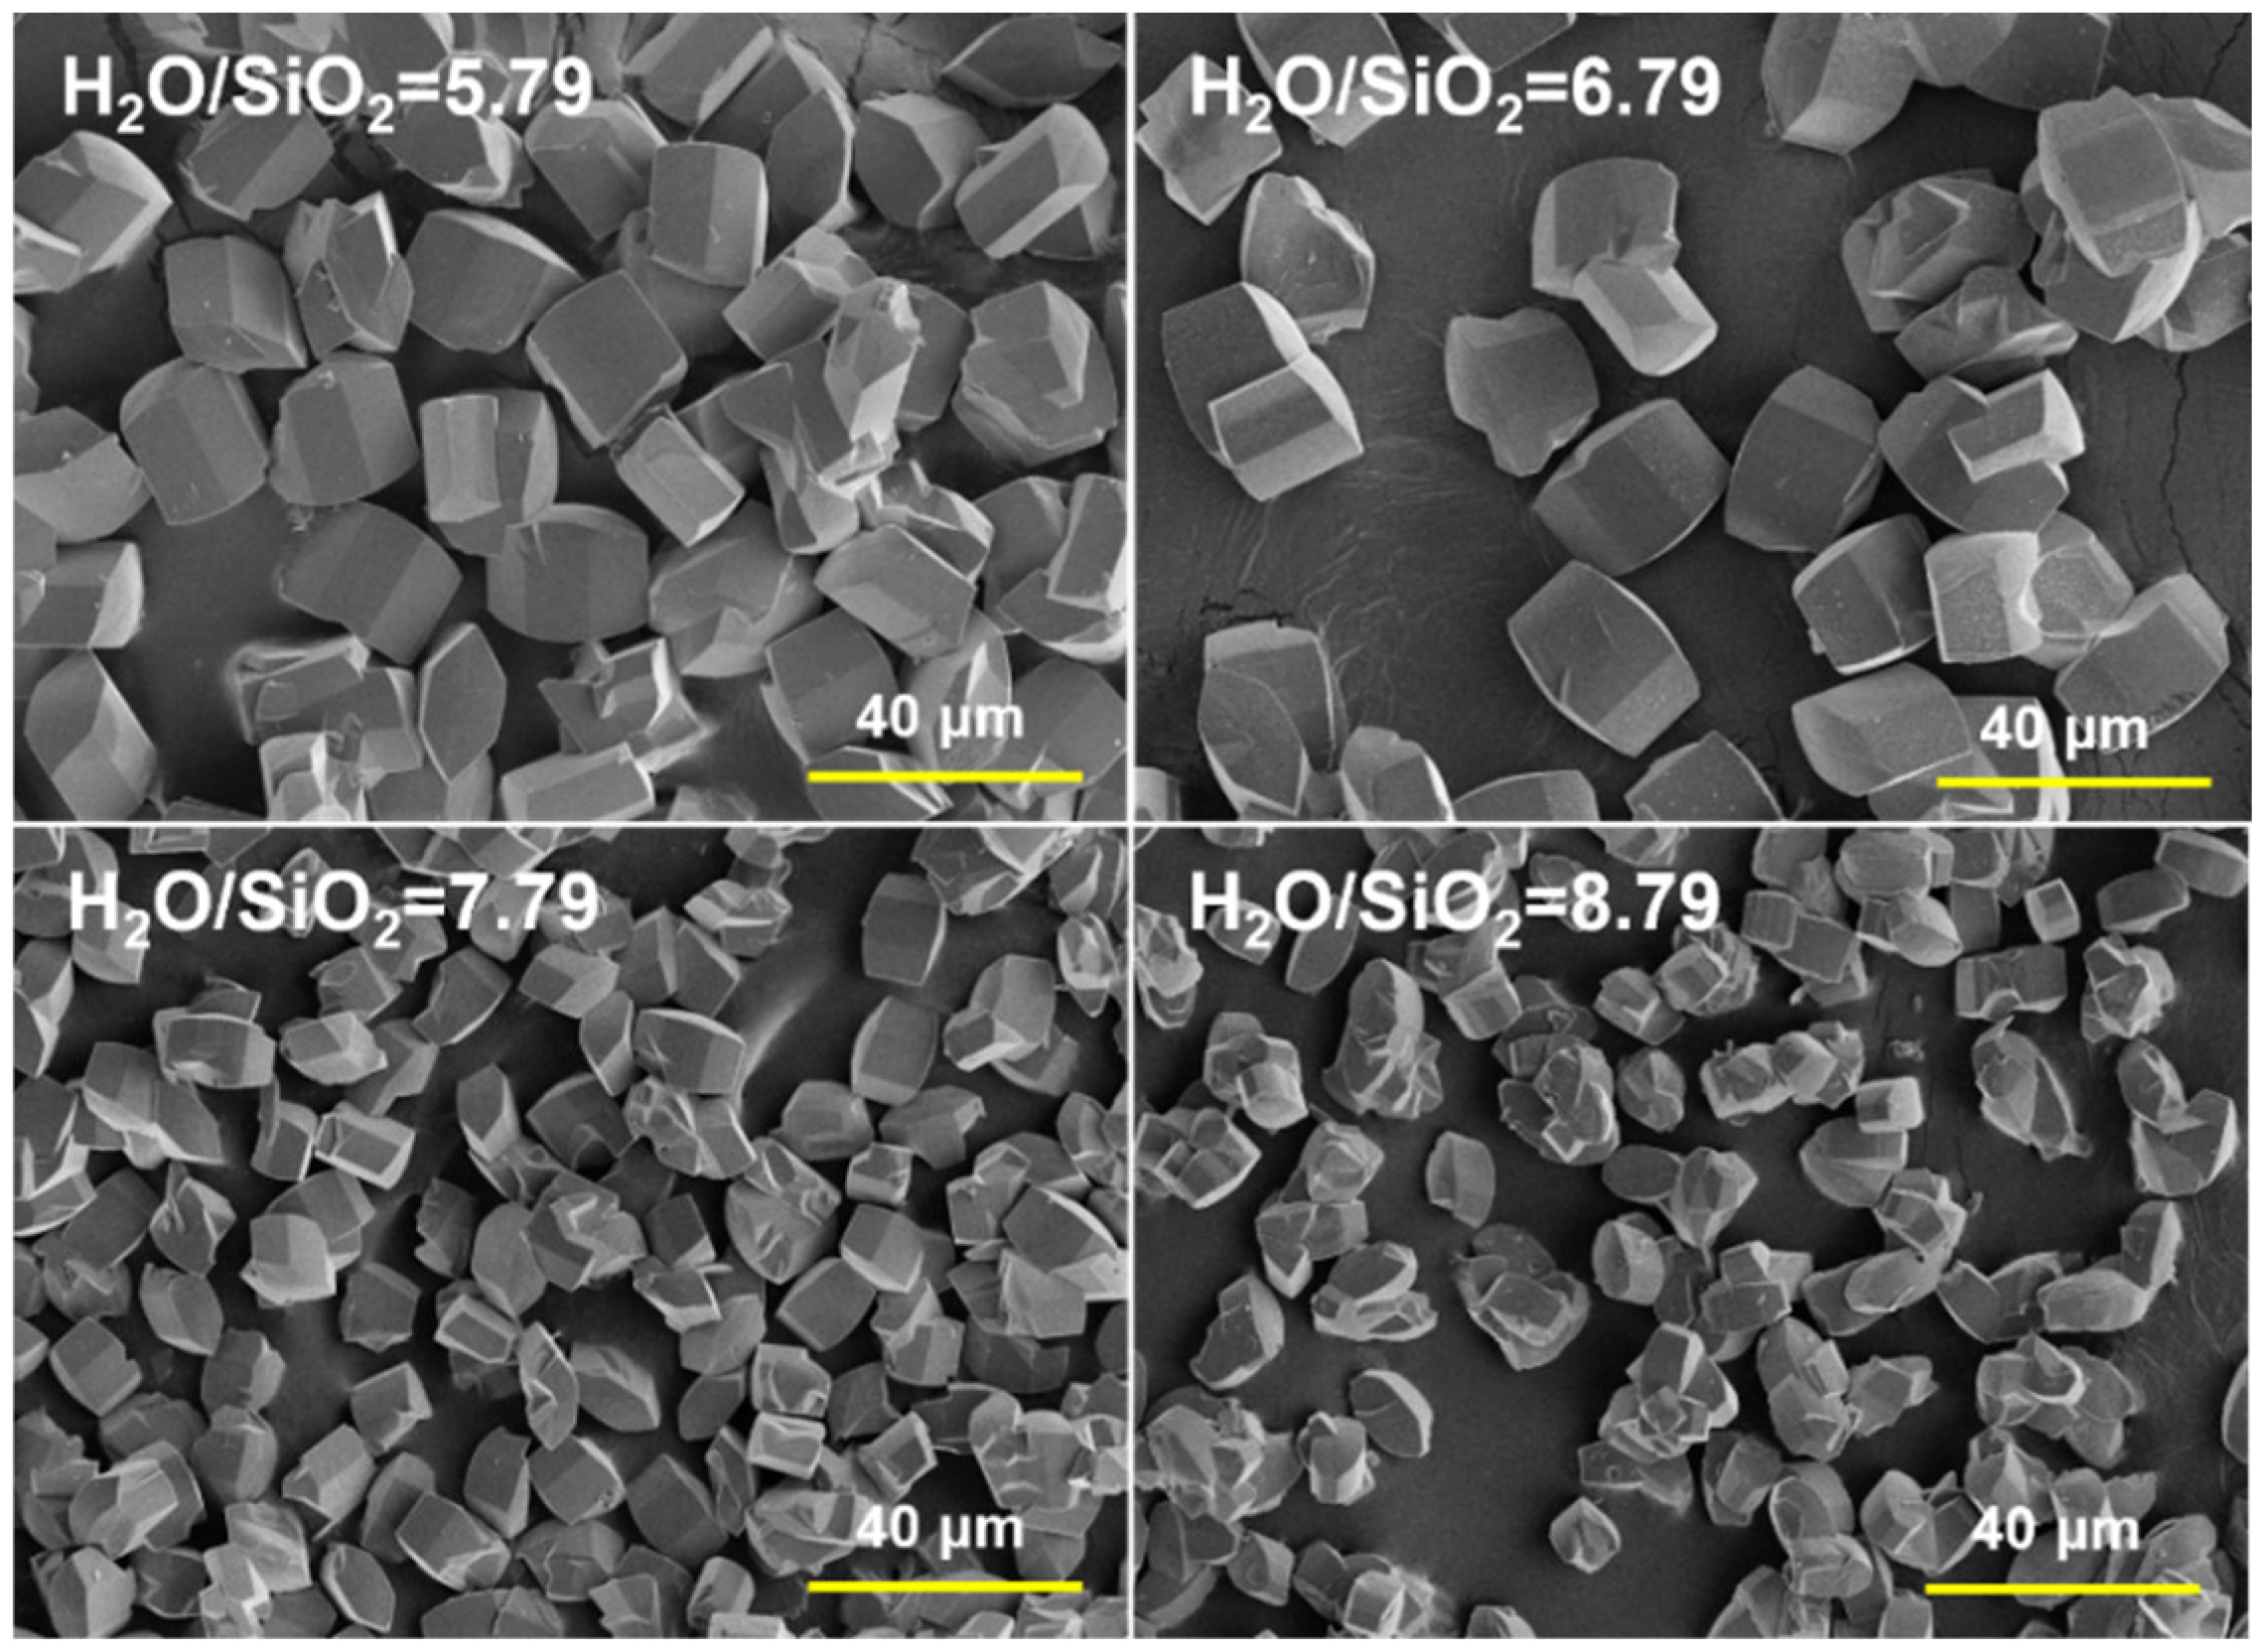
2.1. Synthesis of MOR Zeolite Crystals with Different Size

The parameters of hydrothermal synthesis, such as aging time, alkalinity, and water content, significantly affect the particle size of zeolites [28]; thus, we systematically investigated the effects of the conditions of hydrothermal crystallization on tuning the size of MOR crystals. During the aging process of the initial gel, the silica and alumina sources are dissolved or depolymerized, and repolymerization occurs. Next, the nucleation occurs. Therefore, tuning the aging time could change the concentration of silica–aluminate in the liquid phase, which affects nucleation and crystal growth; hence, the morphology, crystallinity and size of zeolites will be influenced [29]. Here, 1, 4 and 8 h were chosen to study the effect of aging time. XRD patterns (Figure S1) clearly show that all three samples have great crystallinity without other impurity phases. The relative crystallinity was calculated via peak areas of (200), (330), (150), (202) and (350) diffractions using the sample, with an aging time of 4 used as the reference. The relative crystallinity of the three samples was 95.9%, 100% and 94.2%, meaning that the crystallinity increased and then decreased with the increase in aging time. Figure 1 represents the SEM images of synthesized samples at different aging times. Uniform size and regular morphology were observed for all three samples. With the increase in aging time, the particle size first increased and then decreased. Ogura et al. discovered that prolonging the aging time could increase the concentration of silica–aluminate in the liquid phase, which facilitated nucleation and sped up the procedure of crystallization, enabling the creation of smaller-sized products [30].
To investigate the effect of Si/Al content, MOR samples with Si/Al ratios of 10–25 were prepared. As shown in Figure 2a, when the initial composition of Al source was too high (i.e., Si/Al = 10), pure MOR could not be formed, and a considerable amount of P zeolite was observed. As the Si/Al content increased, the P phase disappeared, and pure MOR was formed with similar crystallinity.
The SEM images in Figure 3 illustrate that the sample with a Si/Al ratio of 10 had a prismatic morphology. Meanwhile, some small particles with rough surfaces were also observed due to the presence of the P phase. The morphology of MOR particles became more regular and uniform as the Si/Al ratio increased to 15 and 20, and the particle size also grew. However, further improving the Si content led to a decrease in particle size. Element analysis via ICP-OES (listed in Table 1) indicated that a higher Si/Al content in the initial gel favored the incorporation of Si atoms into the MOR framework.
The alkalinity, which is the ratio of NaOH to SiO2 in synthetic gel, was also studied. The XRD pattern (Figure 2b) shows that there was an unwanted γ-SiO2 phase at OH/SiO2 = 0.3. In this work, we used silica sol as the Si source. Having too low alkalinity was not conducive to completing hydrolysis of Si sources and further nucleation. As a result, a certain ratio of amorphous SiO2 appeared, some of which transformed into γ-SiO2. As shown in the SEM image (Figure 4), there were lots of amorphous particles with irregular morphology, which was in line with the XRD result. Once the OH/SiO2 content increased to 0.5 or more, the samples became highly crystallized without other phases. Accordingly, the crystal morphology became more uniform. However, when the alkalinity was too high (OH/SiO2 = 0.7), the particle size decreased significantly, and many small particles were obtained. This finding may be due to the higher solubility of the silicon sol at high alkalinity. The high ion concentration in the liquid phase resultes in more nuclei being produced [31]. Therefore, the optimized molar ratio of NaOH to SiO2 is 0.5 or 0.6.
In addition, the amount of water also has a heavy influence on zeolite production [28,32,33]. It influences the concentration of ions in the initial mixture. Moreover, changing the amount of water affects not only the hydrolysis of the silicon and aluminum sources, but also the rates of nucleation and crystallization. Therefore, different morphologies and crystal sizes were obtained. As shown in Figure S2, the highly crystalline pure MOR formed in the range of 5.79–8.79 for H2O/SiO2 content. When the water content increased, the concentration of ions decreased, which slowed the crystallization rate. Therefore, within the same crystallization time, as illustrated in the SEM images of MOR with different H2O/SiO2 contents (Figure 5), there was a significant decrease in the size of the MOR.
The synthesis conditions for all highly crystallized products are summarized in Table 1, together with the Si/Al ratio and particle size. The MOR samples with particle sizes ranging from 3 × 7 to 30 × 36 μm can be successfully obtained in the ranges of Si/Al = 15–25, H2O/SiO2 = 5.79–8.79 and OH/SiO2 = 0.5–0.7. To simplify the study of the diffusion effect on catalyst performance, four samples with similar Si/Al contents, aspect ratios, and size gradients were selected. As illustrated in Figure 6, the samples with sizes of 0.1 × 0.2, 3 × 7, 8 × 13 and 17 × 24 μm were selected and named MOR-0.2, MOR-7, MOR-13 and MOR-24, respectively; among these samples, MOR-0.2 was a commercial sample with spherical morphology and a Si/Al ratio of 7.7. N2 adsorption–desorption isotherms (see Figure S3) showed isotherms typical of type I on all four samples, which is in line with the microporous characteristics of MOR. In particular, MOR-0.2 displayed a small hysteresis loop at high p/p0, indicating the existence of a mesoporous structure, probably due to the stacking of small crystals. The textural parameters summarized in Table 2 suggested that the as-prepared three samples had almost identical pore structures. Only MOR-0.2 possessed a small amount of mesopores, though the difference was very limited. Thus, the effect of pore structure can be excluded as an influencing variable in the following study of catalytic performance and diffusion behavior.

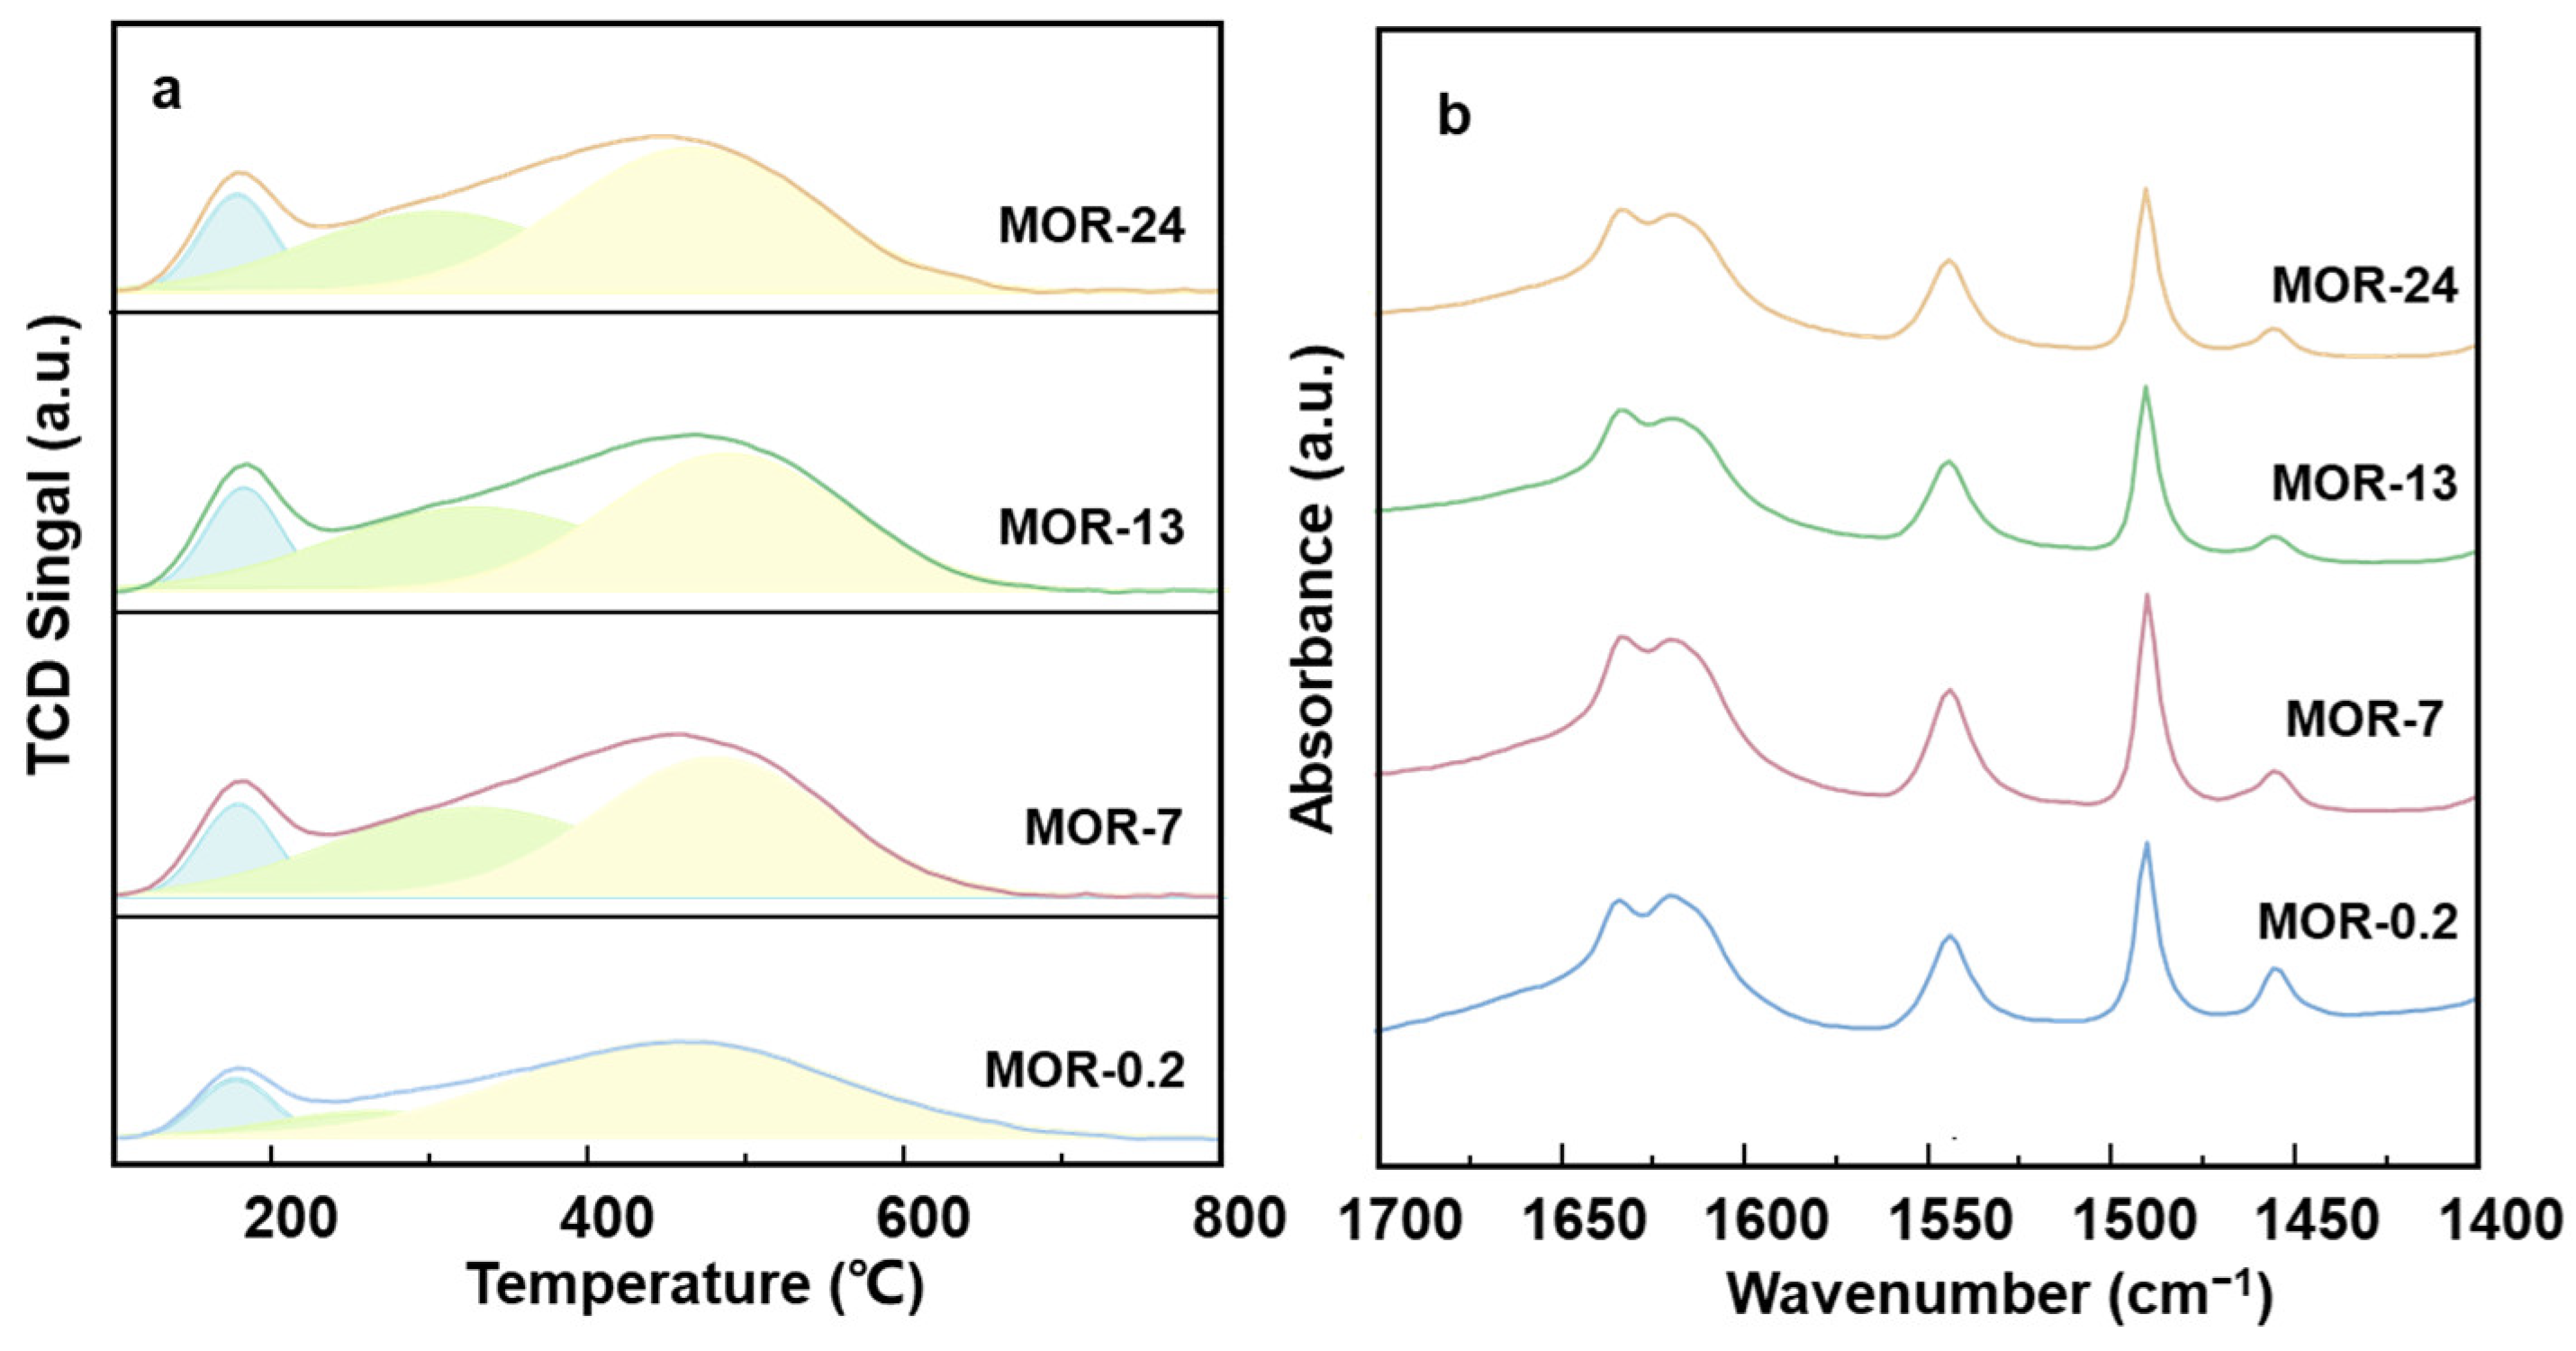
2.2. Acidity Characterizations

As we previously mentioned, BASs in 8-MR were generally accepted as active sites for DME carbonylation. Therefore, quantitative analyses of acid concentration and distribution are required to elucidate the influence of intrinsic reactivity and diffusion property. Taking the accessibility of acid sites at different locations into consideration, NH3 and pyridine were used to titrate all acid sites and acid sites only in 12-MR, respectively [5,34]. The NH3-TPD profiles of samples were displayed in Figure 7a, all of which showed three overlapping desorption peaks. The peaks centered around 458 K, 573 K and 743 K were assigned to weakly adsorbed NH3 and NH3 that interacted with Lewis acid sites (LASs) and BASs, respectively [35,36]. The total amounts of BASs in different samples were listed in Table 3. Obviously, the number of BASs growed with the increased particle size of MOR.
The relatively large diameter of pyridine (~5.9 Å) allows it to selectively interact with the acidic sites within 12-MR [5,37]. The bands at 1540 and 1450 cm−1 in the Py-IR spectra of the samples are characteristics of pyridine adsorbed on BASs and LASs, respectively (Figure 7b). The calculated results based on the two peak areas were summarized in Table 3 [38]. As the particle size expanded, the number of BASs in 12-MR first enlarged and then decreased, while the number of BASs in 8-MR gradually rose from 779 to 1345 μmol·g−1.

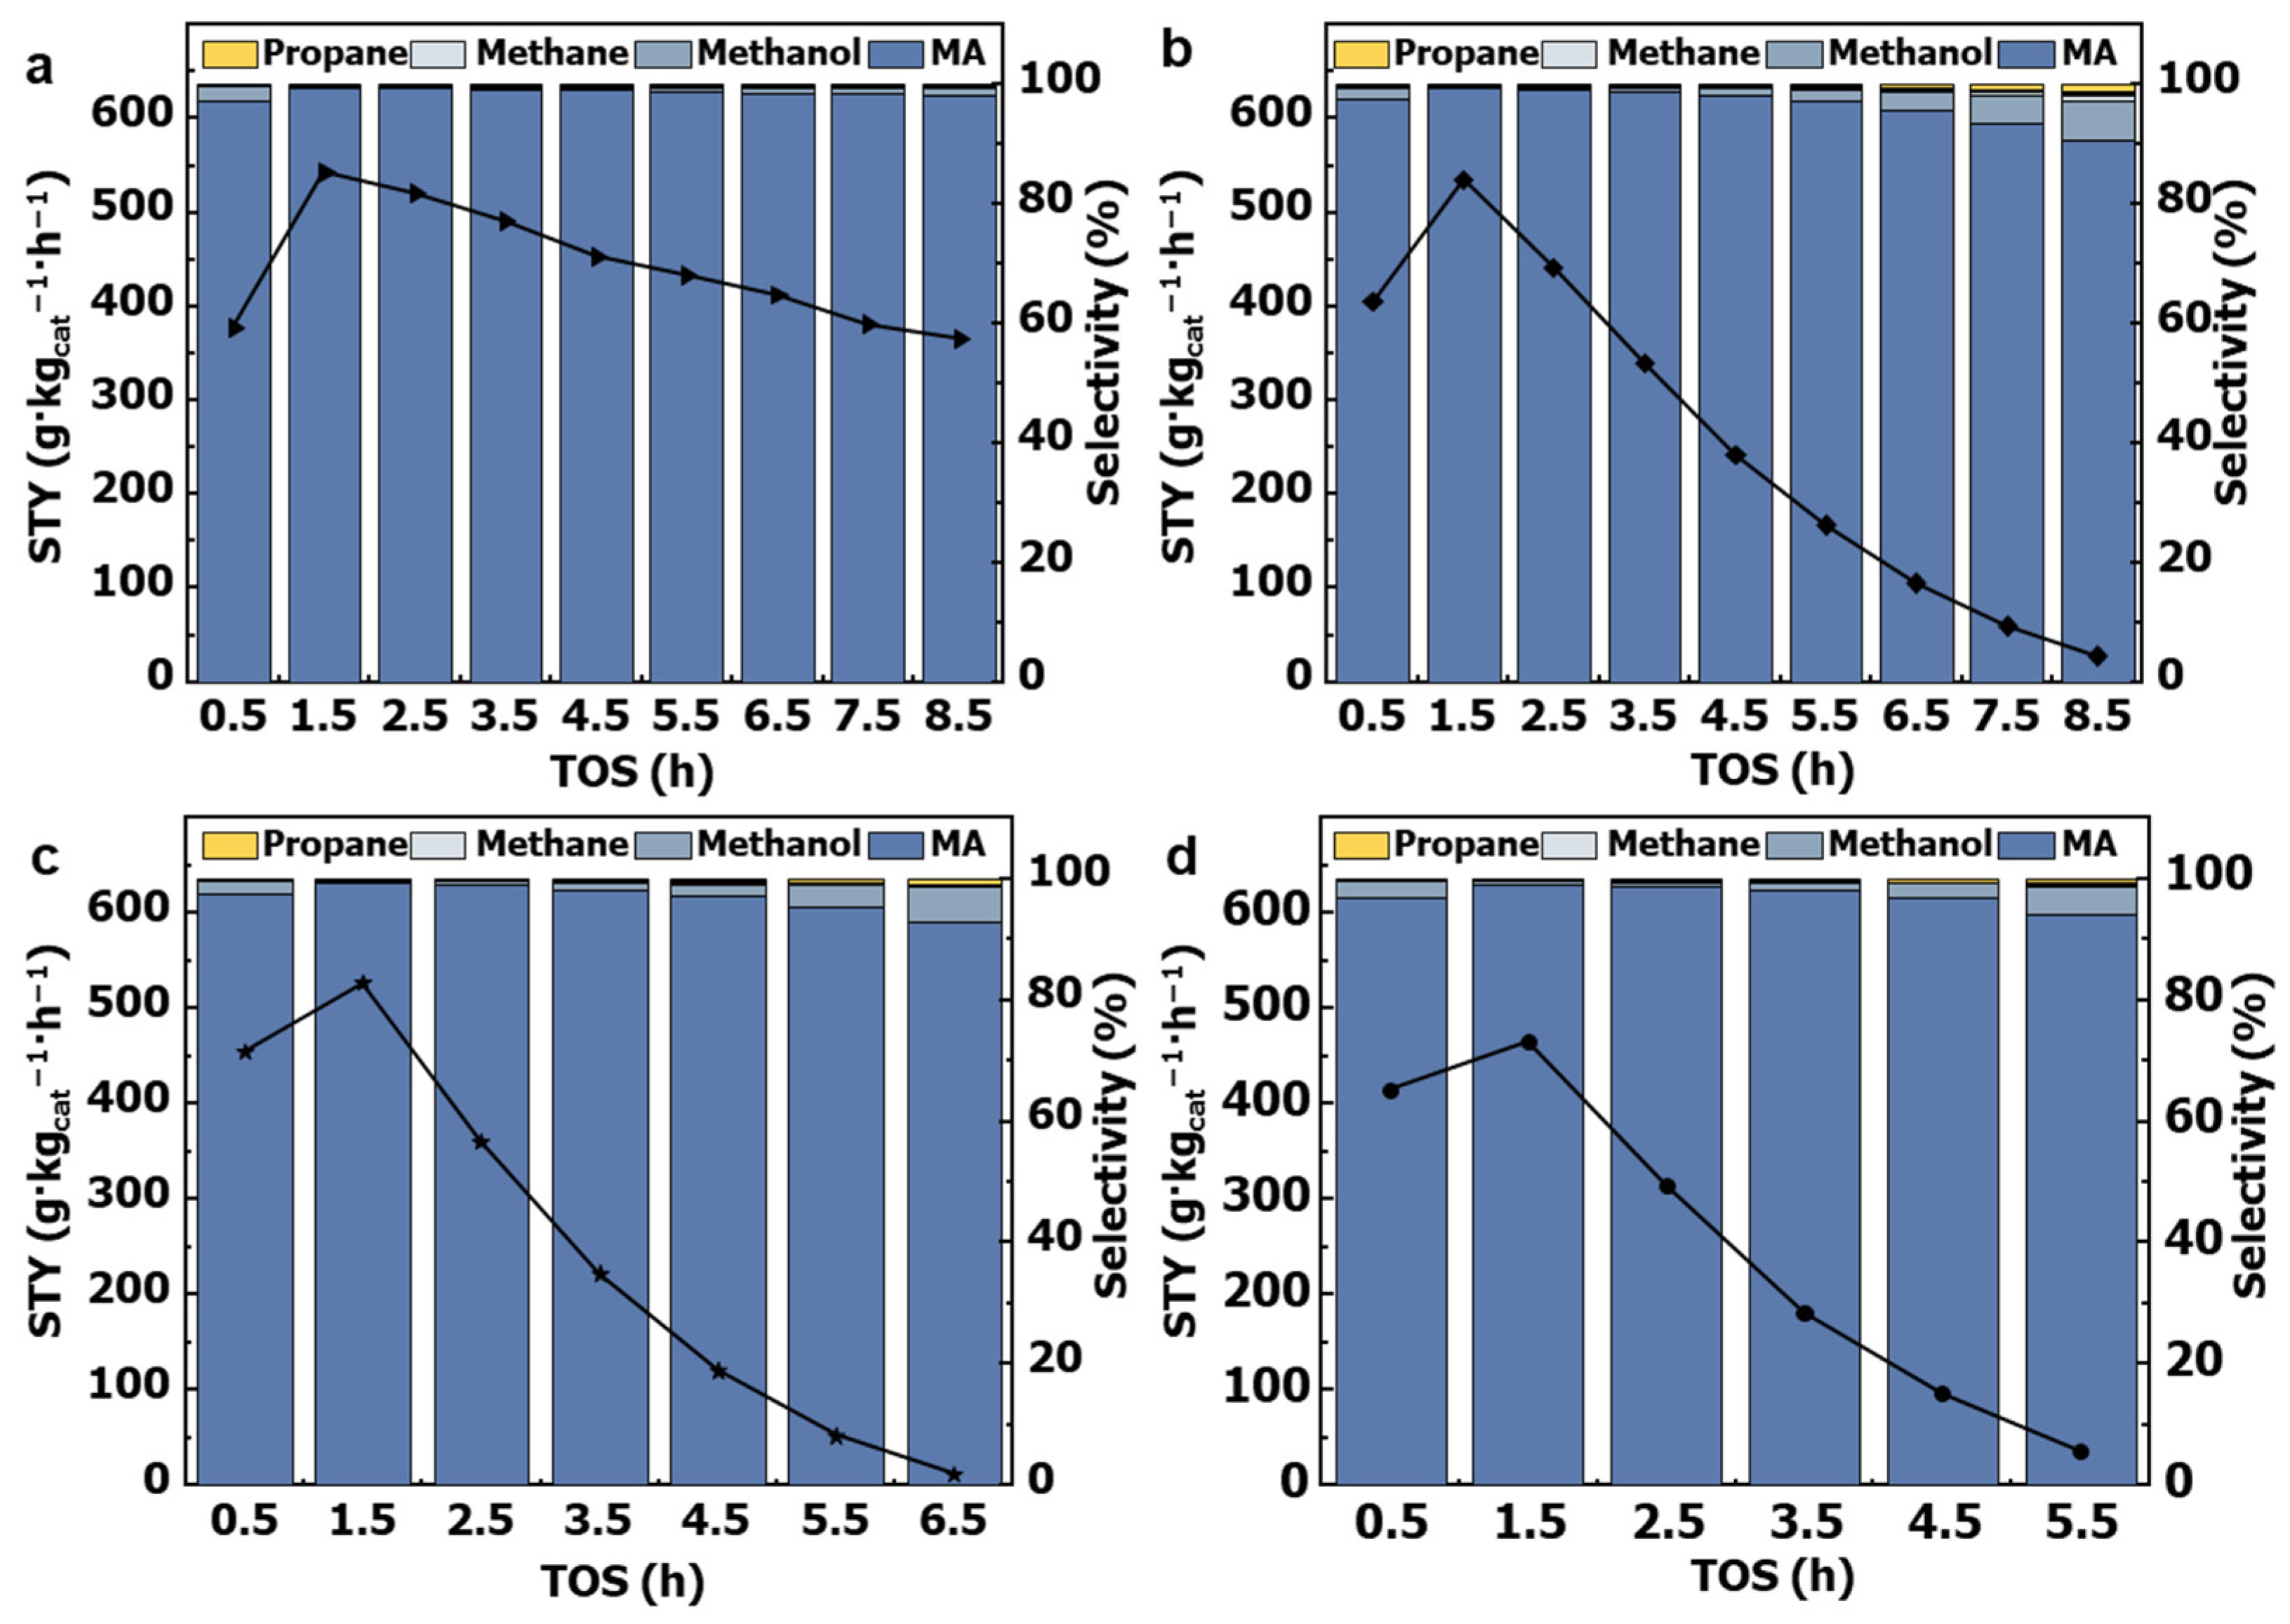
2.3. Catalytic Performance

Figure 8 shows the DME carbonylation performance on the four MOR catalysts. After an induction period, the space–time yield of MA (STYMA) on different catalysts reached the maximum at 1.5 h, and the catalysts then deactivated very quickly. The maximum value of STYMA showed a slight decrease in line with the increment of MOR size (from MOR-0.2 to MOR-13), and the value then dropped considerably when the MOR size became 17 × 24 μm.
On the other hand, the stability of catalysts with different particle sizes varied dramatically. For MOR-0.2, only a decline of around 33% in activity was observed after 8.5 h, and the MA selectivity remained above 99%. However, the STYMA on MOR-7 decreased to 28 g·kgcat−1·h−1. It is more remarkable that MOR-13 and MOR-24 underwent quicker deactivation, which only took 6.5 h or, in some cases, an even shorter period of time. Meanwhile, the selectivity of related by-products, such as methanol and propane, gradually grew with time. Therefore, it can be considered that particle size had a significant effect on side reactions and the formation of carbon deposits.
As we mentioned before, the BASs in 8-MR are accepted as active sites, while BASs in 12-MR and Lewis acid sites are not related to DME carbonylation. Therefore, to eliminate the influence of the number of active sites on activity, we normalized the STYMA at 1.5 h, based on the amount of BASs in the 8-MR, to obtain the apparent TOFMA for the four samples (Table 3). In many previous studies, a linear relationship between the STY of MA and the amount of BASs in the 8-MR was established. This trend suggests that the catalytic efficiency or ability of each BASs in the 8-MR is identical. However, in this work, the apparent TOFMA of the samples decreased significantly with an increase in the particle size. It is speculated that the diffusion path is prolonged as the particle size increases. Accordingly, the more severe mass transfer limitation lowers the apparent activity and accelerates the coke formation.

2.4. Effect of Mass Transfer on DME Carbonylation

The DME desorption curves on different samples at different temperatures were displayed in Figure 9a–c. The experimental data fit well with the theoretical curves, as confirmed in Figures S4–S6. It is clear that as the particles increased, the DME desorption became faster at the same temperature, while the desorption rate increased with improved temperature. To further quantify the DME diffusion in the different samples at the same temperature, the desorption data were analyzed and compared based on the equations listed in the Supplementary Materials document. The obtained effective diffusion time constant values for (D/r2) and L (a parameter in the ZLC model defined via Equation (S2)) were listed in Table 4. The values of L for all samples were greater than 10, indicating that the desorption process was kinetically controlled. For the same samples, the D/r2 increased with elevating temperature, demonstrating that the DME diffusion rate was accelerated at higher temperatures. While comparing D/r2 values of different samples at the same temperature, it is noteworthy that the DME diffusion was enhanced in smaller MOR particles, indicating that shortening the diffusion path efficiently accelerated the mass transfer in MOR channels.
The Arrhenius plots of DME diffusion for the four samples were displayed in Figure 9d, and the activation energy Ea calculated from the curves was also listed in Table 4. The results showed that the diffusion activation energy increased with the increase in particle size, which was indicative of the gradually enhanced diffusion limitation. Therefore, we can conclude that the lower apparent TOFMA and the faster deactivation rate with incremental particle size occurred mainly due to diffusion properties.
To further identify the influence of diffusion properties caused by particle size, the two spent catalysts with the largest size differences (i.e., spent MOR-0.2 and spent MOR-24) were characterized via N2 physisorption, XPS and TG. As shown in Table 5, compared to the fresh MOR-0.2, the micropore volume and BET surface areas of the spent MOR-0.2 were reduced by ~30% and ~45%, respectively, while the spent MOR-24 pore channels were almost completely blocked, and the surface areas were reduced to 4 m2·g−1. These observations suggested that the coke was deposited in the MOR channels, becoming more severe as the particle size increased. The thermogravimetric analysis (TG, solid lines) and derivative thermogravimetry (DTG) curves were shown in Figure 10. In the DTG curve, the weight loss at around 400 K is attributed to the removal of water, and the weight losses at 500–600 K and 600–800 K are associated with the combustion of soft and hard carbon accumulations, respectively [39]. Thus, the content of carbon species found on the two spent catalysts can be assessed. The coke content is 11 wt.% on the spent MOR-24, which is much higher than that on the spent MOR-0.2 (4 wt.%). The element analysis via XPS showed that the carbon content significantly increased after etching. This result indicated that the coke was mainly deposited inside the micropores, rather than on the external surface, which is in line with the results of N2 physisorption. In addition, as the particle size increased, the carbon contents on the surface and in the bulk both improved. Therefore, the mass transfer limitation caused by a larger particle size facilitated the coke deposit, resulting in faster catalyst deactivation.

3. Materials and Methods

3.1. Catalyst Preparation

MOR was prepared via the hydrothermal method, and the corresponding schematic representation is shown in Figure S7. In a typical synthesis, the appropriate amounts of Al(OH)3 (Aladdin Reagent Co., Ltd., Ontario, CA, USA), NaOH (Tianjin Guangfu Fine Chemical Co., Ltd., Tianjin, China), silica sol (40 wt.% SiO2 (Alfa Aesar Co., Ltd., Lancashire, UK)) and deionized water were mixed and stirred for 4 h. The molar composition of the synthesized gel was xSiO2:Al2O3:yNa2O:zH2O (x = 5–12.5, y = 3–7, z = 57.9–87.9). The gel was transferred to a Teflon-lined stainless-steel autoclave and heated to 423 K for 5 days. After the autoclave was cooled to room temperature, the solid product was separated via centrifugation, washed with distilled water, dried at 383 K for 12 h and calcined at 773 K for 4 h to obtain Na-form MOR. To explore the synthesis conditions of micrometer MOR particles, MOR particles with different sizes were subsequently obtained via adjusting a single synthesis parameter (Si/Al content in gel, aging time, the amount of water or alkalinity) based on the initial hydrothermal method. The samples were labeled as MOR-x, where x represents the particle size measured via SEM. Next, the samples were exchanged twice at 353 K with 0.1 mol/L (NH4)2SO4 aqueous solution for 6 h and washed with deionized water. To obtain H-MOR, the samples were calcined at 773 K for 4 h.

3.2. Catalytic Characterization

X-ray diffraction (XRD) measurement was carried out via Rigaku D/MAX-2500 (Rigaku Corporation, Tokyo, Japan) using Cu Kα characteristic diffraction radiation (λ = 1.54056 Å, 40 kV, 200 mA). The scanning range was 5–50°, and the scanning speed was 8°/min.
N2 adsorption–desorption isotherms of fresh and used catalysts were obtained at 77 K using a Micromeritics ASAP 2460 (Micromeritics, Atlanta, GA, USA). The total pore volume and median pore width were determined based on the Horvath–Kawazoe (H-K) equation. The total specific surface area and pore volume were calculated using the Brunauer–Emmett–Teller method, and the micropore surface area was calculated via the t-plot method.
The elemental compositions of Si and Al were measured via inductively coupled plasma optical emission spectrometry (ICP-OES) (VISTA-MPX, Varian, Palo Alto, CA, USA). Before the experiment, all samples were dissolved in HF solution and complexed with excess H3BO3.
The images of the samples were taken using a FEI Apreo S LoVac scanning electron microscope (SEM, Thermo Fisher Scientific, Waltham, MA, USA)).
Temperature-programmed desorption of ammonia (NH3-TPD) was carried out via a Micromeritics Autochem II 2920 instrument (Micromeritics, Atlanta, GA, USA). Typically, 100 mg samples were pre-treated at 473 K for 1 h under Ar atmosphere to remove impurities. Subsequently, the temperature was lowered to 423 K and 10% vol. NH3/He was introduced for 1 h to saturate the sample. Next, the inlet gas was switched to He to remove physically adsorbed NH3 at 373 K. The sample was heated to 1173 K at a rate of 10 K/min, during which period the signal was recorded using a thermal conductivity detector (TCD).
Fourier Transform infrared spectroscopy of pyridine adsorption (Py-FTIR) was performed via a Thermo Scientific Nicolet 6700 (Thermo Fisher Scientific, Waltham, MA, USA). A self-supporting wafer of samples (~20 mg) was placed into an in situ cell equipped with CaF2 windows. The samples were pre-treated at 673 K under vacuum for 1 h before testing. The samples were exposed to pyridine for 30 min and degassed for 30 min at 423 K to remove gaseous and physically adsorbed pyridine. IR spectra were collected via 32 scans in the range of 4000–1100 cm−1 at 4 cm−1 resolution using a background collected at 423 K.
TG analysis was conducted via TGA Q50 (Waters, Agawam, MA, USA) to analyze the coke deposits in the spent catalysts. Approximately 10 mg of spent catalyst was heated from 323 K to 1073 K at a rate of 5 K/min under a steady airflow (40 mL/min).
X-ray photoelectron spectroscopy (XPS) was carried out using a Thermo Fisher Scientific ESCALAB Xi+ (Waltham, MA, USA). The obtained data were calibrated with C 1s (284.6 eV) as an internal reference. Depth profiling was obtained at the time stage of 600 s for argon ion etching.

3.3. Zero Length Column for Diffusion Measurement

The zero length column (ZLC) method was used to measure the intracrystalline diffusion coefficients [40,41,42]. A small amount of sample (2–3 mg) was sandwiched between two microgrids and loaded within a 1/8 in. union, which was then placed in a gas chromatograph oven (GC, Agilent 7890B, Agilent Technologies, Santa Clara, CA, USA). The samples were pre-treated in a flow of N2 at 473 K for 2 h before the experiment. The samples were then saturated with DME at designed temperatures (313, 333, 353 K). After reaching the adsorption equilibrium, N2 was introduced into the cell, at which point the concentration of DME desorbed from the sample was detected using a flame ionization detector (FID). To ensure the samples were saturated via DME before desorption, as well as to exclude the effect of external diffusion, the adsorption of DME was conducted at the following conditions: a DME pressure of 200 Pa, an adsorption time of 30 min and a flowrate of N2 90 mL/min. The data of the desorption process were analyzed by applying the full process method [43]. The detailed analysis process is given in the Supplementary Materials document.

3.4. Catalyst Evaluation

The catalytic properties were evaluated via a fix-bed reactor with an inner diameter of 8 mm. Generally, 0.5 g catalyst (40–60 mesh) was loaded into the tubular reactor. Before it was fed into the reaction gas, the catalyst was pre-treated for 9 h under N2 flow at 473 K. The DME carbonylation was performed at 473 K, as well as at 1.5 MPa of total pressure of DME/CO (1/49, volume ratio). The input gas flow was 100 mL/min, giving the gas an hourly space velocity (GHSV) of 6000 h−1. The effluent gases were analyzed using an online GC (Shimadzu 2014C, Shimadzu Corporation, Kyoto, Japan), which was equipped with a thermal conductivity detector (TCD) and a flame ionization detector (FID). The conversion of DME (XDME) and the selectivity of product i (Si) were acquired via Equations (1) and (2), respectively.
X DME % = n DME , inlet mol     n DME , outlet mol n DME , inlet mol   ×   100 %
S i % = n DME , i mol n DME , inlet mol     n DME , outlet mol   ×   100 %
where n DME , i is the molar amount of DME converted to product i. The space–time yield of MA (STYMA) and the turnover frequency of MA (TOFMA) were calculated via Equations (3) and (4), respectively.
STY MA ( g · g cat 1 · h 1 ) = flow   rate   of   DME mol / h   ×   X DME   ×   S MA   ×   M MA g / mol m cat kg
TOF MA ( h 1 ) = flow   rate   of   DME mol / h   ×   X DME   ×   S MA m cat g   ×   number   of   Brønsted   acid   sites   of   8 - MR mol / g

4. Conclusions

In this work, we successfully adjusted the crystal size of MOR zeolite by systematically investigating the composition of the initial gel and the crystallization conditions. Among the obtained pure MOR with high crystallinity, four samples with similar Si/Al contents, aspect ratios, pore properties and gradient crystal sizes were selected to investigate the influence of mass transfer on DME carbonylation. Based on quantitative analysis of acidic properties, the normalized MA formation rates on the BASs in 8-MR were determined, reflecting the influence of diffusion properties on catalytic performance. With increasing particle size, the improved diffusion efficiency resultes in higher MA yield, lower selectivity of byproducts and moderate deactivation. DME diffusion measurements and kinetic studies based on ZLC methods provides quantitative analysis regarding the size effect on diffusion behaviors. The expansion of the diffusion path entails an elevation in the activation energy and a decline in the DME diffusion rate. The results demonstrate that the decreased activity and stability in MOR-catalyzed DME carbonylation were caused by the enhanced diffusion limitation. Therefore, the development of nano-sized or nano-assembled MOR is a promising research direction that would boost the DME carbonylation rate.

Supplementary Materials

The following supporting information can be downloaded via this hyperlink: https://www.mdpi.com/article/10.3390/catal13071049/s1. Figure S1: XRD patterns of samples with agitation times of 1, 4 and 8 h; Figure S2: XRD patterns of samples with different H2O/SiO2 contents; Figure S3: N2 adsorption and desorption isotherms of the (a) fresh and (b) spent MOR samples with different sizes; Figures S4–S6: ZLC curves and fitting curves of DME in different samples at 313 K, 333 K and 353 K via the full range method; Figure S7: schematic representation of the MOR hydrothermal synthesis.

Author Contributions

Conceptualization, S.H.; Data curation, C.D. and Y.L.; Funding acquisition, S.H.; Investigation, Y.X.; Methodology, Y.X. and S.H.; Project administration, S.H.; Software, Y.X. and H.L.; Supervision, S.H.; Validation, Y.X.; Visualization, C.D. and Y.L.; Writing—original draft, C.D.; Writing—review and editing, Y.L., H.L., Y.Z., S.H. and X.M. All authors have read and agreed to the published version of the manuscript.

Funding

This work was supported by the National Natural Science Foundation of China (21978209) and the Royal Society International Collaboration Award (No. ICA\R1\180317).

Data Availability Statement

The data presented in this study are available on request from the corresponding author.

Conflicts of Interest

The authors declare no conflict of interest.

References

  1. Liu, G.; Yang, G.; Peng, X.; Wu, J.; Tsubaki, N. Recent advances in the routes and catalysts for ethanol synthesis from syngas. Chem. Soc. Rev. 2022, 51, 5606–5659. [Google Scholar] [CrossRef] [PubMed]
  2. Zhan, E.S.; Xiong, Z.P.; Shen, W.J. Dimethyl ether carbonylation over zeolites. J. Energy Chem. 2019, 36, 51–63. [Google Scholar] [CrossRef] [Green Version]
  3. Shen, H.B.; Li, Y.; Huang, S.Y.; Cai, K.; Cheng, Z.Z.; Lv, J.; Ma, X.B. The carbonylation of dimethyl ether catalyzed by supported heteropoly acids: The role of Bronsted acid properties. Catal. Today 2019, 330, 117–123. [Google Scholar] [CrossRef]
  4. Cheung, P.; Bhan, A.; Sunley, G.J.; Iglesia, E. Selective carbonylation of dimethyl ether to methyl acetate catalyzed by acidic zeolites. Angew. Chem. Int. Ed. 2006, 45, 1617–1620. [Google Scholar] [CrossRef]
  5. Bhan, A.; Allian, A.D.; Sunley, G.J.; Law, D.J.; Iglesia, E. Specificity of sites within eight-membered ring zeolite channels for carbonylation of methyls to acetyls. J. Am. Chem. Soc. 2007, 129, 4919–4924. [Google Scholar] [CrossRef]
  6. Boronat, M.; Martinez-Sanchez, C.; Law, D.; Corma, A. Enzyme-like specificity in zeolites: A unique site position in mordenite for selective carbonylation of methanol and dimethyl ether with CO. J. Am. Chem. Soc. 2008, 130, 16316–16323. [Google Scholar] [CrossRef]
  7. Li, B.J.; Xu, J.; Han, B.; Wang, X.M.; Qi, G.D.; Zhang, Z.F.; Wang, C.; Deng, F. Insight into dimethyl ether carbonylation reaction over mordenite zeolite from in-situ solid-state NMR spectroscopy. J. Phys. Chem. C. 2013, 117, 5840–5847. [Google Scholar] [CrossRef]
  8. Wang, M.X.; Huang, S.Y.; Lu, J.; Cheng, Z.Z.; Li, Y.; Wang, S.P.; Ma, X.B. Modifying the acidity of H-MOR and its catalytic carbonylation of dimethyl ether. Chin. J. Catal. 2016, 37, 1530–1538. [Google Scholar] [CrossRef]
  9. Xia, Y.M.; Li, Z.H.; Li, Y.; Cai, K.; Liu, Y.D.; Lv, J.; Huang, S.Y.; Ma, X.B. Promotion effect and mechanism of Ga modification on dimethyl ether carbonylation catalyzed by mordenite. Catal. Today 2022, 405–406, 152–158. [Google Scholar] [CrossRef]
  10. Li, Y.; Yu, M.; Cai, K.; Wang, M.Y.; Lv, J.; Howe, R.F.; Huang, S.Y.; Ma, X.B. Template-induced Al distribution in MOR and enhanced activity in dimethyl ether carbonylation. Phys. Chem. Chem. Phys. 2020, 22, 11374–11381. [Google Scholar] [CrossRef]
  11. Cai, K.; Li, Y.; Shen, H.B.; Cheng, Z.Z.; Huang, S.Y.; Wang, Y.; Ma, X.B. A density functional theory study on the mechanism of Dimethyl ether carbonylation over heteropolyacids catalyst. Front. Chem. Sci. Eng. 2021, 15, 319–329. [Google Scholar] [CrossRef]
  12. Chen, N.; Zhang, J.; Gu, Y.T.; Zhang, W.N.; Cao, K.P.; Cui, W.H.; Xu, S.T.; Fan, D.; Tian, P.; Liu, Z.M. Designed synthesis of MOR zeolites using gemini-type bis(methylpyrrolidinium) dications as structure directing agents and their DME carbonylation performance. J. Mater. Chem. A 2022, 10, 8334–8343. [Google Scholar] [CrossRef]
  13. Zhang, L.Y.; Feng, X.B.; He, Z.M.; Chen, F.; Su, C.; Zhao, X.Y.; Cao, J.P.; He, Y.R. Enhancing the stability of dimethyl ether carbonylation over Fe-doped MOR zeolites with tunable 8-MR acidity. Chem. Eng. Sci. 2022, 256, 10. [Google Scholar] [CrossRef]
  14. Cai, K.; Huang, S.Y.; Li, Y.; Cheng, Z.Z.; Lv, J.; Ma, X.B. Influence of acid strength on the reactivity of dimethyl ether carbonylation over H-MOR. ACS Sustain. Chem. Eng. 2018, 7, 2027–2034. [Google Scholar] [CrossRef]
  15. Chen, W.; Li, G.; Yi, X.; Day, S.J.; Tarach, K.A.; Liu, Z.; Liu, S.B.; Edman Tsang, S.C.; Gora-Marek, K.; Zheng, A. Molecular understanding of the catalytic consequence of ketene intermediates under confinement. J. Am. Chem. Soc. 2021, 143, 15440–15452. [Google Scholar] [CrossRef]
  16. Rasmussen, D.B.; Christensen, J.M.; Temel, B.; Studt, F.; Moses, P.G.; Rossmeisl, J.; Riisager, A.; Jensen, A.D. Ketene as a reaction intermediate in the carbonylation of dimethyl ether to methyl acetate over mordenite. Angew. Chem. Int. Ed. 2015, 54, 7261–7264. [Google Scholar] [CrossRef]
  17. Cheng, Z.Z.; Huang, S.Y.; Li, Y.; Lv, J.; Cai, K.; Ma, X.B. Deactivation kinetics for the carbonylation of dimethyl ether to methyl acetate on H-MOR. Ind. Eng. Chem. Res. 2017, 56, 13618–13627. [Google Scholar] [CrossRef]
  18. Liu, S.P.; Fang, X.D.; Liu, Y.; Liu, H.C.; Ma, X.G.; Zhu, W.L.; Liu, Z.M. Dimethyl ether carbonylation over mordenite zeolite modified by alkyimidazolium ions. Catal. Commun. 2020, 147. [Google Scholar] [CrossRef]
  19. He, P.; Li, Y.; Cai, K.; Xiong, X.; Lv, J.; Wang, Y.; Huang, S.Y.; Ma, X.B. Nano-assembled mordenite zeolite with tunable morphology for carbonylation of dimethyl ether. ACS Appl. Nano Mater. 2020, 3, 6460–6468. [Google Scholar] [CrossRef]
  20. Ma, M.; Huang, X.M.; Zhan, E.S.; Zhou, Y.; Xue, H.F.; Shen, W.J. Synthesis of mordenite nanosheets with shortened channel lengths and enhanced catalytic activity. J. Mater. Chem. A 2017, 5, 8887–8891. [Google Scholar] [CrossRef]
  21. Liu, Y.H.; Zhao, N.; Xian, H.; Cheng, Q.P.; Tan, Y.S.; Tsubaki, N.; Li, X.G. Facilely synthesized H-mordenite nanosheet assembly for carbonylation of dimethyl ether. ACS Appl. Mater. Interfaces 2015, 7, 8398–8403. [Google Scholar] [CrossRef] [PubMed]
  22. Yao, J.; Wu, Q.M.; Fan, J.Q.; Komiyama, S.; Yong, X.J.; Zhang, W.; Zhao, T.J.; Guo, Z.S.; Yang, G.H.; Tsubaki, N. A Carbonylation Zeolite with Specific Nanosheet Structure for Efficient Catalysis. ACS Nano 2021, 15, 13568–13578. [Google Scholar] [CrossRef] [PubMed]
  23. Liu, S.P.; Cheng, Z.Z.; Li, Y.; Sun, J.H.; Cai, K.; Huang, S.Y.; Lv, J.; Wang, S.P.; Ma, X.B. Improved catalytic performance in dimethyl ether carbonylation over hierarchical mordenite by enhancing mass transfer. Ind. Eng. Chem. Res. 2020, 59, 13861–13869. [Google Scholar] [CrossRef]
  24. Wang, X.S.; Li, R.J.; Yu, C.C.; Liu, Y.X.; Zhang, L.Y.; Xu, C.M.; Zhou, H.J. Enhancing the dimethyl ether carbonylation performance over mordenite catalysts by simple alkaline treatment. Fuel 2019, 239, 794–803. [Google Scholar] [CrossRef]
  25. Xue, H.F.; Huang, X.M.; Ditzel, E.; Zhan, E.S.; Ma, M.; Shen, W.J. Dimethyl ether carbonylation to methyl acetate over nanosized mordenites. Ind. Eng. Chem. Res. 2013, 52, 11510–11515. [Google Scholar] [CrossRef]
  26. Sheng, H.B.; Qian, W.X.; Zhang, H.T.; Zhao, P.; Ma, H.F.; Ying, W.Y. Synthesis of hierarchical porous H-mordenite zeolite for carbonylation of dimethyl ether. Microporous Mesoporous Mater. 2020, 295. [Google Scholar] [CrossRef]
  27. Li, Y.; Li, Z.; Huang, S.Y.; Cai, K.; Qu, Z.; Zhang, J.F.; Wang, Y.; Ma, X.B. Morphology-dependent catalytic performance of mordenite in carbonylation of dimethyl ether: Enhanced activity with high c/b ratio. ACS Appl. Mater. Interfaces 2019, 11, 24000–24005. [Google Scholar] [CrossRef]
  28. Xu, C.; Guo, Y.; Xiao, Q.; Zhong, Y.; Zhu, W. Synthesis and characterization of large, pure mordenite crystals. J. Porous Mater. 2011, 19, 847–852. [Google Scholar] [CrossRef]
  29. Ghanbari, B.; Zangeneh, F.K.; Sastre, G.; Moeinian, M.; Marhabaie, S.; Rizi, Z.T. Computational elucidation of the aging time effect on zeolite synthesis selectivity in the presence of water and diquaternary ammonium iodide. Phys. Chem. Chem. Phys. 2021, 23, 21240–21248. [Google Scholar] [CrossRef]
  30. Ogura, M.; Kawazu, Y.; Takahashi, H.; Okubo, T. Aluminosilicate species in the hydrogel phase formed during the aging process for the crystallization of FAU zeolite. Chem. Mater. 2003, 15, 2661–2667. [Google Scholar] [CrossRef]
  31. Keoh, S.H.; Chaikittisilp, W.; Muraoka, K.; Mukti, R.R.; Shimojima, A.; Kumar, P.; Tsapatsis, M.; Okubo, T. Factors governing the formation of hierarchically and sequentially intergrown MFI zeolites by using simple diquaternary ammonium structure-directing agents. Chem. Mat. 2016, 28, 8997–9007. [Google Scholar] [CrossRef]
  32. Lu, B.; Oumi, Y.; Sano, T. Convenient synthesis of large mordenite crystals. J. Cryst. Growth 2006, 291, 521–526. [Google Scholar] [CrossRef]
  33. Bajpai, P.K.; Rao, M.S.; Gokhale, K.V.G.K. Synthesis of mordenite type zeolites. Ind. Eng. Chem. Prod. Res. Dev. 1978, 17, 223–227. [Google Scholar] [CrossRef]
  34. Bordiga, S.; Lamberti, C.; Bonino, F.; Travert, A.; Thibault-Starzyk, F. Probing zeolites by vibrational spectroscopies. Chem. Soc. Rev. 2015, 44, 7262–7341. [Google Scholar] [CrossRef] [PubMed]
  35. Lonyi, F.; Valyon, J. On the interpretation of the NH3-TPD patterns of H-ZSM-5 and H-mordenite. Microporous Mesoporous Mater. 2001, 47, 293–301. [Google Scholar] [CrossRef]
  36. He, P.; Wang, J.H.; Li, Y.; Huang, S.Y.; Wang, M.Y.; Wang, Y.; Lv, J.; Ma, X.B. Efficient synthesis of mordenite zeolite for dimethyl ether carbonylation. Ind. Eng. Chem. Res. 2021, 60, 8085–8093. [Google Scholar] [CrossRef]
  37. Jiao, F.; Pan, X.L.; Gong, K.; Chen, Y.X.; Li, G.; Bao, X.H. Shape-selective zeolites promote ethylene formation from syngas via a ketene intermediate. Angew. Chem. Int. Ed. 2018, 57, 4692–4696. [Google Scholar] [CrossRef]
  38. Emeis, C.A. Determination of integrated molar extinction coefficients for infrared absorption bands of pyridine adsorbed on solid acid catalysts. J. Catal. 1993, 141, 347–354. [Google Scholar] [CrossRef]
  39. Cheng, Z.Z.; Huang, S.Y.; Li, Y.; Cai, K.; Yao, D.W.; Lv, J.; Wang, S.P.; Ma, X.B. Carbonylation of dimethyl ether over MOR and Cu/H-MOR catalysts: Comparative investigation of deactivation behavior. Appl. Catal. A-Gen. 2019, 576, 1–10. [Google Scholar] [CrossRef]
  40. Karger, J.; Valiullin, R. Mass transfer in mesoporous materials: The benefit of microscopic diffusion measurement. Chem. Soc. Rev. 2013, 42, 4172–4197. [Google Scholar] [CrossRef]
  41. Eic, M.; Ruthven, D.M. A new experimental technique for measurement of intracrystalline diffusivity. Zeolites 1988, 8, 40–45. [Google Scholar] [CrossRef]
  42. Vattipalli, V.; Qi, X.; Dauenhauer, P.J.; Fan, W. Long Walks in Hierarchical Porous Materials due to Combined Surface and Configurational Diffusion. Chem. Mat. 2016, 28, 7852–7863. [Google Scholar] [CrossRef]
  43. Han, M.H.; Yin, X.Y.; Jin, Y.; Chen, S. Diffusion of aromatic hydrocarbon in ZSM-5 studied by the improved zero length column method. Ind. Eng. Chem. Res. 1999, 38, 3172–3175. [Google Scholar] [CrossRef]
Figure 1. SEM images of samples with different aging time.
Catalysts 13 01049 g001
Figure 2. XRD patterns of samples with different (a) Si/Al and (b) OH/SiO2 contents.
Catalysts 13 01049 g002
Figure 3. SEM images of samples with different Si/Al contents.
Catalysts 13 01049 g003
Figure 4. SEM images of samples with different OH/SiO2 contents.
Catalysts 13 01049 g004
Figure 5. SEM images of MOR with different H2O/SiO2 contents.
Catalysts 13 01049 g005
Figure 6. SEM images of MOR samples with different sizes.
Catalysts 13 01049 g006
Figure 7. (a) NH3-TPD profiles and (b) Pyridine-IR spectra of samples.
Catalysts 13 01049 g007
Figure 8. Catalytic performance of (a) MOR-0.2, (b) MOR-7, (c) MOR-13 and (d) MOR-24.
Catalysts 13 01049 g008
Figure 9. ZLC desorption data at (a) 313 K, (b) 333 K, (c) 353 K and (d) Arrhenius plots of DME diffusion on catalysts.
Catalysts 13 01049 g009
Figure 10. TG (solid line) and DTG (dashed line) curves of (a) spent MOR-0.2 and (b) spent MOR-24.
Catalysts 13 01049 g010
Table 1. Conditions of hydrothermal synthesis and sizes of products.
SampleSi/Al in GelH2O/SiO2OH/SiO2Aging Time/hSize
/μm
Si/Al in Product
1207.790.5410 × 165.3
2207.790.587 × 15-
3207.790.514 × 75.1
4207.790.6412 × 176.2
5207.790.747 × 18-
6205.790.5417 × 247.0
7206.790.5411 × 22-
8208.790.548 × 145.1
9157.790.5416 × 17-
10257.790.546 × 118.0
11257.790.518 × 136.1
12258.790.543 × 76.5
Table 2. Textural properties of MOR samples with different sizes.
SampleSurface Area (m2·g−1)Pore Volume (cm3·g−1)
BETMicroporeMesoporeTotalMicroporeMesopore
MOR-0.2548526220.2540.2030.051
MOR-756055730.2140.2100.004
MOR-1355955900.2100.2100
MOR-2455054910.2080.2100.002
Table 3. Content of acid sites in MOR samples with different sizes.
SampleBASTotal a (μmol·g−1)LASTotal a (μmol·g−1)BAS12-MR b (μmol·g−1)LAS12-MR b (μmol·g−1)BAS8-MR c (μmol·g−1)TOFMA
(h−1, 1.5 h)
MOR-0.21016681237677799.4
MOR-7138012183215810596.8
MOR-13142110333044011176.4
MOR-2415938762483913454.7
a: calculated based on NH3-TPD; b: calculated based on Py-IR; c: BAS8-MR = BASTotal − BAS12-MR.
Table 4. Summary of diffusion parameters derived from ZLC experiments.
SampleT (K)LD/r2 (s−1)Ea (kJ/mol)
MOR-0.2313123.03.2 × 10−44.7
333117.03.6 × 10−4
353116.03.9 × 10−4
MOR-731399.02.2 × 10−49.6
33391.72.7 × 10−4
35394.33.4 × 10−4
MOR-1331370.62.1 × 10−410.4
33360.32.7 × 10−4
35354.23.2 × 10−4
MOR-2431354.41.8 × 10−412.3
33345.72.2 × 10−4
35354.53.1 × 10−4
Table 5. Carbon content and textural properties of spent MOR-0.2 and MOR-24.
Coke Content (wt.%)
Obtained via TG
C Content (%)
Obtained via XPS
C Content (%)
Obtained via XPS with Etching
BET
Surface Area (m2·g−1)
Micropore Volume (cm3·g−1)
Spent MOR-0.2 416762960.108
Spent
MOR-24
11368040.002
Disclaimer/Publisher’s Note: The statements, opinions and data contained in all publications are solely those of the individual author(s) and contributor(s) and not of MDPI and/or the editor(s). MDPI and/or the editor(s) disclaim responsibility for any injury to people or property resulting from any ideas, methods, instructions or products referred to in the content.

