Article

The Role of Fe in Ni-Fe/TiO2 Catalysts for the Dry Reforming of Methane

Department of Chemical Engineering, University of New Hampshire, Durham, NH 03824, USA
*
Author to whom correspondence should be addressed.
Catalysts 2023, 13(8), 1171; https://doi.org/10.3390/catal13081171
Submission received: 9 June 2023 / Revised: 18 July 2023 / Accepted: 27 July 2023 / Published: 30 July 2023
(This article belongs to the Section Catalysis for Sustainable Energy)

Abstract

:
A series of nickel- and iron-modified titanium dioxide (Ni-Fe/TiO2) are studied for the dry reforming of methane (DRM) at 550 °C. Temperature-programmed surface reactions using CH4 and CO2 as probe molecules, as well as activity results, confirmed that both CO2 and CH4 conversion decreased with the addition of Fe. The XPS results obtained from reduced and used catalysts suggested changes in the surface nickel and iron species. Characterizations, particularly thermogravimetric analysis (TGA) and Raman spectroscopy over used catalysts, revealed that the addition of Fe can greatly inhibit the coke formation. In situ DRIFTS further identified that the addition of Fe favored the formation of carbonate species, which can facilitate the removal of coke deposited on the surface.

Graphical Abstract

1. Introduction

The dry reforming of methane (DRM) plays an important role in sustainability because it can convert two major greenhouse gases through one single reaction, CH 4 + CO 2 2 CO + 2 H 2   [1,2,3]. The mixture of hydrogen and carbon monoxide produced through this reaction can be further transformed into fuels and chemicals through the Fischer–Tropsch reaction [4,5]. Precious metals-based catalysts—particularly, Pt, Ru, Rh, Pd and Ir [6,7,8,9,10]—have been investigated for the dry reforming of methane reactions. Meanwhile, the high cost related to precious metals is unavoidable. Nickel (Ni)-based catalysts emerged as an alternative choice when researchers searched for catalysts with a low cost but comparable activity [11]. However, nickel-based catalysts usually undergo severe deactivation during the reaction because of changes in the physical and chemical properties of metals, such as the change in the oxidation state [12], metal sintering [13,14], and coke formation [15,16]. Among all possibilities, coking is often accepted as a primary reason for the occurrence of catalyst deactivation over nickel-based catalysts [17].
In order to minimize the impact of deactivation, particularly coke formation, a variety of secondary metals, including Ru [18], Re [19], Ir [20], Fe [21], Co [22] and Cu [23], have been studied for nickel-based bimetallic catalysts. The increase in nickel dispersion and the adjustment of the redox property are attributed to this improvement [24]. Among the choice of second metals, iron (Fe) is particularly promising simply because of its abundance and low cost. Kim [25,26] suggested that FeO species facilitate the oxidation of coke to CO when nickel and iron are supported over MgAl2O4. Theofanidis also investigated the Ni-Fe/MgAl2O4 catalysts which were prepared with the incipient wetness impregnation method. They suggested the lattice oxygen from FeOx [27] and the location of Fe [28] are important in improving coke resistance. Meanwhile mesoporous Al2O3 support did not inhibit coke formation; even the formation of the Ni-Fe alloy was observed [29]. Clearly, the choices of synthesis methods and supports would affect the catalytic performance of Ni-Fe-supported catalysts. The addition of Fe also greatly impacted the structure of Ni species [30,31]. The formation of smaller nickel particles and improved metal dispersion on LaNi0.5Fe0.5O3 were suggested to inhibit the coke formation [32,33]. Decreased nickel particle sizes were also reported over the Ni-Fe/MgO catalyst [34]. The change in nickel particles facilitated the coke gasification reaction.
It is notable that coke deposition is favorable while the reaction temperature is below 600 °C [35]. This explains why the dry reforming of methane is often studied at temperatures above 650 °C. Meanwhile, we chose a reaction temperature of 550 °C to study how and why the addition of iron would minimize the coke formation [36]. Also, the choice of titanium dioxide (TiO2) is mainly because of its unique redox property and low cost [37]. The nickel- and iron-modified TiO2 catalysts (Ni-Fe/TiO2) are synthesized through the co-precipitation method. Temperature-programmed reactions using different probe molecules, including H2, CH4 and CO2, were applied to understand the dynamic changes in surface properties. The used catalysts were further characterized through X-ray photoelectron spectroscopy (XPS), thermogravimetric analysis (TGA) and Raman spectroscopy.

2. Results and Discussion

2.1. Redox Properties

Hydrogen–temperature-programmed reduction (H2-TPR) was applied to study the surface reduction process over Ni/TiO2, Fe/TiO2 and Ni-Fe/TiO2 catalysts. As shown in Figure 1, the peak fitting analysis was employed to gain an understanding of the H2-TPR profiles of calcined catalysts. Three reduction peaks were identified over the Ni/TiO2 catalyst. Peaks shown at 216 °C and 243 °C are related to the reduction in bulk NiO species [38]. The hydrogen consumption based on those two reduction peaks is 0.92 mmol H2/gcatalyst. The peak shown at 320 °C can be assigned to the reduction in NiO species, which strongly interact with TiO2 support [38]. The hydrogen consumption based on the reduction peak at 320 °C is 0.63 mmol H2/gcatalyst. The different amount of hydrogen consumption suggested that the bulk NiO species prevail over the Ni/TiO2 catalyst. For the Fe/TiO2 catalyst, three reduction peaks were also identified. The reduction peak at 270 °C is assigned to the reduction of Fe2O3 to Fe3O4 [39,40]. Meanwhile, the reduction peaks shown at 365 °C and 560 °C are assigned to the step reduction of Fe3O4 through the sequences of Fe3O4→ FeO → Fe0 [39,40]. As shown in Table 1, the total hydrogen consumption over the Fe/TiO2 catalyst is 2.64 mmol H2/gcatalyst, which is higher than that of the Ni/TiO2 catalyst.
The H2-TPR profiles of the bimetallic Ni–Fe/TiO2 catalysts are different from those profiles of the Ni/TiO2 and Fe-TiO2 catalysts. The reduction in bulk NiO species still appeared at 216 °C. The addition of Fe affects the Ni–TiO2 interaction, which was confirmed by the appearance of a reduction peak shown around 265 °C. The hydrogen consumption corresponding to the 265 °C reduction decreased with the increase in iron loading. The hydrogen consumption is 1.6 mmol H2/gcatalyst for Ni3Fe1/TiO2 (shown in Table 1) but is decreased to 0.37 mmol H2/gcatalyst for Ni1Fe3/TiO2. Considering that this reduction peak is close to the 270 °C reduction observed over the Fe/TiO2 catalyst, this reduction peak may be attributed to the reduction in Fe2O3 species. A high reduction peak is observed for all Ni-Fe/TiO2 catalysts. Similar to previous studies of Ni-Fe/TiO2 catalysts [41], this reduction peak may be associated with the reduction of FeO → Fe0. Interestingly, a reduction peak close to 365 °C is identified over Ni1Fe3/TiO2. It is suggested that iron nanoparticles may form when the iron loading is increased [41].

2.2. Methane–Temperature-Programmed Surface Reaction followed by Differential Thermogravimetry (CH4-TPSR/DTG)

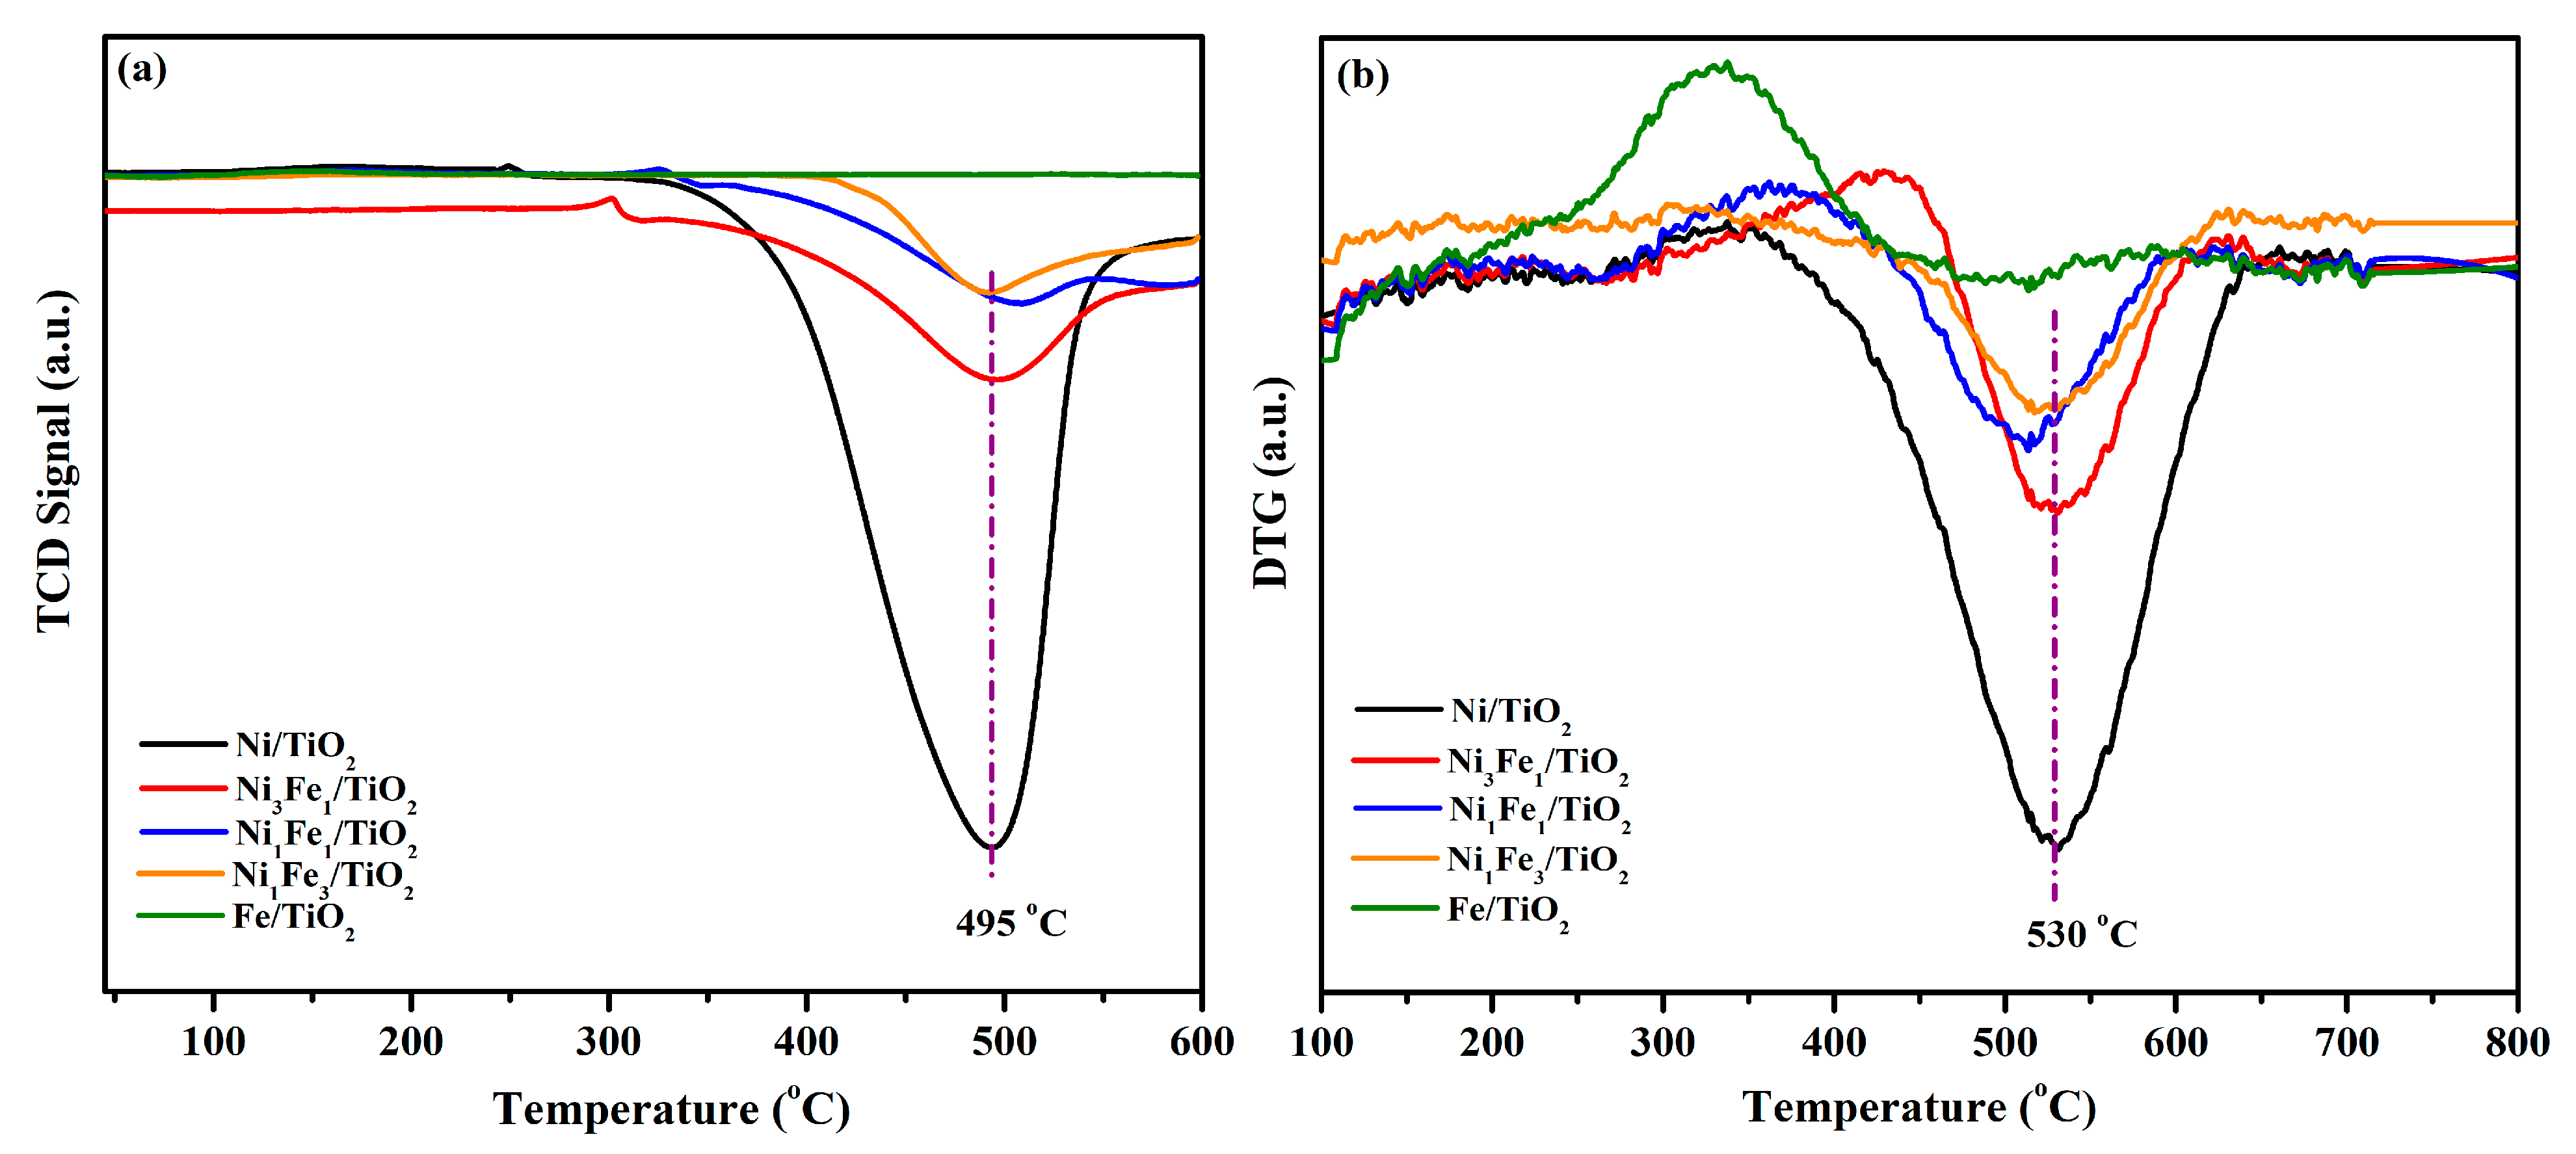
The effect of the addition of iron on the methane activity was studied with a CH4–temperature-programmed surface reaction (CH4-TPSR). As shown in Figure 2a, the activation of CH4 starts at temperatures as low as 350 °C, and the transient activity of methane increases up until 495 °C over the Ni/TiO2 catalyst. Meanwhile, no activity was observed over the Fe/TiO2 catalyst. It suggested that nickel is the active species for CH4 conversion [27,28]. The bimetallic Ni-Fe/TiO2 catalysts showed a similar CH4-TPSR profile as the Ni/TiO2 catalyst, but the peak intensity decreased with the increase in iron loading. The differences between Ni/TiO2 and Ni-Fe/TiO2 can be explained by the change in the Ni–TiO2 interaction with the addition of Fe [42,43]. Differential thermogravimetry (DTG) was applied to investigate the carbon formation through methane decomposition. The amount of carbon deposited on the surface was calculated. The value was 93.6 mg/gcatalyst over Ni/TiO2 and dropped to 16.3 mg/gcatalyst over the Ni3Fe1/TiO2 catalyst. The decrease suggested that iron may inhibit carbon deposition on the surface. In Figure 2b, the peak observed at 530 °C may be correlated with the formation of an amorphous type of carbon during CH4-TPSR [44]. Because all peak temperatures observed over the Ni-Fe/TiO2 catalysts are close to that of the Ni/TiO2 catalyst, the introduction of Fe may not impact the type of carbon formed through methane decomposition.

2.3. Carbon Dioxide–Temperature-Programmed Surface Reaction followed by Hydrogen–Temperature-Programmed Reduction (CO2-TPSR/H2-TPR)

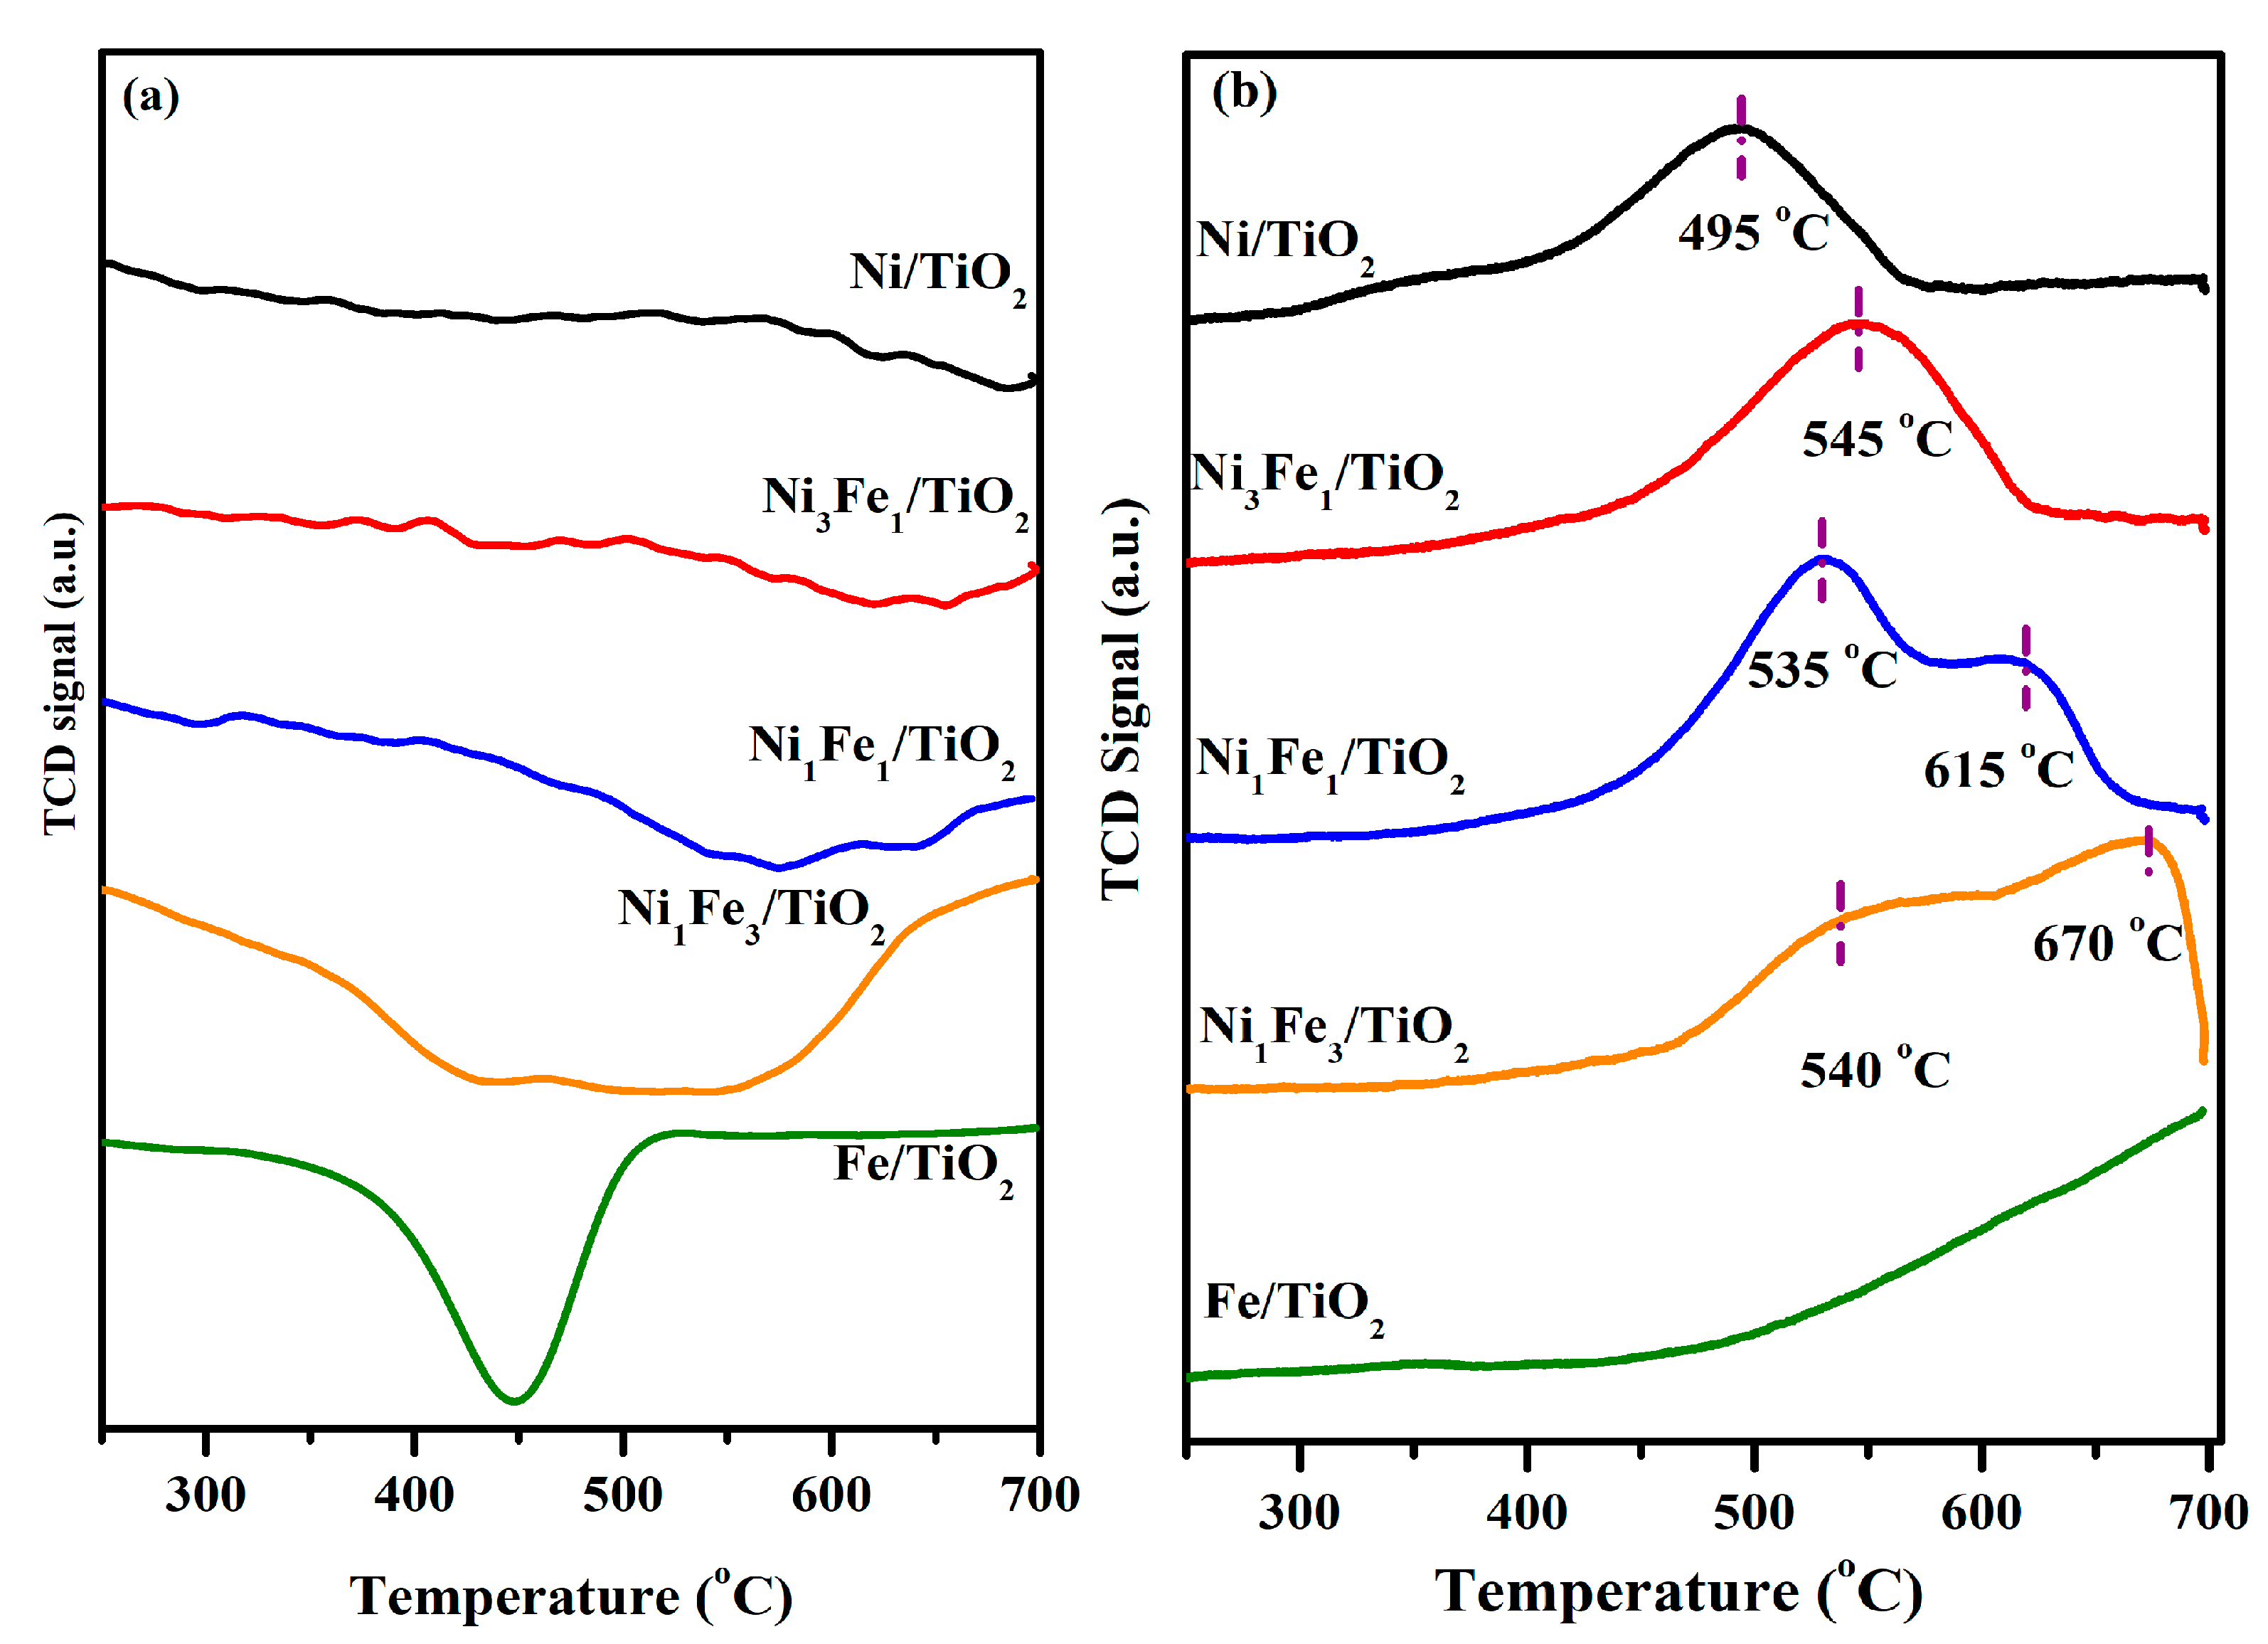
The carbon dioxide–temperature-programmed surface reaction, followed by a hydrogen–temperature reduction (CO2-TPSR/H2-TPR) technique, was applied to study CO2 adsorption and activation over surfaces of reduced catalysts. As shown in Figure 3a, Fe/TiO2 showed maximum CO2 transient activity at 450 °C, while Ni/TiO2 showed CO2 transient activity around 700 °C. This may be explained by the fact that reduced iron species can be easily oxidized by carbon dioxide compared to that of nickel species on the surface [25,27]. H2-TPR profiles obtained after CO2-TPSR tests over Ni/TiO2, Ni-Fe/TiO2 and Fe/TiO2 catalysts are shown in Figure 3b. A distinct hydrogen consumption peak at 495 °C was observed over the Ni/TiO2 catalyst. However, the reduction peak starts to appear after 500 °C over the Fe/TiO2 catalyst. Meanwhile, reduction peaks observed over Ni-Fe/TiO2 catalysts started around 400 °C. With the increase in iron loading, the splitting of reduction peaks occurred, and the shoulder peak was shifted to a higher temperature. Peaks located below 600 °C may be related to Ni sites [45], while peaks located above 600 °C are related to active Fe sites [45]. As shown in Table S1 (in the Supplementary Materials), the amount of H2 consumed during H2-TPR after CO2-TPSR increased with the increase in Fe loading. The values are 0.97 mmol/gcatalyst over the Ni/TiO2 catalyst and 3.05 mmol/gcatalyst over the Ni1Fe3/TiO2 catalyst.

2.4. Catalytic Activity Tests

The catalytic performance in the dry reforming of methane was evaluated at 550 °C. The total metal concentrations before/after the pretreatment were determined by the inductive couple plasma (ICP). The actual nickel and iron concentrations are close to the designed loading, shown in Table S2 (in the Supplementary Materials). Figure 4a,b show CH4 conversion and CO2 conversion, respectively. The CH4 and CO2 conversion over Ni/TiO2 after a 6 h time-on-stream (TOS) was 58% and 31%, respectively, while the H2/CO ratio increased up to 0.94 after a 6 h time-on-stream. The equilibrium calculations were performed using Aspen Plus V11. While calculating the equilibrium compositions, both the dry reforming of the methane reaction and the reverse water gas shift reaction were considered. The conversions at equilibrium are 48% for CH4 and 57% for CO2. The equilibrium H2/CO ratio was 0.83. The CH4 conversion and H2/CO ratio being higher than the equilibrium level suggested that CH4 decomposition may occur as a side reaction [42]. This is further confirmed by the calculation of the carbon balance. As shown in Table S3 (in the Supplementary Materials), the C balance decreased over Ni/TiO2 during DRM from 86% to 83% at 1 h to 6 h time-on-stream periods. Similar observations for Ni-based catalysts are reported by others [42,46,47].
For Ni3Fe1/TiO2, the CH4 conversion was 34% after a 6 h time-on-stream, while the CO2 conversion was 37% after a 6 h time-on-stream, which was slightly higher than that of Ni/TiO2. The higher CO2 conversion observed over the Ni3Fe1/TiO2 catalyst suggested that the addition of Fe may accelerate the reverse water gas shift (RWGS) reaction. The H2/CO ratio is applied as an indicator of side reactions, including RWGS and CH4 decomposition. The value of the H2/CO ratio over Ni3Fe1/TiO2 remained 0.8 throughout DRM, which is near the thermodynamic equilibrium. The increase in iron loading could lead to a decrease in both CH4 and CO2 conversion. This may be explained by the decreased Ni concentration, which was suggested to passivate H2 formation and selectivity [25]. As shown in Table S3 (in the Supplementary Materials), the C balance after 6 h on stream was 97% and 98% over Ni1Fe1/TiO2 and Ni1Fe3/TiO2, respectively. Clearly, the presence of Fe improved the C balance. This may be explained by the role of Fe in promoting the gasification of carbon species during DRM [27].
The CH4 decomposition reaction was also carried out at 550 °C to further confirm the impact from the methane decomposition. As shown in Figure S1a (in the Supplementary Materials), a maximum conversion of CH4 was observed over the Ni/TiO2 catalyst, while all Ni-Fe/TiO2 catalysts showed a lower CH4 conversion than that of Ni/TiO2. It is suggested that Ni is an active site for decomposing CH4, while the addition of Fe would inhibit CH4 dissociation. Figure S1b (in the Supplementary Materials) showed CO formation during CH4 decomposition. The maximum CO formation was observed over the Ni1Fe3/TiO2 catalyst. It is suggested that the addition of Fe to Ni/TiO2 could be beneficial in oxidizing carbon during the CH4 decomposition reaction [25,27].

2.5. XPS Analysis

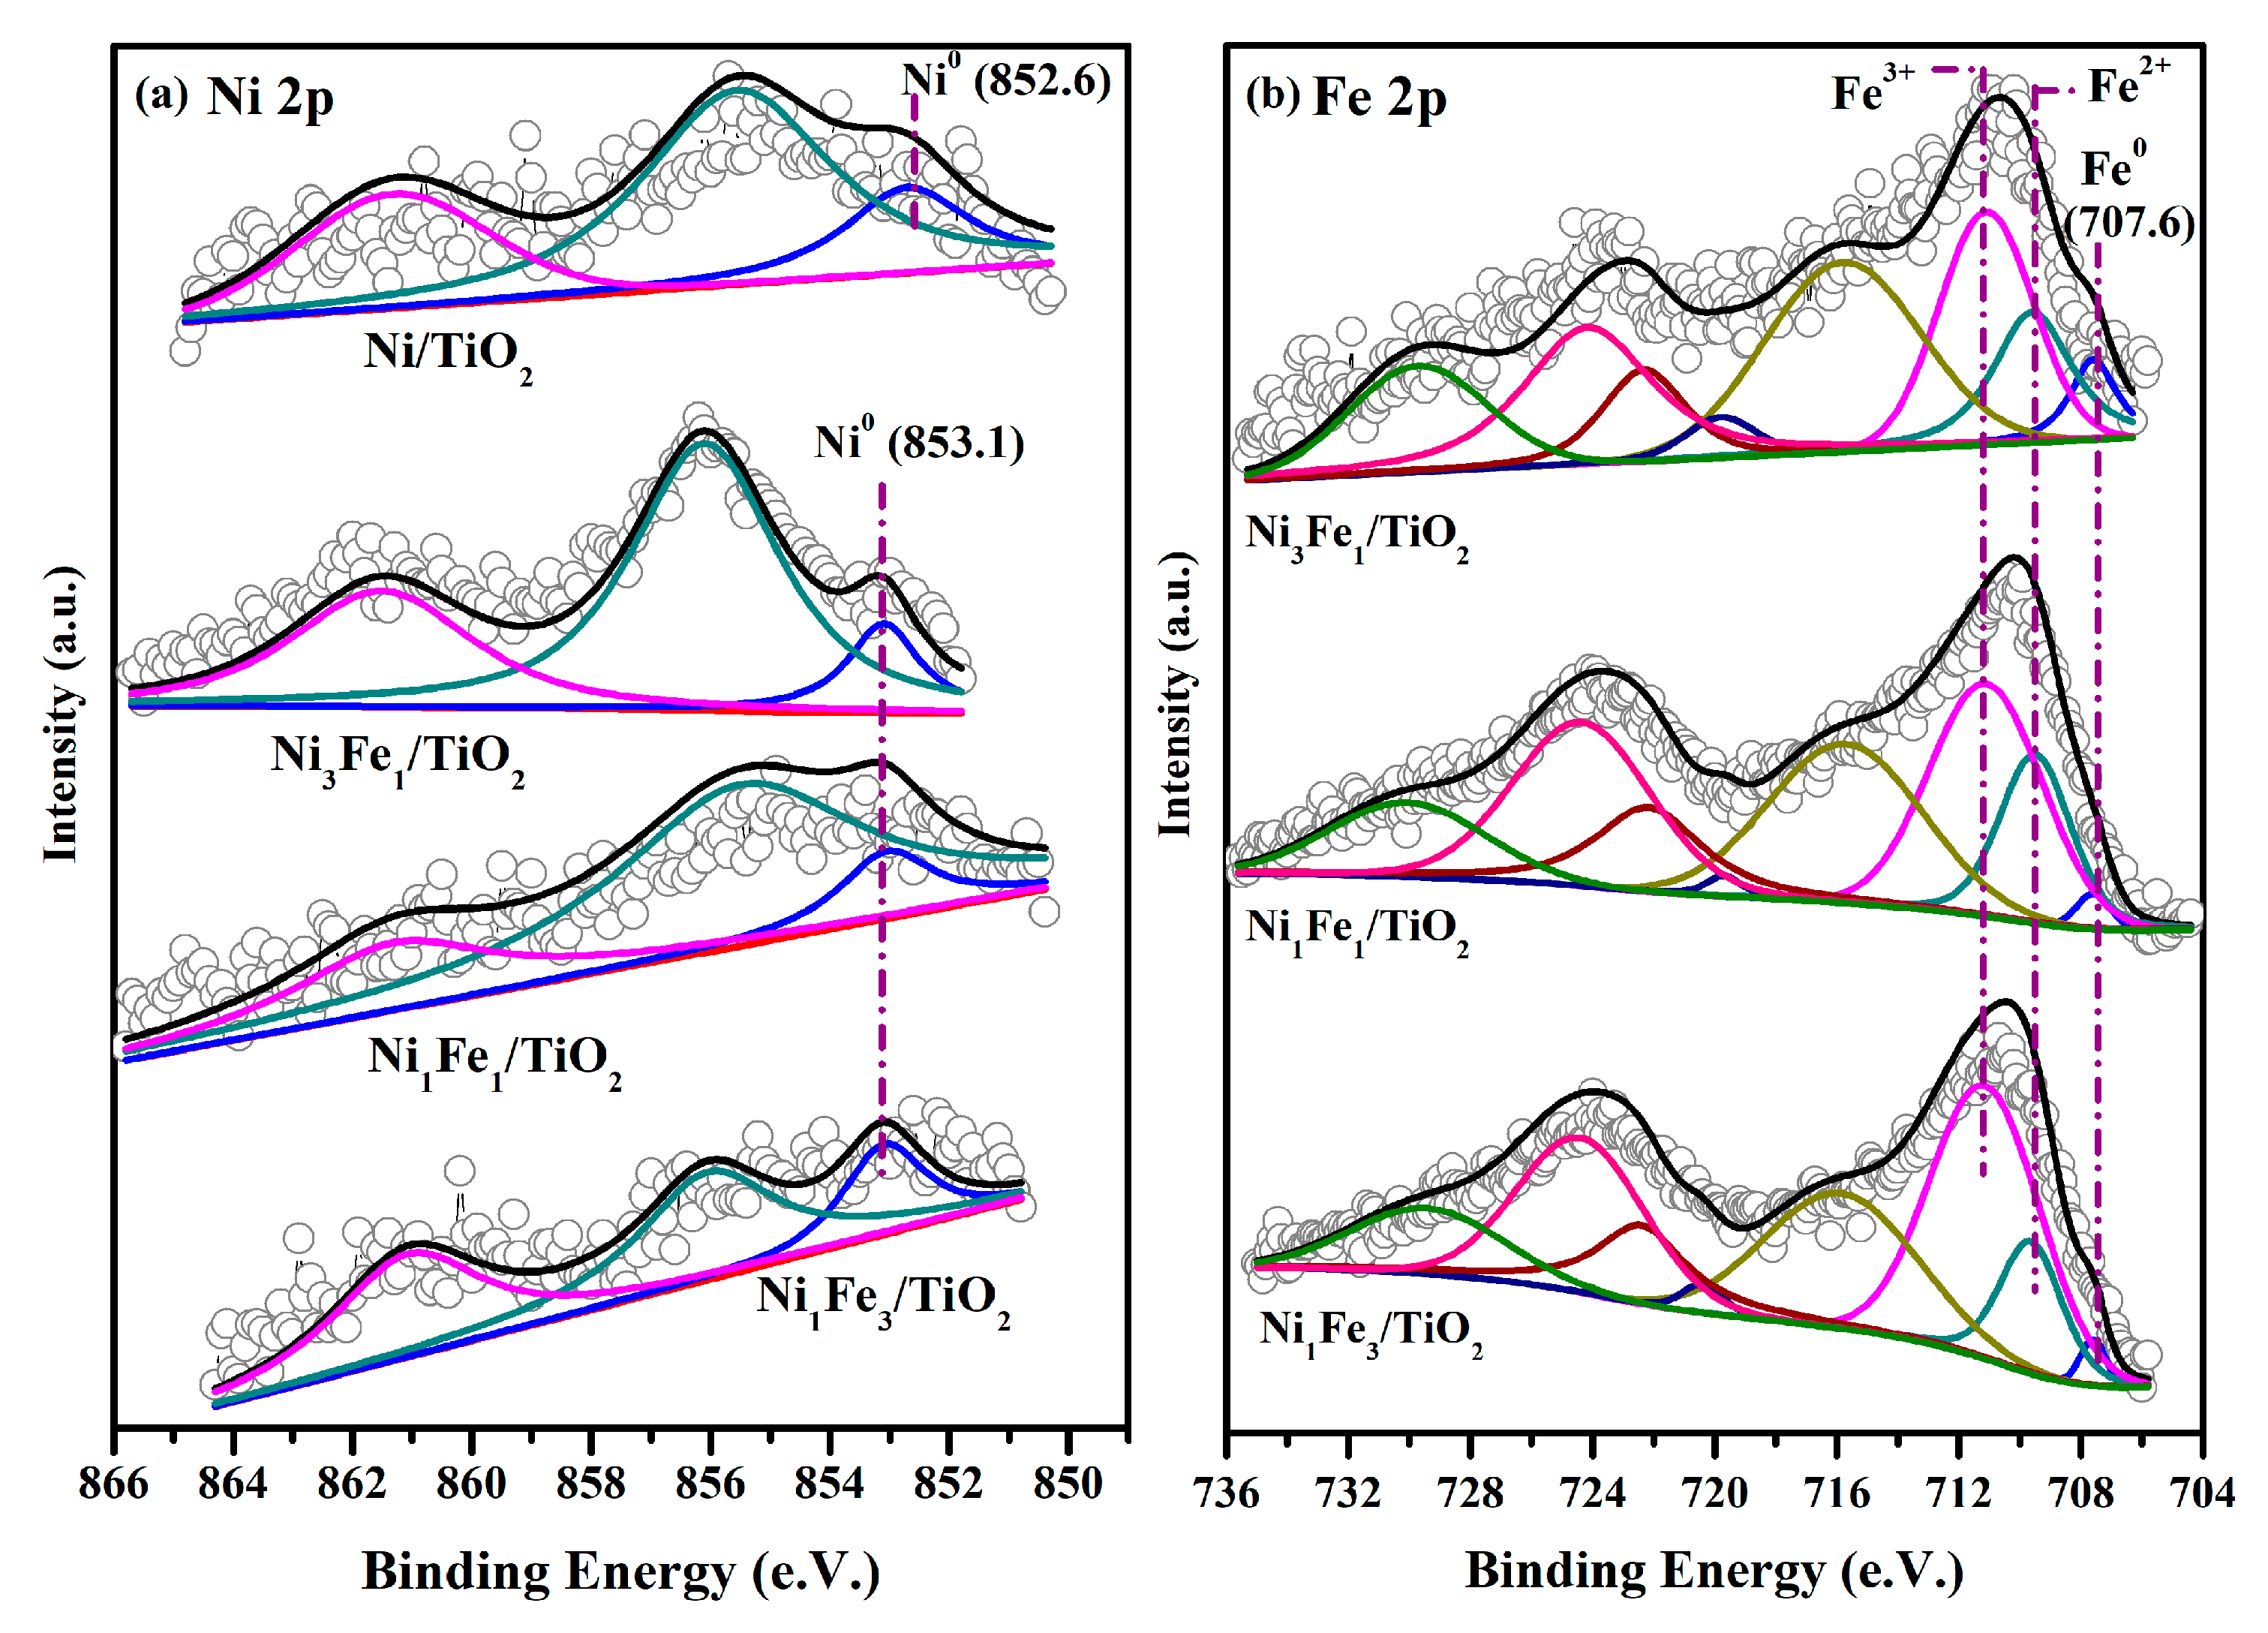
Catalysts after the pretreatment and after the reaction were characterized by XPS. The peak fitting analysis was applied to gain information about the oxidation states of surface species. For the reduced Ni/TiO2 catalyst, shown in Figure 5a, the peak centered at 852.6 eV is related to the Ni0 2p3/2 species [29]. The peak located at 855.6 eV is assigned to Ni2+ 2p3/2, which may be related to NiO species interacting with Fe species [45]. For all Ni-Fe/TiO2 catalysts, the Ni0 peak appears at 853.1 eV. A chemical shift of +0.5 eV compared to Ni0 in Ni/TiO2 was also identified. The chemical shift suggested that the addition of Fe in Ni/TiO2 promoted Ni–Fe interaction. Meanwhile, the Ni2+ 2p3/2 peak in Ni3Fe1/TiO2 is centered at 856.1 eV, which is +0.5 eV higher than that of Ni2+ in Ni/TiO2. Those results indicated that the addition of Fe to Ni/TiO2 promoted nickel–iron interactions.
The peak fitting analysis of the Fe 2p spectra for all the Ni-Fe/TiO2 catalysts is shown in Figure 5b. Three distinct Fe 2p3/2 peaks are identified due to the different oxidation states of Fe. Generally, 706.8 eV is attributed to Fe0, while Fe2+ and Fe3+ are related to 709.6 eV and 711.2 eV, respectively [45,48]. While considering the formation of Ni-Fe interactive species, the peak centered at 707.6 eV is assigned to Fe0. The existence of Ti3+ species was confirmed by the peak located at 457.3 eV and 462.1 eV, as shown in Figure S2. The Ti3+ species can be explained by the pre-reduction treatment [49,50]. The molar composition of the surface O/Ti ratio is listed in Table 2. For all the reduced catalysts, the values are lower than the stoichiometry ratio, which suggested the formation of oxygen vacancies. The surface concentrations of Ni and Fe species were determined by the relative ratio of Fe/(Ni+Fe) on the surface. This ratio obtained from the reduced Ni3Fe1/TiO2 is 0.49, which is higher than the designed ratio of iron to nickel. The increase in iron loading resulted in the increase in this ratio. Therefore, the pre-reduction led to the increase in surface iron species.
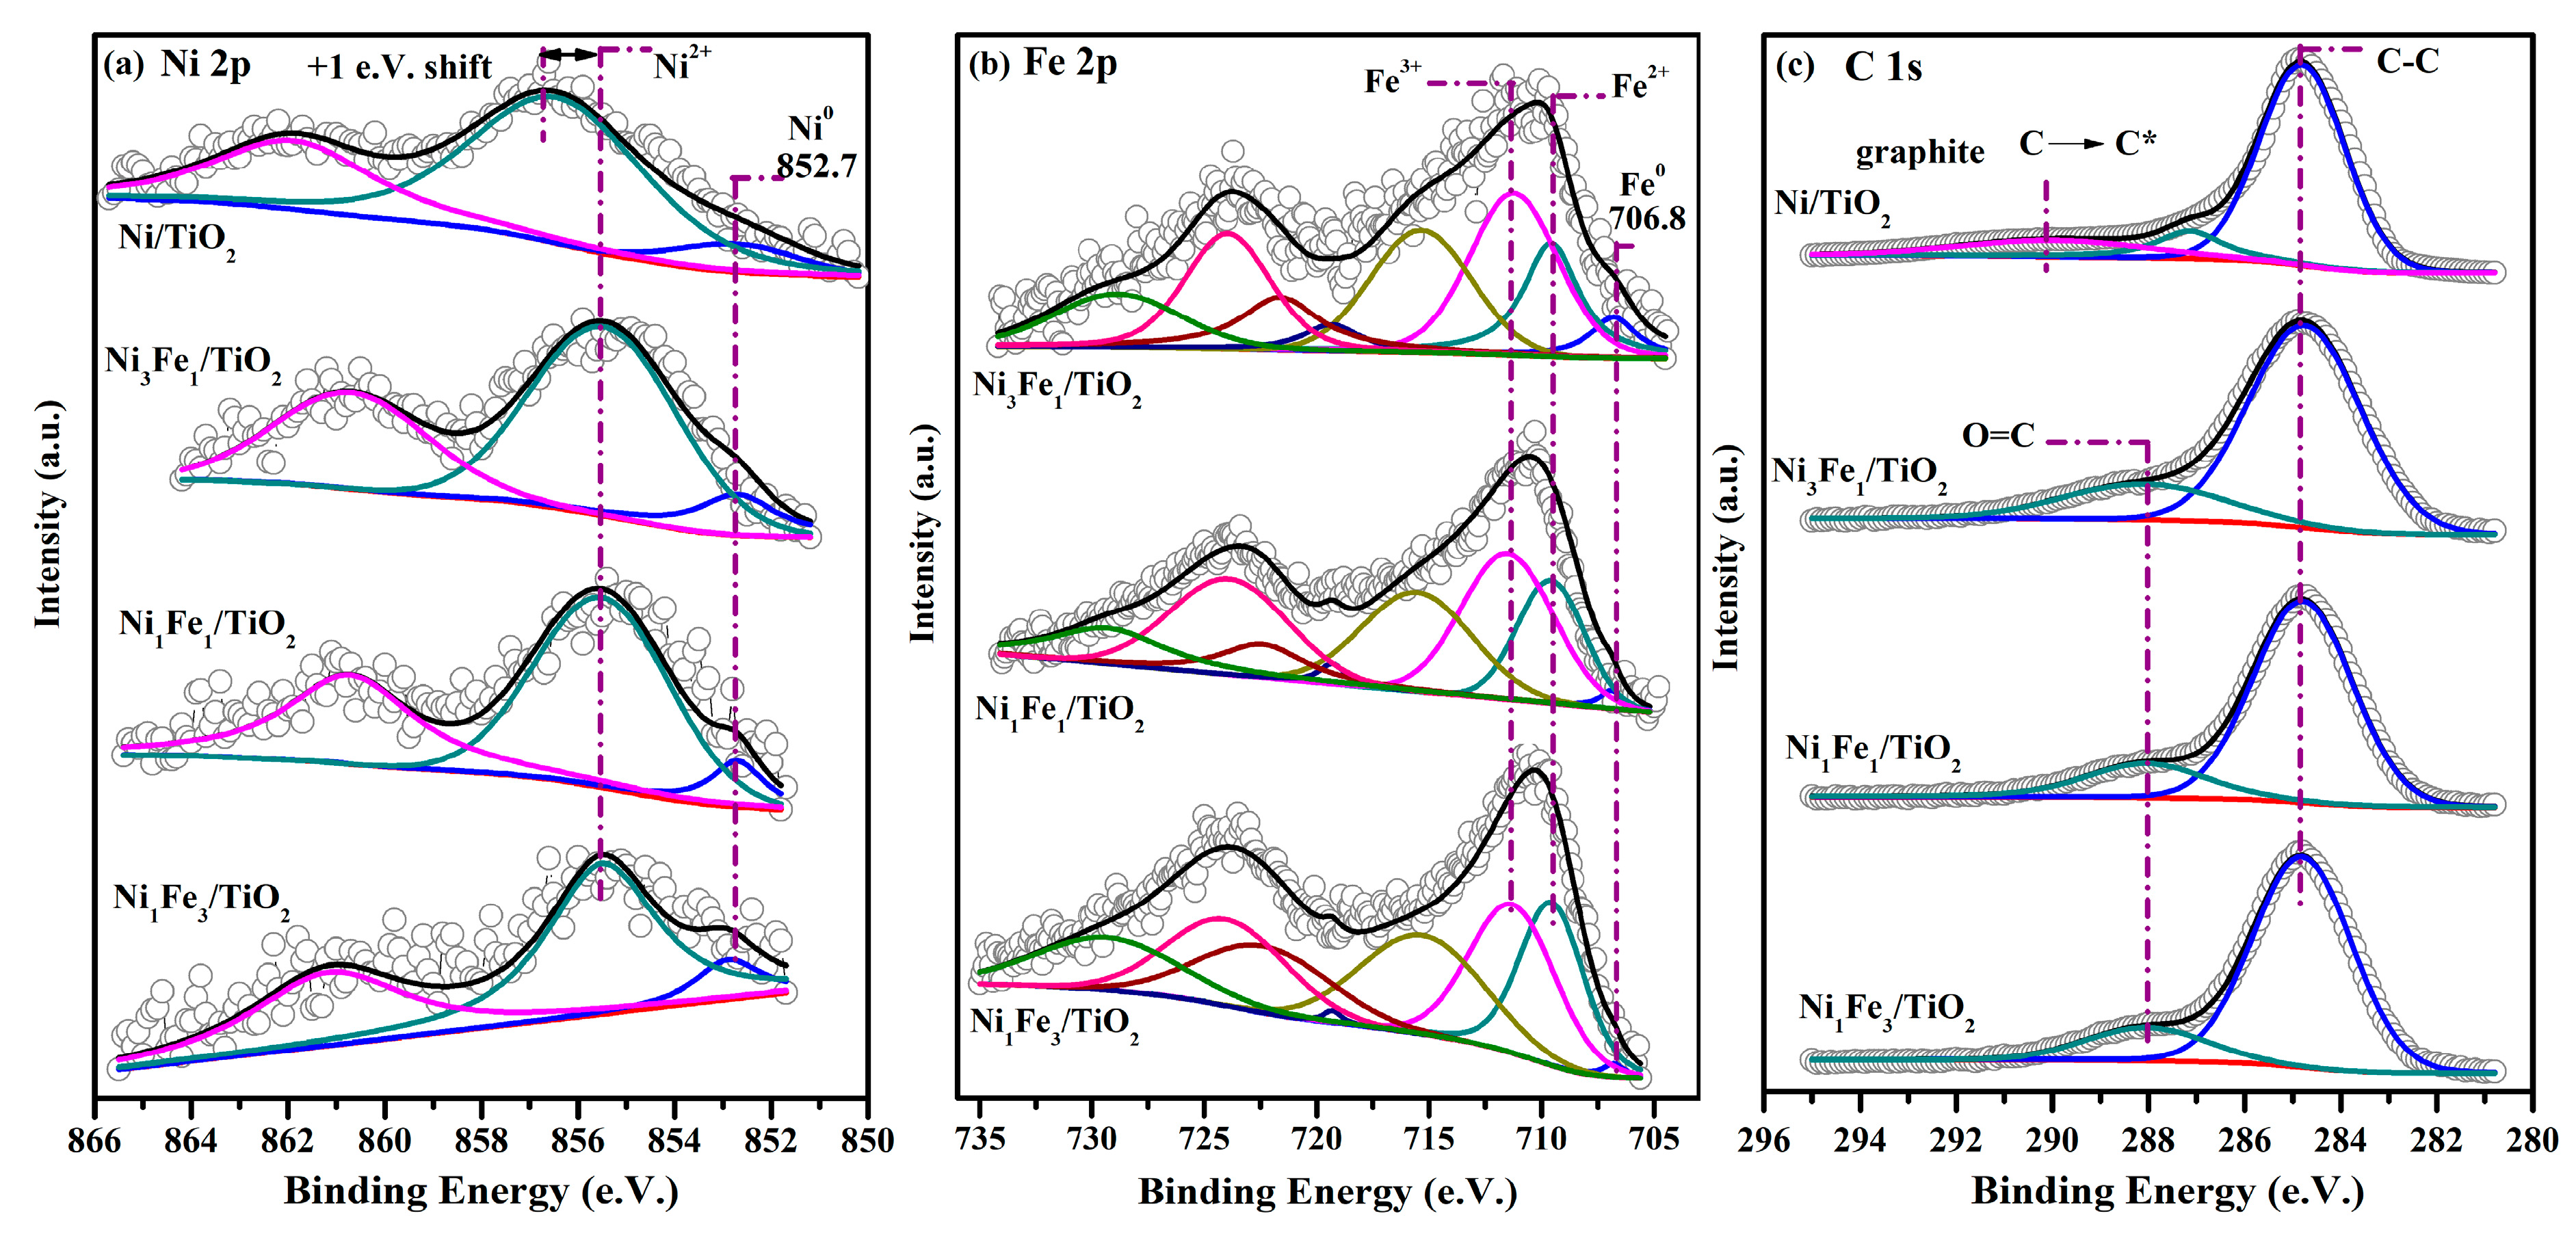
The XPS profiles of used catalysts after the dry reforming of the methane reaction are shown in Figure 6. The peak located at 852.7 eV confirmed the existence of Ni0 species. Compared with the used Ni-TiO2 catalyst, the peak related to Ni2+ species observed over the used Ni-Fe/TiO2 catalysts showed a chemical shift of +1 eV. It suggested that the interaction between nickel and titanium dioxide was enhanced during DRM tests. A peak at 290.9 eV is identified based on the C 1s spectra of the used catalysts. This characteristic peak is assigned to graphitic-type carbon species due to π → π* transitions [34,51]. The peak shown at 288 eV is observed over all used catalysts. It is assigned to C=O-type carbonate species. The presence of such carbonate species would modify the coke inhibition/resistance property of Ni-Fe/TiO2 catalysts.
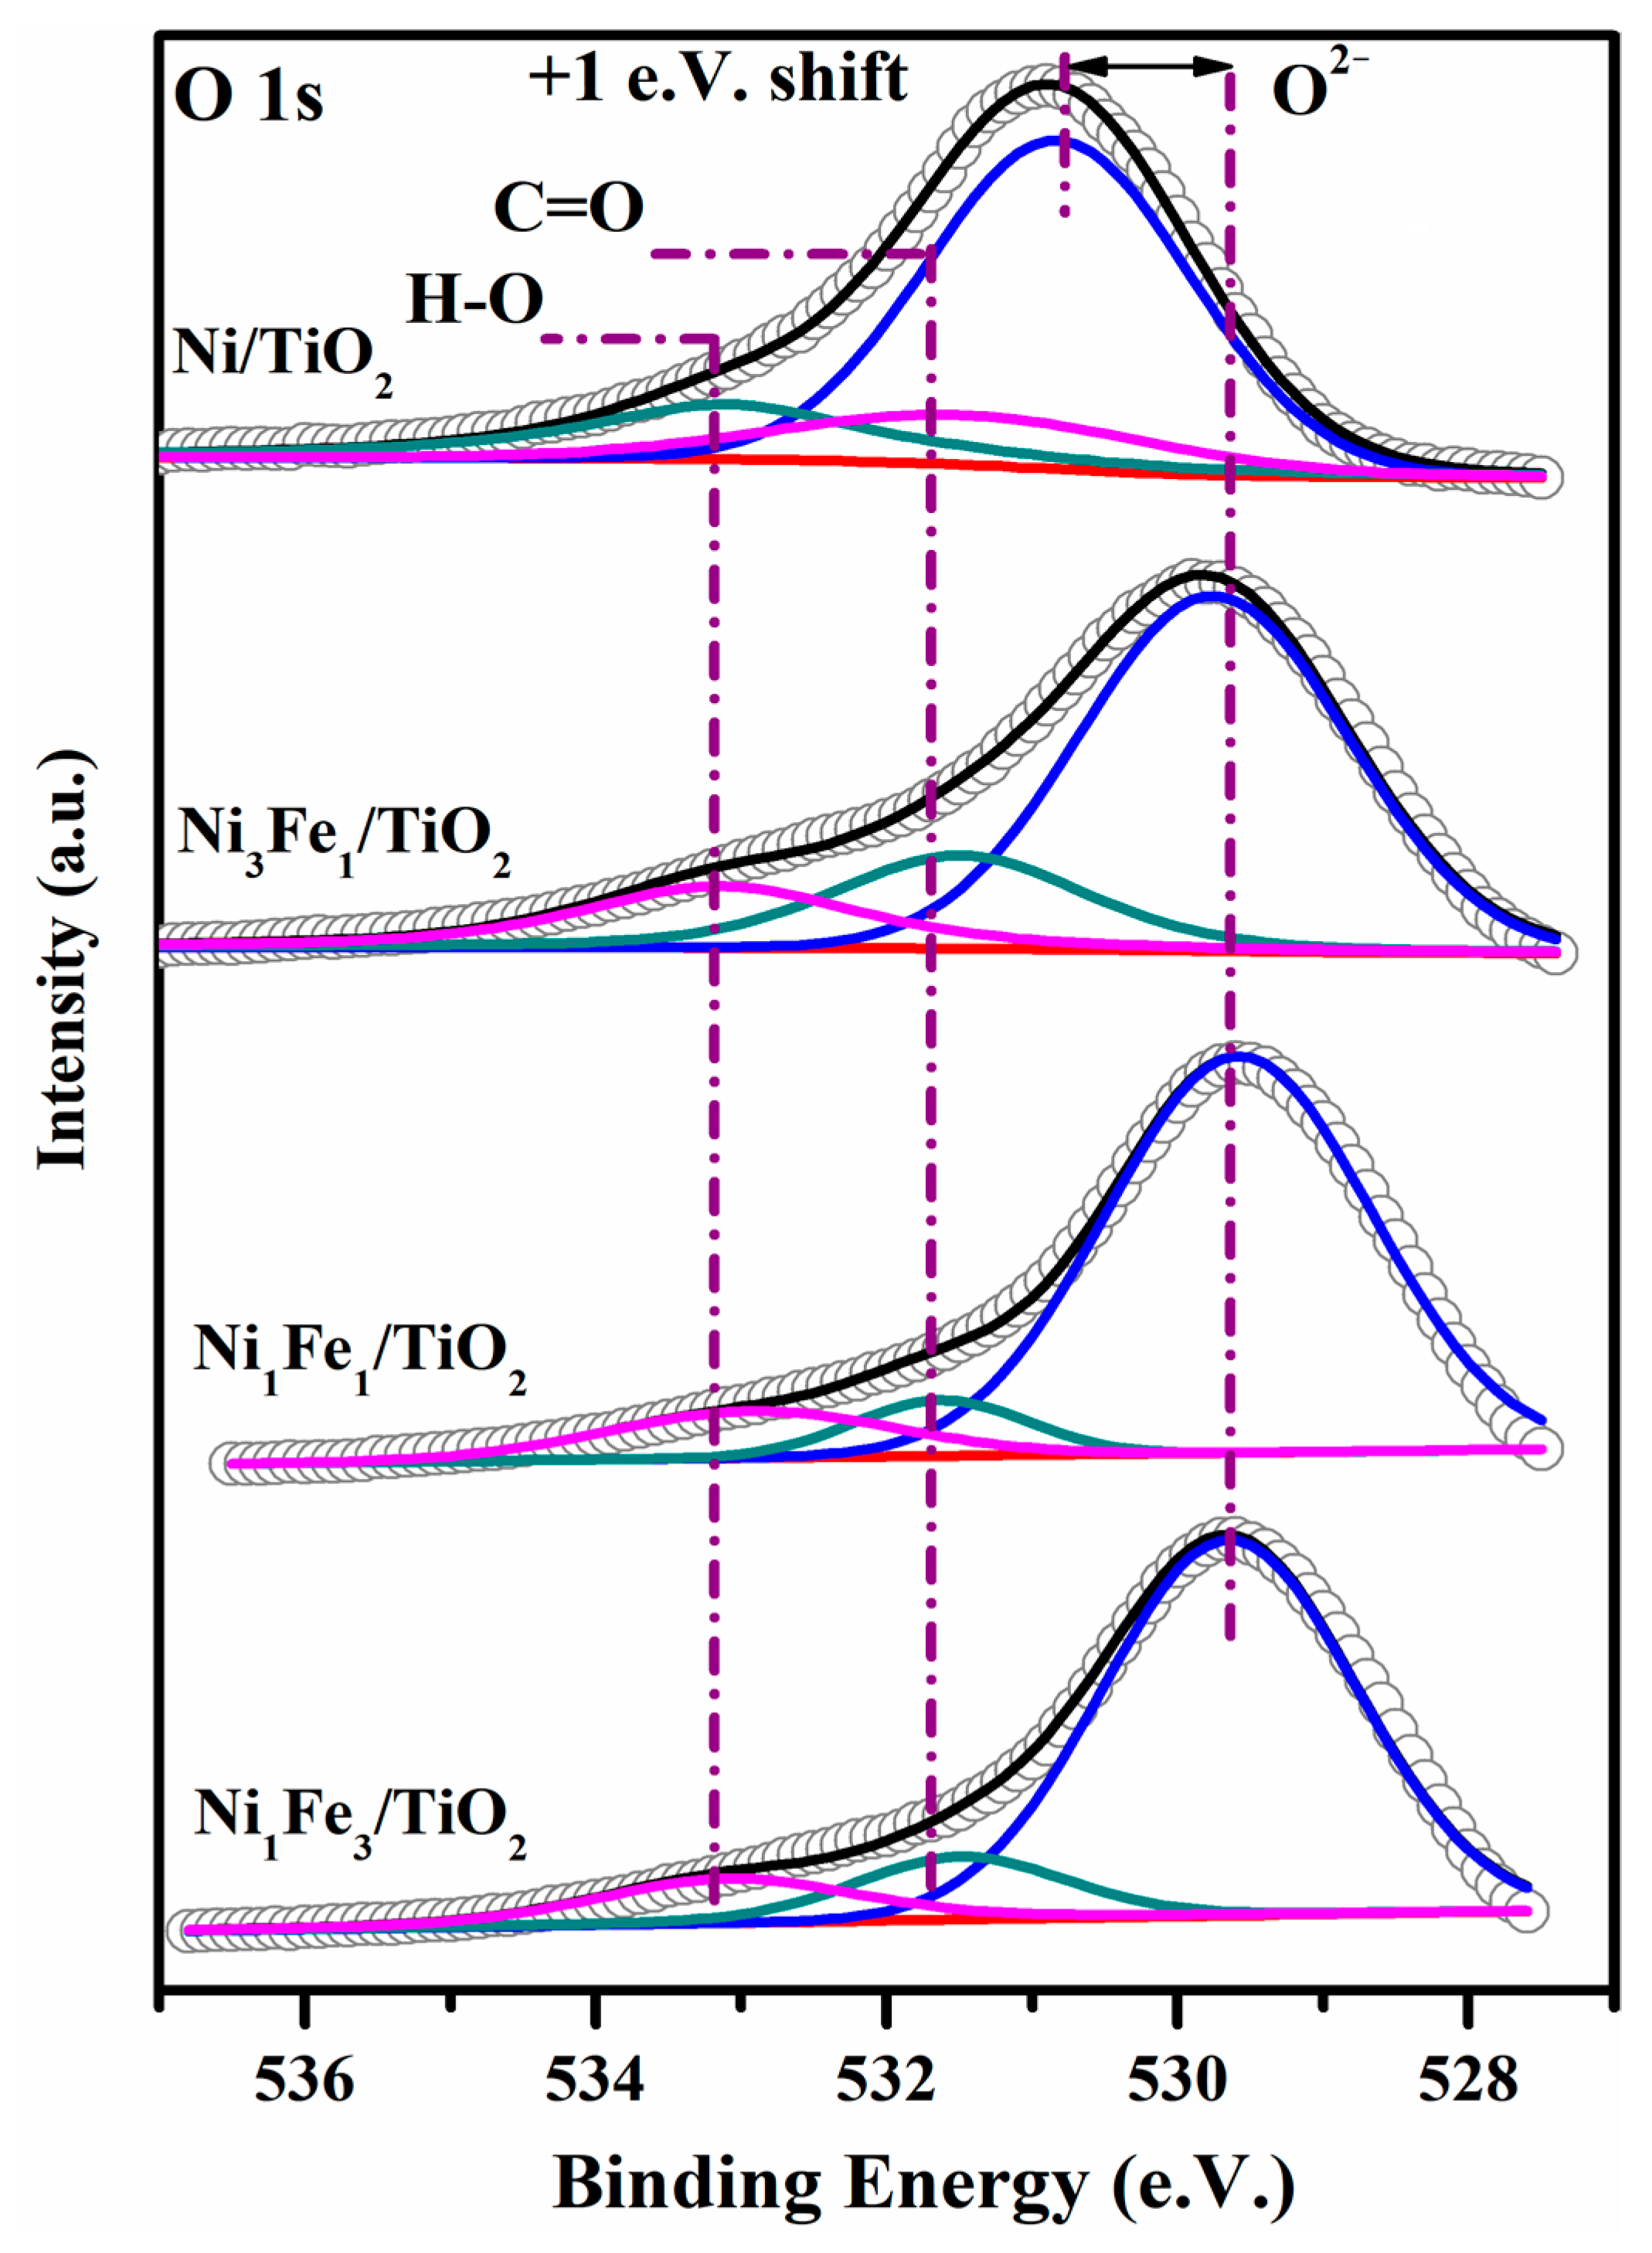
Figure 7 show O 1s spectra over the used Ni/TiO2 and used Ni-Fe/TiO2 catalysts after the reaction. The application of the peak fitting analysis to XPS spectra made it possible to identify three surface oxygen species. The lattice oxygen species (O2−) from metal oxide is related to the peak located at 529.7 eV [52,53]. After the reaction, this peak was shifted by +1 eV to 530.7 eV over the Ni/TiO2 catalyst. The surface carbonates (C=O) species is related to the peak located at 531.5 eV [34]. Meanwhile, the 533.1 eV peak is assigned to the hydroxyl group (O-H) [52,53]. The surface adsorbed oxygen species could facilitate coke oxidation during the reforming reaction [34].

2.6. Thermogravimetric Analysis

CH4 decomposition has been suggested as a major source of carbon deposition [54]. Two types of coke, namely, amorphous coke and graphite coke, are formed during the decomposition of methane [44]. Amorphous coke, which is usually oxidized below 600 °C, is suggested to be more active compared to graphite coke. The oxygen sources are assumed to come from either lattice oxygen from reducible supports, including TiO2 [54], or oxygen species from the CO2 dissociation. When an excess amount of amorphous coke is present on the catalyst surface, it can be easily nucleated and transformed into graphite coke. Meanwhile, the cumulation of graphite coke could eventually encapsulate the active nickel sites, thereby resulting in catalyst deactivation [55]. An optimum balance between the coke formation and the oxidation of coke plays an important role in preventing reforming catalysts from deactivation due to coke formation. To estimate the amount and identify the type of carbon deposited during the dry reforming reaction, the thermogravimetric analysis (TGA) was applied to the used catalysts. TGA profiles of Ni/TiO2 and Ni-Fe/TiO2 are shown in Figure S3 (in the Supplementary Materials). A weight loss of about 31.3 wt% was observed over the used Ni/TiO2, which is equivalent to 51.9 mgcokeh−1gcatalyst−1. Figure 8a shows the first-order derivative of the TGA curve from Ni/TiO2. The asymmetric peak can be deconvoluted into two peaks. The amorphous type of coke is related to the peak located at 550 °C [44]. The formation rate of amorphous coke is 24.9 mgcokeh−1gcatalyst−1. Meanwhile, the graphitic type of carbon is related to the peak around 615 °C. The formation rate of graphitic carbon is 27 mgcokeh−1gcatalyst−1.
The introduction of Fe significantly inhibited coke deposition, as shown in Figure 8b. Although both amorphous and graphitic carbon existed over those used Ni-Fe/TiO2 catalysts, the intensity is marginal. Taking Ni3Fe1/TiO2 as an example, the amount of coke formation was calculated as 0.48 wt%, which is equivalent to 2.5 mgcokeh−1gcatalyst−1. Compared with Ni/TiO2, the coke deposits were decreased by a factor of 21 over Ni3Fe1/TiO2. Interestingly, no carbon deposits were found over Ni1Fe1/TiO2 and Ni1Fe3/TiO2 catalysts after the reaction. Our results confirmed the role of Fe in inhibiting coke deposition over Ni-Fe-based catalysts [25,26,29,34].

2.7. Raman Spectroscopy

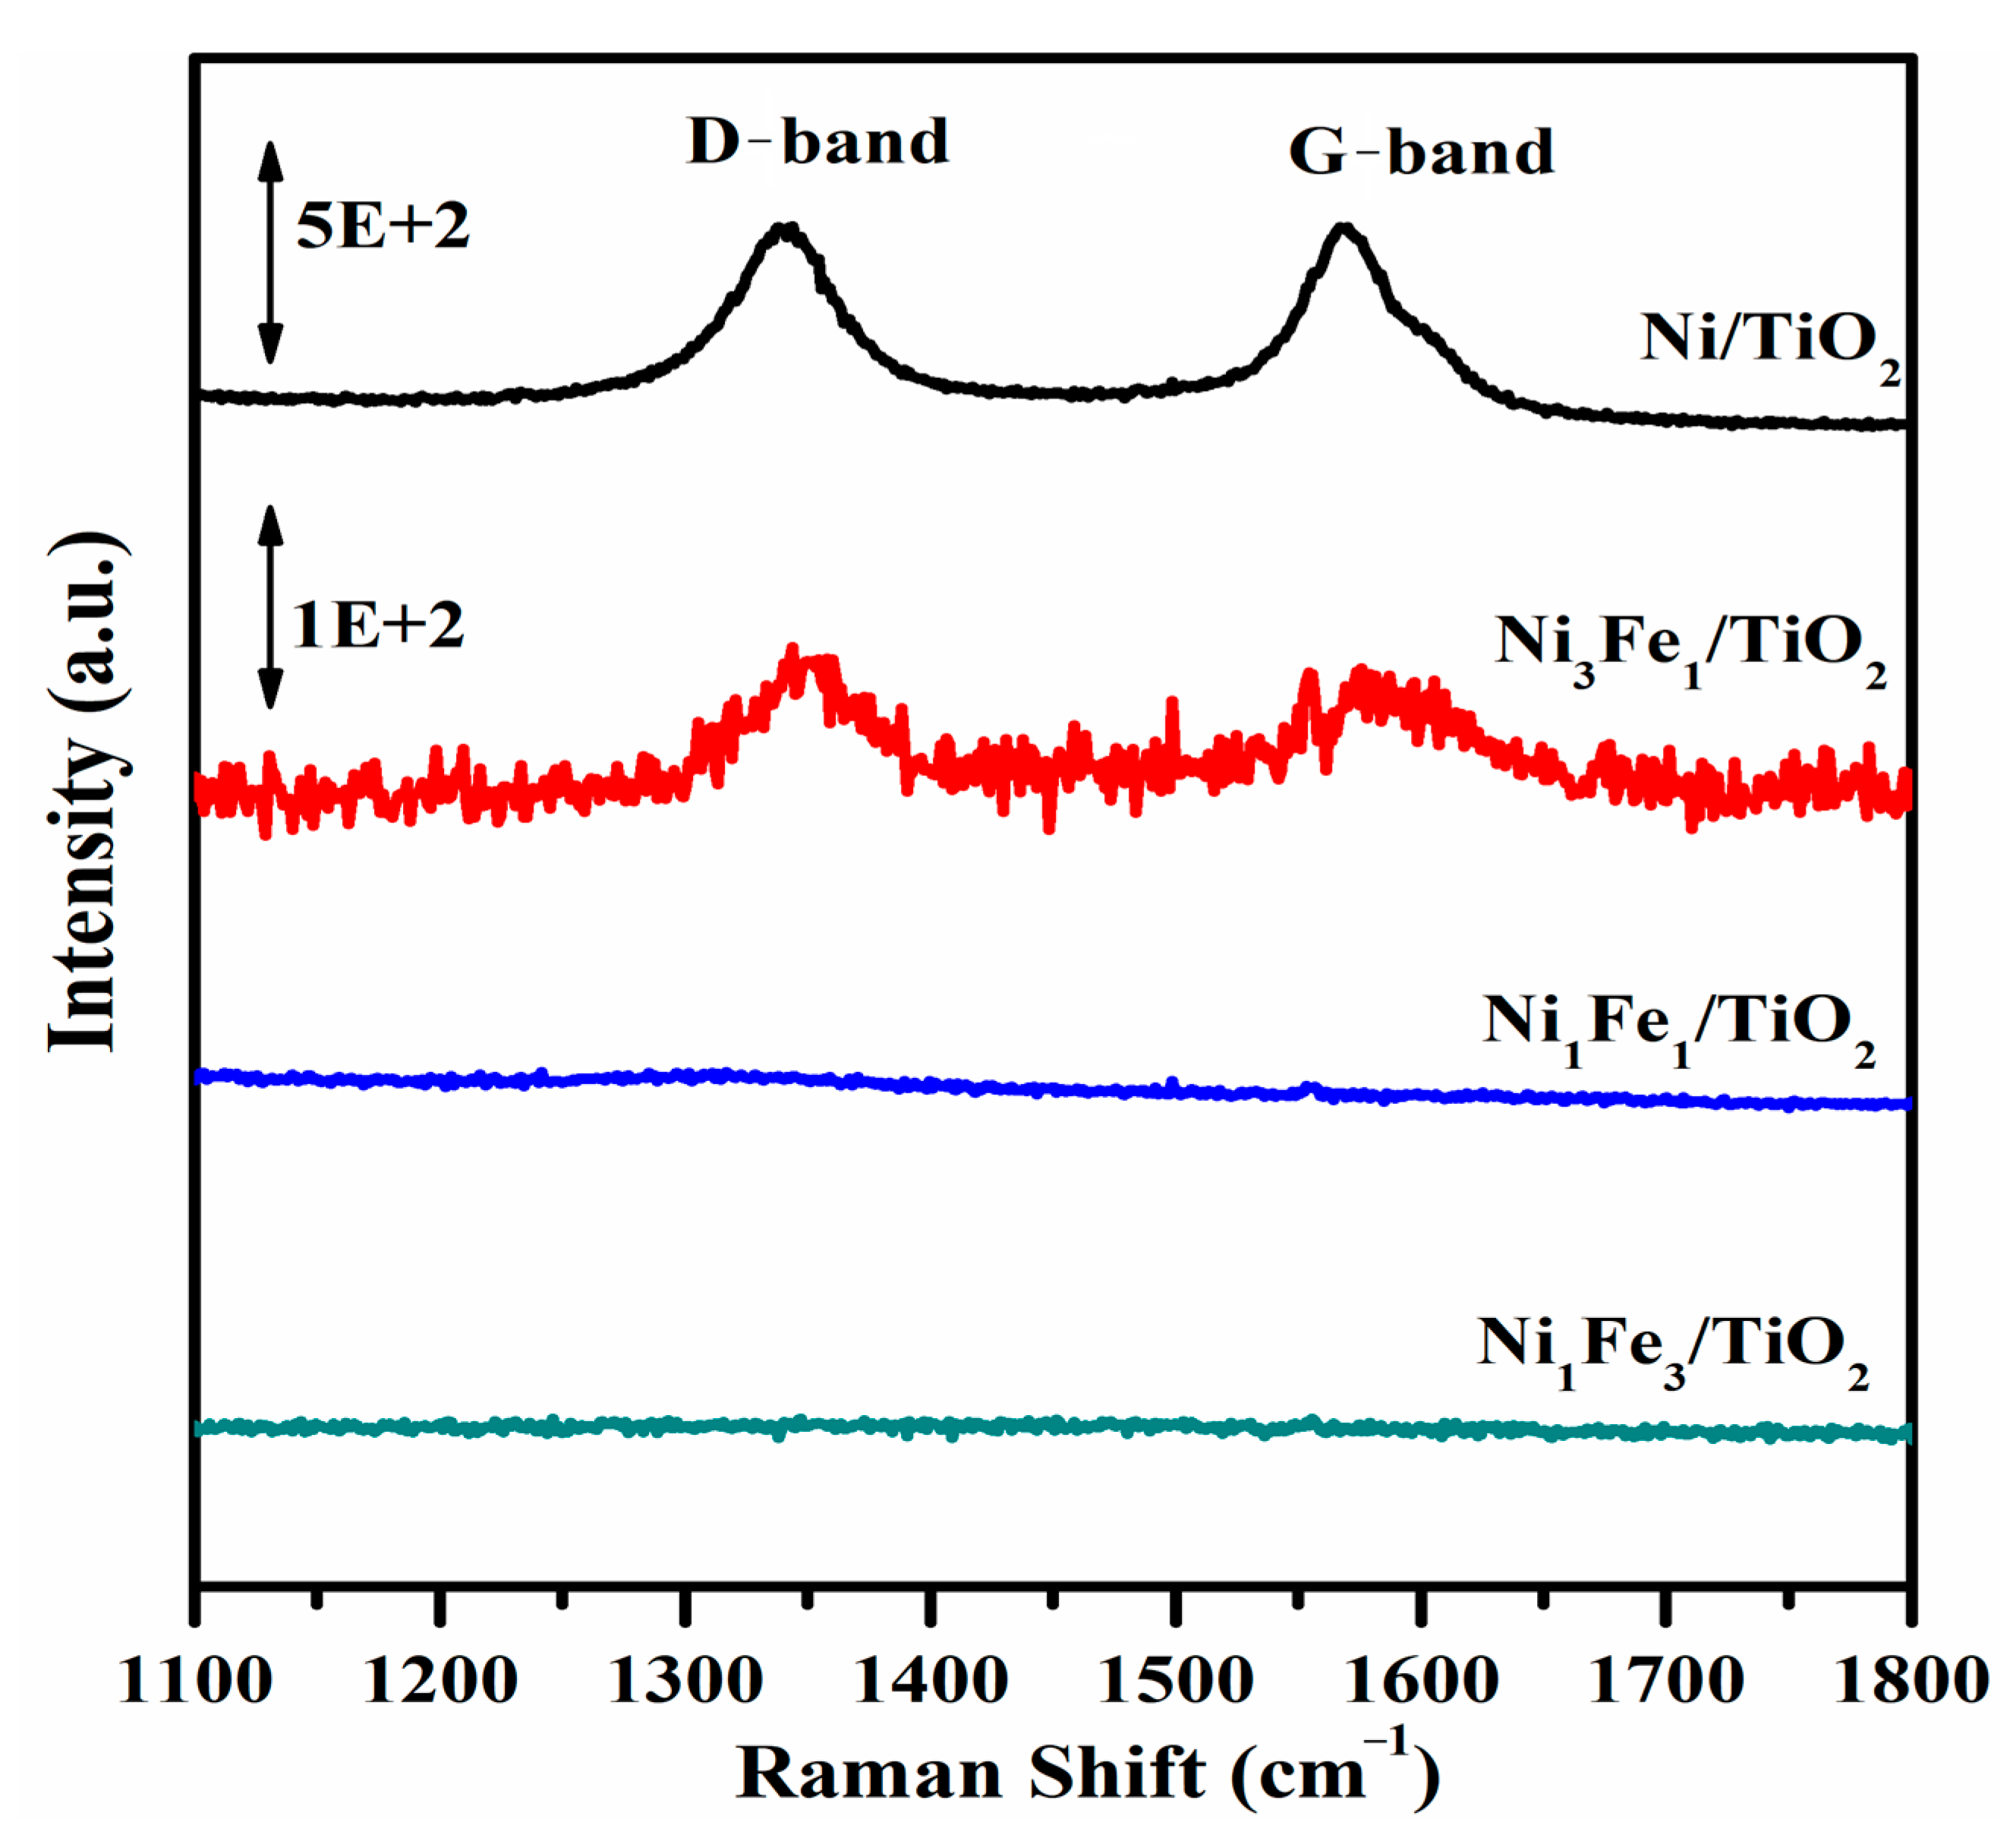
Raman spectroscopy was applied to determine the graphitic degree of coke on catalysts after the reaction. As shown in Figure 9, two strong Raman bands were observed over the Ni-TiO2 catalyst and Ni3Fe1/TiO2 catalyst. The band located around 1345 cm−1 is assigned to the D band of carbon, which is related to hydrogen-containing carbon species (CHx) or amorphous carbon [25,56]. The bands located at around 1570 cm−1 are assigned to the G band, which is related to the ordered sp2 C=C bond in graphite [25,56]. The intensity of both D and G bands decreased over the Ni3Fe1/TiO2 catalyst compared to that of Ni/TiO2. However, the ratio between the D-band intensity and G-band intensity (ID/IG) is 1.0 for both Ni/TiO2 and Ni3Fe1/TiO2 catalysts. Considering the value of (ID/IG) is the indicator of the structural disorder of the carbon species formed, it suggested that the addition of Fe may not affect the type of surface coke. The further increase in Fe resulted in the absence of Raman bands over Ni1Fe1/TiO2 and Ni1Fe3/TiO2. This suggests that the addition of iron may minimize coke formation.

2.8. In Situ DRIFTS Analysis

Figure 10a shows the IR spectra after pulses of CH4/He were introduced over the Ni/TiO2 catalyst. Gaseous CH4 was confirmed based on peaks located around 1304 cm−1 and 3015 cm−1 [57]. The peaks located around 2363 cm−1 are the characteristic peaks of the gas phase CO2. These peaks disappeared after 2 min. The existence of carbonate species (COO*) was confirmed with the peak located at 1540 cm−1 [58]. The evolution of the gas phase CO2 and carbonate species may be explained by the oxidization reaction between the lattice oxygen of NiO or active oxygen in TiO2 support and the carbon produced from CH4 decomposition [37]. The decrease in carbonate species led to the development of formate (HCOO*) species, which is related to a peak located at 1352 cm−1 [59]. The formation of formate species is possibly through the reaction of carbonate species and hydrogen species from methane decomposition, namely, COO * + H * HCOO * .
One pulse of CO2/He was introduced 5 min after the first CH4/He pulse. The dynamic spectra are shown in Figure 10b. The doublets at 2340 cm−1 and 2363 cm−1 are related to the gaseous CO2 species. The absence of other major peaks suggested that CO2 does not dissociate over Ni0 in the Ni/TiO2 catalyst at 550 °C. Lastly, a second pulse of CH4/He was introduced. As shown in Figure 10c, a new peak located at 1717 cm−1 appeared besides the gaseous CH4 and carbonate species. This peak is related to formyl species (CHO*) [59]. The population of formyl species was increased with the change in carbonate species. The formation of formyl species may be explained as the reaction between H* species and carbonates and the decomposition of formate-type species.
The same procedure was applied to the Ni3Fe1/TiO2 catalyst. Figure 11 shows the IR spectra after three pulses over Ni3Fe1/TiO2. As shown in Figure 11a, surface species including the gas phase CO2, formate and formyl species were observed after the first pulse of CH4/He. The major difference between Ni3Fe1/TiO2 and Ni/TiO2 after the first pulse is the formation of carbonate and formyl species over Ni3Fe1/TiO2. This suggested that lattice oxygen from Fe may be involved in the oxidation reaction with carbon species formed during methane decomposition [27,28]. After one CO2/He pulse, an identical feature was observed for both Ni3Fe1/TiO2 and Ni/TiO2 catalysts.
As shown in Figure 11b, the intensity of the carbonate peaks collected from Ni3Fe1/TiO2 is stronger than those observed from the Ni/TiO2 catalyst. During the second CH4/He pulse, the intensity of both the carbonate and formate species gradually decreased while the increase in the formyl species. This suggested that Fe facilitated the formation of COO* during the CO2 pulse. The reaction between COO* and carbonaceous CH*/C during the second CH4/He pulse leads to the formation of formyl (CHO*) species, namely, COO * + CH * CHO * + CO * . The formyl species (CHO*) is further decomposed to produce CO* and H*. In summary, the introduction of Fe would facilitate the removal of surface carbon species because of the lattice oxygen from FeOx.

3. Materials and Methods

3.1. Catalyst Preparation

Bimetallic Ni-Fe-modified TiO2 catalysts were synthesized by a two-step approach. Aqueous Ni(NO3)2·6H2O and Fe(NO3)3·9H2O solution was added dropwise into 0.2 M Na2CO3 solution under vigorous stirring at room temperature. The pH value, 9–10, was maintained by adding 1.0 M NaOH solution. The solution mixture was vigorously stirred for an additional 30 min. Centrifugation was applied to collect precipitates, which were further washed with D.I. water. Then, 30 mL water was added into the mixture of commercial TiO2 (P25, Sigma Aldrich, St. Louis, MO, USA) and Ni-Fe precipitates. After stirring for 24 h at room temperature, the as-prepared catalysts were washed with D.I. water and dried in vacuum at 95 °C for 48 h. After calcination in air at 450 °C for 4 h, the calcined Ni-Fe/TiO2 catalysts were obtained. Both Ni/TiO2 and Fe/TiO2 catalysts were prepared in a similar procedure as that described for Ni-Fe/TiO2 catalysts. The total metal loading was designed as 10 weight%. The values of x and y from NixFey/TiO2 catalysts stand for the weight ratios.

3.2. Catalyst Characterization

3.2.1. Inductively Coupled Plasma Atomic Emission Spectroscopy (ICP-AES)

Inductively coupled plasma atomic emission spectroscopy (ICP-AES) measurements were conducted on a Leeman Labs PS1000 instrument (Teledyne Leeman Labs, Mason, OH, USA). Before each measurement, 10 mg of samples were digested in an aqua regia solution (2–3 mL) overnight. The aqueous mixture is diluted by deionized water to obtain the desired concentration of the metal in a neutral pH solution.

3.2.2. Temperature-Programmed Reactions

Hydrogen–Temperature-Programmed Reduction (H2-TPR) was conducted in Micromeritics Autochem II 2920 (Micromeritics, Norcross, GA, USA). Typically, 50 mg of the calcined catalyst was pretreated with pure helium at 150 °C for 1 h. Then, 10% H2/Ar (30 mL/min) was introduced while the temperature was increased from room temperature to 700 °C, with the heating rate being 5 °C/min.
Methane–Temperature-Programmed Surface Reaction (CH4-TPSR) and Carbon Dioxide–Temperature-Programmed Surface Reaction (CO2-TPSR) experiments were also conducted in Micromeritics AutoChem II 2920 (Micromeritics, Norcross, GA, USA). Then, 50 mg of the calcined catalyst was reduced with 10% H2/Ar (30 mL/min) at 550 °C for 1 h. After the pretreatment, pure helium was introduced while temperature was cooled down to room temperature. Then, 10% CH4/He (30 mL/min) was introduced while the temperature increased from room temperature to 600 °C, with the heating rate being 10 °C/min. The outlet gases were analyzed by a TCD detector.
For CO2-TPSR experiments, 10% CO2/He (30 mL/min) was flowing through the catalysts while the temperature increased from room temperature to 700 °C, with the heating rate being 10 °C/min. Pure helium was then introduced to cool down the catalysts. Then, 10% H2/Ar (30 mL/min) was introduced for the following H2-TPR test. The procedure is the same as the H2-TPR experiment described previously for the calcinated catalysts.

3.2.3. Thermogravimetric Analysis/Differential Thermogravimetry (TGA-DTG)

Thermogravimetric tests were performed on a thermogravimetric analyzer TGA/DSC1 (Mettler-Toledo LLC, Columbus, OH, USA). Typically, air (30 mL/min) was flowing through 20 mg of samples while the temperature increased from 25 °C to 800 °C, with the heating rate being 5 °C/min. Built-in software was used to obtain the differential thermogravimetry results. The amount of coke deposited was calculated based on the weight difference before and after the TGA analysis.

3.2.4. X-ray Photoelectron Spectroscopy (XPS)

X-ray photoelectron spectroscopy (XPS) was conducted on a Thermo Scientific K-Alpha system, equipped with an Al source and a 180° double-focusing hemispherical analyzer with a 128-channel detector at a pass energy of 50 eV. The original XPS data were processed by Thermo Scientific Avantage Software (Version 5) to perform the quantitative surface chemical analyses. A binding energy value referencing the C 1s peak (284.8 eV) was applied to eliminate the effect of the surface’s adventitious contamination layer besides the removal of a Shirely background. The Avantage software (Version 5) incorporated the appropriate sensitivity factors and corrected for the electron energy analyzer transmission function. The peak fitting analysis was conducted using the XPSPEAK4.1 software (version 4.1).

3.2.5. Raman Spectroscopy

Raman spectra were obtained with a Raman spectrometer (NT-MDT America Inc. Tempe, AZ, USA) using a diode laser beam at 532 nm. Five scans of 10 s and a laser power of 22 ± 2 mW under ambient conditions were applied to the data collection.

3.2.6. In Situ Diffuse Reflectance Infrared Fourier Transform Spectroscopy (DRIFTS)

An In Situ Diffuse Reflectance Infrared Fourier Transform Spectroscopy (DRIFTS) experiment was performed in a Nicolet IS50 FTIR spectrometer (Thermo Scientific, Waltham, MA, USA). A Harrick Scientific diffuse reflection accessory equipped with a mercury-cadmium-telluride detector was used to hold the sample. The sample was reduced with 30% H2/He at 550 °C for 1 h. Then, pure helium was introduced before the IR test. The background was obtained while pure He flowed through the IR cell. After the background scan, the first pulse of 10% CH4/He (20 mL/min) was introduced into the reactor cell for 5 min. The DRIFTS spectra were obtained every minute. A second 10% CO2/He pulse of equal volume was introduced for 5 min. Finally, another pulse of 10% CH4/He was introduced into the IR cell.

3.3. Catalytic Activity Performance

The activity test was performed in a home-made fixed bed reactor at 550 °C. Prior to the dry reforming of the methane reaction, calcined catalysts were reduced in 30% H2/He (30 mL/min) at 550 °C for 1 h. A mixture of 10% CH4/He (30 mL/min) and 10% CO2/He (30 mL/min) was introduced simultaneously into the reactor. Typically, 0.2 g of catalysts were diluted with equal amounts of quartz sand for each reaction run. The value of GHSV is 18,000 mL h−1 gcatalyst−1. The CH4-decomposition tests were performed at 550 °C using the same reactor. Then, 10% CH4/He(30 mL/min) flowed through the catalysts, which was equal to 9000 mL h−1 gcatalyst−1. The outlet gases were analyzed by an online SRI 8610C gas chromatograph (SRI Instruments, Torrance, CA, USA) equipped with one Thermal Conductivity Detector (TCD) and one Flame Ionization Detector (FID). Hayesep D columns and Moleseive D columns were used for gas separation. The following equations were used to calculate the CH4 and CO2 conversions, where F stands for the molar flow rate.
CH 4   Conversion = ( F CH 4 in F CH 4 out F CH 4 in )
CO 2   Conversion = ( F CO 2 in F CO 2 out F CO 2 in )
( H 2 / CO )   Ratio = H 2   produced   ( μ mol   · min 1 )   CO   produced   ( μ mol   · min 1 )
Carbon   balance   = ( F CH 4 out +   F CO 2 out + F CO out F CH 4 in + F CO 2 in )  

4. Conclusions

The role of Fe in inhibiting coke formation in the dry reforming of methane was studied over a series of nickel- and iron-modified titanium dioxide (Ni-Fe/TiO2) catalysts. The methane–temperature-programmed surface reaction (CH4-TPSR) suggested that nickel activates methane but leads to coke formation. The carbon dioxide–temperature-programmed surface reaction (CO2-TPSR) suggested that iron could decrease the activity. The hydrogen–temperature-programmed reduction (H2-TPR) and XPS analysis confirmed the changes in the surface nickel and iron species before and after the reaction. The In Situ DRIFTS analysis confirmed that the surface iron species facilitated the transformation of coke into carbonates as an intermediate species, which can be easily removed through a surface gasification reaction.

Supplementary Materials

The following supporting information can be downloaded at: https://www.mdpi.com/article/10.3390/catal13081171/s1, Figure S1: (a) CH4 conversion and (b) CO formation rate during the decomposition of methane reaction at 550 °C. (■) Ni/TiO2, () Ni3Fe1/TiO2, () Ni1Fe1/TiO2, () Ni1Fe3/TiO2; Figure S2: XPS spectra of Ti 2p over reduced catalysts; Figure S3: TGA profiles of Ni/TiO2 and Ni-Fe/TiO2 catalysts after DRM; Table S1: Calculated hydrogen consumption based on H2-TPR test, which follows the CO2-TPSR test; Table S2: Metal concentrations determined by Inductive Couple Plasma (ICP); Table S3: Carbon balance over Ni/TiO2 and Ni-Fe/TiO2 catalysts during the reaction.

Author Contributions

G.S.D.: Investigation, Formal analysis, Data curation, Visualization, Writing—original draft. G.C.: Visualization, Formal analysis, Data curation, Writing—review. N.Y.: Conceptualization, Methodology, Resources, Supervision, Formal analysis, Visualization, Data curation, Funding acquisition, Validation, Writing—original draft, review and editing. All authors have read and agreed to the published version of the manuscript.

Funding

This research was funded by the University of New Hampshire through the start-up fund (N.Y.).

Data Availability Statement

No applicable.

Acknowledgments

The authors are grateful for the financial support from the University of New Hampshire.

Conflicts of Interest

There are no conflict of interest to declare.

References

  1. Medeiros, F.G.M.D.; Lopes, F.W.B.; Vasconcelos, B.R.D. Prospects and technical challenges in hydrogen production through dry reforming of methane. Catalysts 2022, 12, 363. [Google Scholar] [CrossRef]
  2. Sengupta, S.; Ray, K.; Deo, G. Effects of modifying Ni/Al2O3 catalyst with cobalt on the reforming of CH4 with CO2 and cracking of CH4 reactions. Int. J. Hydrogen Energy 2014, 39, 11462–11472. [Google Scholar] [CrossRef]
  3. Kim, J.; Suh, D.J.; Park, T.; Kim, K. Effect of metal particle size on coking during CO2 reforming of CH4 over Ni–alumina aerogel catalysts. Appl. Catal. A Gen. 2000, 197, 191–200. [Google Scholar] [CrossRef]
  4. Pakhare, D.; Shaw, C.; Haynes, D.; Shekhawat, D.; Spivey, J. Effect of reaction temperature on activity of Pt-and Ru-substituted lanthanum zirconate pyrochlores (La2Zr2O7) for dry (CO2) reforming of methane (DRM). J. CO2 Util. 2013, 1, 37–42. [Google Scholar] [CrossRef]
  5. Tanios, C.; Bsaibes, S.; Gennequin, C.; Labaki, M.; Cazier, F.; Billet, S.; Tidahy, H.L.; Nsouli, B.; Aboukais, A.; Abi-Aad, E. Syngas production by the CO2 reforming of CH4 over Ni–Co–Mg–Al catalysts obtained from hydrotalcite precursors. Int. J. Hydrogen Energy 2017, 42, 12818–12828. [Google Scholar] [CrossRef]
  6. Damyanova, S.; Pawelec, B.; Arishtirova, K.; Huerta, M.V.M.; Fierro, J.L.G. The effect of CeO2 on the surface and catalytic properties of Pt/CeO2–ZrO2 catalysts for methane dry reforming. Appl. Catal. B Environ. 2009, 89, 149–159. [Google Scholar] [CrossRef]
  7. Liu, Z.; Zhang, F.; Rui, N.; Li, X.; Lin, L.; Betancourt, L.E.; Su, D.; Xu, W.; Cen, J.; Attenkofer, J.; et al. Highly active ceria-supported Ru catalyst for the dry reforming of methane: In Situ identification of Ruδ+–Ce3+ interactions for enhanced conversion. ACS Catal. 2019, 9, 3349–3359. [Google Scholar] [CrossRef]
  8. Yentekakis, I.V.; Goula, G.; Hatzisymeon, M.; Argyropoulou, I.B.; Botzolaki, G.; Kousi, K.; Kondarides, D.I.; Taylor, M.J.; Parlett, C.M.A.; Osatiashtiani, A.; et al. Effect of support oxygen storage capacity on the catalytic performance of Rh nanoparticles for CO2 reforming of methane. Appl. Catal. B Environ. 2019, 243, 490–501. [Google Scholar] [CrossRef] [Green Version]
  9. Yue, L.; Li, J.; Chen, C.; Fu, X.; Gong, Y.; Xia, X.; Hou, J.; Xiao, C.; Chen, X.; Zhao, L.; et al. Thermal-stable Pd@ mesoporous silica core-shell nanocatalysts for dry reforming of methane with good coke-resistant performance. Fuel 2018, 218, 335–341. [Google Scholar] [CrossRef]
  10. Maina, S.C.P.; Ballarini, A.D.; Vilella, J.I.; Miguel, S.R. Study of the performance and stability in the dry reforming of methane of doped alumina supported iridium catalysts. Catal. Today 2020, 344, 129–142. [Google Scholar] [CrossRef]
  11. Bradford, M.C.J.; Vannice, M.A. CO2 Reforming of CH4. Catal. Rev. 1999, 41, 1–42. [Google Scholar] [CrossRef]
  12. Das, S.; Sengupta, M.; Patel, J.; Bordoloi, A. A study of the synergy between support surface properties and catalyst deactivation for CO2 reforming over supported Ni nanoparticles. Appl. Catal. A Gen. 2017, 545, 113–126. [Google Scholar] [CrossRef]
  13. de la Cruz-Flores, V.G.; Martinez-Hernandez, A.; Gracia-Pinilla, M.A. Deactivation of Ni-SiO2 catalysts that are synthetized via a modified direct synthesis method during the dry reforming of methane. Appl. Catal. A Gen. 2020, 594, 117455. [Google Scholar] [CrossRef]
  14. Littlewood, P.; Weitz, E.; Marks, T.J.; Stair, P.C. Kinetic iso-conversion loop catalysis: A reactor operation mode to investigate slow catalyst deactivation processes, with Ni/Al2O3 for the dry reforming of methane. Ind. Eng. Chem. Res. 2019, 58, 2481–2491. [Google Scholar] [CrossRef]
  15. Wang, C.; Sun, N.; Zhao, N.; Wei, W.; Sun, Y.; Sun, C.; Liu, H.; Snape, C.E. Coking and deactivation of a mesoporous Ni–CaO–ZrO2 catalyst in dry reforming of methane: A study under different feeding compositions. Fuel 2015, 143, 527–535. [Google Scholar] [CrossRef]
  16. Wang, Z.; Cao, X.M.; Zhu, J.; Hu, P. Activity and coke formation of nickel and nickel carbide in dry reforming: A deactivation scheme from density functional theory. J. Catal. 2014, 311, 469–480. [Google Scholar] [CrossRef]
  17. Ay, H.; Uner, D. Dry reforming of methane over CeO2supported Ni, Co and Ni–Co catalysts. Appl. Catal. B Environ. 2015, 179, 128–138. [Google Scholar] [CrossRef]
  18. Sokefun, Y.O.; Trottier, J.; Yung, M.M.; Joseph, B.; Kuhn, J.N. Low temperature dry reforming of methane using Ru-Ni-Mg/ceria-zirconia catalysts: Effect of Ru loading and reduction temperature. Appl. Catal. A Gen. 2022, 645, 118842. [Google Scholar] [CrossRef]
  19. Cichy, M.; Panczyk, M.; Słowik, G.; Zawadzki, W.; Borowiecki, T. Ni-Re alloy catalysts on Al2O3 for methane dry reforming. Int. J. Hydrogen Energy 2022, 47, 16528–16543. [Google Scholar] [CrossRef]
  20. Huang, Y.; Li, X.; Zhang, Q.; Vinokurov, V.A.; Huang, W. Enhanced carbon tolerance of hydrotalcite-derived Ni-Ir/Mg(Al)O catalysts in dry reforming of methane under elevated pressures. Fuel Process. Technol. 2022, 237, 107446. [Google Scholar] [CrossRef]
  21. Jabbour, K.; Saad, A.; Inaty, L.; Davidson, A.; Massiani, P.; Hassan, N.E. Ordered mesoporous Fe-Al2O3 based-catalysts synthesized via a direct “one-pot” method for the dry reforming of a model biogas mixture. Int. J. Hydrogen Energy 2019, 44, 14889–14907. [Google Scholar] [CrossRef]
  22. Wu, Z.; Yang, B.; Miao, S.; Liu, W.; Xie, J.; Lee, S.; Pellin, M.J.; Xiao, D.; Su, D.; Ma, D. Lattice strained Ni-Co alloy as a high-performance catalyst for catalytic dry reforming of methane. ACS Catal. 2019, 9, 2693–2700. [Google Scholar] [CrossRef]
  23. Sagar, T.V.; Padmakar, D.; Lingaiah, N.; Prasad, P.S.S. Influence of solid solution formation on the activity of CeO2 supported Ni–Cu mixed oxide catalysts in dry reforming of methane. Catal. Lett. 2019, 149, 2597–2606. [Google Scholar] [CrossRef]
  24. Bian, Z.; Das, S.; Wai, M.H.; Hongmanorom, P.; Kawi, S. A Review on bimetallic nickel-based catalysts for CO2 reforming of methane. ChemPhysChem 2017, 18, 3117–3134. [Google Scholar] [CrossRef] [Green Version]
  25. Kim, S.M.; Abdala, P.M.; Margossian, T.; Hosseini, D.; Foppa, L.; Armutlulu, A.; Van Beek, W.; Comas-Vives, A.; Copéret, C.; Müller, C. Cooperativity and dynamics increase the performance of NiFe dry reforming catalysts. J. Am. Chem. Soc. 2017, 139, 1937–1949. [Google Scholar] [CrossRef] [PubMed]
  26. Margossian, T.; Larmier, K.; Kim, S.M.; Krumeich, F.; Müller, C.; Copéret, C. Supported bimetallic NiFe nanoparticles through colloid synthesis for improved dry reforming performance. ACS Catal. 2017, 7, 6942–6948. [Google Scholar] [CrossRef]
  27. Theofanidis, S.A.; Galvita, V.V.; Poelman, H.; Marin, G.B. Enhanced Carbon-Resistant Dry Reforming Fe-Ni Catalyst: Role of Fe. ACS Catal. 2015, 5, 3028–3039. [Google Scholar] [CrossRef]
  28. Theofanidis, S.A.; Galvita, V.V.; Poelman, H.; Dharanipragada, N.V.R.A.; Longo, A.; Meledina, M.; Tendeloo, G.V.; Detavernier, C.; Marin, G.B. Fe-Containing magnesium aluminate support for stability and carbon control during methane reforming. ACS Catal. 2018, 8, 5983–5995. [Google Scholar] [CrossRef]
  29. Li, B.; Luo, Y.; Li, B.; Yuan, X.; Wang, X. Catalytic performance of iron-promoted nickel-based ordered mesoporous alumina FeNiAl catalysts in dry reforming of methane. Fuel Process. Technol. 2019, 193, 348–360. [Google Scholar] [CrossRef]
  30. Bonmassar, N.; Bekheet, M.F.; Schlicker, L.; Gili, A.; Gurlo, A.; Doran, A.; Gao, Y.; Heggen, M.; Bernardi, J.; Klötzer, B.; et al. In situ-determined catalytically active state of LaNiO3 in methane dry reforming. ACS Catal. 2020, 10, 1102–1112. [Google Scholar] [CrossRef]
  31. Wang, M.; Zhao, T.; Dong, X.; Li, M.; Wang, H. Effects of Ce substitution at the A-site of LaNi0.5Fe0.5O3 perovskite on the enhanced catalytic activity for dry reforming of methane. Appl. Catal. B Environ. 2018, 224, 214–221. [Google Scholar] [CrossRef]
  32. Lima, S.M.; Assaf, J.M. Ni-Fe catalysts based on perovskite-type oxides for dry reforming of methane to syngas. Catal. Lett. 2006, 108, 63–70. [Google Scholar] [CrossRef]
  33. Song, X.; Dong, X.; Yin, S.; Wang, M.; Li, M.; Wang, H. Effects of Fe partial substitution of La2NiO4/LaNiO3 catalyst precursors prepared by wet impregnation method for the dry reforming of methane. Appl. Catal. A Gen. 2016, 526, 132–138. [Google Scholar] [CrossRef]
  34. Zhang, T.; Liu, Z.; Zhu, Y.; Liu, Z.; Sui, Z.; Zhu, K.; Zhou, X. Dry reforming of methane on Ni-Fe-MgO catalysts: Influence of Fe on carbon-resistant property and kinetics. Appl. Catal. B Environ. 2020, 264, 118497. [Google Scholar] [CrossRef]
  35. Nikoo, M.K.; Amin, N.A.S. Thermodynamic analysis of carbon dioxide reforming of methane in view of solid carbon formation. Fuel Process. Technol. 2011, 92, 678–691. [Google Scholar] [CrossRef] [Green Version]
  36. Dhillon, G.S. Nick-Iron Catalysts for Low Temperature Dry Reformation of Methane. Ph.D. Thesis, University of New Hampshire, Durham, NH, USA, 2021. [Google Scholar]
  37. Xie, T.; Zhang, Z.Y.; Zheng, H.Y.; Xu, K.D.; Hu, Z.; Lei, Y. Enhanced photothermal catalytic performance of dry reforming of methane over Ni/mesoporous TiO2 composite catalyst. Chem. Eng. J. 2022, 429, 132507. [Google Scholar] [CrossRef]
  38. Yan, Q.G.; Weng, W.Z.; Wan, H.L.; Toghiani, H.; Toghiani, R.K.; Pittman, C.U. Activation of methane to syngas over a Ni/TiO2 catalyst. Appl. Catal. A Gen. 2003, 239, 43–58. [Google Scholar] [CrossRef]
  39. Ray, K.; Sengupta, S.; Deo, G. Reforming and cracking of CH4 over Al2O3supported Ni, Ni-Fe and Ni-Co catalysts. Fuel Process. Technol. 2017, 156, 195–203. [Google Scholar] [CrossRef]
  40. Ashok, J.; Kawi, S. Steam reforming of biomass tar model compound at relatively low steam-to-carbon condition over CaO-doped nickel–iron alloy supported over iron–alumina catalysts. Appl. Catal. A Gen. 2015, 490, 24–35. [Google Scholar] [CrossRef]
  41. Pandey, D.; Deo, G. Effect of support on the catalytic activity of supported Ni–Fe catalysts for the CO2 methanation reaction. J. Ind. Eng. Chem. 2016, 33, 99–107. [Google Scholar] [CrossRef]
  42. Song, K.; Lu, M.; Xu, S.; Chen, C.; Zhan, Y.; Li, D.; Au, C.; Jiang, L.; Tomishige, K. Effect of alloy composition on catalytic performance and coke-resistance property of Ni-Cu/Mg(Al)O catalysts for dry reforming of methane. Appl. Catal. B Environ. 2018, 239, 324–333. [Google Scholar] [CrossRef]
  43. Li, D.; Xu, S.; Song, K.; Chen, C.; Zhan, Y.; Jiang, L. Hydrotalcite-derived Co/Mg(Al)O as a stable and coke-resistant catalyst for low-temperature carbon dioxide reforming of methane. Appl. Catal. A Gen. 2018, 552, 21–29. [Google Scholar] [CrossRef]
  44. Shah, M.; Das, S.; Nayak, A.K.; Mondal, P.; Bordoloi, A. Smart designing of metal-support interface for imperishable dry reforming catalyst. Appl. Catal. A Gen. 2018, 556, 137–154. [Google Scholar] [CrossRef]
  45. Ashok, J.; Kawi, S. Nickel–Iron alloy supported over Iron–Alumina catalysts for steam reforming of biomass tar model compound. ACS Catal. 2014, 4, 289–301. [Google Scholar] [CrossRef]
  46. Dȩbek, R.; Motak, M.; Duraczyska, D.; Launay, F.; Galvez, M.E.; Grzybek, T.; Da Costa, P. Methane dry reforming over hydrotalcite-derived Ni–Mg–Al mixed oxides: The influence of Ni content on catalytic activity, selectivity and stability. Catal. Sci. Technol. 2016, 6, 6705–6715. [Google Scholar] [CrossRef]
  47. Dębek, R.; Motak, M.; Galvez, M.E.; Grzybek, T.; Da Costa, P. Promotion effect of zirconia on Mg(Ni,Al)O mixed oxides derived from hydrotalcites in CO2 methane reforming. Appl. Catal. B Environ. 2018, 223, 36–46. [Google Scholar] [CrossRef]
  48. Yamashita, T.; Hayes, P. Analysis of XPS spectra of Fe2+ and Fe3+ ions in oxide materials. Appl. Surf. Sci. 2008, 254, 2441–2449. [Google Scholar] [CrossRef]
  49. Cao, G.; Yi, N. Pretreatment effect on copper-titanium dioxide catalysts in CO oxidation. Catal. Commun. 2022, 170, 106484. [Google Scholar] [CrossRef]
  50. Cao, G.; Deskins, N.A.; Yi, N. Carbon monoxide oxidation over copper and nitrogen modified titanium dioxide. Appl. Catal. B Environ. 2021, 285, 119748. [Google Scholar] [CrossRef]
  51. Theofanidis, S.A.; Batchu, R.; Galvita, V.V.; Poelman, H.; Marin, G.B. Carbon gasification from Fe–Ni catalysts after methane dry reforming. Appl. Catal. B Environ. 2016, 185, 42–55. [Google Scholar] [CrossRef]
  52. Zhang, M.; Zhang, J.; Zhou, Z.; Chen, S.; Zhang, T.; Song, F.; Zhang, Q.; Tsubaki, N.; Tan, Y.; Han, Y. Effects of the surface adsorbed oxygen species tuned by rare-earth metal doping on dry reforming of methane over Ni/ZrO2 catalyst. Appl. Catal. B Environ. 2020, 264, 118522. [Google Scholar] [CrossRef]
  53. Damyanova, S.; Shtereva, I.; Pawelec, B.; Mihaylov, L.; Fierro, J.L.G. Characterization of none and yttrium-modified Ni-based catalysts for dry reforming of methane. Appl. Catal. B Environ. 2020, 278, 119335. [Google Scholar] [CrossRef]
  54. Damaskinos, C.M.; Vasiliades, M.A.; Efsthathiou, A.M. The effect of Ti4+ dopant in the 5 wt% Ni/Ce1-xTixO2-δ catalyst on the carbon pathways of dry reforming of methane studied by various transient and isotopic techniques. Appl. Catal. A Gen. 2019, 579, 116–129. [Google Scholar] [CrossRef]
  55. Amin, A.M.; Croiset, E.; Epling, W. Review of methane catalytic cracking for hydrogen production. Int. J. Hydrogen Energy 2011, 36, 2904–2935. [Google Scholar] [CrossRef]
  56. Cao, K.; Gong, M.; Yang, J.; Cai, J.; Chu, S.; Chen, Z.; Shan, B.; Chen, R. Nickel catalyst with atomically-thin meshed cobalt coating for improved durability in dry reforming of methane. J. Catal. 2019, 373, 351–360. [Google Scholar] [CrossRef]
  57. Das, S.; Ashok, J.; Bian, Z.; Dewangan, N.; Wai, M.H.; Du, Y.; Borgna, A.; Hidajat, K.; Kawi, S. Silica–Ceria sandwiched Ni core–shell catalyst for low temperature dry reforming of biogas: Coke resistance and mechanistic insights. Appl. Catal. B Environ. 2018, 230, 220–236. [Google Scholar] [CrossRef]
  58. Marinho, A.L.A.; Toniolo, F.S.; Noronha, F.B.; Epron, F.; Duprez, D.; Bion, N. Highly active and stable Ni dispersed on mesoporous CeO2-Al2O3 catalysts for production of syngas by dry reforming of methane. Appl. Catal. B Environ. 2021, 281, 119459. [Google Scholar] [CrossRef]
  59. Bu, K.; Deng, J.; Zhang, X.; Kuboon, S.; Yan, T.; Li, H.; Shi, L.; Zhang, D. Promotional effects of B-terminated defective edges of Ni/boron nitride catalysts for coking- and sintering-resistant dry reforming of methane. Appl. Catal. B Environ. 2020, 267, 118692. [Google Scholar] [CrossRef]
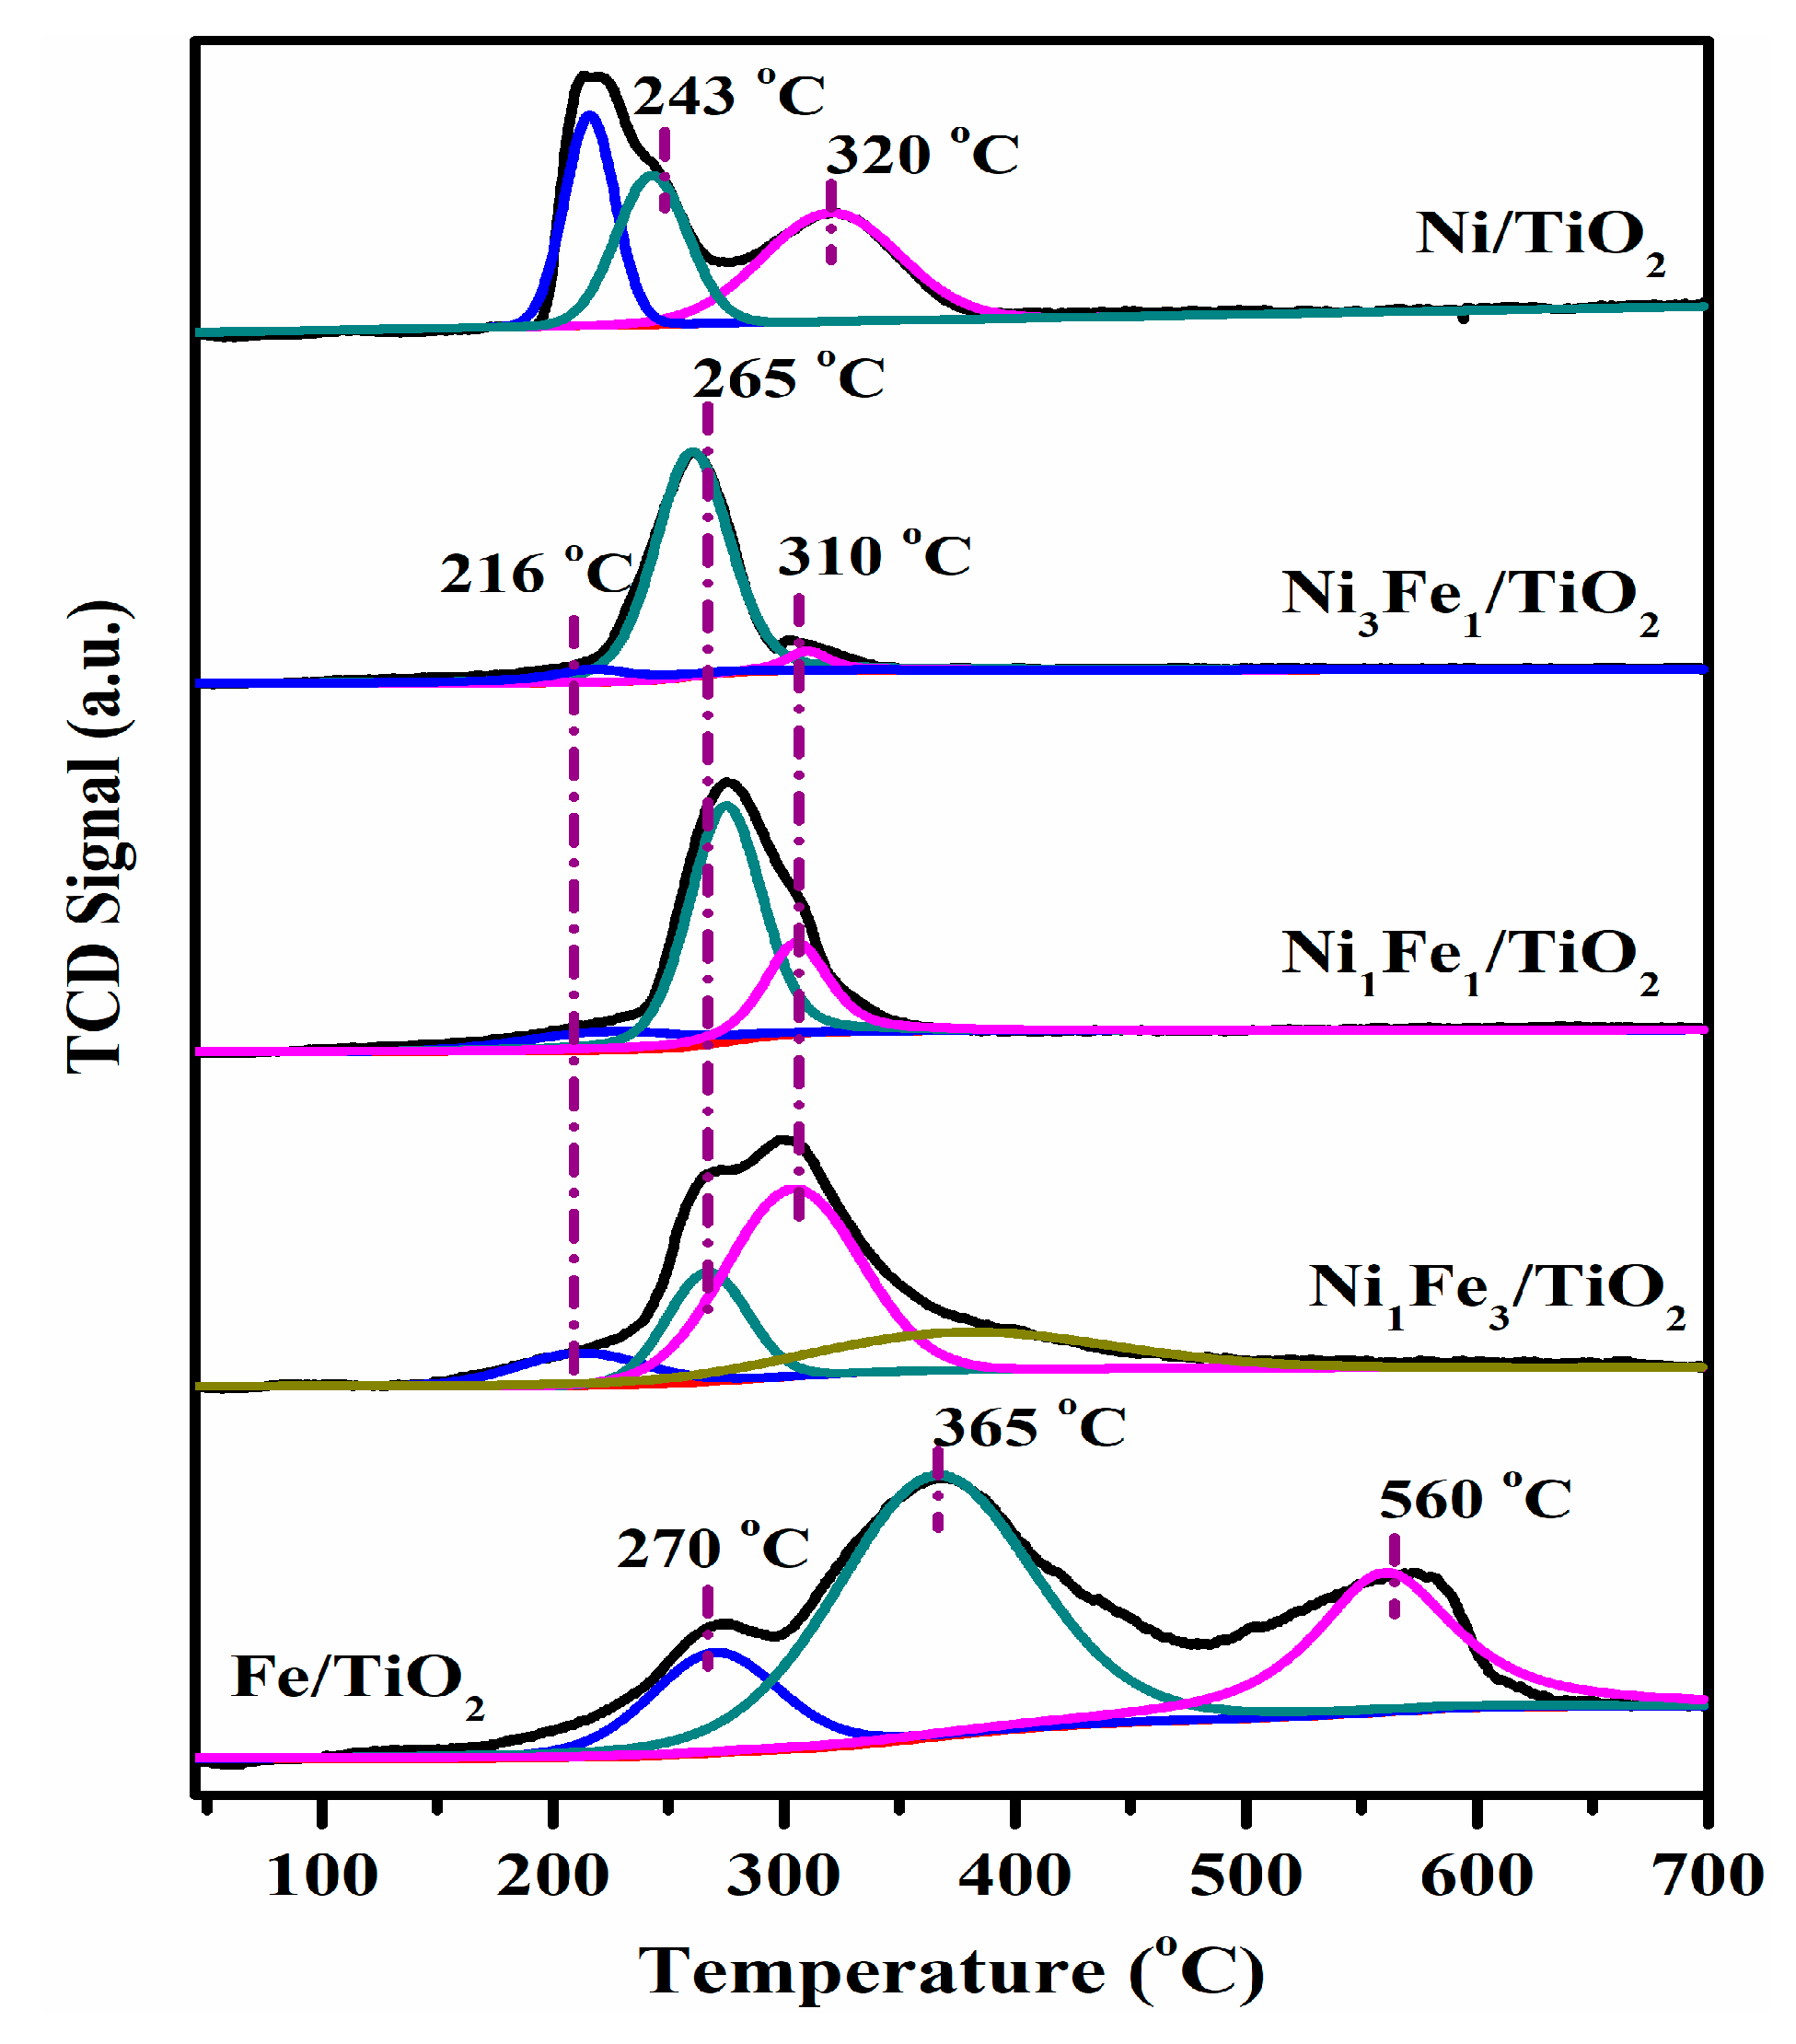
Figure 1. Profiles of H2-TPR over calcined Ni/TiO2, Ni-Fe/TiO2 and Fe/TiO2 catalysts. The blank lines present the experimental data. The colored lines under the original data are obtained using peak fitting software.
Catalysts 13 01171 g001
Figure 2. Profiles of (a) CH4-TPSR and (b) DTG after CH4-TPSR over Ni/TiO2, Ni-Fe/TiO2 and Fe/TiO2 catalysts.
Catalysts 13 01171 g002
Figure 3. Profiles of (a) CO2-TPSR and (b) H2-TPR after CO2-TPSR over Ni/TiO2, Fe/TiO2 and Ni-Fe/TiO2 catalysts.
Catalysts 13 01171 g003
Figure 4. (a) CH4 conversion, (b) CO2 conversion, (c) H2/CO ratio as a function of time-on-stream (TOS) over Ni/TiO2 and Ni-Fe/TiO2 catalysts. (■) Ni/TiO2, () Ni3Fe1/TiO2, () Ni1Fe1/TiO2, () Ni1Fe3/TiO2.
Catalysts 13 01171 g004
Figure 5. XPS spectra of reduced catalysts: (a) Ni 2p and (b) Fe 2p. The lines with circles present the experimental data. The colored lines are obtained using peak fitting software. The black lines are the simulated profile based on the peak fitting curves.
Catalysts 13 01171 g005
Figure 6. XPS spectra of catalysts after DRM tests. (a) Ni 2p, (b) Fe 2p, (c) C 1s. The lines with circles present the experimental data. The colored lines are obtained using peak fitting software. The black lines are the simulated profile based on the peak fitting curves.
Catalysts 13 01171 g006
Figure 7. O 1s XPS spectra of used catalysts after the reaction. The lines with circles present the experimental data. The colored lines are obtained using peak fitting software. The black lines are the simulated profile based on the peak fitting curves.
Catalysts 13 01171 g007
Figure 8. DTG profiles of catalysts after DRM tests. (a) Ni/TiO2 and (b) Ni-Fe/TiO2.
Catalysts 13 01171 g008
Figure 9. Raman spectra of catalysts after the reaction.
Catalysts 13 01171 g009
Figure 10. In situ DRIFTS spectra over the Ni/TiO2 catalyst under an alternate pulse at 550 °C. (a) CH4/He pulse, (b) CO2/He pulse, (c) subsequent CH4/He pulse.
Catalysts 13 01171 g010
Figure 11. In situ DRIFTS spectra over the Ni3Fe1/TiO2 catalyst under an alternate pulse at 550 °C. (a) CH4/He pulse, (b) CO2/He pulse, (c) subsequent CH4/He pulse.
Catalysts 13 01171 g011
Table 1. Peak temperature and hydrogen consumption based on H2-TPR profiles of Ni/TiO2, Fe/TiO2 and Ni-Fe/TiO2 catalysts.
Peak Temperature (°C) and H2-Consumption (mmol H2/gcatalyst)
Ni/TiO2216 (0.46)243 (0.46)320 (0.63)-
Fe/TiO2 270 (0.38) 365 (1.53)560 (0.73)
Peak 1Peak 2Peak 3
Ni3Fe1/TiO2216 (0.14)265 (1.6)310 (0.09)-
Ni1Fe1/TiO2216 (0.14)265 (1.22)310 (0.54)-
Ni1Fe3/TiO2216 (0.14)265 (0.37)310 (0.88)365 (0.63)
Table 2. Molar concentration (%) of surface species over reduced catalysts.
CatalystsNi0Ni2+Fe0Fe2+Fe3+O/TiFe/(Ni+Fe)
Ni/TiO20.702.27 1.00-
Ni3Fe1/TiO20.573.290.481.252.050.740.49
Ni1Fe1/TiO20.322.210.211.763.551.070.68
Ni1Fe3/TiO20.291.070.191.843.691.120.80
Disclaimer/Publisher’s Note: The statements, opinions and data contained in all publications are solely those of the individual author(s) and contributor(s) and not of MDPI and/or the editor(s). MDPI and/or the editor(s) disclaim responsibility for any injury to people or property resulting from any ideas, methods, instructions or products referred to in the content.