
The Structure–Activity Relationship of CuO in the Catalytic Conversion Reaction of Glycerol to Lactic Acid

Abstract
:
1. Introduction
2. Results and Discussion
2.1. Characterization
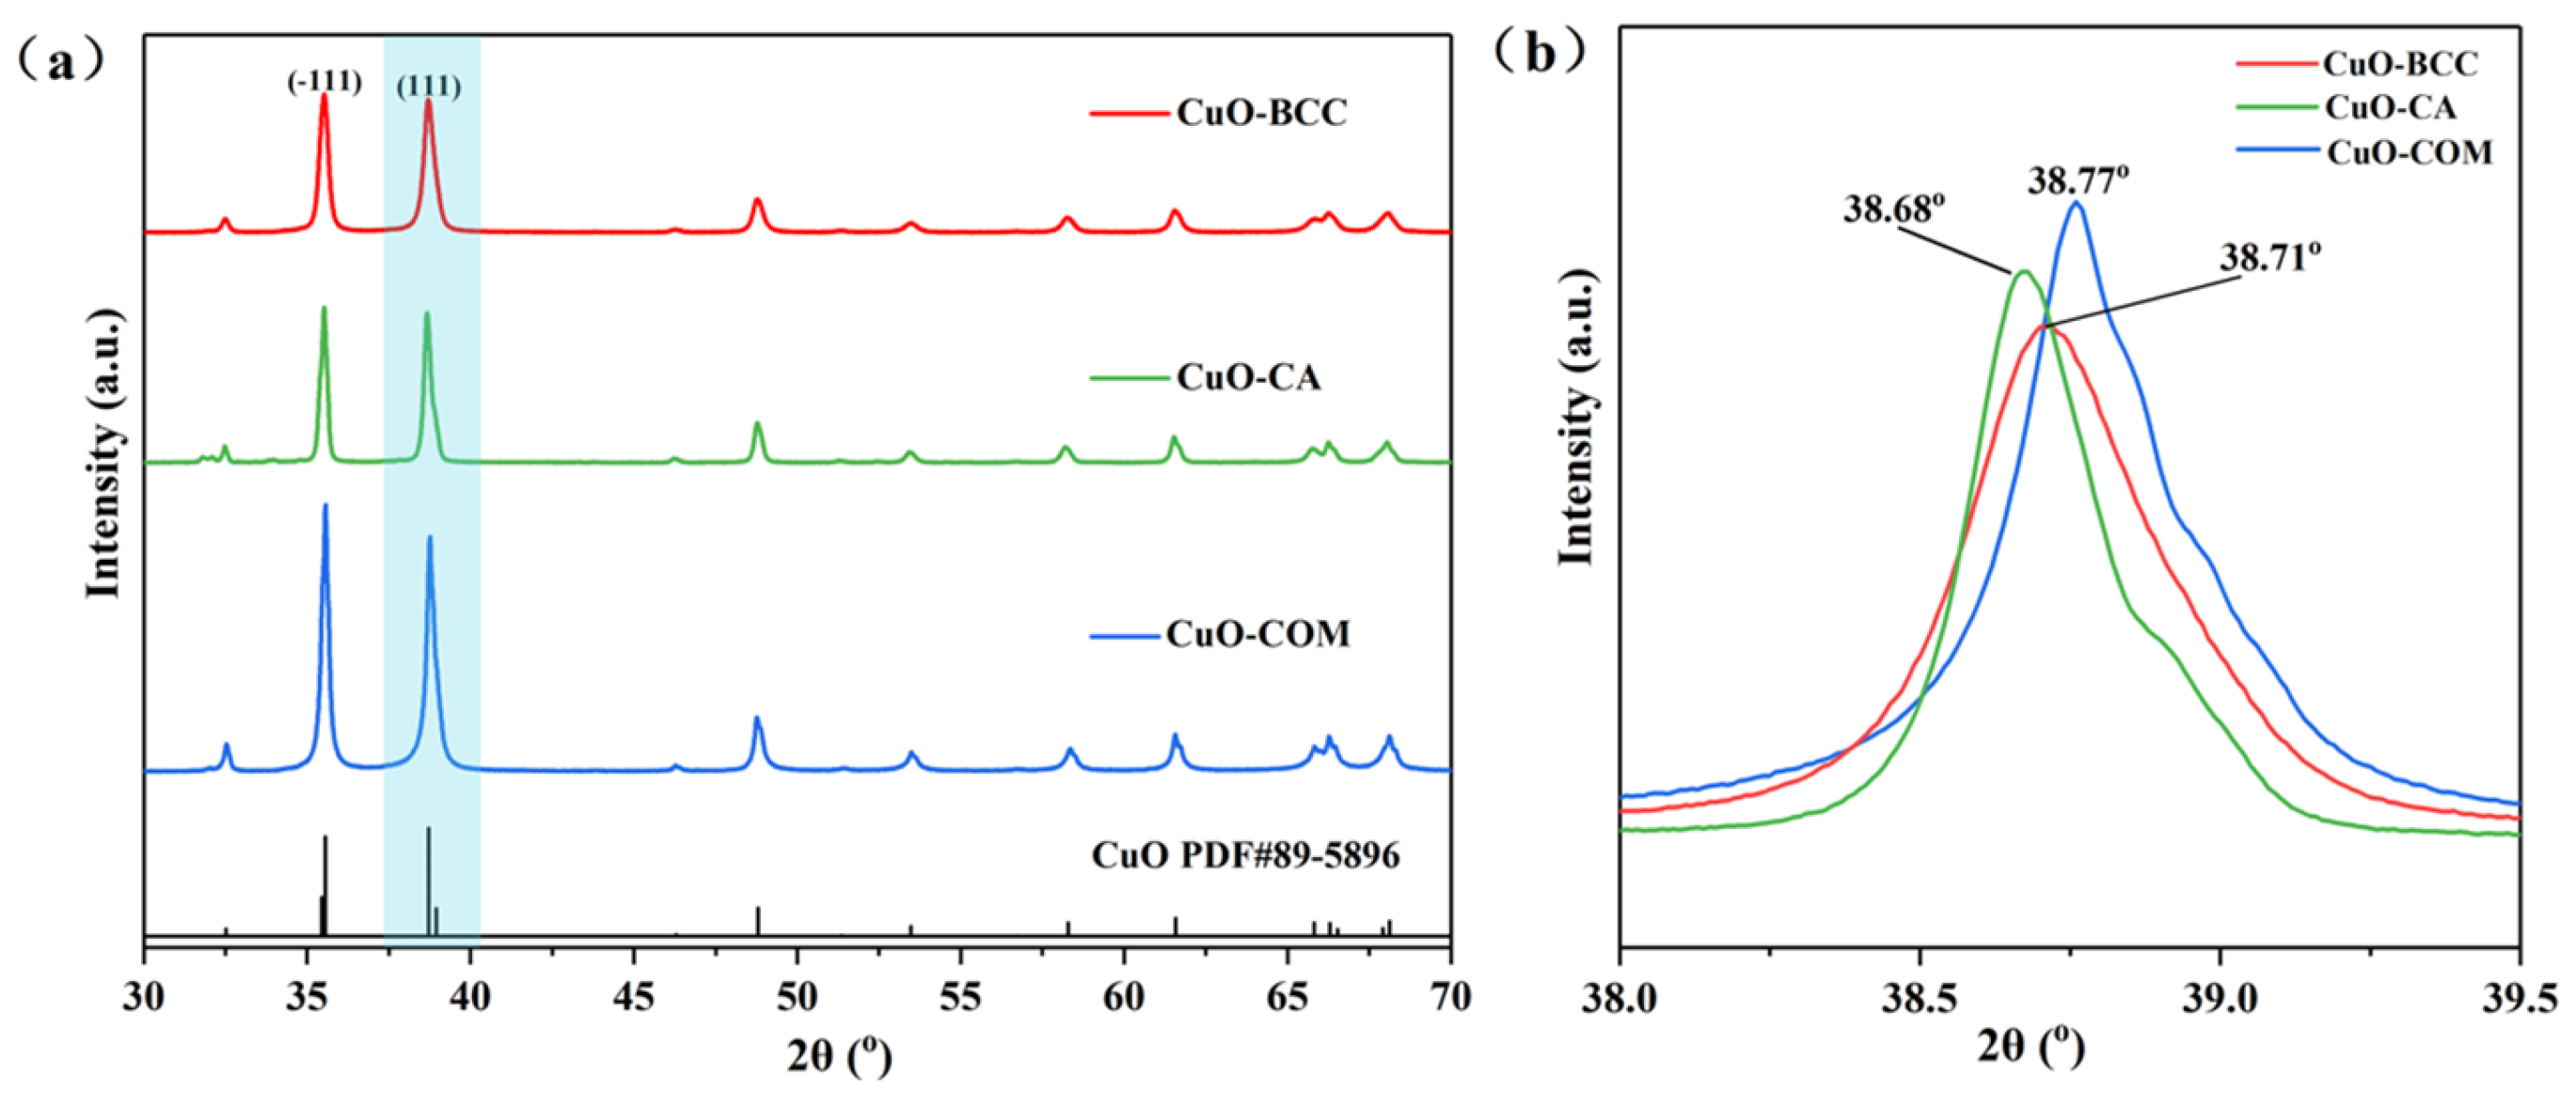
2.1.1. XRD
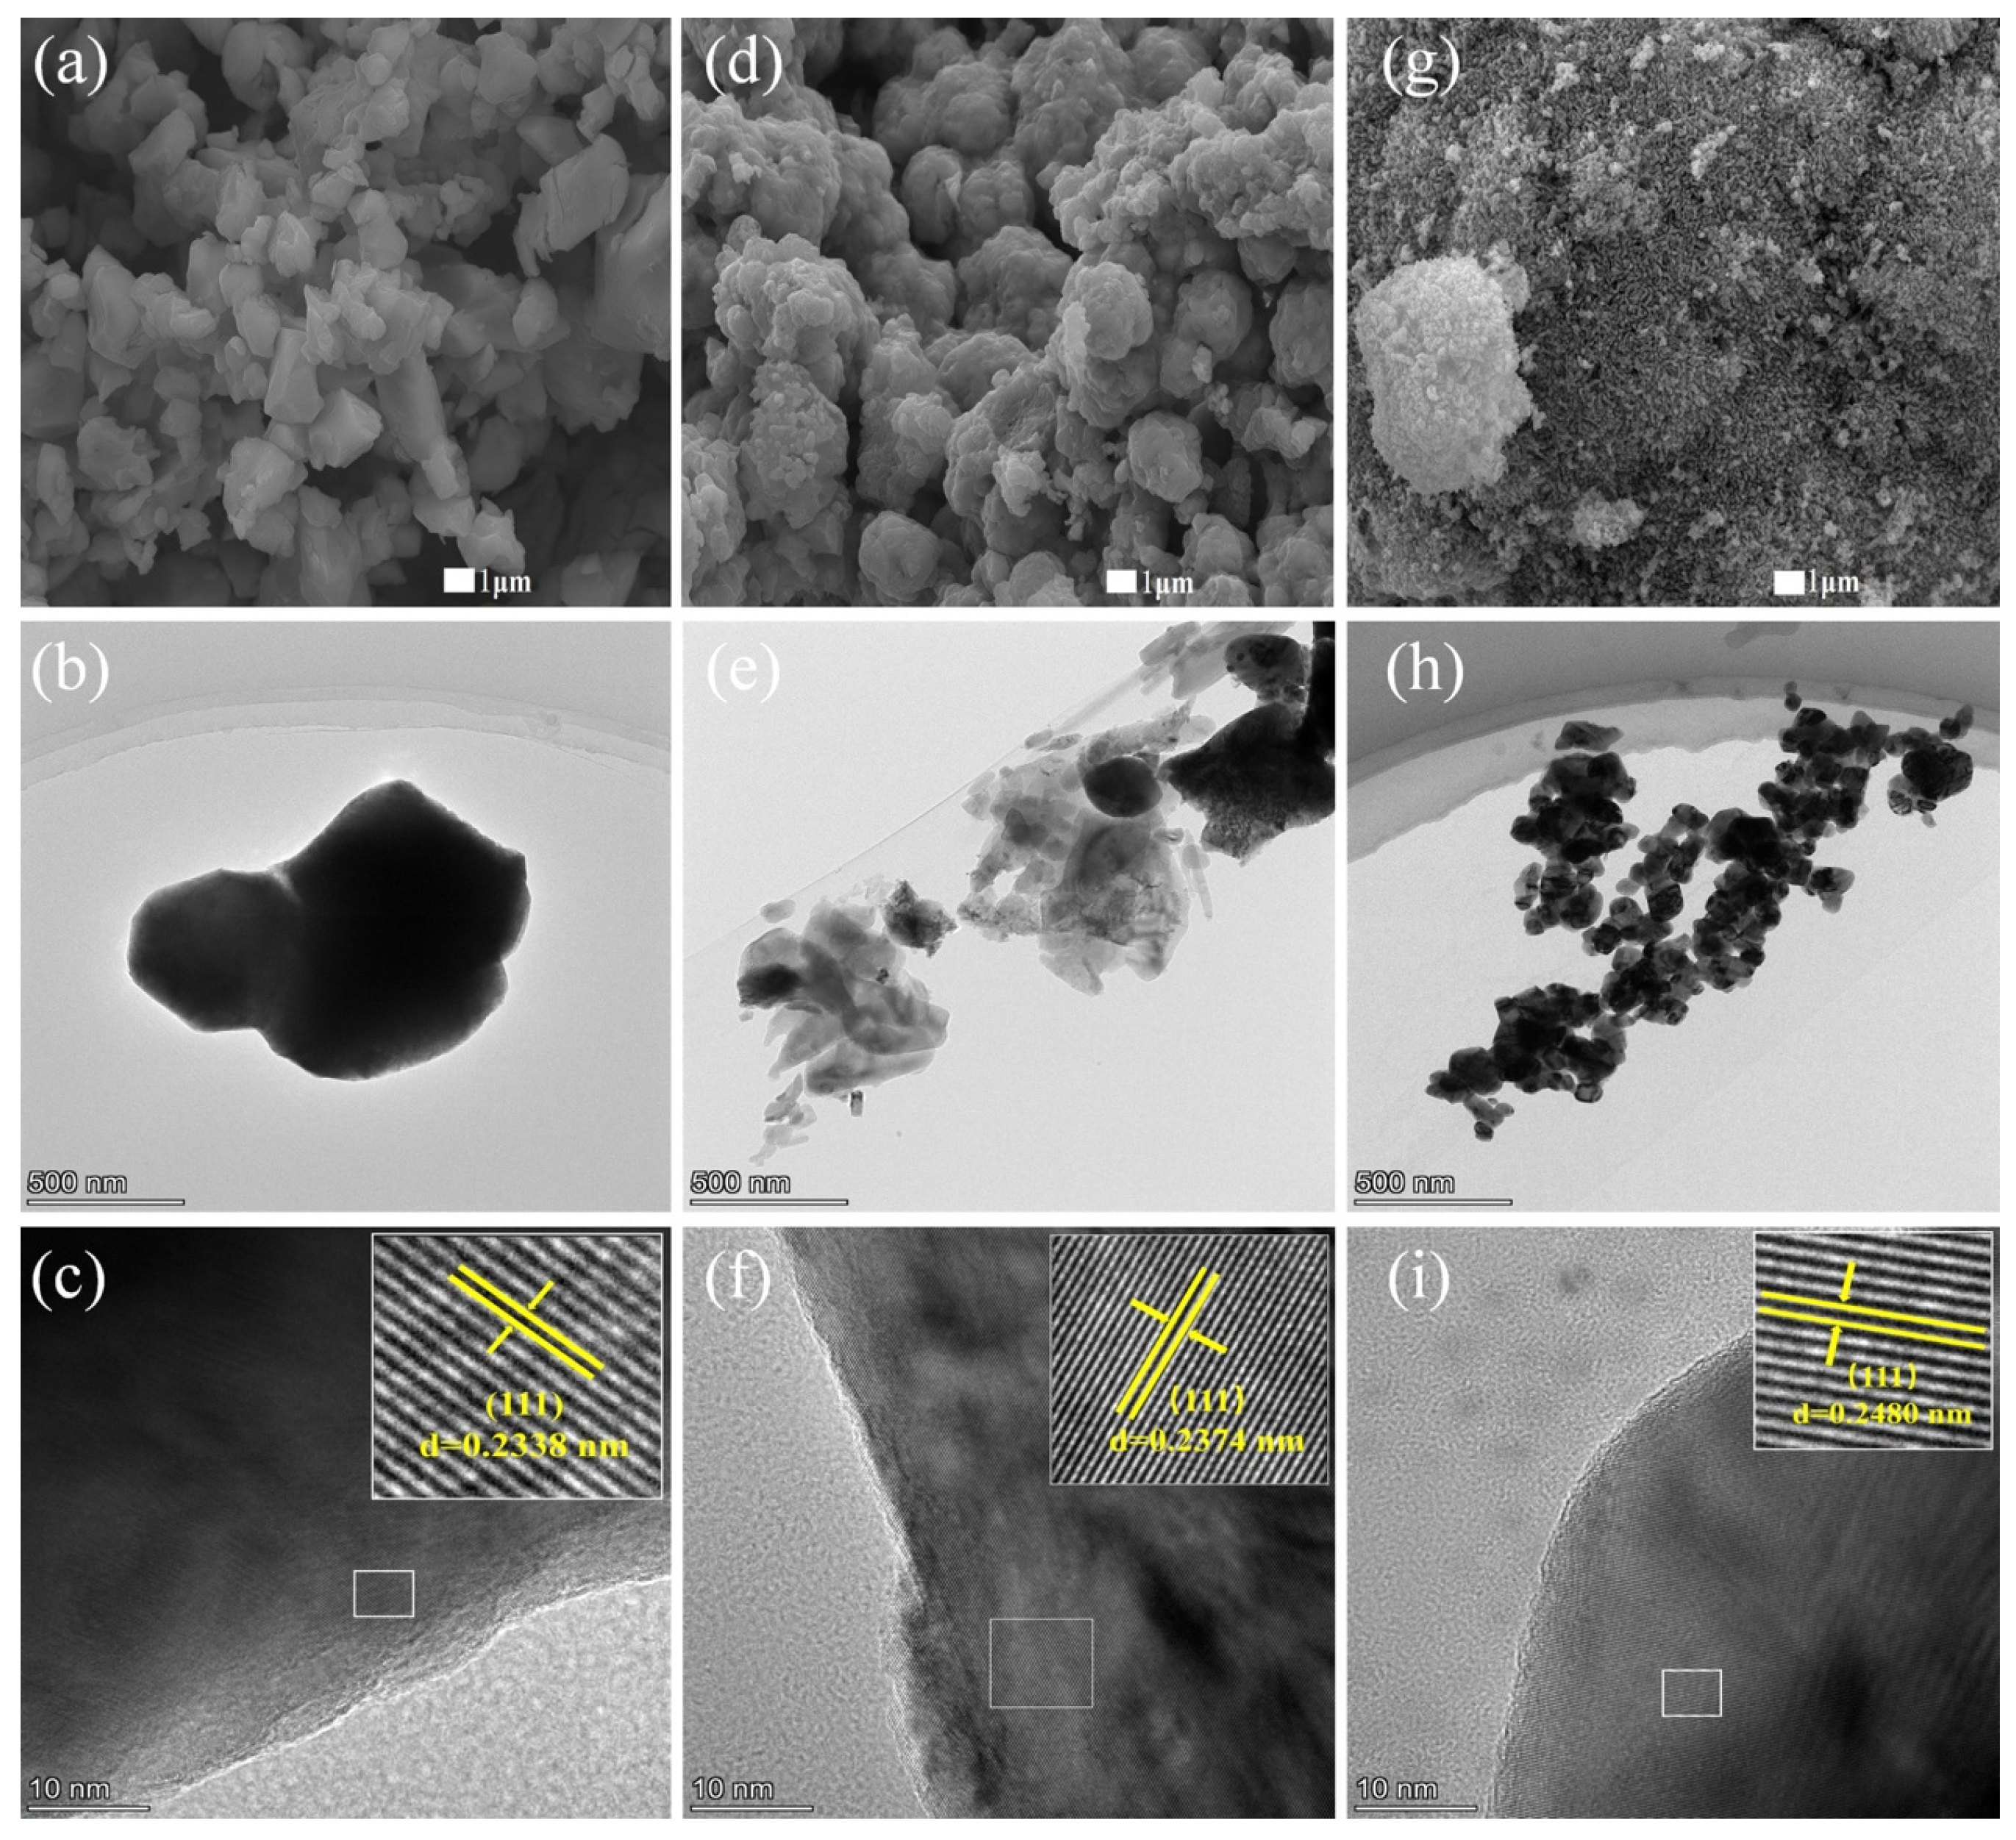
2.1.2. SEM and TEM
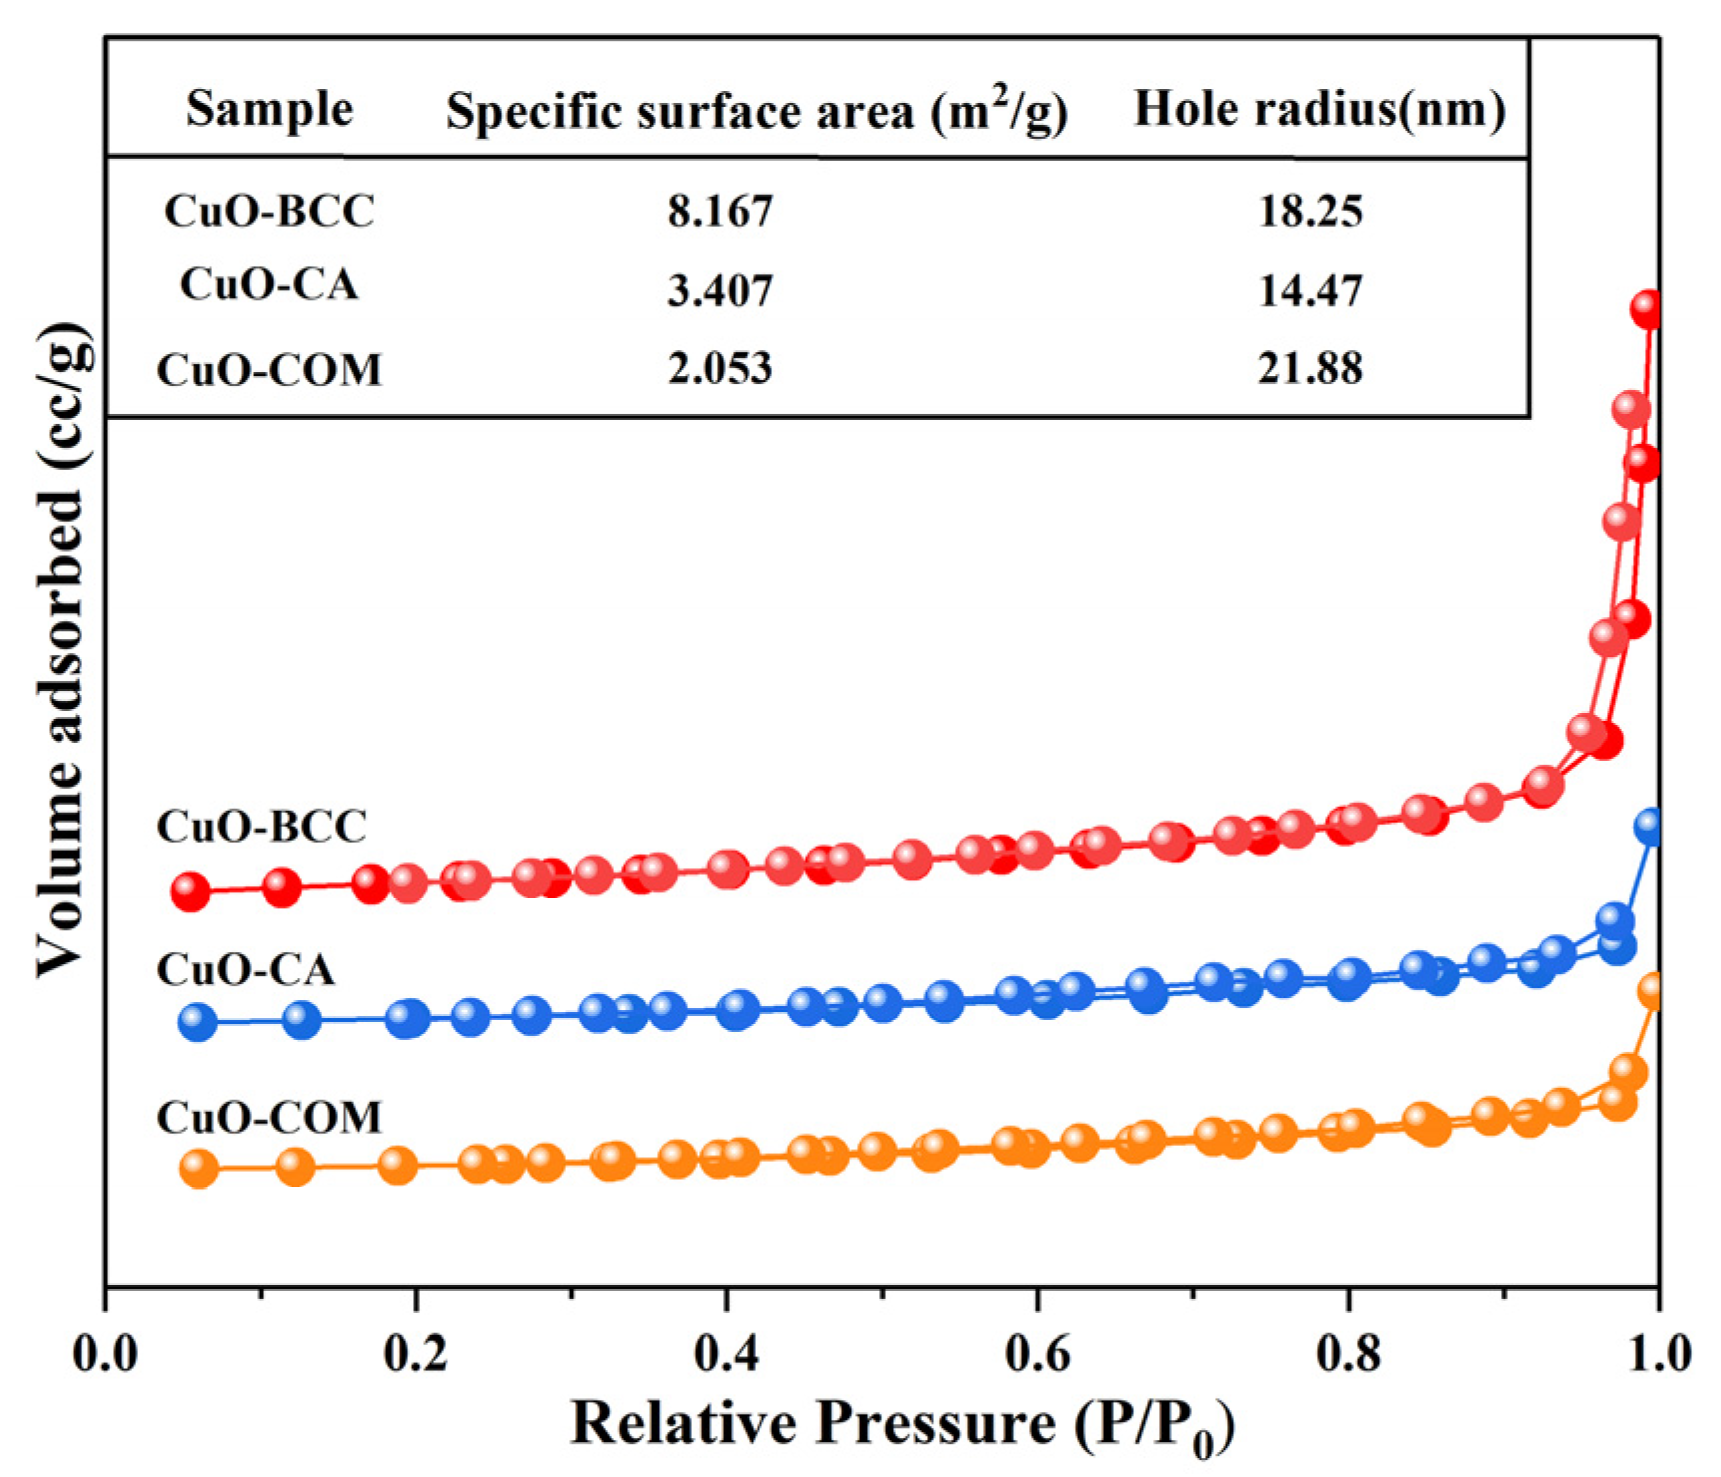
2.1.3. N2 Adsorption Surface Analysis
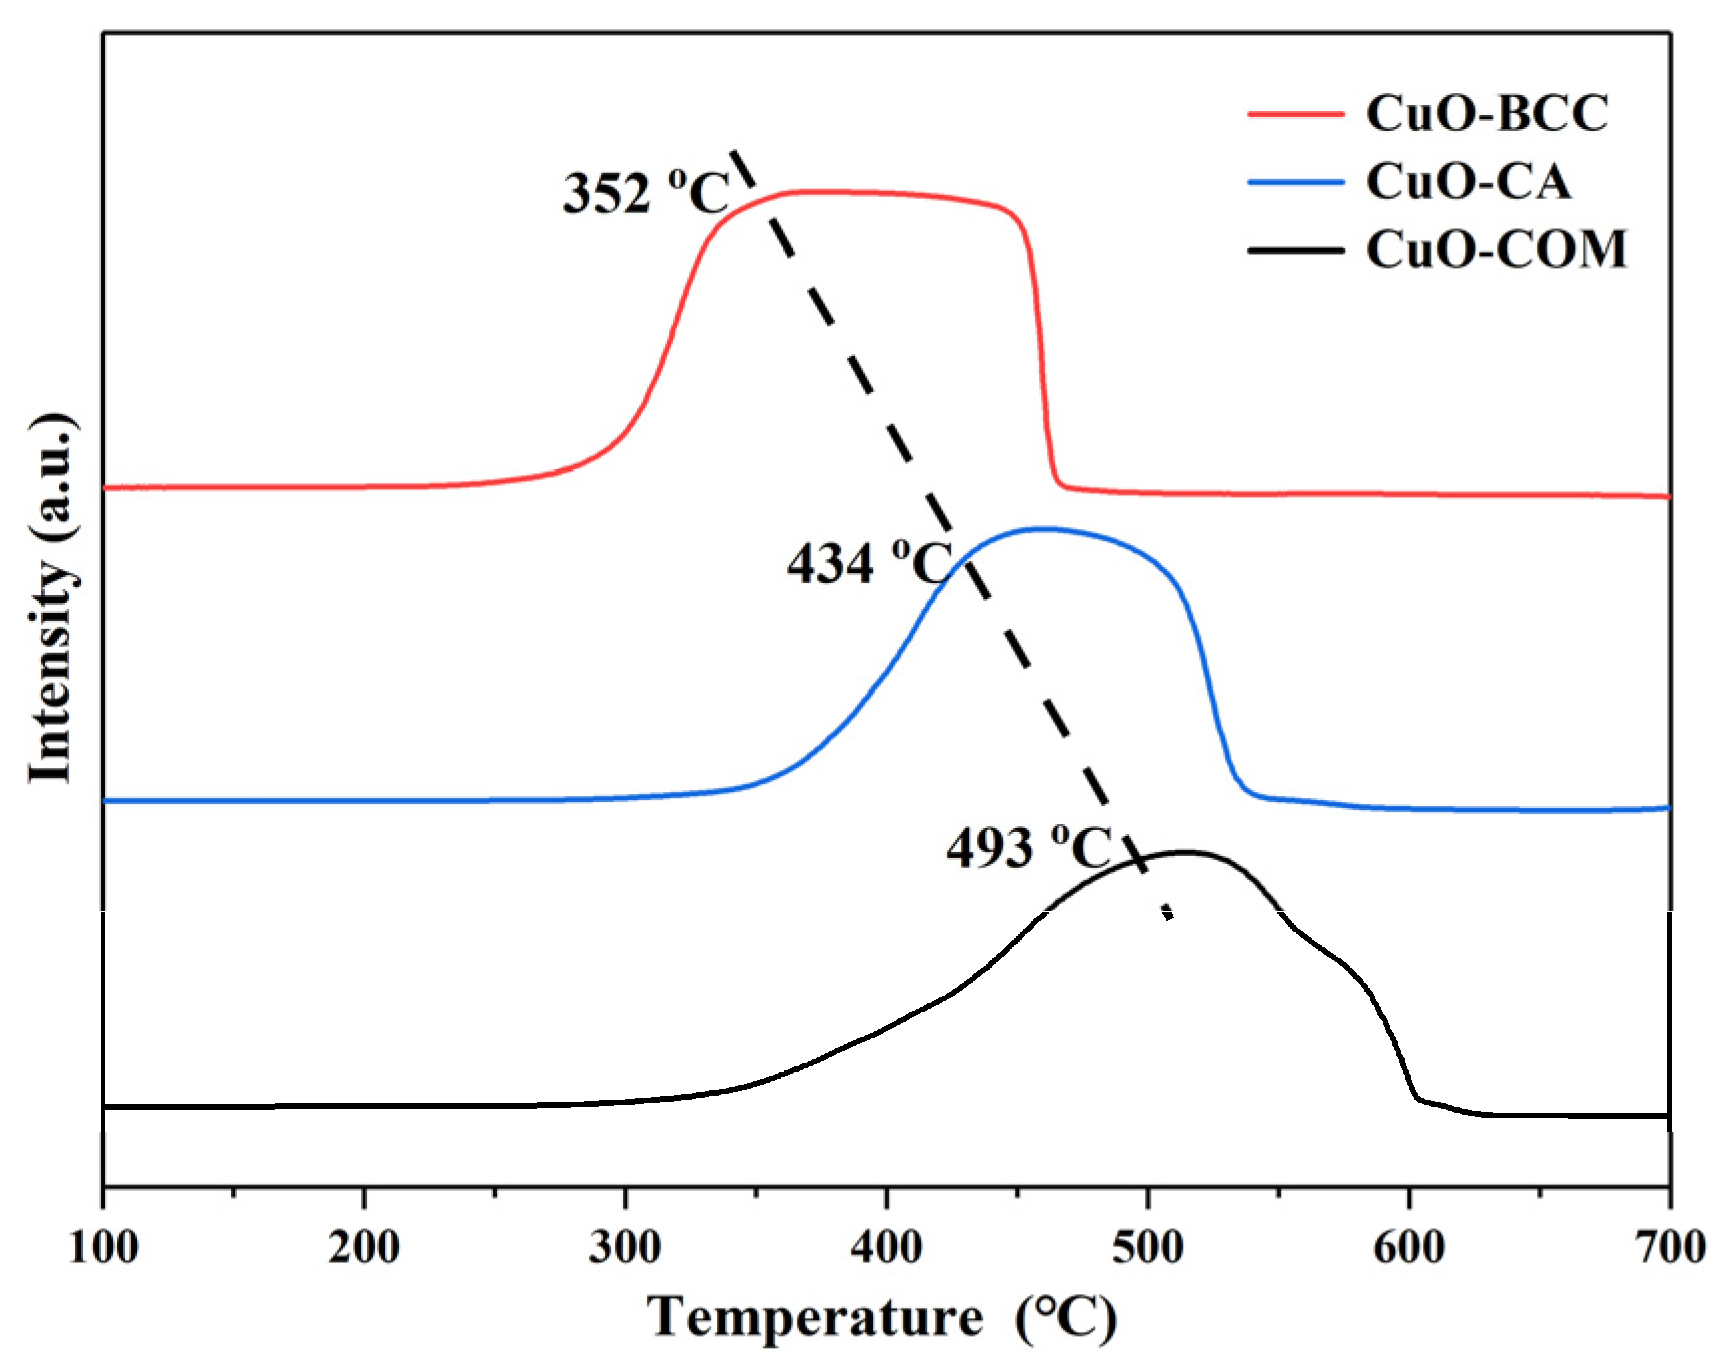
2.1.4. H2-TPR
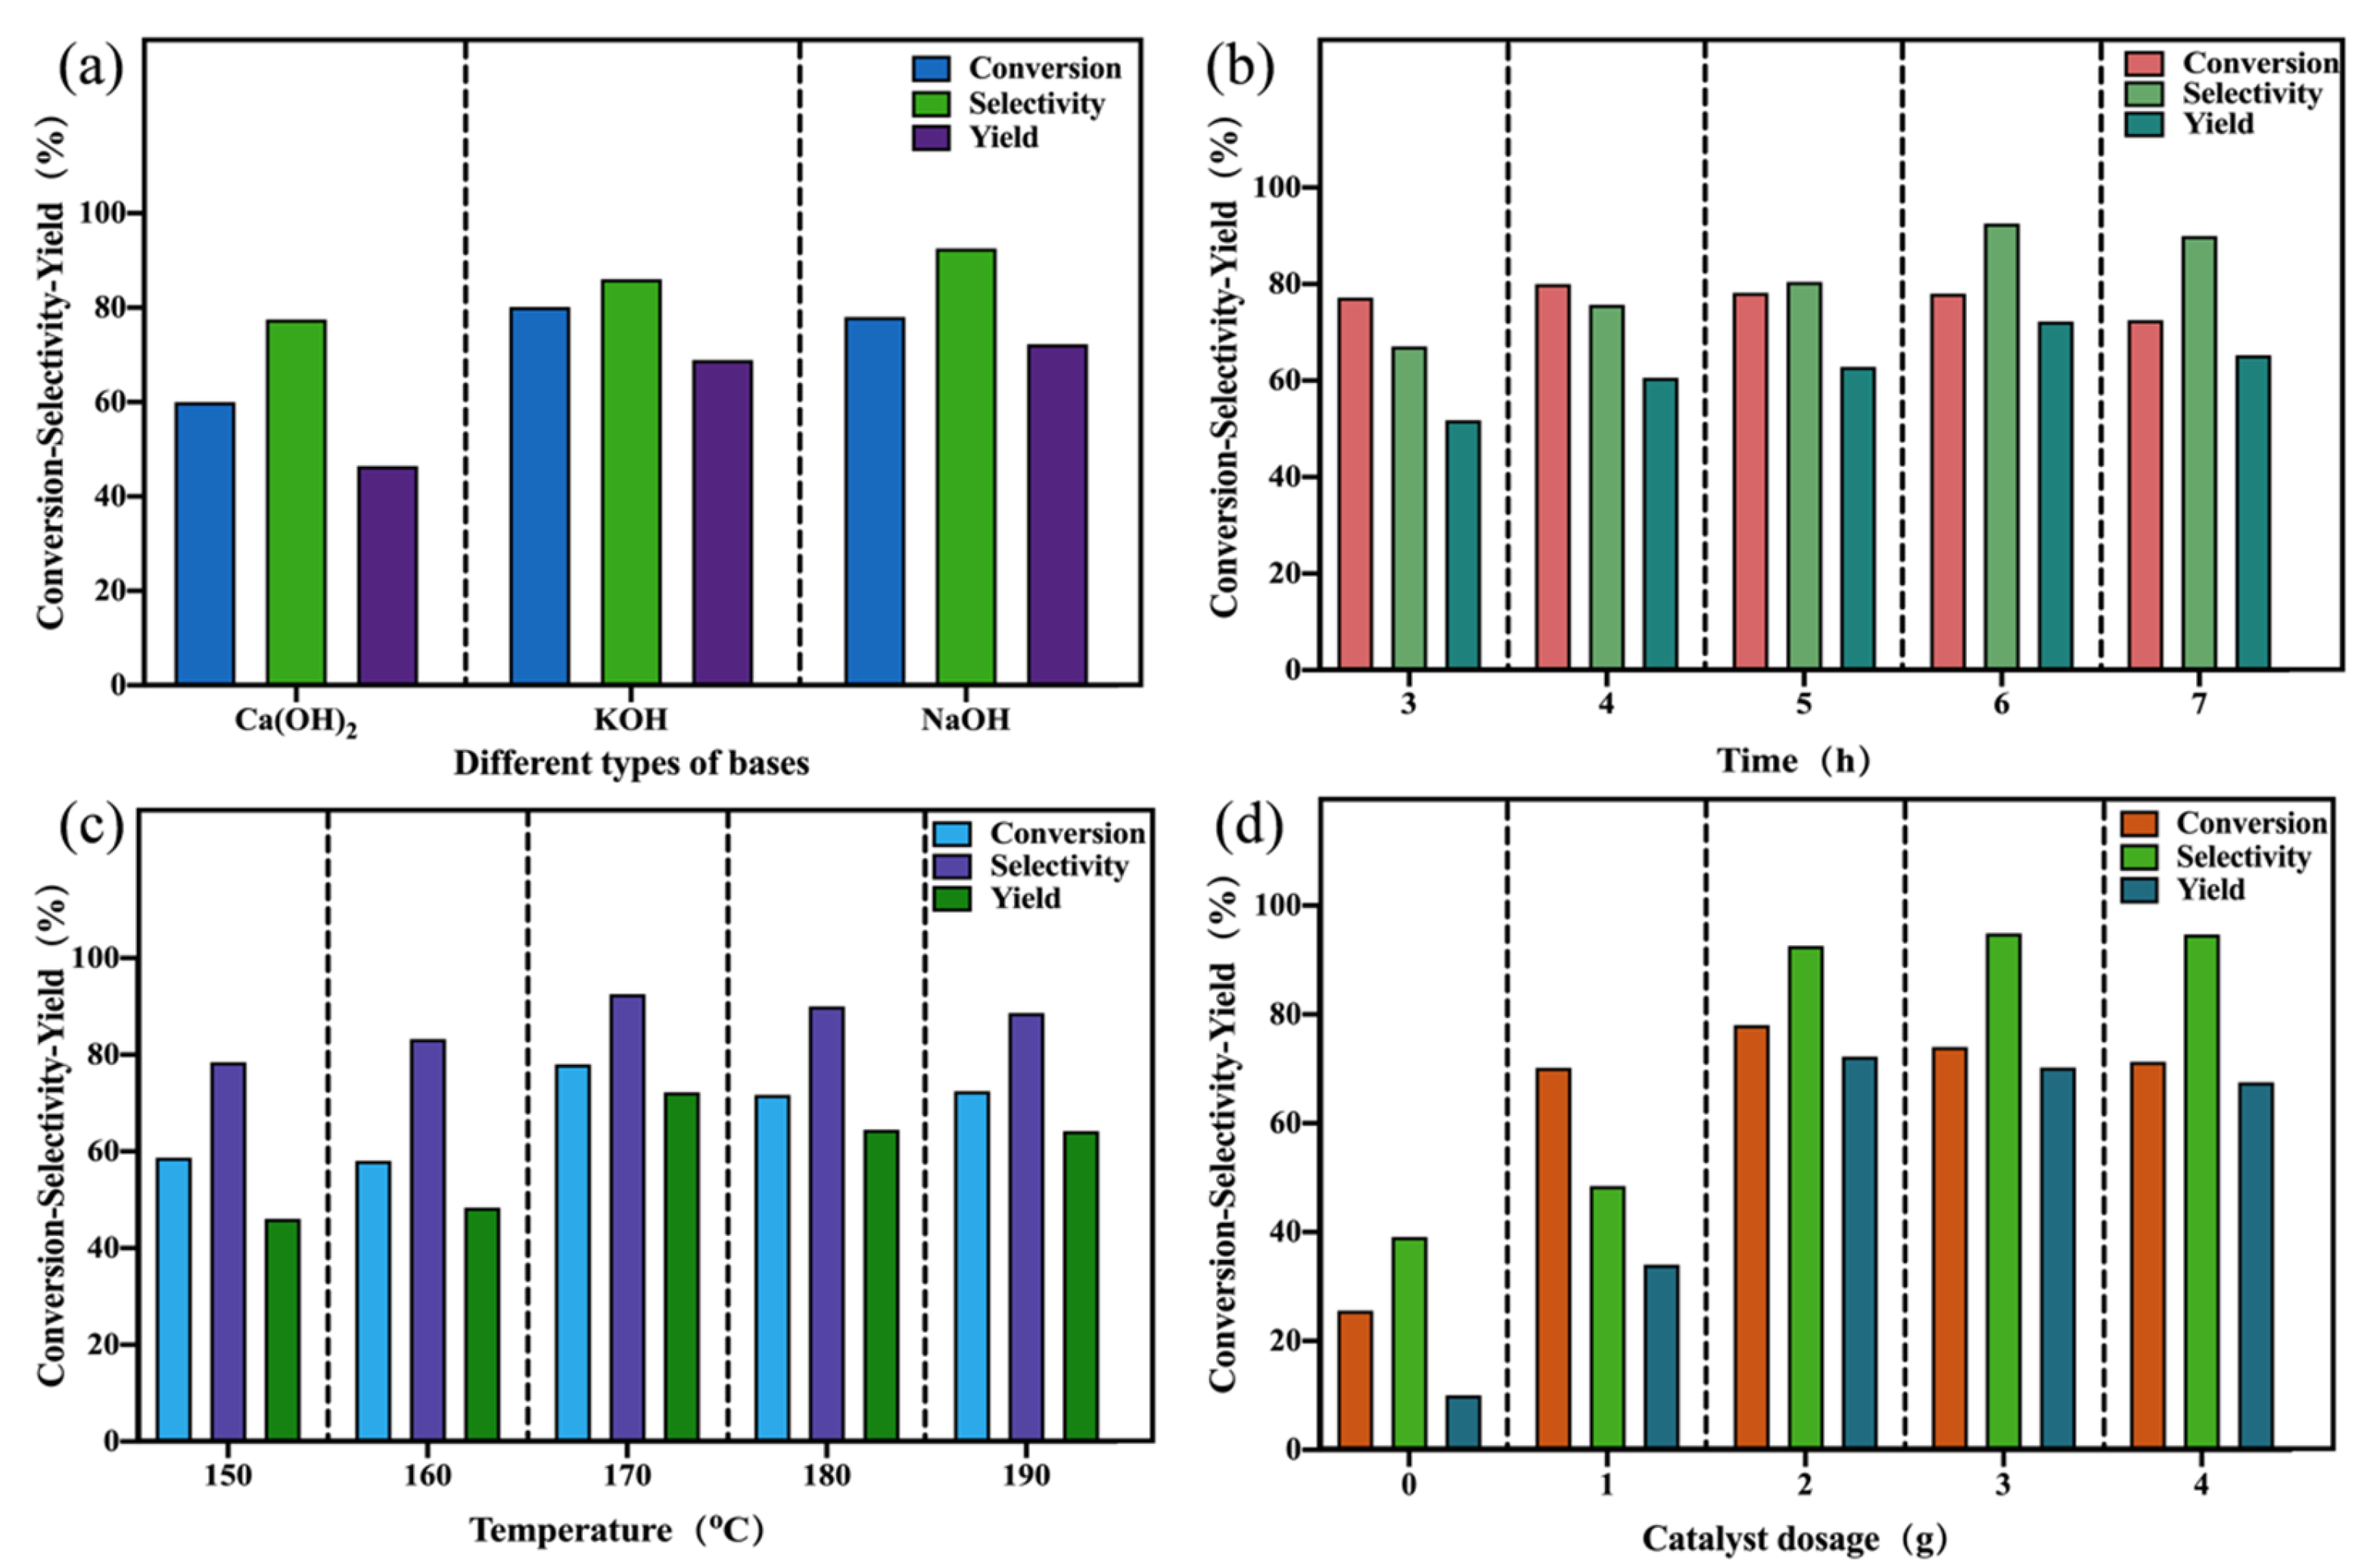
2.2. Optimization of Catalytic Reaction Parameters
2.3. Structure–Activity Relationship of Three CuO Pairs for Catalytic Reactions
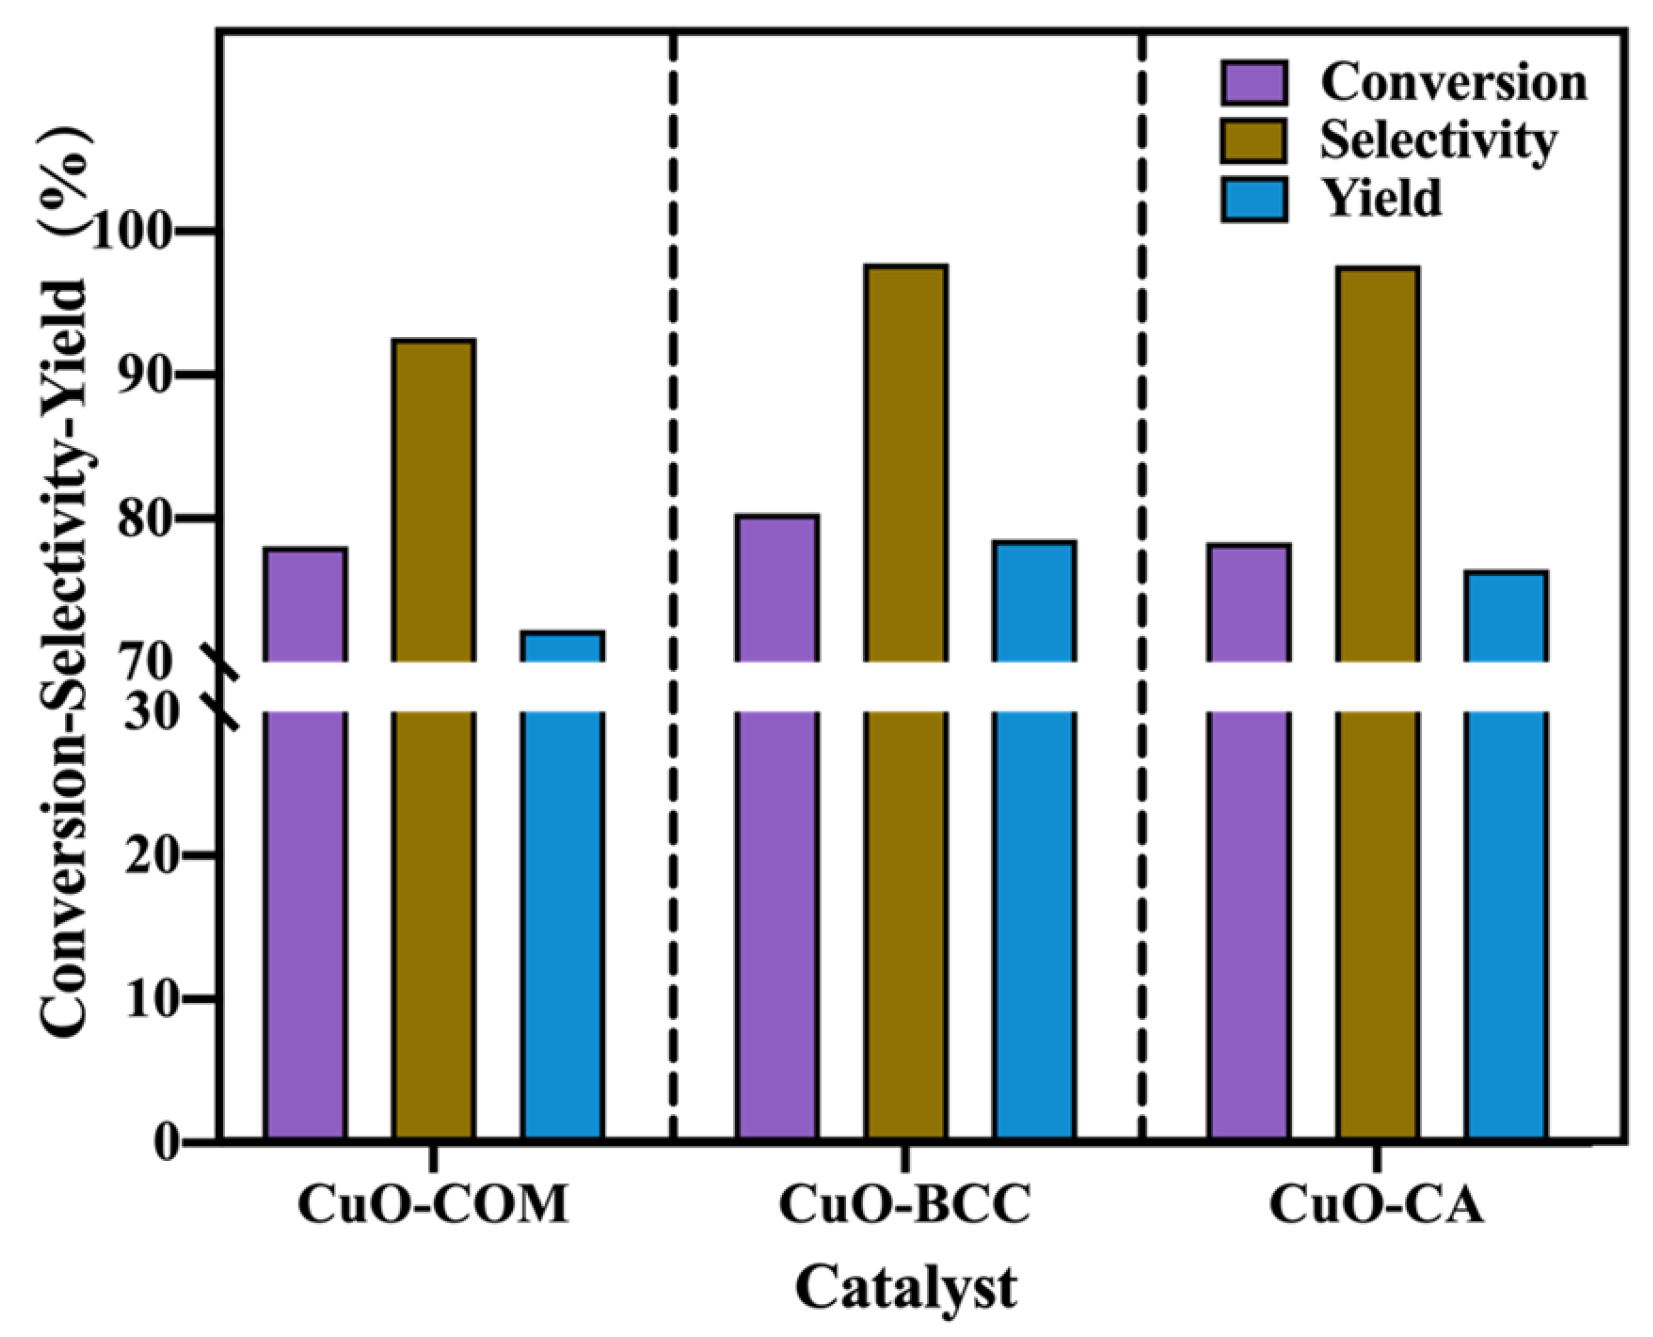
2.3.1. Effect of Three CuO on the Catalytic Performance
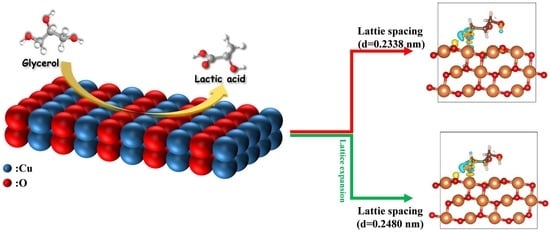
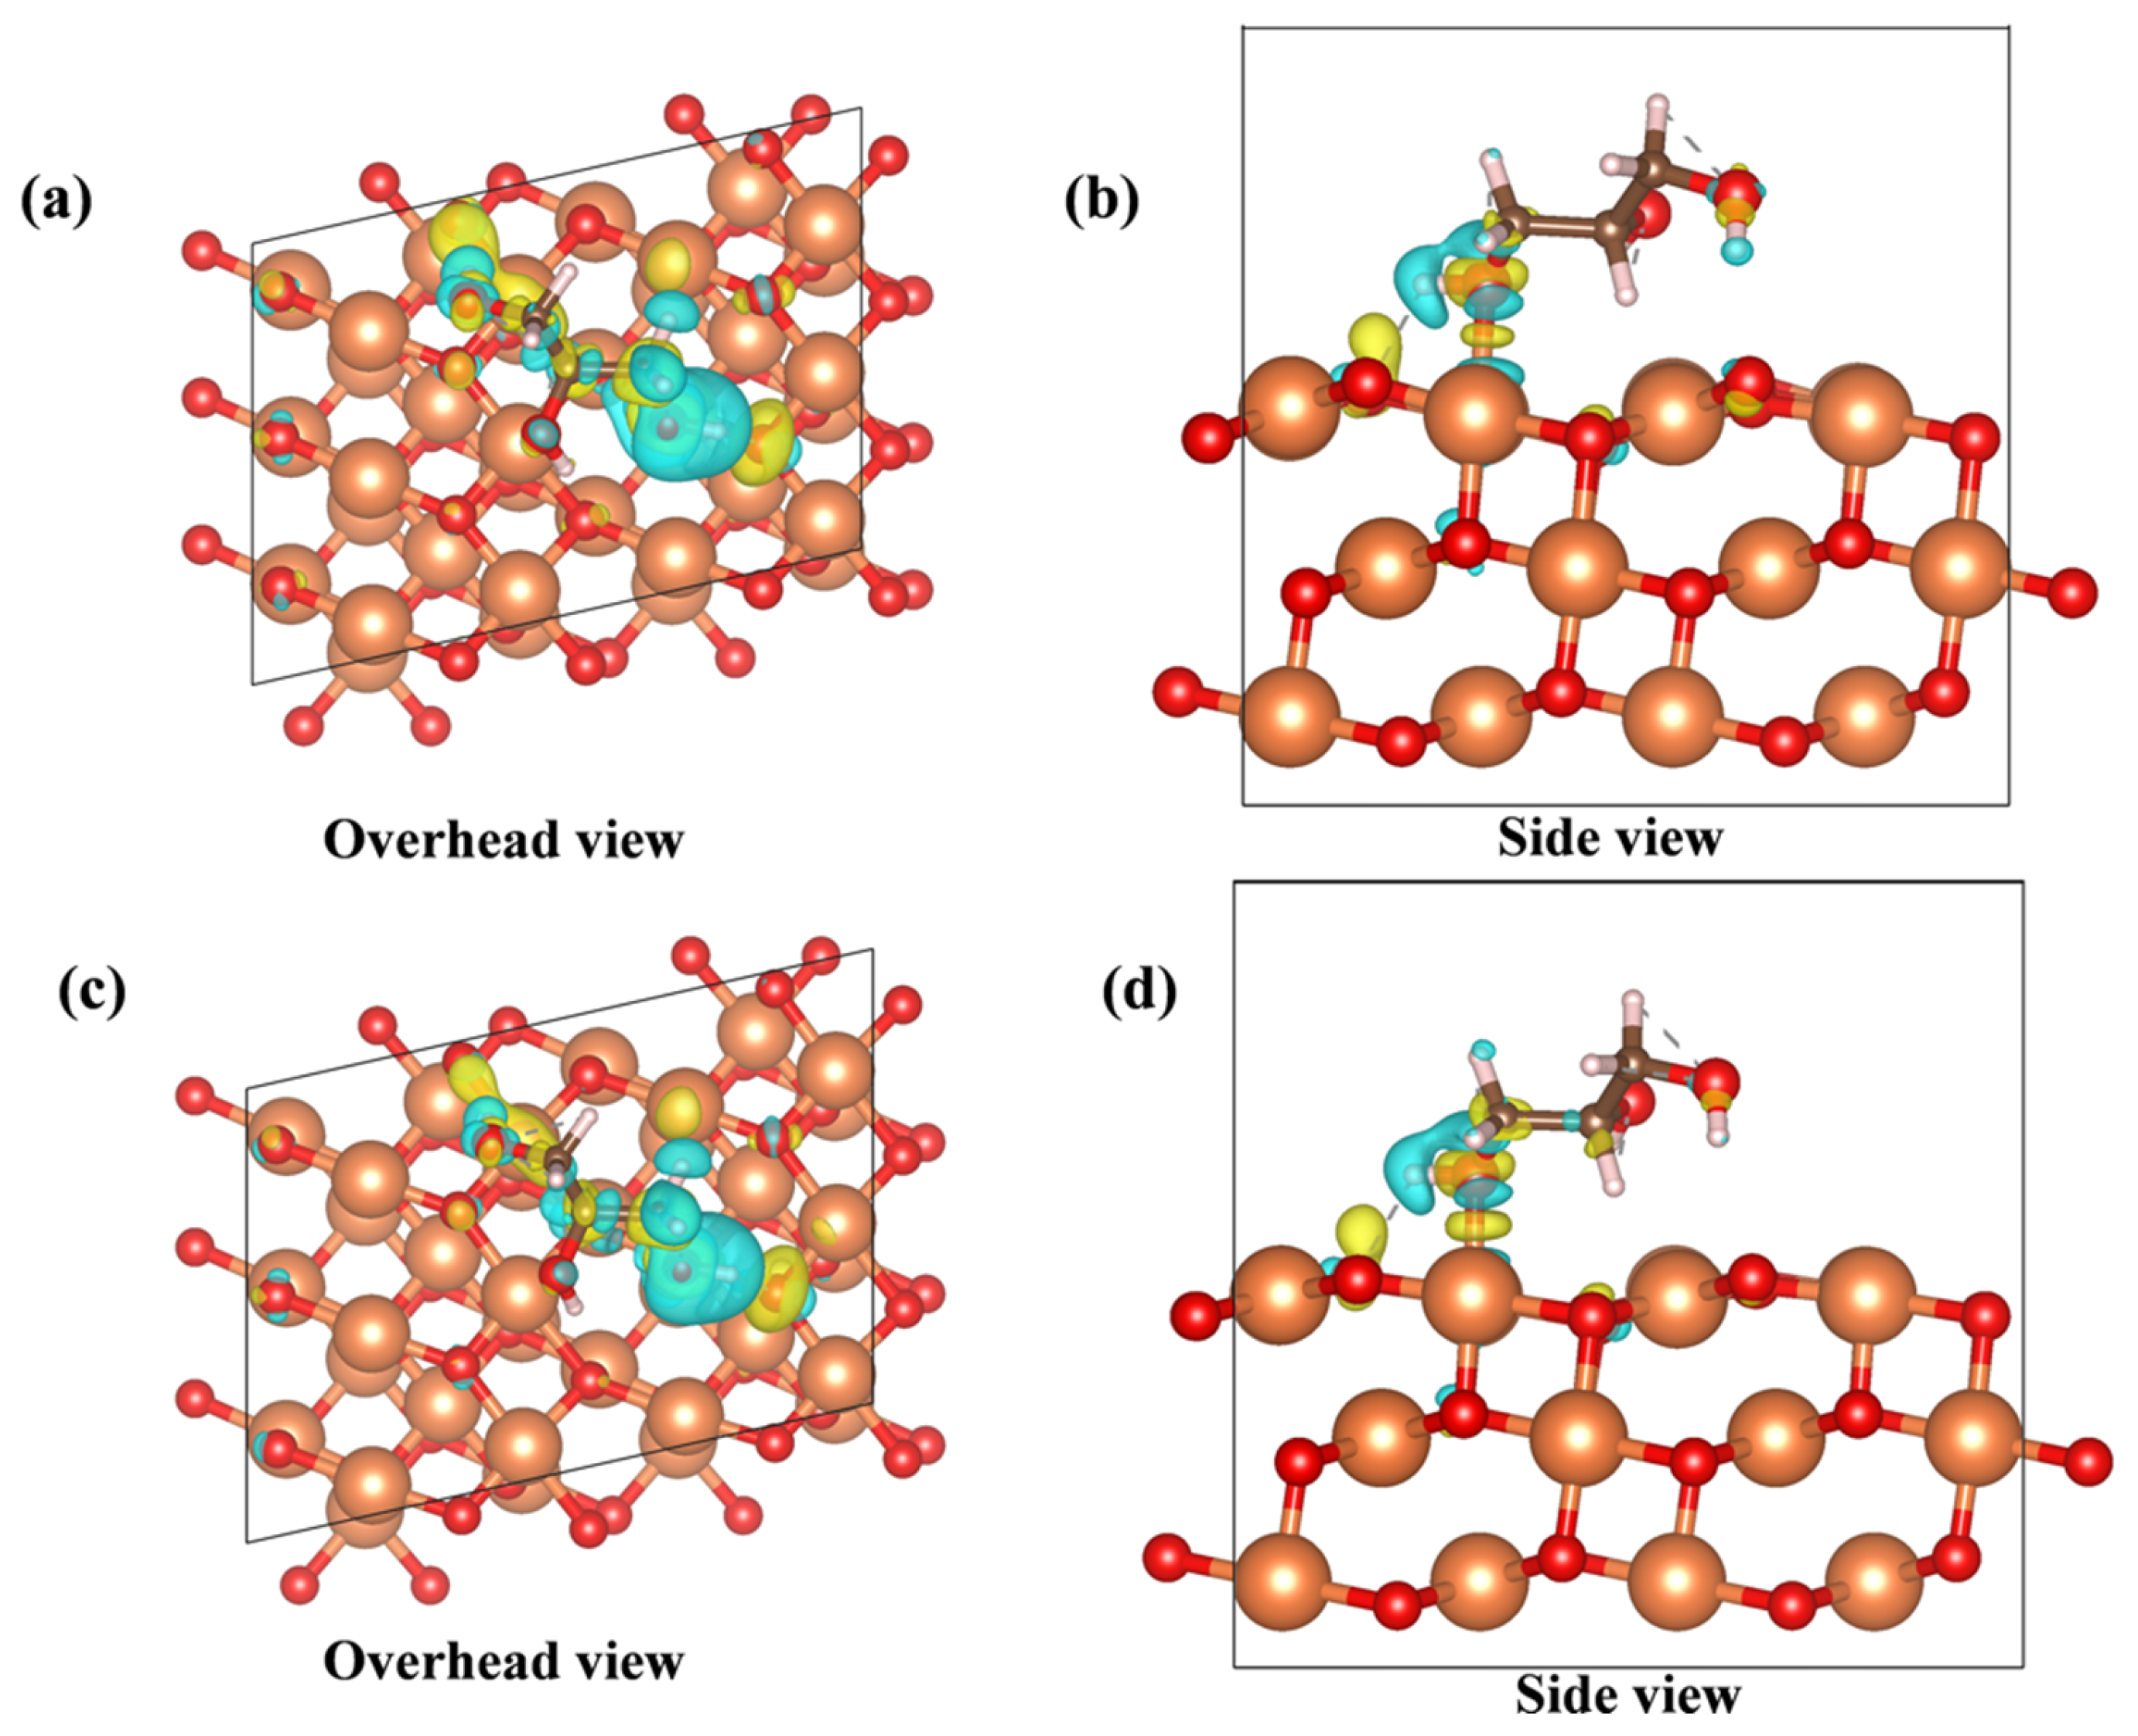
2.3.2. Density Functional Theory (DFT) Calculations
3. Experimental Section
3.1. Preparation
3.2. Characterizations
3.3. Catalytic Tests
3.4. Model Building and Calculation
4. Conclusions
Author Contributions
Funding
Data Availability Statement
Acknowledgments
Conflicts of Interest
References
- Chen, S.; Xu, S.; Ge, C.; Hu, C. Mechanistic Investigations of the Synthesis of Lactic Acid from Glycerol Catalyzed by an Iridium–NHC Complex. Processes 2022, 10, 626. [Google Scholar] [CrossRef]
- Wang, F.; Harindintwali, J.D.; Yuan, Z.; Wang, M.; Wang, F.; Li, S.; Yin, Z.; Huang, L.; Fu, Y.; Li, L.; et al. Technologies and perspectives for achieving carbon neutrality. Innovation 2021, 2, 100180. [Google Scholar] [CrossRef] [PubMed]
- Wang, Y.; Guo, C.; Chen, X.; Jia, L.; Guo, X.; Chen, R.; Zhang, M.; Chen, Z.; Wang, H. Carbon peak and carbon neutrality in China: Goals, implementation path and prospects. China Geol. 2021, 4, 720–746. [Google Scholar] [CrossRef]
- Silitonga, A.S.; Atabani, A.E.; Mahlia, T.M.I.; Masjuki, H.H.; Badruddin, I.A.; Mekhilef, S. A review on prospect of Jatropha curcas for biodiesel in Indonesia. Renew. Sust. Energ. Rev. 2011, 15, 3733–3756. [Google Scholar] [CrossRef]
- Oh, P.P.; Lau, H.L.N.; Chen, J.; Chong, M.F.; Choo, Y.M. A review on conventional technologies and emerging process intensification (PI) methods for biodiesel production. Renew. Sust. Energ. Rev. 2012, 16, 5131–5145. [Google Scholar] [CrossRef]
- Willke, T.; Vorlop, K. Biotransformation of glycerol into 1,3-propanediol. Eur. J. Lipid. Sci. Tech. 2008, 110, 831–840. [Google Scholar] [CrossRef]
- Yurdakul, M.; Ayas, N.; Bizkarra, K.; Doukkali, M.E.; Cambra, J.F. Preparation of Ni-based catalysts to produce hydrogen from glycerol by steam reforming process. Int. J. Hydrogen Energ. 2016, 41, 8084–8091. [Google Scholar] [CrossRef]
- Callam, C.S.; Singer, S.J.; Lowary, T.L.; Hada, C.M. Computational analysis of the potential energy surfaces of glycerol in the gas and aqueous phases: Effects of level of theory, basis set, and solvation on strongly intramolecularly hydrogen-bonded systems. J. Am. Chem. Soc. 2001, 123, 11743–11754. [Google Scholar] [CrossRef]
- Zhou, C.H.C.; Beltramini, J.N.; Fan, Y.X.; Lu, G.Q. Chemoselective catalytic conversion of glycerol as a biorenewable source to valuable commodity chemicals. Chem. Soc. Rev. 2008, 37, 527–549. [Google Scholar] [CrossRef]
- Viswanadham, B.; Pavankumar, V.; Chary, K.V.R. Vapor phase dehydration of glycerol to acrolein over phosphotungstic acid catalyst supported on niobia. Catal. Lett. 2014, 144, 744–755. [Google Scholar] [CrossRef]
- Sun, D.; Yamada, Y.; Sato, S.; Ueda, W. Glycerol as a potential renewable raw material for acrylic acid production. Green Chem. 2017, 19, 3186–3213. [Google Scholar] [CrossRef]
- Sagou, J.P.S.; Ahualli, S.; Thomas, F.; Duval, J.F.L. Influence of ionic strength and polyelectrolyte concentration on the electrical conductivity of suspensions of soft colloidal polysaccharides. J. Colloid Interf. Sci. 2015, 459, 212–217. [Google Scholar] [CrossRef] [PubMed]
- Tang, C.; Li, S.M.; Yu, S.S. Research Progress of Solid Catalysts for Catalytic Conversion of Glycerol to Lactic Acid. J. Mol. Catal. 2022, 36, 398–411. [Google Scholar]
- Slomkowski, S.; Penczek, S.; Duda, A. Polylactides—An overview. Polym. Advan. Technol. 2014, 25, 436–447. [Google Scholar] [CrossRef]
- Djukić-Vuković, A.; Mladenović, D.; Ivanović, J.; Pejin, J.; Mojović, L. Towards sustainability of lactic acid and poly-lactic acid polymers production. Renew. Sust. Energ. Rev. 2019, 108, 238–252. [Google Scholar] [CrossRef]
- Reddy, G.; Altaf, M.; Naveena, B.J.; Venkateshwar, M.; Kumar, E.V. Amylolytic bacterial lactic acid fermentation—A review. Biotechnol. Adv. 2008, 26, 22–34. [Google Scholar] [CrossRef]
- Martinez, F.A.C.; Balciunas, E.M.; Salgado, J.M.; González, J.M.D.; Converti, A.; Oliveira, R.P.S. Lactic acid properties, applications and production: A review. Trends Food Sci. Tech. 2013, 30, 70–83. [Google Scholar] [CrossRef]
- Kim, S.Y.; Kim, J.N.; Wee, Y.J.; Park, D.H.; Ryu, H.W. Production of bacterial cellulose by Gluconacetobacter sp. RKY5 isolated from persimmon vinegar. Appl. Biochem. Biotech. 2006, 131, 705–715. [Google Scholar] [CrossRef] [PubMed]
- Lasprilla, A.J.R.; Martinez, G.A.R.; Lunelli, B.H.; Jardini, A.L.; Filho, R.M. Poly-lactic acid synthesis for application in biomedical devices—A review. Biotechnol. Adv. 2012, 30, 321–328. [Google Scholar] [CrossRef]
- Nwamba, M.C.; Sun, F.; Mukasekuru, M.R.; Song, G.; Harindintwali, J.D.; Boyi, S.A.; Sun, H. Trends and hassles in the microbial production of lactic acid from lignocellulosic biomass. Environ. Technol. Inno. 2021, 21, 101337. [Google Scholar] [CrossRef]
- Ghaffar, T.; Irshao, M.; Anwar, Z.; Aqil, T.; Zulifqar, Z.; Asma Tariq, A.; Kamran, M.; Nudrat Ehsan, N.; Mehmood, S. Recent trends in lactic acid biotechnology: A brief review on production to purification. J. Radiat. Res. Appl. Sci. 2014, 7, 222–229. [Google Scholar] [CrossRef]
- Mrillo, B.; Zornoza, B.; De la Iglesia, O.; Téllez, C.; Coronas, J. Chemocatalysis of sugars to produce lactic acid derivatives on zeolitic imidazolate frameuworks. J. Catal. 2016, 334, 60–67. [Google Scholar] [CrossRef]
- Auneau, F.; Aranil, S.; Besson, M.; Djakovitch, L.; Michel, C.; Delbecq, F.; Sautet, P.; Pinel, C. Heterogeneous Transformation of Glycerol to Lactic Acid. Top. Catal. 2012, 55, 474–479. [Google Scholar] [CrossRef]
- John, R.P.; Anisha, G.S.; Nampoothiri, K.M.; Pandey, A. Direct lactic acid fermentation: Focus on simultaneous saccharification and lactic acid production. Biotechnol. Adv. 2009, 27, 145–152. [Google Scholar] [CrossRef]
- Kishida, H.; Jin, F.; Zhou, Z.; Takehiko, M.; Heiji, E. Conversion of Glycerin into Lactic Acid by Alkaline Hydrothermal Reaction. Chem. Lett. 2005, 34, 1560–1561. [Google Scholar] [CrossRef]
- Sharninghausen, L.S.; Campos, J.; Manas, M.G.; Crabtree, R.H. Efficient selective and atom economic catalytic conversion of glycerol to lactic acid. Nat. Commun. 2014, 5, 1–9. [Google Scholar] [CrossRef]
- Siddiki, S.M.A.H.; Touchy, A.S.; Kon, K.; Toyao, T.; Shimizu, K. Oxidant-free dehydrogenation of glycerol to lactic acid by heterogeneous platinum catalysts. ChemCatChem 2017, 9, 2816–2821. [Google Scholar] [CrossRef]
- Yang, H.; Chen, Y.; Cui, X.; Wang, G.; Cen, Y.; Deng, T.; Yan, W.; Gao, J.; Zhu, S.; Olabye, U.; et al. A Highly Stable Copper-Based Catalyst for Clarifying the Catalytic Roles of Cu0 and Cu+ Species in Methanol Dehydrogenation. Angew. Chem. Int. Ed. 2018, 130, 1854–1858. [Google Scholar] [CrossRef]
- Phung, T.K. Copper-based catalysts for ethanol dehydrogenation and dehydrogenative coupling into hydrogen, acetaldehyde and ethyl acetate. Int. J. Hydrogen Energ. 2022, 47, 42234–42249. [Google Scholar] [CrossRef]
- Wang, Z.; Liu, X.; Rooney, D.W.; Hu, P. Elucidating the mechanism and active site of the cyclohexanol dehydrogenation on copper-based catalysts: A density functional theory study. Surf. Sci. 2015, 640, 181–189. [Google Scholar] [CrossRef]
- Zavrazhnov, S.A.; Esipovich, A.L.; Zlobin, S.Y.; Belousov, A.S.; Vorotyntsev, A.V. Mechanism Analysis and Kinetic Modelling of Cu NPs Catalysed Glycerol Conversion into Lactic Acid. Catalysts 2019, 9, 231. [Google Scholar] [CrossRef]
- Roy, D.; Subramaniam, B.; Chaudhari, R.V. Cu-based catalysts show low temperature activity for glycerol conversion to lactic acid. ACS Catal. 2011, 1, 548–551. [Google Scholar] [CrossRef]
- Moreira, A.B.F.; Bruno, A.M.; Souza, M.M.V.M.; Robinson, L.M. Continuous production of lactic acid from glycerol in alkaline medium using supported copper catalysts. Fuel Process. Technol. 2016, 144, 170–180. [Google Scholar] [CrossRef]
- Yin, H.; Zhang, C.; Yin, H.; Gao, D.; Shen, L.; Wang, A. Hydrothermal conversion of glycerol to lactic acid catalyzed by Cu/hydroxyapatite, Cu/MgO, and Cu/ZrO2 and reaction kinetics. Chem. Eng. J. 2016, 288, 332–343. [Google Scholar] [CrossRef]
- Ftouni, J.; Villandier, N.; Auneau, F.; Besson, M.; Djakovitch, L.; Pinel, C. From glycerol to lactic acid under inert conditions in the presence of platinum-based catalysts: The influence of support. Catal. Today 2015, 257, 267–273. [Google Scholar] [CrossRef]
- Zavrazhnov, S.A.; Esipovich, A.L.; Danov, S.M.; Zlobin, S.Y.; Belousov, A.S. Catalytic Conversion of Glycerol to Lactic Acid: State of the Art and Prospects. Kinet. Catal. 2018, 59, 459–471. [Google Scholar] [CrossRef]
- Yang, G.Y.; Ke, Y.H.; Ren, H.F.; Liu, C.L.; Yang, R.Z.; Dong, W.S. The conversion of glycerol to lactic acid catalyzed by ZrO2-supported CuO catalysts. Chem. Eng. J. 2016, 283, 759–767. [Google Scholar] [CrossRef]
- Razali, N.; Abdullah, A.Z. Production of lactic acid from glycerol via chemical conversion using solid catalyst: A review. Appl. Catal. A Gen. 2017, 543, 234–246. [Google Scholar] [CrossRef]
- Kresse, G.; Joubert, D. From ultrasoft pseudopotentials to the projector augmented-wave method. Phys. Rev. B 1999, 59, 1758–1777. [Google Scholar] [CrossRef]
- Perdew, J.P.; Burke, K.; Ernzerhof, M. Generalized gradient approximation made simple. Phys. Rev. Lett. 1996, 77, 3865–3868. [Google Scholar] [CrossRef]
- Grimme, S.; Antony, J.; Ehrlich, S.; Krieg, H. A consistent and accurate ab initio parametrization of density functional dispersion correction (DFT-D) for the 94 elements H-Pu. J. Chem. Phys. 2010, 132, 154104. [Google Scholar] [CrossRef] [PubMed]
- Monkhorst, H.J.; Pack, J.D. Special points for Brillouin-zone integrations. Phys. Rev. B 1976, 13, 5188. [Google Scholar] [CrossRef]


| NaOH/Glycerol Molarity | Glycerol Conversion Rate (%) | Lactic Acid Selectivity (%) |
|---|---|---|
| 0 | trace | — |
| 0.5 | 58.12 | 81.70 |
| 1.1 | 78.05 | 92.56 |
| 1.5 | 76.52 | 93.43 |
| 1.8 | 73.07 | 93.99 |
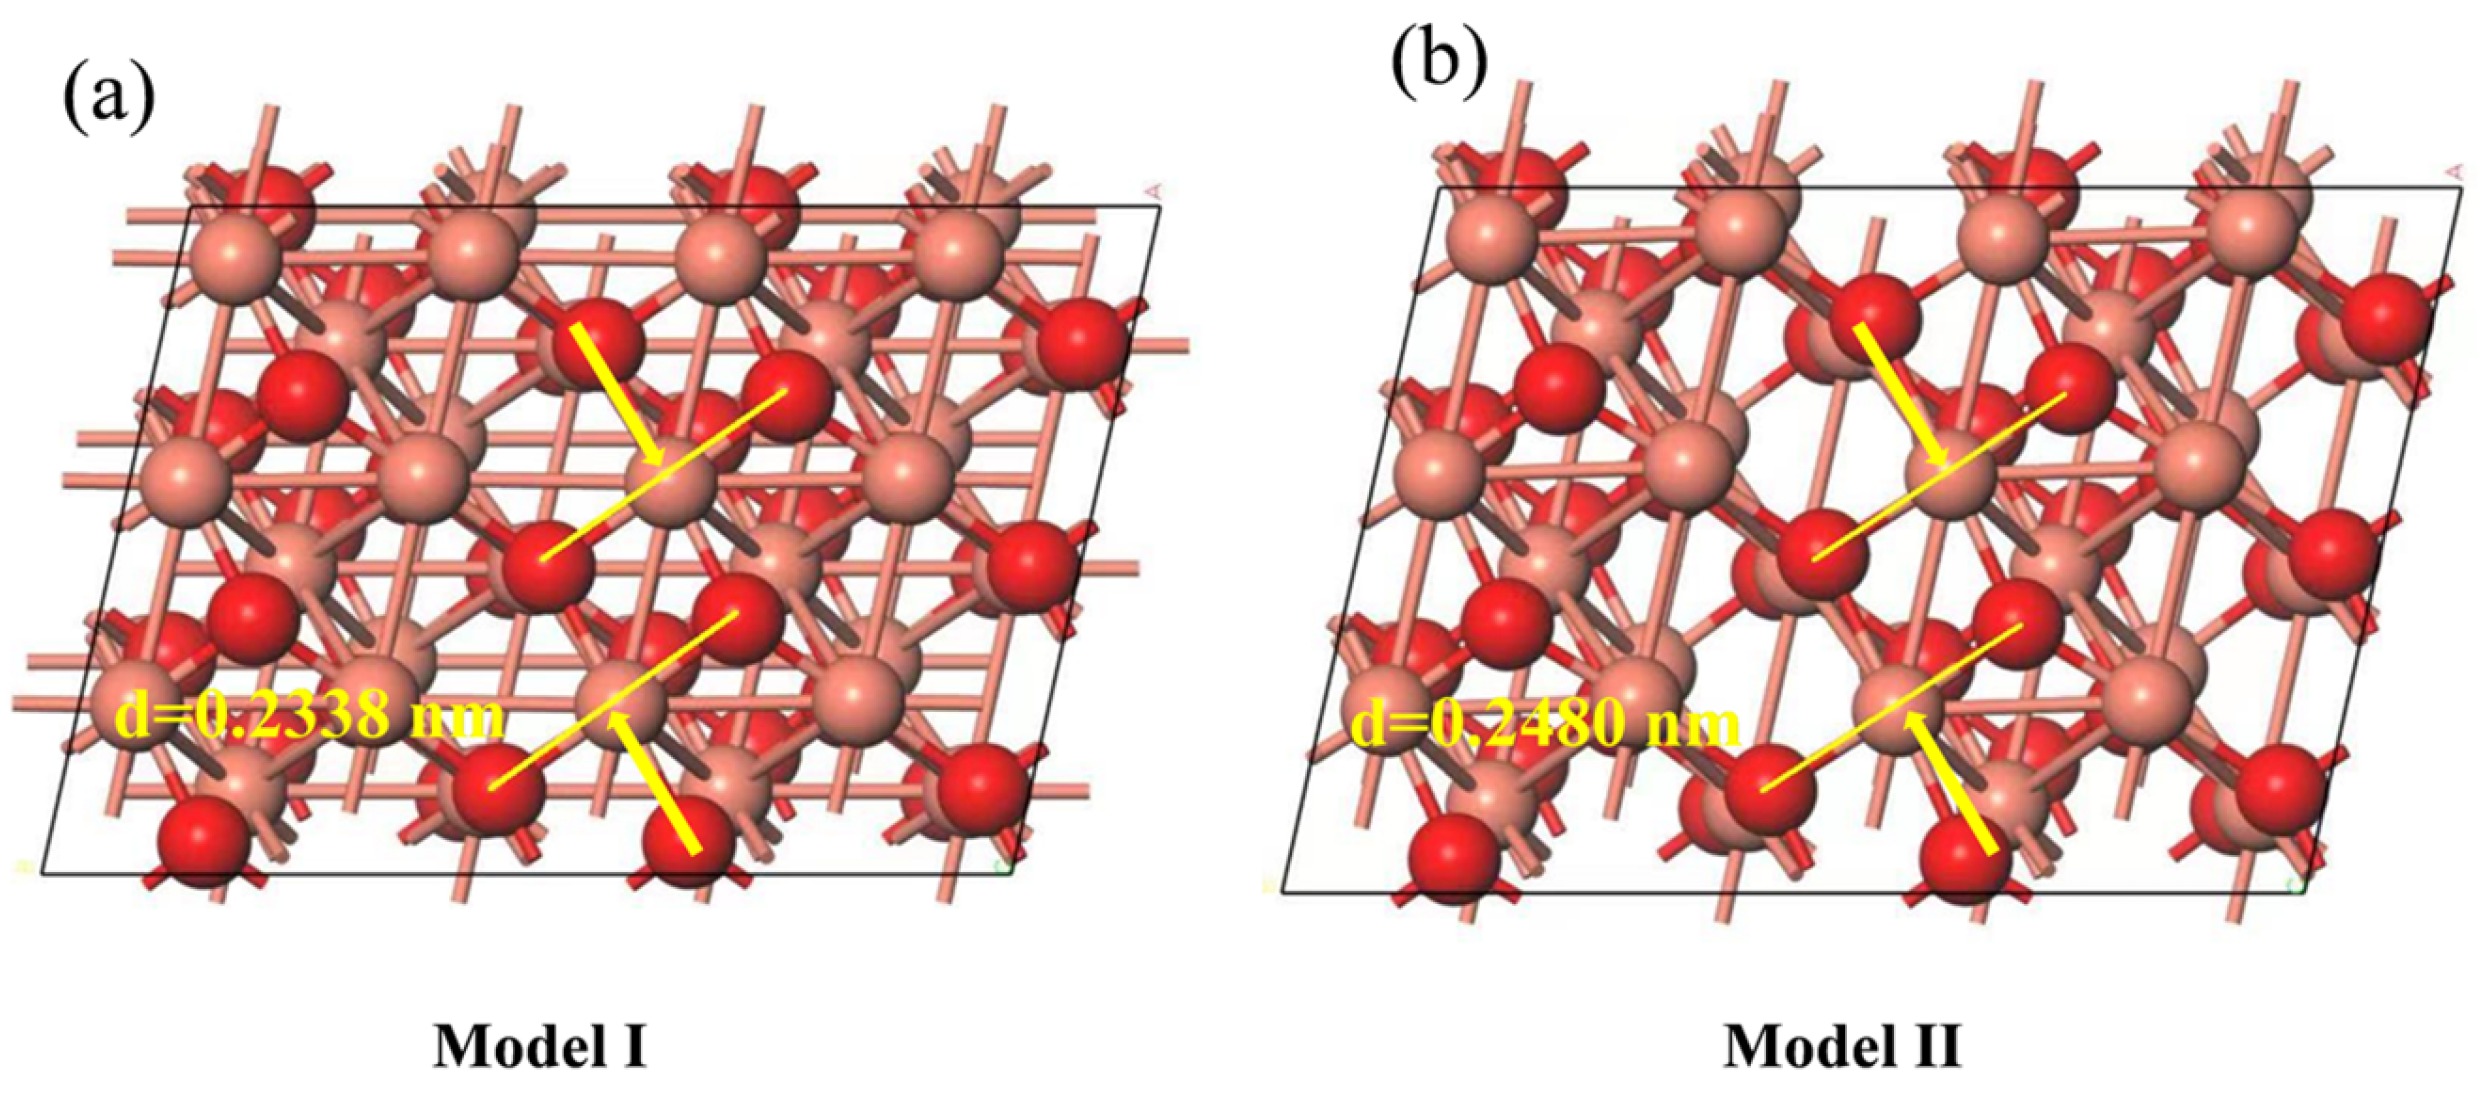
| Models | lattice Spacing (nm) | Adsorption Energy (eV) | Cu–O Bond Length (Å) |
|---|---|---|---|
| CuO–COM | 0.2338 | −3.41 | 2.0652 |
| CuO–BCC | 0.2480 | −3.05 | 1.9753 |
Disclaimer/Publisher’s Note: The statements, opinions and data contained in all publications are solely those of the individual author(s) and contributor(s) and not of MDPI and/or the editor(s). MDPI and/or the editor(s) disclaim responsibility for any injury to people or property resulting from any ideas, methods, instructions or products referred to in the content. |
© 2023 by the authors. Licensee MDPI, Basel, Switzerland. This article is an open access article distributed under the terms and conditions of the Creative Commons Attribution (CC BY) license (https://creativecommons.org/licenses/by/4.0/).
Share and Cite
Tang, C.; Li, S.; Li, S.; Wang, Y.; He, M.; Huang, M.; Yu, S. The Structure–Activity Relationship of CuO in the Catalytic Conversion Reaction of Glycerol to Lactic Acid. Catalysts 2023, 13, 1218. https://doi.org/10.3390/catal13081218
Tang C, Li S, Li S, Wang Y, He M, Huang M, Yu S. The Structure–Activity Relationship of CuO in the Catalytic Conversion Reaction of Glycerol to Lactic Acid. Catalysts. 2023; 13(8):1218. https://doi.org/10.3390/catal13081218
Chicago/Turabian StyleTang, Cheng, Shuangming Li, Shanqi Li, Yiwen Wang, Mingyue He, Mengyuan Huang, and Sansan Yu. 2023. "The Structure–Activity Relationship of CuO in the Catalytic Conversion Reaction of Glycerol to Lactic Acid" Catalysts 13, no. 8: 1218. https://doi.org/10.3390/catal13081218
APA StyleTang, C., Li, S., Li, S., Wang, Y., He, M., Huang, M., & Yu, S. (2023). The Structure–Activity Relationship of CuO in the Catalytic Conversion Reaction of Glycerol to Lactic Acid. Catalysts, 13(8), 1218. https://doi.org/10.3390/catal13081218