Abstract
Xanthate pollution during mineral processing is currently a major global challenge. Solar energy-induced photocatalysis is an effective and sustainable solution to this problem. The synthesis of specially designed photocatalysts is a critical step in this field of research. Even though a large number of structures have been developed in this regard, they are limited by low visible-light absorption and the fast recombination of photoinduced electron–hole pairs. To address these barriers, a novel nano-hybrid was developed with Bi2WO6 nanoflakes using MoS2 nanosheets as the co-catalyst. The as-prepared hybrid was critically examined to confirm its successful formation and determine its inherent exclusive characteristics. Finally, the photocatalytic ability for xanthate removal from wastewater was measured. The bandgap energy of Bi2WO6 and MoS2 was 2.85 eV and 1.87 eV, respectively, while that of the synthesized heterostructure was 2.54 eV. The photocatalytic ability of this novel structure is 6.65 and 9.65 times that of Bi2WO6 and MoS2, respectively.
1. Introduction
Every year, approximately two billion tons of minerals are processed, accounting for 10% of global industrial wastewater. Water consumption in the mineral processing sector can vary widely depending on the specific process and the type of mineral being processed. On average, 5–50 m3 of water is required to process one ton of ore [1]. Flotation, in which a slurry of finely ground ore particles is mixed with water and chemical collectors, is an effective method for recovering a wide range of minerals. The choice of the collector depends on the type of mineral being processed and the specific flotation process. Xanthates are a common type of collector that are widely used because of their strong selectivity, high recoverability, low cost, versatility, and ease of use. Therefore, its consumption is increasing and is expected to reach 3.7 billion tons by 2025 [2].
Only 50% of xanthates are consumed during the process, while the remainder is discharged to tailing ponds. They cannot be recovered completely, and their residues drain into the effluent. They are stable in basic media; however, under acidic conditions, they degrade to CS2, a highly toxic and flammable compound. Even in small quantities, xanthates deteriorate water quality and induce a malodor. Xanthates also have a high bioaccumulation factor in plants, which can affect algal metabolism even at concentrations of less than 1 mg/L. Xanthates disrupt the metabolism of human and animal cells, resulting in damage to the nervous system, liver, and consequently, other organs. In addition, they easily interact with other heavy metals in the environment and complex pollutants, ultimately leading to enzyme disruption and genetic mutations in organisms [3]. Therefore, the effective removal of xanthates from water effluents is crucial.
Chemical precipitation, adsorption, and biological and advanced oxidation methods are generally used to remove xanthates from water bodies [2]. Simple operation and easy control are the advantages of chemical precipitation methods; however, they require large amounts of chemicals and are restricted by large volumes of sludge. In addition, this pH-sensitive process requires large amounts of acids and alkalis [4]. Adsorption is a simple, efficient, and economical method for removing xanthate from water effluents. Its applicability is limited to very low concentrations, in addition to its regeneration and re-usability issues. The complete elimination of pollutants is impossible using this method [5]. Economic, eco-friendly, and simple operations are attractive features of the biological processes in which microorganisms are utilized to decompose xanthates. The major limitations of this process are its low efficiency and long duration. In addition, microbes decompose xanthate into alcohol and CS2, which are toxic to microbes and trigger secondary contamination [6].
Advanced oxidation processes (AOPs) use reactive oxygen species (ROS) to effectively oxidize xanthates. These methods are relatively fast and efficient [7]. Strong oxidizing agents, such as hydroxyl, sulfate, superoxide, and hydroperoxyl free radicals, oxidize xanthates into completely harmless smaller molecules such as CO2 and H2O. Fenton oxidation is a relatively simple and cost-effective process that uses an Fe catalyst. This process requires additional chemicals, such as H2O2, for activation. The handling and disposal of hazardous byproducts, such as iron sludge, is also a major hurdle [8]. Ozone oxidation is a fast and effective process for xanthate removal. However, ozone is hazardous to workers; its generation is expensive, and it requires extensive pre-treatment [9]. Hydrogen peroxide is another strong oxidizing agent that degrades xanthates in wastewater. However, careful control of the pH and other water chemistry parameters is required. In addition to the high treatment costs, activation and sludge handling are other serious limitations [10].
Photocatalytic oxidation is more cost-effective than other advanced oxidation processes; it requires less chemical input and produces less waste. It uses light and a catalyst to oxidize organic pollutants in water effluents. The light-activated catalyst generates electron–hole pairs that react with water and oxygen to produce free radicals, which in turn oxidize xanthates [11]. Many of the well-established conventional catalysts are activated under UV light, which is only 3–5% of the solar spectrum. To overcome this serious limitation, a lot of attention has been paid to tailoring the photocatalyst to work effectively in visible light, which accounts for 42–43% of the solar spectrum [12]. The wide bandgap energy and rapid recombination of photogenerated electron–hole pairs greatly impede the practical implementation of this technology in the current industrial scenario.
Doping and semiconductor coupling are widely adopted techniques to improve the activity, selectivity, and stability of the photocatalyst and reduce its bandgap. Doping can be realized by embedding metal ions, such as copper, manganese, and iron, nonmetal elements, such as carbon, nitrogen, and sulfur, or popular noble metals, such as silver and gold [13]. For example, Bian et al. [14] significantly reduced the bandgap of TiO2 to 2.24 eV by doping N and Ce into it. They removed 96.3% of sodium isobutyl xanthate under visible light irradiation. However, doping does not enhance the properties of all photocatalysts. Only a limited amount can be doped, and some dopants, such as heavy metals, are toxic. Scaling up the production of doped photocatalysts is difficult. Semiconductor coupling offers greater flexibility in controlling the bandgap and energy levels of materials. It offers greater stability and durability compared to doping; therefore, it is the most effective method for fabricating tailor-made photocatalysts with enhanced optical properties. These semiconductor-coupled nanocomposites exhibit enhanced photocatalytic activity due to their synergistic effects and the broadening of the wavelength range of light absorption [15].
Bismuth-based metal oxides, mainly Bi2WO6, have attracted the attention of researchers due to their composition, structure, and properties. They have a strong photo response, tunable structure, and high quantum yield. The perovskite-type layered configuration promoted good electronic conductivity. Its narrow bandgap (2.6–2.9 eV) facilitates visible-light absorption. Owing to its low cost, nontoxicity, and excellent thermal and chemical stabilities, it has become a prominent photocatalyst. However, the photocatalytic efficiency is poor owing to the limited response to visible light and sluggish transport. Small surface areas and faster recombination are additional disadvantages for its direct use [16,17]. The two-dimensional nanomaterial molybdenum disulfide (MoS2) has narrow bandgap energy, excellent photo absorptivity, high charge-carrier mobility, and low toxicity and cost. It can utilize solar energy with a large absorption coefficient in the 400–500 nm wavelength range [18]. Based on these advantages, MoS2 can serve as a co-catalyst to enhance the photocatalytic activity of Bi2WO6 for xanthate degradation.
Bi2WO6 is a high bandgap material while MoS2 is a low bandgap material. This significant difference ensures that each semiconductor absorbs photons within distinct energy ranges. MoS2 is considered to be a reducing semiconductor, while Bi2WO6 is its counterpart oxidizing semiconductor. In general, there is a high possibility of forming an effective Z-Scheme heterostructure with the combination of oxidizing and reducing semiconducting materials. Therefore, it is possible to fabricate a unique 2D/2D heterostructure with strong interfacial interactions and a large number of active sites with the combination of Bi2WO6 and MoS2. This type of heterostructure is expected to promote rapid charge separation, extend light-harvesting ability, and suppress charge–carrier recombination.
2. Results and Discussion
2.1. Characterization of the Photocatalysts
2.1.1. Phase Analysis
Phase analysis by X-ray diffraction is important for examining the crystal structure, composition, and phase of the as-synthesized pristine and novel hybrid materials. The XRD pattern of pristine Bi2WO6 (Figure 1) indicates that the main diffraction peaks (∗) at 28.23°, 32.79°, 47.12°, and 55.86° are due to diffraction of the crystal faces (113), (200), (220), and (313), respectively. JCPDS card No. 73-1126 indicates the successful formation of Bi2WO6 in the orthorhombic phase [19]. In Figure 1, the peaks (♠) at 14.03°, 33.31°, and 58.91° indicate (002), (101), and (110) planes of pure MoS2. This matches well with the hexagonal phase of MoS2 (JCPDS card No. 37-1492) [20]. The Bi2WO6/MoS2 composite profile was also similar to that of Bi2WO6, indicating that MoS2 insertion did not disturb the crystal structure of Bi2WO6 [21]. However, slight peak shifts were observed at 14.07°, 28.34°, 32.83°, 47.09°, 55.81°, and 58.72°, indicating the successful formation of the composite.
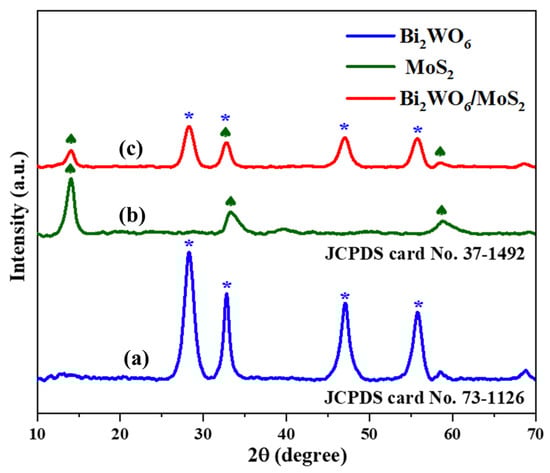
Figure 1.
X-ray diffraction patterns of (a) Bi2WO6, (b) MoS2, and (c) Bi2WO6/MoS2 nanocomposite.
2.1.2. Morphology Analysis
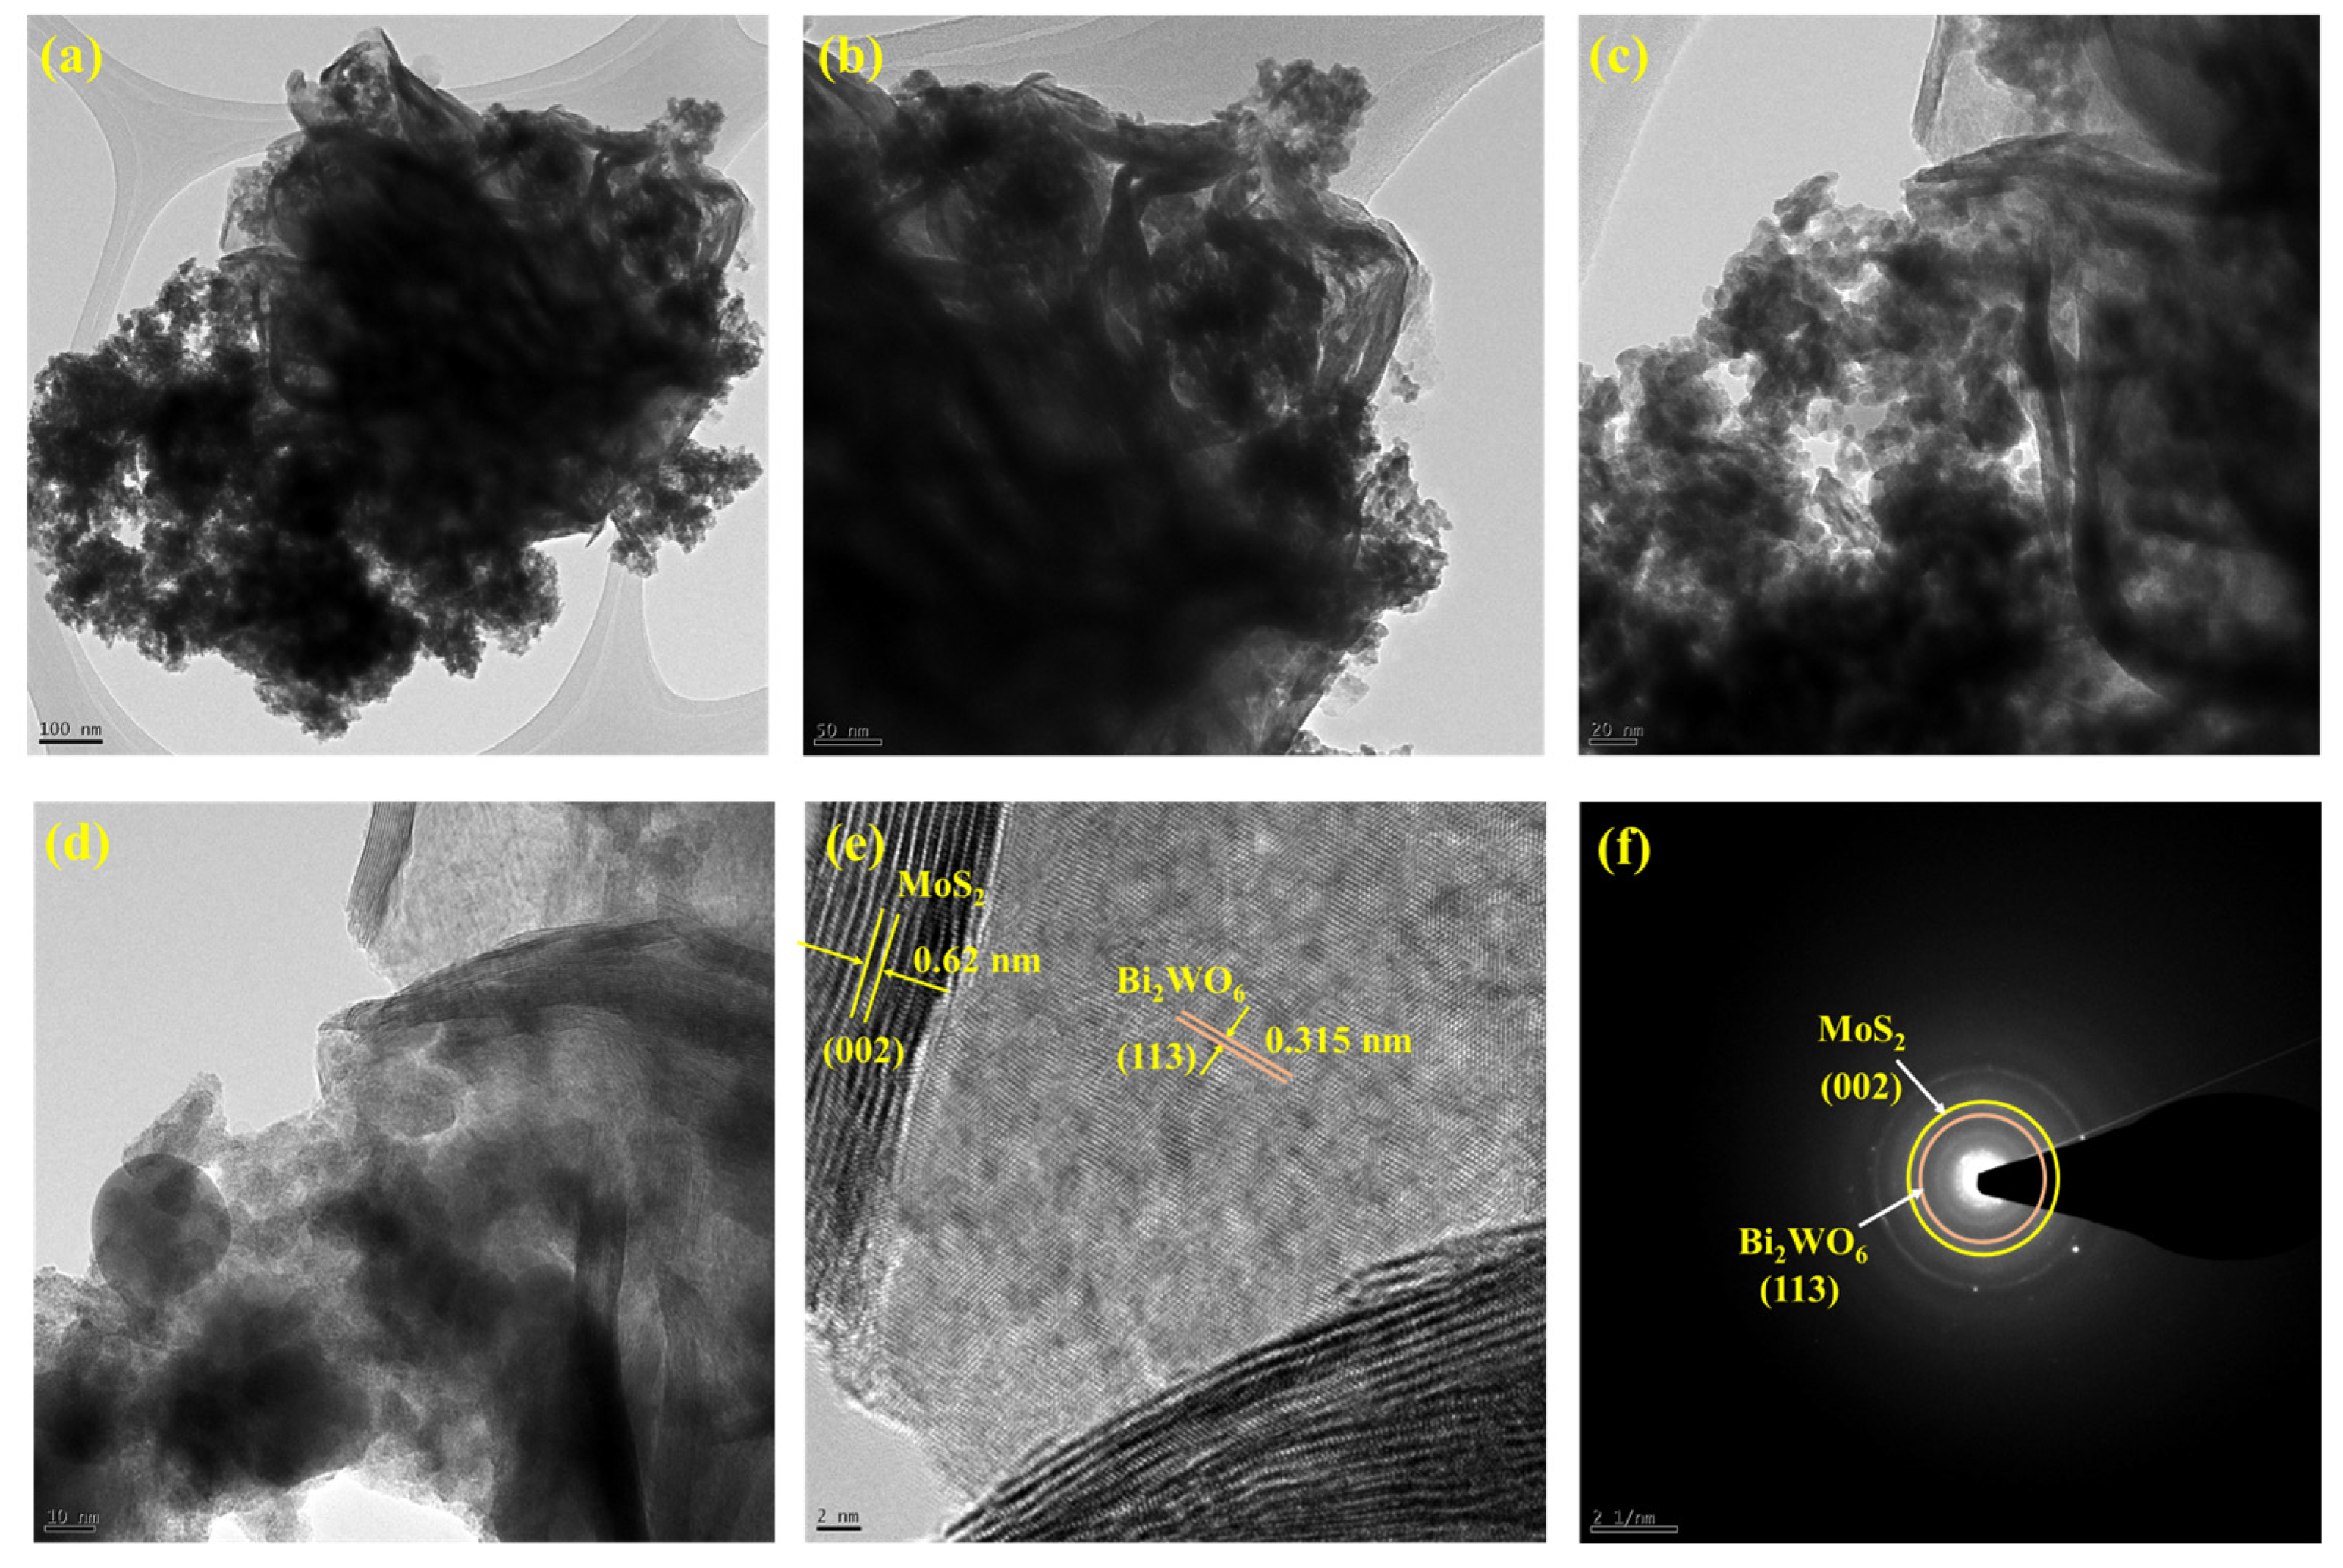
The surface morphology was identified using SEM analysis. Figure 2a,b shows the Bi2WO6 nanoflake bunches under 1 µm and 500 nm magnifications, respectively. The small flakes agglomerated into spherical flowers with different orientations. MoS2 formed small flower petal-like sheets without clustering (Figure 2c,d). Figure 2e,f shows the morphology of the as-prepared nanocomposite under 500 nm magnification. A major portion of the nanocomposite is composed of Bi2WO6 flakes with MoS2 petals between them. This indicates the successful formation of the composite. The samples were subjected to elemental analysis (EDS). A summary of this analysis is presented in Figure 3. Figure 3a shows an image of the sample being analyzed; Figure 3b–f indicate the presence of each element in the composition and its uniform distribution throughout the sample, and Figure 3g shows the quantitative analysis of each element in terms of the weight and atomic percentage. Bismuth and tungsten were the major elements because their input was 10 times greater than that of MoS2. This agrees with the results shown in Figure 2e,f. TEM can provide high-resolution images with fine details. Electron penetration provides a high-dimensional image of the sample. Figure 4a–d show the TEM images of the prepared samples at resolutions of 100, 50, 20, and 10 nm, respectively. The Bi2WO6 flakes and MoS2 sheets became distinctly visible as the magnification increased. The lattice fringes (Figure 4e) with a d spacing of 0.315 nm and 0.62 nm represent (113) lattice plane of orthorhombic Bi2WO6 and hexagonal plane (002) of MoS2. The diffraction spots of the corresponding SAED pattern in Figure 4f indicate the simultaneous presence of Bi2WO6 and MoS2.
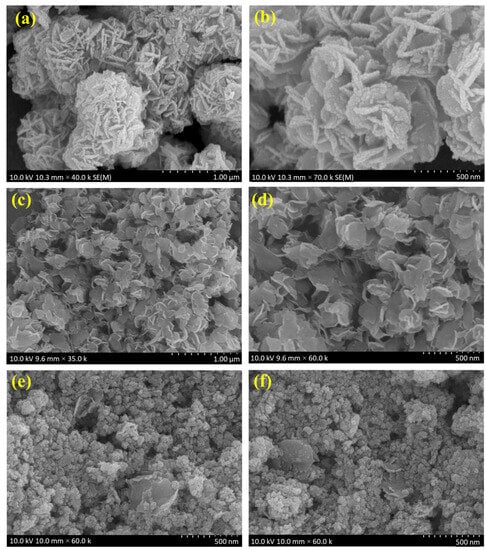
Figure 2.
SEM images of (a,b) Bi2WO6, (c,d) MoS2, and (e,f) Bi2WO6/MoS2 nanocomposite.
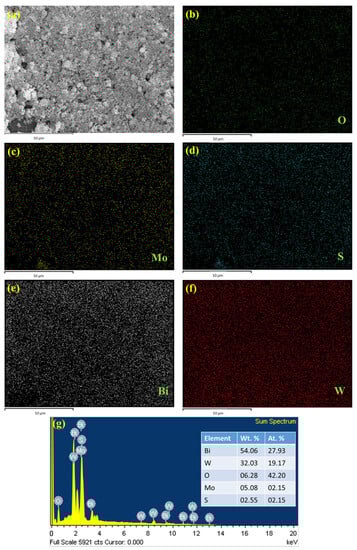
Figure 3.
EDS analysis of (a) Bi2WO6/MoS2 composite, (b) O, (c) Mo, (d) S, (e) Bi, (f) W, and (g) elemental analysis.
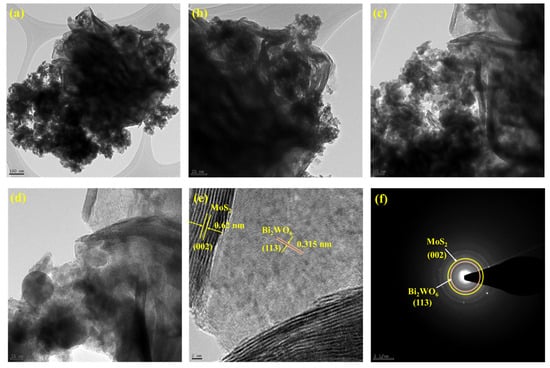
Figure 4.
TEM images of Bi2WO6/MoS2 nanocomposite with magnification (a) 100 nm, (b) 50nm, (c) 20 nm, (d) 10 nm, (e) lattice fringe pattern, and (f) SAED pattern.
2.1.3. Elemental Analysis
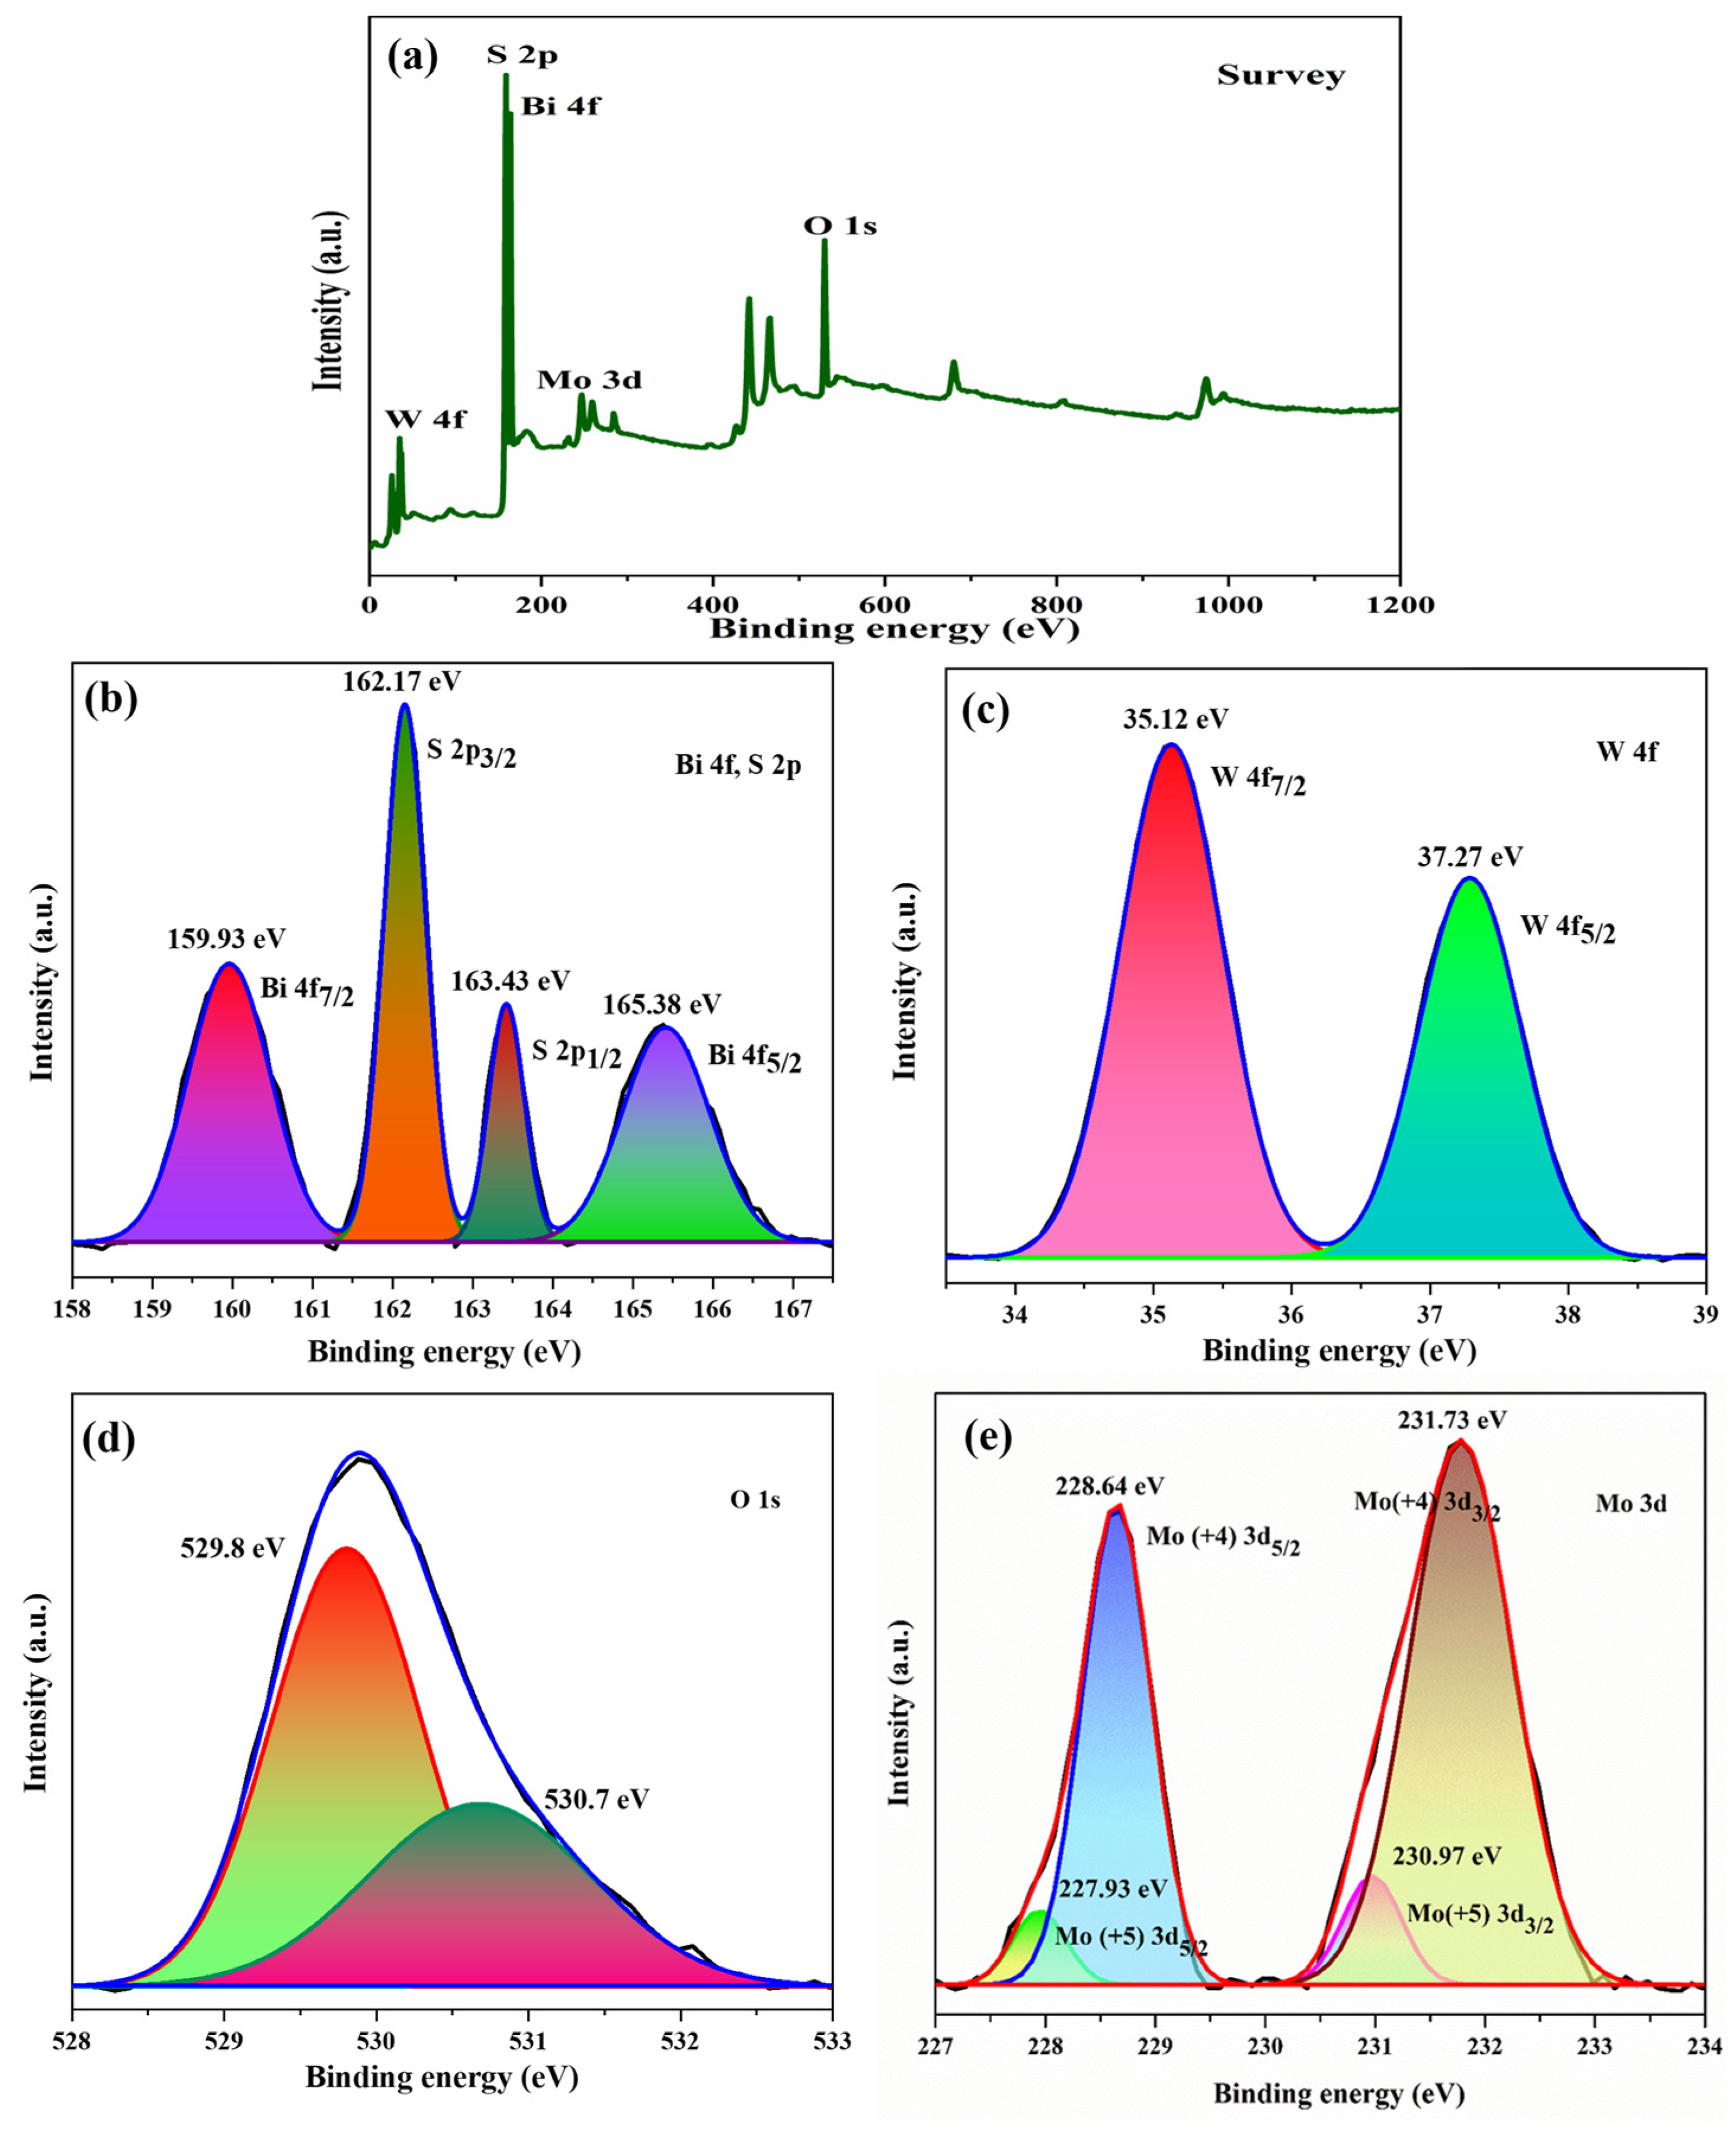
X-ray photoelectron spectroscopy (XPS) is a powerful analytical tool for detecting the chemical composition and electronic structure of materials at the atomic level. The peaks listed in the survey spectrum (Figure 5a) indicate the presence of all constituent elements (that is, Bi, W, O, Mo, and S) in the composite. High-resolution Bi 4f, W 4f, O 1s, Mo 3d, S 2s, and S 2p spectra are presented in Figure 5b–e. The peak positions, attributing elements, and corresponding electronic states are summarized in Table 1. As per the results portrayed in the table, the chemical states of bismuth, tungsten, molybdenum, and sulfur are Bi3+, W6+, Mo4+, and S2−, respectively. Moreover, the new peaks at 227.93 eV and 230.97 eV attributed to Mo+5 oxidation state, which may occur due to S-Mo charge transfer but not due to MoO3 [22]. The peaks of O 1s at 529.8 eV and 530.7 eV correspond to W–O and Bi–O bonds, respectively.
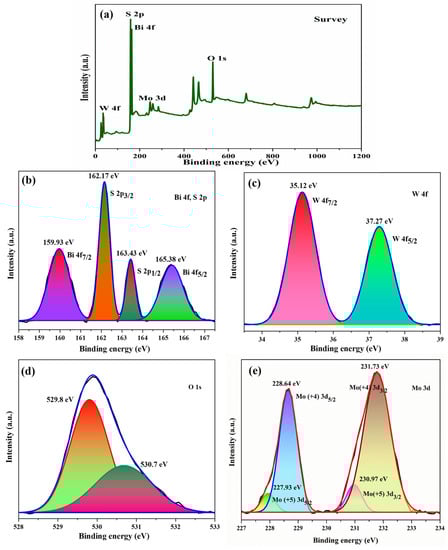
Figure 5.
XPS (a) survey, (b) Bi 4f, S 2p, (c) W 4f, (d) O 1s, (e) Mo 3d spectra for Bi2WO6/MoS2 nanocomposite.

Table 1.
X-ray photoelectron spectroscopy analysis of Bi2WO6/MoS2 nanocomposite.
2.1.4. Bandgap Analysis
The photocatalytic performance of a material depends on its optical properties, which are usually expressed in terms of bandgap energy. The bandgap energy of the material was calculated based on the UV–vis diffuse reflectance spectra (DRS). The DRS spectra of pristine and composite materials are shown in Figure 6a. The light-harvesting capacity of Bi2WO6 is poor in the visible region. However, when coupled with MoS2, the capacity considerably improved. The bandgap energies of pure Bi2WO6 is 2.85 eV (Figure 6b), and that of MoS2 is 1.87 eV (Figure 6c). The value for the composite was 2.54 eV.
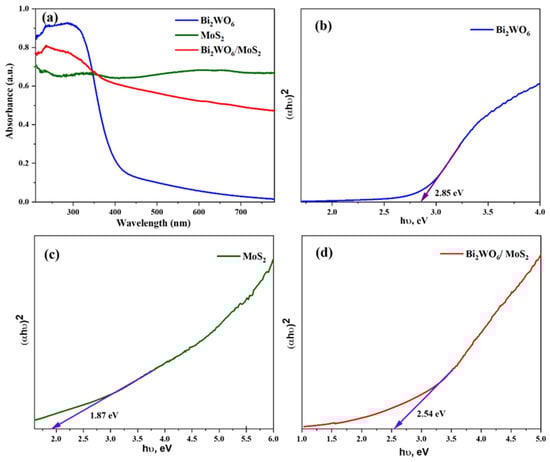
Figure 6.
(a) Optical absorbance spectra and (b–d) Tauc plots of the synthesized samples.
2.2. Photocatalytic Activity
As described in the previous section, the Bi2WO6/MoS2 nanocomposites were successfully prepared to enhance the light-harvesting capacity of its basic material Bi2WO6. In this section, the photocatalytic abilities are analyzed. The relevance and significance of xanthate removal were explained in the Introduction. The feed concentration, volume, catalyst dosage, and sampling procedure are described in the experimental section. The photocatalytic ability of the composite was tested along with that of pristine materials. A blank experiment was conducted to account for the self-degradation of PBX. The experiments began with dosage effects. Three experiments were conducted using 5, 10, and 15 mg of as-prepared composites. The results were calculated as a percentage removal and are presented in Figure 7a. The highest reduction occurred at a dose of 10 mg; therefore, this dose was used as the model for further experiments. Figure 7b shows the absorption profiles of PBX at different time intervals during photocatalysis using 10 mg of the synthesized nanocomposite. It showed distinct absorption at a wavelength of approximately 300 nm. No significant reduction in peak intensity was observed for the first 30 min of agitation under dark conditions. This indicates a mild effect of adsorption on the process. However, a significant difference was observed during the first 10 min of solar light irradiation. Following the same trend, complete mineralization was observed within 50 min. This is primary evidence of the catalytic activity of the prepared composites. Moreover, its performance was compared with that of pristine materials. As shown in Figure 7c, the results of the blank experiment indicate no self-degradation of the feed solution during the investigation. It also portrays the removal trends of pristine Bi2WO6 and MoS2, which could remove approximately 40% and 35% of xanthate (PBX) in the same period in which the as-prepared composite degraded almost one hundred percent. These results indicate the success of this nanocomposite with an upgraded light-harvesting capacity compared with its pristine counterparts. The kinetic parameters are an additional measure of the composite caliber. They play critical roles in the design of photo-reactors. As proven by many researchers, pseudo-first-order kinetics accurately represent the photocatalytic degradation of organic pollutants in water effluents. The same is true in this case, as per Figure 7d.
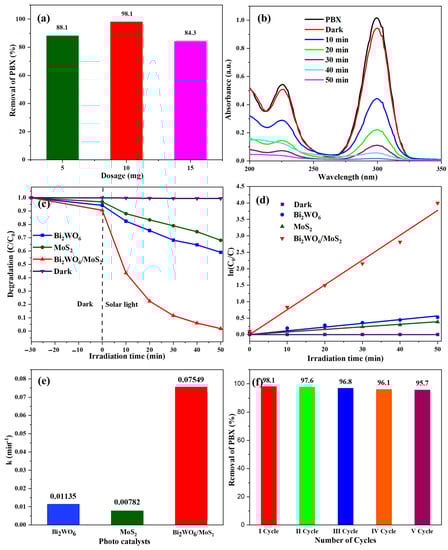
Figure 7.
(a) Effect of catalyst loading, (b) absorbance spectra for the degradation of PBX over Bi2WO6/MoS2 nanocomposite, (c) degradation efficiency of as-prepared samples, (d) pseudo-first-order kinetics, (e) kinetic rate constants of the as-prepared catalysts, and (f) stability test.
The data following the linear trend show the goodness of fit for this model. Rate constants were estimated based on these linear fits. The values for Bi2WO6, MoS2, and the Bi2WO6/MoS2 composite were 0.01135, 0.00782, and 0.07549 min−1, as shown in Figure 7e, and the rate constant value of the composite was very high compared to the other two. The performance of the composite was 6.65 times superior to that of Bi2WO6 and 9.65 times that of MoS2. Therefore, the results prove the hypothesis proposed in the Introduction: semiconductor coupling by joining Bi2WO6 with MoS2 can result in a highly efficient photocatalyst. This has turned out to be true, with strong evidence of successful composite formation. Catalyst stability and recyclability are also important in the era of economic and stringent environmental constraints. From this perspective, the catalyst was reused five times consecutively, and the PBX removal efficiency was calculated. As per the results shown in Figure 7f, no significant decline in the catalyst performance was observed, indicating the stability and reusability of the as-prepared nanocomposite.
2.3. Plausible Photocatalytic Mechanism
The intrinsic mechanism of the process was investigated. When light is incident on a photocatalyst, the electrons are excited and move to the conduction band, leaving behind holes in the valence band. These electrons and holes interact with the surrounding water molecules and generate free radicals, which in turn degrade organic pollutants. This is the typical mechanism for pristine photocatalysts. However, in the composites, these electrons and holes migrate from one energy level to another to balance the overall electric potential. Based on their migration path and final positions, they generate free radicals that actively participate in the reaction. These free radicals can be identified by examining the various trapping agents. In this study, triethanolamine (TEA), p-benzoquinone (BQ), and isopropyl alcohol (IPA) were used to trap holes and superoxide and hydroxyl free radicals. The degradation studies were repeated by adding these agents to determine their effects. Figure 8 shows the results of these studies. The addition of BQ and TEA did not have a considerable effect on the process, whereas the impact of IPA is distinctly visible in Figure 8. This indicates the critical role of hydroxyl free radicals in xanthate degradation. Hydroxyl is the most reactive species compared to others due to its high reduction potential of 2.8 V. It attacks rapidly with a high rate constant [28]. Therefore, the degradation rate was extremely high, resulting in complete removal within 50 min.
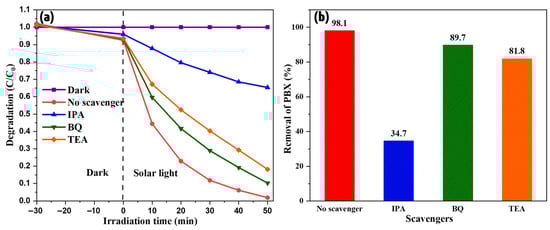
Figure 8.
(a) Radical trapping effect and (b) rate of degradation of selected scavengers.
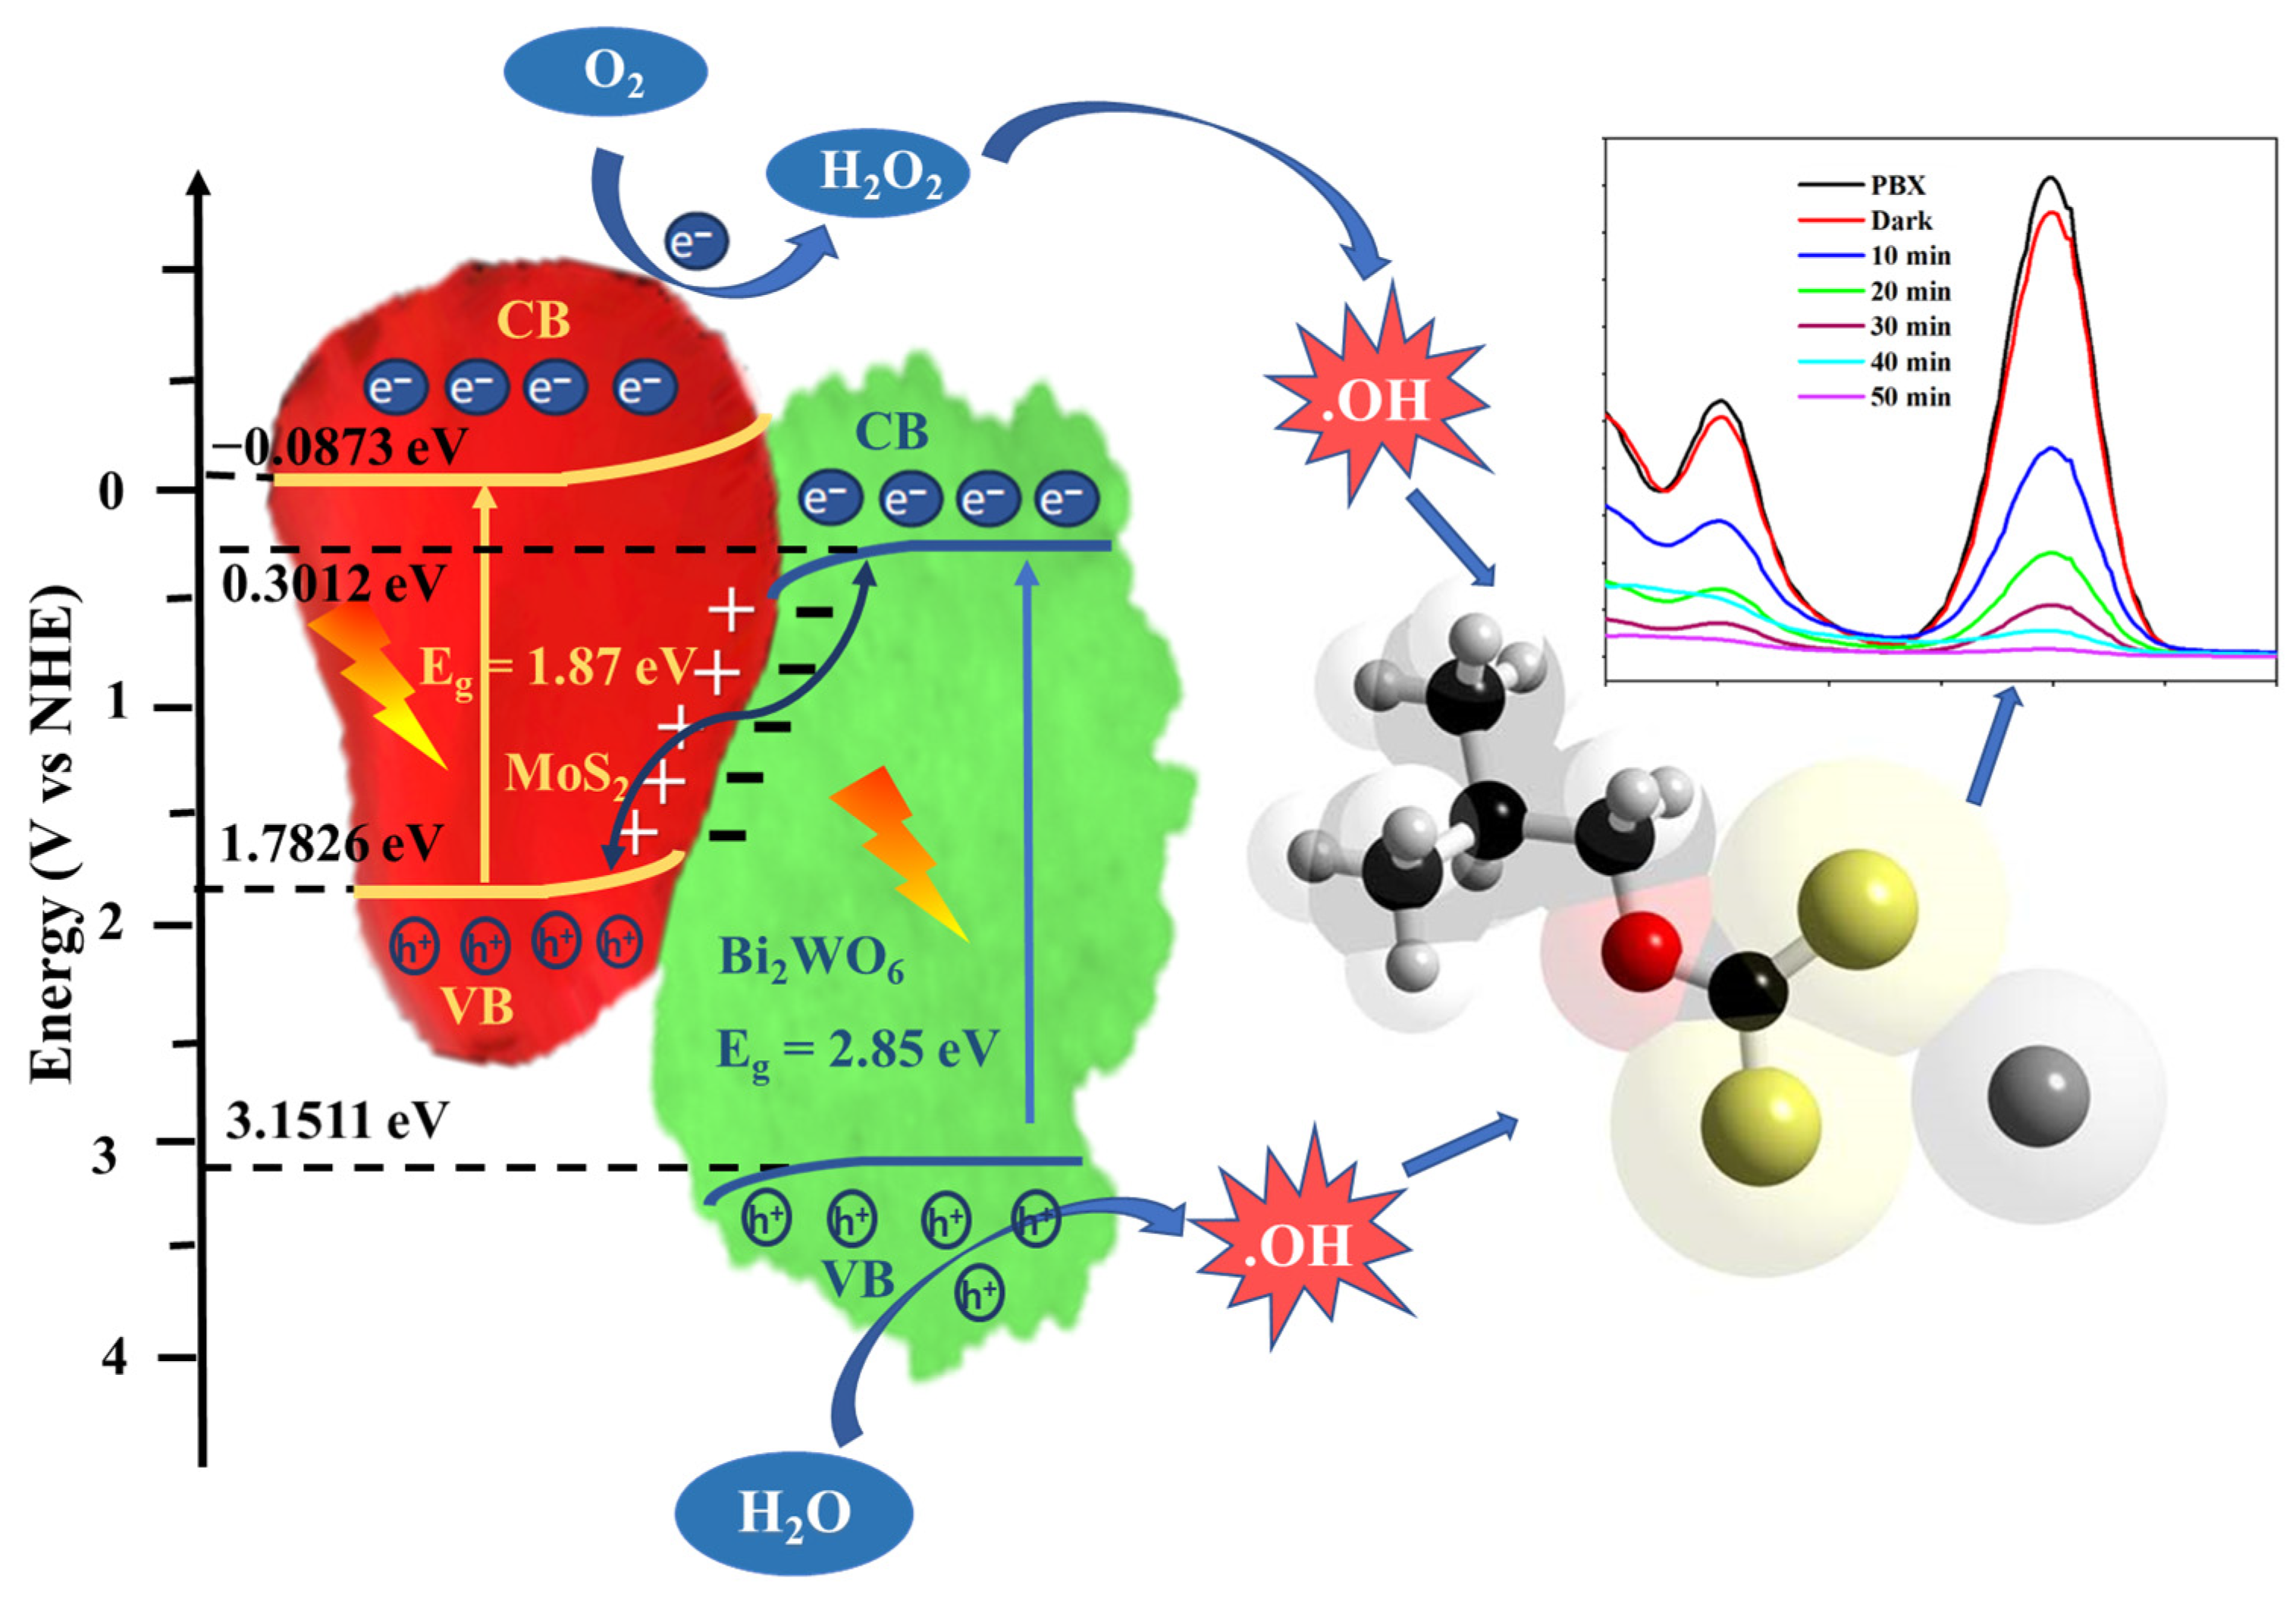
The identification of the exact band-edge position is also important for investigating the electron and hole migration pathways and the corresponding free-radical generation. The band-edge positions were calculated using the standard procedure presented in the literature [29]. Additionally, the valence band (VB) and conduction band (CB) potentials are measured using the empirical formulae: EVB = χ − Ee + (0.5) Eg; ECB = EVB − Eg. Where EVB and ECB are the VB and CB potentials, respectively. χ is the electronegativity of the semiconductor; for Bi2WO6 and MoS2, the χ values are 6.23 and 5.35 eV, respectively. Eg and Ee refer to the bandgap energy and energy of free electrons on the hydrogen scale (~4.5 eV), respectively. The values for pristine Bi2WO6 are 0.3012 and 3.1511 eV, and those for MoS2 are −0.0873 and 1.7826 eV. As seen from the band-edge positions depicted in Figure 9, the highest conduction band value is for MoS2, that is, −0.0873 eV. Since it is less than −0.33 eV vs. NHE (standard reduction potential), the production of superoxide radicals is not possible; however, it is sufficient to produce hydroxyl radicals [30]. This is in agreement with the results of the scavenger studies. Similarly, only Bi2WO6 exhibits a redox potential (EVB = 3.1511 eV; E(OH−/•OH = 1.96 eV) to produce •OH radicals. If the charge transfer is a Type II mechanism, holes must migrate from the VB of Bi2WO6 to that of MoS2 and directly participate in the degradation process; however, this contradicts the results from the scavenger studies. In addition, the energy gap between the valence band of MoS2 and the conduction band of Bi2WO6 was small (1.4815 eV). When Bi2WO6 and MoS2 join, the free electrons of MoS2 flow to those of Bi2WO6 to balance the Fermi level [31]. Therefore, the MoS2 side was positively charged, and the Bi2WO6 side was negatively charged at the interface, resulting in a built-in electric field. The photogenerated electrons in the CB of Bi2WO6 could easily join the holes in the VB of MoS2. This Z-scheme improves the separation efficiency of electrons and holes, producing highly active catalysts. This extended life of the free radicals improves the effective breakdown of PBX. Therefore, the as-prepared heterojunction completely degraded the PBX in 50 min.

Figure 9.
The mechanism for PBX degradation by the Bi2WO6/MoS2 nanocomposite.
3. Material and Methods
3.1. Photocatalysts Synthesis and Characterization
Bi2WO6 nanoflakes were prepared using a simple hydrothermal method. A total of 4.365 g of Bi(NO3)3·5H2O was added to 30 mL of Millipore water under constant stirring. Sodium tungstate solution was prepared in the same quantity as the bismuth nitrate solution by adding 1.485 g of sodium tungstate dihydrate (Na2WO4·2H2O) to 30 mL Millipore water. This solution was added dropwise to the bismuth nitrate solution and stirred for 60 min. Subsequently, it was transferred into a 100 mL TLSS (Teflon-lined stainless steel) autoclave, sealed, and heated at 200 °C for 24 h. MoS2 nanosheets were prepared in the same fashion by mixing 2.48 g of ammonium molybdate tetrahydrate and 4.56 g and thiourea in 70 mL of Millipore water. Both products were cleaned via centrifugation using ethanol and water in an alternating manner and dried at 80 °C for a day to yield the final products. Similarly, the composite was synthesized using the prepared Bi2WO6 nanoflakes and MoS2 nanosheets in a 10:1 ratio. Two solutions were prepared: one by adding 200 mg Bi2WO6 to 100 mL and another by adding 20 g MoS2 to 20 mL ethanol. The MoS2 solution was then added dropwise to the Bi2WO6 solution and mixed thoroughly for two hours. The uniform solution was placed in a 200-mL TLSS, sealed, and heated at 200 °C for 16 h. The final product, that is, the composite, was obtained by the aforementioned drying process. The details of the characterization and instrumentation specifications are reported in our previous studies [12].
3.2. Photocatalysis Experiments
A potassium butyl xanthate (PBX) solution (20 mg/L) was prepared accurately, and 5, 10, and 15 mg of the as-prepared composite were added to 50 mL of this solution to yield three separate solutions. The contents were continuously stirred for 30 min in the dark to determine the effects of adsorption. Therefore, solar light was used to activate the catalyst. PBX samples were withdrawn every 10 min and centrifuged for 5 min. The supernatant was collected, and its concentration was measured using a UV–vis spectrophotometer. Degradation was measured in terms of the concentration ratio; degradation kinetic models were tested, and corresponding parameters were estimated using the results reported in our previous studies [32].
4. Conclusions
Bi2WO6 is a low-cost and stable photocatalyst. However, its efficiency is low due to limited photo absorption and sluggish transport of electrons and holes. It was coupled with MoS2 to adjust its bandgap and enhance its photocatalytic ability. All the characterization studies indicated the successful formation of heterojunctions. The oxidative states of the elements were Bi3+, W6+, Mo4+, and S2–. The bandgap energies of Bi2WO6, MoS2, and the composite were 2.85, 1.87, and 2.54 eV, respectively. The band-edge position values for pristine Bi2WO6 were 0.30115509 eV and 3.15116 eV, and for MoS2, they were −0.0873509 and 1.78265 eV. The degradation followed pseudo-first-order kinetics, with a high-rate constant value of 0.07549 min−1. Hydroxyl radicals play a critical role in this process, and their strong reduction potential leads to their rapid degradation. This z-scheme mechanism improves the separation efficiency of electrons and holes, thereby producing a highly active catalyst. Only 10 mg of the as-prepared catalyst completely removed PBX in 50 min. The photocatalytic activity is 6.65 times that of Bi2WO6 and 9.65 times that of MoS2. The prepared catalysts were stable even after the usage of five consecutive cycles.
Author Contributions
Investigation, Formal analysis, Data curation, Validation, Visualization, Writing—original draft: M.R.T.; Conceptualization, Methodology, Validation, Editing, and Supervision: R.K.; Resources, Conceptualization, and Supervision: G.S.C.; Conceptualization, Review, and Editing: J.S. All authors have read and agreed to the published version of the manuscript.
Funding
This research received no external funding.
Data Availability Statement
The data that support the findings of this study are available from the corresponding author upon reasonable request.
Conflicts of Interest
The authors declare no conflict of interest.
References
- Meng, S.; Wen, S.; Han, G.; Wang, X.; Feng, Q. Wastewater Treatment in Mineral Processing of Non-Ferrous Metal Resources: A Review. Water 2022, 14, 726. [Google Scholar] [CrossRef]
- Yuan, J.; Li, S.; Ding, Z.; Li, J.; Yu, A.; Wen, S.; Bai, S. Treatment Technology and Research Progress of Residual Xanthate in Mineral Processing Wastewater. Minerals 2023, 13, 435. [Google Scholar] [CrossRef]
- Elizondo-Álvarez, M.A.; Uribe-Salas, A.; Bello-Teodoro, S. Chemical stability of xanthates, dithiophosphinates and hydroxamic acids in aqueous solutions and their environmental implications. Ecotoxicol. Environ. Saf. 2021, 207, 111509. [Google Scholar] [CrossRef] [PubMed]
- Meng, X.; Wu, J.; Kang, J.; Gao, J.; Liu, R.; Gao, Y.; Wang, R.; Fan, R.; Khoso, S.A.; Sun, W.; et al. Comparison of the reduction of chemical oxygen demand in wastewater from mineral processing using the coagulation–flocculation, adsorption and Fenton processes. Miner. Eng. 2018, 128, 275–283. [Google Scholar] [CrossRef]
- Salarirad, M.M.; Behnamfard, A.; Veglio, F. Removal of xanthate from aqueous solutions by adsorption onto untreated and acid/base treated activated carbons. Desalin. Water Treat. 2021, 212, 220–233. [Google Scholar] [CrossRef]
- Lin, H.; Qin, K.; Dong, Y.; Li, B. A newly-constructed bifunctional bacterial consortium for removing butyl xanthate and cadmium simultaneously from mineral processing wastewater: Experimental evaluation, degradation and biomineralization. J. Environ. Manag. 2022, 316, 115304. [Google Scholar] [CrossRef]
- Dong, C.; Fang, W.; Yi, Q.; Zhang, J. A comprehensive review on reactive oxygen species (ROS) in advanced oxidation processes (AOPs). Chemosphere 2022, 308, 136205. [Google Scholar] [CrossRef]
- Zhang, M.H.; Dong, H.; Zhao, L.; Wang, D.X.; Meng, D. A review on Fenton process for organic wastewater treatment based on optimization perspective. Sci. Total Environ. 2019, 670, 110–121. [Google Scholar] [CrossRef]
- Rekhate, C.V.; Srivastava, J.K. Recent advances in ozone-based advanced oxidation processes for treatment of wastewater—A review. Chem. Eng. J. Adv. 2020, 3, 100031. [Google Scholar] [CrossRef]
- García-Leiva, B.; Teixeira, L.A.C.; Torem, M.L. Degradation of xanthate in waters by hydrogen peroxide, fenton and simulated solar photo-fenton processes. J. Mater. Res. Technol. 2019, 8, 5698–5706. [Google Scholar] [CrossRef]
- Zhang, X.; Kamali, M.; Zhang, S.; Yu, X.; Appels, L.; Cabooter, D.; Dewil, R. Photo-assisted (waste)water treatment technologies—A scientometric-based critical review. Desalination 2022, 538, 115905. [Google Scholar] [CrossRef]
- Tamtam, M.R.; Koutavarapu, R.; Shim, J. InVO4 nanosheets decorated with ZnWO4 nanorods: A novel composite and its enhanced photocatalytic performance under solar light. Environ. Res. 2023, 227, 115735. [Google Scholar] [CrossRef] [PubMed]
- Mohtar, S.S.; Aziz, F.; Ismail, A.F.; Sambudi, N.S.; Abdullah, H.; Rosli, A.N.; Ohtani, B. Impact of Doping and Additive Applications on Photocatalyst Textural Properties in Removing Organic Pollutants: A Review. Catalysts 2021, 11, 1160. [Google Scholar] [CrossRef]
- Bian, Z.; Feng, Y.; Li, H.; Yu, H.; Wu, H. Adsorption-photocatalytic degradation and kinetic of sodium isobutyl xanthate using the nitrogen and cerium co-doping TiO2-coated activated carbon. Chemosphere 2021, 263, 128254. [Google Scholar] [CrossRef] [PubMed]
- Zhang, X.; Jiang, S.P. Layered g-C3N4/TiO2 nanocomposites for efficient photocatalytic water splitting and CO2 reduction: A review. Mater. Today Energy 2022, 23, 100904. [Google Scholar] [CrossRef]
- Zhu, Z.; Wan, S.; Zhao, Y.; Gu, Y.; Wang, Y.; Qin, Y.; Zhang, Z.; Ge, X.; Zhong, Q.; Bu, Y. Recent advances in bismuth-based multimetal oxide photocatalysts for hydrogen production from water splitting: Competitiveness, challenges, and future perspectives. Mater. Rep. Energy 2021, 1, 100019. [Google Scholar] [CrossRef]
- Zhu, Z.; Wan, S.; Zhao, Y.; Qin, Y.; Ge, X.; Zhong, Q.; Bu, Y. Recent progress in Bi2WO6-Based photocatalysts for clean energy and environmental remediation: Competitiveness, challenges, and future perspectives. Nano Sel. 2021, 2, 187–215. [Google Scholar] [CrossRef]
- Samy, O.; Zeng, S.; Birowosuto, M.D.; El Moutaouakil, A. A Review on MoS2 Properties, Synthesis, Sensing Applications and Challenges. Crystals 2021, 11, 355. [Google Scholar] [CrossRef]
- Gao, H.; Liu, F.; Li, X.; Li, F.; Sui, X. Hydrangeas-Like Bi2WO6: Facile Synthesis, Visible-Light Driven Photocatalysis and Theoretical Analysis. J. Nanosci. Nanotechnol. 2012, 12, 6321–6326. [Google Scholar] [CrossRef]
- Zhou, P.; Shen, Y.; Zhao, S.; Chen, Y.; Gao, S.; Liu, W.; Wei, D. Hydrothermal synthesis of novel ternary hierarchical MoS2/TiO2/clinoptilolite nanocomposites with remarkably enhanced visible light response towards xanthates. Appl. Surf. Sci. 2021, 542, 148578. [Google Scholar] [CrossRef]
- Zhang, H.; He, J.; Zhai, C.; Zhu, M. 2D Bi2WO6/MoS2 as a new photo-activated carrier for boosting electrocatalytic methanol oxidation with visible light illumination. Chin. Chem. Lett. 2019, 30, 2338–2342. [Google Scholar] [CrossRef]
- Lai, B.; Singh, S.C.; Bindra, J.K.; Saraj, C.S.; Shukla, A.; Yadav, T.P.; Wu, W.; McGill, S.A.; Dalal, N.S.; Srivastava, A.; et al. Hydrogen evolution reaction from bare and surface-functionalized few-layered MoS2 nanosheets in acidic and alkaline electrolytes. Mater. Today Chem. 2019, 14, 100207. [Google Scholar] [CrossRef]
- Subramanyam, P.; Meena, B.; Suryakala, D.; Subrahmanyam, C. Influence of Bi–Cu microstructure on the photoelectrochemical performance of BiVO4 photoanode for efficient water splitting. Sol. Energy Mater. Sol. Cells 2021, 232, 111354. [Google Scholar] [CrossRef]
- Zhang, X.; Matras-Postolek, K.; Yang, P.; Ping Jiang, S. Z-scheme WOx/Cu-g-C3N4 heterojunction nanoarchitectonics with promoted charge separation and transfer towards efficient full solar-spectrum photocatalysis. J. Colloid Interface Sci. 2023, 636, 646–656. [Google Scholar] [CrossRef] [PubMed]
- Xiong, X.; Zhang, J.; Chen, C.; Yang, S.; Lin, J.; Xi, J.; Kong, Z. Novel 0D/2D Bi2WO6/MoSSe Z-scheme heterojunction for enhanced photocatalytic degradation and photoelectrochemical activity. Ceram. Int. 2022, 48, 31970–31983. [Google Scholar] [CrossRef]
- Miao, F.; Sun, B.; Tao, B.; Wang, Y.; Chu, P.K. MoS2/Ag/TiO2 for photoanode of dye sensitized solar cells. J. Mater. Res. Technol. 2022, 20, 781–790. [Google Scholar] [CrossRef]
- Munoz, R.; López-Elvira, E.; Munuera, C.; Frisenda, R.; Sánchez-Sánchez, C.; Martín-Gago, J.Á.; García-Hernández, M. Direct growth of graphene-MoS2 heterostructure: Tailored interface for advanced devices. Appl. Surf. Sci. 2022, 581, 151858. [Google Scholar] [CrossRef]
- Wang, X.; Zhang, L. Kinetic study of hydroxyl radical formation in a continuous hydroxyl generation system. RSC Adv. 2018, 8, 40632–40638. [Google Scholar] [CrossRef]
- Wu, Y.; Zhang, J.; Long, B.; Zhang, H. The Thermodynamic Stability, Electronic and Photocatalytic Properties of the ZnWO4(100) Surface as Predicted by Screened Hybrid Density Functional Theory. ACS Omega 2021, 6, 15057–15067. [Google Scholar] [CrossRef]
- San Martín, S.; Rivero, M.J.; Ortiz, I. Unravelling the Mechanisms that Drive the Performance of Photocatalytic Hydrogen Production. Catalysts 2020, 10, 901. [Google Scholar] [CrossRef]
- Li, J.; Yuan, H.; Zhang, W.; Jin, B.; Feng, Q.; Huang, J.; Jiao, Z. Advances in Z-scheme semiconductor photocatalysts for the photoelectrochemical applications: A review. Carbon Energy 2022, 4, 294–331. [Google Scholar] [CrossRef]
- Gebremedhin, B.R.; Tamtam, M.R.; Koutavarapu, R.; Shim, J. Eco-friendly synthesis of CuO nanoparticles induced by Var. adoensis and its high photocatalytic ability and recyclability. J. Mater. Sci. Mater. Electron. 2023, 34, 703. [Google Scholar] [CrossRef]


Disclaimer/Publisher’s Note: The statements, opinions and data contained in all publications are solely those of the individual author(s) and contributor(s) and not of MDPI and/or the editor(s). MDPI and/or the editor(s) disclaim responsibility for any injury to people or property resulting from any ideas, methods, instructions or products referred to in the content. |
© 2023 by the authors. Licensee MDPI, Basel, Switzerland. This article is an open access article distributed under the terms and conditions of the Creative Commons Attribution (CC BY) license (https://creativecommons.org/licenses/by/4.0/).